Article

Comparative Study of Buck-Boost, SEPIC, Cuk and Zeta DC-DC Converters Using Different MPPT Methods for Photovoltaic Applications

by
Julio López Seguel
1,
Seleme I. Seleme, Jr.
2,* and
Lenin M. F. Morais
2
1
Faculty of Engineering and Architecture, Arturo Prat University, Iquique 1100000, Chile
2
Department of Electronic Engineering, Federal University of Minas Gerais, Belo Horizonte 31270-901, Brazil
*
Author to whom correspondence should be addressed.
Submission received: 17 September 2022 / Revised: 17 October 2022 / Accepted: 18 October 2022 / Published: 26 October 2022

Abstract

:
The power produced in a photovoltaic (PV) system is highly dependent on meteorological conditions and the features of the connected load. Therefore, maximum power point tracking (MPPT) methods are crucial to optimize the power delivered. An MPPT method needs a DC-DC converter for its implementation. The proper selection of both the MPPT technique and the power converter for a given scenario is one of the main challenges since they directly influence the overall efficiency of the PV system. This paper presents an exhaustive study of the performance of four step-down/step-up DC-DC converter topologies: Buck-Boost, SEPIC, Zeta and Cuk, using three of the most commonly implemented MPPT techniques: incremental conductance (IncCond), perturb and observe (P&O) and fuzzy logic controller (FLC). Unlike other works available in the literature, this study compares and discusses the performance of each MPPT/converter combination in terms of settling time and tracking efficiency of MPPT algorithms, and the conversion efficiency of power converters. Furthermore, this work jointly considers the effects of incident radiation variations, the temperature of the PV panel and the connected load. The main contribution of this work, other than selecting the best combination of converter and MPPT strategy applied to typical PV systems with DC-DC power converters, is to formulate a methodology of analysis to support the design of efficient PV systems. The results obtained from simulations performed in Simulink/MATLAB show that the FLC/Cuk set consistently achieved the highest levels of efficiency, and the FLC/Zeta combination presents the best transient behavior. The findings can be used as a valuable reference for the decision to implement a particular MPPT/converter configuration among those included in this study.

1. Introduction

Over the last few decades, photovoltaic (PV) energy has become one of the most relevant sources of renewable energy. PV systems are top ranked among renewable energy supplies [1]. By the year 2021, the capacity of PV solar power installed in the world had reached approximately 942 GW, including both on-grid and off-grid capacity, according to [2]. Nevertheless, PV panels convert only a small amount of the incident solar irradiation (15–20%), producing electricity with a very low conversion efficiency [3], which reduces the cost-benefit ratio of PV systems. Moreover, the power generation of a PV system depends on environmental conditions such as solar radiation and temperature, along with the characteristics of the connected load [4]. The power of a PV module is maximum at the inflection point of the P-V characteristic, known as the maximum power point (MPP). To maximize the conversion efficiency of a PV panel despite variations in environmental and load conditions, the use of a maximum power point tracking (MPPT) method is indispensable [5].
Over the years, a variety of MPPT techniques have been developed, such as Hill Climbing (HC), Particle Swarm Optimization (PSO), Fractional Open Circuit Voltage (FOCV), Incremental Conductance (IncCond), Fractional Short Circuit Current (FSCC), Perturb and Observe (P&O), Sliding Mode Control (SMC), Artificial Neural Network (ANN), Genetic Algorithm (GA), Cuckoo Search (CS), fuzzy logic controller (FLC) and Firefly Algorithm (FA), among others [6,7,8,9,10,11,12,13]. All of those techniques vary in several respects, such as implementation complexity, effectiveness, tracking speed, tracking accuracy, cost, and hardware requirements [14]. Among all of them, P&O, IncCond and FLC techniques, have been widely used in practical applications [15,16,17]. P&O and IncCond, which are regarded as conventional MPPT methods, have the advantages of being suitable for any PV generator. They work quite well under most conditions and they are simple to implement on a low-cost digital controller [18]. However, both algorithms oscillate around the MPP and fail to converge under sudden meteorological changes [19,20]. On the other hand, FLC is a robust artificial intelligence (AI) method which can reach high MPP tracking efficiency and accuracy [21]. This technique was conceived relying on human understanding of process control and is based on qualitative rules [22]. The FLC method does not require any mathematical model. Furthermore, its implementation is simpler when compared to other AI techniques [23]. Nevertheless, the absence of a systematic method for formulating the membership functions is the main drawback of an FLC method. They mainly are based on the designers’ experience and knowledge about the system. In PV systems, the use of an MPPT method requires for its implementation a DC-DC converter, which can be seen as an impedance adapter between the PV panel and the connected load. The DC-DC power converter is controlled through its electronic switch by a signal generated by the MPPT technique called the duty cycle [24]. There are many DC-DC converters utilized for renewable energy applications and which can be classified into two categories, namely, isolated and non-isolated converters [1]. Although both categories have their own advantages and disadvantages, non-isolated DC-DC topologies are still a more advantageous and feasible option to integrate with renewable energy systems [25].
Buck-Boost, Buck, Boost, SEPIC, Zeta and Cuk are the most frequently used non-isolated converters for PV applications [26]. Among these converters, the topologies Boost and Buck present simplicity, high efficiency and low-order circuits [27]. However, they lack output voltage flexibility, which may limit their use. Indeed, the Boost converter can only increase voltage and the Buck converter can only reduce voltage [28]. Therefore, in PV system battery charging, for instance, both Boost and Buck converters are unfit to charge the battery continuously with MPPT operation. If the battery voltage is lower than maximum power voltage of the PV panel, MPP tracking is not possible in Boost converter; on the other hand, if the battery voltage is greater than the maximum power voltage of the PV panel, MPP tracking is not possible in a Buck converter [29]. Since Buck-Boost, SEPIC, Zeta and Cuk topologies are capable of generating a higher or lower output voltage than the PV generator, they can achieve MPP tracking regardless of changes in weather conditions and connected load. Hence, those topologies are preferable for the MPPT principle [25,30].
Over the years, many comparative studies in the field of PV systems and concerned with power converters and MPPT techniques have been conducted. The majority of these works have focused on analyzing the tracking efficiency of the MPPT algorithms and their impact on the power generation of the PV panel, as shown in [4,7,14,18,21,24,31,32,33,34,35,36,37,38,39,40,41,42,43,44,45,46,47,48,49,50,51,52,53,54,55]. On the other hand, not much attention has been given to the behavior of the DC-DC power converter, though the choice of the suitable DC-DC converter is essential because it has a relevant role in the overall efficiency of the PV system and its reliability. It should be noted that the behavior of the power converter varies depending on the parameters and its operating conditions, such as switching frequency, duty cycle, voltage and current levels, load impedance, continuous conduction mode (CCM) and discontinuous conduction mode (DCM), among others. Thus, it is a task for researchers to define which MPPT/converter set, from the conversion efficiency point of view, performs better in a given scenario. To the best of the authors’ knowledge, there are few recent works taking this approach, as seen in [27], where the authors compare the conversion efficiency of two DC-DC converters (Boost and Buck) working with three different MPPT techniques (IncCond, P&O and Temp). This work shows that the P&O/Boost combination performed with the highest power conversion efficiency. In [56], the conversion efficiency of seven DC-DC converters (Buck-Boost, Boost, Buck, Zeta, SEPIC, Luo and Cuk) is compared, but only operating with the P&O algorithm. In this paper, the authors conclude that the Buck-Boost converter performed better than the rest. In [57], the conversion efficiency of four DC-DC converters (Zeta, ZVS Zeta, SEPIC and ZVS SEPIC) working with two MPPT techniques (IncCond and P&O) is compared. This paper shows that the IncCond/ZVS Zeta configuration achieved the best performance.
Taking into account the abovementioned analysis, this work presents a new comparative study between four non-isolated DC-DC converters (Buck-Boost, SEPIC, Zeta and Cuk) operating with three of the most popular MPPT algorithms (IncCond, P&O and FLC). The study compares and discusses the performance of each MPPT/converter set in terms of their settling time and average steady-state efficiency. Unlike comparative studies available in the literature, this work considers the effects of variations in incident radiation, PV panel temperature and connected load on the performance of the MPPT methods and on the conversion efficiency of each power converter. Thus, this paper provides valuable information for choosing the most suitable MPPT/converter configuration, from the efficiency point of view, for certain weather and load conditions.
The study has been conducted based on simulations implemented with MATLAB/Simulink. In order to obtain more accurate and comparable results, all converters have been designed to present the same inductor ripple current and capacitor ripple voltage levels for a given operating condition. In addition, the passive components of each converter have been simulated in the presence of non-idealities according to commercial values. Furthermore, a precise model for the Kyocera KC85TS commercial PV module has been used.
The paper is structured as follows: Section 2 briefly describes a typical PV system with MPPT controller. In Section 3, a concise description of the main characteristics of the DC-DC converters as well as the sizing of their components is given. Section 4 provides the principles of operation of the MPPT techniques. Simulated results and comparative analysis are provided in Section 5. Section 6 summarizes the conclusions of the paper.

2. PV System Description

In a PV system, when the PV generator is connected directly to the load, its operation point is determined by the generation and load curves’ intersection, which commonly does not coincide with the MPP of the PV module. Moreover, on the one hand, radiation and temperature variations impacts generation curve changes, while on the other hand, the type of load connected to the PV module affects the load curve. Under these conditions, the PV system is unable to operate at the MPP most of the time, with an ensuing loss of available solar energy. To surmount this issue, a DC-DC converter is placed between the load and the PV module, as is shown in Figure 1. Thus, an MPPT algorithm regulates the converter’s duty cycle in order to match the apparent impedance of the PV panel to the impedance at the MPP.

3. DC-DC Converters

Buck-Boost, SEPIC, Zeta and Cuk are non-isolated DC-DC power converters which are able to generate an output voltage larger or smaller than the input voltage magnitude, so they are also called step-down/step-up converters. In comparison to step-down and step-up topologies, step-down/step-up converters are able to cover the entire I–V characteristics of a PV panel. This fact helps MPPT operation to be conducted perfectly in a PV system, regardless of variations in atmospheric and load conditions.

3.1. Buck-Boost Converter

The Buck-Boost converter is simple and inexpensive to implement because it only contains a capacitor and a coil as energy storage elements [28]. It should be noticed that its input current is always discontinuous since the switch is in series with the generator, which implies that the current has many harmonic components, high input ripple and significant noise problems [58]. To handle this problem, large capacitors or LC filters are required. Moreover, in a conventional Buck-Boost converter, the output voltage has opposite polarity than the input voltage, which represents its main issue [59]. Figure 2a shows the structure of a conventional Buck-Boost converter.

3.2. Cuk Converter

Unlike the Buck-Boost converter, where energy transfer is associated with the inductor, energy transfer for the Cuk converter depends on the capacitor C1 as shown in Figure 2c. The inductor L1 on the input filters the DC supply current, preventing large harmonic content [60]. Its continuous input current reduces the size of the input filter capacitor by reducing the current stress on it. In addition, this topology also guarantees the continuity of the output current [61]. Another advantage of this converter is that the control terminal of the electronic switch is grounded, which simplifies the gate drive design. On the other hand, like the Buck-Boost converter, the Cuk converter generates an inverted output voltage [62].

3.3. Single-Ended Primary Inductance Converter (SEPIC)

Just like Cuk converter, the SEPIC converter has an inductor at the input. Hence, the input current waveform is continuous with a low ripple level [63], which is suitable to achieve high-precise MPPT performance. Another benefit of this configuration is the isolation between the output and the input by the capacitor C1, as shown in Figure 2b. The capacitor C1 protects against a short circuit or an overload of the output [64]. Moreover, the classical SEPIC topology has the advantage (when compared to Buck-Boost and Cuk topologies) that both output and input voltages have the same polarity [65]. In addition, the SEPIC converter, like the Cuk converter, has the advantageous feature of the switch control terminal connected to ground [58]. On the other hand, the SEPIC converter has a discontinuous output current, which implies that a large output capacitor filter is necessary to smooth the current.

3.4. Zeta Converter

The Zeta converter, similar to the SEPIC converter, does not suffer from the polarity reversal problem [66]. Furthermore, the Zeta topology not only has low output voltage ripple, which facilitates the output regulation task, but also its uniform output current allows the use of smaller capacitors, which improves the load performance [25,67]. Those features make the Zeta converter a better candidate when voltage quality and output power is critical [68]. On the other hand, the Zeta converter, like the Buck-Boost converter, suffers from the drawback of having a discontinuous input current [69], which can affect the MPPT performance. Another important issue that must be considered in this converter is that the control terminal is not grounded. Thus, a complex high side switch driver circuit is required [26]. Figure 2d shows the structure of the Zeta converter.

3.5. Design of the DC-DC Converters

The passive components of each converter were calculated by using the equations in Table 1. All converters were sized to present the same inductor ripple current (ΔIL) and capacitor ripple voltage (ΔVC) levels for certain operating conditions. The operation conditions were set as follows: ΔIL1 = 10%, ΔIL2 = 20%, ΔVC1 = 5%, ΔVC2 = 2%, DC power supply voltage Vs = 17.4 V, output voltage magnitude Vo = 12 V, load resistor R = 2 Ω and PWM switching frequency f = 30 kHz. In order to incorporate the effect of the losses in the passive components, the calculated values were replaced by the most similar commercial values, so as to include the DC resistance (DCR) of the inductors and the equivalent series resistance (ESR) of the capacitors. It should be noted that the losses in the semiconductors were partially estimated, since only the value of static drain-to-source on-resistance (RDS(on)), in the case of the mosfet, and both forward slope resistance (Ron) and forward voltage drop (VF), in the case of the diode, were considered. Table 2 shows the summary of the passive components of each converter. Table 3 shows the values of the commercial semiconductors used.

4. Maximum Power Point Tracking Algorithms

4.1. Perturb and Observe (P&O) Method

This technique is extensively applied in commercial devices and is the basis of most of the more sophisticated algorithms presented in the literature [48]. The P&O method is widely utilized because of its low cost and simplicity of implementation [70]. This technique consists of disturbing the PV panel voltage in a certain direction through a disturbance of the duty cycle of the DC-DC converter (Δd), and then observing the behavior of its output power. If the power increases, the disturbance continues in the same direction; otherwise, the system is perturbed in the opposite direction. The process is repeated periodically, so in steady state the power oscillates around the MPP, thus wasting some of the energy available in the PV panel. To guarantee proper behavior both dynamic and in steady state, a suitable size for Δd must be carefully selected [71]. The main drawback of this method is the occasional shift of MPP due to rapid changes in climatic conditions, such as in the case of moving clouds [72]. Figure 3 shows the flowchart of this technique.

4.2. Incremental Conductance (IncCond) Method

The IncCond technique is widely utilized because of its high steady-state tracking accuracy and good adaptability for rapid changes in weather conditions [6,73]. This algorithm is based on the principle that the slope of the P-V characteristic of the PV module is zero at the MPP ( d P d V = 0 ) , negative on the right and positive on the left [21]. Thus:
d P d V = I + V d I d V I + V Δ I Δ V
Then (1) can be written as:
Δ I Δ V = I V   ( at   the   MPP )  
Δ I Δ V > I V   ( left   of   the   MPP )  
Δ I Δ V < I V   ( right   of   the   MPP )  
The MPP is traced by comparing the instantaneous conductance ( I V ) with the incremental conductance ( Δ I Δ V ) . When the MPP is reached, the converter’s duty cycle must remain unchanged because the PV panel voltage (VPV) coincides with the maximum power voltage of the PV module (VMPP). In this case, ΔV is zero and the incremental conductance calculation must be omitted, and only the PV panel current must be evaluated. In the event that the MPP changes, a perturbation in the duty cycle must be performed to seek the new MPP. The main disadvantage of this algorithm (compared to P&O) is the increase in hardware and software complexity, due to the mathematical operations required. This latter causes an increase in computation times, which limits the sampling rate for the measurement of voltage and current signals [70]. Figure 4 shows the flowchart of this algorithm.

4.3. Fuzzy Logic Controller (FLC) MPPT Method

FLC is a type of AI strategy that uses heuristic logic for solving complex problems. Because of its simplicity and effectiveness, this approach has become very popular for the control of both linear and non-linear systems. Over the years, this method has demonstrated its outstanding features for the design of high-performance MPPT controllers with the advantage of not requiring any mathematical model of the PV system [74,75]. However, this control approach does not provide a systematic method; instead, it bases its design according to the trial and error method and information that comes from an expert’s knowledge of the system, which represents its main drawback [16,76]. Takagi–Sugeno and Mandami are two of the most frequently used fuzzy inference systems for developing an FLC [77].
Figure 5 shows the block diagram of a typical FLC. In the fuzzification phase, the input signals are transformed into linguistic variables. In the inference phase, the control actions are executed by means of the knowledge base, which is described in terms of If-Then rules and their membership functions. In the defuzzification phase, the fuzzy information is converted back to numerical information using some defuzzification method, such as center of gravity (CoG), or Mean of Maxima (MoM), among other [78,79,80].
For the FLC used in this work, the fuzzy inputs were determined as the slope (S) and the power variation (ΔPPV) defined from the Power-Voltage curve of a PV panel. S and ΔPPV are described by Equations (5) and (6), respectively. For the output variable, the duty cycle increment (ΔD) was determined, which allows calculation of the duty cycle value to control the DC-DC power converter. The duty cycle value is defined by Equation (7). Figure 6 shows the membership functions for the output and inputs of the FLC. For both output and inputs, asymmetrical triangular membership functions were adopted, and their values adjusted by trial and error employing the MATLAB Fuzzy Logic Toolbox. Table 4 shows the fuzzy rule base used. Details of the FLC design can be found in [23].
S ( n ) = Δ P P V ( n ) Δ V P V ( n ) = I P V ( n ) · V P V ( n ) I P V ( n 1 ) · V P V ( n 1 ) V P V ( n ) V P V ( n 1 )
  Δ P P V ( n ) = P P V ( n ) P P V ( n 1 )
D ( n ) = D ( n 1 ) + Δ D ( n )
where n is the sampling time, PPV(n) is the PV module power, VPV(n) is the PV module voltage, IPV(n) is the PV module current and D(n) is the duty cycle of the power converter.

5. Simulations

This section presents the results of the simulations carried out. The general scheme of the PV system shown in Figure 1 was implemented. The PV array was made of one Kyocera KC85TS module. Table 5 presents its main electrical specifications. Details of its modeling can be found in [4]. Figure 7 shows the power-voltage curves obtained for the PV panel at different levels of radiation and temperature. The values of the passive components and semiconductors used in each converter are those shown in Table 2 and Table 3, respectively. The PWM switching frequency was set at 30 kHz. It should be noted that the switch drivers were not considered, they were simulated as ideal components. Moreover, a capacitor was connected between the PV panel and the DC-DC converters to suppress input voltage ripple and filter ripple current. A value corresponding to the commercial Panasonic EEUFR1H102 capacitor (C = 1000 µF, ESR = 16 mΩ) was used.
Figure 8 shows the simulation scheme developed for testing the SEPIC converter operating with the FLC controller. A similar structure was implemented for the other converters and MPPT methods studied in this work. To test the steady-state follow-up efficiency, different tests were performed. First, sudden changes in the radiation profile were applied, keeping a constant temperature of 25 °C. The radiation was varied between 250 W/m2 and 1000 W/m2, as shown in Figure 9a. Next, abrupt variations in the temperature profile were applied, keeping a constant radiation of 1000 W/m2. The temperature was varied between 15 °C and 30 °C, as shown in Figure 9b. Both tests were performed considering four different load resistance values (R = 2 Ω, R = 5 Ω, R = 10 Ω and R = 20 Ω). Each MPPT/converter configuration was compared in terms of efficiency in power produced by the PV panel and the conversion efficiency of the converters, according to the expressions (8) and (9), respectively. Figure 10 shows the waveforms of PV panel current (IPV), duty cycle, PV panel voltage (VPV), PV panel power (PPV) and converter output power (Pout) for the Buck-Boost converter acting under radiation variations; Figure 11, Figure 12 and Figure 13 show the same waveforms for the Cuk, SEPIC and Zeta converters, respectively.
η MPPT = i = 1 n P PV i = 1 n P MPP × 100
where PPV is the power produced by the PV panel, and PMPP is the ideal maximum power generated by the PV panel.
η converter = i = 1 n P out i = 1 n P PV × 100
where Pout is the output power provided by the converters.

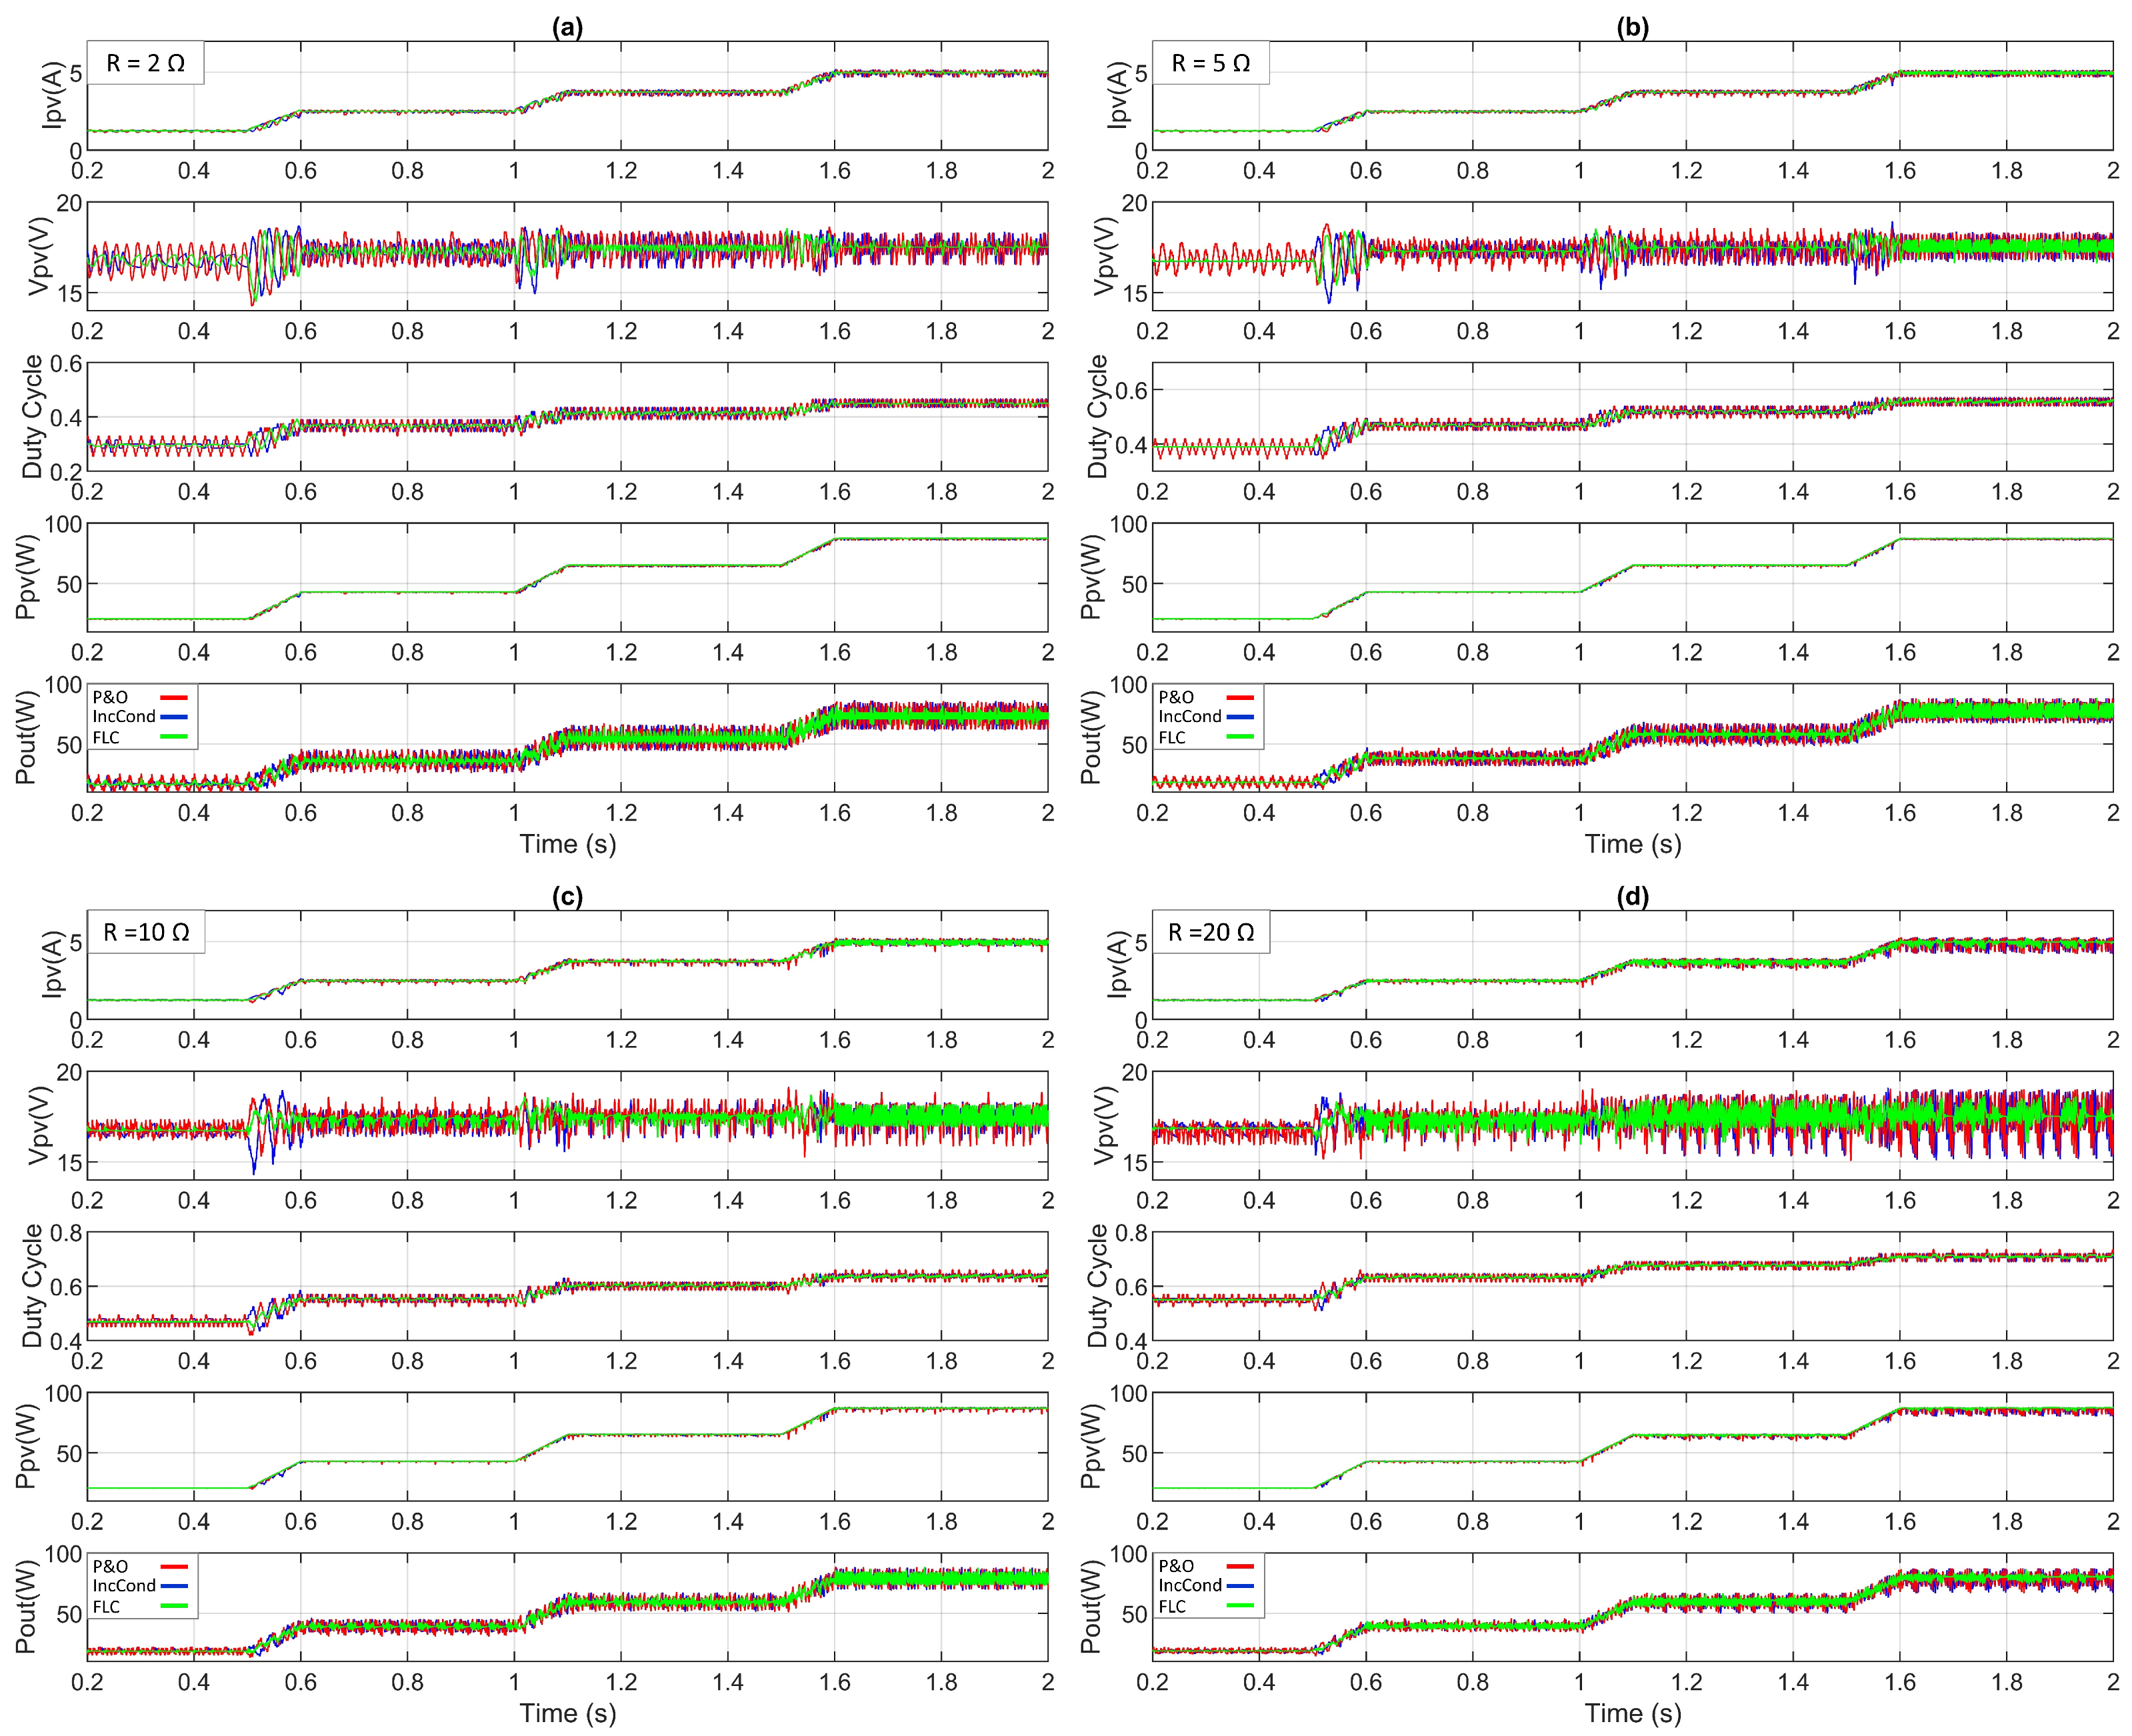
5.1. MPPT Tracking Efficiency under Radiation Variations

Figure 14 shows the summary of the results obtained for the tracking efficiency of the MPPT algorithms for variations in incident radiation. It can be observed that the best performance was achieved by the FLC algorithm operating with the Cuk converter and a connected load of 5 Ω, reaching 99.94% efficiency (Figure 14b), while the worst performance was presented by the P&O algorithm working with the Zeta converter and 2 Ω load, reaching an efficiency of 98.76% (Figure 14a). Figure 15 shows the average efficiency achieved by each MPPT algorithm considering all load conditions. It can be observed that, regardless of the converter used and the value of the connected load, the highest percentages of efficiency were achieved by the FLC algorithm, with the FLC/Cuk configuration being the one that achieved the best performance with an average efficiency of 99.87%. On the other hand, the worst performance was presented by the P&O/SEPIC configuration, reaching an average efficiency of 99.18%.

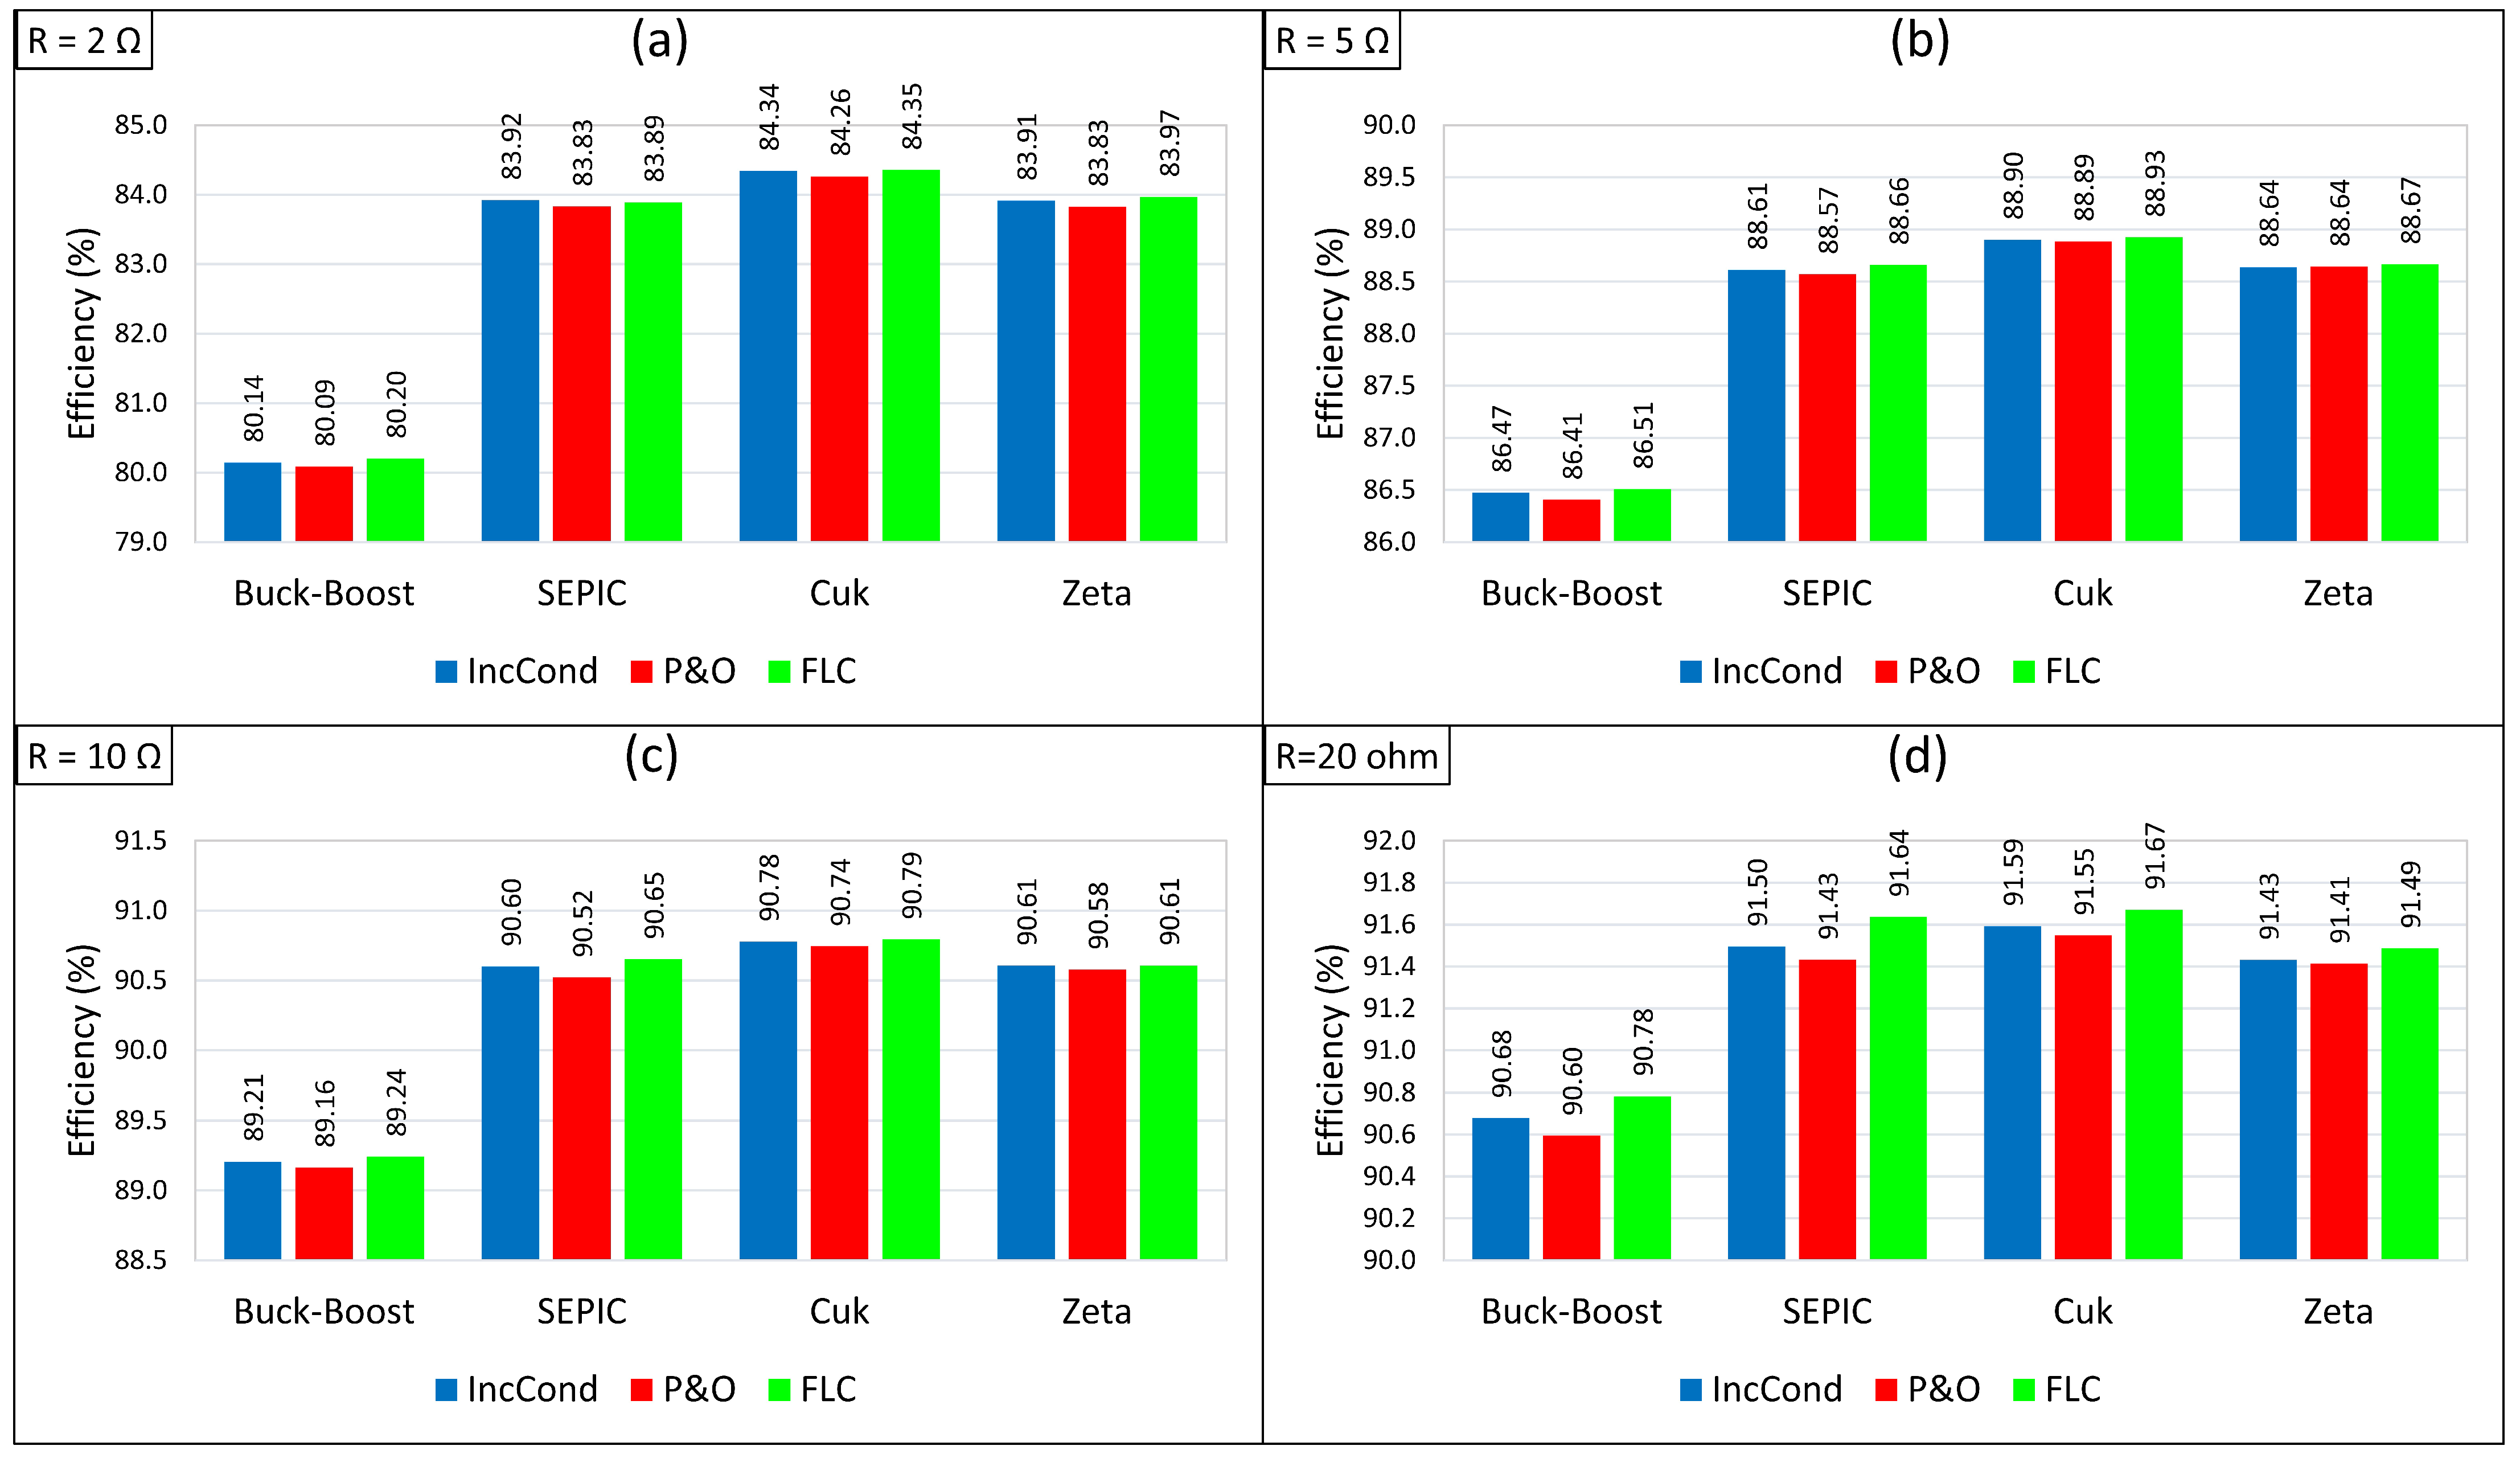
5.2. Converter Efficiency under Radiation Variations

Figure 16 shows the summary of the results obtained for the conversion efficiency of the converters for variations in incident radiation. One can observe the influence of the value of the connected load on the performance of the converters. It is clear that the conversion efficiency of the converters tends to be reduced as the value of the load resistance reduces. On the other hand, it can be seen that the best performance was achieved by the Cuk converter when operating with the FLC algorithm and a connected load of 20 Ω, reaching an efficiency of 91.67% (Figure 16d). The lowest performance was presented by the Buck-Boost converter when working with the P&O algorithm and a load of 2 Ω, reaching an efficiency of 80.09% (Figure 16a). Figure 17 shows the average efficiency achieved by each converter considering all load conditions. It can be observed that regardless of the algorithm used and the value of the connected load, the highest percentages of efficiency were achieved by the Cuk converter. The FLC/Cuk configuration was the one that achieved the best performance with an average conversion efficiency of 89.43%. On the other hand, the worst performance was presented by the P&O/Buck-Boost configuration, reaching an average efficiency of 87.26%.
Figure 18, Figure 19, Figure 20 and Figure 21 show the behavior of the Buck-Boost, Cuk, SEPIC and Zeta topologies, respectively, for temperature variations.

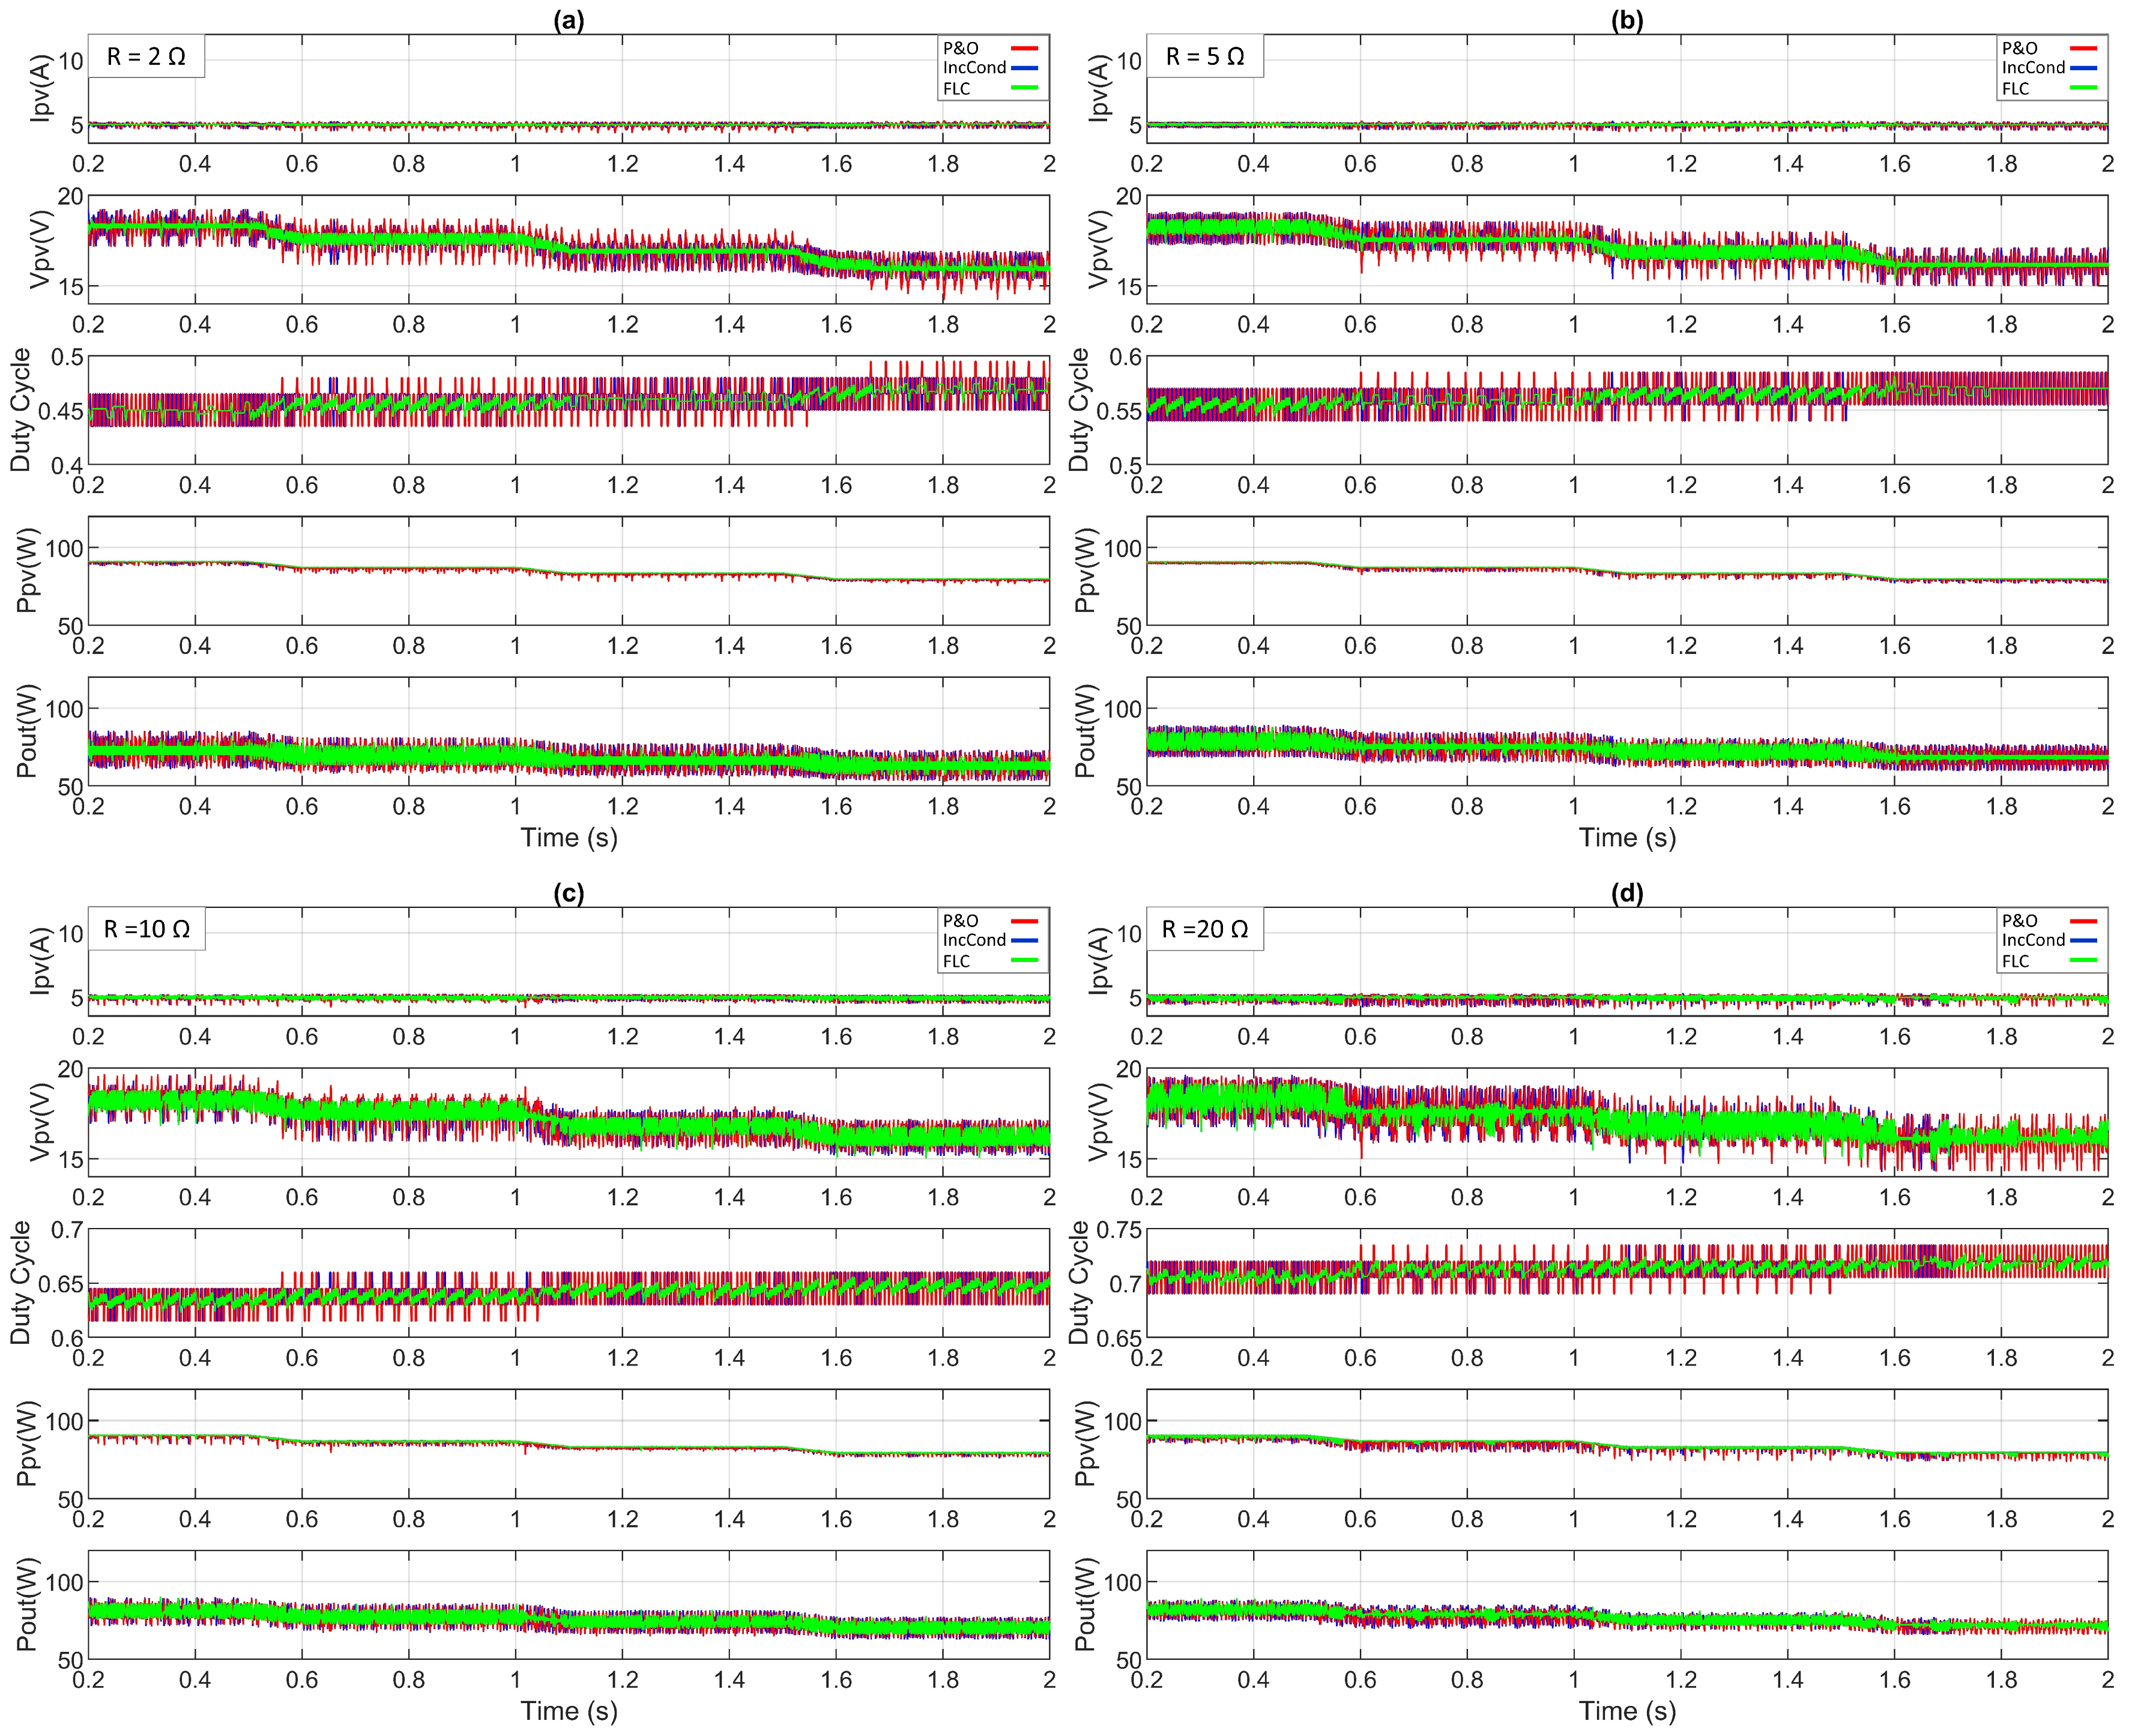
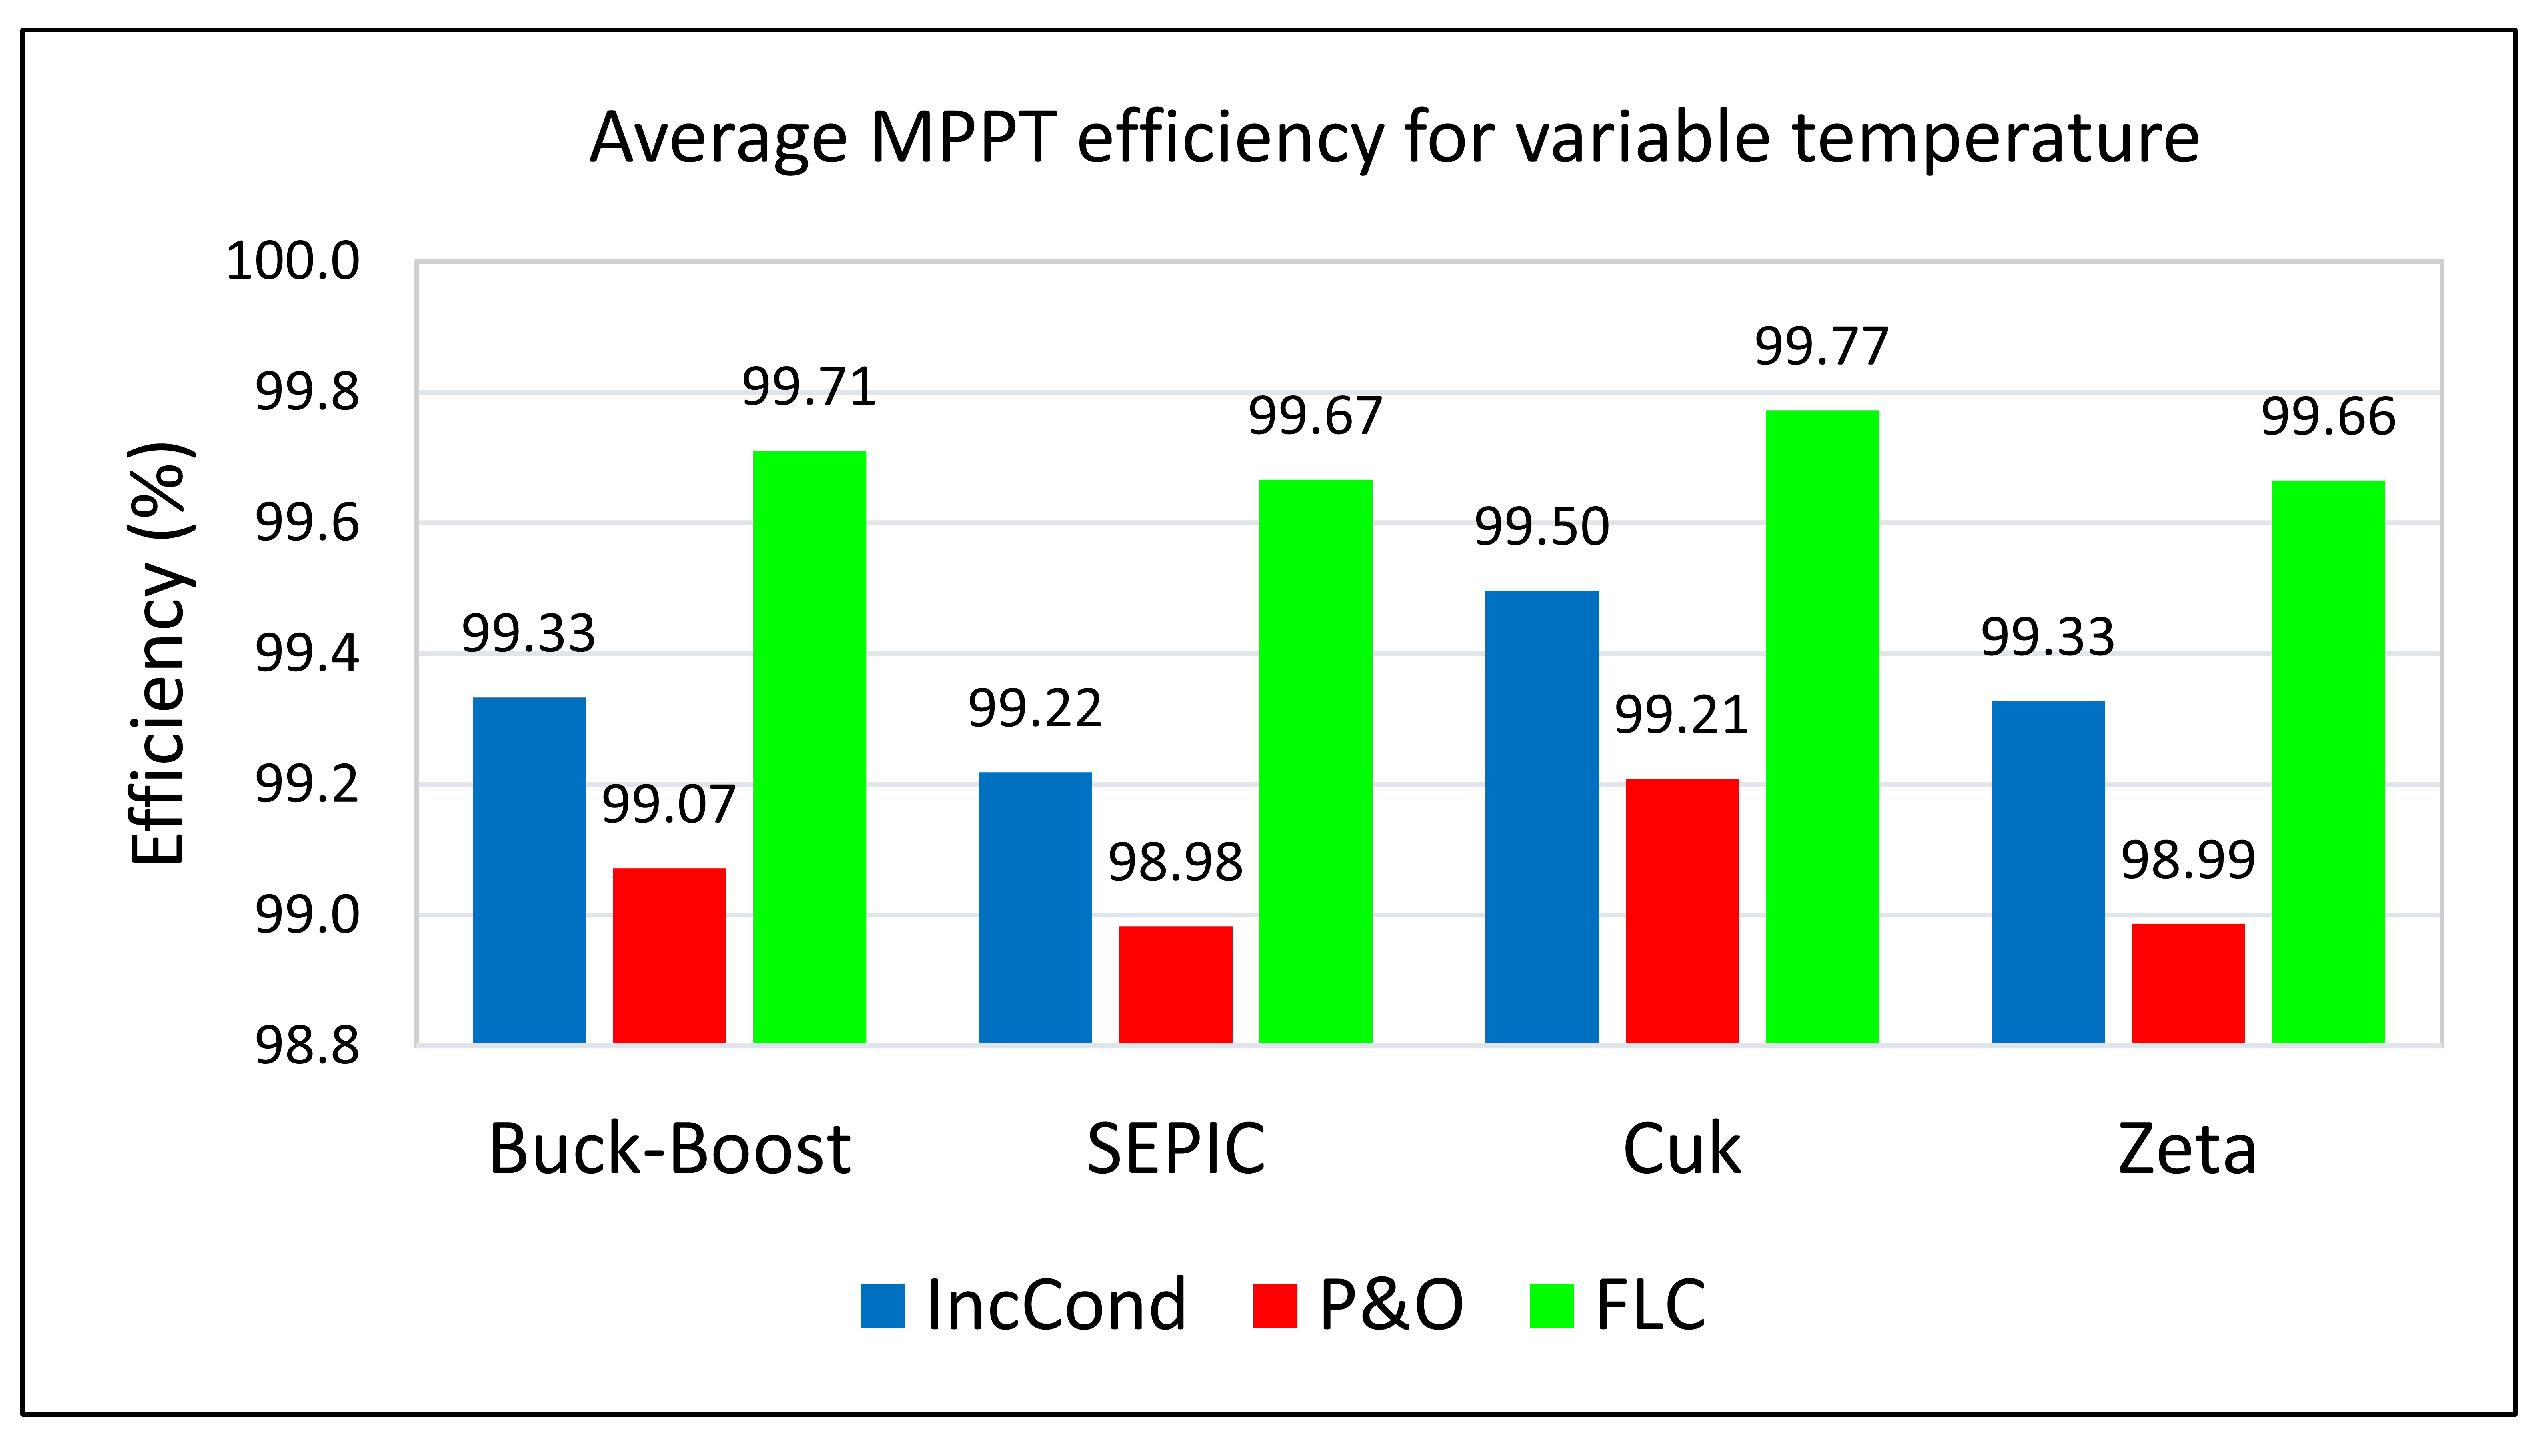
5.3. MPPT Tracking Efficiency under Temperature Variations

Figure 22 shows the summary of the results obtained for the tracking efficiency of MPPT algorithms operating at different temperatures. It can be seen that the best performance was achieved by the FLC algorithm, reaching an efficiency of 99.94% operating with either the Cuk converter or the SEPIC converter, and with a connected load of 2 Ω in both cases (Figure 22a). The worst performance was presented by the P&O algorithm operating with the SEPIC converter and a load of 20 Ω, reaching an efficiency of 98.57% (Figure 22d). Figure 23 shows the average efficiency achieved by each MPPT algorithm considering all load conditions. It can be seen that, regardless of the converter used and the value of the connected load, the highest percentages of efficiency were achieved by the FLC algorithm, with the FLC/Cuk configuration being the one that achieved the best performance with an average efficiency of 99.77%. On the other hand, the lowest average efficiency was presented by the P&O/SEPIC configuration, reaching a value of 98.98%.

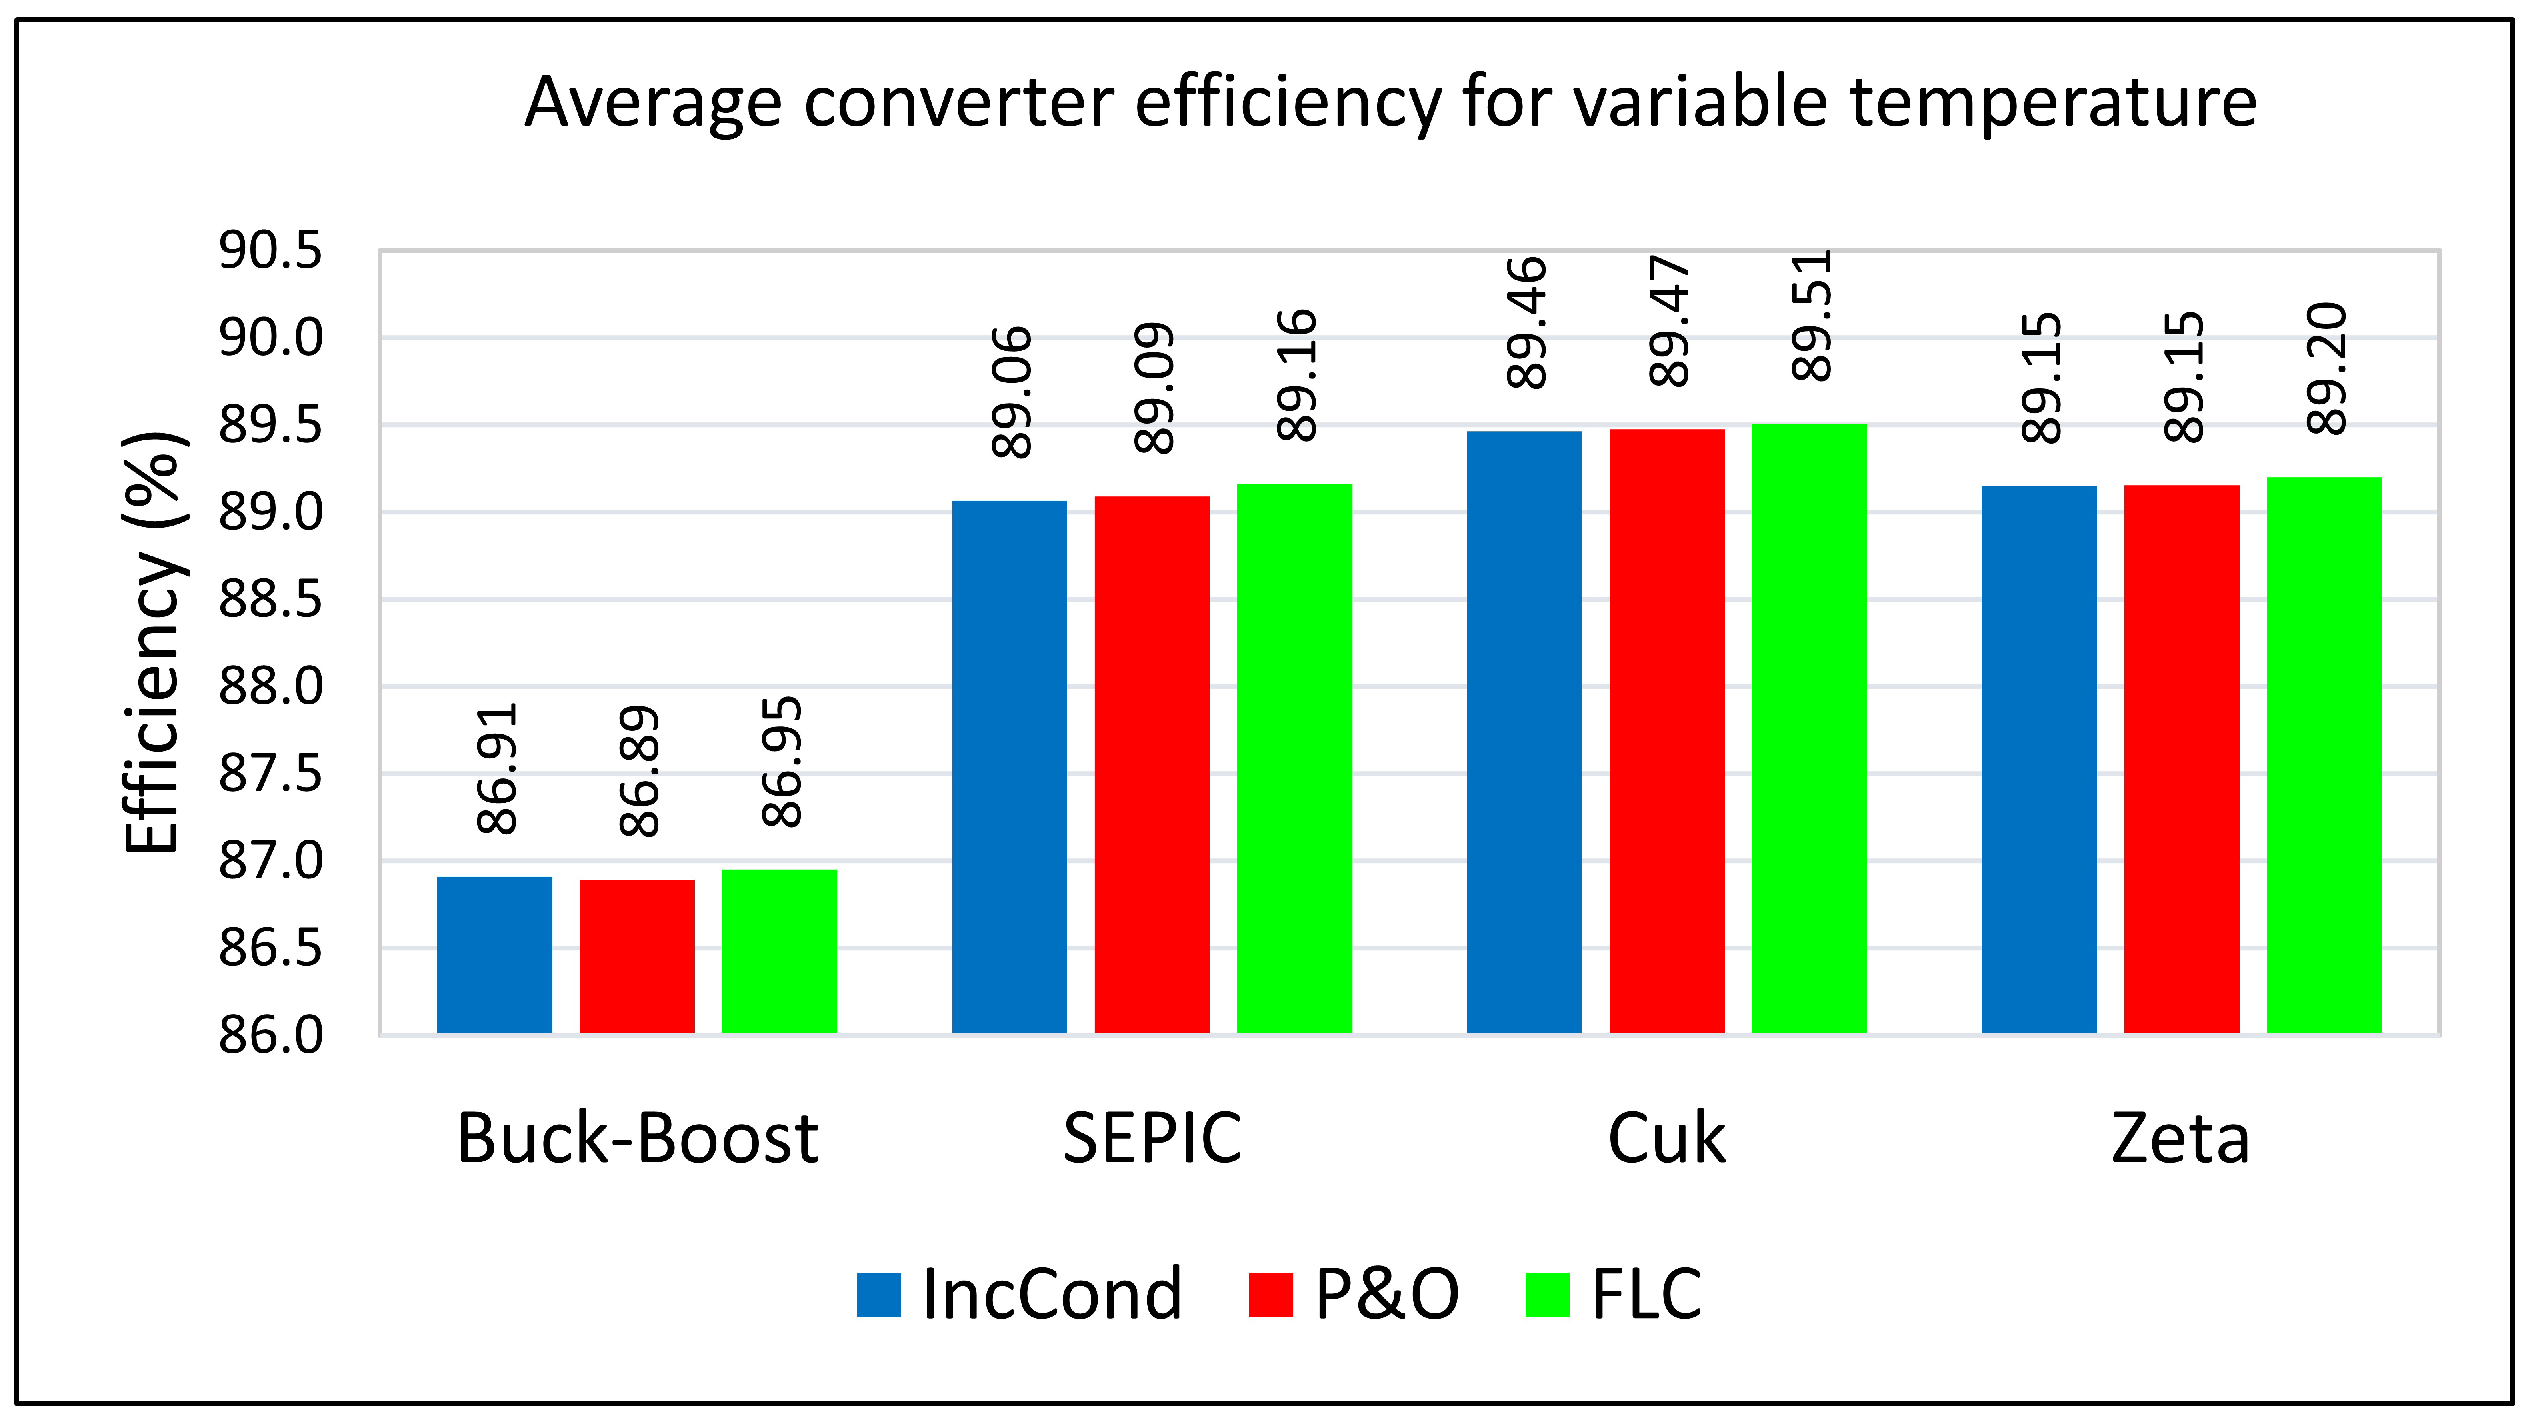
5.4. Converter Efficiency under Temperature Variations

Figure 24 shows the summary of the results obtained for the conversion efficiency of the converters for variations in the temperature of the PV panel. As can be seen, the value of the connected load has a direct effect on the performance of converters, with converters achieving lower efficiency when operating at higher load current levels (lower load resistance). On the other hand, the best performance was achieved by the Cuk converter when operating with the FLC algorithm and a connected load of 20 Ω, reaching an efficiency of 91.63% (Figure 24d). The lowest performance was presented by the Buck-Boost converter when working with the P&O algorithm and a load of 2 Ω, reaching an efficiency of 79.67% (Figure 24a). Figure 25 shows the average efficiency achieved by each converter considering all load conditions. It can be observed that, regardless of the algorithm used and the value of the connected load, the highest percentages of efficiency were achieved by the Cuk converter, with the FLC/Cuk configuration being the one that achieved the best performance with an average conversion efficiency of 89.51%. On the contrary, the worst performance was presented by the P&O/Buck-Boost configuration, reaching an average efficiency of 86.89%.

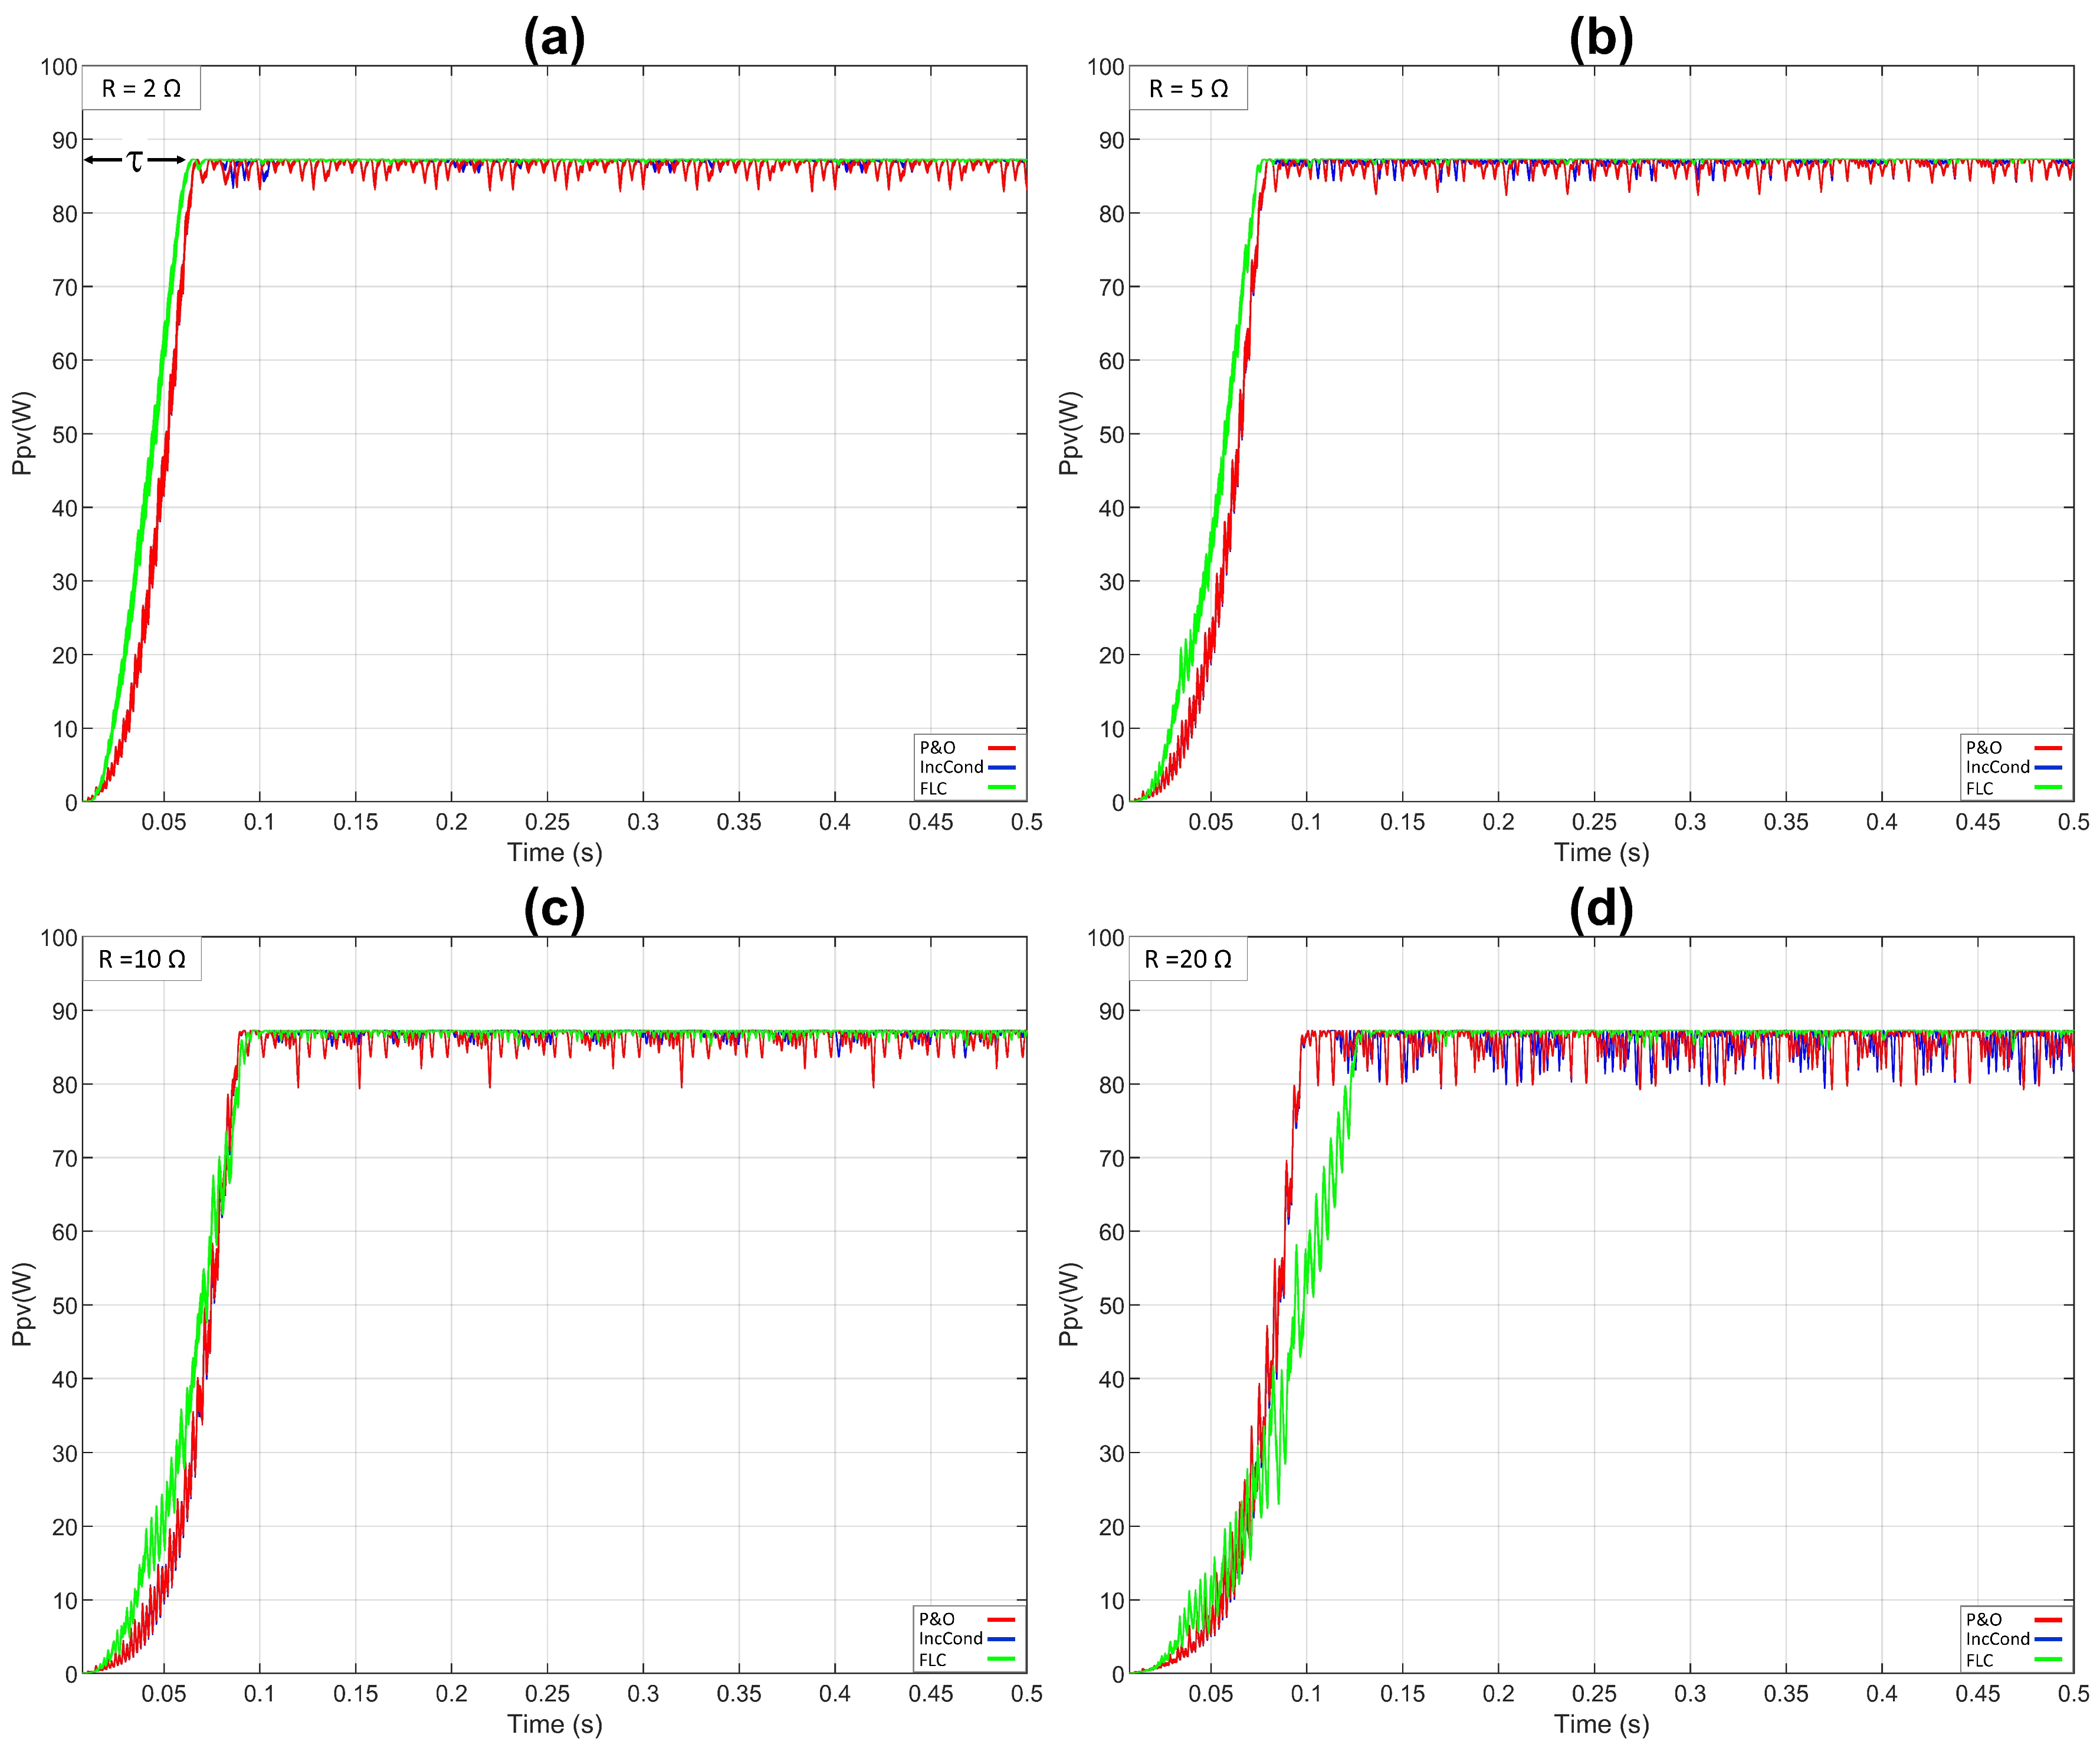
5.5. Transient Tracking Time

The following test was performed in order to analyze the transient behavior: the PV system was simulated considering an incident radiation of 1000 W/m2 and PV panel temperature of 25 °C. For each MPPT/converter configuration, the convergence time (τ) was determined as the instant in which the power reached 95% of the ideal maximum power in the PV module, as recommended in [37]. Figure 26, Figure 27, Figure 28 and Figure 29 show the responses of the MPPT techniques acting with the Buck-Boost, Cuk, SEPIC and Zeta converters, respectively. The test was carried out for each of the load resistance values used above (R = 2 Ω, R = 5 Ω, R = 10 Ω and R = 20 Ω). Figure 30 shows the summary of the results obtained, from which it is observed that the MPPT algorithms respond faster to lower load resistance values. The FLC/Zeta combination with a connected load of 2 Ω presented the fastest transient response with τ = 57.78 ms (Figure 30a), whereas the P&O/SEPIC configuration with a connected load of 20 Ω presented the slowest response with τ = 303.20 ms (Figure 30d). Figure 31 shows the average transient tracking time obtained for each MPPT/converter configuration, where it can be observed that the FLC/Zeta combination was the one that reached the fastest average response with τ = 70.91 ms, whereas the P&O/SEPIC configuration was the one that presented the slowest average response with τ = 288.38 ms.

6. Conclusions

This work enables the selection of the best combination of converter and MPPT strategy applied to typical PV systems with standard DC-DC power converters and the most commonly used MPPT techniques. An exhaustive analysis of the performance of four topologies of non-isolated step-down/step-up DC-DC converters (Buck-Boost, SEPIC, Zeta and Cuk), operating with three different MPPT methods (P&O, IncCond and FLC), used to maximize the electrical power produced in PV generation systems, has been presented. The study was developed based on simulations in Simulink/MATLAB. The transient response and average steady-state efficiency of each MPPT/converter combination were analyzed and compared, considering variations in incident radiation, PV panel temperature and connected load.
The results obtained showed that the value of the connected load has a significant impact on the overall efficiency of the photovoltaic system. It was possible to verify that, in general, when a lower load value is used, the efficiency of the converters and the response times of the MPPT algorithms decrease. On the other hand, regardless of the converter used, all MPPT techniques present excellent performance, with all of them reaching average efficiencies above 98%. Although the three techniques produce similar efficiencies, FLC was slightly superior among them all, followed by IncCond and then P&O. Additionally, it appears that regardless of the MPPT algorithm used, the Cuk converter presented the highest conversion efficiency among all converters; consequently, the FLC/Cuk combination had the best performance of all. On the contrary, the Buck-Boost converter showed the lowest conversion efficiencies, with the P&O/Buck-Boost configuration being the worst. Regarding convergence time, the FLC/Zeta configuration showed the lowest average response time to reach MPP and the P&O/SEPIC configuration had the slowest response.
Finally, this research can be used as a valuable reference for making decisions about whether to implement a particular MPPT/converter configuration among those included in this study.

Author Contributions

Conceptualization, J.L.S.; Methodology, J.L.S.; Software, J.L.S.; Writing—Original draft preparation, J.L.S.; Visualization, J.L.S.; Investigation, J.L.S.; Writing—Reviewing and Editing, S.I.S.J. and L.M.F.M. All authors have read and agreed to the published version of the manuscript.

Funding

This research received no external funding.

Conflicts of Interest

The authors declare no conflict of interest.

Nomenclature

Abbreviations
PVPhotovoltaic
MPPTMaximum power point tracking
MPPMaximum power point
P&OPerturb and observe
IncCondIncremental conductance
FLCFuzzy logic controller
FOCVFractional open circuit voltage
FSCCFractional short circuit current
HCHill climbing
SMCSliding mode control
ANNArtificial neural network
GAGenetic algorithm
PSOParticle swarm optimization
FAFirefly algorithm
CSCuckoo search
AIArtificial intelligence
CCMContinuous conduction mode
DCMDiscontinuous conduction mode
PWMPulse width modulation
CoGCenter of gravity method
MoMMean of Maxima method
Symbols
VMPPMaximum power voltage of the PV panel (V)
PMPPMaximum power of the PV panel (W)
IPVPV panel current (A)
VPVPV panel voltage (V)
PPVPower of the PV panel (W)
PoutOutput power converter (W)
ΔILInductor ripple current (A)
ΔVCCapacitor ripple voltage (V)
VSDC power supply voltage (V)
VOOutput voltage of the power converter (V)
RLoad resistor (Ω)
fPWM switching frequency (Hz)
DCRDC resistance of the inductor (H)
ESREquivalent series resistance of the inductor (Ω)
RDS(on)Static drain-to-source on-resistance of the mosfet (Ω)
RonForward slope resistance of the diode (Ω)
VFForward voltage drop of the diode (Ω)
DDuty cycle of the power converter
ΔDDuty cycle increment
nSample n
n − 1Sample n − 1
SSlope of the P-V curve
ΔPPVPower variation of the PV panel (W)
ΔVPVVoltage variation of the PV panel (V)
ηMPPTEfficiency of the MPPT algorithm (%)
ηconverterEfficiency of the CD-CD power converter (%)
τConvergence time of the MPPT technique (s)

References

  1. Osmani, K.; Haddad, A.; Lemenand, T.; Castanier, B.; Ramadan, M. An investigation on maximum power extraction algorithms from PV systems with corresponding DC-DC converters. Energy 2021, 224, 120092. [Google Scholar] [CrossRef]
  2. Renewables Global Status Report 2022. Available online: https://www.ren21.net/wp-content/uploads/2019/05/GSR2022_Full_Report.pdf (accessed on 28 August 2022).
  3. Kandeal, A.; Algazzar, A.; Elkadeem, M.; Kumar, A.; Abdelaziz, G.; El-Said, E.; Elsaid, A.; Meng, A.; Kandel, R.; Fawzy, H.; et al. Nano-enhanced cooling techniques for photovoltaic panels: A systematic review and prospect recommendations. Solar Energy 2021, 227, 259–272. [Google Scholar] [CrossRef]
  4. López, J.; Seleme, I.; Donoso, P.; Morais, L.; Cortizo, P.; Severo, M. Comparison of the performance of MPPT methods applied in converters Buck and Buck-Boost for autonomous photovoltaic systems. Ingeniare 2021, 29, 229–244. [Google Scholar]
  5. Rajesh, R.; Mabel, C. A comprehensive review of photovoltaic systems. Renew. Sustain. Energy Rev. 2015, 51, 231–248. [Google Scholar] [CrossRef]
  6. Karami, N.; Moubayed, N.; Outbib, R. General review and classification of different MPPT Techniques. Renew. Sustain. Energy Rev. 2017, 68, 1–18. [Google Scholar] [CrossRef]
  7. Reisi, A.; Moradi, M.; Jamasb, S. Classification and comparison of maximum power point tracking techniques for photovoltaic system: A review. Renew. Sustain. Energy Rev. 2013, 19, 433–443. [Google Scholar] [CrossRef]
  8. Messalti, S.; Harrag, A.; Loukriz, A. A new variable step size neural networks MPPT controller: Review, simulation and hardware implementation. Renew. Sustain. Energy Rev. 2017, 68, 221–233. [Google Scholar] [CrossRef]
  9. Chekired, F.; Larbes, C.; Rekioua, D.; Haddad, F. Implementation of a MPPT fuzzy controller for photovoltaic systems on FPGA circuit. Energy Procedia 2011, 6, 541–549. [Google Scholar] [CrossRef] [Green Version]
  10. Robles, C.; Liñán, R.; Ospino, A. Implementation of a cost-effective fuzzy MPPT controller on the Arduino board. Int. J. Smart Sens. Intell. Syst. 2018, 11, 1–10. [Google Scholar]
  11. Mohammed, S.; Devaraj, D.; Imthias, T. A novel hybrid Maximum Power Point Tracking Technique using Perturb & Observe algorithm and Learning Automata for solar PV system. Solar Energy 2016, 112, 1096–1106. [Google Scholar]
  12. Wang, J.; Rong, J.; Yu, L. Dynamic prescribed performance sliding mode control for DC–DC buck converter system with mismatched time-varying disturbances. ISA Trans. 2022, 129, 546–557. [Google Scholar] [CrossRef] [PubMed]
  13. Wang, J.; Li, S.; Yang, J.; Wu, B.; Li, Q. Extended state observer-based sliding mode control for PWM-based DC–DC buck power converter systems with mismatched disturbances. IET Control. Theory Appl. 2015, 9, 579–586. [Google Scholar] [CrossRef]
  14. Mohanty, P.; Bhuvaneswari, G.; Balasubramanian, R.; Dhaliwal, N. MATLAB based modeling to study the performance of different MPPT techniques used for solar PV system under various operating conditions. Renew. Sustain. Energy Rev. 2014, 38, 581–593. [Google Scholar] [CrossRef]
  15. Zakzouk, N.; Elsaharty, M.; Abdelsalam, A.; Helal, A.; Williams, B. Improved performance low-cost incremental conductance PV MPPT technique. IET Renew. Power Gener. 2016, 10, 561–574. [Google Scholar] [CrossRef] [Green Version]
  16. Nabipour, M.; Razaz, M.; Seifossadat, S.; Mortazavi, S. A new MPPT scheme based on a novel fuzzy approach. Renew. Sustain. Energy Rev. 2017, 74, 1147–1169. [Google Scholar] [CrossRef]
  17. Suganthi, L.; Iniyan, S.; Samuel, A. Applications of fuzzy logic in renewable energy systems—A review. Renew. Sustain. Energy Rev. 2015, 48, 585–607. [Google Scholar] [CrossRef]
  18. Sera, D.; Mathe, L.; Kerekes, T.; Viorel, S.; Teodorescu, R. On the Perturb-and-Observe and Incremental Conductance MPPT Methods for PV Systems. IEEE J. Photovolt. 2013, 3, 1070–1078. [Google Scholar] [CrossRef]
  19. Esram, T.; Chapman, P. Comparison of photovoltaic array maximum power point tracking techniques. IEEE Trans. Energy Convers. 2007, 22, 439–449. [Google Scholar] [CrossRef] [Green Version]
  20. Allah, A.; Saied, M.; Mostafa, M.; Abdel, T. A Survey of Maximum PPT Techniques of PV Systems. In Proceedings of the 2012 IEEE Energytech, Cleveland, OH, USA, 29–31 May 2012. [Google Scholar]
  21. Gupta, A.; Chauhan, Y.; Kumar, R. A comparative investigation of maximum power point tracking methods for solar PV system. Sol. Energy 2016, 136, 236–253. [Google Scholar] [CrossRef]
  22. Oudda, M.; Hazzab, A. Fuzzy Logic Control of a SEPIC Converter for a Photovoltaic System. J. Fundam. Renew. Energy Appl. 2016, 6, 1000212. [Google Scholar] [CrossRef]
  23. López, J.; Seleme, I. Robust Digital Control Strategy Based on Fuzzy Logic for a Solar Charger of VRLA Batteries. Energies 2021, 14, 1001. [Google Scholar]
  24. Ba, A.; Ould, C.; El Mamy, M.; Hamdouna, O.; Elhassena, A. Comparative Study of Different DC/DC Power Converter for Optimal PV System Using MPPT (P&O) Method. Appl. Sol. Energy 2018, 54, 235–245. [Google Scholar]
  25. Mumtaz, F.; Zaihar, N.; Tanzim, S.; Singh, B.; Kannan, R.; Ibrahim, O. Review on non-isolated DC-DC converters and their control techniques for renewable energy applications. Ain Shams Eng. J. 2021, 12, 3747–3763. [Google Scholar] [CrossRef]
  26. Dileep, G.; Singh, S. Selection of non-isolated DC-DC converters for solar photovoltaic system. Renew. Sustain. Energy Rev. 2017, 76, 1230–1247. [Google Scholar]
  27. Zaions, D.; Balbino, J.; Baratieri, C.; Stankiewicz, A. Comparative analysis of buck and boost converters applied to different maximum power point tracking techniques for photovoltaic systems. In Proceedings of the Brazilian Power Electronics Conference (COBEP), Juiz de Fora, Brazil, 19–22 November 2017. [Google Scholar]
  28. Dursun, M.; Gorgun, A. Analysis and Performance Comparison of DC-DC Power Converters Used in Photovoltaic Systems. In Proceedings of the 4th International Conference on Electrical and Electronic Engineering (ICEEE), Ankara, Turkey, 8–10 April 2017. [Google Scholar]
  29. Reshma, R.; Sreejith, S. Converter topologies in photovoltaic applications—A review. Renew. Sustain. Energy Rev. 2018, 94, 1–14. [Google Scholar] [CrossRef]
  30. Hossaina, M.; Rahim, N.; Selvaraj, J. Recent progress and development on power DC-DC converter topology, control, design and applications: A review. Renew. Sustain. Energy Rev. 2018, 81, 205–230. [Google Scholar] [CrossRef]
  31. Coelho, R.; Concer, F.; Martins, D. A Study of the basic DC-DC converters applied in maximum power point tracking. In Proceedings of the Brazilian Power Electronics Conference (COBEP), Mato Grosso do Sul, Brazil, 27 September–1 October 2009. [Google Scholar]
  32. Pant, S.; Saini, R. Comparative Study of MPPT Techniques for Solar Photovoltaic System. In Proceedings of the International Conference on Electrical, Electronics and Computer Engineering (UPCON), Aligarh, India, 8–10 November 2019. [Google Scholar]
  33. Sah, B.; Satish, G. A Comparative study of different MPPT techniques using different dc-dc converters in a standalone PV system. In Proceedings of the IEEE Region 10 Conference (TENCON), Singapore, 22–25 November 2016. [Google Scholar]
  34. Soedibyo. Ashari, M. Soedibyo. Ashari, M. The comparative study of Buck-boost, Cuk, Sepic and Zeta converters for maximum power point tracking photovoltaic using P&O method. In Proceedings of the 2nd International Conference on Information Technology, Computer, and Electrical Engineering (ICITACEE), Semarang, Indonesia, 16–18 October 2015. [Google Scholar]
  35. Soriano, L.; Ponce, P.; Molina, A. Analysis of DC-DC Converters for Photovoltaic Applications based on conventional MPPT Algorithms. In Proceedings of the 14th International Conference on Electrical Engineering, Computing Science and Automatic Control (CCE), Mexico City, Mexico, 20–22 September 2017. [Google Scholar]
  36. Surya, P.; Irawan, D.; Zuhri, M. Review and Comparison of DC-DC Converters for Maximum Power Point Tracking System in Standalone Photovoltaic (PV) Module. In Proceedings of the International Conference on Advanced Mechatronics, Intelligent Manufacture, and Industrial Automation (ICAMIMIA), Surabaya, Indonesia, 12–14 October 2017. [Google Scholar]
  37. Jain, S.; Agarwal, V. Comparison of the performance of maximum power point tracking schemes applied to single-stage grid-connected photovoltaic systems. IET Electr. Power Appl. 2007, 1, 753–762. [Google Scholar] [CrossRef]
  38. Yu, G.; Jung, Y.; Choi, J.; Kim, G. A novel two-mode MPPT control algorithm based on comparative study of existing algorithms. Solar Energy 2004, 76, 455–463. [Google Scholar] [CrossRef]
  39. Yen-Jung, M.; Hu, A.; Nirmal-Kumar, N. Evaluation of Micro Controller Based Maximum Power Point Tracking Methods Using dSPACE Platform. In Proceedings of the Australian University Power Engineering Conference, Melbourne, Australia, 10–13 December 2006. [Google Scholar]
  40. Faranda, R.; Leva, S. Energy comparison of mppt techniques for pv systems. WSEAS Trans. Power Syst. 2008, 3, 446–455. [Google Scholar]
  41. Lamnadi, M.; Trihi, M.; Bossoufi, B.; Boulezhar, A. Comparative study of IC, P&O and FLC method of mppt algorithm for grid connected pv module. J. Theor. Appl. Inf. Technol. 2016, 89, 242–253. [Google Scholar]
  42. Houssamo, I.; Locment, F.; Sechilariu, M. Experimental analysis of impact of MPPT methods on energy efficiency for photovoltaic power systems. Electr. Power Energy Syst. 2013, 46, 98–107. [Google Scholar] [CrossRef]
  43. Mosaad, M.; Osama, M.; Mahmoud, A.; Banakher, F. Maximum Power Point Tracking of PV system Based Cuckoo Search Algorithm; review and comparison. Energy Procedia 2019, 162, 117–126. [Google Scholar] [CrossRef]
  44. Ibrahim, H. Comparison between Fuzzy and P&O Control for MPPT for Photovoltaic System Using Boost Converter. J. Energy Technol. Policy 2012, 2, 1–11. [Google Scholar]
  45. Shadlu, M. Comparison of Maximum Power Point Tracking (MPPT) Algorithms to Control DC-DC Converters in Photovoltaic Systems. Recent Adv. Electr. Electron. Eng. 2019, 12, 355–367. [Google Scholar] [CrossRef]
  46. Hussaian, C.; Rani, C. Different Conventional and Soft Computing MPPT Techniques for Solar PV Systems with High Step-Up Boost Converters: A Comprehensive Analysis. Energies 2020, 13, 371. [Google Scholar]
  47. Rezk, H.; Eltamaly, A. A comprehensive comparison of different MPPT techniques for photovoltaic systems. Solar Energy 2015, 112, 1–11. [Google Scholar] [CrossRef]
  48. Bendib, B.; Belmili, H.; Krim, F. A survey of the most used MPPT methods: Conventional and advanced algorithms applied for photovoltaic systems. Renew. Sustain. Energy Rev. 2015, 45, 637–648. [Google Scholar] [CrossRef]
  49. Kchaou, A.; Naamane, A.; Koubaa, Y.; Sirdi, N. Comparative Study of Different MPPT techniques for a Stand-alone PV System. In Proceedings of the 17th International Conference on Sciences and Techniques of Automatic Control & Computer Engineering (STA), Sousse, Tunisia, 19–21 December 2016; pp. 629–634. [Google Scholar]
  50. El mentaly, L.; Amghar, A.; Sahsah, H. Comparison between HC, FOCV and TG MPPT algorithms for PV solar systems using buck converter. In Proceedings of the International Conference on Wireless Technologies, Embedded and Intelligent Systems (WITS), Fez, Morocco, 19–20 April 2017. [Google Scholar]
  51. Basoglu, M.; Çakir, B. Hardware based comparison of buck-boost converter topologies in MPPT systems. In Proceedings of the 9th International Conference on Electrical and Electronics Engineering (ELECO), Bursa, Turkey, 26–28 November 2015. [Google Scholar]
  52. de Brito, G.M.; Sampaio, L.; Luigi, G.; Guilherme, A.; Canesin, C. Comparative Analysis of MPPT Techniques for PV Applications. In Proceedings of the International Conference on Clean Electrical Power (ICCEP), Ischia, Italy, 14–16 June 2011. [Google Scholar]
  53. Ghalib, A. Comparative Study of MPPT Algorithms under Variable Resistive Load. In Proceedings of the 2016 International Conference on Applied and Theoretical Electricity (ICATE), Craiova, Romania, 6–8 October 2016. [Google Scholar]
  54. Sarvi, M.; Azadian, A. A comprehensive review and classified comparison of MPPT algorithms in PV systems. Energy Syst. 2022, 13, 281–320. [Google Scholar] [CrossRef]
  55. Zongo, O. Comparing the Performances of MPPT Techniques for DC-DC Boost Converter in a PV System. Walailak J. Sci. Technol. 2021, 18, 6500. [Google Scholar] [CrossRef]
  56. Jotham, L.; Chia, A.; Teh, J. Non-isolated conventional DC-DC converter comparison for a photovoltaic system: A review. J. Renew. Sustain. Energy 2020, 12, 013502. [Google Scholar] [CrossRef]
  57. Raj, A.; Raj, S.; Gupta, J. Solar PV array-based DC–DC converter with MPPT for low power applications. Renew. Energy Focus 2020, 34, 109–119. [Google Scholar] [CrossRef]
  58. Taghvaee, M.; Radzi, M.; Moosavain, S.; Hashim, H.; Hamiruce, M. A current and future study on non-isolated dc–dc converters for photovoltaic applications. Renew. Sustain. Energy Rev. 2013, 17, 216–227. [Google Scholar] [CrossRef]
  59. Veerachary, M. Design and Analysis of Split-inductor Based Buck-Boost Converters. In Proceedings of the IEEE International Symposium on Circuits and Systems (ISCAS), Sapporo, Japan, 26–29 May 2019. [Google Scholar]
  60. Hart, D. Power Electronics; McGraw Hill: Valparaíso, IN, USA, 2011; pp. 196–264. [Google Scholar]
  61. Gholizadeh, H.; Gorji, S.; Afjei, E.; Sera, D. Design and Implementation of a New Cuk-Based Step-Up DC–DC Converter. Energies 2021, 14, 6975. [Google Scholar] [CrossRef]
  62. Farahat, M.; Metwally, H.; Abd-Elfatah, A. Optimal choice and design of different topologies of DC-DC converter used in PV systems, at different climatic conditions in Egypt. Renew. Energy 2012, 43, 393–402. [Google Scholar] [CrossRef]
  63. Kumar, V.; Ghosh, S.; Swami, N.; Kamal, S.; Saket, R.; Nagar, S. Load voltage-based MPPT technique for standalone PV systems using adaptive step. Int. J. Electr. Power Energy Syst. 2021, 128, 106732. [Google Scholar] [CrossRef]
  64. Necaibia, S.; Samira, M.; Labar, H.; Necaibia, A.; Castronuovo, E. Enhanced auto-scaling incremental conductance MPPT method, implemented on low-cost microcontroller and SEPIC converter. Sol. Energy 2019, 180, 152–168. [Google Scholar] [CrossRef]
  65. Pop-Calimanu, I.; Popescu, S.; Lascu, D. A New SEPIC-Based DC-DC Converter with Coupled Inductors Suitable for High Step-Up Applications. Appl. Sci. 2022, 12, 178. [Google Scholar] [CrossRef]
  66. Vuthchhay, E.; Bunlaksananusorn, C. Modeling and Control of a Zeta Converter. In Proceedings of the The 2010 International Power Electronics Conference—ECCE ASIA, Sapporo, Japan, 21–24 June 2010. [Google Scholar]
  67. Bayat, F.; Karimi, M.; Taheri, A. Robust output regulation of Zeta converter with load/input variations: LMI approach. Control. Eng. Pract. 2019, 84, 102–111. [Google Scholar] [CrossRef]
  68. Arbi, J.; Ben, M.; Moussa, S. Comparative study of Boost and Zeta converters in DC microgrid applications. In Proceedings of the 2020 6th IEEE International Energy Conference (ENERGYCon), Gammarth, Tunisia, 28 September 2020–1 October 2020. [Google Scholar]
  69. Ferrera, M.; Pérez, S.; Durán, E.; Enrique, J. New Single-Input, Multiple-Output Converter Topologies: Combining Single-Switch Nonisolated dc-dc Converters for Single-Input, Multiple-Output Applications. IEEE Ind. Electron. Mag. 2016, 10, 6–20. [Google Scholar] [CrossRef]
  70. Femia, N.; Petrone, G.; Spagnuolo, G.; Vitelli, M. Optimization of perturb and observe maximum power point tracking method. IEEE Transtra. Power Electron. 2005, 20, 963–973. [Google Scholar] [CrossRef]
  71. Subudhi, B.; Pradhan, R. A comparative study on maximum power point tracking techniques for photovoltaic power systems. IEEE Trans. Sustain. Energy 2013, 4, 89–98. [Google Scholar] [CrossRef]
  72. Osakada, M.; Hussein, K.; Muta, I.; Hoshino, T. Maximum photovoltaic power tracking: An algorithm for rapidly changing atmospheric conditions. IEE Proc.—Gener. Transm. Distrib. 1995, 142, 59–64. [Google Scholar]
  73. Liu, F.; Duan, S.; Liu, B.; Kang, Y. A variable step size INC MPPT method for pv systems. IEEE Trans. Ind. Electron. 2008, 55, 2622–2628. [Google Scholar]
  74. Sharma, K.; Kumar, D. Robust controller design for DC-DC converters using fuzzy logic. In Proceedings of the 4th International Conference on Signal Processing, Computing and Control (ISPCC), Solan, India, 21–23 September 2017. [Google Scholar]
  75. Messai, A.; Mellit, A.; Guessoum, A.; Kalogirou, S. Maximum power point tracking using a GA optimized fuzzy logic controller and its FPGA implementation. Sol. Energy 2011, 85, 265–277. [Google Scholar] [CrossRef]
  76. Boutouba, M.; El Ougli, A.; Miqoi, S.; Tidhaf, B. Design and Experimentation of a Control System Implemented on Raspberry Pi 3 Board for Photovoltaic Systems Using SEPIC Converter. J. Electr. Syst. 2017, 13, 661–677. [Google Scholar]
  77. Luta, D.; Raji, A. Comparing fuzzy rule-based MPPT techniques for fuel cell stack applications. Energy Procedia 2019, 156, 177–182. [Google Scholar] [CrossRef]
  78. Cheng, P.; Peng, B.; Liu, Y.; Cheng, Y.; Huang, J. Optimization of a Fuzzy-Logic-Control-Based MPPT Algorithm Using the Particle Swarm Optimization Technique. Energies 2015, 8, 5338–5360. [Google Scholar] [CrossRef] [Green Version]
  79. Subiyanto, S.; Mohamed, A.; Hannan, M. Intelligent maximum power point tracking for PV system using Hopfield neural network optimized fuzzy logic controller. Energy Build. 2012, 51, 29–38. [Google Scholar] [CrossRef]
  80. Robles, A.; Giraldo, J.; Rodríguez, O. Fuzzy Logic Based MPPT Controller for a PV System. Energies 2017, 10, 2036. [Google Scholar]
  81. Kyocera Corporation KC85TS Datasheet. Available online: https://www.manualslib.com/manual/387909/Kyocera-Kc85ts.html (accessed on 15 October 2022).
Figure 1. Typical PV system with DC-DC power converter and MPPT controller.
Energies 15 07936 g001
Figure 2. Step-down/step-up DC-DC power converters. (a) Buck-Boost. (b) SEPIC. (c) Cuk. (d) Zeta.
Energies 15 07936 g002
Figure 3. Flowchart of P&O MPPT method.
Energies 15 07936 g003
Figure 4. Flowchart of IncCond MPPT method.
Energies 15 07936 g004
Figure 5. Block diagram of an FLC controller.
Energies 15 07936 g005
Figure 6. Triangular membership functions of the FLC. (a) Input S. (b) Input ΔPPV. (c) Output ΔD.
Energies 15 07936 g006
Figure 7. The P–V characteristic curves simulated for the Kyocera KC85TS module. (a) Variable temperature and constant radiation of 1000 W/m2. (b) Variable radiation and constant temperature of 25 °C.
Energies 15 07936 g007
Figure 8. (a) Simulation scheme developed for the PV system operating with the SEPIC converter and the FLC-MPPT algorithm. (b) Internal block diagram of the FLC.
Energies 15 07936 g008
Figure 9. (a) Radiation profile. (b) Temperature profile.
Energies 15 07936 g009
Figure 10. PV system operating with Buck-Boost topology and MPPT methods for radiation variations and constant temperature of 25 °C. (a) R = 2 Ω. (b) R = 5 Ω. (c) R = 10 Ω. (d) R = 20 Ω.
Energies 15 07936 g010
Figure 11. PV system operating with Cuk topology and MPPT methods for radiation variations and constant temperature of 25 °C. (a) R = 2 Ω. (b) R = 5 Ω. (c) R = 10 Ω. (d) R = 20 Ω.
Energies 15 07936 g011
Figure 12. PV system operating with SEPIC topology and MPPT methods for radiation variations and constant temperature of 25 °C. (a) R = 2 Ω. (b) R = 5 Ω. (c) R = 10 Ω. (d) R = 20 Ω.
Energies 15 07936 g012
Figure 13. PV system operating with Zeta topology and MPPT methods for radiation variations and constant temperature of 25 °C. (a) R = 2 Ω. (b) R = 5 Ω. (c) R = 10 Ω. (d) R = 20 Ω.
Energies 15 07936 g013
Figure 14. MPPT tracking efficiency for radiation variations and constant temperature of 25 °C. (a) R = 2 Ω. (b) R = 5 Ω. (c) R = 10 Ω. (d) R = 20 Ω.
Energies 15 07936 g014
Figure 15. Average MPPT tracking efficiency for radiation variations and constant temperature of 25 °C.
Energies 15 07936 g015
Figure 16. Converter efficiency for radiation variations and constant temperature of 25 °C. (a) R = 2 Ω. (b) R = 5 Ω. (c) R = 10 Ω. (d) R = 20 Ω.
Energies 15 07936 g016
Figure 17. Average converter efficiency for radiation variations and constant temperature of 25 °C.
Energies 15 07936 g017
Figure 18. PV system operating with Buck-Boost topology and MPPT methods for temperature variations and constant radiation of 1000 W/m2. (a) R = 2 Ω. (b) R = 5 Ω. (c) R = 10 Ω. (d) R = 20 Ω.
Energies 15 07936 g018
Figure 19. PV system operating with Cuk topology and MPPT methods for temperature variations and constant radiation of 1000 W/m2. (a) R = 2 Ω. (b) R = 5 Ω. (c) R = 10 Ω. (d) R = 20 Ω.
Energies 15 07936 g019
Figure 20. PV system operating with SEPIC topology and MPPT methods for temperature variations and constant radiation of 1000 W/m2. (a) R = 2 Ω. (b) R = 5 Ω. (c) R = 10 Ω. (d) R = 20 Ω.
Energies 15 07936 g020
Figure 21. PV system operating with Zeta topology and MPPT methods for temperature variations and constant radiation of 1000 W/m2. (a) R = 2 Ω. (b) R = 5 Ω. (c) R = 10 Ω. (d) R = 20 Ω.
Energies 15 07936 g021
Figure 22. MPPT tracking efficiency for temperature variations and constant radiation of 1000 W/m2. (a) R = 2Ω. (b) R = 5 Ω. (c) R = 10 Ω. (d) R = 20 Ω.
Energies 15 07936 g022
Figure 23. Average MPPT tracking efficiency for temperature variations and constant radiation of 1000 W/m2.
Energies 15 07936 g023
Figure 24. Converter efficiency for temperature variations and constant radiation of 1000 W/m2. (a) R = 2 Ω. (b) R = 5 Ω. (c) R = 10 Ω. (d) R = 20 Ω.
Energies 15 07936 g024
Figure 25. Average converter efficiency for temperature variations and constant radiation of 1000 W/m2.
Energies 15 07936 g025
Figure 26. Convergence time of the MPPT techniques working with the Buck-Boost converter at 1000 W/m2 and 25 °C. (a) R = 2 Ω. (b) R = 5 Ω. (c) R = 10 Ω. (d) R = 20 Ω.
Energies 15 07936 g026
Figure 27. Convergence time of the MPPT techniques working with the Cuk converter at 1000 W/m2 and 25 °C. (a) R = 2 Ω. (b) R = 5 Ω. (c) R = 10 Ω. (d) R = 20 Ω.
Energies 15 07936 g027
Figure 28. Convergence time of the MPPT techniques working with SEPIC converter at 1000 W/m2 and 25 °C. (a) R = 2 Ω. (b) R = 5 Ω. (c) R = 10 Ω. (d) R = 20 Ω.
Energies 15 07936 g028
Figure 29. Convergence time of the MPPT techniques working with the Zeta converter at 1000 W/m2 and 25 °C. (a) R = 2 Ω. (b) R = 5 Ω. (c) R = 10 Ω. (d) R = 20 Ω.
Energies 15 07936 g029
Figure 30. Settling time of MPPT methods at 1000 W/m2 and 25 °C. (a) R = 2 Ω. (b) R = 5 Ω. (c) R = 10 Ω. (d) R = 20 Ω.
Energies 15 07936 g030
Figure 31. Average settling time of MPPT methods at 1000 W/m2 and 25 °C.
Energies 15 07936 g031
Table 1. Setting equations.
ParameterBuck-BoostCukSEPICZeta
V o V s D 1 D D 1 D D 1 D D 1 D
L 1 V s · D Δ I L 1 · f V s · D Δ I L 1 · f V s · D Δ I L 1 · f V s · D Δ I L 1 · f
L 2 - V s · D Δ I L 2 · f V s · D Δ I L 2 · f V s · D Δ I L 2 · f
C 1 V o · D Δ V C 1 · f · R V o · D Δ V C 1 · f · R V o · D Δ V C 1 · f · R V o · D Δ V C 1 · f · R
C 2 - V o ( 1 D ) 8 · Δ V C 2 · L 2 · f 2 V o · D Δ V C 2 · f · R V s · D 8 · Δ V C 2 · L 2 · f 2
Table 2. Passive components of the DC-DC converters.
Buck-BoostCukSEPICZeta
ParameterCalculated ValueCommercial
Value
Calculated ValueCommercial
Value
Calculated ValueCommercial
Value
Calculated ValueCommercial
Value
L 1 233.5 µH220 µH
DCR = 75 mΩ
Coilcraft
PCV-2-224-05L
572.1 µH560 µH
DCR = 90 mΩ
Coilcraft
PCV-2-564-08L
572.1 µH560 µH
DCR = 90 mΩ
Coilcraft
PCV-2-564-08L
572.1 µH560 µH
DCR = 90 mΩ
Coilcraft
PCV-2-564-08L
L 2 --197.3 µH180 µH
DCR = 48 mΩ
Coilcraft
PCV-2-184-10L
197.3 µH180 µH
DCR = 48 mΩ
Coilcraft
PCV-2-184-10L
197.3 µH180 µH
DCR = 48 mΩ
Coilcraft
PCV-2-184-10L
C 1 340.1 µF330 µF
ESR = 22 mΩ
Panasonic EEUFR1H331L
136.1 µF150 µF
ESR = 42 mΩ
Panasonic EEUFR1H151
136.1 µF150 µF
ESR = 42 mΩ
Panasonic EEUFR1H151
136.1 µF150 µF
ESR = 42 mΩ
Panasonic EEUFR1H151
C 2 --20.8 µF22 µF
ESR = 340 mΩ
Panasonic EEUFR1H220
340.1 µF330 µF
ESR = 22 mΩ
Panasonic EEUFR1H331L
20.8 µF22 µF
ESR = 340 mΩ
Panasonic EEUFR1H220
Table 3. Semiconductor devices.
ComponentDescription
MosfetIRF540Z
Static Drain-to-Source On-Resistance R DS ( on ) = 26.5   m
DiodeMBR20100CT
Forward Voltage Drop V F = 0.8   V
Forward Slope Resistance   R on = 15.8   m
Table 4. Rules for the FLC.
SNBNSZOPSPB
ΔPPV
NBPBPSZONSNB
NSPBPSZONSNB
ZOPSPSZONSNS
PSPBPSZONSNB
PBPBPSZONSNB
Table 5. Electrical characteristics of the Kyocera KC85TS commercial PV panel [81].
ParametersValues
Maximum power current (IMPP)5.02 A
Maximum power voltage (VMPP)17.4 V
Maximum power (PMPP)87 W ± 10%
Short circuit current (ISC)5.34 A
Open circuit voltage (VOC)21.7 V
Temperature coefficient of ISC2.12 × 10−3 A/°C
Temperature coefficient of VOC−8.21 × 10⁻² V/°C
Max system voltage600 V
Publisher’s Note: MDPI stays neutral with regard to jurisdictional claims in published maps and institutional affiliations.

