

Design of a Hydrogen Production System Considering Energy Consumption, Water Consumption, CO2 Emissions and Cost


Division of Mechanical Science and Technology, Graduate School of Science and Technology, Gunma University, 29-1 Honcho, Ota 373-0057, Gunma, Japan
*
Author to whom correspondence should be addressed.
Energies 2022, 15(21), 7938; https://0-doi-org.brum.beds.ac.uk/10.3390/en15217938
Submission received: 30 September 2022
/
Revised: 18 October 2022
/
Accepted: 21 October 2022
/
Published: 26 October 2022
(This article belongs to the Special Issue Advances in Hydrogen Energy Ⅱ)
Abstract
:CO2 emissions associated with hydrogen production can be reduced replacing steam methane reforming with electrolysis using renewable electricity with a trade-off of increasing energy consumption, water consumption and cost. In this research, a linear programming optimization model of a hydrogen production system that considers simultaneously energy consumption, water consumption, CO2 emissions and cost on a cradle-to-gate basis was developed. The model was used to evaluate the impact of CO2 intensity on the optimum design of a hydrogen production system for Japan considering different stakeholders’ priorities. Hydrogen is produced using steam methane reforming and electrolysis. Electricity sources include grid, wind, solar photovoltaic, geothermal and hydro. Independent of the stakeholders’ priorities, steam methane reforming dominates hydrogen production for cradle-to-gate CO2 intensities larger than 9 kg CO2/kg H2, while electrolysis using renewable electricity dominates for lower cradle-to-gate CO2 intensities. Reducing the cradle-to-gate CO2 intensity increases energy consumption, water consumption and specific cost of hydrogen production. For a cradle-to-gate CO2 intensity of 0 kg CO2/kg H2, the specific cost of hydrogen production varies between 8.81 and 13.6 USD/kg H2; higher than the specific cost of hydrogen production targeted by the Japanese government in 2030 of 30 JPY/Nm3, 3.19 USD/kg H2.
1. Introduction
Hydrogen can contribute to achieving greenhouse gas (GHG) emissions and energy security goals in different sectors such as industry, buildings and transport [1], and it is expected to play an important role in the decarbonization of the energy system [2]. However, the development of the hydrogen supply chain is at an early stage in most countries in the world, with lack of infrastructure preventing large scale adoption of hydrogen in the energy system [3].
Global hydrogen demand totaled 75 Mt H2/year in 2019 [2]. Hydrogen was produced using steam methane reforming (SMR), electrolysis, hydrocarbon reforming and methane pyrolysis, with SMR accounting for the largest share of hydrogen production [4]. Dependence on fossil fuels lead to CO2 emissions of 830 Mt CO2/year associated with global hydrogen production [5]. Currently, hydrogen is predominantly used in the industry sector, mainly in oil refining, and in the production of fertilizers, polymers and resins [6], while applications as an energy carrier are still limited.
A nexus between energy, water and CO2 emissions, hereafter Water-Energy-Carbon (WEC) nexus, exists in hydrogen production due to the energy-intensive nature of the process, utilization of water as feedstock and CO2 emission when fossil fuels are used. As can be seen in Figure 1, energy consumption, water consumption and CO2 emissions associated with hydrogen production vary depending on the production route selected.
Water is consumed at different stages of hydrogen production: energy carrier production, feedstock production and hydrogen production process. Water access for hydrogen production has been identified as an issue in places facing water scarcity [5]. Furthermore, water access for hydrogen production is likely to become a more relevant problem in the future as hydrogen demand increases. Therefore, it is necessary to consider the WEC nexus in the design of the hydrogen supply chain.
The WEC nexus in energy systems and the hydrogen supply chain have been studied extensively in the existing literature. However, both topics have been addressed separately and no research was found considering the WEC nexus in the design of the hydrogen supply chain. The most relevant research regarding these topics are discussed below and the main characteristics are summarized in Table 1.
Conventionally, studies regarding the hydrogen supply chain focused on evaluating GHG emissions and cost, without considering water consumption. Furthermore, hydrogen production assessment on a cradle-to-gate (CTG) basis is not common, with most studies focusing on the production process only. De-León Almaraz et al. [15] used a multi-objective Mixed Integer Linear Programming (MILP) model that optimizes simultaneously cost, global warming potential and risk to design a hydrogen supply chain for France considering geographic information. Shibata [16] evaluated the economic viability of hydrogen production using surplus electricity as a grid integration measure for solar photovoltaic (PV) and wind electricity generation in Japan. Samsatli et al. [17] used a MILP optimization model to design an integrated wind-hydrogen-electricity network to provide hydrogen and electricity for road transportation in Great Britain, including the spatial distribution and temporal variability of energy demand and wind. Reuß et al. [18] designed a hydrogen supply chain with spatial resolution for Germany, considering energy use, CO2 emissions and cost. Caglayan et al. [19,28] used optimization models to design a hydrogen supply chain using renewable energy in the context of Europe, considering energy use, cost and weather variability. Weimann et al. [20] used a cost optimization MILP model to evaluate hydrogen production as electricity storage medium and commodity in an energy system with high penetration of wind and solar electricity for the Netherlands.
Other studies regarding hydrogen supply chains estimated water consumption associated with hydrogen production. However, these studies were not conducted on a CTG basis and they focused only on the hydrogen production process. Even though water consumption was accounted for, these studies did not include the WEC nexus in decision making regarding the configuration of the system. Suleman et al. [21] used life cycle assessment (LCA) to evaluate hydrogen production using SMR, wind electrolysis and solar PV electrolysis on a 1 kg-H2 basis accounting for water use during hydrogen production process without considering cost. Gabrielli et al. [22] used a MLIP model that simultaneously optimizes cost and CO2 emissions to design a hydrogen supply chain for Switzerland, considering water consumption as feedstock for hydrogen production. Hydrogen production routes included SMR, SMR with carbon capture and storage (CCS), biomass gasification and polymer electrolyte membrane electrolysis using grid electricity.
The Water-Energy nexus and the WEC nexus in energy systems have been studied extensively in the existing literature. However, no research was found regarding energy systems assessment considering the WEC nexus that included hydrogen production. Spang et al. [9] estimated water consumption for national energy portfolios including electricity and fuel production for 158 countries, considering fossil fuels, nuclear fuel and biofuels. Chen et al. [9] developed a two-region physical input-output model of the energy and water flows in a city and its hinterland and used it to study the water-energy nexus for Hong Kong and South China, considering electricity and fossil fuels. Larsen and Drews [24] used an ensemble of indicators to characterize water usage in different electricity generation technologies and used it to analyze water use for electricity production in European countries, considering spatio-temporal development. Nouri et al. [25] used a linear programming (LP) model to determine the optimum combination of electricity generation technologies that minimizes water consumption in electricity generation for California, considering renewable and non-renewable energy resources. Jin et al. [26] quantified water consumption and withdrawals for electricity generation and transmission in China, considering differences across regions and seasonal variability. Tovar-Facio et al. [27] optimized the mix of renewable electricity generation technologies for the Peninsular Electricity System in Spain using a multi-objective MILP model that considers technical constraints, energy resources availability, freshwater consumption, lifecycle GHG emissions and cost.
No research was found dealing with the WEC nexus and cost in decision making regarding the design of hydrogen production systems. This research aims to fill that gap by developing a LP optimization model that considers simultaneously energy consumption, water consumption, CO2 emissions and cost to optimize the configuration of a hydrogen production system on a CTG basis. From a conceptual point of view, this research expands the assessment of energy systems using the WEC nexus by considering hydrogen as an energy carrier additional to electricity.
The originality of this research consists in considering simultaneously energy consumption, water consumption, CO2 emissions and cost in the design of a hydrogen production system. The approach developed here can help the academia, policymakers and industries to design low-carbon or zero-emissions hydrogen production systems that are cost-effective and minimize pressure on water supply.
The objective of this research is to evaluate the impact of CO2 intensity on the optimum design of a hydrogen production system, considering energy consumption, water consumption, CO2 emissions and cost on a CTG basis. Japan was considered as a case of study. The rest of the paper is organized as follows: the mathematical formulation of the optimization model and the description of the scenarios are presented in Section 2, results are presented and discussed in Section 3, and conclusions are presented in Section 4.
2. Methods
2.1. Energy and Material Flows in Hydrogen Production
This research evaluates hydrogen production using a CTG approach that includes energy carrier production, feedstock production and hydrogen production process. This research is a first attempt to include the WEC nexus in the design of hydrogen supply chains, and it was limited to hydrogen production. Hydrogen transport distribution and storage are not considered. As shown in Figure 2, six hydrogen production routes are considered: (1) SMR using natural gas, (2) electrolysis using grid electricity, (3) electrolysis using wind electricity, (4) electrolysis using solar PV electricity, (5) electrolysis using geothermal electricity and (6) electrolysis using hydroelectricity. SMR consumes natural gas both as energy resource to produce heat and as feedstock in the hydrogen production process. In addition, SMR also uses electricity as energy carrier and water as feedstock. Electrolysis consumes water as the only feedstock and electricity as the only energy carrier. Electricity is produced using different energy resources. Centralized production is assumed for both SMR and electrolysis. Only proton exchange membrane (PEM) electrolysis was considered.
In addition to utilization as feedstock in SMR and electrolysis, water is also used for cooling and other purposes in electricity production, and for natural gas production and transport. In the case of water production, only water distribution losses are accounted for.
2.2. Optimization Model Formulation
The energy system was modeled using a static bottom-up LP optimization model developed using the software General Algebraic Modeling Systems (GAMS) [29] and solved using the solver CPLEX [30]. The model estimates the optimum share of each hydrogen production route in total hydrogen production. Calculations for hydrogen production share, energy consumption and feedstock consumption were performed on a one-year basis for a typical year of the service life of the hydrogen production technology because targets for hydrogen use on a national level are often set by several countries in terms of annual supply (e.g., Japan targets the supply of 300,000 t-H2/year by 2030 [31]). A brief description of the model formulation and initial results were presented in [32]. The complete formulation of the model is presented below.
2.2.1. Objective Function
As indicated by Equation (1), The objective function maximizes the overall score of the hydrogen production system in terms of energy consumption, water consumption, CO2 emissions and cost. In that way, the WEC nexus and cost can be considered simultaneously in the design of the hydrogen production system. Similar to Granovskii et al. [33], weighting coefficients were used to represent the importance that stakeholders assign to each category. The term stakeholder refers to all parties such as citizens, government and companies that are involved in the design of the hydrogen production system.
The four categories are combined in one single objective function using normalized indicators that evaluate how each hydrogen production route performs compared with the best performer in each category, similar to the methods developed by Acar and Dincer [34], as indicated in Equation (2).
The decision variables correspond to the share of each hydrogen production route in total hydrogen production on a one-year basis, as indicated in Equation (3):
where Z is the overall score of the hydrogen production system, j is the hydrogen production route, c is the category for evaluation, α is the share of each hydrogen production route in total hydrogen production, S is the score for each hydrogen production route, w is the weighting coefficient for each category, Maximum and Minimum correspond to the maximum and minimum values for each attribute within all the hydrogen production routes, Attribute is the parameter selected to evaluate the performance of the hydrogen production routes in each category, H2 is the hydrogen production for each route and Dmd is the annual hydrogen demand.
Specific energy consumption (i.e., energy consumed to produce 1 kg H2), specific water consumption (i.e., water consumed to produce 1 kg H2), specific CO2 emissions (i.e., CO2 emitted to produce 1 kg H2) and specific production cost (i.e., cost to produce 1 kg H2) were selected as attributes to evaluate the hydrogen production routes in terms of the energy consumption, water consumption CO2 emissions and cost, respectively.
2.2.2. Constraints
The objective function is solved under the following seven constraints:
- (1)
- The share of each hydrogen production route in total hydrogen production cannot be negative, Equation (4).
- (2)
- Total hydrogen production should be equal to annual hydrogen demand, Equation (5).
- (3)
- The total amount of water consumed cannot exceed the maximum amount of water available, Equation (6).
- (4)
- The total amount of natural gas consumed as feedstock and as energy carrier cannot exceed the maximum amount of natural gas available, Equation (7). The first two terms on the left side of Equation (7) are associated with natural gas use as energy carrier, accounting for production and utilization in the hydrogen production process, respectively. The third and fourth terms in Equation (7) are associated with natural gas use as feedstock, accounting for production and utilization in the hydrogen production process, respectively.
- (5)
- Total electricity consumption cannot exceed the maximum amount of electricity available for each energy resource, Equation (8).
- (6)
- Combinations of feedstocks, hydrogen production routes and energy carriers that are not viable were ruled out using Equations (11) and (12):
- (7)
- In order to determine the impact of constraints on CO2 emissions on the design of the hydrogen production system, a cap on the maximum CO2 intensity, defined as the CO2 emissions per 1 kg H2 produced, was set. This constraint was expressed in terms of the hydrogen demand rather than in terms of the total hydrogen production to make the model linear. The resulting constraint indicates that total CO2 emissions associated with hydrogen production cannot exceed maximum CO2 emissions allowed, as indicated in Equation (13):
2.2.3. Economic Evaluation
The economic evaluation of the hydrogen production system is performed using the specific cost of hydrogen production, Equation (14), defined as the cost of producing 1 kg H2. The specific cost of hydrogen production was selected because the targets for hydrogen use in the future in several countries are often set in terms of the hydrogen supply capacity and the cost of producing one unit of hydrogen. For example, the Japanese government targets the supply of 300,000 t-H2/year with a production cost of 30 JPY/Nm3-H2 (3.19 USD/kg H2) by 2030 [31]. The specific cost of hydrogen production includes feedstock cost, energy cost, operating and maintenance (O&M) cost and capital cost. The size of the hydrogen production system is expressed in terms of the installed capacity, Equation (15), corresponding to the amount of energy contained in the hydrogen produced over one year divided by the number of hours within one year that the hydrogen production technology can be operated.
where cH2 is the specific cost of hydrogen production, cfeed is feedstock price, cene is the energy carrier price, cOM is the specific O&M cost, ccap is the specific capital cost, CRF is the capital recovery factor, P is the installed capacity, HHV is the higher heating value and CF is the capacity factor.
For consistency, costs were also evaluated on a one-year time basis in the calculation of the specific cost of hydrogen production. Energy cost and feedstock cost correspond to the cost of energy and feedstock used in one year, respectively. O&M cost corresponds to the cost operation and maintenance for hydrogen production on a typical year of the hydrogen production technology service life. Capital cost was annualized throughout the service life of the hydrogen production technologies.
2.3. Scenarios for Hydrogen Production in Japan
Within the framework of GHG emissions reduction to mitigate climate change, Japan aims to transit from the current fossil fuel-based energy system to a hydrogen-based energy system, in a vision that is called ‘Hydrogen Society’. In the short term, Japan targets the development of a commercial-scale hydrogen supply chain with a capacity of 300,000 t-H2/year by 2030 [31]. Considering that many countries in the world face challenges with the initial development of the hydrogen supply chain in the short-term, this research focuses on the design of a hydrogen production system to achieve the hydrogen supply target set by the Japanese government in 2030.
A scenario-based approach was used to assess the impact of the maximum CO2 intensity on the optimum configuration of the hydrogen production system. Four scenarios that represent different stakeholder priorities regarding energy consumption, water consumption, CO2 emissions and cost in the design of the hydrogen production system were considered. The Low-Cost scenario minimizes cost in the design of the hydrogen production system, representing the business-as-usual situation, where economic performance is the priority. The Low Energy Use scenario minimizes energy consumption in the design of the hydrogen production system, prioritizing rational energy use. The Water-Energy-Carbon scenario minimizes simultaneously energy consumption, water consumption and CO2 emissions in the design of the hydrogen production system, aiming for the best environmental performance without considering the economic performance. The Water-Energy-Carbon-Cost scenario minimizes simultaneously energy consumption, water consumption, CO2 emissions and cost, balancing environmental and economic performance and representing the best solution in terms of sustainability. The values for the weighting coefficients for each scenario are presented in Table 2.
For a given set of stakeholder priorities, the maximum CO2 emissions allowed in the production of hydrogen will influence the configuration of the hydrogen production system. In this research, the optimum configuration of the hydrogen production system was estimated for maximum CO2 intensities varying between 0 and 18 kg CO2/kg H2 using steps of 1 kg CO2/kg H2. The upper boundary for the CO2 intensity interval evaluated was set based on preliminary calculations that showed no changes in the configuration of the hydrogen production system for CO2 intensities higher than 18 kg CO2/kg H2. Due to the utilization of grid electricity for transporting the water that is used in electrolysis, the minimum CO2 intensity possible for hydrogen production was estimated in 0.007 kg CO2/kg H2. This value corresponds to the minimum CO2 intensity that makes the model feasible.
2.4. Input Data
In the case of hydrogen production using renewable electricity, the reduction of energy imports and improvement of energy dependence can be obtained along with GHG emissions reduction. With that aim in mind, the hydrogen production system was designed considering only the domestic resources, both for energy and feedstock, except grid electricity that relies on imported energy resources. Japan does not possess abundant fossil fuel reserves. For instance, natural gas yearly availability was estimated in 2.29 Mt/year using data from [8,35]. In that sense, the existing fossil fuel reserves can be used in the short term as a first stage in the transition towards a Hydrogen Society, where hydrogen will be produced using renewable energy in the long-term. To avoid pressure on fresh water supply, maximum water availability was limited to 10% of water consumption in the industrial sector, approximately 1.11 billion m3/year based on data from [36]. Data for energy consumption factors and feedstock consumption factors for feedstock production are presented in Table 3.
Data for the maximum amount of energy carrier available are presented in Table 4, along with data for energy consumption factors for energy carrier production and water consumption factors for energy carrier production. Hydrogen production route characteristics are presented in Table 5.
All costs were estimated in 2017 USD. The average exchange rate for the Fiscal Year 2017 of 112.1 JPY/USD from the Bank of Japan [48] was used to convert values in JPY to USD. Prices of 0.203 USD/m3 H2O for water [49] and 0.437 USD/kg for natural gas [41] were utilized in the calculations. Values of 38.7, 52.0, 27.0 and 42.7 USD/GJ were used for the prices of wind electricity, solar PV electricity, geothermal electricity and hydroelectricity, based on data from the Ministry of Economy, Trade and Industry(METI) [47]. The electricity price for the industry of 35.7 USD/GJ [41] was utilized as the grid electricity price. Capital cost of SMR was estimated in 121 USD/kW using data from [50], while a value of 800 USD/kW was used for electrolysis [4]. Service lives of 25 and 10 years were assumed for SMR and electrolysis, respectively [51]. Capital costs were annualized throughout the service lives of the hydrogen production technologies using a discount rate of 10%, corresponding to the internal rate of return used in [4]. Operating and maintenance (O&M) costs were estimated in 0.2122 USD/kg H2 for SMR and 0.1506 USD/kg H2 for electrolysis using data from [50] and [51], respectively.
CO2 emission factor for natural gas production was assumed equal to 2.29 kg CO2/kg NG [8]. CO2 emission factor was estimated in 0.453 kg CO2/m3 H2O, assuming only grid electricity is consumed in water production. Grid electricity generation in Japan emits 142 g CO2/MJ [52], while renewable electricity generation does not emit CO2. Regarding the hydrogen production process, natural gas combustion to produce heat for SMR emits 57.0 g CO2/MJ, estimated from the stoichiometric reaction for methane and 5.70 kg CO2/kg H2 from the process chemistry [4]. In the case of electrolysis, CO2 emissions associated to energy use and process chemistry are both zero.
2.5. Main Assumptions and Limitations
All calculations were performed on an annual basis, using the Fiscal Year 2017 as the base year for the calculations. Similar to Larsen and Drews [24], water consumption for energy carrier production includes water evaporated and water transpired. Additionally, following the approach used by Spang et al. [9], water consumption was limited to ‘operational’ water consumption, excluding water embedded in equipment and materials used to fabricate energy conversion technologies, feedstock production technologies and hydrogen production technologies. Furthermore, water consumption factors for energy carrier production vary depending on the specific climatic conditions of the facilities [9]. However, estimates from the existing literature were used instead of values for Japan due to lack of data. Total water consumption was estimated without differentiating the type of water resource. Another limitation of this research is that water purification to meet water purity requirements for PEM electrolysis was not considered.
3. Results and Discussion
3.1. Hydrogen Production System Configuration
The optimum configuration of the hydrogen production system as function of the CTG CO2 intensity for hydrogen production in the four scenarios considered is presented in Figure 3. Since fossil fuels account for a significant share in grid electricity generation in Japan and electrolysis has a high specific energy consumption, electrolysis using grid electricity is not selected in any scenario. SMR is used for hydrogen production in all scenarios as much as the constraint on the CTG CO2 intensity allows, representing more than 59% hydrogen production share for CTG CO2 intensities larger than 9 kg CO2/kg H2 in all scenarios. SMR has a 100% share in hydrogen production for CTG CO2 intensities larger than 16 kg CO2/kg H2 in the Low-Cost, Low Energy Use and Water-Energy-Carbon-Cost scenarios. For CTG CO2 intensities lower than 16 kg CO2/kg H2, SMR share in hydrogen production decreases monotonously until reaching 0% for a CTG CO2 intensity of 0 kg CO2/kg H2. The hydrogen production routes used to replace SMR change in accord with the stakeholders’ priorities in each scenario.
In the Low-Cost scenario, SMR is replaced with electrolysis using geothermal electricity and electrolysis using hydroelectricity as the CTG CO2 intensity decreases, accounting for 23.7 and 76.3% of hydrogen production for a CTG CO2 intensity of 0 kg CO2/kg H2, respectively. Electrolysis using geothermal electricity is the cheapest option for hydrogen production at low CTG CO2 intensities due to its relatively high-capacity factor and the low electricity cost. Despite the price of hydroelectricity being relatively high, electrolysis using hydroelectricity is the second cheapest option due to the high-capacity factor of hydroelectricity compared with other types of renewable electricity. The use of other types of renewable electricity is unnecessary due to the high availability of hydroelectricity. In the Low Energy Use scenario, electrolysis using hydroelectricity replaces SMR for CTG CO2 intensities lower than 16 kg CO2/kg H2, since electrolysis using hydroelectricity has the lowest CTG specific energy consumption among all electrolysis types considered. As hydroelectricity is largely available, once the CTG CO2 intensity reaches 0 kg CO2/kg H2, all hydrogen is produced through electrolysis using hydroelectricity.
In the Water-Energy-Carbon scenario, electrolysis using wind electricity accounts for 37.6% of hydrogen production throughout the CTG CO2 intensity range evaluated. For CTG CO2 intensities equal or larger than 10 kg CO2/kg H2, SMR accounts for 62.4% of hydrogen production. For CTG CO2 intensities lower than 10 kg CO2/kg H2, SMR is replaced with electrolysis using solar PV electricity. When the CTG CO2 intensity becomes 0 kg CO2/kg H2, only electrolysis using wind electricity and solar PV electricity are used with electrolysis using solar PV electricity accounting for 62.4% of hydrogen production. In the Water-Energy-Carbon-Cost scenario, electrolysis using wind electricity is limited to CTG CO2 intensities lower than 16 kg CO2/kg H2. Due to the limited availability of wind electricity, electrolysis using geothermal electricity enters the hydrogen production mix for CTG CO2 intensities lower than 10 kg CO2/kg H2. However, as geothermal electricity availability is small, electrolysis using hydroelectricity becomes necessary for CTG CO2 intensities lower than 6 kg CO2/kg H2. For a CTG CO2 intensity of 0 kg CO2/kg H2, electrolysis using wind electricity, geothermal electricity and hydroelectricity account for 37.6, 23.7 and 38.7% of hydrogen production, respectively.
The size of the hydrogen production system is indicated by the installed capacity presented in Figure 4. Estimating the installed capacity required for the hydrogen production system is important as the large installed capacity requirement has been identified as a barrier that prevents hydrogen production on a large scale [53]. For a given hydrogen demand, the required installed capacity for each hydrogen production route depends on the capacity factor, which is determined by the capacity factor of the hydrogen production technology and the capacity factor of the energy conversion technology used for energy carrier production. Installed capacity increases as CTG CO2 intensity decreases in all scenarios since SMR is replaced with electrolysis using renewable electricity, which has lower capacity factors.
Installed capacity is the lowest in the Low-Cost scenario as prioritizing cost causes the penetration of electrolysis using geothermal electricity and electrolysis using hydroelectricity, which have the highest capacity factors among electrolysis using renewable electricity. For CTG CO2 intensities between 16 and 18 kg CO2/kg H2, installed capacity remains constant at 1.50 GW. Installed capacity increases between 1.50 and 2.39 GW for CTG CO2 intensities between 15 and 0 kg CO2/kg H2 as electrolysis using geothermal electricity and electrolysis using hydroelectricity are utilized. Installed capacity in the Low Energy Use scenario is identical to the Low-Cost scenario for CTG CO2 intensities between 18 and 16 kg CO2/kg H2. As electrolysis using hydroelectricity replaces SMR, installed capacity increases from 1.50 to 2.59 GW when CTG CO2 intensity decreases from 15 to 0 kg CO2/kg H2.
Including water consumption and CO2 emissions in the priorities increases installed capacity for CTG CO2 intensities lower than 15 kg CO2/kg H2. In the Water-Energy-Carbon scenario, installed capacity remains constant at 3.55 GW for CTG CO2 intensities between 18 to 10 kg CO2/kg H2. As electrolysis using solar PV electricity penetrates in hydrogen production, installed capacity increases from 3.85 to 9.85 GW when the CTG CO2 intensity decreases from 9 to 0 kg CO2/kg H2. In the Water-Energy-Carbon-Cost scenario installed capacity is lower than in the Water-Energy-Carbon scenario for all CTG CO2 intensities evaluated. Installed capacity is identical to the Low-Cost scenario for CTG CO2 intensities between 18 and 16 kg CO2/kg H2. As the CTG CO2 intensity decreases from 15 to 0 kg CO2/kg H2, installed capacity increases from 1.55 to 4.03 GW, due to the shift from SMR to electrolysis using wind electricity, geothermal electricity and hydroelectricity.
The Water-Energy-Carbon scenario requires the largest installed capacity among all scenarios, since electrolysis using wind electricity and solar PV electricity are selected. In that sense, low capacity factors of solar PV and wind electricity are an obstacle to reduce the installed capacity of the hydrogen production system. Even in the Low-Cost scenario, constructing the hydrogen production plants required to satisfy the demand of 300,000 t-H2/year is a challenging task, which gets more complicated if a CTG CO2 intensity of 0 kg CO2/kg H2 is targeted. Installed capacity for hydrogen production for a CTG CO2 intensity of 0 kg CO2/kg H2 varies between 2.39 and 9.85 GW in the four scenarios considered. These values are higher than the global expected installed capacity for electrolyzers in 2021, estimated in 730 MW by the International Energy Agency (IEA) [54]; and are in the same order of magnitude of the combined installed capacity of 5.2 GW for planned green hydrogen projects in Europe [55].
3.2. Energy Consumption
CTG energy consumption is presented in Figure 5. CTG energy consumption increases as CTG CO2 intensity decreases in all scenarios, since SMR is replaced by electrolysis, which has larger specific energy consumption for the hydrogen production process. Additionally, electricity generation consumes more energy than natural gas production, increasing energy consumption for energy resource production. Differences across scenarios using electrolysis are explained by the energy consumption associated with electricity generation.
In the Low-Cost scenario, CTG energy consumption remains constant at 18.3 PJ/year for CTG CO2 intensities between 16 and 18 kg CO2/kg H2, with energy production, feedstock production and hydrogen production process representing 10.2, 10.5 and 79.3% of CTG energy consumption, respectively. Electrolysis use increases energy consumption in energy resource production and hydrogen process while reducing energy consumption in feedstock production. Energy resource production share in CTG energy consumption goes from 25.6 to 66.2% when the CTG CO2 intensity decreases from 15 to 0 kg CO2/kg H2. At the same time, hydrogen production process share in CTG energy consumption goes from 66.0 to 33.8%, while feedstock production share in CTG energy consumption decreases from 8.4% to almost 0%. CTG energy consumption reaches 174 PJ/year for a CTG CO2 intensity of 0 kg CO2/kg H2.
The Low Energy Use scenario has the lowest CTG energy consumption for hydrogen production among all scenarios. CTG energy consumption in the Low Energy Use scenario is identical to the Low-Cost scenario for CTG CO2 intensities between 16 and 18 kg CO2/kg H2. CTG energy consumption increases from 18.8 to 75.9 PJ/year as the CTG CO2 intensity decreases from 15 to 0 kg CO2/kg H2. Hydrogen production process represents more than 77% of CTG energy consumption throughout the CTG CO2 intensity range evaluated. As the CTG CO2 intensity decreases from 15 to 0 kg CO2/kg H2, energy resource production share in CTG energy consumption increases from 10.6 to 22.7%; while feedstock production share goes from 10.1% to almost 0%.
The Water-Energy-Carbon scenario has the largest values for CTG energy consumption among all scenarios. CTG energy consumption remains constant at 74.5 PJ/year for CTG CO2 intensities between 18 and 10 kg CO2/kg H2, with energy resource production, feedstock production and hydrogen production process accounting for 56.6, 1.6 and 41.8% of CTG energy consumption. CTG energy consumption increases from 86.0 to 321 PJ/year as the CTG CO2 intensity decreases from 9 to 0 kg CO2/kg H2. Energy resource production share in CTG energy consumption increases from 61.0 to 81.7%; while hydrogen production process shares decrease from 37.7% to 18.3%. Feedstock production share in CTG energy consumption decreases from 1.3% to almost 0%.
CTG energy consumption in the Water-Energy-Carbon-Cost scenario is lower than in the Water-Energy-Carbon scenario throughout the CTG CO2 intensity range evaluated, except between 9 and 6 kg CO2/kg H2 due to the utilization of electrolysis using geothermal electricity. CTG energy consumption in the Water-Energy-Carbon-Cost scenario is identical to the Low-Cost scenario for CTG CO2 intensities between 16 and 18 kg CO2/kg H2. CTG energy consumption increases from 19.7 PJ/year for a CTG CO2 intensity of 15 kg CO2/kg H2 to 208 PJ/year for 0 kg CO2/kg H2. The later value is 19.9% larger than the CTG energy consumption for the Low-Cost scenario and 35.1% lower than the value for the Water-Energy-Carbon scenario. Energy resource production share in CTG energy consumption increases from 14.4 to 71.8% as the CTG CO2 intensity decreases from 15 to 0 kg CO2/kg H2 in the Water-Energy-Carbon-Cost scenario. At the same time, hydrogen production process shares decrease from 75.9 to 28.2%, while feedstock production share decreases from 9.7% to almost 0%.
3.3. Water Consumption
CTG water consumption is presented in Figure 6. CTG water consumption increases as the CTG CO2 intensity decreases in all scenarios, since SMR is replaced with electrolysis, which has larger specific water consumption for the hydrogen production process. CTG water consumption experiences the largest increase for the Low Energy Use and the Low-Cost scenarios, where electrolysis using hydroelectricity accounts for the largest share of hydrogen production for CTG CO2 intensities lower than 5 kg CO2/kg H2.
In the Low-Cost scenario CTG water consumption for hydrogen production remains constant for CTG CO2 intensities between 18 and 16 kg CO2/kg H2 at 3.50 million m3/year. Shift from SMR to electrolysis using geothermal electricity and electrolysis using hydroelectricity due to stricter CTG CO2 intensity constraints causes the increase in CTG water consumption for hydrogen production from 3.78 to 219 million m3/year when the CTG CO2 intensity decreases from 15 to 0 kg CO2/kg H2. The structure of water consumption is also affected by changes in CTG CO2 intensity. Hydrogen production process accounts for the largest share of CTG water consumption for CTG CO2 intensities between 18 and 14 kg CO2/kg H2. Energy resource production accounts for the largest share in CTG water consumption for lower CTG CO2 intensities, increasing from 57.0 to 97.7% when the CTG CO2 intensity decreases from 13 to 0 kg CO2/kg H2.
CTG water consumption for hydrogen production in the Low Energy Use scenario is identical to the Low-Cost scenario for CTG CO2 intensities between 18 and 16 kg CO2/kg H2, 3.50 million m3/year. CTG water consumption increases from 6.00 to 276 million m3/year as the CTG CO2 intensity decreases from 15 to 0 kg CO2/kg H2. Similar to the Low-Cost scenario, water consumption structure is affected by changes in the CTG CO2 intensity, with hydrogen production process accounting for the largest share of CTG water consumption for hydrogen production for CTG CO2 intensities larger than 15 kg CO2/kg H2 and energy resource production consuming the largest share for lower CTG CO2 intensities. Energy resource production accounts for 98.2% of CTG water consumption for hydrogen production when the CTG CO2 intensity becomes 0 kg CO2/kg H2.
For CTG CO2 intensities between 10 and 18 kg CO2/kg H2, CTG water consumption in the Water-Energy-Carbon scenario remains constant at 4.06 million m3/year. CTG water consumption increases from 4.12 to 5.22 million m3/year when the CTG CO2 intensity is reduced from 9 to 0 kg CO2/kg H2. Hydrogen production process, energy resource production and feedstock production represent 85.0, 6.8 and 8.2% of CTG water consumption for CTG CO2 intensities between 18 and 10 kg CO2/kg H2. As the CTG CO2 intensity decreases to 0 kg CO2/kg H2, hydrogen production process, energy resource production and feedstock production shares in CTG water consumption reach 89.3, 4.2 and 6.5%, respectively.
CTG water consumption in the Water-Energy-Carbon-Cost scenario is identical to the Low-Cost scenario for CTG CO2 intensities between 18 and 16 kg CO2/kg H2. Penetration of electrolysis using wind electricity in the hydrogen production mix increases CTG water consumption from 3.51 to 4.01 million m3/year as the CTG CO2 intensity decreases from 15 to 10 kg CO2/kg H2. Further reductions in the CTG CO2 intensity drive the penetration of electrolysis using geothermal electricity, increasing the CTG water consumption from 4.94 to 10.9 million m3/year as the CTG CO2 intensity decreases from 9 to 6 kg CO2/kg H2. For lower CTG CO2 intensities, electrolysis using hydroelectricity is used, increasing CTG water consumption from 26.7 to 117 million m3/year when the CTG CO2 intensity decreases from 5 to 0 kg CO2/kg H2. Hydrogen production process accounts for the largest share of CTG water consumption for CTG CO2 intensities between 18 and 8 kg CO2/kg H2, while energy production represents the largest share for lower CTG CO2 intensities. Water-Energy-Carbon-Cost scenario consumes less than half of the water consumed in the Low Energy Use scenario and 53.3% of the water consumed in the Low-Cost scenario for a CTG CO2 intensity of 0 kg CO2/kg H2.
Final energy consumption in Japan during 2017 totaled 13.4 EJ/year [35]. In contrast, the 300,000 t-H2/year hydrogen production target corresponds to 36 PJ/year, representing 0.27% of final energy consumption. Total water consumption in Japan during 2017 accounted for 79.3 billion m3/year [36]. For a CTG CO2 intensity of 0 kg CO2/kg H2, CTG water consumption for hydrogen production in the Low-Cost scenario reaches 219 million m3/year, 0.28% of national water consumption. Therefore, supplying 0.27% of national energy consumption with hydrogen requires 0.28% of national water consumption if cost were to be prioritized. Prioritizing simultaneously energy consumption, water consumption, CO2 emissions and cost can reduce this value to almost half, 117 million m3/year, corresponding to 0.15% of national water consumption. Water consumption for hydrogen production is small for the 2030 hydrogen production target. However, water consumption for hydrogen production will become more relevant in the future due to the increase in hydrogen demand. For instance, the 2050 hydrogen production target of the Hydrogen Society ranges between 5 and 10 Million t-H2/year [31], between 16.7 to 33.3 times the hydrogen demand considered in this research.
3.4. Hydrogen Production Cost
Specific cost of hydrogen production is presented in Figure 7. Reducing the CTG CO2 intensity increases the specific cost of hydrogen production and changes the cost structure in all scenarios. The lowest values for the specific cost of hydrogen production are obtained in the Low-Cost scenario. Specific cost of hydrogen production remains constant at 1.60 USD/kg H2 for CTG CO2 intensities between 18 and 16 kg CO2/kg H2, since only SMR is used. Penetration of electrolysis using geothermal electricity and electrolysis using hydroelectricity increases the specific cost of hydrogen production from 1.64 to 8.82 USD/kg H2 as the CTG CO2 intensity decreases from 15 to 0 kg CO2/kg H2. For CTG CO2 intensities between 18 and 16 kg CO2/kg H2, feedstock cost and energy cost account for the largest share of the specific cost of hydrogen production, 54.9 and 27.6%, while O&M and capital cost account for 13.3 and 4.2%, respectively. As the CTG CO2 intensity decreases, energy cost and capital cost become the largest components of the specific cost of hydrogen production, 86.5 and 11.8% for a CTG CO2 intensity of 0 kg CO2/kg H2, while O&M cost share decreases to 1.7% and feedstock cost share becomes negligible.
In the Low Energy Use scenario, specific cost of hydrogen production is identical to the Low-Cost scenario for CTG CO2 intensities between 16 and 18 kg CO2/kg H2. Compared with the Low-Cost scenario, the Low Energy Use scenario has higher values for the specific cost of hydrogen production for CTG CO2 intensities between 15 and 0 kg CO2/kg H2 since electrolysis using geothermal electricity is replaced with electrolysis using hydroelectricity, which has a lower capacity factor and higher electricity price. Specific cost of hydrogen production increases from 1.67 to 9.63 USD/kg H2 when the CTG CO2 intensity decreases from 15 to 0 kg CO2/kg H2. Energy cost, O&M cost and capital cost account for 86.7, 1.6 and 11.7% of the specific cost of hydrogen production for a CTG CO2 intensity of 0 kg CO2/kg H2, while feedstock cost share becomes negligible.
The Water-Energy-Carbon scenario exhibits the highest values for the specific cost of hydrogen production among all scenarios. Specific cost of hydrogen production remains constant at 5.03 USD/kg H2 for CTG CO2 intensities between 18 and 10 kg CO2/kg H2, distributed as 10.9% feedstock cost, 62.0% energy cost, 3.8% O&M cost and 23.4% capital cost. Penetration of electrolysis using solar PV electricity increases the specific cost of hydrogen production up to 13.6 USD/kg H2 when the CTG CO2 intensity becomes 0 kg CO2/kg H2. Energy cost, O&M cost and capital cost account for 67.5, 1.1 and 31.4% of specific cost of hydrogen production, while feedstock cost becomes negligible.
Specific cost of hydrogen production in the Water-Energy-Carbon-Cost scenario is identical to the Low-Cost scenario and Low Energy Use scenario for CTG CO2 intensities between 18 and 16 kg CO2/kg H2. As electrolysis using wind electricity, geothermal electricity and hydroelectricity replace SMR in hydrogen production due to stricter CTG CO2 intensity constraints, the specific cost of hydrogen production increases, reaching 9.23 USD/kg H2 when the CTG CO2 intensity becomes 0 kg CO2/kg H2. The specific cost of hydrogen production in the Water-Energy-Carbon-Cost scenario becomes lower than in the Low Energy Use scenario for CTG CO2 intensities lower than 8 kg CO2/kg H2. For a CTG CO2 intensity of 0 kg CO2/kg H2, the specific cost of hydrogen production is only 4.7% larger in the Water-Energy-Carbon-Cost scenario than in the Low-Cost scenario. The cost structure is changed as the CTG CO2 intensities become smaller, with energy cost and capital cost becoming the main components of the specific cost of hydrogen production for a CTG CO2 intensity of 0 kg CO2/kg H2, 79.4 and 19.0%, respectively. O&M cost represent 1.6% of the hydrogen production cost and feedstock cost becomes negligible.
3.5. Implications for Policymaking
Between October 2020 and May 2021, the Japanese government announced three policies aiming to reduce GHG emissions in the energy system: (1) reducing GHG emissions in Japan to net zero by 2050 [56], (2) banning gasoline-fueled car sales by mid 2030s [57], and (3) reducing GHG emissions by 46% compared with the 2013 level by 2030 [58]. In the context of these three new policies, production of low-carbon hydrogen became more important for energy supply and energy security.
However, the development of the infrastructure required for the hydrogen production system is a challenging task. Despite the large installed capacity required, hydrogen demand targeted by 2030 represents less than 1% of current national energy consumption. From the technical point of view, all configurations for the hydrogen production system design presented in the four scenarios are feasible. However, from the economic point of view, feasibility depends on how much stakeholders are willing or forced to pay to reduce the CO2 emissions in hydrogen production.
For a given constraint in the CO2 intensity for hydrogen production on a CTG basis, the Water-Energy-Carbon-Cost scenario offers the most sustainable configuration of the hydrogen production system, balancing low CO2 emissions with moderate increases in specific cost of hydrogen production and water consumption. The two main renewable energy sources for electricity production in this scenario are geothermal electricity and wind electricity. However, they both run out before hydrogen demand has been satisfied for a CTG CO2 intensity of 0 kg CO2/kg H2, requiring the use of hydroelectricity. It is recommended to couple the promotion of hydrogen supply chain development with increasing the electricity generation capacity for wind and geothermal electricity. Electrolysis using solar PV electricity is not selected in this scenario due to its high cost, caused by the high price of solar PV electricity and the low capacity factor. Reducing the price for solar PV electricity and increasing the capacity factor can contribute to a larger penetration of electrolysis using solar PV electricity in the hydrogen production system. Electrolysis using solar PV electricity is desirable in low-carbon hydrogen production from the point of view of water use since it has the lowest specific water consumption for hydrogen production.
In the Basic Hydrogen Strategy, the Japanese government targets a hydrogen production cost of 30 JPY/Nm3 H2 by 2030 [31], corresponding to 3.19 USD/kg H2. This target is possible only in the Low-Cost scenario for CTG CO2 intensities higher than 11 kg CO2/kg H2, or in the Low Energy scenario and the Water-Energy-Carbon-Cost scenario for CTG CO2 intensities higher than 13 kg CO2/kg H2. The Japanese hydrogen production cost target is not possible in the Water-Energy-Carbon scenario as the minimum cost of hydrogen production is 5.03 USD/kg H2. In that sense, it is necessary to develop policies that can bring down the cost of hydrogen production for electrolysis using renewable electricity. It was found that energy cost share in the specific cost of hydrogen production increases in all scenarios as CTG CO2 intensity decreases, accounting for more than 67.5% for a CTG CO2 intensity of 0 kg CO2/kg H2. Therefore, it is important to reduce the cost of renewable electricity to promote the adoption of low-carbon hydrogen.
The approach developed in this research to find the optimum design of a hydrogen production system can be expanded to other components of the hydrogen supply chain for Japan. Additionally, this approach can be used to design and evaluate hydrogen supply chains for other countries. Since the potential for renewable electricity generation for different energy resources and the availability of water are determined by the local conditions of each country, the optimum configuration of the hydrogen production system will change. However, the approach developed here allows policymakers to design more sustainable hydrogen supply chains that can reduce CO2 emissions without increasing the pressure on water supply. This is particularly important in countries/regions facing water scarcity problems with growing energy demands.
Recently, in the midst of the COVID-19 pandemic crisis, the discussion about the role of hydrogen in future energy systems has gained more attention. In a post-pandemic world, several governments are implementing packages for economic recovery; (1) providing an opportunity to promote clean energy transitions by supporting the deployment of batteries and hydrogen-producing electrolyzers to complement energy efficiency improvement and renewable energy deployment [54]. (2) Supporting hydrogen demand in different sectors of the economy can boost the benefits from supporting low-carbon hydrogen production technologies. For instance, in the European Union, the use of post-pandemic economic recovery plans to support hydrogen infrastructure and hydrogen use in different areas of the economy is gaining support from policymakers, investors and industries as strategy to reduce hydrogen cost and promote hydrogen use [55].
3.6. Sensitivity Analysis
With the aim of assessing the robustness of the model, the sensitivity of the results to variations in the most relevant parameters was evaluated. Parameters selected for the sensitivity analysis were capital cost of electrolysis, wind electricity price, geothermal electricity price, hydroelectricity price, wind electricity capacity factor, geothermal electricity capacity factor, hydroelectricity capacity factor, geothermal electricity water consumption factor, water price, electrolysis discount rate, electrolysis service life and electricity specific energy consumption. The sensitivity analysis was performed only for the Water-Energy-Carbon-Cost scenario under a CTG CO2 intensity of 0 kg CO2/kg H2, which provides the most sustainable option for the hydrogen production system design. Additionally, ±20% variations were considered for the selected parameters compared with the values used in the Water-Energy-Carbon-Cost scenario.
Results of the sensitivity analysis for hydrogen production, installed capacity and specific cost of hydrogen production are presented in Figure 8. Specific energy consumption for electrolysis is the only parameter that affects the structure of the hydrogen production system. Electrolysis using wind electricity, geothermal electricity and hydroelectricity account for 37.6, 23.7 and 38.7% of hydrogen production for the Water-Energy-Carbon-Cost scenario. A 20% increase in the specific energy consumption for electrolysis increases the share of electrolysis using hydroelectricity in hydrogen production to 48.9%, while reducing the share of electrolysis using wind electricity to 31.4% and geothermal electricity to 19.7%. In contrast, a 20% decrease in the specific energy consumption for electrolysis reduces the share of electrolysis using hydroelectricity in hydrogen production to 23.4%, while increasing the share of electrolysis using wind electricity to 47.0% and geothermal electricity to 29.6%.
Installed capacity is affected the most by the capacity factor for electrolysis using wind electricity, with ±20% variations in the capacity factor for electrolysis using wind electricity causing changes of −10.8 and +16.2% in installed capacity, respectively. The second parameter is the specific energy consumption for electrolysis, causing changes of −5.9 and 8.9% in installed capacity, respectively. Variations in the capacity factor for electrolysis using hydroelectricity and geothermal electricity cause smaller variations in installed capacity, while other parameters do not affect the installed capacity required for the hydrogen production system.
The specific cost of hydrogen production is more sensitive to variations in the considered parameters than hydrogen production and installed capacity, with the specific energy consumption of electrolysis having the largest impact. Additionally, ±20% variations in the specific energy consumption of electrolysis cause changes of −17.0 and 16.4% in the specific cost of hydrogen production, followed by the price of hydroelectricity that causes variations of ±7.0% in the specific cost of hydrogen production. Similarly, ±20% variations in the price of wind electricity cause ±6.2% changes in the specific cost of hydrogen production. The effect of the other parameters on the specific cost of hydrogen production is smaller.
4. Conclusions
Replacing SMR with electrolysis using renewable electricity is an alternative to produce low-carbon hydrogen. However, there is a trade-off between CO2 emissions reduction and energy consumption, water consumption and cost. A static bottom-up linear programming optimization model of the hydrogen production system that simultaneously considers energy consumption, water consumption, CO2 emissions and cost was developed to study the impact of CO2 intensity on the optimum design of a hydrogen production system, considering Japan as a case of study. Main conclusions are presented below:
- SMR accounts for more than 59% of hydrogen production for CTG CO2 intensities larger than 9 kg CO2/kg H2 in all scenarios, while electrolysis using renewable electricity dominates hydrogen production for lower CTG CO2 intensities. Electricity sources vary depending on the stakeholders’ priorities, selecting geothermal and hydro if cost is prioritized, hydro if energy consumption is prioritized, wind and solar PV if the energy consumption, water consumption and CO2 emissions are prioritized, and wind, geothermal and hydro if energy consumption, water consumption, CO2 emissions and cost are prioritized.
- Installed capacity increases as CTG CO2 intensity increases in all scenarios. The lowest value is obtained for a CTG CO2 intensity of 18 kg CO2/kg H2, 1.50 GW for the Low-Cost, Low Energy Use and Water-Energy-Carbon-Cost scenarios. Installed capacity increases to values between 2.39 and 9.85 GW for a CTG CO2 intensity of 0 kg CO2/kg H2, reaching a value of 4.03 GW when energy consumption, water consumption, CO2 emissions and cost are prioritized simultaneously. Installed capacity for electrolysis in all scenarios for a CTG CO2 intensity of 0 kg CO2/kg H2 are larger than the global expected installed capacity for electrolyzers is 2021, showing the magnitude of the effort required to build the infrastructure for hydrogen production needed in the Hydrogen Society.
- The lowest CTG energy consumption is obtained for a CTG CO2 intensity of 18 kg CO2/kg H2, 18.3 PJ/year in the Low-Cost, Low Energy Use and Water-Energy-Carbon-Cost scenarios. CTG energy consumption increases as CTG CO2 intensity decreases. For a CTG CO2 intensity of 0 kg CO2/kg H2, CTG energy consumption varies between 75.9 and 321 PJ/year, reaching 208 PJ/year when energy consumption, water consumption, CO2 emissions and cost are prioritized simultaneously. Energy resource production represents the largest share in CTG energy consumption in all scenarios for a CTG CO2 intensity of 0 kg CO2/kg H2, excepting the Low Energy Use scenario, where hydrogen production process accounts for the largest share.
- The lowest CTG water consumption is obtained for a CTG CO2 intensity of 18 kg CO2/kg H2, 3.50 million m3/year in the Low-Cost, Low Energy Use and Water-Energy-Carbon-Cost scenarios. CTG water consumption for hydrogen production increases as the cradle-to-gate CO2 intensity decreases in all scenarios, reaching values between 5.21 and 276 million m3/year for a CTG CO2 intensity of 0 kg CO2/kg H2. Prioritizing simultaneously energy consumption, water consumption, CO2 emissions and cost leads to a CTG water consumption of 117 million m3/year, corresponding to 0.15% of national water consumption in Japan. Water consumption for hydrogen production will become more relevant in the future as hydrogen demand is expected to range between 5 and 10 million t-H2/year by 2050, compared with the 300,000 t-H2/year considered for 2030.
- The smallest specific cost of hydrogen production is achieved for a CTG CO2 intensity of 18 kg CO2/kg H2, 1.59 USD/kg H2 in the Low-Cost, Low Energy Use and Water-Energy-Carbon-Cost scenarios. Specific cost of hydrogen production increases as the CTG CO2 intensity decreases. For a CTG CO2 intensity of 0 kg CO2/kg H2, the specific cost of hydrogen production varies between 8.81 and 13.6 USD/kg H2, becoming 9.23 USD/kg H2 if energy consumption, water consumption, CO2 emissions and cost are prioritized simultaneously. The 2030 specific hydrogen production cost target of 30 JPY/Nm3, 3.19 USD/kg H2, is not possible for hydrogen production under a CTG CO2 intensity of 0 kg CO2/kg H2 in any scenario.
- For a given constraint in the CO2 intensity for hydrogen production on a CTG basis, the Water-Energy-Carbon-Cost scenario offers the most sustainable configuration of the hydrogen production system, balancing low CO2 emissions with moderate increases in specific cost of hydrogen production and water consumption. This approach allows policymakers to tackle the reduction of CO2 emissions in the energy system without increasing the pressure on water supply.
Author Contributions
The contribution of the authors to this article is as follows: conceptualization, J.C.G.P. and Y.I.; methodology, J.C.G.P., Y.I. and M.A.; software, J.C.G.P. and Y.I.; validation, J.C.G.P. and M.A.; formal analysis, J.C.G.P., Y.I. and M.A.; investigation, J.C.G.P., Y.I. and M.A.; resources, J.C.G.P. and M.A.; data curation, J.C.G.P. and Y.I.; writing—original draft preparation, J.C.G.P.; writing—review and editing, M.A.; visualization, J.C.G.P. and Y.I.; supervision, M.A.; project administration, J.C.G.P.; funding acquisition, J.C.G.P. and M.A. All authors have read and agreed to the published version of the manuscript.
Funding
This research was funded by the Association for the Advancement of Science & Technology, Gunma University and the Yoshio and Nobuko Yamamoto Memorial Trust Fund.
Data Availability Statement
All data utilized are referenced in the article.
Acknowledgments
The authors appreciate the comments and suggestions made by the reviewers.
Conflicts of Interest
The authors declare no conflict of interest.
Nomenclature
| α | Share of each hydrogen production route in total hydrogen production |
| Attribute | Parameter selected to evaluate the performance of the hydrogen production routes |
| c | category for evaluation |
| ccap | Specific capital cost |
| CCS | Carbon Capture and Storage |
| cene | Energy carrier price |
| CF | Capacity factor |
| cfeed | Feedstock price |
| cH2 | Specific cost of hydrogen production |
| cOM | Specific operating and maintenance cost |
| CRF | Capital recovery factor |
| CTG | Cradle-to-gate |
| Dmd | Annual hydrogen demand |
| E | Energy consumption |
| ECFE | Energy consumption factor for energy production |
| ECFF | Energy consumption factor for feedstock production |
| Enemax | Maximum amount of energy carrier available |
| eNG | Natural gas used as energy carrier |
| EFenep | CO2 emission factor for energy carrier production |
| EFeneu | CO2 emission factor for energy carrier use |
| EFfeedp | CO2 emission factor for feedstock production |
| EFprocess | CO2 emission factor of the chemical process for hydrogen production |
| Feedmax | Maximum amount of feedstock available |
| fNG | Natural gas used as feedstock |
| GAMS | General Algebraic Modeling System |
| GHG | Greenhouse gas |
| H2 | Hydrogen production for each route |
| HHV | Higher heating value |
| i | Feedstock |
| IEA | International Energy Agency |
| j | Hydrogen production route |
| k | Energy resource |
| LCA | Life Cycle Assessment |
| LP | Linear Programming |
| m | Feedstock consumption |
| Maximum | Maximum value for each attribute |
| METI | Ministry of Economy, Trade and Industry |
| Minimum | Minimum value for each attribute |
| MLIP | Mixed Integer Linear Programming |
| NCFE | Natural gas consumption factor for energy production |
| NCFF | Natural gas consumption factor for feedstock production |
| NG | Natural gas |
| O&M | Operating and maintenance |
| P | Installed capacity |
| PV | Photovoltaic |
| S | Score for each hydrogen production route |
| SEC | Specific energy consumption |
| SMR | Steam Methane Reforming |
| w | Weighting coefficient for each category |
| WCFE | Water consumption factor for energy production. |
| WCFF | Water consumption factor for feedstock production |
| WEC | Water-Energy-Carbon |
| Yield | Hydrogen production yield |
| Z | Overall score of the hydrogen production system |
References
- IEA/OECD. Technology Roadmap: Hydrogen and Fuel Cells; International Energy Agency and Organization for Economic Cooperation and Development: Paris, France, 2015. [Google Scholar]
- IEA/OECD. Energy Technology Perspectives 2020; International Energy Agency and Organization for Economic Cooperation and Development: Paris, France, 2020. [Google Scholar]
- Staffell, I.; Scamman, D.; Velazquez Abad, A.; Balcombe, P.; Dodds, P.E.; Ekins, P.; Shah, N.; Ward, K.R. The role of hydrogen and fuel cells in the global energy system. Energy Environ. Sci. 2019, 12, 463–491. [Google Scholar] [CrossRef] [Green Version]
- Parkinson, B.; Tabatabaei, M.; Upham, D.C.; Ballinger, B.; Greig, C.; Smart, S.; McFarland, E. Hydrogen production using methane: Techno-economics of decarbonizing fuels and chemicals. Int. J. Hydrogen Energy 2018, 43, 2540–2555. [Google Scholar] [CrossRef]
- IEA/OECD. The Future of Hydrogen; Seizing Today’s Opportunities; International Energy Agency and Organization for Economic Cooperation and Development: Paris, France, 2019; Available online: https://www.iea.org/reports/the-future-of-hydrogen (accessed on 20 May 2021).
- IRENA. Hydrogen from Renewable Power: Technology Outlook for the Energy Transition; International Renewable Energy Agency: Paris, France, 2018; Available online: https://www.irena.org/publications/2018/Sep/Hydrogen-from-renewable-power (accessed on 28 April 2021).
- Jaber, O.; Naterer, G.F.; Dincer, I. Natural gas usage as a heat source for integrated SMR and thermochemical hydrogen production technologies. Int. J. Hydrogen Energy 2010, 35, 8569–8579. [Google Scholar] [CrossRef]
- Ruth, M.; Laffen, M.; Timbario, T.A. Hydrogen Pathways: Cost, Well-to-Wheels Energy Use, and Emissions for the Current Technology Status of Seven Hydrogen Production, DElivery and Distribution Scenarios; National Renewable Energy Laboratory. 2009. Available online: https://www.nrel.gov/docs/fy10osti/46612.pdf (accessed on 1 August 2022).
- Spang, E.S.; Moomaw, W.R.; Gallagher, K.S.; Kirshen, P.H.; Marks, D.H. The water consumption of energy production: An international comparison. Environ. Res. Lett. 2014, 9, 15. [Google Scholar] [CrossRef]
- METI. Japan’s Energy 2018; 10 Questions for Understanding the Current Energy Situation; Ministry of Economy, Trade and Industry: Japan, 2019; Available online: https://www.enecho.meti.go.jp/en/category/brochures/pdf/japan_energy_2018.pdf (accessed on 10 August 2022).
- NEDO. Chapter 2 Solar Power Generation. In NEDO Renewable Energy Technology White Paper; New Energy and Industrial Technology Development Organization: Japan, 2013; p. 85. Available online: https://www.nedo.go.jp/content/100544817.pdf (accessed on 5 August 2022). (In Japanese)
- NEDO. Chapter 3 Wind Power Generation. In NEDO Renewable Energy Technology White Paper; New Energy and Industrial Technology Development Organization: Japan, 2013; p. 82. Available online: https://www.nedo.go.jp/content/100544818.pdf (accessed on 3 August 2022). (In Japanese)
- Zarrouk, S.J.; Moon, H. Efficiency of geothermal power plants: A worldwide review. Geothermics 2014, 51, 142–153. [Google Scholar] [CrossRef]
- Lee, U.; Han, J.; Elgowainy, A. Water Consumption Factors for Electricity Generation in the United States; Energy Systems Division, Argonne National Laboratory: Argonne, IL, USA, 2016. Available online: https://greet.es.anl.gov/files/wcf-2016 (accessed on 15 August 2022).
- De-León Almaraz, S.; Azzaro-Pantel, C.; Montastruc, L.; Boix, M. Deployment of a hydrogen supply chain by multi-objective/multi-period optimisation at regional and national scales. Chem. Eng. Res. Des. 2015, 104, 11–31. [Google Scholar] [CrossRef]
- Shibata, Y. Economic Analysis of Hydrogen Production from Variable Renewables. IEEJ Energy J. 2015, 10, 26–46. [Google Scholar]
- Samsatli, S.; Staffell, I.; Samsatli, N.J. Optimal design and operation of integrated wind-hydrogen-electricity networks for decarbonising the domestic transport sector in Great Britain. Int. J. Hydrogen Energy 2016, 41, 447–475. [Google Scholar] [CrossRef]
- Reuß, M.; Grube, T.; Robinius, M.; Stolten, D. A hydrogen supply chain with spatial resolution: Comparative analysis of infrastructure technologies in Germany. Appl. Energy 2019, 247, 438–453. [Google Scholar] [CrossRef]
- Caglayan, D.G.; Heinrichs, H.U.; Robinius, M.; Stolten, D. Robust design of a future 100% renewable european energy supply system with hydrogen infrastructure. Int. J. Hydrogen Energy 2021, 46, 29376–29390. [Google Scholar] [CrossRef]
- Weimann, L.; Gabrielli, P.; Boldrini, A.; Kramer, G.J.; Gazzani, M. Optimal hydrogen production in a wind-dominated zero-emission energy system. Adv. Appl. Energy 2021, 3, 100032. [Google Scholar] [CrossRef]
- Suleman, F.; Dincer, I.; Agelin-Chaab, M. Comparative impact assessment study of various hydrogen production methods in terms of emissions. Int. J. Hydrogen Energy 2016, 41, 8364–8375. [Google Scholar] [CrossRef]
- Gabrielli, P.; Charbonnier, F.; Guidolin, A.; Mazzotti, M. Enabling low-carbon hydrogen supply chains through use of biomass and carbon capture and storage: A Swiss case study. Appl. Energy 2020, 275, 115245. [Google Scholar] [CrossRef]
- Chen, P.; Alvarado, V.; Hsu, S. Water energy nexus in city and hinterlands: Multi-regional physical input- output analysis for Hong Kong and South China. Appl. Energy 2018, 225, 986–997. [Google Scholar] [CrossRef]
- Larsen, M.A.D.; Drews, M. Water use in electricity generation for water-energy nexus analyses: The European case. Sci. Total Environ. 2019, 651, 2044–2058. [Google Scholar] [CrossRef] [PubMed]
- Nouri, N.; Balali, F.; Nasiri, A.; Seifoddini, H.; Otieno, W. Water withdrawal and consumption reduction for electrical energy generation systems. Appl. Energy 2019, 248, 196–206. [Google Scholar] [CrossRef]
- Jin, Y.; Behrens, P.; Tukker, A.; Scherer, L. The energy-water nexus of China’ s interprovincial and seasonal electric power transmission. Appl. Energy 2021, 286, 116493. [Google Scholar] [CrossRef]
- Tovar-Facio, J.; Guerras, L.S.; Ponce-Ortega, J.M.; Martín, M. Sustainable Energy Transition Considering the Water-Energy Nexus: A Multiobjective Optimization Framework. ACS Sustain. Chem. Eng. 2021, 9, 3768–3780. [Google Scholar] [CrossRef]
- Caglayan, D.G.; Heinrichs, H.U.; Linssen, J.; Robinius, M.; Stolten, D. Impact of different weather years on the design of hydrogen supply pathways for transport needs. Int. J. Hydrogen Energy 2019, 44, 25442–25456. [Google Scholar] [CrossRef]
- GAMS Development Corp. GAMS—A Users’ Guide; GAMS Development Corp.: Washington, DC, USA, 2017. [Google Scholar]
- GAMS Development Corp. CPLEX 12; GAMS Development Corporation: Washington, DC, USA; Available online: https://www.gams.com/latest/docs/S_CPLEX.html (accessed on 20 January 2021).
- METI. Basic Hydrogen Strategy; Ministry of Economy, Trade and Industry: Japan, 2017; Available online: https://www.meti.go.jp/english/press/2017/pdf/1226_003b.pdf (accessed on 10 September 2021).
- González Palencia, J.C.; Itoi, Y.; Araki, M. Hydrogen Production System Design considering the Water-Energy-Carbon Nexus and Cost. In Proceedings of the 12th International Conference on Applied Energy—ICAE 2020, Bangkok, Thailand, 1–10 December 2020; p. 6. [Google Scholar]
- Granovskii, M.; Dincer, I.; Rosen, M.A. Economic and environmental comparison of conventional, hybrid, electric and hydrogen fuel cell vehicles. J. Power Sources 2006, 159, 1186–1193. [Google Scholar] [CrossRef]
- Acar, C.; Dincer, I. Review and evaluation of hydrogen production options for better environment. J. Clean. Prod. 2019, 218, 835–849. [Google Scholar] [CrossRef]
- METI. Annual Energy Report 2018 (Energy Whitepaper 2018); Ministry of Economy, Trade and Industry: Japan, 2019; Available online: https://www.enecho.meti.go.jp/about/whitepaper/2019pdf/ (accessed on 5 August 2022). (In Japanese)
- MLIT. Utilization of Water Resources; Ministry of Land, Infrastructure, Transport and Tourism: Japan, 2018; Available online: http://www.mlit.go.jp/mizukokudo/mizsei/mizukokudo_mizsei_tk2_000014.html (accessed on 15 April 2022). (In Japanese)
- Wakeel, M.; Chen, B.; Hayat, T.; Alsaedi, A.; Ahmad, B. Energy consumption for water use cycles in different countries: A review. Appl. Energy 2016, 178, 868–885. [Google Scholar] [CrossRef]
- Wang, M. GREET 1 Model 2018; Energy Systems Division, Argonne National Laboratory: Argonne, IL, USA, 2018. Available online: https://greet.es.anl.gov/greet_1_series (accessed on 16 August 2022).
- MHLW. Waterworks Technologies in Japan. In Water Supply in Japan; Ministry of Health, Labour and Welfare: Japan. Available online: https://www.mhlw.go.jp/english/policy/health/water_supply/8.html (accessed on 10 May 2021).
- METI. Significance of Introducing Renewable Energy and Characteristics of Each Source; Ministry of Economy, Trade and Industry: Japan, 2014; Available online: https://www.enecho.meti.go.jp/committee/council/basic_policy_subcommittee/mitoshi/004/pdf/004_05.pdf (accessed on 13 May 2021). (In Japanese)
- EDMC; IEEJ. EDMC Handbook of Energy & Economic Statistics 2019; The Energy Data and Modelling Center, The Institute of Energy Economic: Tokyo, Japan; The Energy Conservation Center: Tokyo, Japan, 2019. (In Japanese) [Google Scholar]
- ECOFYS. International Comparison of Fossil Power Efficiency and CO2 Intensity—Update 2018. 2018. Available online: https://guidehouse.com/-/media/www/site/downloads/energy/2018/intl-comparison-of-fossil-power-efficiency--co2-in.pdf (accessed on 18 August 2022).
- Nazari-Heris, M.; Mohammadi-Ivatloo, B. Chapter 6—Design of Small Hydro Generation Systems. In Distributed Generation Systems Design, Operation and Grid Integration; Butterworth Heinemann: Oxford, UK, 2017; pp. 301–332. [Google Scholar]
- Inoue, N. Chapter 1 Nuclear Energy. In All About Nuclear Energy—Wisdom that Coexists with the Earth; Japan Atomic Energy Comission: Japan, 2003; pp. 1–14. Available online: http://www.aec.go.jp/jicst/NC/sonota/study/aecall/book/pdf/1syou.pdf (accessed on 5 August 2022). (In Japanese)
- NEDO. Chapter 4 Biomass Energy. In NEDO Renewable Energy Technology White Paper; New Energy and Industrial Technology Development Organization: Japan, 2013; p. 108. Available online: https://www.nedo.go.jp/content/100544819.pdf (accessed on 13 August 2022). (In Japanese)
- Elgowainy, A.; Han, J.; Lee, U.; Li, J.; Dunn, J.; Wang, M. 2016 DOE Hydrogen and Fuel Cells Program Annual Merit Review; Life-Cycle Analysis of Water Consumption for Hydrogen Production; Argonne National Laboratory: Argonne, IL, USA, 2016. Available online: https://www.hydrogen.energy.gov/pdfs/review16/sa039_elgowainy_2016_o.pdf (accessed on 11 May 2021).
- METI. Power Cost Verification Report of the Long-Term Energy Supply and Demand Subcommittee; Ministry of Economy, Trade and Industry: Tokyo, Japan, 2015; Available online: http://www.enecho.meti.go.jp/committee/council/basic_policy_subcommittee/mitoshi/cost_wg/007/pdf/007_05.pdf (accessed on 8 August 2022). (In Japanese)
- BOJ. US. Dollar/Yen Spot Rate at 17:00 in JST, Average in the Month, Tokyo Market; Bank of Japan: Tokyo, Japan, 2020; Available online: http://www.stat-search.boj.or.jp/ssi/mtshtml/fm08_m_1_en.html (accessed on 13 August 2022).
- METI. Overview of Industrial Water Supply Business; Ministry of Economy, Trade and Industry: Japan. Available online: http://warp.da.ndl.go.jp/info:ndljp/pid/11181294/www.meti.go.jp/shingikai/sankoshin/chiiki_keizai/kogyoyo_suido/pdf/004_s01_00.pdf (accessed on 10 August 2022). (In Japanese).
- Nikolaidis, P.; Poullikkas, A. A comparative overview of hydrogen production processes. Renew. Sustain. Energy Rev. 2017, 67, 597–611. [Google Scholar] [CrossRef]
- Samsatli, S.; Samsatli, N.J. A multi-objective MILP model for the design and operation of future integrated multi-vector energy networks capturing detailed spatio-temporal dependencies. Appl. Energy 2018, 220, 893–920. [Google Scholar] [CrossRef]
- METI. FY2017 Energy Supply and Demand Report (Revised Report); Ministry of Economy, Trade and Industry: Tokyo, Japan, 2019; Available online: https://www.meti.go.jp/english/press/2019/0412_004.html (accessed on 20 August 2022).
- Fickling, D. The Hydrogen Economy’s Time Is Approaching. The Washington Post. 2020. Available online: https://www.washingtonpost.com/business/energy/the-hydrogen-economys-time-is-approaching/2020/05/08/383b1a04-9191-11ea-9322-a29e75effc93_story.html (accessed on 12 May 2021).
- IEA/OECD. Batteries and Hydrogen Technology: Keys for a Clean Energy Future; International Energy Agency and Organization for Economic Cooperation and Development: Paris, France, 2020; Available online: https://www.iea.org/articles/batteries-and-hydrogen-technology-keys-for-a-clean-energy-future (accessed on 20 September 2022).
- Chestney, N.; Abnett, K. Green Hydrogen’s Time Has Come, Say Advocates Eying Post-Pandemic World. Reuters. 2020. Available online: https://jp.reuters.com/article/us-health-coronarivus-hydrogen-analysis/green-hydrogens-time-has-come-say-advocates-eying-post-pandemic-world-idINKBN22K0MJ (accessed on 14 September 2022).
- METI. Japan’s Roadmap to “Beyond-Zero” Carbon; Ministry of Economy, Trade and Industry: Japan. Available online: https://www.meti.go.jp/english/policy/energy_environment/global_warming/roadmap/index.html (accessed on 13 September 2022).
- Ito, H.; Noguchi, Y. Japan to Ban Domestic Gas-Fueled Car Sales by Mid-2030s. The Asahi Shimbun. 2020. Available online: http://www.asahi.com/ajw/articles/13989088 (accessed on 17 September 2022).
- Takenaka, K.; Takemoto, Y.; Obayashi, Y. Japan Vows Deeper Emission Cuts as Biden Holds Climate Summit. Reuters. 2021. Available online: https://www.reuters.com/business/environment/japan-government-propose-new-target-cutting-greenhouse-gases-by-46-nikkei-2021-04-22/ (accessed on 22 September 2022).
Figure 1.
Energy and material flows and costs associated with the production of 1 kg of hydrogen using steam methane reforming and electrolysis using different energy resources for electricity production. Built using data from [4,7,8,9,10,11,12,13,14].

Figure 2.
Energy and material flows associated with hydrogen production.

Figure 3.
Share of hydrogen production routes in hydrogen production as function of the CO2 intensity for hydrogen production on a cradle-to-gate. (a) Low-Cost scenario; (b) Low Energy Use scenario; (c) Water-Energy-Carbon scenario; (d) Water-Energy-Carbon-Cost scenario.
Figure 3.
Share of hydrogen production routes in hydrogen production as function of the CO2 intensity for hydrogen production on a cradle-to-gate. (a) Low-Cost scenario; (b) Low Energy Use scenario; (c) Water-Energy-Carbon scenario; (d) Water-Energy-Carbon-Cost scenario.

Figure 4.
Installed capacity as function of the CO2 intensity for hydrogen production on a cradle-to-gate basis. (a) Low-Cost scenario; (b) Low Energy Use scenario; (c) Water-Energy-Carbon scenario; (d) Water-Energy-Carbon-Cost scenario.
Figure 4.
Installed capacity as function of the CO2 intensity for hydrogen production on a cradle-to-gate basis. (a) Low-Cost scenario; (b) Low Energy Use scenario; (c) Water-Energy-Carbon scenario; (d) Water-Energy-Carbon-Cost scenario.


Figure 5.
Energy consumption as function of the CO2 intensity for hydrogen production on a cradle-to-gate basis. (a) Low-Cost scenario; (b) Low Energy Use scenario; (c) Water-Energy-Carbon scenario; (d) Water-Energy-Carbon-Cost scenario.
Figure 5.
Energy consumption as function of the CO2 intensity for hydrogen production on a cradle-to-gate basis. (a) Low-Cost scenario; (b) Low Energy Use scenario; (c) Water-Energy-Carbon scenario; (d) Water-Energy-Carbon-Cost scenario.


Figure 6.
Water consumption as function of the CO2 intensity for hydrogen production on a cradle-to-gate basis. (a) Low-Cost scenario; (b) Low Energy Use scenario; (c) Water-Energy-Carbon scenario; (d) Water-Energy-Carbon-Cost scenario.
Figure 6.
Water consumption as function of the CO2 intensity for hydrogen production on a cradle-to-gate basis. (a) Low-Cost scenario; (b) Low Energy Use scenario; (c) Water-Energy-Carbon scenario; (d) Water-Energy-Carbon-Cost scenario.

Figure 7.
Specific cost of hydrogen production as function of the CO2 intensity for hydrogen production on a cradle-to-gate basis. (a) Low-Cost scenario; (b) Low Energy Use scenario; (c) Water-Energy-Carbon scenario; (d) Water-Energy-Carbon-Cost scenario.
Figure 7.
Specific cost of hydrogen production as function of the CO2 intensity for hydrogen production on a cradle-to-gate basis. (a) Low-Cost scenario; (b) Low Energy Use scenario; (c) Water-Energy-Carbon scenario; (d) Water-Energy-Carbon-Cost scenario.


Figure 8.
Sensitivity analysis of the hydrogen system performance in the Water-Energy-Carbon-Cost scenario for a cradle-to-gate CO2 intensity of 0 kg-CO2/kg-H2 CO2. (a) Hydrogen production share and installed capacity; (b) specific cost of hydrogen production.
Figure 8.
Sensitivity analysis of the hydrogen system performance in the Water-Energy-Carbon-Cost scenario for a cradle-to-gate CO2 intensity of 0 kg-CO2/kg-H2 CO2. (a) Hydrogen production share and installed capacity; (b) specific cost of hydrogen production.


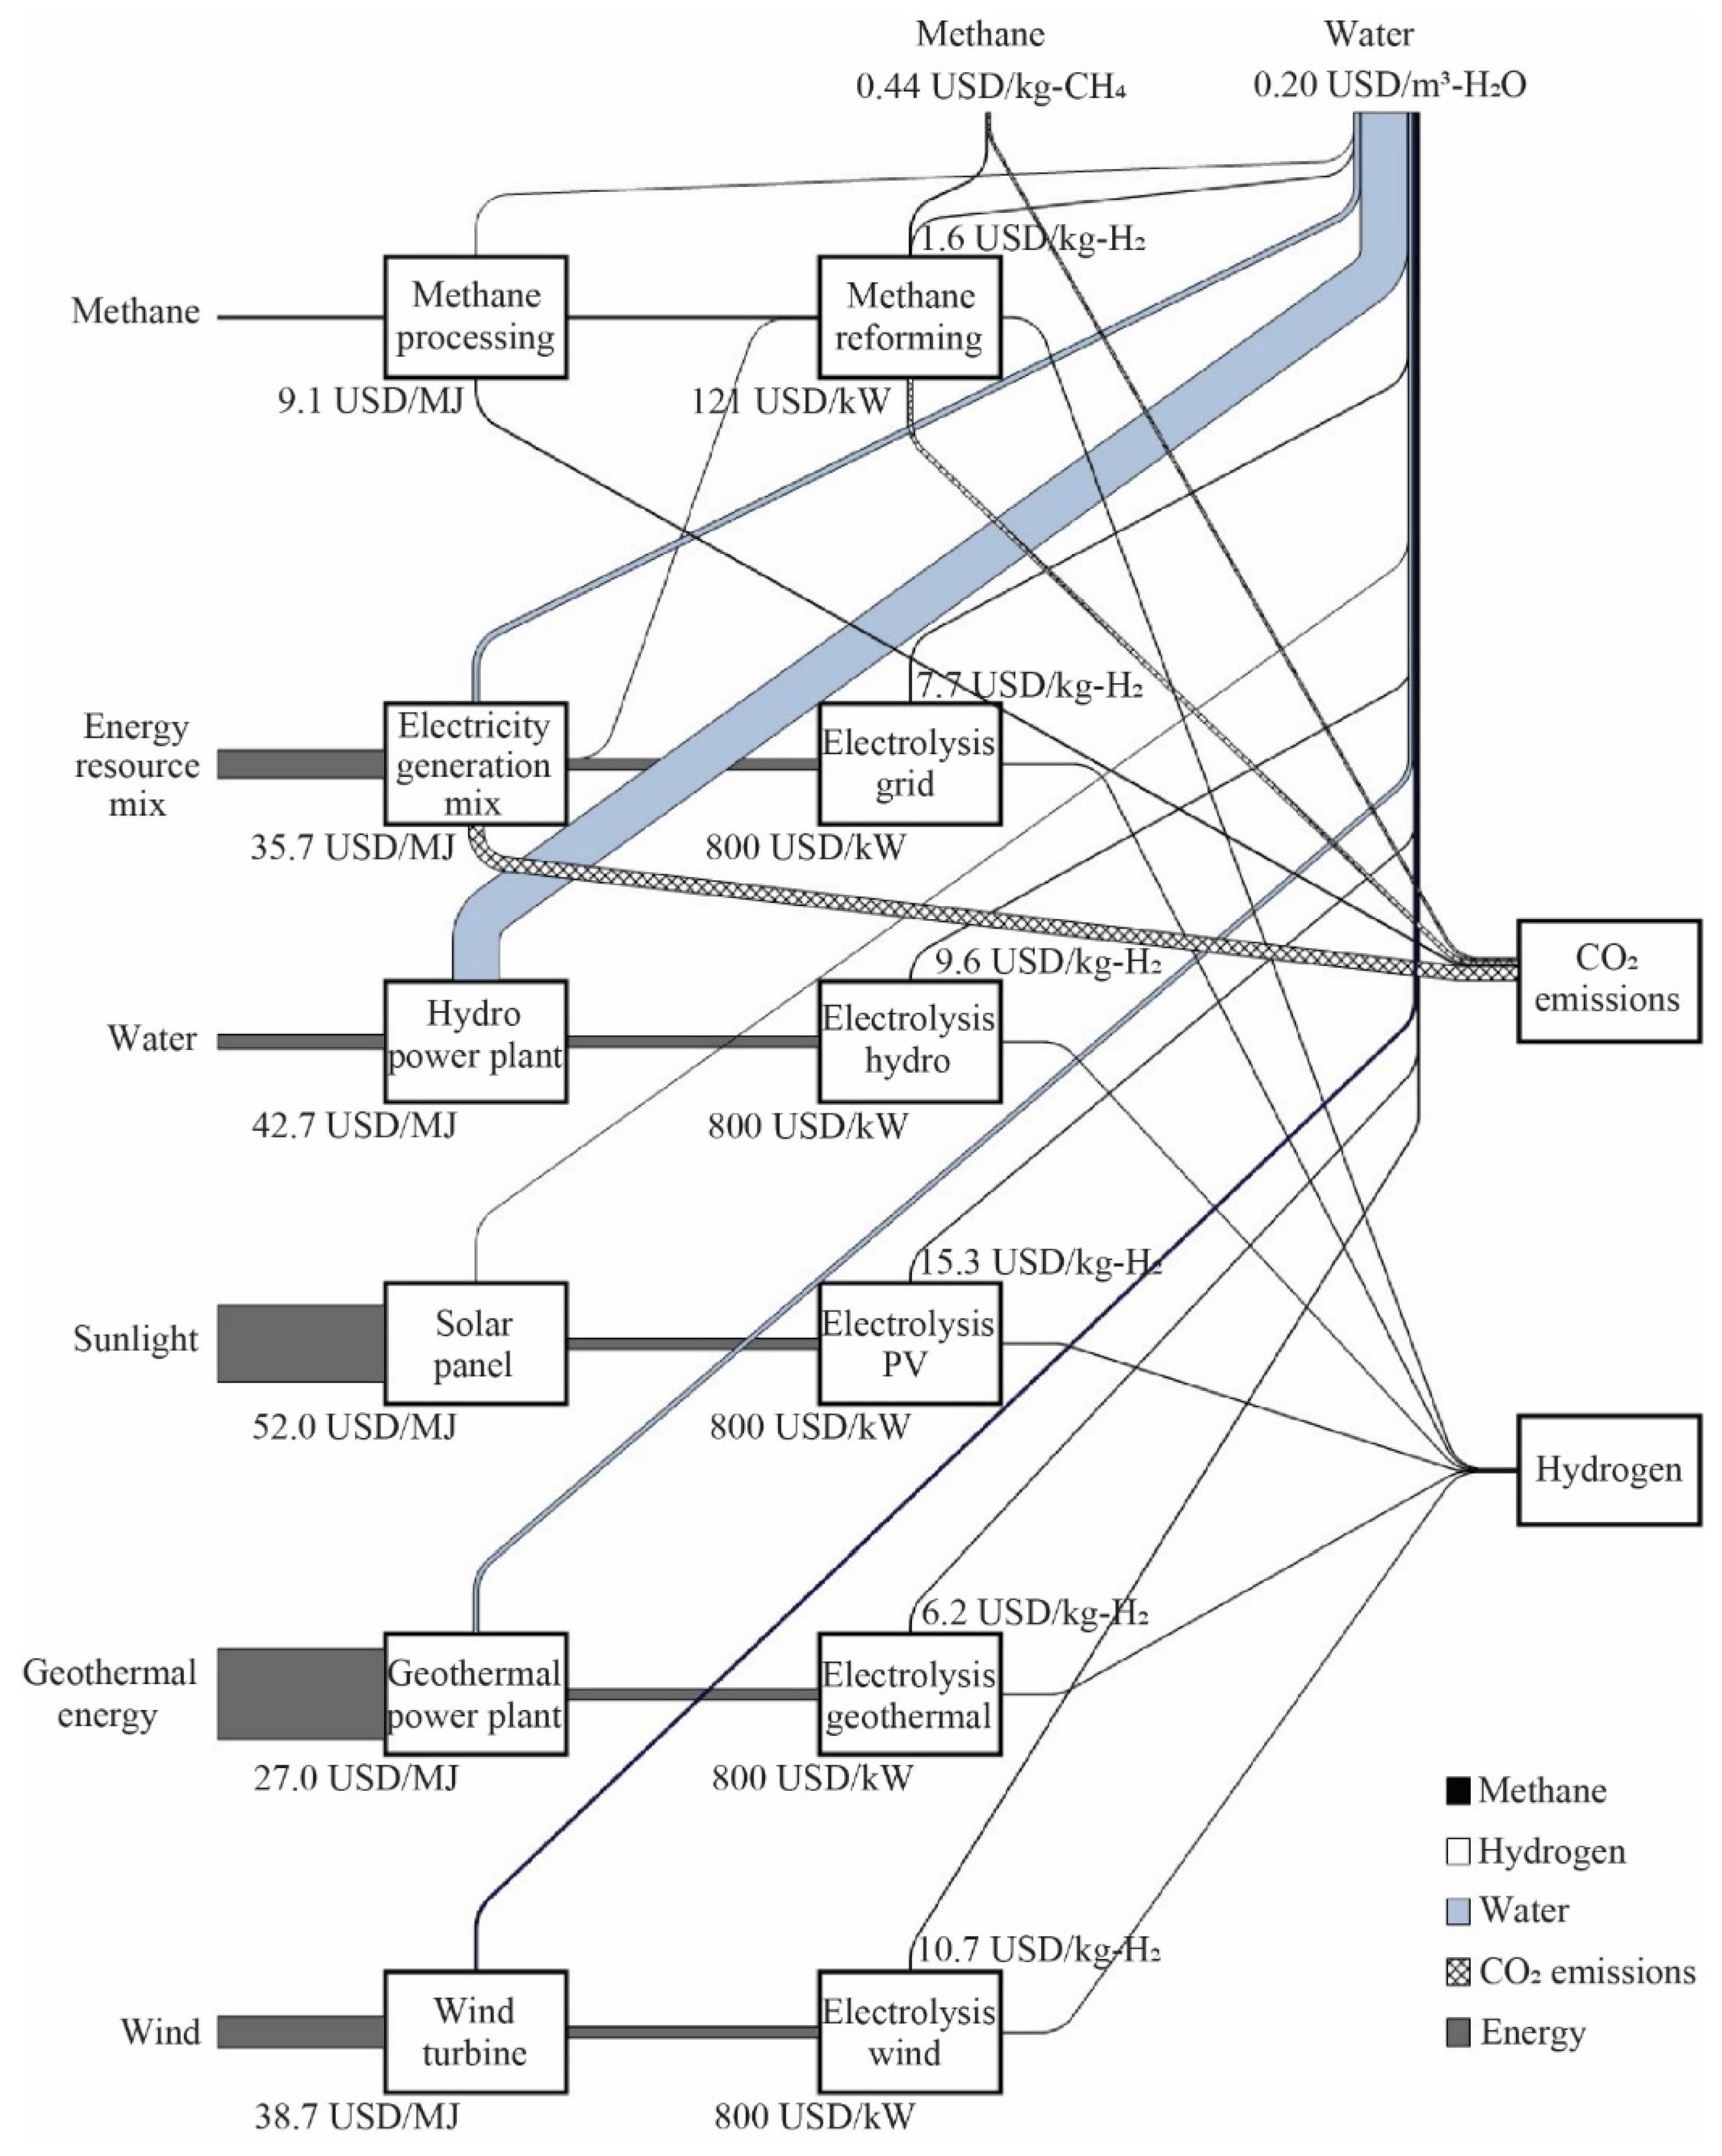
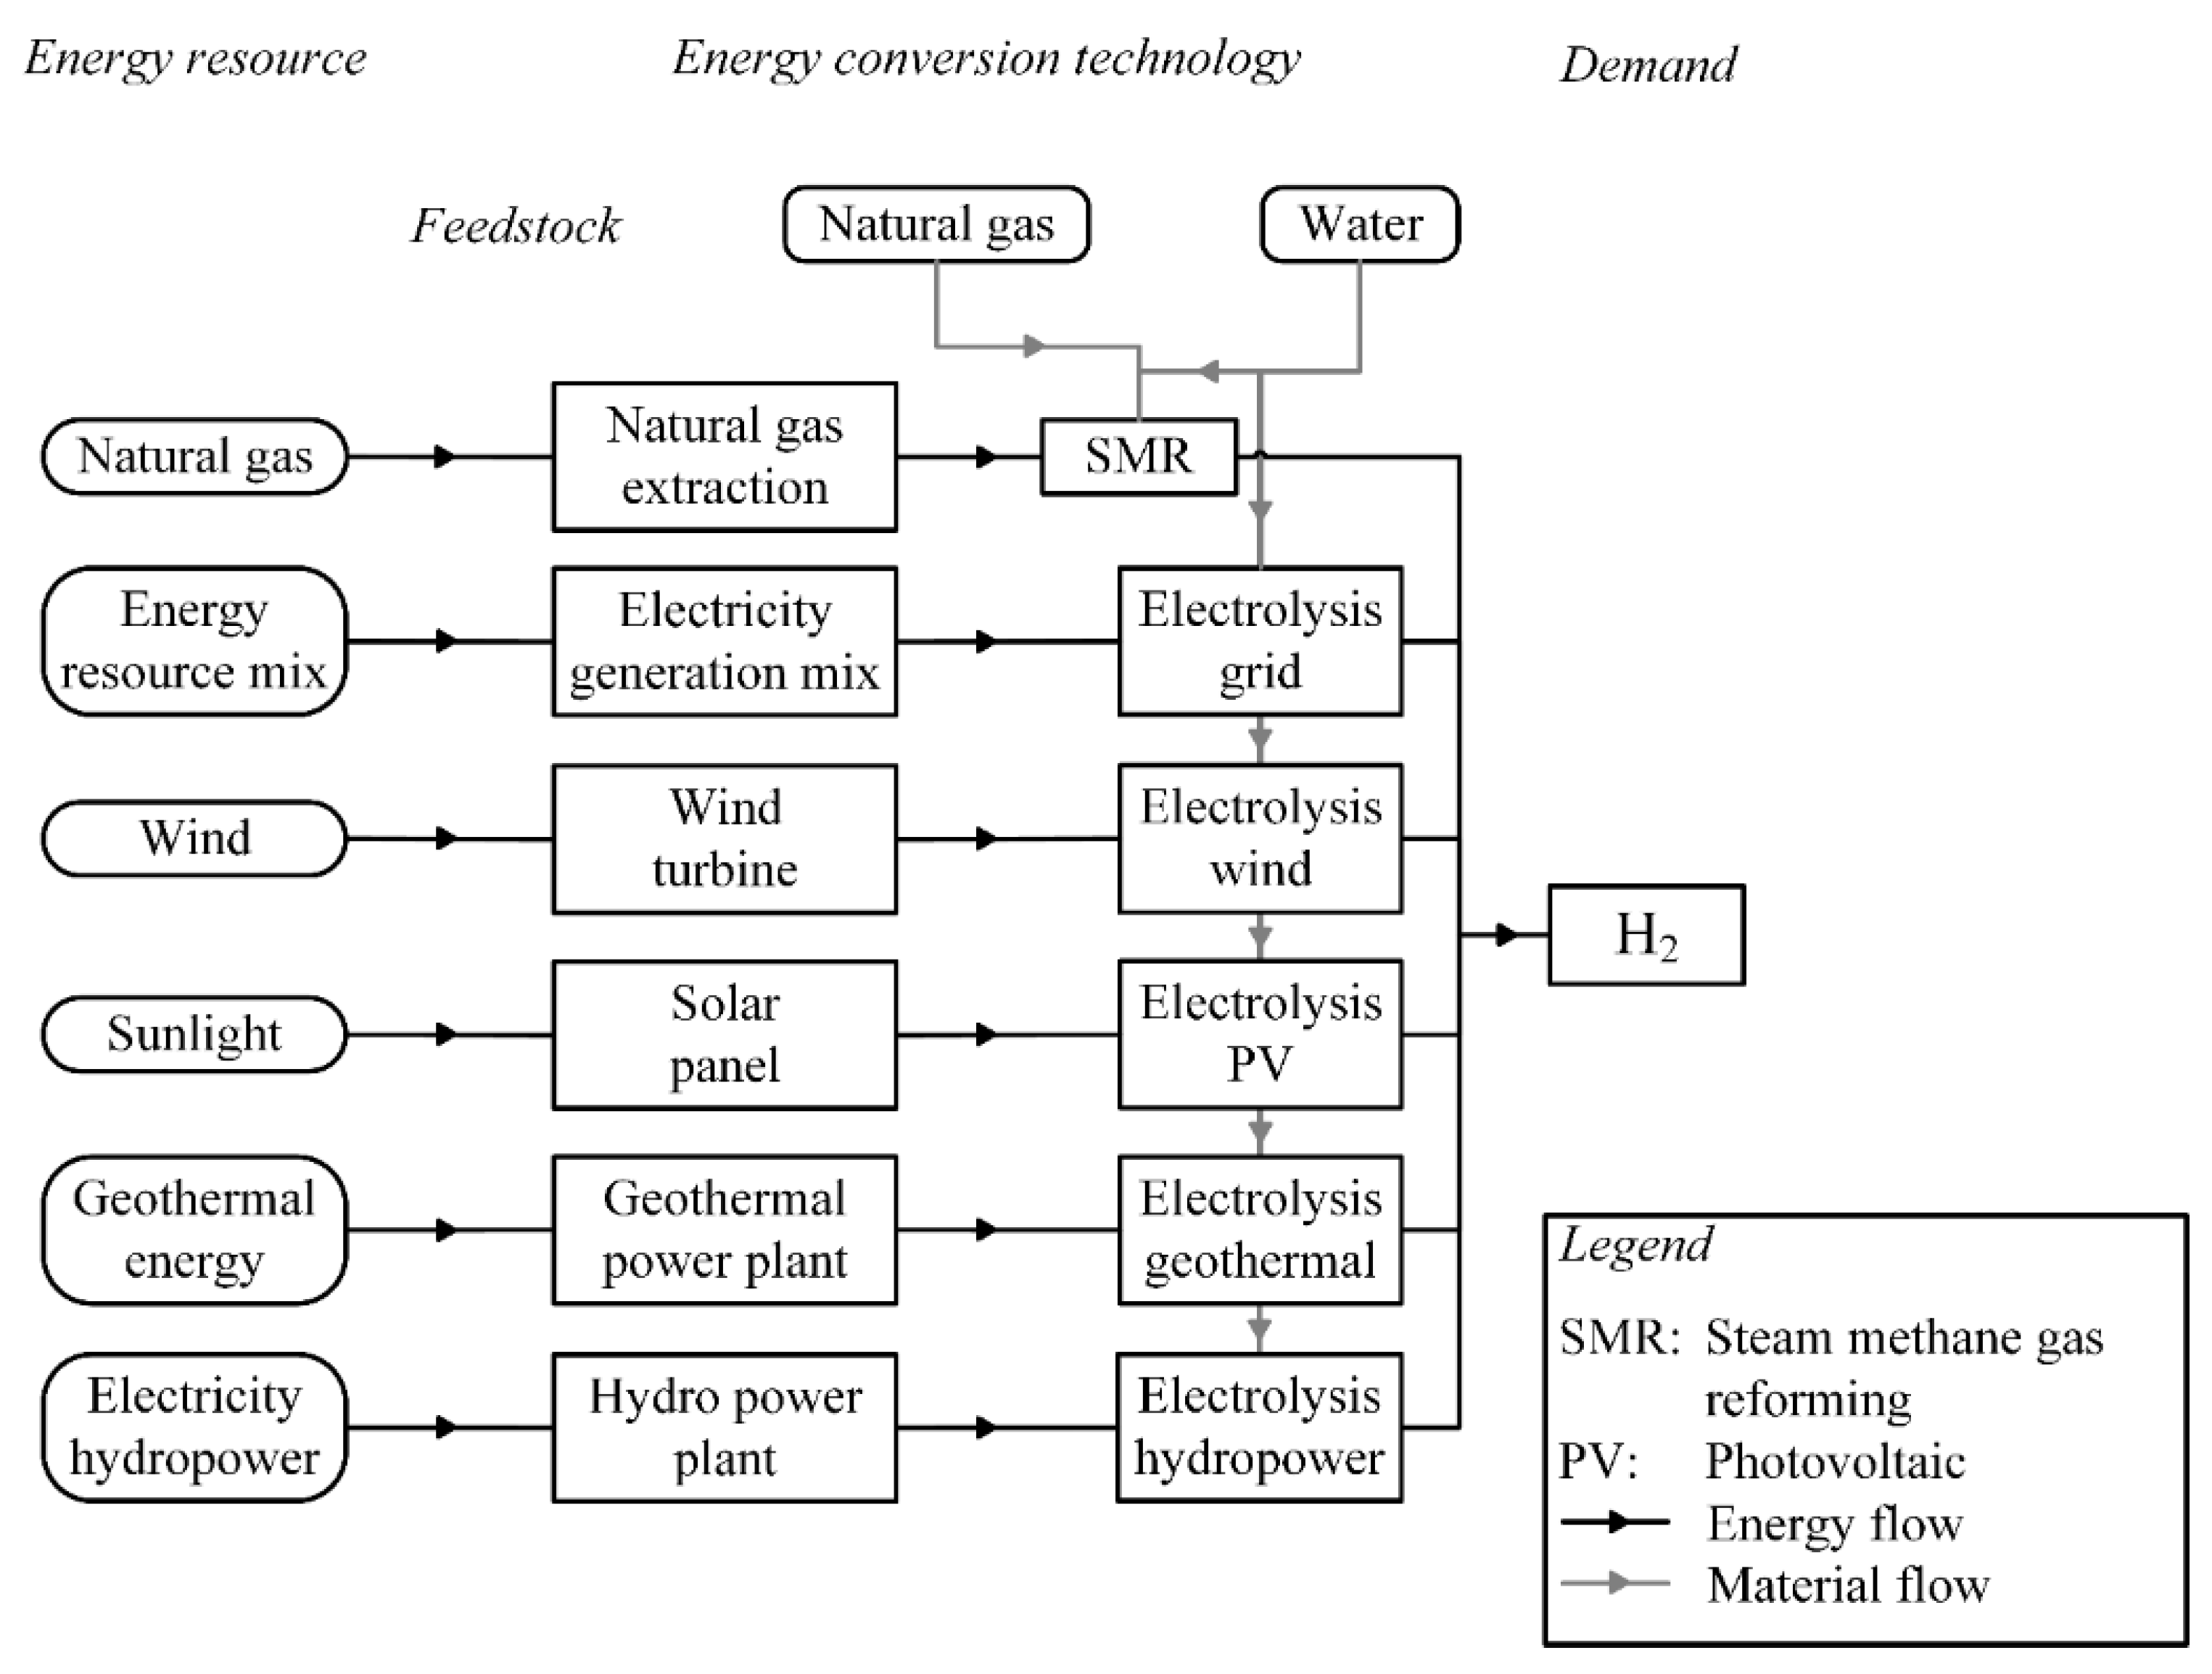
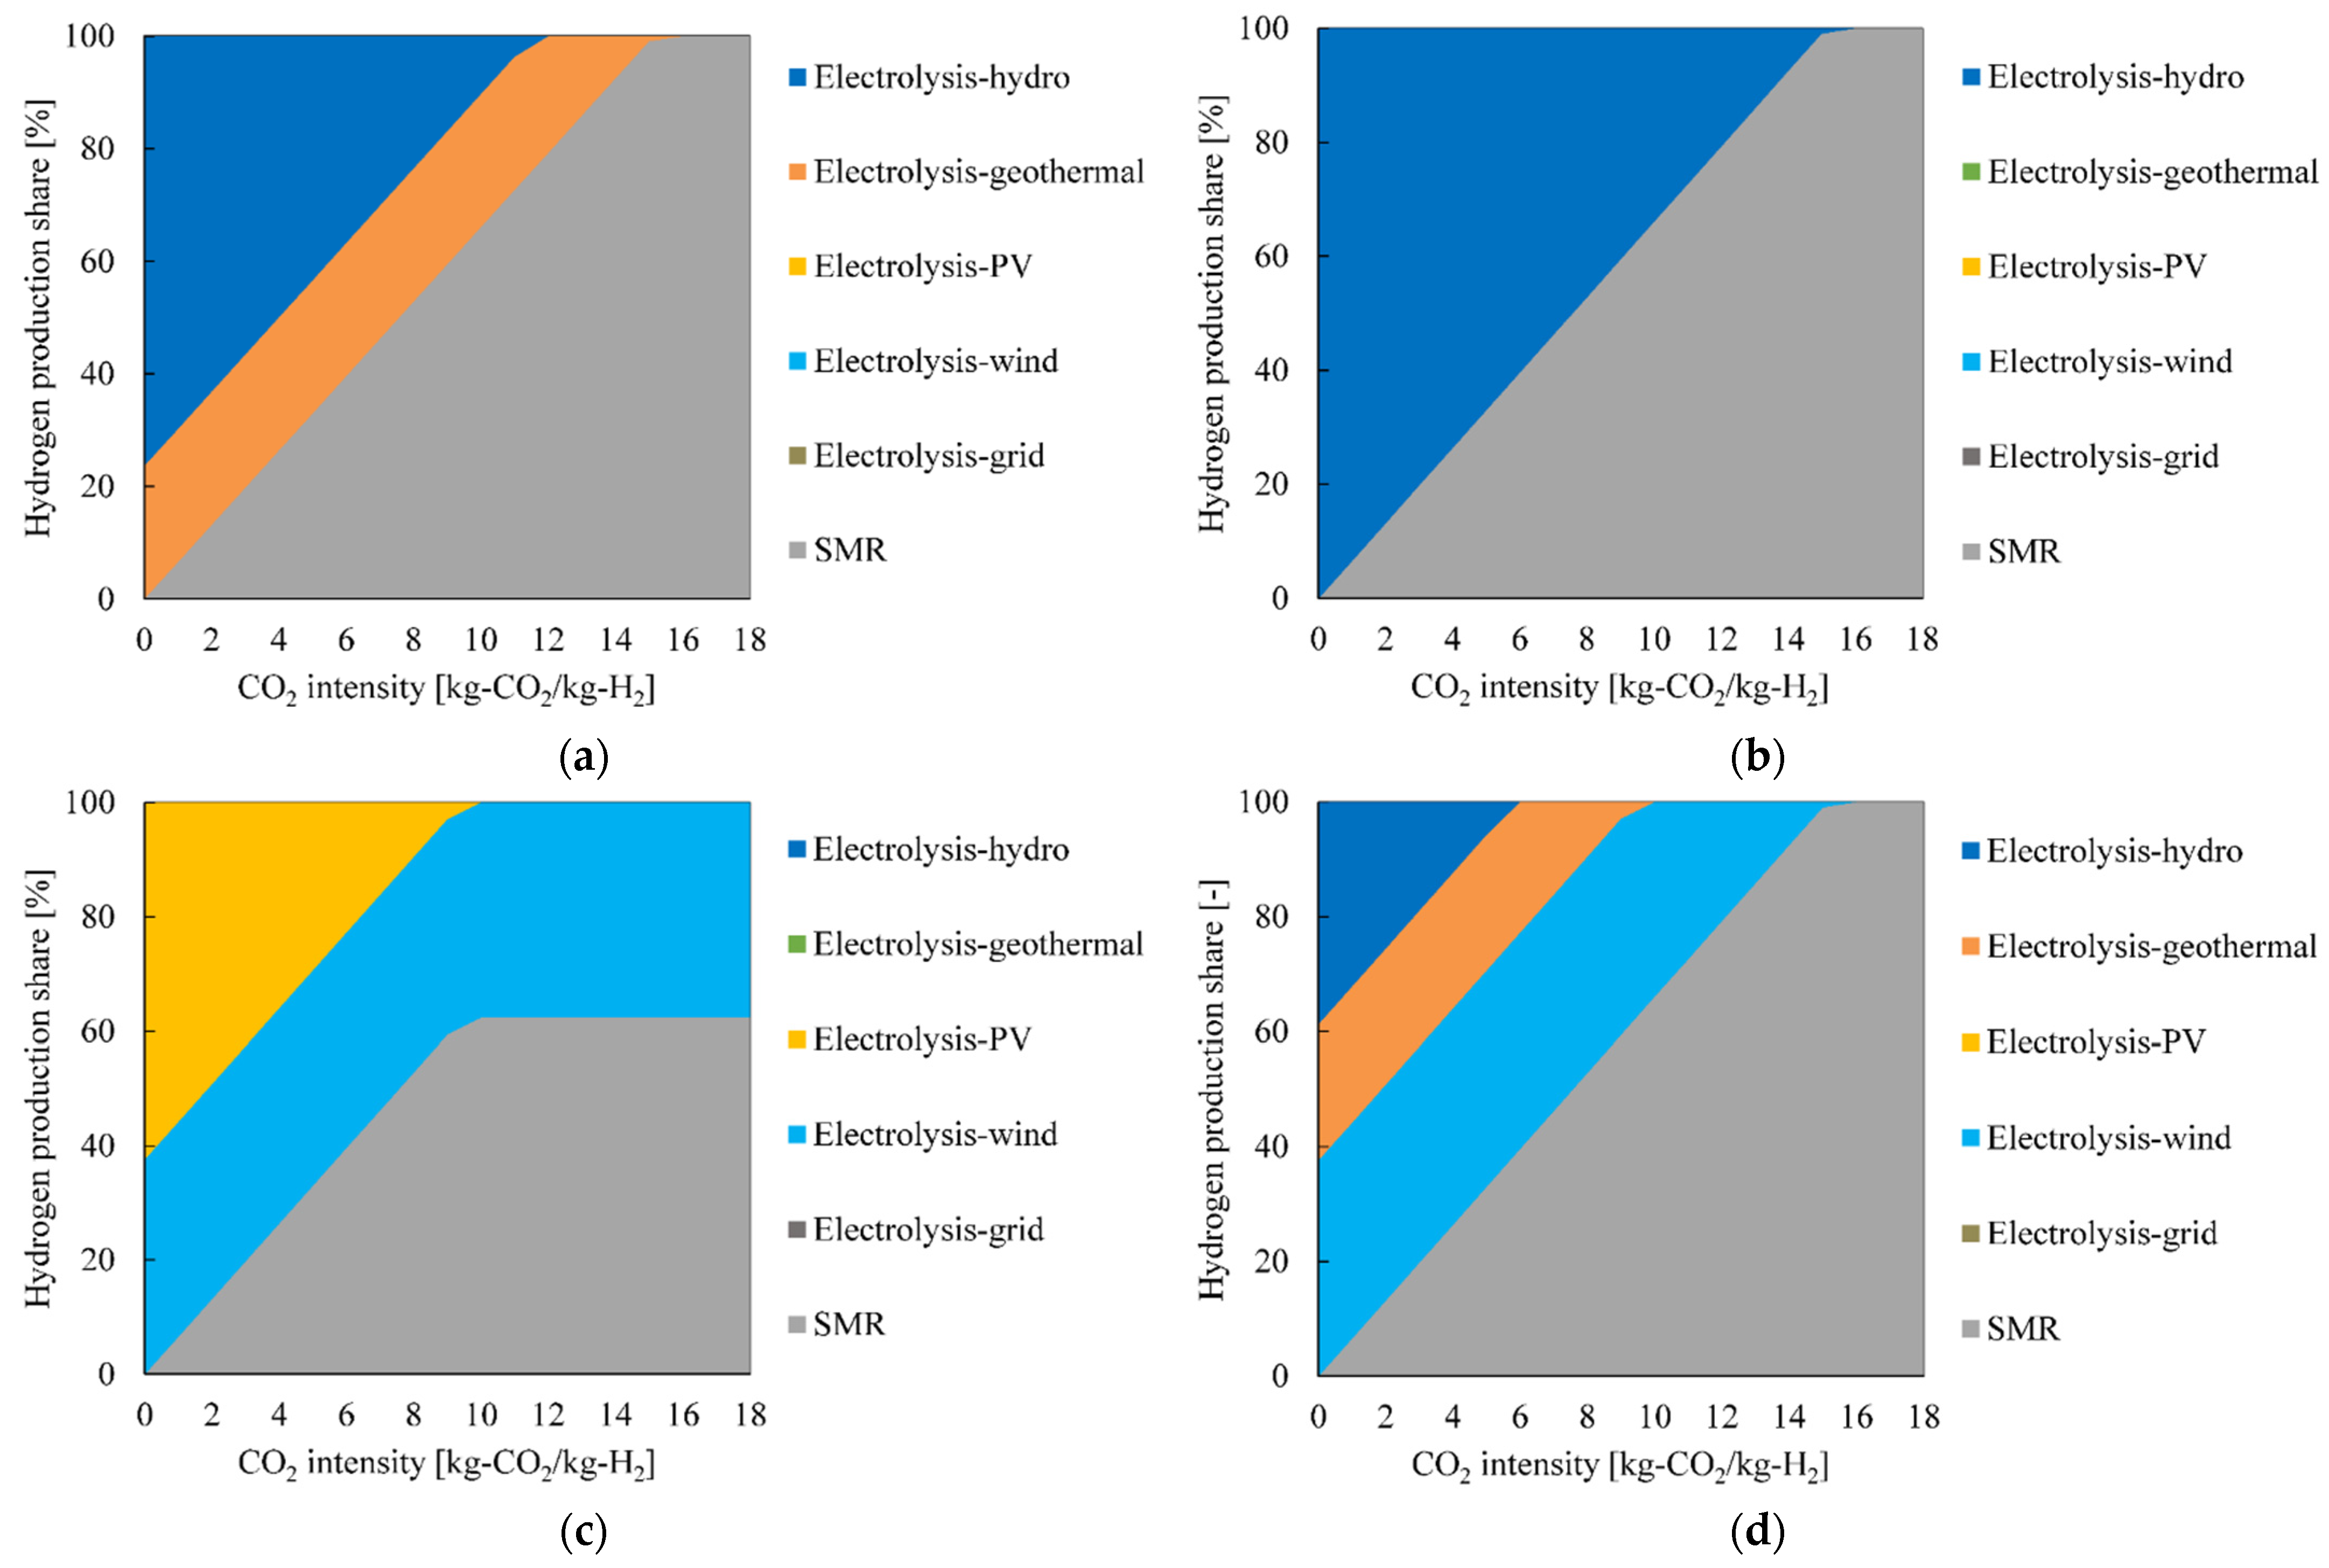
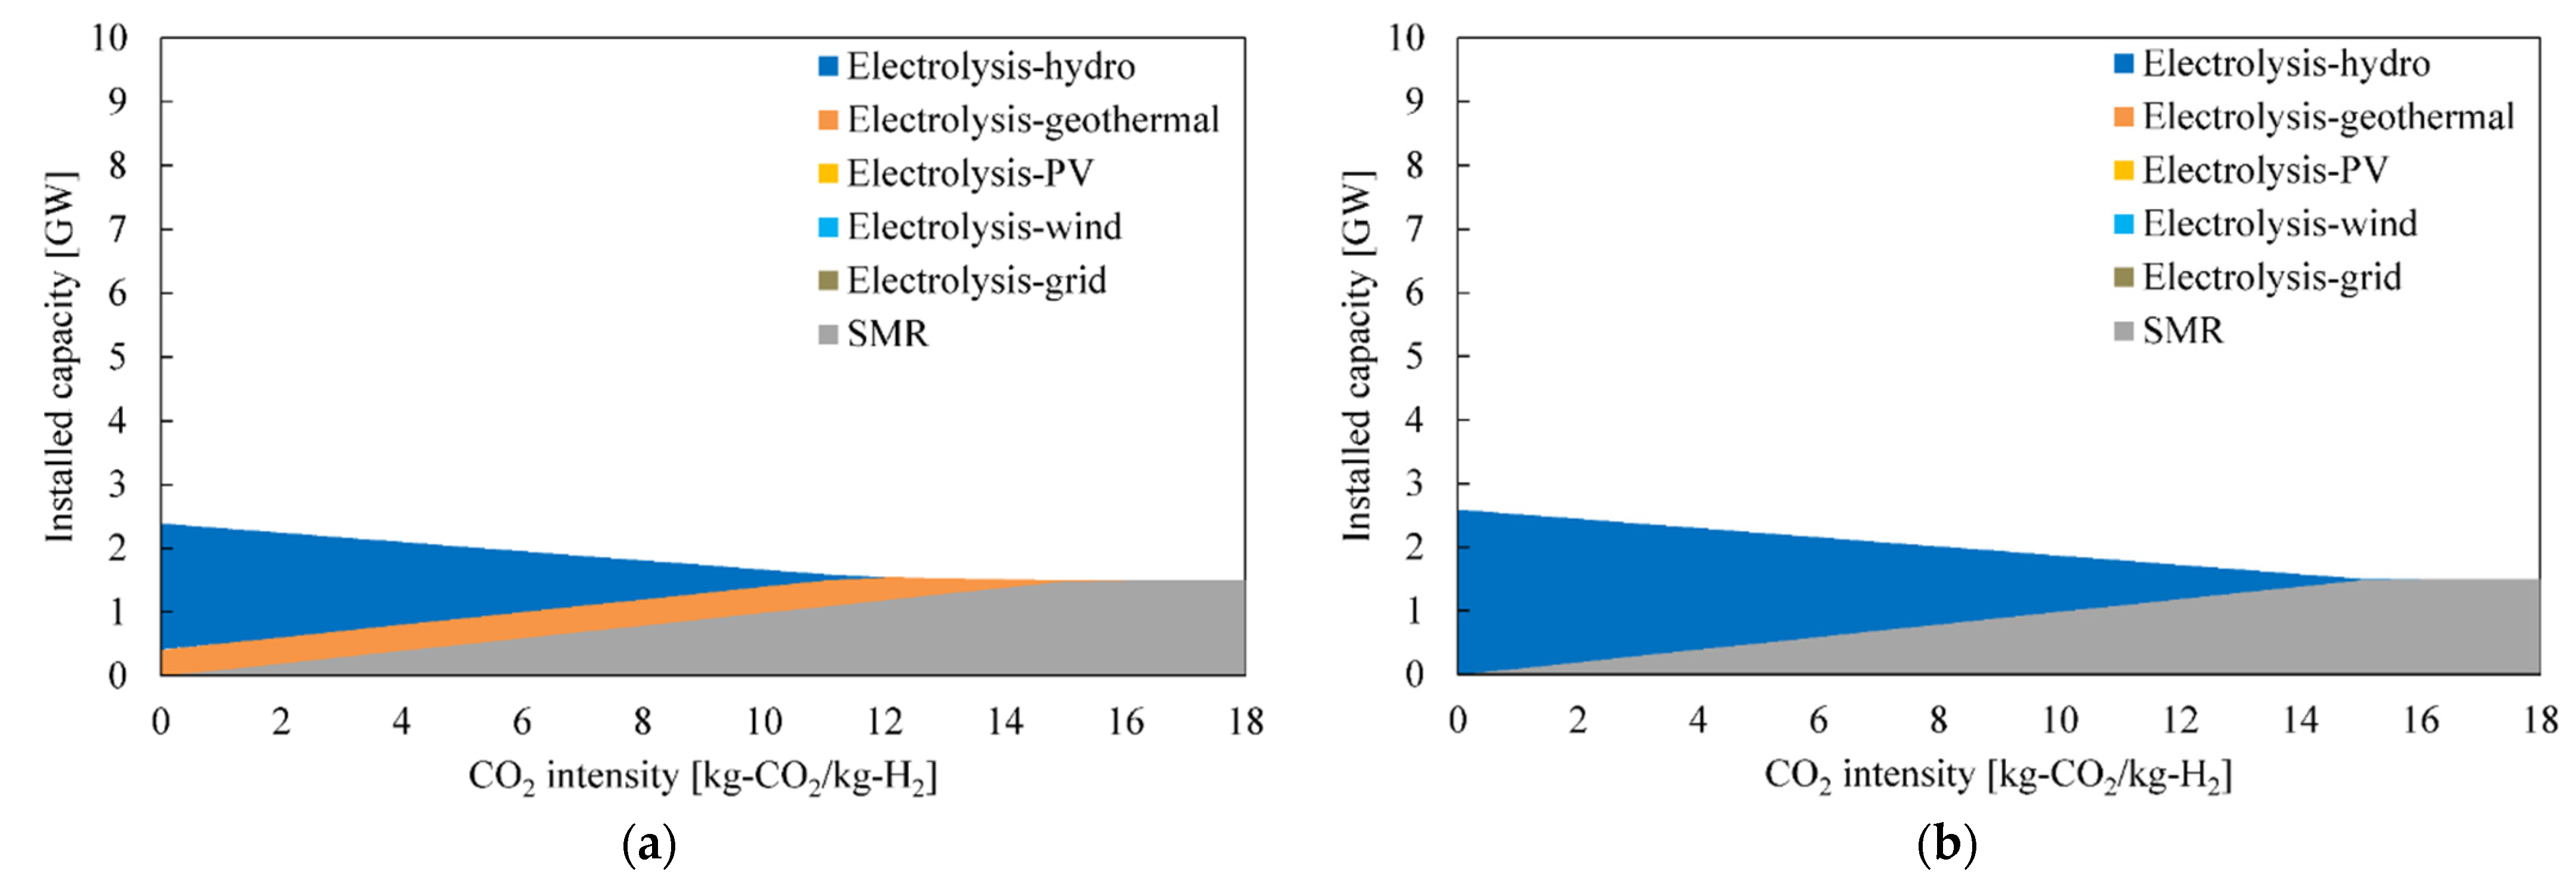
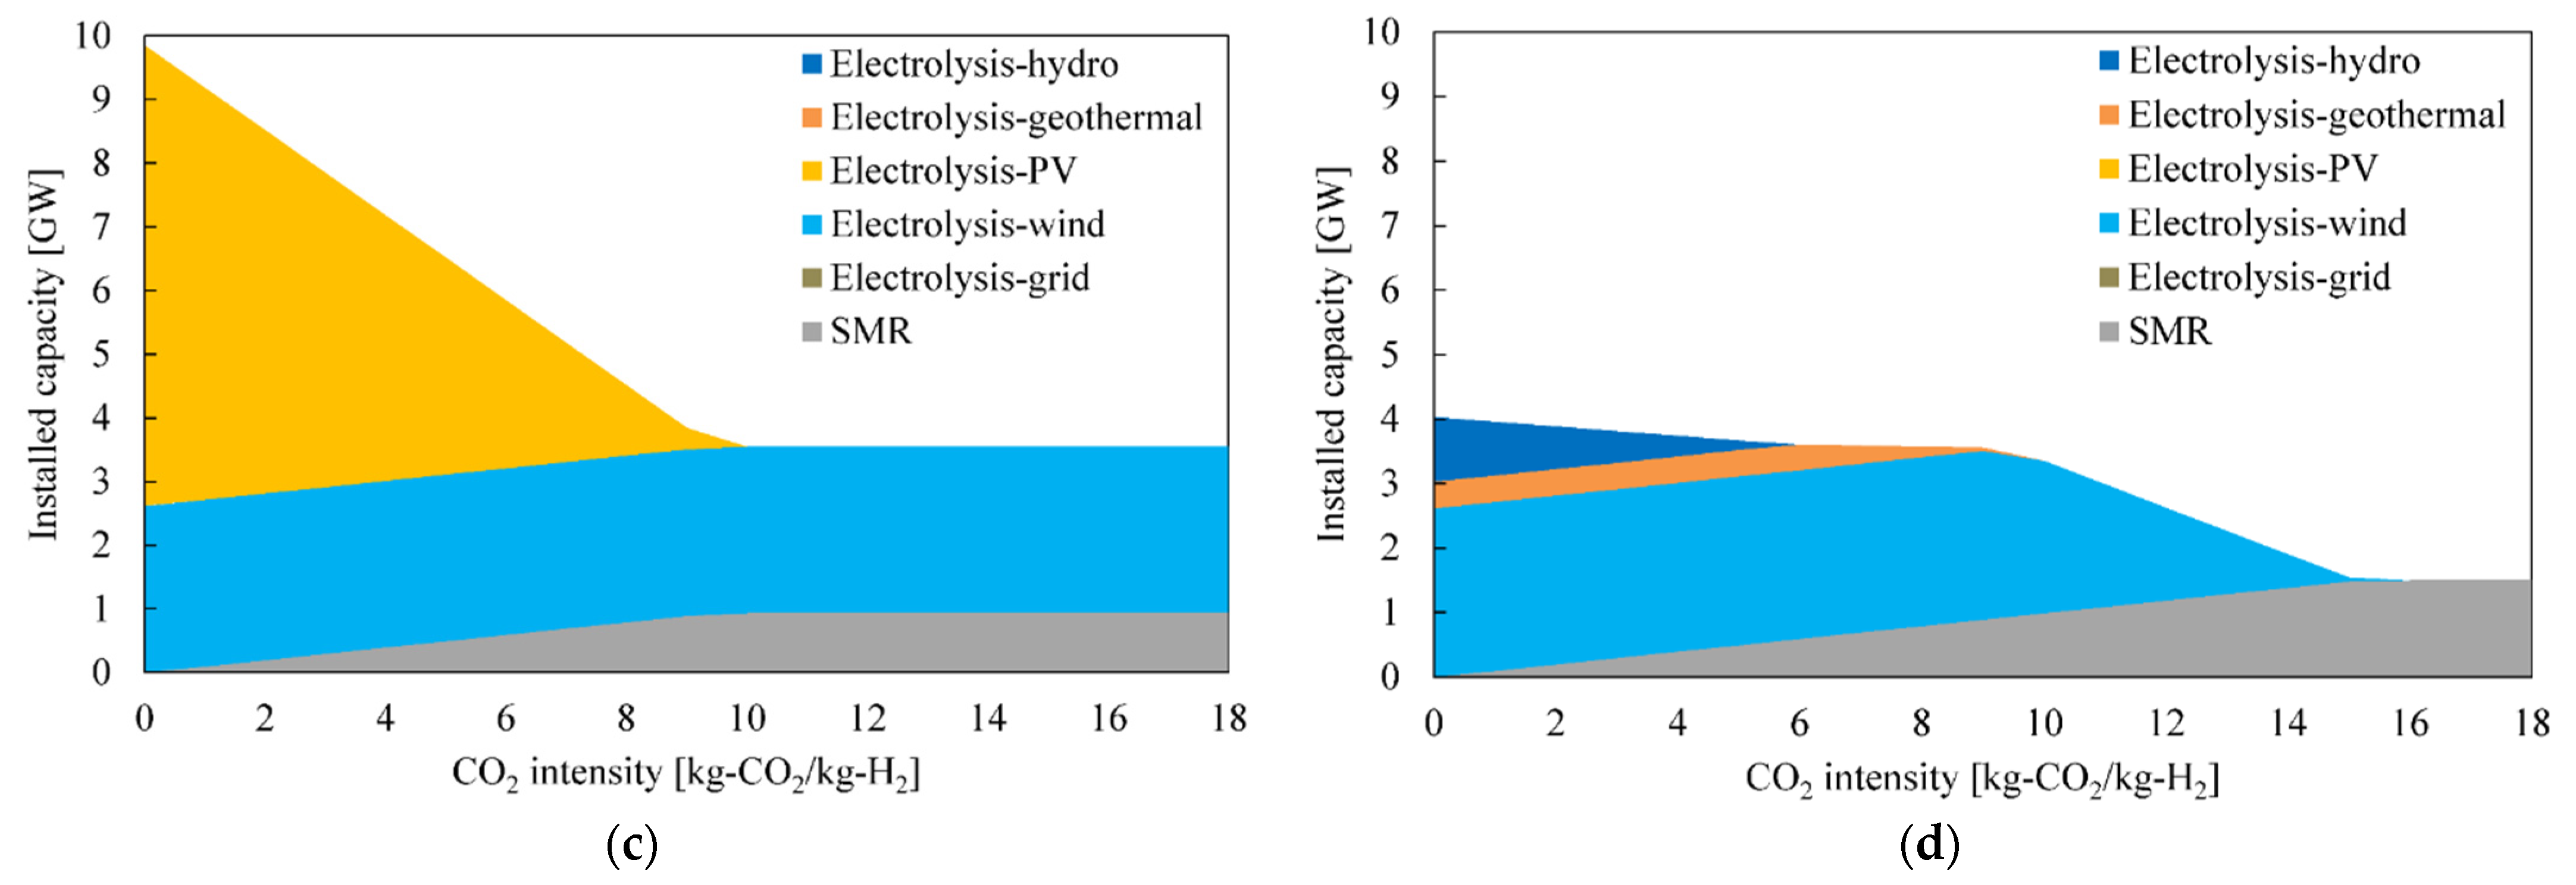
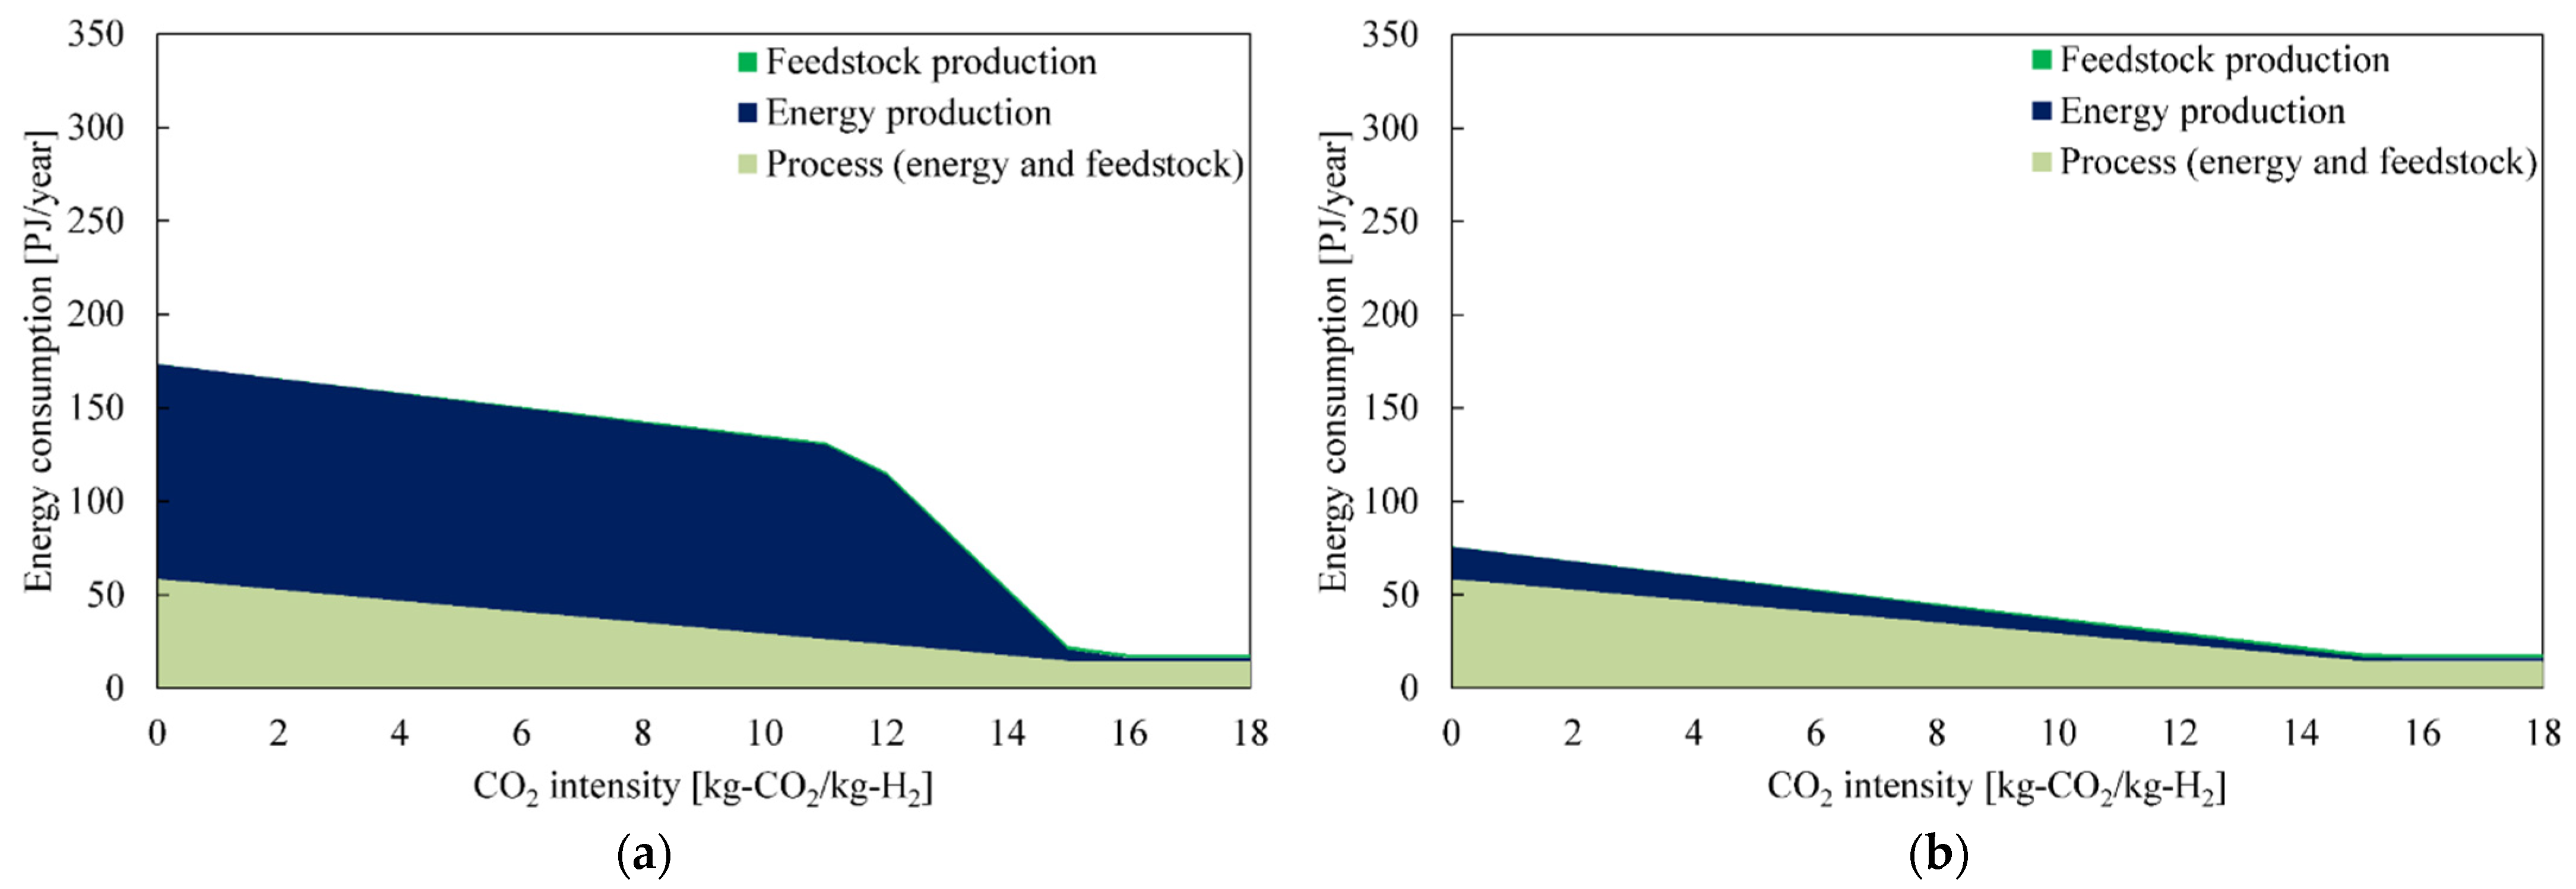
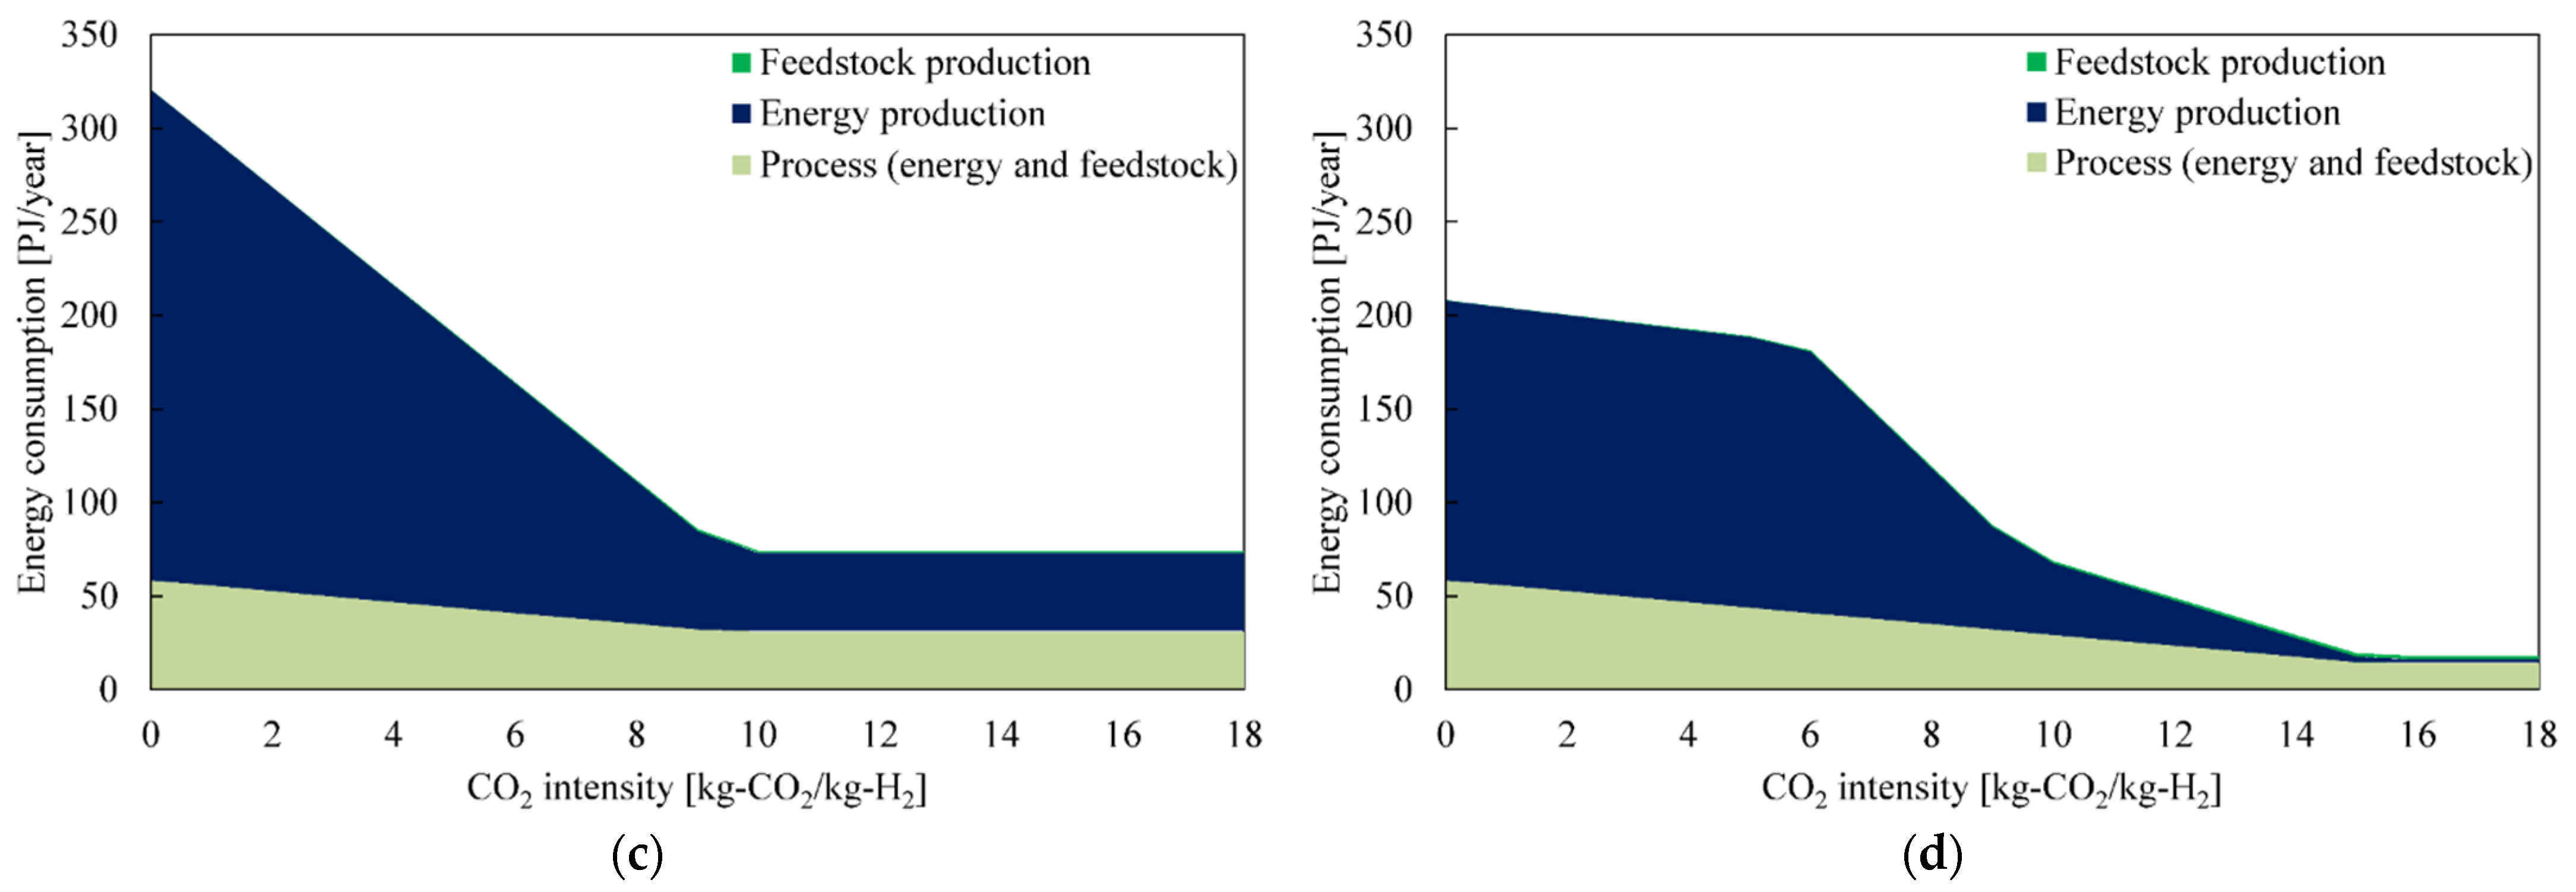
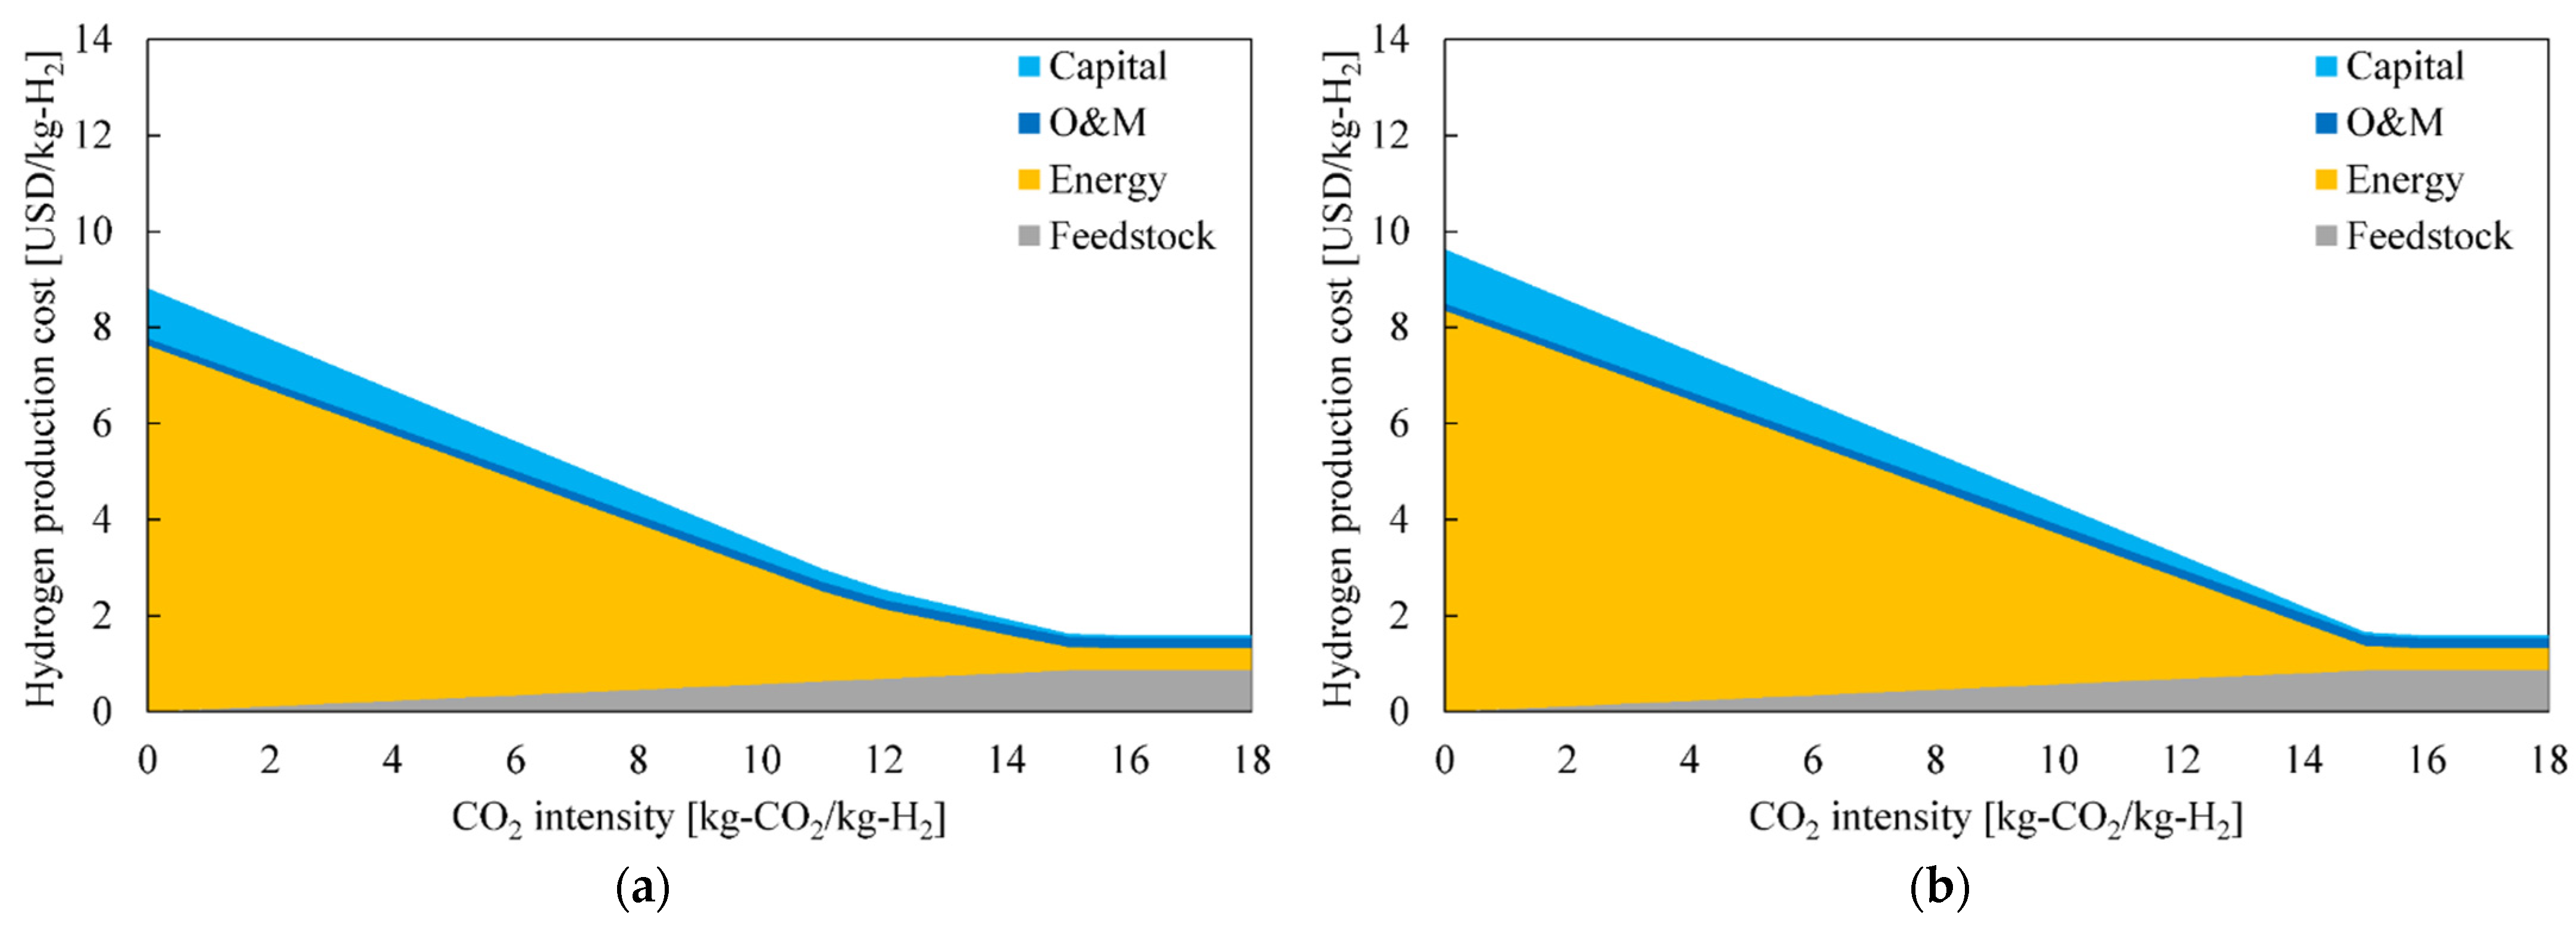
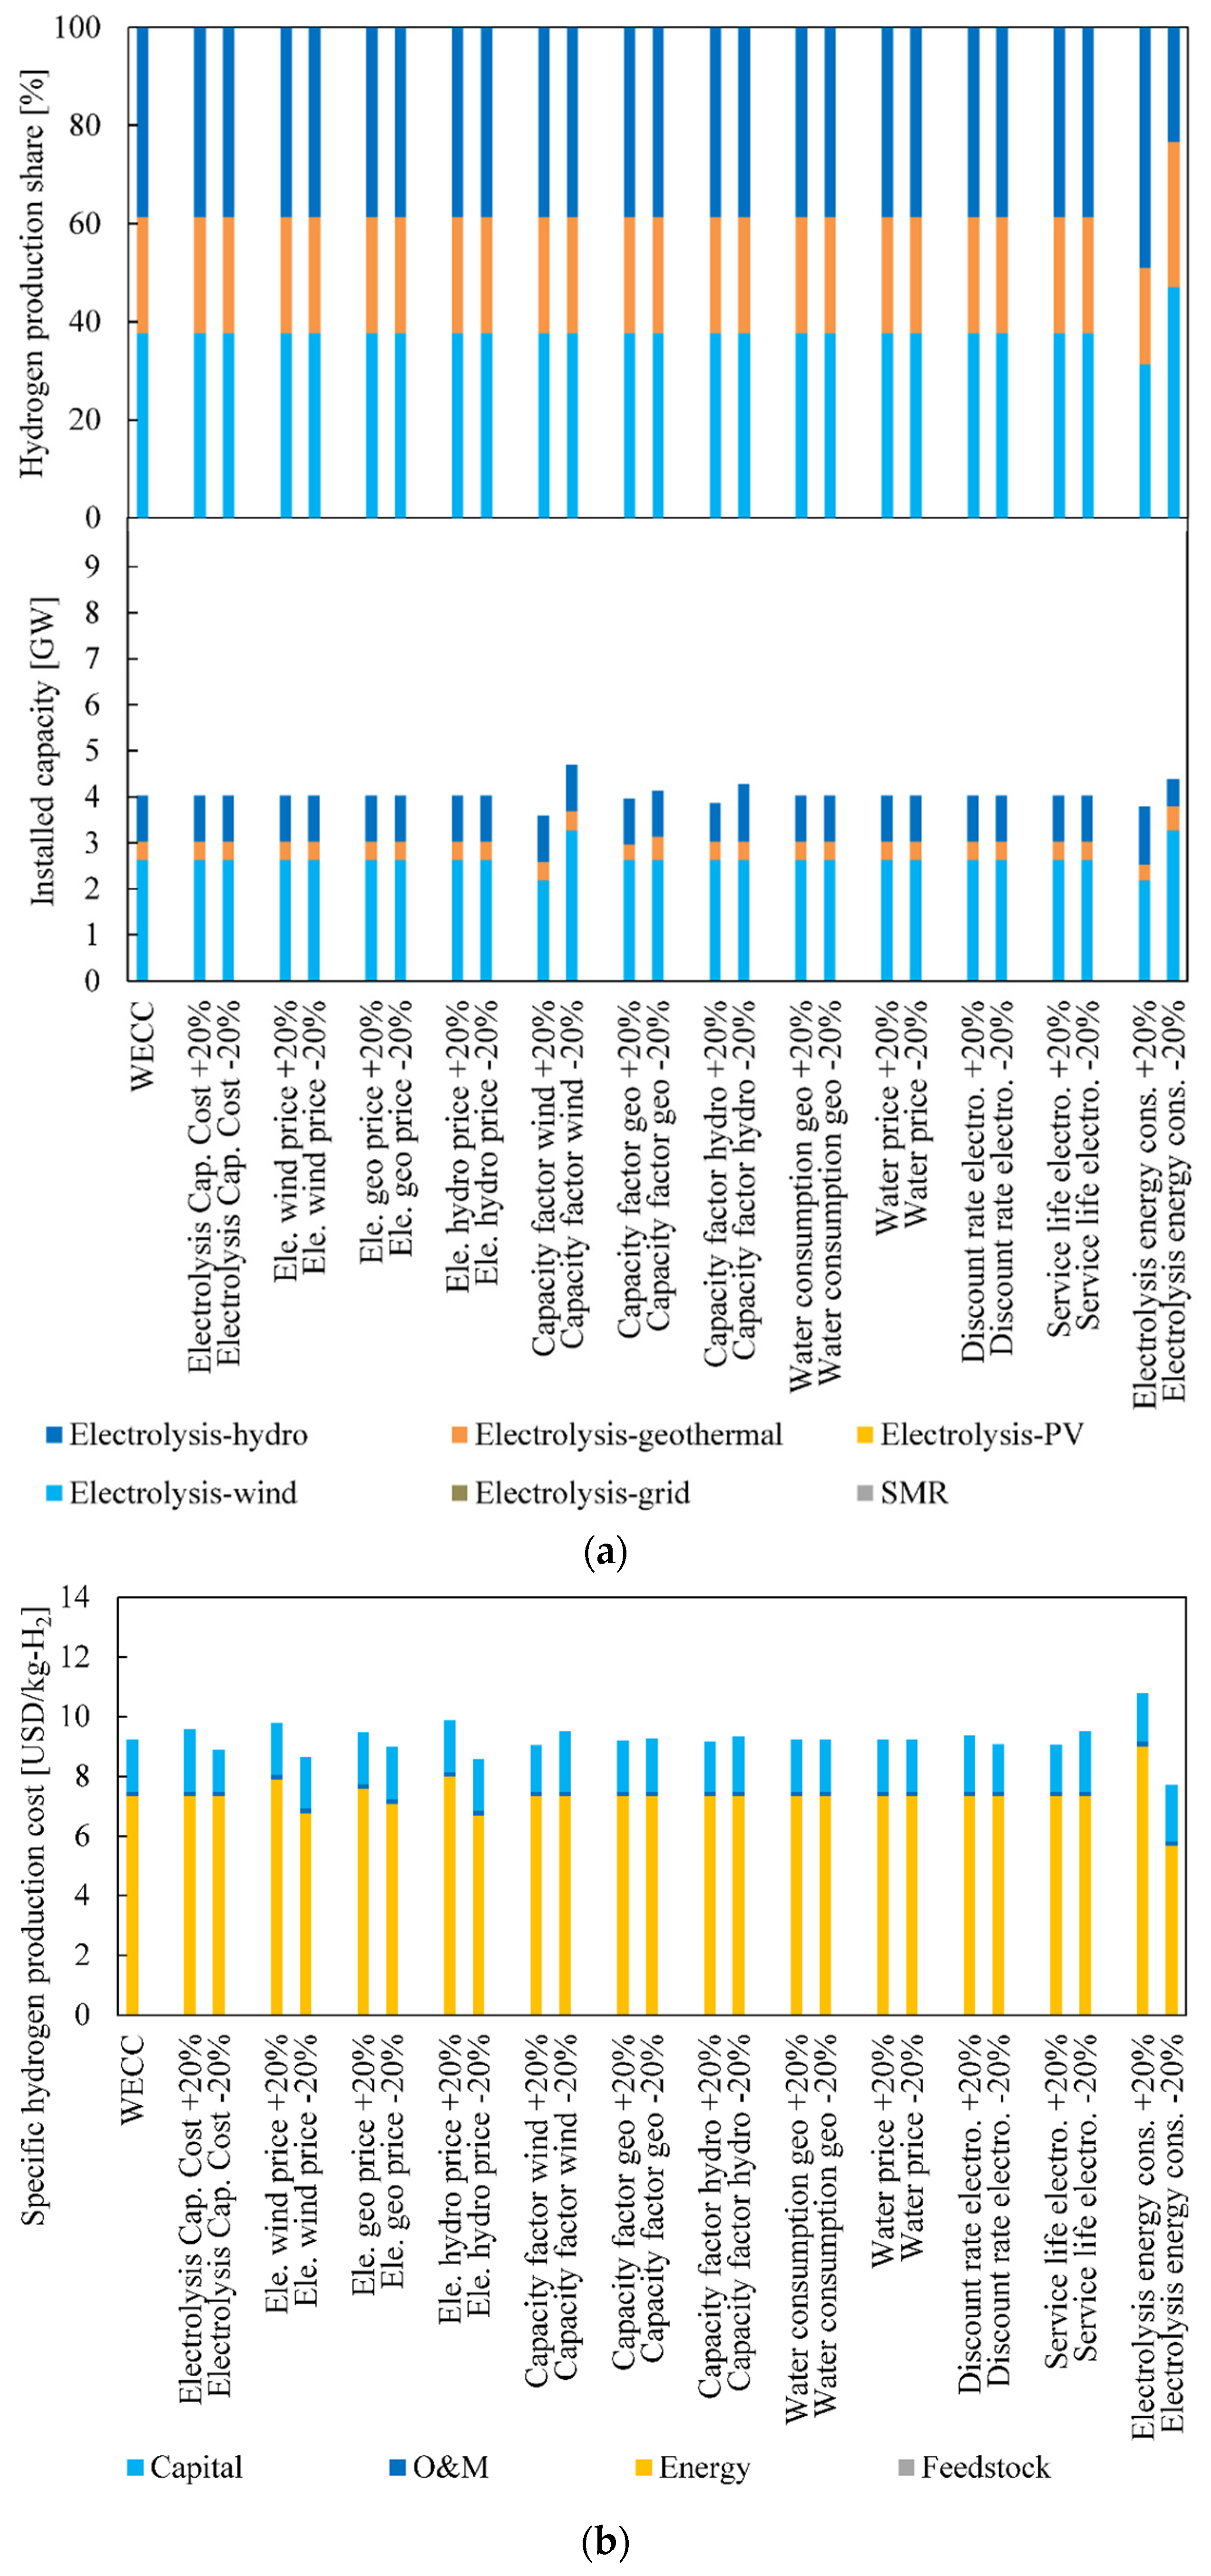
Table 1.
Main characteristics of previous studies regarding the hydrogen supply chain and energy systems assessment considering the Water-Energy-Carbon nexus and cost.
Table 1.
Main characteristics of previous studies regarding the hydrogen supply chain and energy systems assessment considering the Water-Energy-Carbon nexus and cost.
| Lead Author | Year | Hydrogen Production | Water-Energy Nexus | National/ Regional Scale | Aspects Considered in the Design/Assessment | |||
|---|---|---|---|---|---|---|---|---|
| Cost | Energy Use | Water Use | CO2 Emissions | |||||
| De-León Almaraz [15] | 2015 | ✓ | ✓ | ✓ | ✓ | ✓ | ||
| Shibata [16] | 2015 | ✓ | ✓ | ✓ | ✓ | |||
| Samsatli [17] | 2016 | ✓ | ✓ | ✓ | ✓ | ✓ | ||
| Reuß [18] | 2019 | ✓ | ✓ | ✓ | ✓ | ✓ | ||
| Caglayan [19] | 2021 | ✓ | ✓ | ✓ | ✓ | |||
| Weimann [20] | 2021 | ✓ | ✓ | ✓ | ✓ | |||
| Suleman [21] | 2016 | ✓ | ✓ | ✓ | ✓ | |||
| Gabrielli [22] | 2020 | ✓ | ✓ | ✓ | ✓ | ✓ | ✓ | |
| Spang [9] | 2014 | ✓ | ✓ | ✓ | ✓ | |||
| Chen [23] | 2018 | ✓ | ✓ | ✓ | ✓ | |||
| Larsen [24] | 2019 | ✓ | ✓ | ✓ | ✓ | |||
| Nouri [25] | 2019 | ✓ | ✓ | ✓ | ✓ | |||
| Jin [26] | 2021 | ✓ | ✓ | ✓ | ✓ | |||
| Tovar-Facio [27] | 2021 | ✓ | ✓ | ✓ | ✓ | ✓ | ✓ | |
| This research | 2022 | ✓ | ✓ | ✓ | ✓ | ✓ | ✓ | ✓ |
Table 2.
Weighting coefficients in each scenario.
| Category | Scenario | |||
|---|---|---|---|---|
| Low-Cost | Low Energy Use | Water-Energy-Carbon | Water-Energy-Carbon-Cost | |
| Energy consumption | 0 | 1.00 | 0.333 | 0.250 |
| Water consumption | 0 | 0 | 0.333 | 0.250 |
| CO2 emissions | 0 | 0 | 0.333 | 0.250 |
| Cost | 1.00 | 0 | 0 | 0.250 |
Table 3.
Energy consumption factors for feedstock production and feedstock consumption factors for feedstock production.
Table 3.
Energy consumption factors for feedstock production and feedstock consumption factors for feedstock production.
| Feedstock | Energy Consumption Factor [MJ/Unit a] | Feedstock Consumption Factor | |
|---|---|---|---|
| Water [L/Unit] | Natural Gas [kg/Unit] | ||
| Natural gas | 3.190 b | 0.221 d | 0.060 b |
| Water | 3.195 c | 73 e | 0 f |
a Units for feedstock are kg for natural gas and m3 for water. b Source: Ruth et al. [8]. c Source: Wakeel et al. [37]. d Source: Spang et al. [9]. Value converted to mass basis using a Higher Heating Value for natural gas of 55.2 MJ/kg [38]. e Accounting only for water distribution losses using data from [39]. f Assuming all energy consumed in water production comes from grid electricity.
Table 4.
Maximum amount of energy carrier available, energy consumption factors for energy carrier production and feedstock consumption factors for energy carrier production.
Table 4.
Maximum amount of energy carrier available, energy consumption factors for energy carrier production and feedstock consumption factors for energy carrier production.
| Energy Carrier | Availability [PJ/Year] | Energy Consumption Factor [MJ/MJ] | Feedstock Consumption Factor | |
|---|---|---|---|---|
| Water [L/MJ] | Natural Gas [kg/MJ] | |||
| Natural gas | 110 a | 0.066 g | 0.004 m | 0.0012 g |
| Electricity-wind | 22.1 b | 1.857 h | 0 m | 0 |
| Electricity-PV | 132 c | 6.042 i | 0.006 m | 0 |
| Electricity-grid | 1444 d | 1.530 j | 0.632 n | 0 p |
| Electricity-geothermal | 13.9 e | 7.333 k | 0.487 m | 0 |
| Electricity-hydro | 420 f | 0.294 l | 4.627 o | 0 |
a Natural gas yearly availability of 2.29 Mt/year converted to energy basis using a Lower Heating Value of 48.2 MJ/kg [38]. b Assuming all installed capacity for wind power plants in Japan of 3500 MW [35] can be used for hydrogen production with a capacity factor of 0.20 [40]. c Assuming all the non-residential PV installed capacity in Japan of 34,770 MW [35] can be used for hydrogen production with a capacity factor of 0.12 [40]. d Assuming maximum 10% of grid electricity consumption in manufacturing [41] can be used for hydrogen production. Value corrected using the energy consumption factor for grid electricity production. e Assuming all installed capacity for geothermal power plants in Japan of 550 MW [35] can be used for hydrogen production with a capacity factor of 0.80 [40]. f Assuming all hydroelectricity produced in Japan [35] can be used for hydrogen production. Value corrected using the energy consumption factor for grid electricity production. g Estimated using energy conversion efficiency data from [8]. h Estimated using energy conversion efficiency data from [12]. i Estimated using energy conversion efficiency data from [11]. j Estimated using electricity generation mix data from [10]; energy conversion efficiency data from [11,12,13,42,43,44,45]. k Estimated using energy conversion efficiency data from [13]. l Estimated using energy conversion efficiency data from [43]. m Source: Spang et al. [9]. n Estimated using electricity generation mix data from [10]; water consumption factors for electricity production from [9,14]. o Source: Lee et al. [14]. p Assuming only imported natural gas is used in generation of grid electricity.
Table 5.
Hydrogen production routes characteristics.
| Hydrogen Production Route | Specific Energy Consumption [MJ/kg H2] | Yield [kg H2/Unit] | Capacity Factor [-] | ||||||
|---|---|---|---|---|---|---|---|---|---|
| Natural Gas | Electricity Wind | Electricity Solar PV | Electricity Grid | Electricity Geothermal | Electricity Hydro | Natural Gas | Water | ||
| SMR | 46.3 a | 0 | 0 | 2.05 c | 0 | 0 | 0.500 d | 110 e | 0.90 c |
| Electrolysis-wind | 0 | 195 b | 0 | 0 | 0 | 0 | 0 | 64.4 e | 0.19 f |
| Electrolysis-solar PV | 0 | 0 | 195 b | 0 | 0 | 0 | 0 | 64.4 e | 0.12 f |
| Electrolysis-grid | 0 | 0 | 0 | 195 b | 0 | 0 | 0 | 64.4 e | 0.97 f |
| Electrolysis-geothermal | 0 | 0 | 0 | 0 | 195 b | 0 | 0 | 64.4 e | 0.78 f |
| Electrolysis-hydro | 0 | 0 | 0 | 0 | 0 | 195 b | 0 | 64.4 e | 0.52 f |
a Estimated using natural gas consumption for SMR from [7]; assuming a Lower Heating Value of 48.2 MJ/kg [38]. b Source: Parkinson et al. [4]. c Source: Ruth et al. [8]. d Source: Jaber et al. [7]. e Source: Elgowainy et al. [46]. f Estimated as the product of the capacity factor for centralized electrolysis of 0.97 [8] and the capacity factor for renewable electricity from METI [40]: wind electricity, 0.2; solar PV electricity, 0.12; geothermal electricity, 0.80; and 0.45 for large hydropower and 0.60 for small and medium hydropower. Combined hydropower capacity factor was estimated using data for hydroelectricity generation from METI [47]. A capacity factor of 1 was assumed for grid electricity.
Publisher’s Note: MDPI stays neutral with regard to jurisdictional claims in published maps and institutional affiliations. |
© 2022 by the authors. Licensee MDPI, Basel, Switzerland. This article is an open access article distributed under the terms and conditions of the Creative Commons Attribution (CC BY) license (https://creativecommons.org/licenses/by/4.0/).
Share and Cite
MDPI and ACS Style
González Palencia, J.C.; Itoi, Y.; Araki, M. Design of a Hydrogen Production System Considering Energy Consumption, Water Consumption, CO2 Emissions and Cost. Energies 2022, 15, 7938. https://0-doi-org.brum.beds.ac.uk/10.3390/en15217938
AMA Style
González Palencia JC, Itoi Y, Araki M. Design of a Hydrogen Production System Considering Energy Consumption, Water Consumption, CO2 Emissions and Cost. Energies. 2022; 15(21):7938. https://0-doi-org.brum.beds.ac.uk/10.3390/en15217938
Chicago/Turabian StyleGonzález Palencia, Juan C., Yuta Itoi, and Mikiya Araki. 2022. "Design of a Hydrogen Production System Considering Energy Consumption, Water Consumption, CO2 Emissions and Cost" Energies 15, no. 21: 7938. https://0-doi-org.brum.beds.ac.uk/10.3390/en15217938
Note that from the first issue of 2016, this journal uses article numbers instead of page numbers. See further details here.