Article

Safety Issues of a Hydrogen Refueling Station and a Prediction for an Overpressure Reduction by a Barrier Using OpenFOAM Software for an SRI Explosion Test in an Open Space

Korea Atomic Energy Research Institute, Daejeon 34057, Korea
*
Author to whom correspondence should be addressed.
Submission received: 16 September 2022 / Revised: 8 October 2022 / Accepted: 10 October 2022 / Published: 13 October 2022
(This article belongs to the Special Issue Advances in Hydrogen Energy Ⅱ)

Abstract

:
Safety issues arising from a hydrogen explosion accident in Korea are discussed herein. In order to increase the safety of hydrogen refueling stations (HRSs), the Korea Gas Safety Corporation (KGS) decided to install a damage-mitigation wall, also referred to as a barrier, around the storage tanks at the HRSs after evaluating the consequences of hypothetical hydrogen explosion accidents based on the characteristics of each HRS. To propose a new regulation related to the barrier installation at the HRSs, which can ensure a proper separation distance between the HRS and its surrounding protected facilities in a complex city, KGS planned to test various barrier models under hypothetical hydrogen explosion accidents to develop a standard model of the barrier. A numerical simulation to investigate the effect of the recommended barrier during hypothetical hydrogen explosion accidents in the HRS will be performed before installing the barrier at the HRSs. A computational fluid dynamic (CFD) code based on the open-source software OpenFOAM will be developed for the numerical simulation of various accident scenarios. As the first step in the development of the CFD code, we conducted a hydrogen vapor cloud explosion test with a barrier in an open space, which was conducted by the Stanford Research Institute (SRI), using the modified XiFoam solver in OpenFOAM-v1912. A vapor cloud explosion (VCE) accident may occur due to the leakage of gaseous hydrogen or liquefied hydrogen owing to a failure of piping connected to the storage tank in an HRS. The analysis results using the modified XiFoam predicted the peak overpressure variation from the near field to the far field of the explosion site through the barrier with an error range of approximately ±30% if a proper analysis methodology including the proper mesh distribution in the grid model is chosen. In addition, we applied the proposed analysis methodology using the modified XiFoam to barrier shapes that varied from that used in the test to investigate its applicability to predict peak overpressure variations with various barrier shapes. Through the application analysis, we concluded that the proposed analysis methodology is sufficient for evaluating the safety effect of the barrier, which will be recommended through experimental research, during VCE accidents at the HRSs.

1. Introduction

Hydrogen has been recently proposed as one of the future energy resources in Korea, which is similar to global energy trends [1,2,3], because hydrogen energy can promote a clean air environment and provide an alternate energy source in preparation for an oil energy crisis. In order to establish a hydrogen energy system to be used for a more economic society, an infrastructure network capable of transferring hydrogen from manufactures to consumers must be appropriately constructed. In particular, hydrogen refueling stations (HRSs) for public transit should be located in downtown areas and suburbs to make hydrogen a convenient fuel for vehicles. Thus, the Korean government passed a law to promote the hydrogen economy and hydrogen safety management and proposed a roadmap to activate the hydrogen economic system [4,5]. According to this plan, approximately 1200 HRSs, which can support approximately 80,000 taxies, 40,000 buses, and 30,000 trucks, will be constructed for the public transport system as part of the hydrogen energy by 2040. In addition, approximately 40 liquefied hydrogen (LH2) stations will be built by 2025, as these can supply more hydrogen on a smaller scale [6] when compared to a gaseous hydrogen station, which may be a good strategy for a small country such as Korea.
However, implementing the plan has been somewhat delayed because people living around HRS sites to be built in cities require verification of the safety of the use of hydrogen energy. They may fear the hydrogen station and consider that an explosion accident could occur, that which occurred at a compressed storage facility containing hydrogen gas transferred from the water electrolysis facility in Gangwon province in Korea [7]. As a result of this accident, the Korea Gas Safety Corporation (KGS) published specific technical regulations for water electrolysis facilities to ensure their safe construction and operation [8]. Moreover, KGS decided to reinforce a protection method to prevent damage propagation, such as blast waves and debris scattering, as much as possible when a hydrogen explosion accident occurs around a compressed hydrogen storage tank at an HRS [9]. One such reinforcement method is to install an effective damage-mitigation wall, also known as a barrier, around the storage tanks at the HRSs after evaluating the consequences of hypothetical hydrogen explosion accidents based on the characteristics of each HRS.
However, current technical regulations for HRSs only require the installation of a barrier when the separation distance between the storage tank or processing facility at the HRS and protected surrounding facilities, such as a school, house, and other building, does not meet the requirements of the recommended separation distance [10,11,12,13]. Furthermore, current regulations simply propose a basic barrier model with the minimum requirement of a geometric configuration, minimal material specifications, and supporting materials on the ground. Thus, it is necessary to devise new installation criteria for these barriers that include the extent of the damage reduction and reduced separation distances due to the barrier on the basis of various tests using several recommended barrier models for HRSs. An experiment is being conducted according to various accident scenarios as determined by a quantitative risk analysis [9].
To evaluate the effect of a barrier under a hypothetical hydrogen explosion before installing it at an HRS, a computational fluid dynamic (CFD) code using the open-source software OpenFOAM [14] will be developed to simulate the barrier effect so as to decrease damage propagation, after which the developed CFD code will be freely released to engineers who work on the safety of HRSs [9]. In addition, this CFD code can be used to partly offset the limitations of the experimental research on the installation criteria of the barriers because a gas explosion test generally requires a secured space, precise measurements, and safe experimentation. As the first step of the development of the CFD code, we decided to conduct a hydrogen vapor cloud explosion test with a barrier in an open space [15,16], as performed by the Stanford Research Institute (SRI), using a modified XiFoam solver on the basis of OpenFOAM-v1912 [17] to see whether the CFD code using the open-source software can accurately simulate the peak overpressure reduction caused by the barrier. According to CFD results published on hydrogen safety, a commercial CFD code has been widely used to predict the propagation of pressure waves due to a gas explosion, with the results then used to evaluate the integrity of a structure or the separation distance [18,19,20,21]. However, a CFD analysis using open-source software has not yet been actively conducted as part of an evaluation of the safety related to hydrogen energy facilities. Therefore, the proposed analysis methodology for a physical, numerical, and grid model in this study may be effective when used as a basic guideline for a CFD analysis using open-source software to simulate the effects of the proposed barrier models under a vapor cloud explosion (VCE) accident, which may occur due to the leakage of gaseous hydrogen or liquefied hydrogen owing to the failure of piping connected to a storage tank at an HRS [22,23,24].

2. Current Regulations on Barriers at HRSs

A barrier is currently installed around compressed hydrogen storage tanks or processing facilities producing hydrogen gas at HRSs according to the technical regulations when the separation distance requirement between the HRS and protected facilities located around the HRS is not met, as shown in Table 1 [10,11,12]. The recommended separation distance in the regulations varies according to the capacity of the storage tank or the processing facility and the level of the protected facilities. In Table 1, the first class of protected facilities includes kindergartens, schools, hospitals, libraries, and buildings with an internal area greater than 1000 m2 [13]. The second class includes houses and buildings with an internal area of 100 to 1000 m2 [13]. When the barrier is installed at the HRS, its height and width are determined based on the linearly geometric relationship from the storage tank or the processing facility relative to the protected facility, as shown in Figure 1a,b, for preventing direct arrival of the damage from the hydrogen explosion site to the protected facility. The upper part of the barrier may be tilted at an angle within 90 degrees to cover the top surface of the storage tank with higher pressure when the barrier is installed around the storage tank (Figure 1c) [10,11,12].

3. SRI Hydrogen Explosion Test

3.1. Test Facility and Conditions

SRI performed an explosion test in an open space using a hydrogen–air mixture volume of 5.2 m3 (2.2 m × 2.2 m × 1.07 m) under a stoichiometric condition of 30 vol. % by varying the ignition method and existence of a barrier, as shown in Figure 2 and Table 2 [15,16]. A gas-mixing system consisting of small fans and sensors was used to create the stoichiometric condition of the hydrogen–air mixture in a tent region, whose boundary was enclosed by a thin plastic film. The barrier to reduce the peak overpressure was located 4 m from the right boundary of the tent, and its dimensions were as follows: a height of 2 m, width 10 m, and thickness 0.1 m. The experiment was initiated by igniting the hydrogen–air mixture with an electric spark device or a high-explosive material, in this case, 10 g of C-4 2.5 cm above the center of the bottom plate in the tent. The equivalent energy transferred by the electric spark for 2 ms was 40 J, and that of the explosive material was 5.2 × 10⁴ J. The plastic film was quickly broken by a cutting machine along a supporting steel tube just before the start of the ignition. In these tests, an obstacle to accelerate the hydrogen flame in the tent was not installed. The overpressures were measured 2 m behind (P2) and 2 m in front of (P4) the barrier using a Kistler pressure transducer to ascertain the barrier effect on the overpressure reduction, as shown in Figure 2, as well as the effect on the overpressure inside the tent (P3). The overpressure was also measured 11 m, 21 m, and 41 m from the ignition point. In addition, the flame front time of arrival (TOA) in the tent was measured using six ionization pins installed along the horizontal and vertical directions from the ignition point, as shown in Table 3.

3.2. Test Results

The overpressure data from the tests showed that the phenomenon of a hydrogen explosion varied greatly according to the ignition method used (Figure 3). The test ignited by the electric spark induced a deflagration with an overpressure increase of approximately 5.6 to 7.8 kPa for 50 ms in the tent, whereas the test started by the high-explosive material caused a detonation of approximately 1300 to 1350 kPa for 0.5 ms. The peak overpressure of 4.93 kPa at P4 was reduced to 1.75 kPa at P2 through the barrier during the deflagration test, and the peak overpressure of 231 kPa at P4 was decreased to 16.4 kPa at P2 during the detonation test. According to the measured data, the overpressure reduction ratio by the barrier in the range of 4 m was increased from approximately 64.6% to 93.7% as the explosion phenomenon changed from the deflagration to the detonation. The measured flame front TOAs and overpressure at P3 in Test 4-02 showed that the flame front arrived at all ionization pins in approximately 32 ms, whereas the peak overpressure was recorded at 51.4 ms as approximately 6.72 kPa. This time difference may mean that the combustion of the hydrogen–air mixture in the tent was completed at approximately 51.4 ms because the flame initially propagated along the horizontal and vertical directions, forming a semi-spherical combustion region, as shown in Figure 4b. The pressure increase feature at P3 in the tent affected the shape of the pressure wave from the tent to the far field through the barrier (Figure 4c), which was a typical pressure wave shape during the deflagration phenomenon. Therefore, we choose Test 4-02 as the first set of validation data for the modified XiFoam solver to predict the overpressure reduction by the barrier because the deflagration may be the dominant explosion phenomenon when a hydrogen vapor cloud explodes in an air environment [23].

4. Development of an Analysis Methodology

The XiFoam solver in OpenFOAM-v1912, which was modified by KAERI [17], was used to propose an analysis methodology initially for predicting the propagation of a pressure wave from the explosion site to the air environment through the barrier during a hydrogen deflagration on the basis of the SRI Test 4-02. After the test data were validated, a sensitivity analysis using the modified XiFoam solver was conducted to assess the changes in the geometry configurations of the barrier relative to that used in the SRI test, so as to determine the applicability of this tool to the various barrier models during VCE accidents at HRSs.

4.1. Modification of the XiFoam Solver

The XiFoam solver, which was developed based on the flamelet model with a one-step chemical reaction of a fuel–air mixture, as expressed by Equation (1) for a compressible premixed combustion flow, was modified to account for the radiative heat transfer phenomenon by water vapor to consider the effect of humidity on the combustion of hydrogen in an air environment [17,25,26]. We added a transport model for the initial water vapor in the hydrogen–air mixture and for the P-1 radiation heat transfer into the version of XiFoam solver released in OpenFOAM v-1912 [14]. However, only the radiative heat transfer from the combusted gas to the bottom wall in the tent was calculated using Equation (2) in this analysis because there was no humidity data in the initial gas concentration for the hydrogen–air mixture in Test 4-02 [16]. In Equation (2), qr represents the radiation heat flux, a is the absorption coefficient, e is the emission coefficient, and E is the emission contribution. The calculated combustion energy and radiative heat energy were used as the heat source or sink in the energy equation.
H2 + 1/2O2 + 1.82N2 → H2O + 1.82N2 + 0.242 MJ
· q r = a G r 4 e σ S B T 4 + E
In XiFoam, the propagation of the flame front in the hydrogen–air mixture was simulated using the transport equation of the combustion progress variable “b” (Equation (3)), which ranges from 0 to 1 according to the combustion status. If the regress variable b is 1, it indicates an unburned state and may be decreased to 0 as combustion takes place. The source term of the b transport equation, the right-hand side of Equation (3), representing the flame propagation speed includes flame wrinkling (ξ) to consider the turbulence effect on the propagation of the flame [17,25,26]. Flame wrinkling can be expressed as the ratio of the turbulent flame speed (St) and the laminar flame speed (Su) via Equation (4). The turbulent flame speed can be expressed by adding the turbulent fluctuation velocity (u’) to the laminar flame speed, as expressed by Equation (5) [27,28]. The solution of flame wrinkling in the combustion flow field can be obtained by solving the transport equations, from Equations (6) to (12), to predict the flame wrinkling variations precisely due to the generation (G) and removal (R) effects, which are affected by the turbulence flow field [25,26]. In Equation (6), Us is the average velocity at the flame surface, and the final term is related to the resolved strain rates σs and σt [26]. Rη in Equation (10) is the Kolmogorov Reynolds number, and n in Equations (11) and (12) is the flame propagation direction [26].
t ρ ¯ b + · ρ ¯ U b · μ t S c t b = ρ ¯ u S u ξ b
ξ = S t S u
St = Su + u
ξ t + U s · ξ = G ξ R ξ 1 + max σ s σ t , 0 ξ
G = R ξ e q 1 ξ e q
R = 0.28 τ ξ e q ξ e q * 1
ξ e q = 1 + 2 1 b ξ e q * 1
ξ e q * = 1 + 0.62 u S u R η
σ s = · U s n ^ · U s · n ^ ξ + ξ + 1 · S u n ^ n ^ · S u n ^ · n ^ 2 ξ
σ t = · U s + S u ξ n ^ n ^ · U s + S u ξ n ^ · n ^
The laminar flame speed was effectively modeled by Equations (13) to (15) to consider the changes in the temperature and pressure in the unburnt gas region as combustion progresses on the basis of the referenced temperature of 300 K and pressure of 0.1 MPa in the hydrogen–air mixture [17,29]. In Equation (13), Su0 is the laminar flame speed of 2.1 m/s at the reference condition, and φ is the fuel equivalent ratio [27,28,29].
Su = Su0 (Tu/T0)α (P/P0)β
α = 2.18 − 0.8(φ − 1)
β = −0.16 + 0.22(φ − 1)
To calculate the thermal-hydraulic flow field connected to hydrogen combustion, the governing equations of the mass conservation, Navier–Stokes momentum, total energy, and species transport were solved using a PIMPLE algorithm [14]. A turbulent flow field was simulated using the k-ω Shear Stress Transport (SST) model, which combines the advantages of k-ω in the near wall region and the k-ε model for the rest of the flow [14,30]; the applicability of this model to a hydrogen combustion flow was verified through analysis results from the THAI tests [17]. In Equations (16) to (18), β* and β are numerical constants and F1 is a blending function in which 1 indicates near the wall and 0 represents away from the wall [14,17,30]. A time step of approximately 1.0 × 10⁻⁶ s to 1.0 × 10⁻⁴ s in the transient calculation time of 0.11 s was used to simulate the propagation of the pressure wave accurately through the barrier while holding the Courant––Friedrichs–Lewy (CFL) number below 0.8 on the basis of earlier CFD results [18,19,20,21]. When applying these models and the time step size in the transient calculation, the residuals of the mass, momentum, total energy, turbulent kinetic energy, turbulent dissipation, and combustion progress equations converged to an error below 1.0 × 10⁻⁶.
D D t ρ k = · ρ D k k + ρ G 2 3 ρ k · U ρ β * ω k + S k
D D t ρ ω = · ρ D ω ω + ρ γ G ν 2 3 ρ γ ω · U ρ β ω 2 ρ F 1 1 C D k ω + S ω
ν t = a 1 k max a 1 ω , b 1 F 23 S

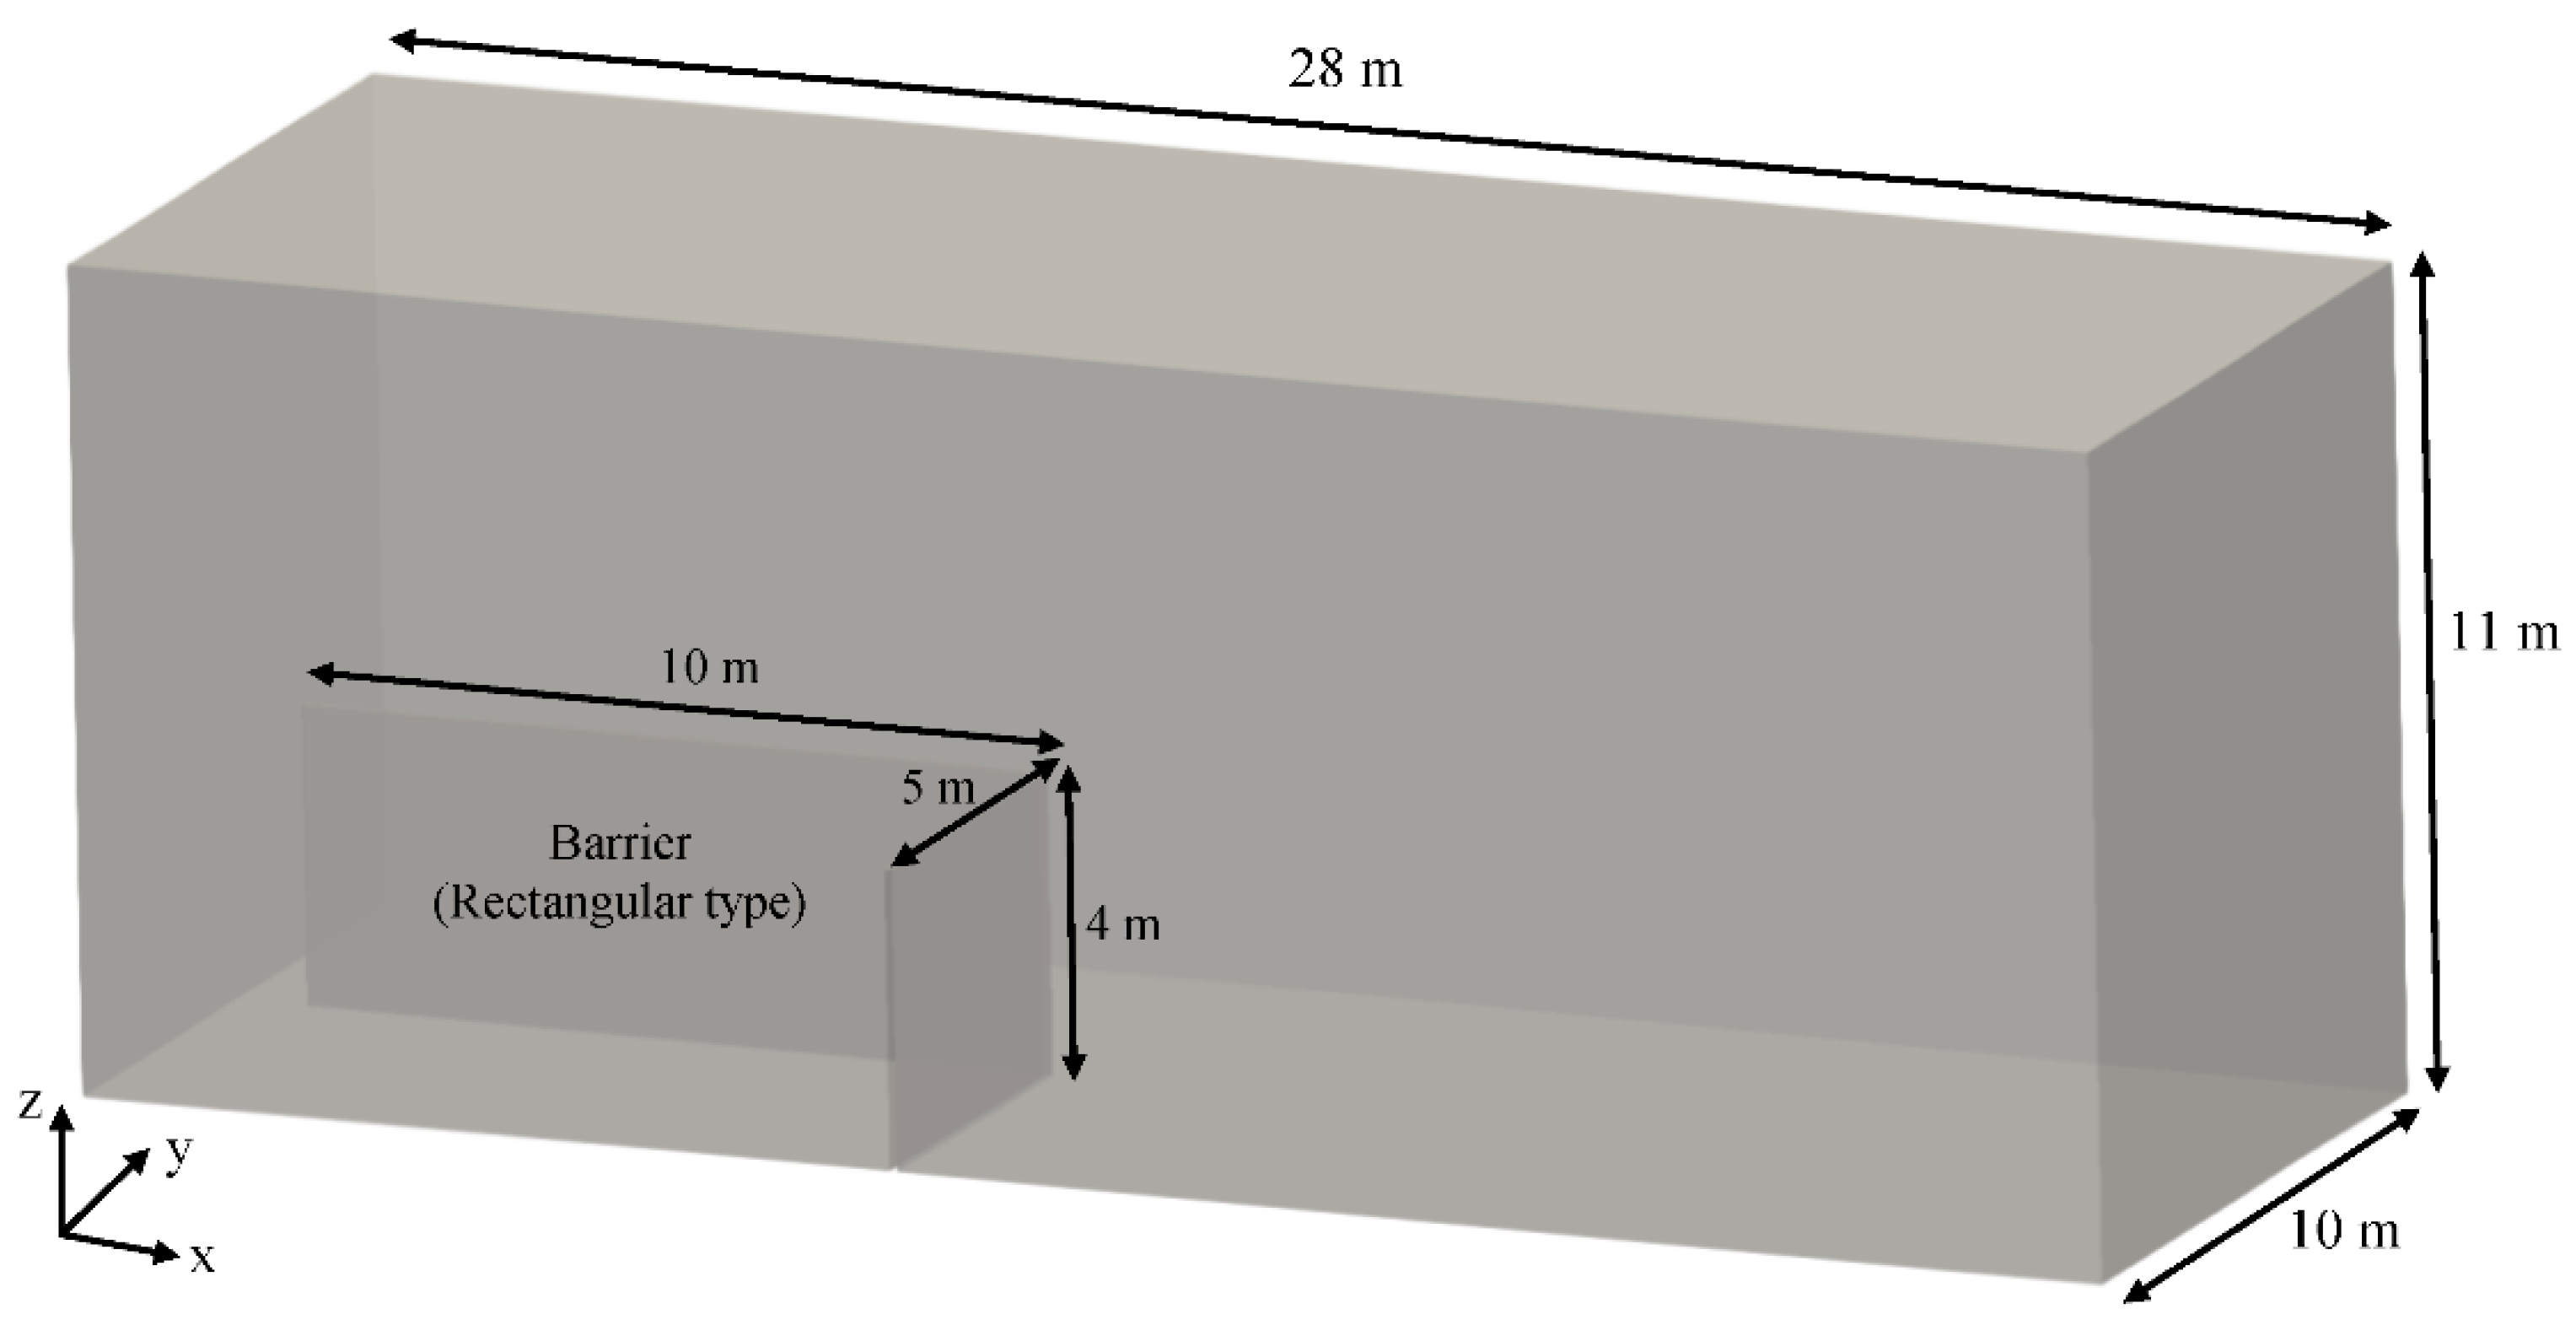
4.2. Grid Model with Initial and Boundary Conditions

A three-dimensional and half-symmetric grid model to simulate the tent, barrier, and air environment to 22 m from the ignition point was developed, as shown in Figure 5a, on the basis of the SRI’s test facility [16] and the separation distance requirement in the KGS codes [10,11]. This was carried out using the blockMesh software in OpenFOAM. In total, 3,029,280 hexahedral mesh cells were generated as the base case of the grid model considering the grid quality criteria of the best practice guidelines and the grid models used for the hydrogen deflagration phenomenon [18,19,20,21,31,32,33,34]. In the base grid model, a dense mesh cell distribution with an approximate cell length of 1.5 cm was located around the ignition point in the tent region (Figure 5b, Table 4) to resolve the rapid flame propagation issue owing to the turbulence generated from the spark ignition process. A coarse mesh distribution with a cell length of approximately 15 to 50 cm was generated at the region far from the tent to ensure the propagation of the pressure wave and to reduce the computational time. An intermediate mesh distribution with a cell length of approximately 5 to 10 cm was generated around the barrier to simulate the pressure wave propagation after the collision with the barrier. The shape of the barrier was simplified to a rectangular box by neglecting the vertical supporting parts to reduce the required grid generation effort because its doing so did not induce significant distortion of the CFD results in the prediction of pressure wave propagation.
To investigate the effect of the mesh distribution on the pressure wave propagation in the CFD results, the cell length of approximately 15 to 50 cm in the far region from the tent region in the grid model was varied to 10 to 50 cm and from 20 to 50 cm, as shown in Table 4. The calculated maximum aspect ratios in the grid models were approximately 27 to 28 at the far field region; these were inevitably generated due to the use of different hexahedral cell lengths from the explosion site to the air environment in the rectangular grid model using the matched surface interface. These aspect ratios may be at an acceptable level when the time step size is properly chosen so as accurately to capture the pressure wave propagation [18,19,20,21,31,32,33,34]. The sensitivity calculation results can be used as a reference in a grid model to simulate hydrogen vapor cloud explosion accidents at HRSs; this can be performed by an engineer at the HRS site using OpenFOAM.
An open condition with the transmittance of a pressure wave [14] was assigned to all the surrounding surfaces except for the bottom and half-cut surfaces. This allows for the inflow and outflow of fluid through the surfaces. A symmetrical condition was applied to the half-cut surface in the grid model. A wall condition of 283.45 K was assigned to the surfaces of the barrier and the bottom of the grid model. Regarding the radiative heat transfer calculation, an emissivity value of 0.072 was utilized for the bottom wall in the tent region based on the radiative property table [35]. The wall functions to calculate the turbulence quantities of k and ω were kqRWallFunction and omegaWallFunction, respectively [14,17,36].
A hydrogen concentration of 29.9% for the hydrogen–air mixture in the tent region was assigned as the initial condition in terms of the corresponding mass fraction using the utility program of setFields in OpenFOAM, as shown in Table 5. In addition, the initial pressure and temperature for the tent region and the air environment were 101,325 Pa and 283.45 K, respectively, as also established with the setFields according to the SRI test conditions. The initial turbulence quantities of k and ω in the air environment for the k-ω SST model were assumed to be 1 × 10⁻² m2/s2 and 1 × 10⁻² s−1, respectively, considering the recorded wind information shown in Table 2. The initial turbulent fluctuation velocity (u’) of 7.5 m/s in the tent region, equivalent to 25% of the approximated turbulent flame speed of 29.9 m/s in the test, was assumed to compensate for the lack of turbulence generation when the flame passed over the location of the supporting bar, the mixing fan, and the cover box (Table 3) in the CFD analysis. These small structures in the tent region were not included in the grid model because we could not find dimensional information pertaining to them in the test report [15,16]. Furthermore, a very fine mesh model to resolve small structures in the tent region incurs considerable computational time, which is not appropriate when the purpose is to develop CFD code to be used by engineers at HRSs. The approximated turbulent flame speed was calculated using Equation (5) with the measured flame front TOAs, as shown in Figure 3a, and the distance from the ignition point to the ionization sensor locations (Table 3). The value of 25% for the initial turbulence fluctuation velocity in the tent region was determined through various numerical tests capable of accurately predicting the measured peak overpressure (P3) inside the tent.
The spark ignition model, previously developed based on other SRI test results [18], was used to simulate the ignition process for 2 ms by the electric spark device with an equivalent energy of 40 J in the test. Energy 40 J is very large when considering the ignition energy to start the hydrogen combustion [20,27,28]. The spark ignition model was represented as the activated spherical volume having an enlarged radius of 6 cm, pressure of 105 kPa (Ph), and temperature of 1000 K (Th) using setFields and ignitionSites in combustionProperties in OpenFOAM. The parameters of the radius, pressure, and temperature were obtained by conserving the energy of 40 J between the initial state of the hydrogen–air mixture (1 atm, 283.45 K) and the corresponding activated state, as expressed by Equations (19) and (20) [18]. During the derivation of Equation (19), the ideal gas law (P = ρRT) was used to generate the connected unknown variables of the pressure (Ph) and spherical volume (Vh) of the activated hydrogen–air mixture. In addition, we assumed turbulence intensity of 50% of the expansion velocity of the activated hydrogen–air mixture where turbulence generation fully took place during the ignition process [18]. The expansion velocity was defined as the ratio of the radius 6 cm of the activated spherical volume to the spark operation time of 2 ms. The value of 50% for the turbulent intensity was sourced from the measured turbulence intensity in a spark ignition engine [37], as there were no measured data in the SRI test. On the basis of this assumption for the turbulence generation during the spark ignition process, we obtained turbulent quantities of k = 337.5 m2/s2 and ω = 500 s−1. In these calculations, we also assumed that turbulent eddy generation in the spark ignition region was fully developed for 2 ms, after which it isotropically dissipated.
E s p a r k = m h C p ¯ T h T c = V h ρ h C p , h T h ρ c C p , c T c = V h R g P h C p , h P c C p , c
V h = 4 3 π r h 3

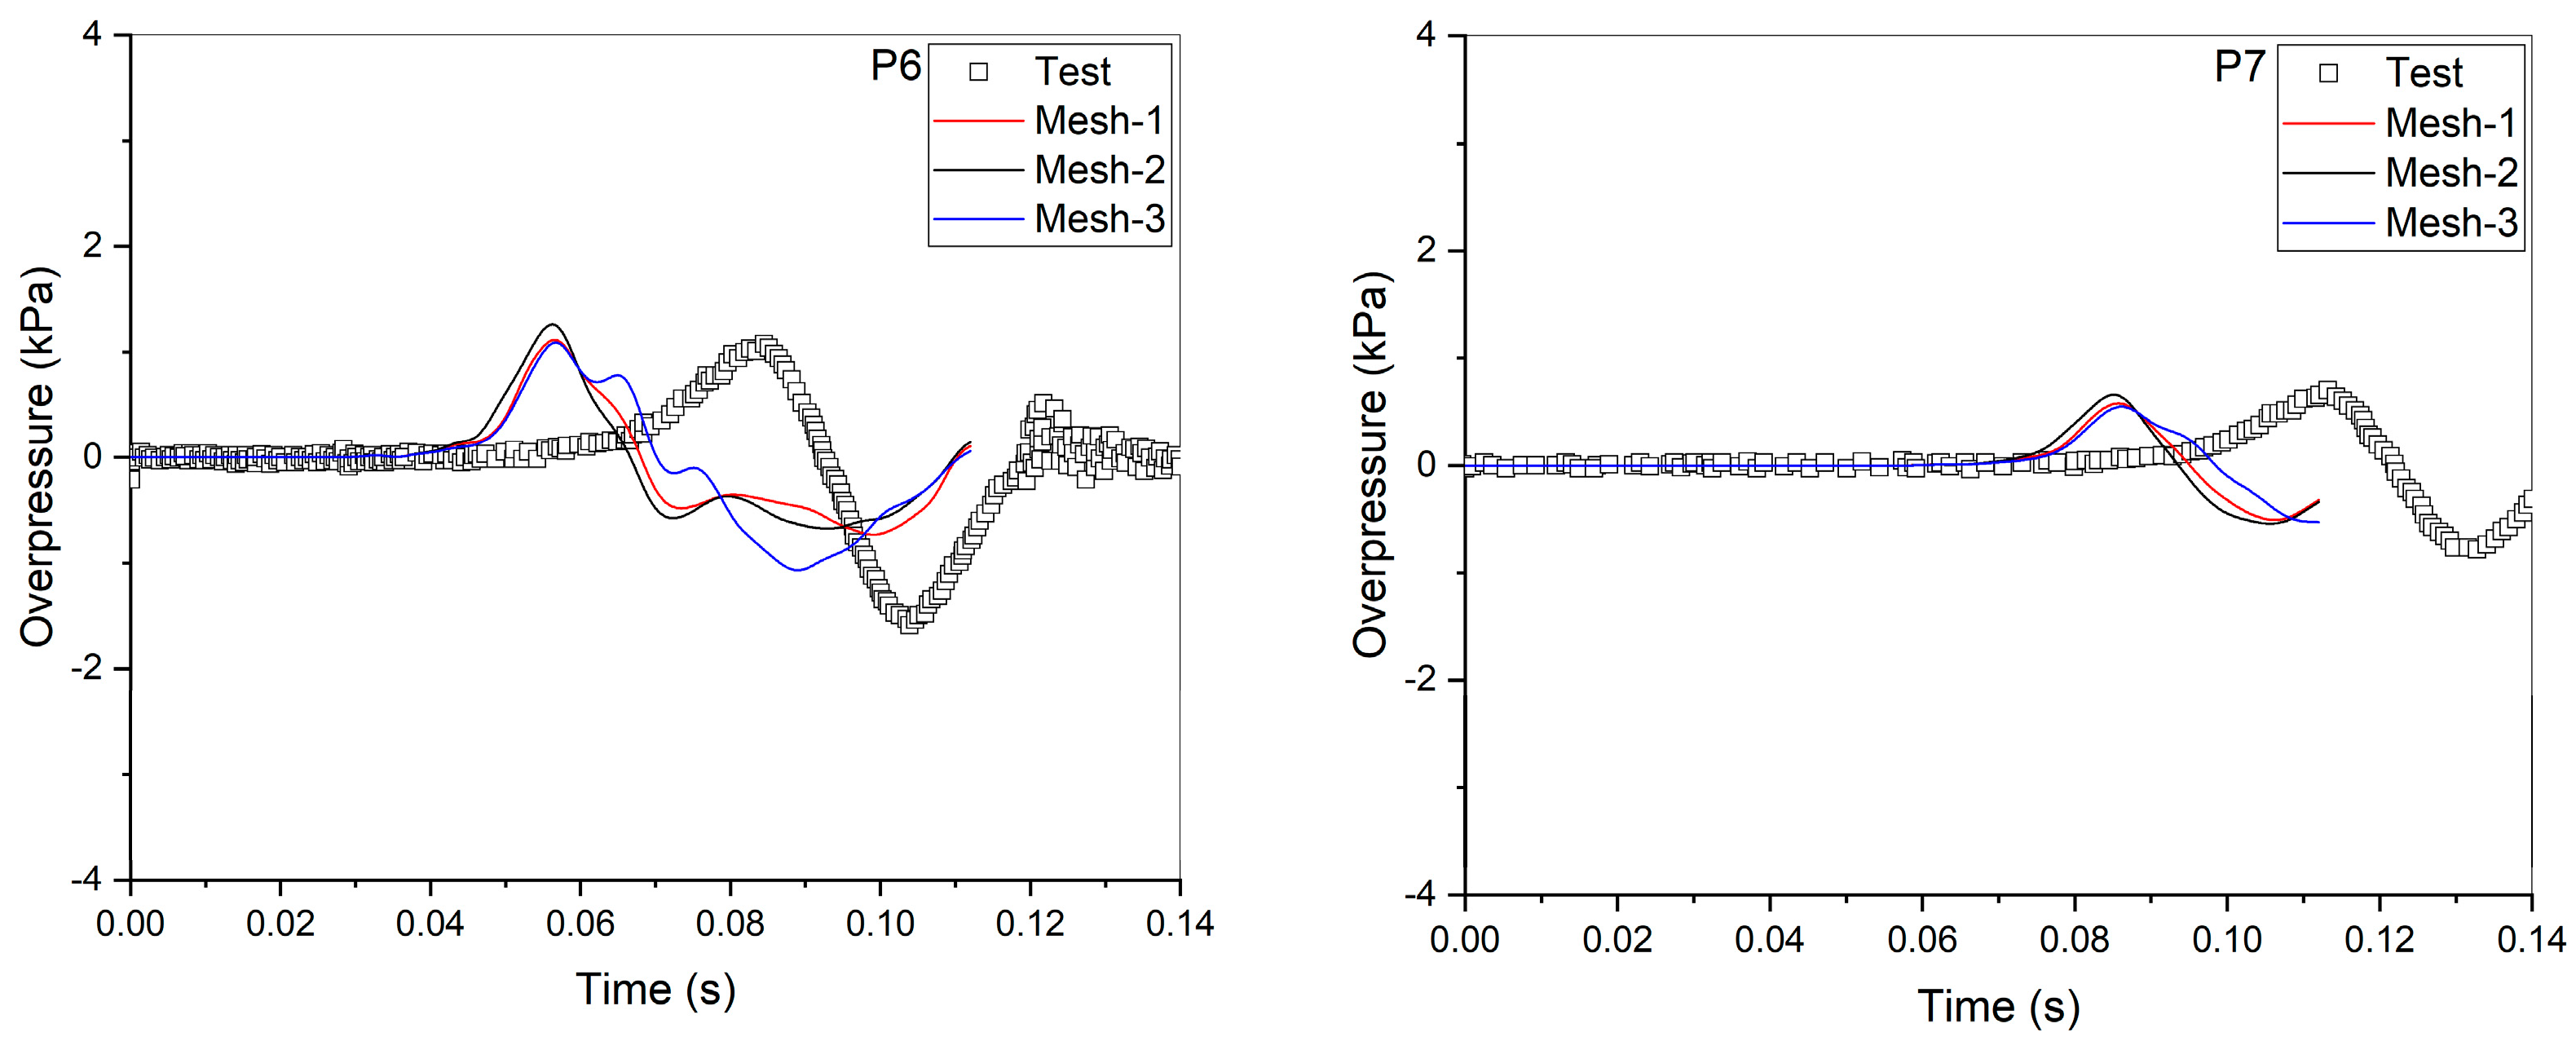
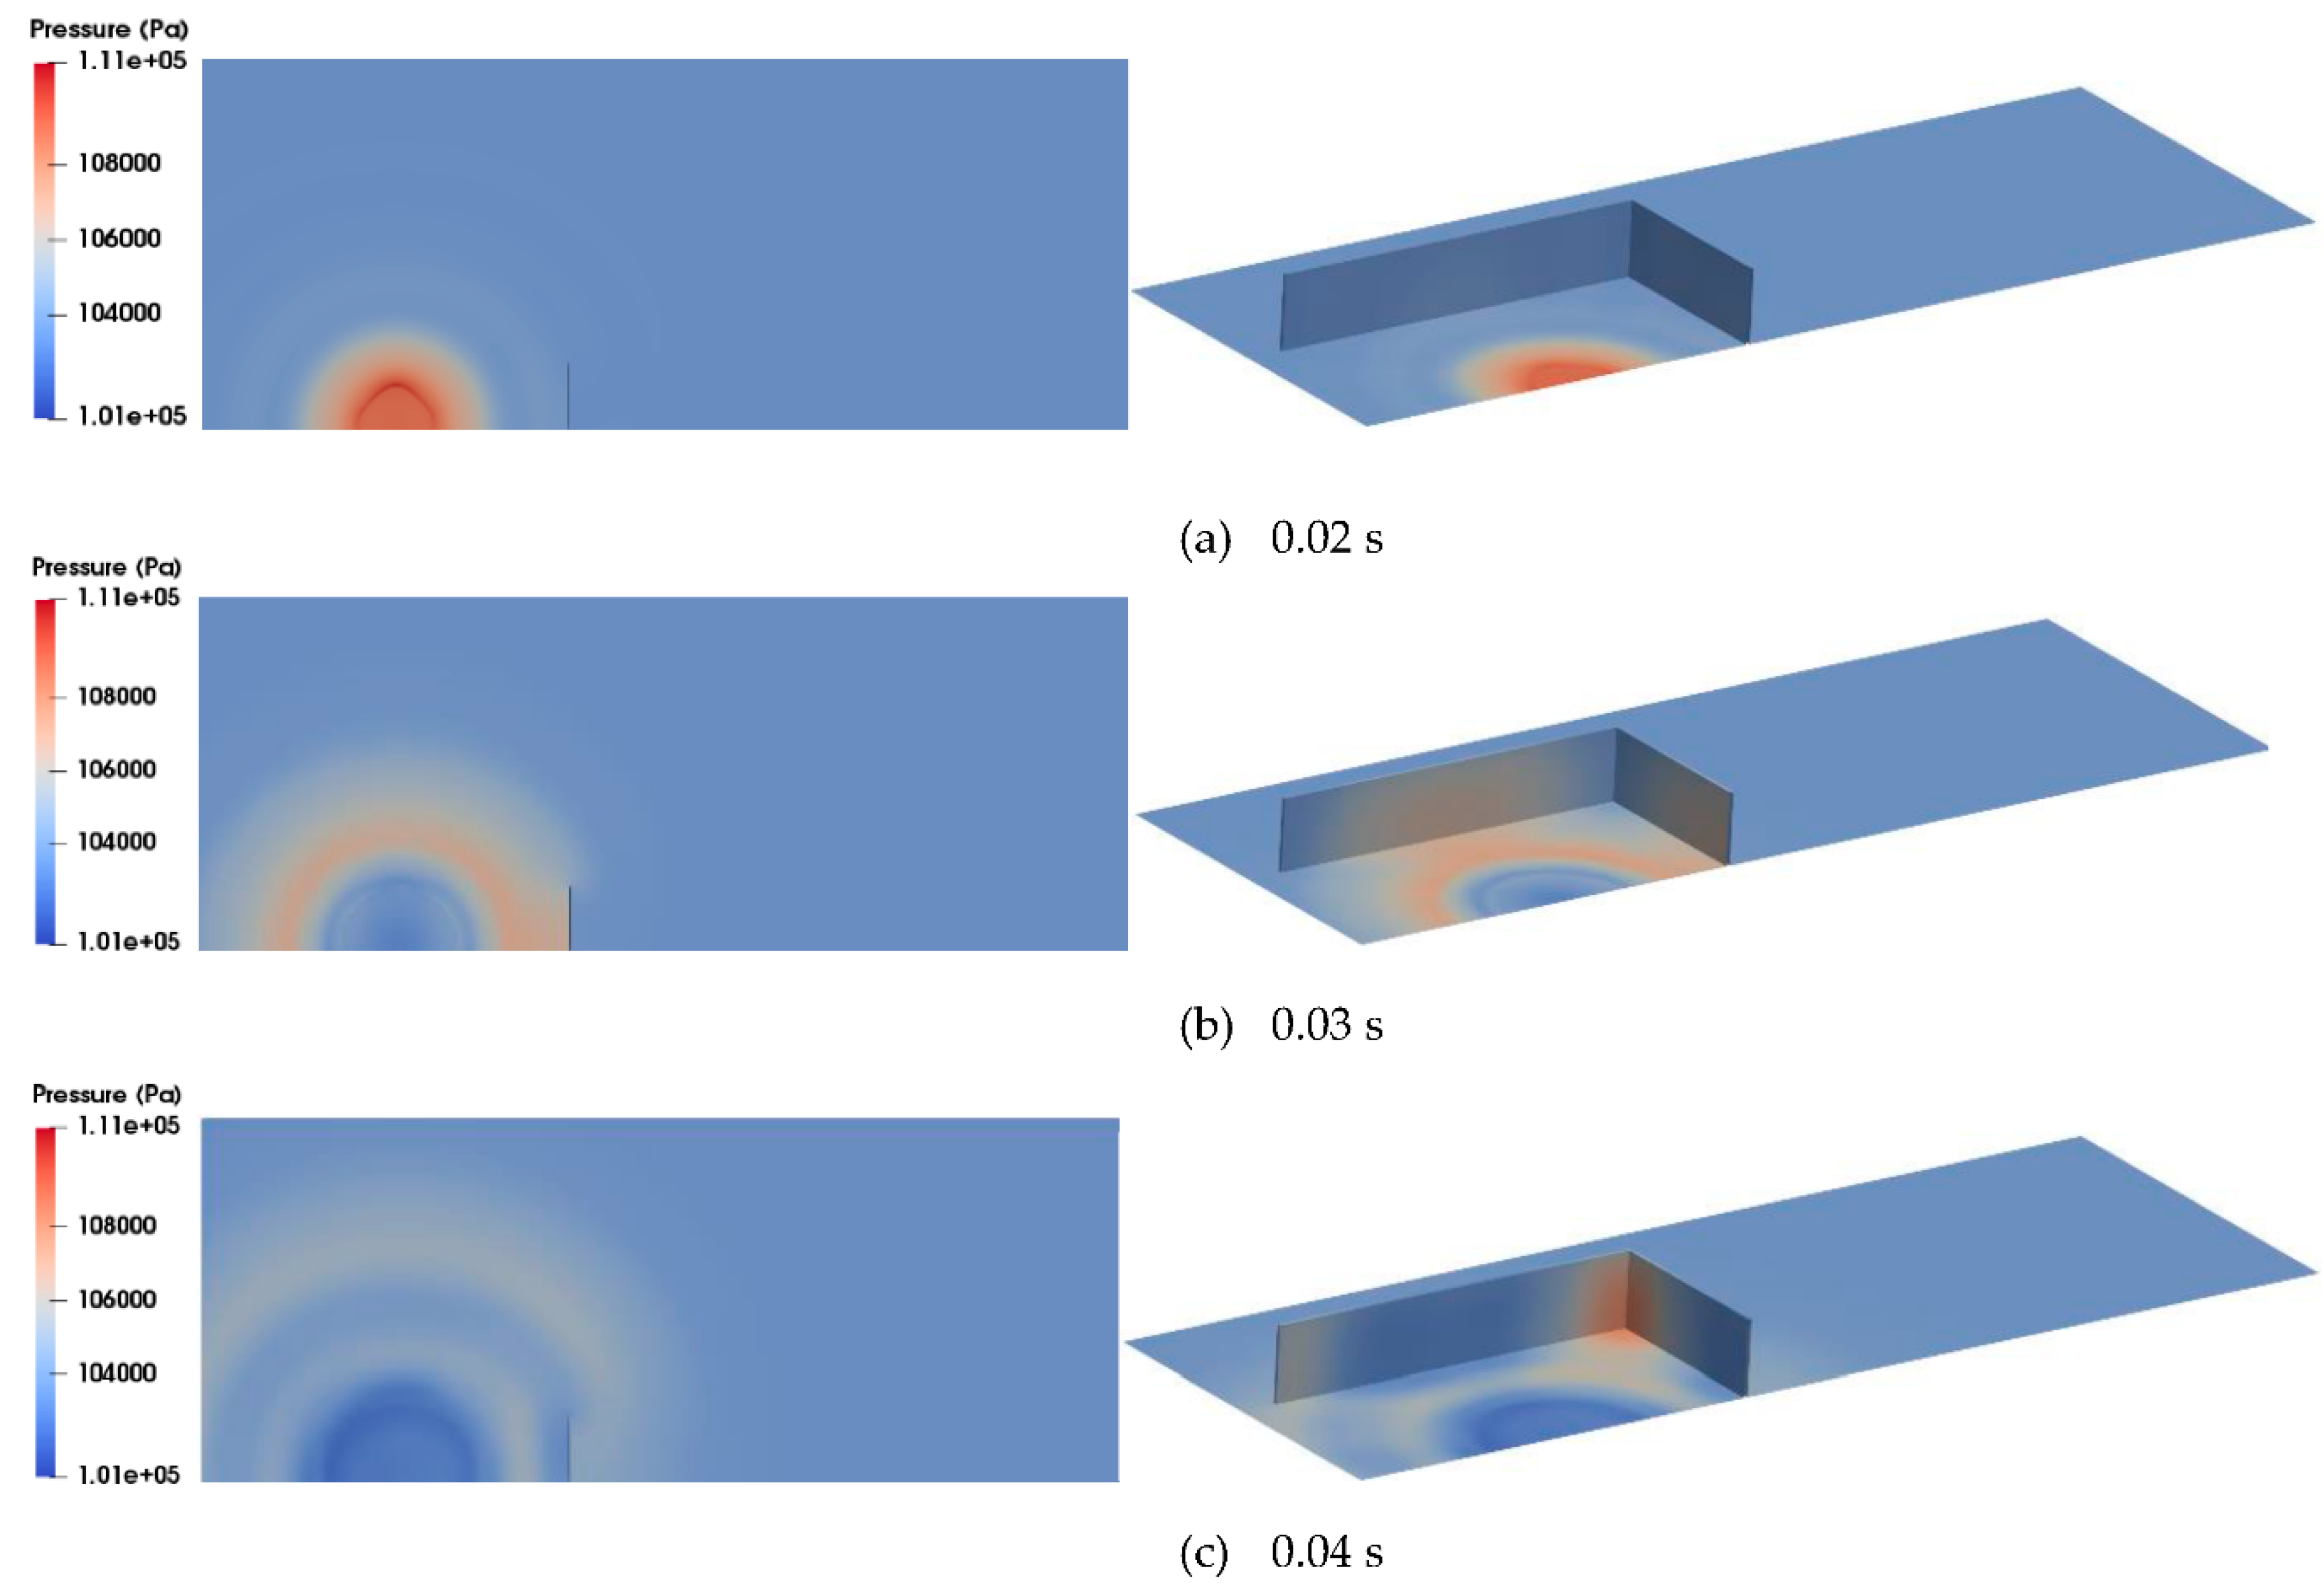
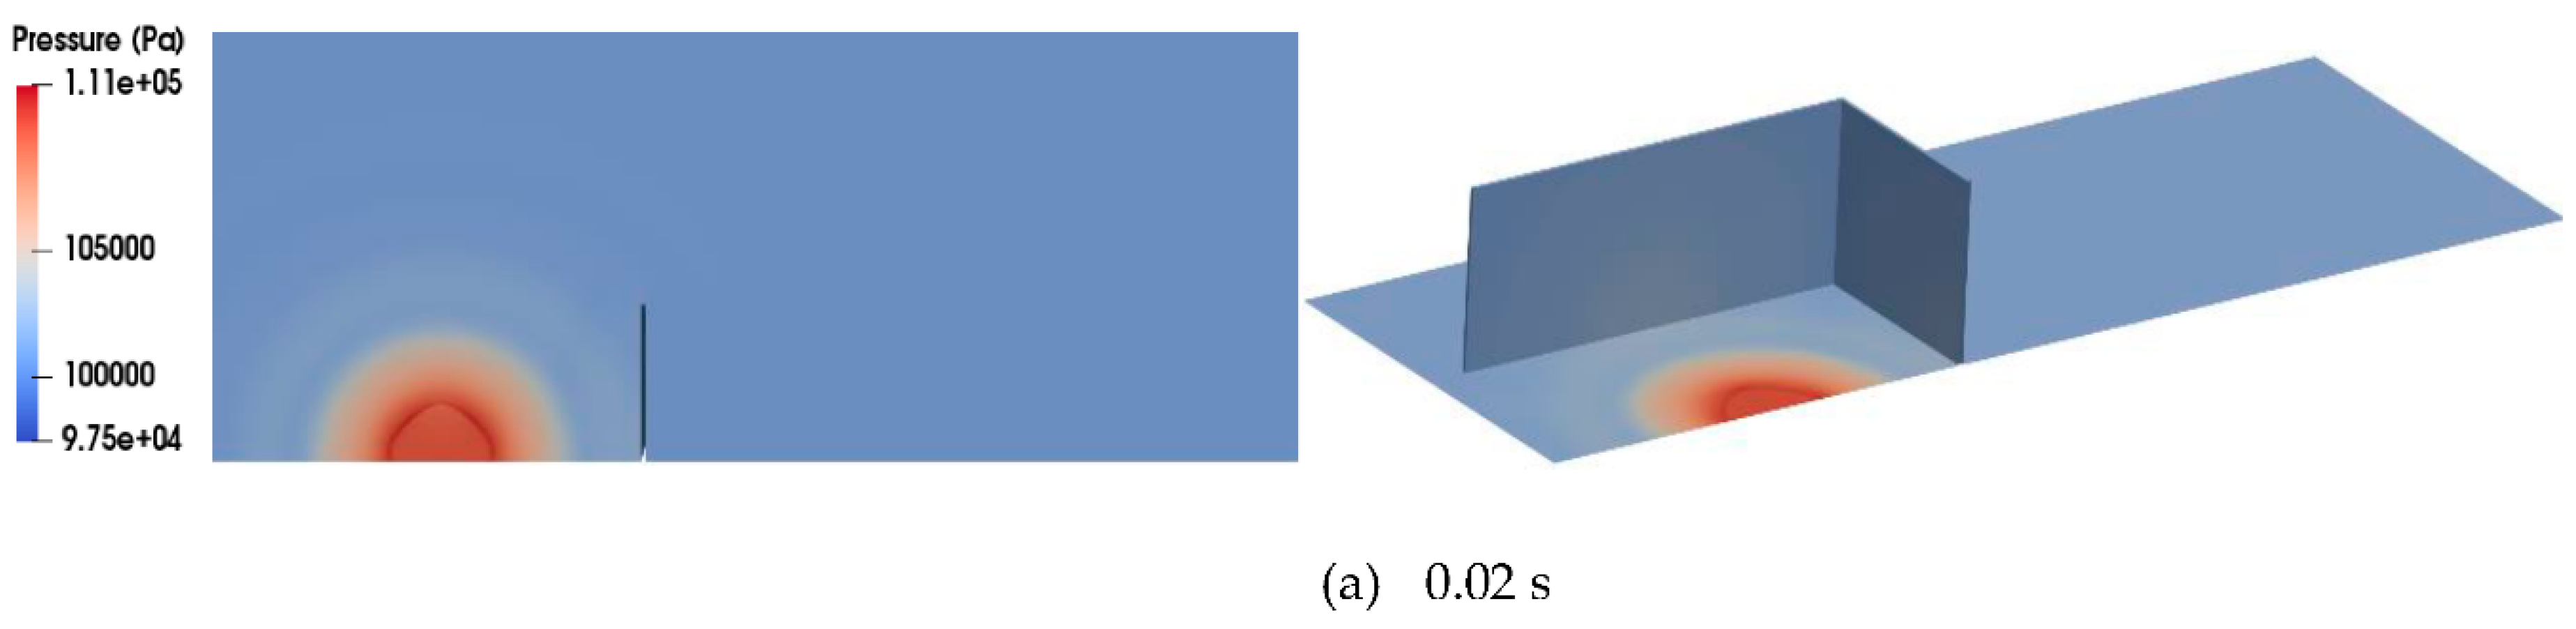
4.3. Discussion on the CFD Results for Test 4-02

The calculated gas temperature and pressure distributions over time according to the modified XiFoam solver, as shown in Figure 6, Figure 7 and Figure 8, reasonably simulate the gas explosion phenomenon and the pressure wave propagation from the tent region to the air environment through the barrier. Figure 6 shows that the gas temperature increases to approximately 2700 K from the initial temperature of 283.45 K as combustion takes place during the flame propagation process from the ignition point to the boundary of the tent region with the formation of semi-spherical shape. After hydrogen combustion is complete in the tent region, the hot gas mixture expands to approximately two times the initial tent region. As a result of this temperature increase in the combustion region, the pressure band generated around the outer surface of the combustion region, as shown in Figure 6c and Figure 7d, starts to propagate to the air environment while its magnitude decreases (Figure 7). In particular, Figure 8 shows that the pressure wave propagates continually at a reduced magnitude after colliding with the barrier in the rear region of the barrier (Figure 8b, “A”). Some of the pressure wave propagating along the horizontal x-direction undergoes a directional turn to the rear region of the barrier after passing along the inner surface of the barrier (Figure 8, “B” and “C”) despite its magnitude.
The characteristics of the pressure wave propagation through the barrier indicate that the calculated peak overpressures at P4 and P2, located 2 m in front and 2 m behind the barrier, respectively, rapidly decrease from approximately 4.9 kPa to 1.5 kPa. Subsequently, the peak overpressure from the region behind the barrier (P2) to the far field region (P6) continually decreases from approximately 1.5 kPa to 1.0 kPa as the hemi-spherical band shape of the pressure wave propagates over a distance of 4 m. As the pressure propagates further into the air environment, the calculated peak overpressure at P7, located 10 m away from P6, also decreases by approximately 0.7 kPa. However, the peak overpressure at 4 m from the left boundary of the tent (P1), where the barrier is not installed, is calculated as approximately 3.1 kPa. This value is approximately two times higher than the peak overpressures at P4 despite the different distance from the ignition point to the pressure sensor location. The comparison of the pressure wave behaviors at P1 to P7 between the test data and the CFD results shows that the CFD results accurately simulate the shape of the measured pressure wave (Figure 9) and their peak overpressures with an error range of approximately ±30% (Figure 10). Therefore, we find that the CFD analysis can reasonably simulate the peak overpressure reduction caused by the barrier if the analysis methodology is properly chosen.
However, the predicted pressure waves at the local positions from P1 to P7 in the transient calculation pass approximately 30 ms faster than the measured data, as shown in Figure 9. This difference may have resulted from the difference in the established times of the peak overpressure at P3 in the tent region between the CFD results and the test data. The peak overpressure at P3 in the CFD analysis was calculated and found to be approximately 23 ms, which is approximately 30 ms faster than the measured value. The earlier establishment of the peak overpressure at P3 in the CFD result can be explained by the fact that the assumption of fully turbulent generation in the spark ignition model neglects the transition period from the laminar flame to the turbulent flame caused by the instability phenomenon in the hydrogen–air chemical reactive flow [27,28]. To simulate the instability phenomenon accurately, a detailed chemistry model using a very fine cell length on the mm order should be used. However, this model generally requires lengthy calculation times and a powerful hardware system [38]. In addition, we assumed a uniform turbulent fluctuation velocity of 7.5 m/s as the initial condition of the tent region to compensate for not modeling the small structures in the grid model, though turbulence generation due to the small structures in the test may occur at the locations of the small structures. Therefore, if the detailed chemistry model and the very fine mesh model to resolve the small structures in the tent region are used, the difference in the passing time for the pressure wave between the CFD results and the test data may disappear. However, a detailed chemistry model with a very fine mesh is not appropriate for calculating hydrogen explosion accidents at HRSs because the grid model for the HRS must cover a long distance from the explosion site to protected facilities and the corresponding calculation should be completed within a proper time.
The calculated flame TOAs in the tent region also show approximately 6 to 10 ms faster propagation from Ion-1 to Ion-6 (Table 3) when compared to the measured data, as shown in Figure 11. The reason for this difference can also be explained by the assumptions used in the spark ignition model and the initial condition in the tent region. The flame arrival time in the CFD calculation is defined as the instant when the gas temperature increases to approximately 700 K at the locations of Ion-1 to Ion-6 in the tent region.
The sensitivity calculation results when investigating the effect of the mesh length during the pressure wave propagation process at the far field region (Figure 12) show that the variation in the predicted peak overpressures according to the mesh size is approximately ±10%. However, the calculated shape of the pressure wave using the grid model of Mesh-3 is slightly different at the descending slope after the peak when compared to other models.
Finally, we propose the analysis methodology shown in Table 6 that is capable of accurately predicting peak overpressure variations through the barrier with an error range of approximately ±30% under a hypothetical VCE accident at an HRS on the basis of the hydrogen explosion test with a hydrogen–air mixture volume of 5.2 m3 under a stoichiometry condition as performed by SRI. This analysis methodology will be continually modified and validated using various test results, including the VCE at the mock-up facility of an HRS that includes dispensers, vehicles, and a barrier [39]. The methodology will then be finally established for VCE accidents at HRSs after simulating the test results with the barriers recommended by KGS.

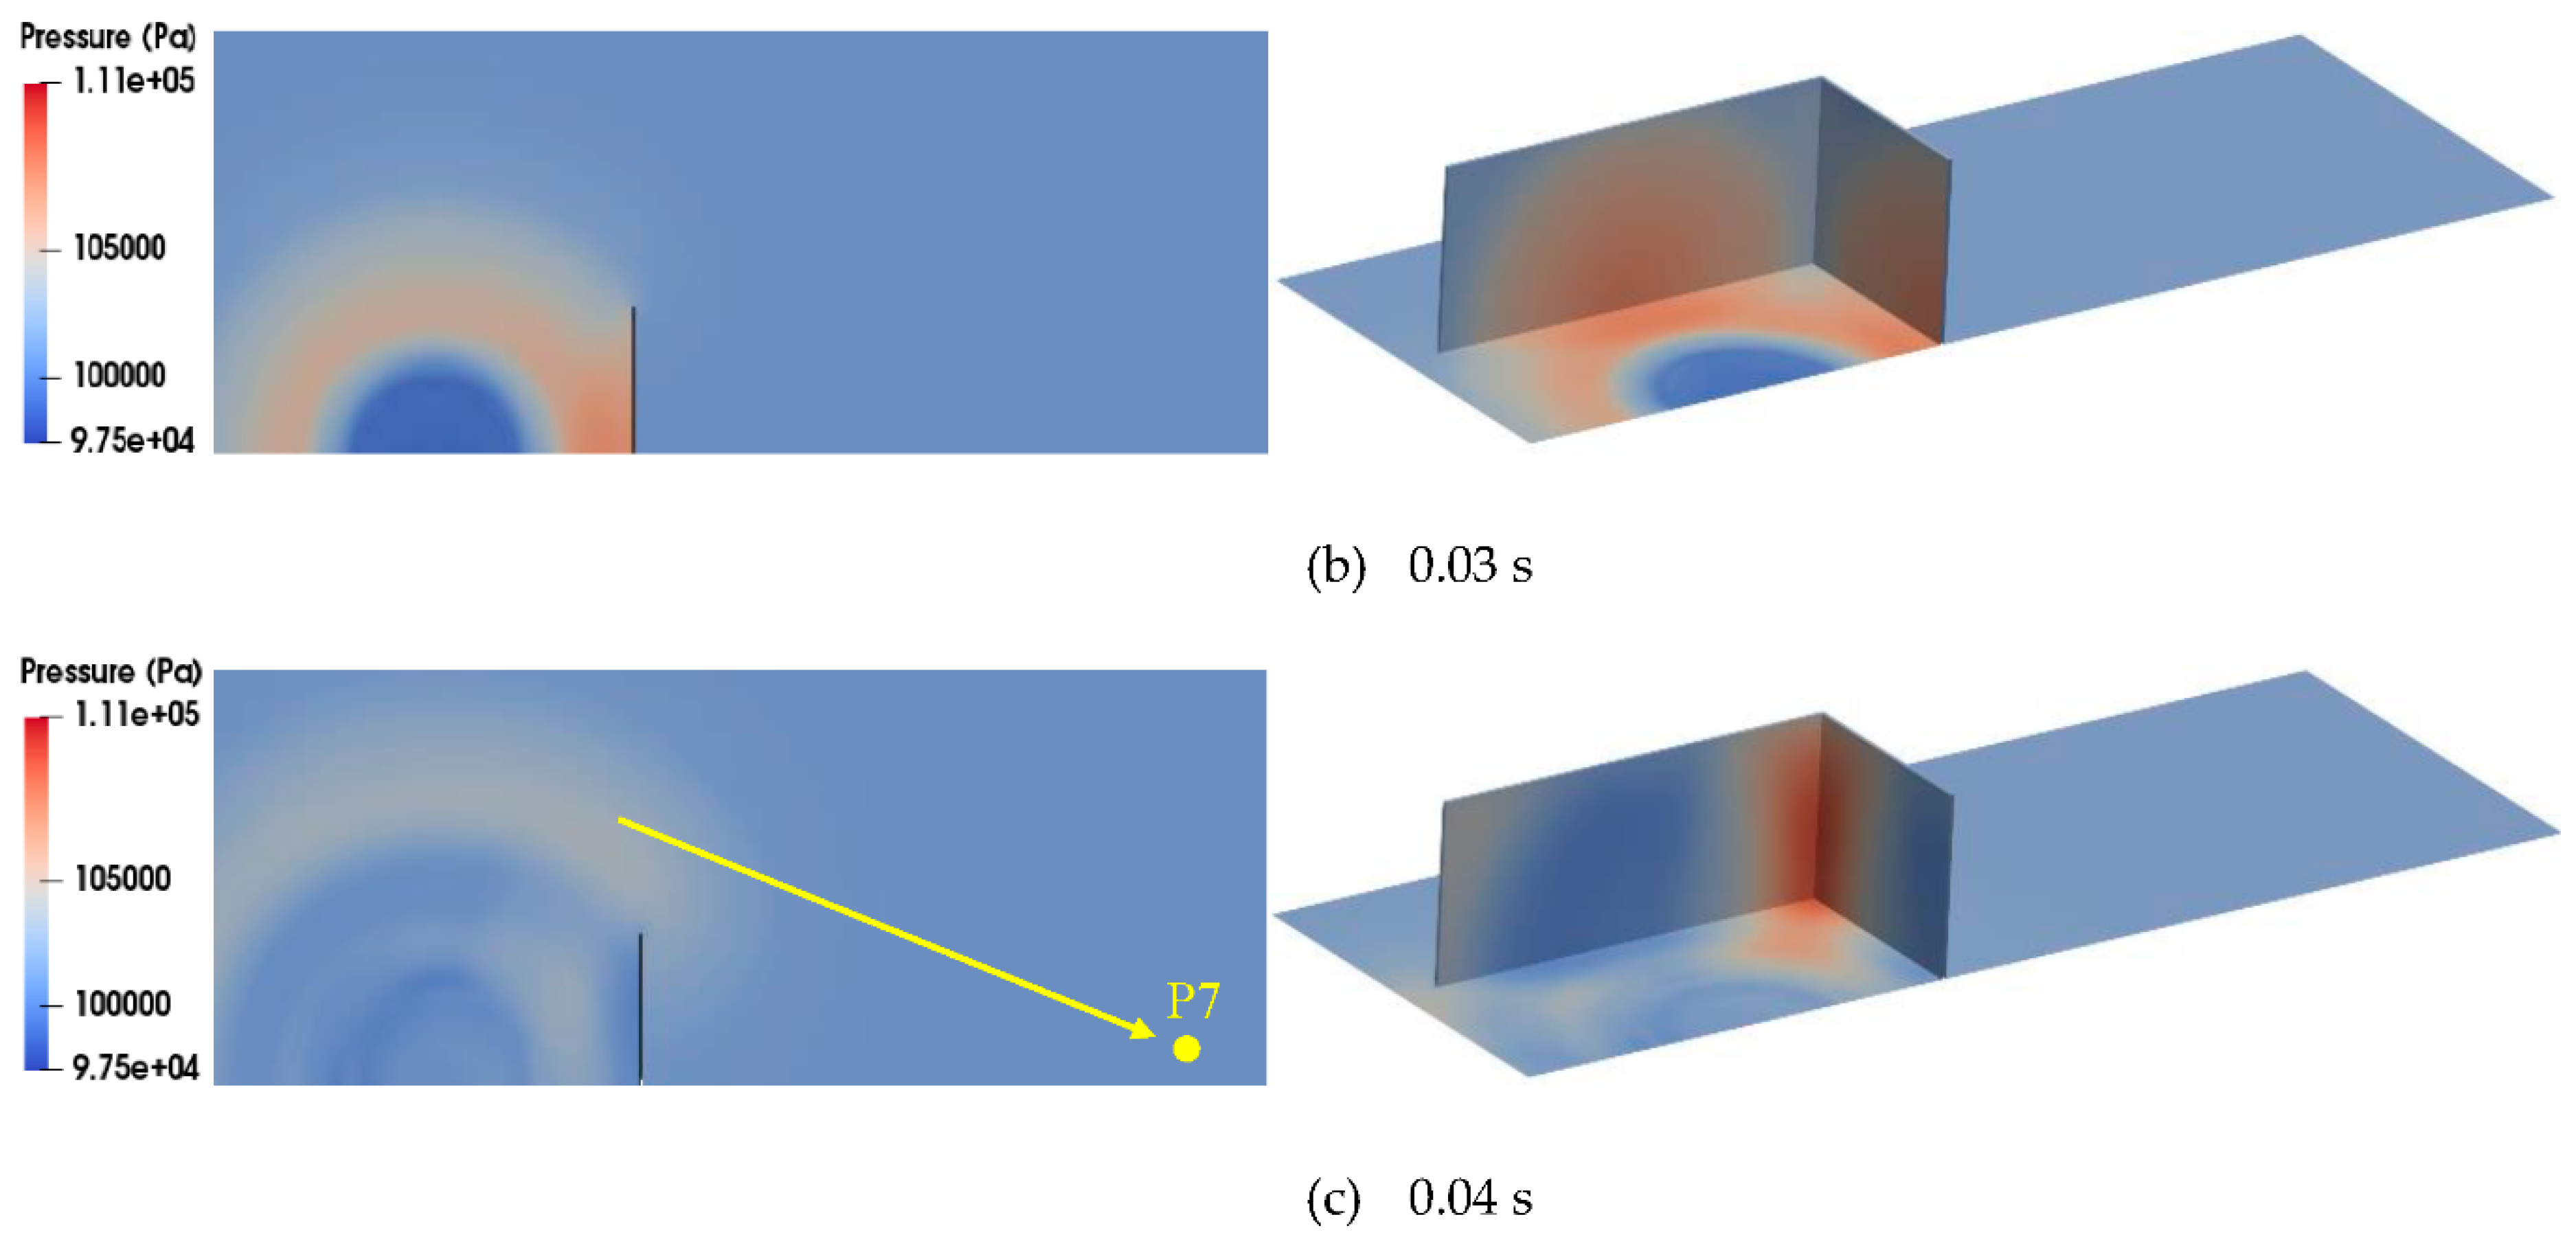
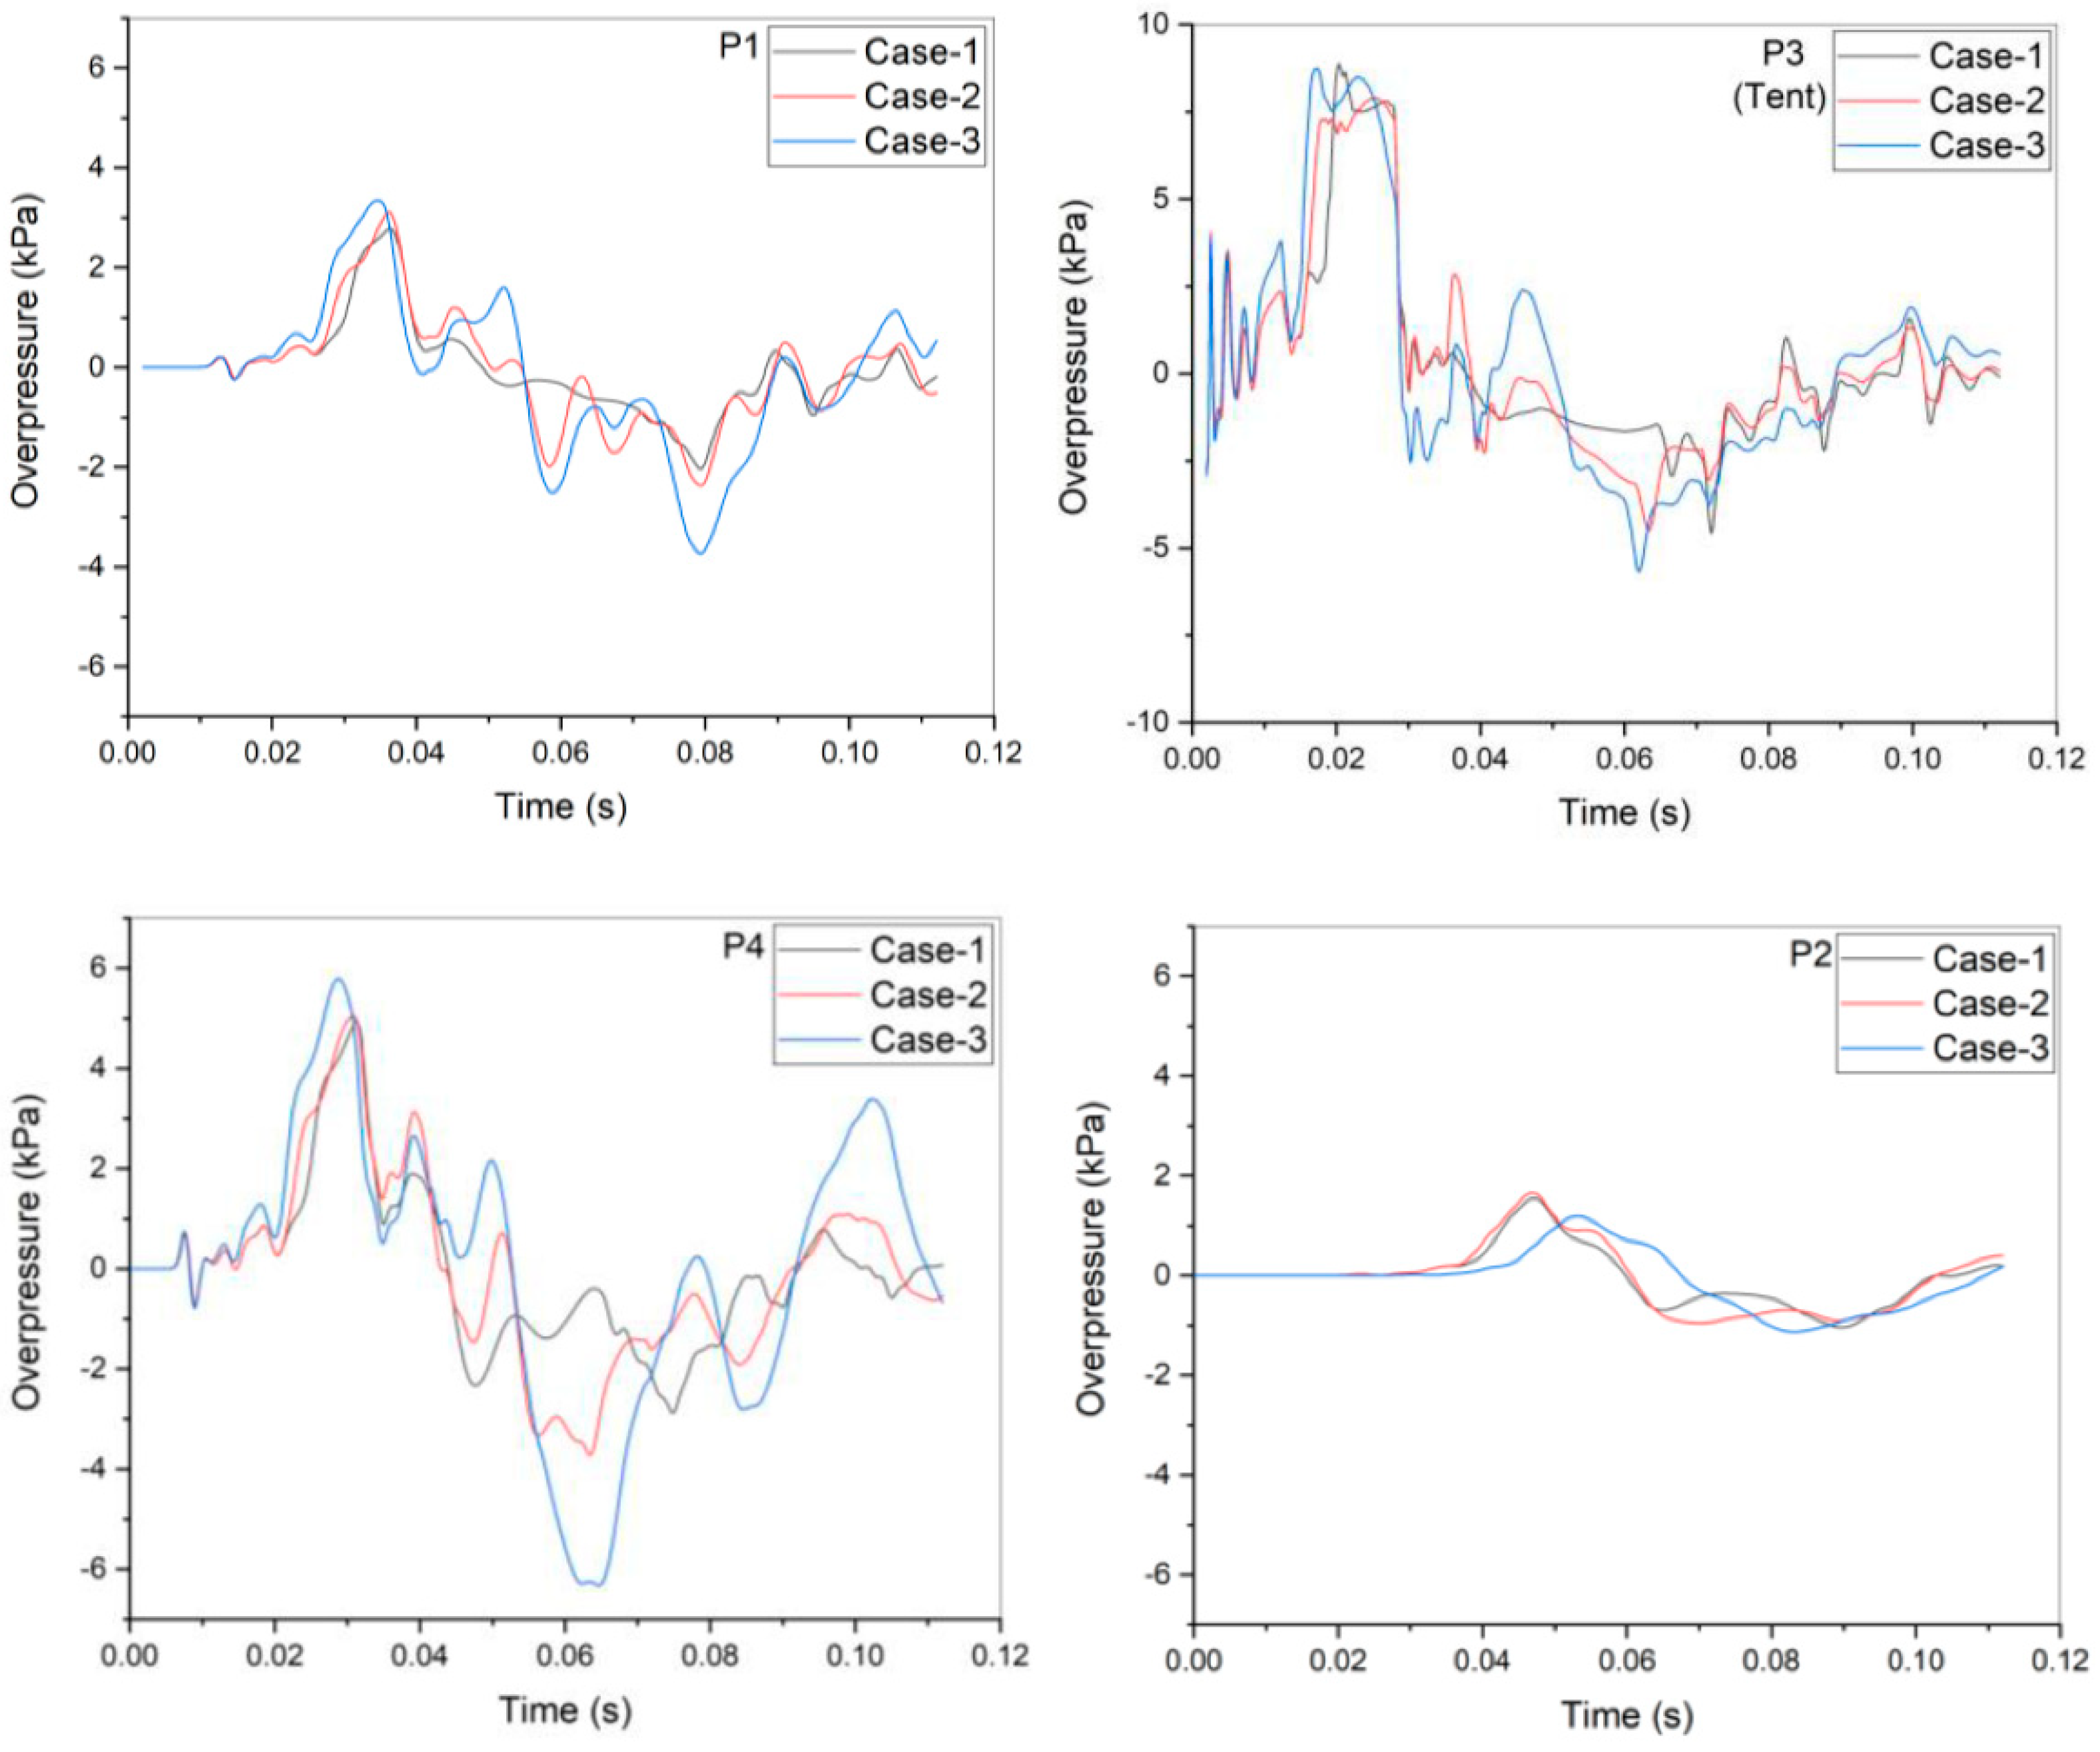
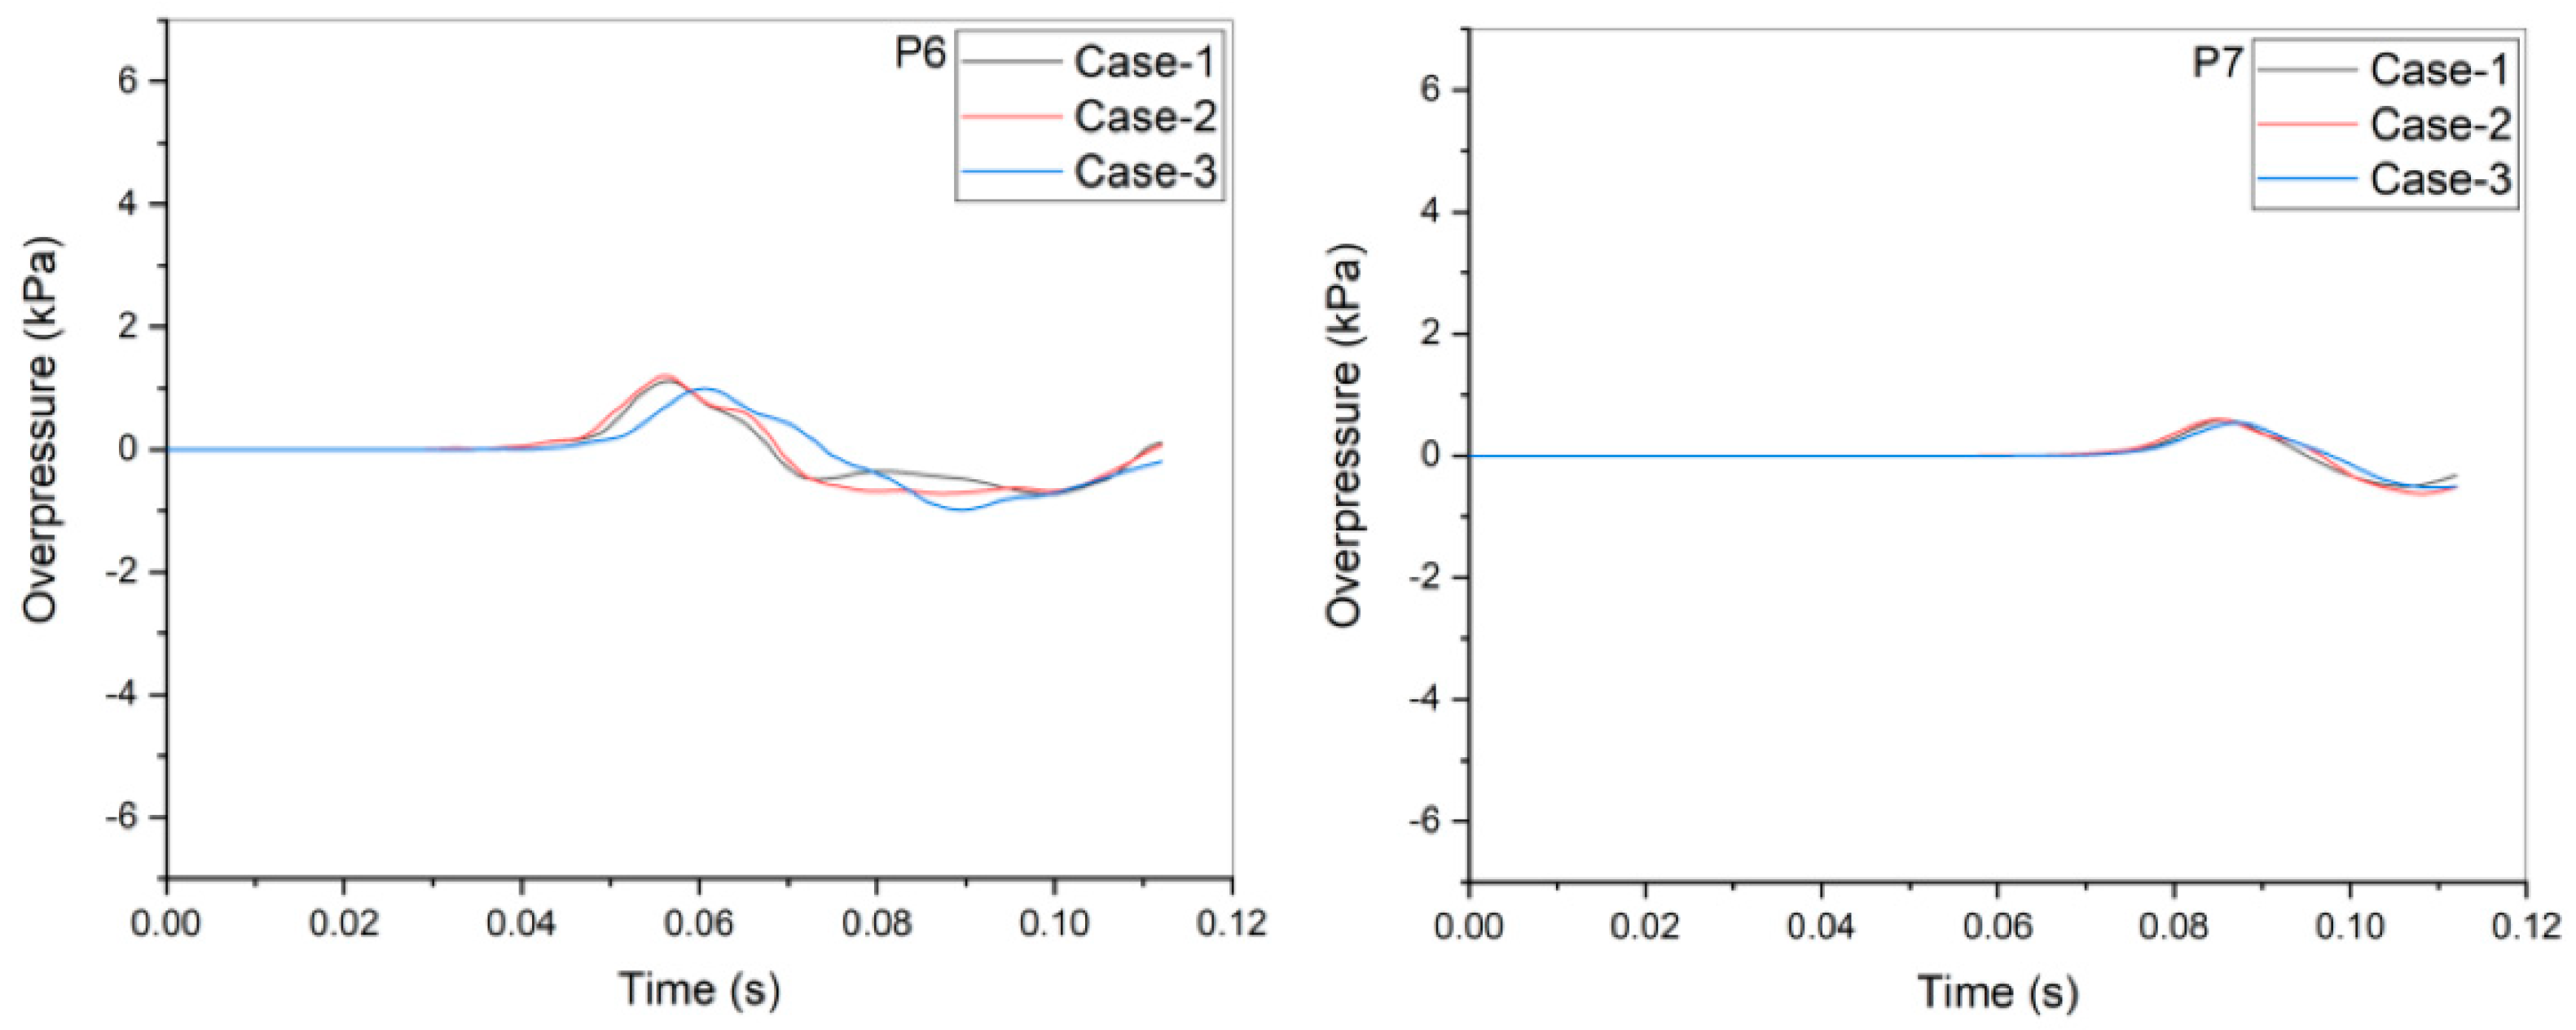
4.4. Applicability Test Using the Proposed Analysis Methodology

In order to evaluate the applicability of the proposed analysis methodology (Table 6) using the modified XiFoam solver in OpenFOAM to predict the peak overpressure reduction through the barrier and the pressure wave propagation from the near field to the far field of a hydrogen explosion site at an HRS, we introduced a rectangular barrier with different heights of 2 m and 4 m, as shown in Figure 13, because the barrier type, which will be installed around the hydrogen storage tank at the HRS, is likely to be determined as a rectangular shape with a higher height. To analyze the application cases, we applied the test condition of SRI 4-02 as the initial condition (Table 7) to simulate a hydrogen vapor cloud explosion, as this assumption can produce a convenient comparison between the different application cases. In Table 7, Case 1 is identical to the case of Mesh-1 in Table 4, of which the results are described in Section 4.2 and Section 4.3. The rectangular barriers with heights of 2 m and 4 m in the grid model were placed at the same location as the plate barrier in the x-direction; its distance from the tent boundary to the barrier wall in the y-direction was assumed to be 4 m, as shown in Figure 13. The mesh distribution in the grid models for Case 2 and Case 3 was generated on the basis of that of Mesh-1, as shown in Figure 5b, because the mesh distribution in the computational domain, particularly at the front region of the barrier, can affect the pressure distribution. Thus, the total number of cells generated in the grid model for Case 3 was increased to 3,807,512 cells from the number of cells generated (3,048,518) in Case 2. The boundary and initial conditions given in the CFD calculation for Case 1 (Figure 5a, Table 5) were identically applied to those of Case 2 and Case 3.
The CFD results for the application tests using the proposed analysis methodology are shown in Figure 14, Figure 15 and Figure 16. According to Figure 14 and Figure 15, the overall characteristics of pressure wave propagation in Case 2 and Case 3 from the tent region to the air environment are similar to those of Case 1. However, the extent of the reflected pressure wave to the tent region by the rectangular barrier is increased when compared to that in Case 1 because the barrier wall surrounds the tent region where the hydrogen explosion occurs. In particular, the rectangular barrier with a height of 4 m (Case 3) blocks and reflects more of the pressure wave from the explosion site compared to the barrier with a height of 2 m (Case 2). As a result of this effect of the rectangular barrier, the peak overpressure at 2 m in front of the barrier (P4) in Case 3 is approximately 17% higher than that of Case 1, as shown in Figure 16, whereas the peak overpressure at 2 m behind the barrier (P2) in Case 3 is approximately 23% lower than that of Case 1. Thus, we find that the damage reduction effect caused by the rectangular barrier with a height of 4 m is better than that by the other barriers. Moreover, the reflection effect by the rectangular barrier increases the calculated peak overpressure in the tent region (P3) and on the left side (P1), which is located 4 m from the tent boundary. However, the effects of the reduced overpressure by the rectangular barriers tend to decrease from the location of P6 and then almost disappear at P7, which is located at a distance of 21 m from the ignition point. This result can be explained by the fact that most of the pressure wave arriving at the P7 location comes from the pressure wave, which is located at the upper region of the barrier, as shown in Figure 15c. When considering these calculation results on the basis of the SRI test results using the plate barrier with a height of 2 m, we can judge that the proposed analysis methodology can be effectively applied for the simulation of VCE accidents at HRSs.

5. Conclusions and Further Work

We proposed an analysis methodology using a modified version of the XiFoam solver in OpenFOAM-v1912 to predict peak overpressure variations through a barrier and the corresponding distribution to far fields from an explosion site with an error range of approximately ±30% under hydrogen vapor cloud explosion accidents at HRSs on the basis of SRI test 4-02. In addition, we confirmed the applicability of the proposed analysis methodology by analyzing the effects of the different barrier shapes during a hydrogen vapor cloud explosion, which was simulated using the SRI test condition. The results indicate that the proposed analysis methodology using the modified XiFoam solver can be used to evaluate the safety effects of the various barrier models under VCE accidents before such models are installed at an HRS.
As further work, we must validate and modify the proposed analysis methodology against various test results, including the VCE in a mock-up facility of an HRS to for an accurate prediction of overpressure buildup and the corresponding variations through the barrier. In addition, the pressure distribution on the barrier surface as predicted by the analysis methodology will be transferred to a structure analysis to evaluate the integrity of the barrier. Finally, the analysis methodology will be published as a technical guide connected to the installation criterion for the barrier ultimately to evaluate the safety of HRSs.

Author Contributions

Investigation, S.-M.K.; Methodology, H.-S.K.; Resources, H.-S.K.; Software, H.-S.K., S.-M.K. and J.K.; Writing—original draft, H.-S.K. All authors have read and agreed to the published version of the manuscript.

Funding

This research was funded by a grant from the Korea Institute of Energy Technology Evaluation and Planning (KETEP) funded by the Korean government (Ministry of Trade, Industry and Energy) (No. 20215810100020).

Conflicts of Interest

The authors declare no conflict of interest.

Nomenclature

Dturbulent diffusion coefficient (m2/s)
bprogressive variable (-)
Cpspecific heat (J/kg-K)
Eemission contribution (-)
Grradiation intensity (W/m2)
kturbulent kinetic energy (m2/s2)
mactmass of the activated mixture of hydrogen and air due to spark (kg)
Ppressure (Pa)
qheat flux (W/m2)
Rggas constant (J/kg-K)
rradius (m)
Sstrain rate (1/s)
Sulaminar flame speed (m/s)
Stturbulent flame speed (m/s)
Sctturbulent Schmidt number (-)
Ttemperature (K)
u’turbulence fluctuation velocity (m/s)
Uvelocity (m/s)
Vvolume (m3)
Greek letters
νeddy viscosity (m2/s)
ρdensity (kg/m3)
ωspecific dissipation rate (1/s)
σSBStefan-Boltzmann coefficient (-)
φfuel equivalent ratio (-)
Subscripts
0reference condition
cambient state
hactivated state
kturbulence kinetic energy
rradiative
ulaminar
tturbulence

References

  1. Field, R.A.; Derwent, R.G. Global Warming Consequences of Replacing Natural Gas with Hydrogen in the Domestic Energy Sectors of Future Low-Carbon Economies in the United Kingdom and the United States of America. Int. J. Hydrogen Energy 2021, 46, 30190–30203. [Google Scholar] [CrossRef]
  2. IEA. The Future of Hydrogen, Technical Report. 2019. Available online: https://www.iea.org/reports/the-future-of-hydrogen (accessed on 1 August 2022).
  3. Meng, X.; Gu, A.; Wu, X.; Zhou, L.; Zhou, Z.; Liu, B.; Mao, Z. Status Quo of China Hydrogen Strategy in the Field of Transportation and International Comparisons. Int. J. Hydrogen Energy 2021, 46, 28887–28899. [Google Scholar] [CrossRef]
  4. Ministry of Trade, Industry and Energy. Hydrogen Economy Fostering and Hydrogen Safety Management Act; No. 16942; Ministry of Trade, Industry and Energy: Sejong-si, Korea, 2021. [Google Scholar]
  5. National Library of Korea. Hydrogen Economy Revitalization Roadmap, Policy Information. 2019. Available online: https://policy.ni.go.kr (accessed on 1 June 2021).
  6. Cho, C.H.; Kim, D.H.; Kang, S.G.; Choi, S.J.; Kim, Y.G. International Status of a Liquid Hydrogen Refueling Station. In Proceedings of the KHNS, Spring Meeting, Daejeon, Korea, 27–28 May 2021. [Google Scholar]
  7. Chuncheon District Prosecutors’ Office, Gangneung Branch. Investigation Results for the Hydrogen Tank Explosion in Gangwon Techno Park; Press Release Report; Chuncheon District Prosecutors’ Office, Gangneung Branch: Gangneung, Korea, 4 December 2019. [Google Scholar]
  8. KGS. Facility/Technical/Inspection Code for Manufacture of Water Electrolysis Facility; KGS AH271; KGS: Seoul, Korea, 2021. [Google Scholar]
  9. Kim, K.S. Development of Design Technology and Safety Standard in the Protection Wall for Blast Mitigations in Hydrogen Station; Research Plan Report, No. 20215810100020; KGS: Seoul, Korea, 2021. [Google Scholar]
  10. KGS. Facility/Technical/Inspection Code for Fuel Vehicles Refueling by Type of On-Site Hydrogen Production; Technical Standards, KGS FP216; Ministry of Trade, Industry & Energy: Sejong-si, Korea, 2020. [Google Scholar]
  11. KGS. Facility/Technical/Inspection Code for Fuel Vehicles Refueling by Type of Compressed Hydrogen Delivery; Technical Standards, KGS FP217; Ministry of Trade, Industry & Energy: Sejong-si, Korea, 2020. [Google Scholar]
  12. Ministry of Environment. Manual for Construction and Operation of a Hydrogen Refueling Station; Ministry of Environment: Sejong-si, Korea, 2021. [Google Scholar]
  13. Ministry of Trade, Industry and Energy. High Pressure Gas Safety Management Act; Enforcement Rules, No. 446, Annex 2; Ministry of Trade, Industry and Energy: Sejong-si, Korea, 2022. [Google Scholar]
  14. OpenCFD Ltd. OpenFOAM User Guide, Version 1912. 2019. Available online: https://www.openfoam.com (accessed on 2 May 2021).
  15. Groethe, M.A.; Colton, J.D. FY01 Annual Report on Hydrogen Safety in the World Energy Network; Technical Report; SRI: Menlo Park, CA, USA, 2002. [Google Scholar]
  16. Groethe, M.A. FY02 Annual Report on Hydrogen Safety in the World Energy Network; Technical Report; SRI: Menlo Park, CA, USA, 2002. [Google Scholar]
  17. Kim, S.; Kim, J. Effect of Radiation Model on Simulation of Water Vapor—Hydrogen Premixed Flame Using Flamelet Combustion Model in OpenFOAM. Nucl. Eng. Tech. 2022, 54, 1321–1335. [Google Scholar] [CrossRef]
  18. Kang, H.S.; NO, H.C.; Kim, S.B.; Kim, M.H. Methodology of CFD Analysis for Evaluating H2 Explosion Accidents in an Open Space. Int. J. Hydrogen Energy 2015, 40, 3075–3090. [Google Scholar] [CrossRef]
  19. Kang, H.S.; NO, H.C.; Kim, S.B. Application of the Developed CFD Analysis Methodology to H2 Explosion Accidents in an Open Space. Int. J. Hydrogen Energy 2017, 42, 1306–1317. [Google Scholar] [CrossRef]
  20. Kang, H.S.; Kim, J.; Hong, S.W.; Kim, S.B. Numerical Analysis for Hydrogen Flame Acceleration during a Severe Accident in the APR1400 Containment Using a Multi-Dimensional Hydrogen Analysis System. Energies 2020, 13, 6151. [Google Scholar] [CrossRef]
  21. Kang, H.S.; Kim, J.; Hong, S.W. Numerical Analysis for Hydrogen Flame Acceleration during a Severe Accident Initiated by SBLOCA in the APR1400 Containment. Hydrogen 2022, 3, 28–42. [Google Scholar] [CrossRef]
  22. Hall, J. Ignites Release of Liquid Hydrogen; Research Report, RR987; HSL: London, UK, 2014. [Google Scholar]
  23. Kang, H.S.; Kim, S.; Kim, J.; Kim, D.H. Development of an Analysis Methodology for a Liquid Hydrogen Explosion Accident in a Hydrogen Refueling Station and a Functional Design for Analysis Modules; Technical Report, KAERI/TR-9041/2021; KAERI: Daejeon, Korea, 2021. [Google Scholar]
  24. Pu, L.; Shao, X.; Zhang, S.; Lei, G.; Li, Y. Plume Dispersion Behaviour and Hazard Identification for Large Quantities of Liquid Hydrogen Leakage. Asia-Pacific J. Chem. Eng. 2019, 14, e2299. [Google Scholar] [CrossRef]
  25. Weller, H.G. The Development of a New Flame Area Combustion Model Using Conditional Averaging, Thermo-Fluids Section; Report TF/9307; Imperial College: London, UK, 1993. [Google Scholar]
  26. Tabor, G.; Weller, H.G. Large Eddy Simulation of Premixed Turbulent Combustion Using Ξ Flame Surface Wrinkling Model. Flow Turbul. Combust. 2004, 72, 1–28. [Google Scholar] [CrossRef]
  27. Turns, S.R. An Introduction to Combustion, 2nd ed.; McGraw-Hill, Inc.: Singapore, 2000. [Google Scholar]
  28. Kuo, K.K. Principles of Combustion, 2nd ed.; John Wiley & Sons, Inc.: New Jersey, NJ, USA, 2005. [Google Scholar]
  29. Metghalchi, M.; Keck, J.C. Burning Velocities of Mixtures of Air with Methanol, Isooctane, and Indolence at High Pressure and Temperature. Combust. Flame 1982, 48, 191–210. [Google Scholar] [CrossRef]
  30. Menter, H.S.; Kim, J.; Kim, S.B.; Hong, S.W. The SST Turbulence Model with Improved Wall Treatment for Heat Transfer Predictions in Gas Turbines. In Proceedings of the International Gas Turbine Congress, Tokyo, Japan, 2–7 November 2003. [Google Scholar]
  31. Wintergerste, T.; Casey, M.; Hutton, A.G. The Best Practice Guidelines for a CFD—A European Initiative on Quality and Trust. In Proceedings of the 5th ASME Pressure Vessels and Piping Conference, Vancouver, BC, Canada, 5–9 August 2002. [Google Scholar]
  32. Yanez, J.; Kotchourko, A.; Lelyakin, J. Hydrogen Deflagration Simulations under Typical Containment Conditions for Nuclear Safety. Nuclear Eng. Design 2012, 250, 678–686. [Google Scholar] [CrossRef]
  33. Movahed-Shariat-Panahi, M.A. Recommendation for Maximum Allowable Mesh Size for Plant Combustion Analyses with CFD codes. Nuclear Eng. Design 2012, 253, 360–366. [Google Scholar] [CrossRef]
  34. Jakel, C.; Verfondern, K.; Kelm, S.; Jahn, W.; Allelein, H.-J. 3D Modeling of the Different Boiling Regime during Spill and Spreading of Liquid Hydrogen. Engergy Procedia 2012, 29, 244–253. [Google Scholar] [CrossRef] [Green Version]
  35. Modest, M.F. Radiative Heat Transfer; International ed.; McGraw-Hill, Inc.: Singapore, 1993. [Google Scholar]
  36. Povilaitis, M.; Jaseliūnaitė, J. Simulation of Hydrogen-Air-Diluents Mixture Combustion in an Acceleration Tube with FlameFoam Solver. Energies 2021, 14, 5504. [Google Scholar] [CrossRef]
  37. Heywood, J.B. International Combustion Engine Fundamentals; McGraw-Hill, Inc.: New York, NY, USA, 1988. [Google Scholar]
  38. Choi, J.Y.; Jeung, I.S.; Yoon, Y. Computational Fluid Dynamics Algorithms for Unsteady Shock-Induced Combustion, Part 1: Validation. AIAA J. 2000, 38, 1179–1187. [Google Scholar] [CrossRef]
  39. Shirvill, L.C.; Royle, M.; Roberts, T.A. Hydrogen Releases Ignited in a Simulated Vehicle Refueling Environment. In Proceedings of the 2nd International Conference on Hydrogen Safety, San Sebastián, Spain, 11–13 September 2007. [Google Scholar]
Figure 1. Installation guideline for the barrier at the HRSs [10,11].
Energies 15 07556 g001
Figure 2. Test facility [16].
Energies 15 07556 g002
Figure 3. Measured peak overpressure according to test cases [16].
Energies 15 07556 g003
Figure 4. Results of Test 4-02.
Energies 15 07556 g004
Figure 5. Grid model, mesh distribution, and boundary conditions.
Energies 15 07556 g005
Figure 6. Temperature distribution as time passes (front view).
Energies 15 07556 g006
Figure 7. Pressure distribution as time passes (front view).
Energies 15 07556 g007
Figure 8. Pressure distribution as time passes (rear view).
Energies 15 07556 g008
Figure 9. Comparison of the overpressure behaviors between the test data and the CFD results.
Energies 15 07556 g009aEnergies 15 07556 g009b
Figure 10. Comparison of the peak overpressures between the test data and the CFD results.
Energies 15 07556 g010
Figure 11. Comparison of the flame front TOA between the test data and the CFD results.
Energies 15 07556 g011
Figure 12. Mesh sensitivity calculation results for the peak overpressures at the far fields.
Energies 15 07556 g012
Figure 13. Grid model for the application test.
Energies 15 07556 g013
Figure 14. Pressure distribution on the symmetry plane, barrier wall, and ground (Case 2).
Energies 15 07556 g014
Figure 15. Pressure distribution on the symmetry plane, barrier wall, and ground (Case 3).
Energies 15 07556 g015aEnergies 15 07556 g015b
Figure 16. Calculated pressure wave behaviors at P1 to P7 in the application tests.
Energies 15 07556 g016aEnergies 15 07556 g016b
Table 1. Separation Distance between the HRS and the Protection Facility [10,11].
Components
in the HRS
Compressed Gas (m3)
or
Liquefied Gas (kg)
Protected Facility
1st Class (m)
Protected Facility
2nd Class (m)
Storage tank or Processing facility<10,0001712
10,000 to 20,0002114
20,000 to 30,0002416
30,000 to 40,0002718
40,000 to 50,0003020
50,000 to 990,0003020
>990,0003020
Table 2. Conditions in the SRI hydrogen explosion tests [15,16].
Test No.H2–Air Mixture Volume (m3)H2 Con.
(vol.%)
Ambient
Temp. (K)
Wind
(m/s)
Ignition
Method
Barrier
Existence
4-015.230.0289.850.9–1.3Electric sparkX
4-025.229.9283.452.0Electric sparkO
5-025.230.0284.555.110 g C-4O
6-015.230.0290.051.310 g C-4X
Table 3. Sensor locations in the tent for Test 4-02 [16].
Sensor Locations (Photo)SensorDistance from Ignition Point (m)xLocation (cm)
y
z
Energies 15 07556 i001P30.950−95.00
Ion-10.80−57−572.5
Ion-20.90−64−642.5
Ion-31.00−71−712.5
Ion-40.9900101.5
Ion-50.190021.5
Ion-60.400043
Ignition point-002.5
Table 4. Sensitivity calculation conditions for the mesh length.
Mesh
Case No.
Tent Region (cm)Barrier Region
(cm)
Far Field Region
(cm)
Total Number of CellsAspect Ratio
11.55–1015–503,029,280<27.8
21.55–1010–503,473,060<28.3
31.55–1020–502,726,880<27.4
Table 5. Initial conditions in the tent region and air environment.
ParameterTent RegionAir EnvironmentSpark Ignition Region
Pressure (Pa)101,325101,325105,000
Temperature (K)283.45283.451000
H2 fraction (vol.%)29.9029.9
Combustion progress (b)11-
Table 6. Analysis methodology for prediction the peak overpressure through the barrier.
ParameterModel
  • Open source software
OpenFOAM-v1912
  • Thermal-hydraulic solver algorithm
PIMPLE
  • Combustion model
Modified XiFoam
  • Turbulent model
k-ω SST
  • Wall function
kqR/omega
  • CFL number
<0.8
  • Mesh type
Hexahedral
  • Mesh size at the far field
~50 cm
  • Ignition model
Spark ignition model
Table 7. Simulation conditions for application test.
Case No.H2–Air Mixture Volume (m3)H2 Con.
(vol.%)
Barrier
Type/Height (m)/Width (m)
Number of Cells
(Grid Model)
Case 15.229.9Plate/2/0.13,029,280
Case 25.229.9Rectangular/2/0.13,048,516
Case 35.229.9Rectangular/4/0.13,807,512
Publisher’s Note: MDPI stays neutral with regard to jurisdictional claims in published maps and institutional affiliations.

