
A Method for Characterising the Influence of Casting Parameters on the Metallurgical Bonding of Copper and Steel Bimetals


Abstract
:1. Introduction
1.1. Compound Casting
- melting, crystallisation and cooling processes developing stresses;
- reciprocal diffusion of one cast material into the other, grain boundaries being favourable locations;
- polymorphic transformation; and
- structural transformation: dissolution and precipitation processes forming solid solutions and/or intermetallic phases.
1.2. Copper-Iron Compounds
1.3. Research Goal
2. Materials and Methods
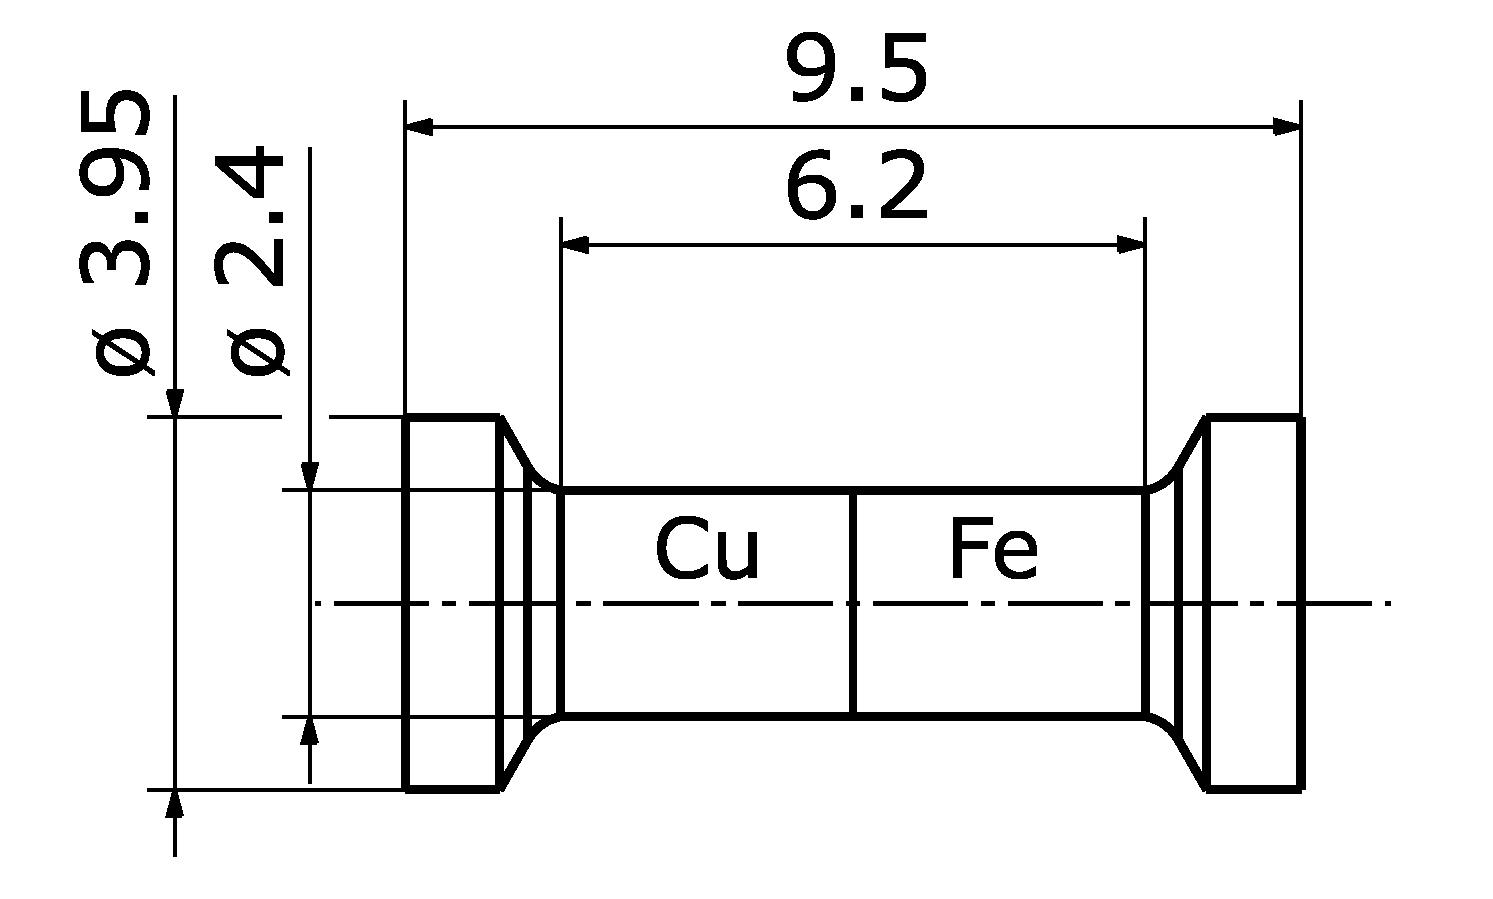
2.1. Specimen Preparation
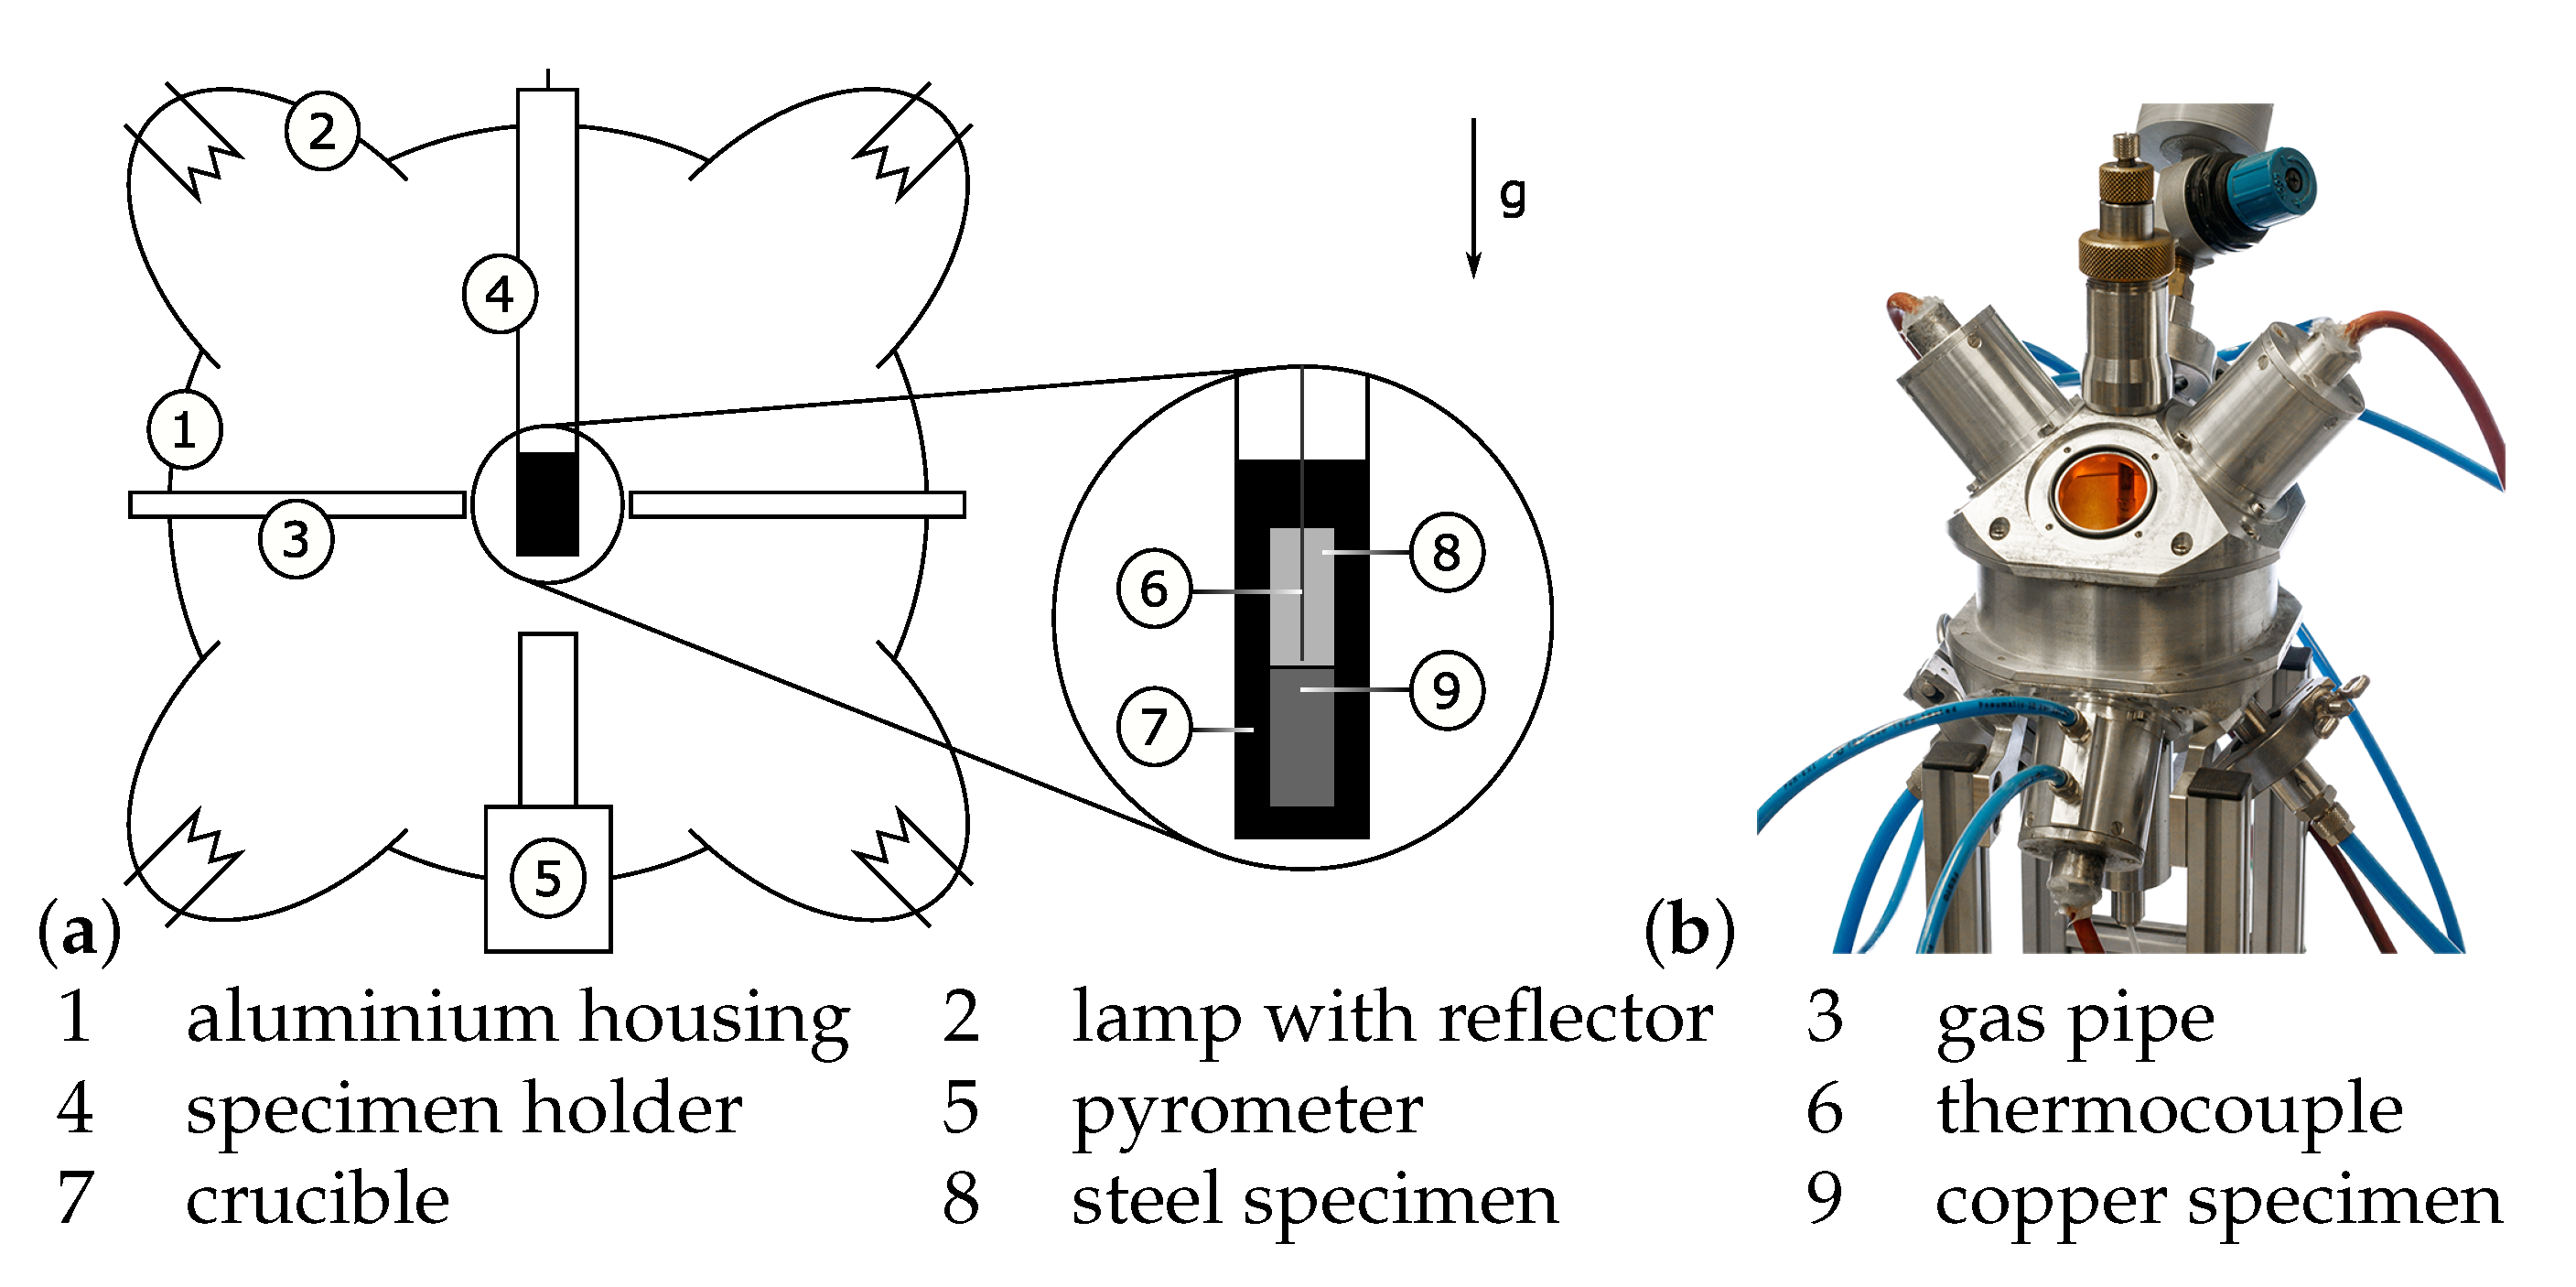
2.2. Mirror Furnace
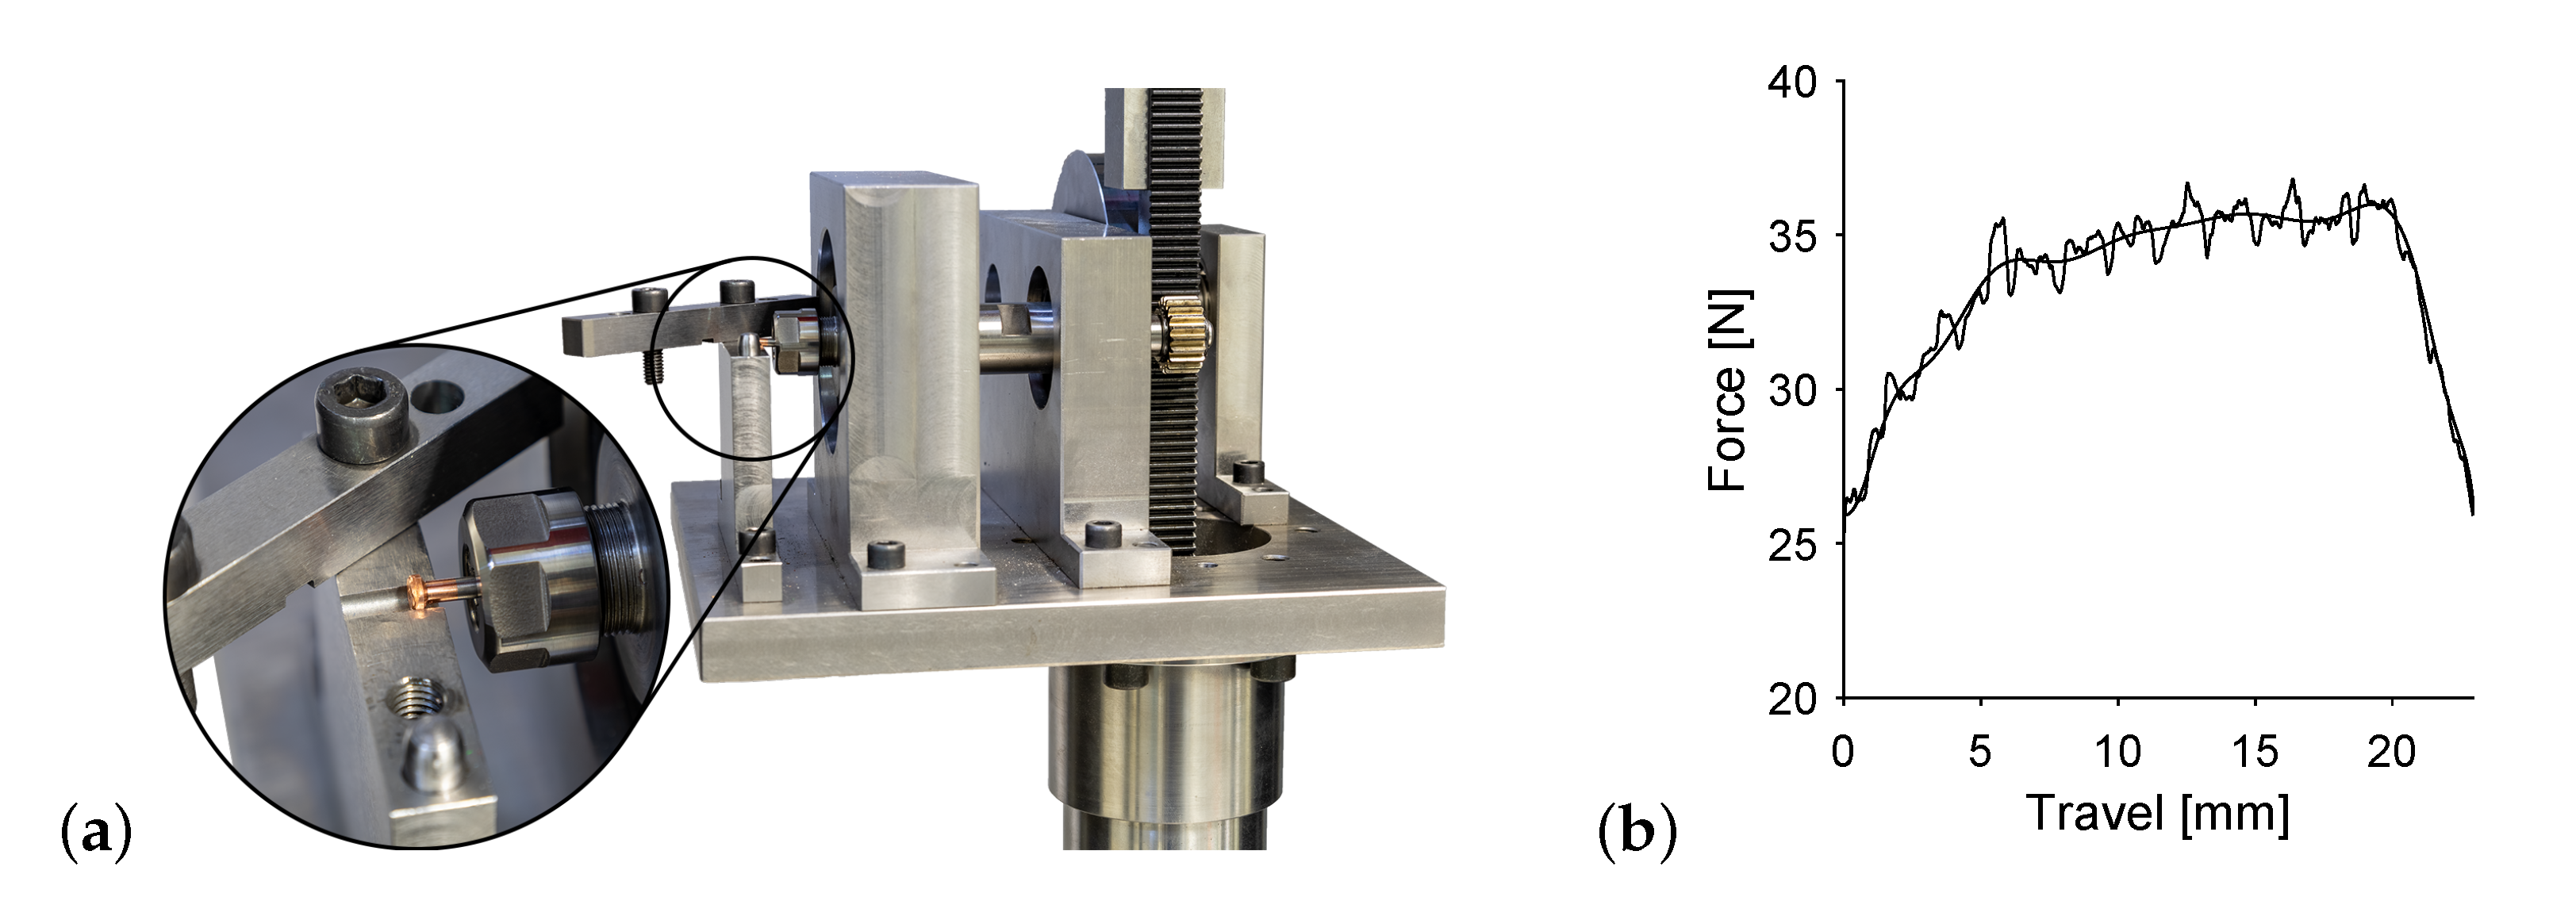
2.3. Testing
3. Results and Discussion
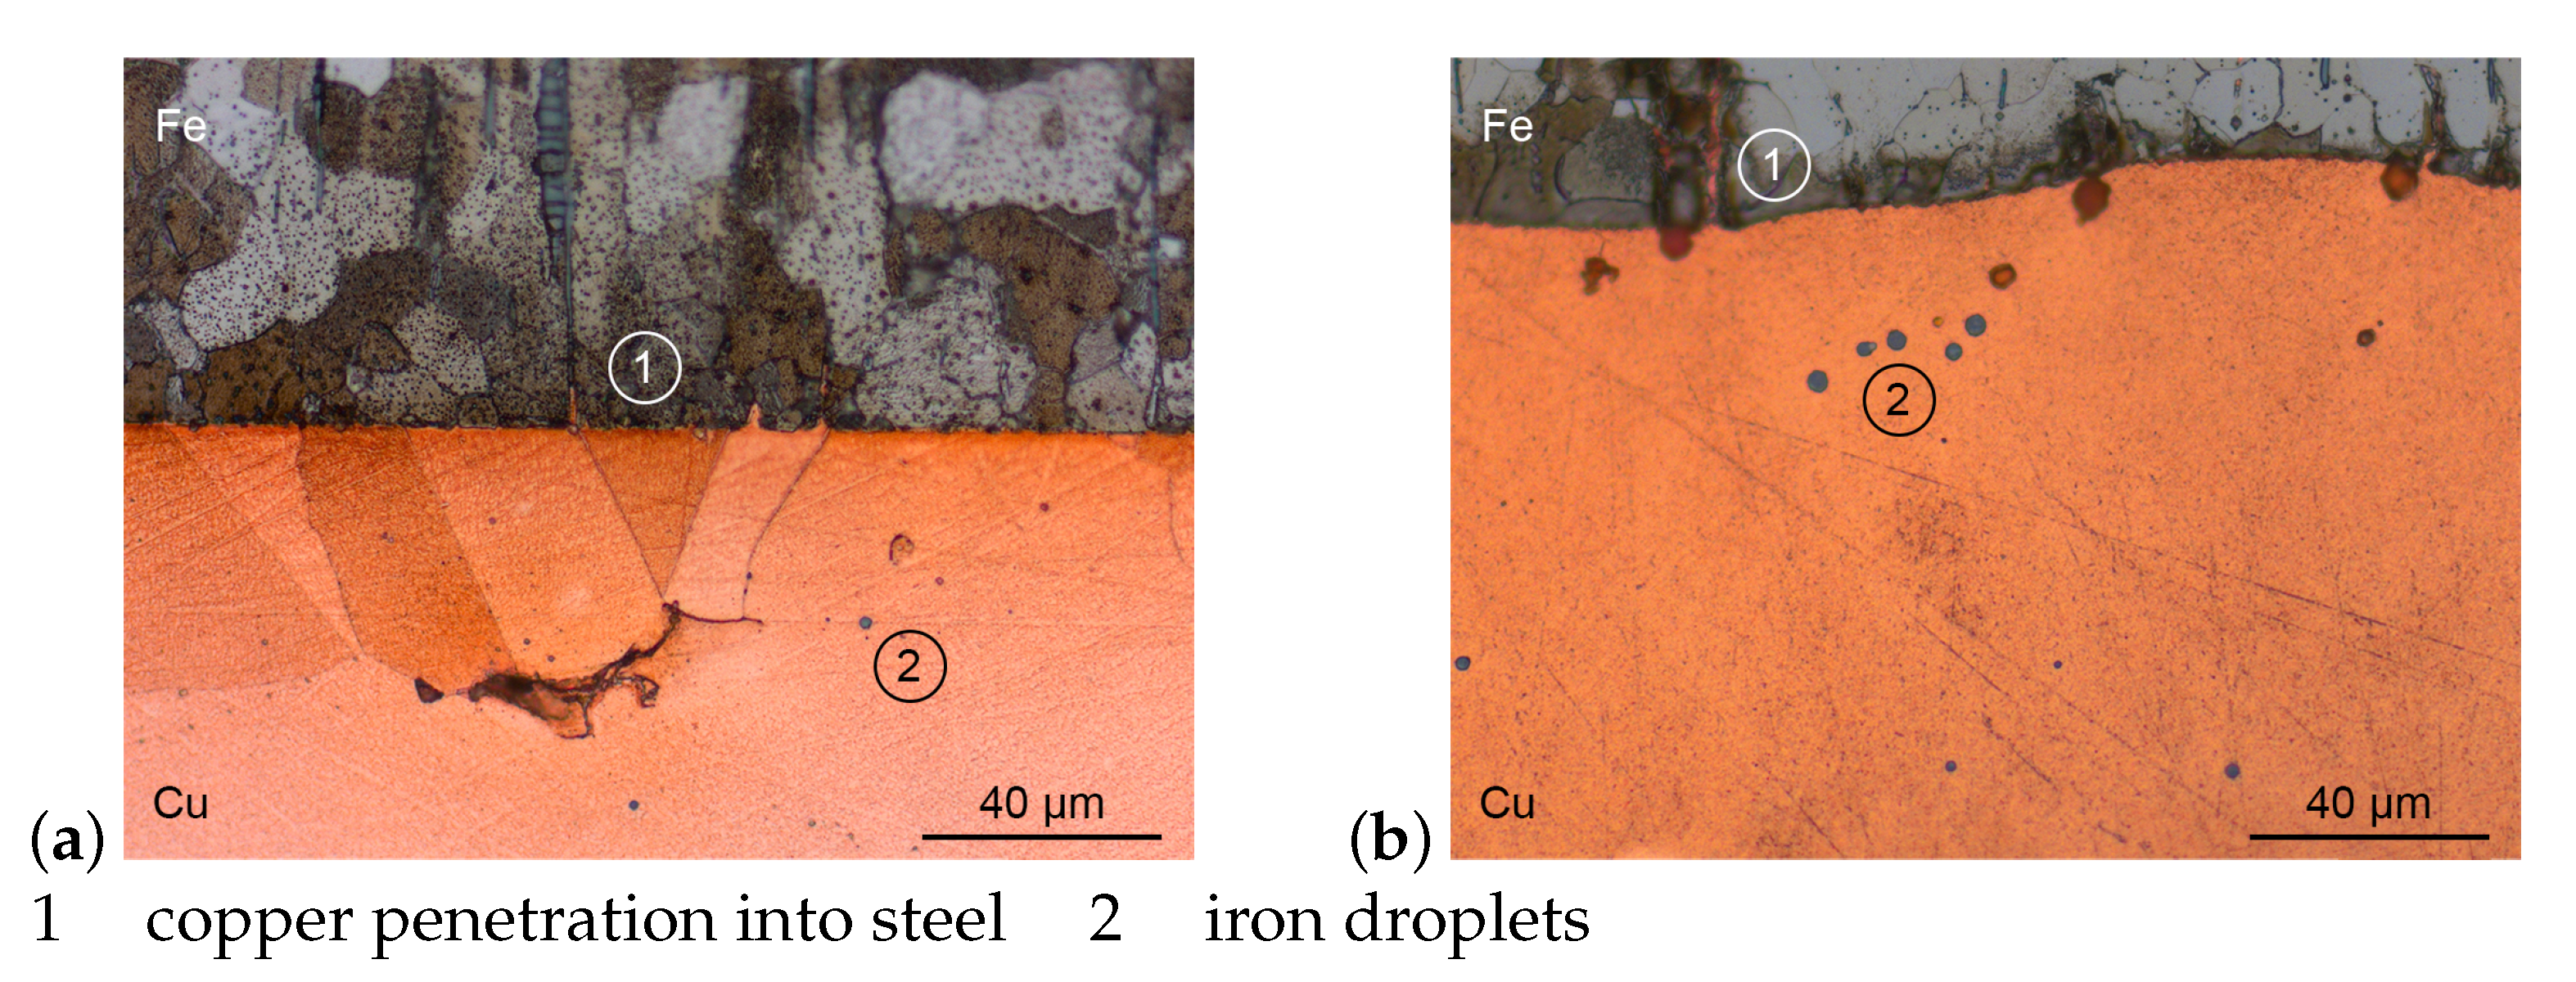
3.1. Microstructure
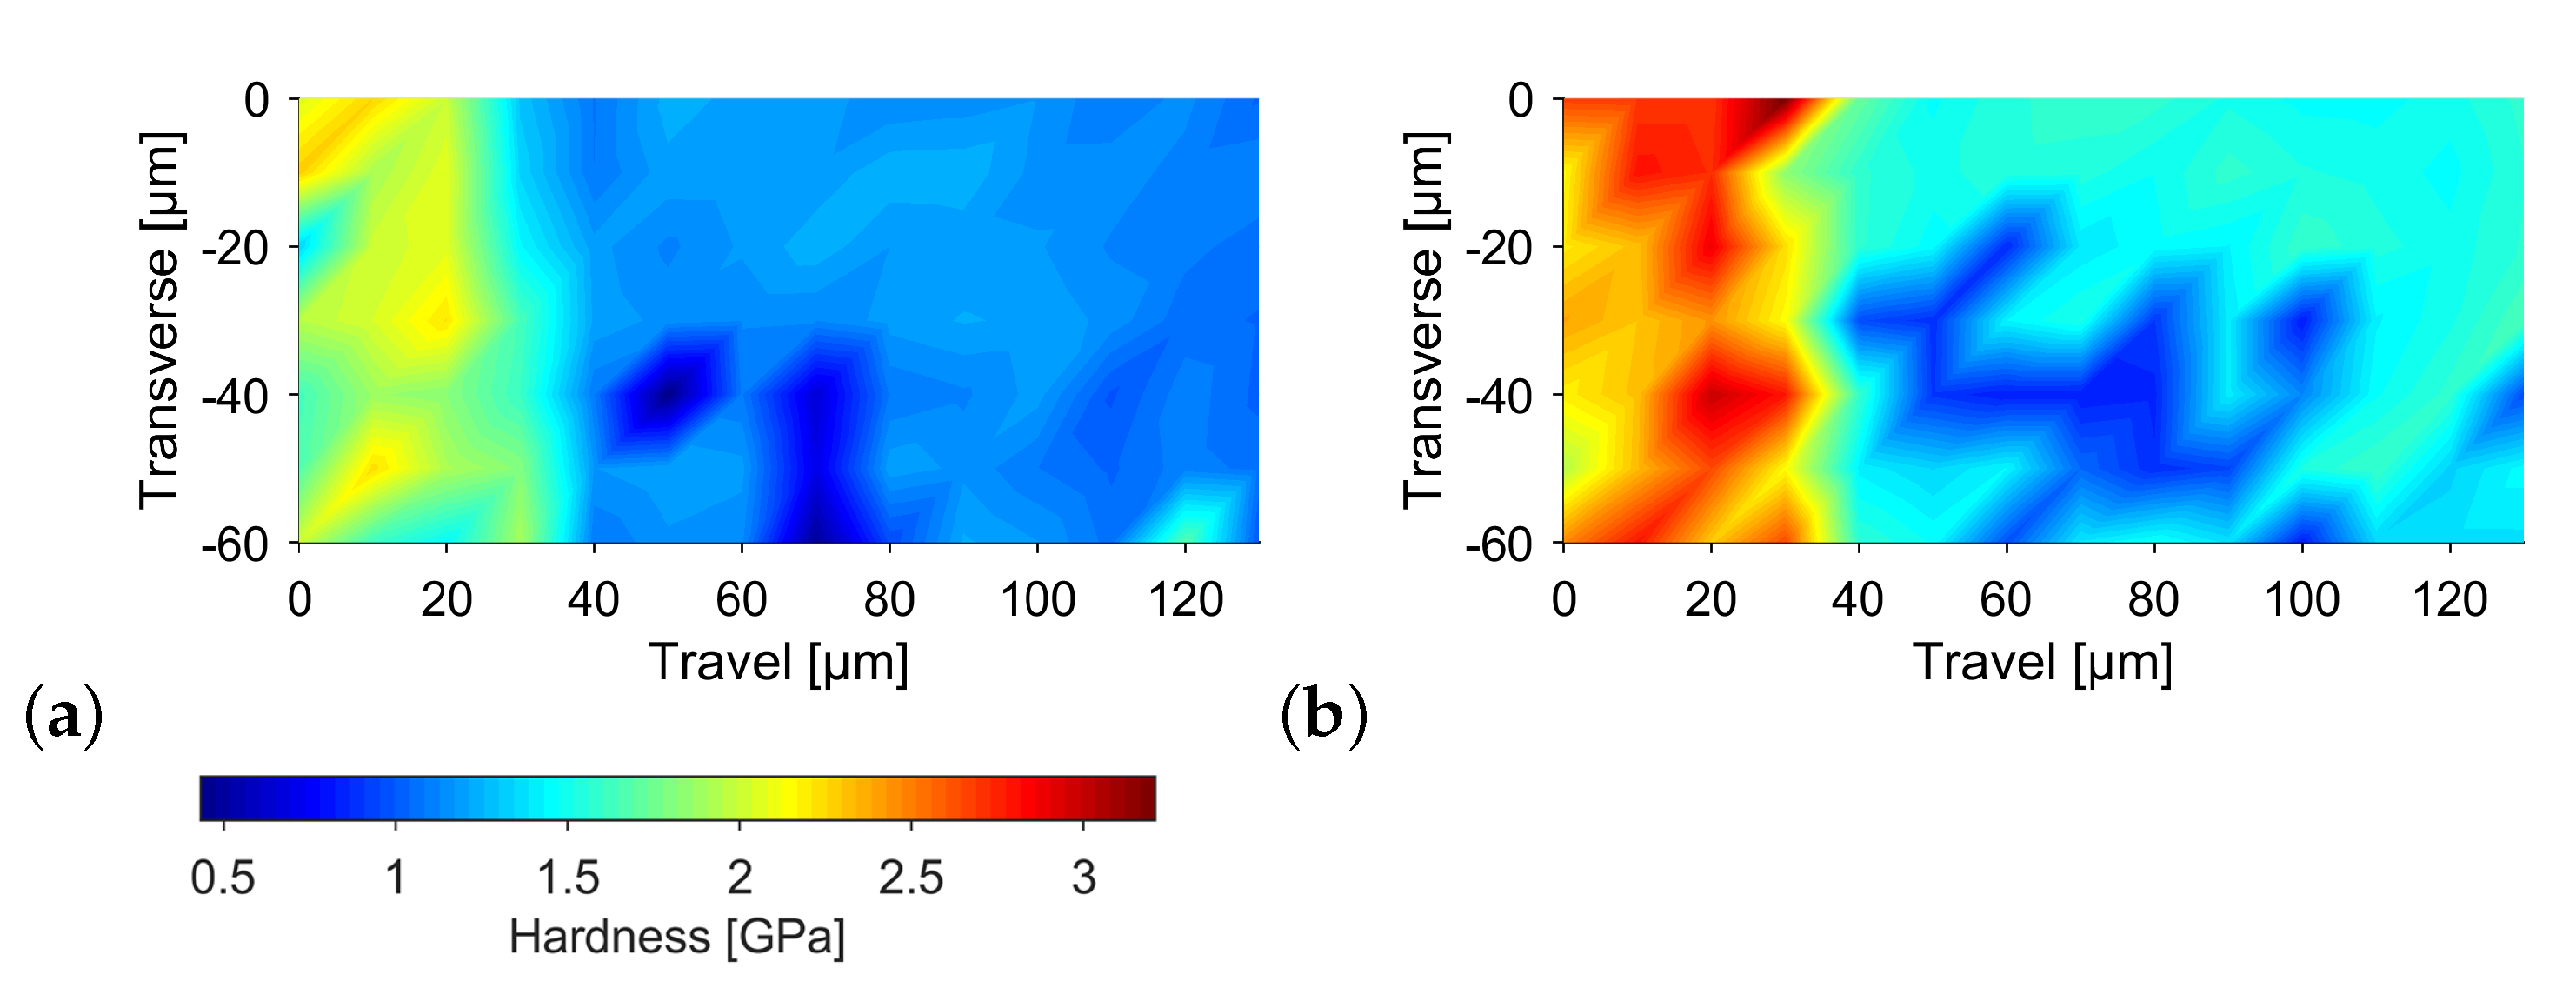
3.2. Hardness
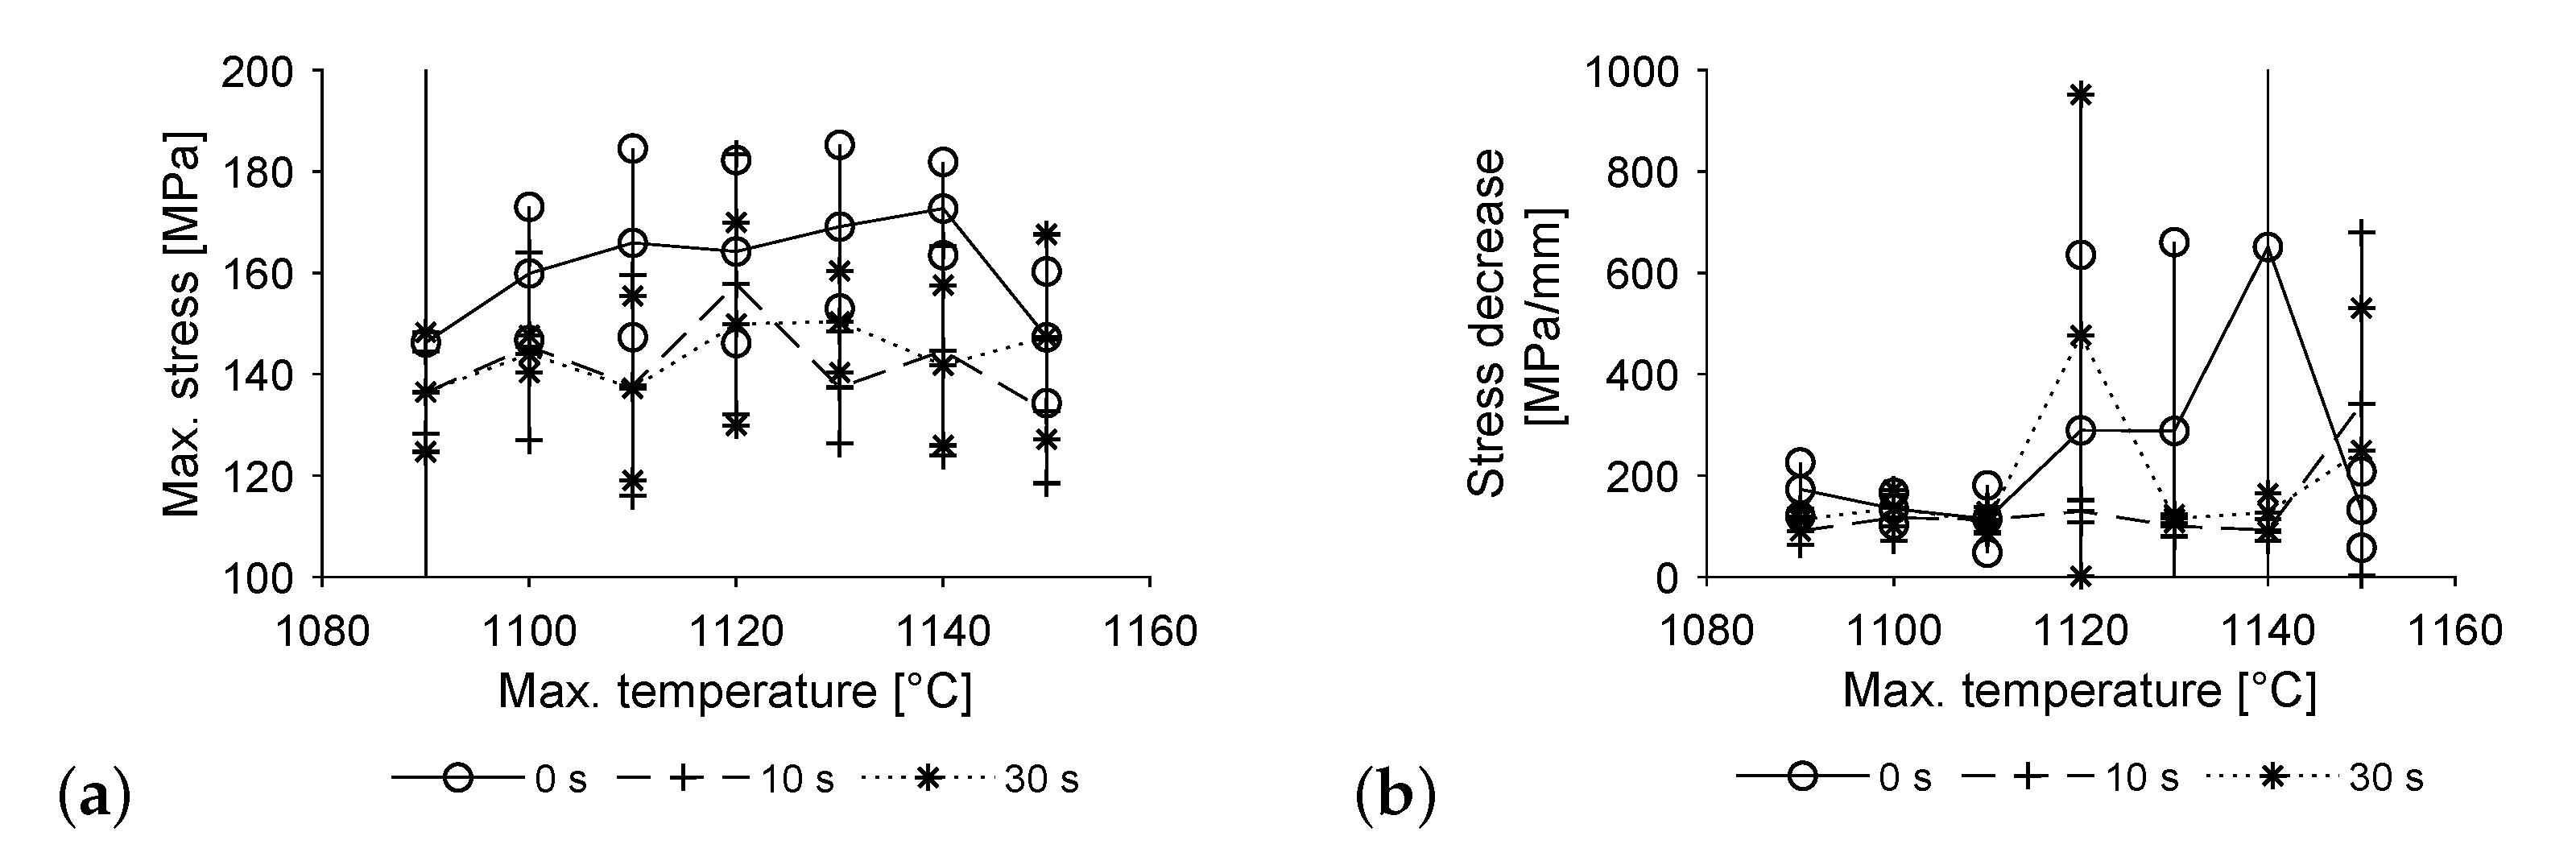
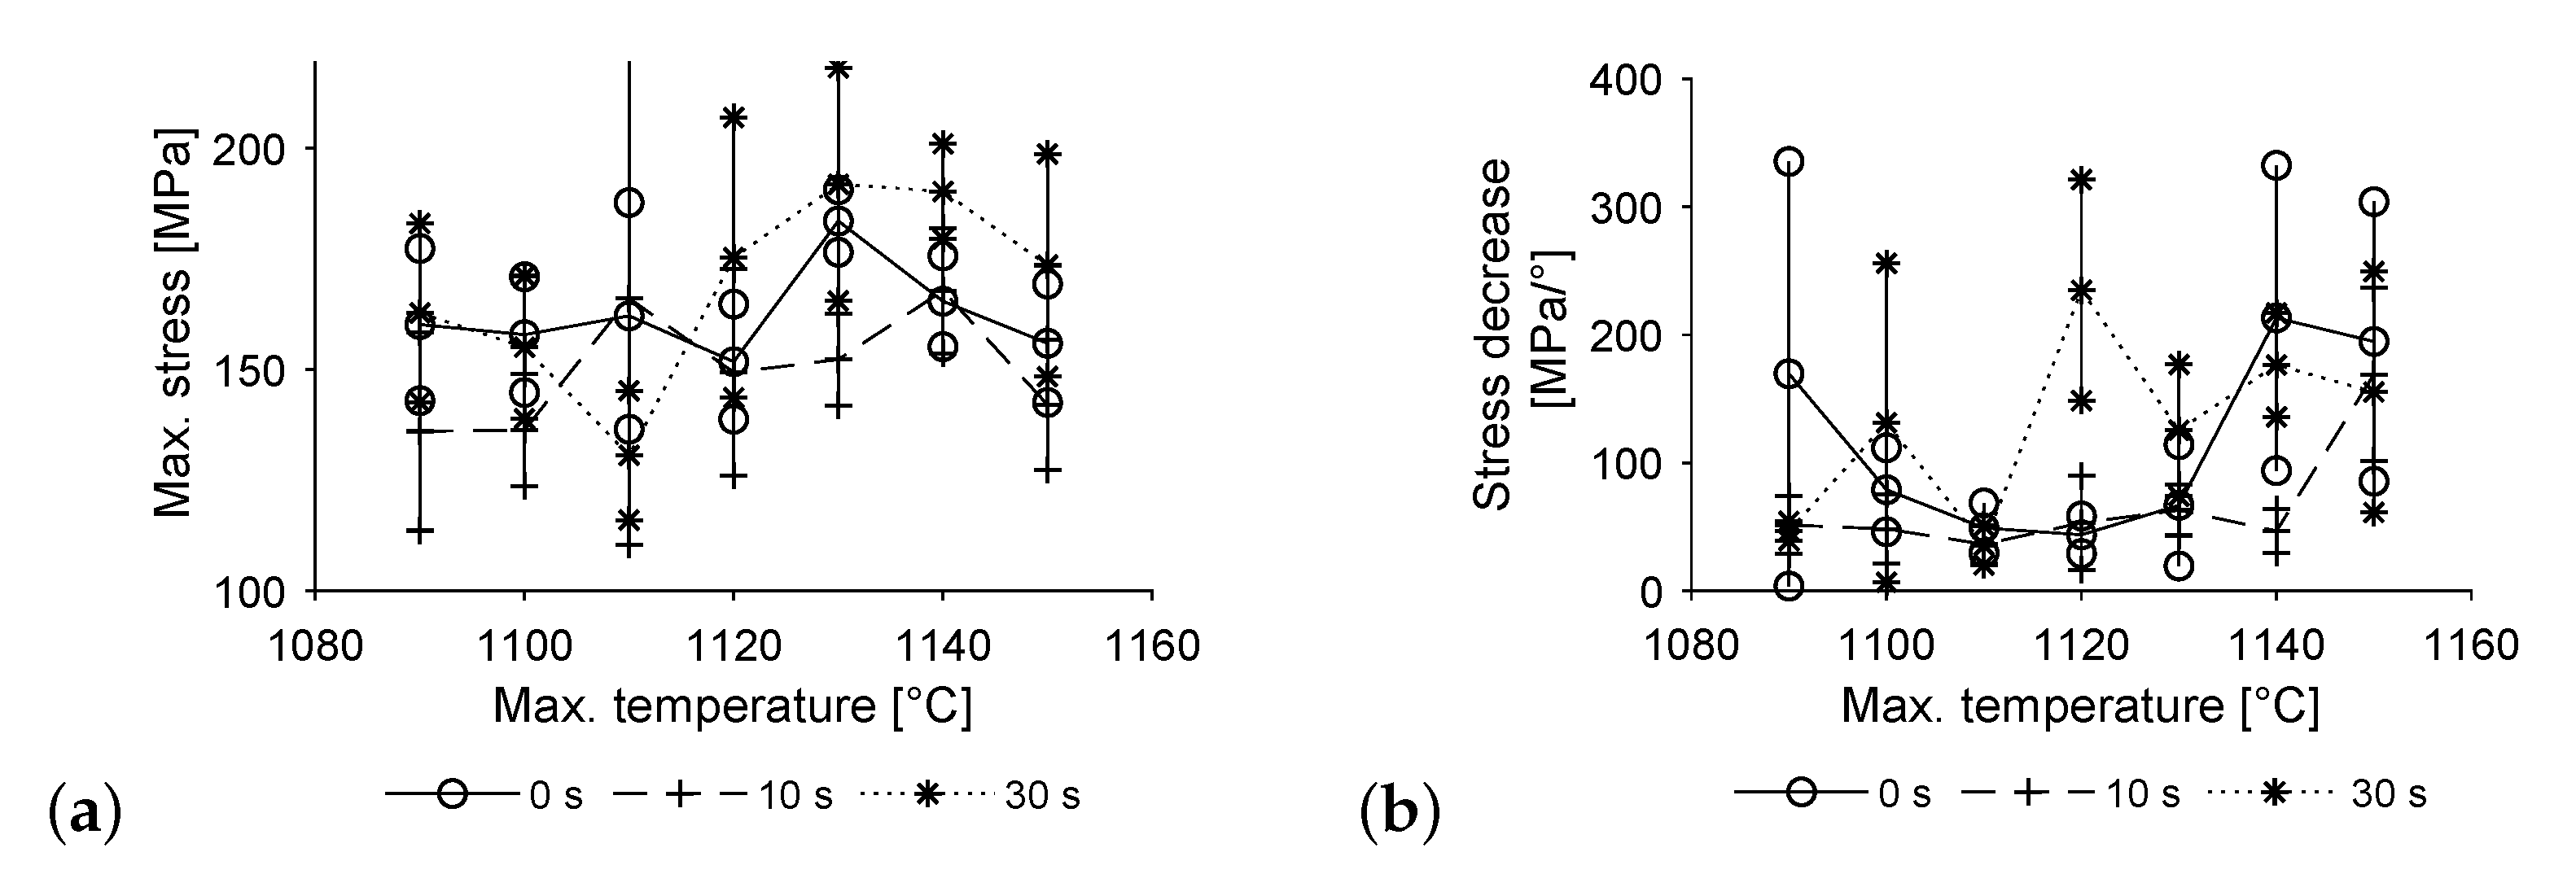
3.3. Mechanical Testing
4. Conclusions
Author Contributions
Funding
Institutional Review Board Statement
Informed Consent Statement
Data Availability Statement
Conflicts of Interest
References
- Nerl, C.; Wimmer, M.; Hoffmann, H.; Kaschnitz, E.; Langbein, F.; Volk, W. Development of a continuous composite casting process for the production of bilayer aluminium strips. J. Mater. Process. Technol. 2014, 214, 1445–1455. [Google Scholar] [CrossRef]
- Hasse, S. Gießerei Lexikon. 19; Aufl Schiele & SchÖn: Berlin, Germany, 2007. [Google Scholar]
- Ißleib, A.; Friedel, A.; Lubojanski, I. Verbundgießen von Eisen-Kohlenstoff-Legierungen–grundlegende metallurgische Reaktionen an der Grenzfläche–Teil I. Gießerei-Prax. 1995, 15, 286–289. [Google Scholar]
- Mittler, T. Verbundstranggießen von Kupferwerkstoffen. Ph.D. Thesis, Technical University Munich, Munich, Germany, 2021. [Google Scholar]
- Steeg, M.; Engel, U.; Roemer, E. Hochleistungsfähige metallische Mehrschichtverbundwerkstoffe für Gleitlager. In Gleitlager Als Mod. Maschinenelemente. Teil A: Konstr. Werkst. Und Schmier. Von Radiallagern. Expert Ehningen; Expert-Verlag: Ehningen, Germany, 1993; pp. 237–258. [Google Scholar]
- Behrens, V. Elektrische Kontakte: Werkstoffe, Gestaltungen und Anwendungen in der Nachrichten-, Automobil-und Energietechnik; Expert-Verlag: Renningen, Germany, 2010. [Google Scholar]
- Flores, V.; Almanza, R. Behavior of the compound wall copper–steel receiver with stratified two-phase flow regimen in transient states when solar irradiance is arriving on one side of receiver. Sol. Energy 2004, 76, 195–198. [Google Scholar] [CrossRef]
- Hans, M.; Támara, J.C.; Mathews, S.; Bax, B.; Hegetschweiler, A.; Kautenburger, R.; Solioz, M.; Mücklich, F. Laser cladding of stainless steel with a copper–silver alloy to generate surfaces of high antimicrobial activity. Appl. Surf. Sci. 2014, 320, 195–199. [Google Scholar] [CrossRef]
- D’Andrea, D.; Epasto, G.; Bonanno, A.; Guglielmino, E.; Benazzi, G. Failure analysis of anti-friction coating for cylinder blocks in axial piston pumps. Eng. Fail. Anal. 2019, 104, 126–138. [Google Scholar] [CrossRef]
- Abbasi, M.; Toroghinejad, M.R. Effects of processing parameters on the bond strength of Cu/Cu roll-bonded strips. J. Mater. Process. Technol. 2010, 210, 560–563. [Google Scholar] [CrossRef]
- Liu, H.; Zhang, B.; Zhang, G. Enhanced toughness and fatigue strength of cold roll bonded Cu/Cu laminated composites with mechanical contrast. Scr. Mater. 2011, 65, 891–894. [Google Scholar] [CrossRef]
- Vinaricky, E. Elektrische Kontakte, Werkstoffe und Anwendungen; Springer: Berlin, Germany, 2002. [Google Scholar]
- Pan, D.; Gao, K.; Yu, J. Cold roll bonding of bimetallic sheets and strips. Mater. Sci. Technol. 1989, 5, 934–939. [Google Scholar] [CrossRef]
- Münster, D.; Hirt, G. Copper Clad Steel Strips Produced by a Modified Twin-Roll Casting Process. Metals 2019, 9, 1156. [Google Scholar] [CrossRef] [Green Version]
- Chen, G.; Xu, G. Effects of melt pressure on process stability and bonding strength of twin-roll cast steel/aluminum clad sheet. J. Manuf. Process. 2017, 29, 438–446. [Google Scholar] [CrossRef]
- Kadoshnikov, V.I.; Kulikova, E.V.; Dema, R.R.; Kharchenko, M.V.; Androsenko, M.V.; Latypov, O.R. Manufacturing Technology Improvement of Technology and Equipment for Preparing Steel-Copper Wire. Chem. Pet. Eng. 2019, 55, 76–83. [Google Scholar] [CrossRef]
- Kasper, W. Dynaplat® Sprengplattierung-eine explosive Verbindung. STAHL 2000, 5, 44–47. [Google Scholar]
- Langeslag, S.; Sgobba, S.; Libeyre, P.; Gung, C.Y. Extensive characterisation of copper-clad plates, bonded by the explosive technique, for ITER electrical joints. Phys. Procedia 2015, 67, 1036–1042. [Google Scholar] [CrossRef] [Green Version]
- Haubenberger, W. Ein Kupfer-Austenit-Verbundleiter fuer hohe mechanische Beanspruchung. Metall 1980, 34, 999–1001. [Google Scholar]
- Zhi-shui, Y.; Feng-jiang, W.; Xiao-quan, L.; Ming-fang, W. Diffusion bonding of copper alloy to stainless steel with Ni and Cu interlayer. Trans. Nonferrous Met-Als Soc. China 2000, 10, 88–91. [Google Scholar]
- Dong, L.; Chen, W.; Hou, L.; Liu, Y.; Luo, Q. Metallurgical process analysis and microstructure characterization of the bonding interface of QAl9-4 aluminum bronze and 304 stainless steel composite materials. J. Mater. Process. Technol. 2016, 238, 325–332. [Google Scholar] [CrossRef]
- Sürül, K. Entwicklung von neuartigen Bindeschichten zur Verbesserung der Bindefestigkeit von Zinnbasis-Gleitlagermetallen; Rheinisch-Westfälischen Technischen Hochschule Aachen: Aachen, Germany, 2009. [Google Scholar]
- Hejazi, M.M.; Divandari, M.; Taghaddos, E. Effect of copper insert on the microstructure of gray iron produced via lost foam casting. Mater. Des. 2009, 30, 1085–1092. [Google Scholar] [CrossRef]
- DIN EN ISO 7500-1 Metallic Materials-Calibration and Verification of Static Uniaxial Testing Machines-Part 1: Tension/Compression Testing Machines-Calibration and Verification of the Force-Measuring System; German Institute for Standardization: Berlin, Germany, 2018.
- DIN EN ISO 6892-1:2020-06, Metallische Werkstoffe-Zugversuch-Teil 1: Prüfverfahren bei Raumtemperatur (ISO 6892-1:2019); Deutsche Fassung EN ISO 6892-1:2019; German Institute for Standardization: Berlin, Germany, 2020.


| Element (mass %) | Cu | Fe | C | Mn | Ni | Cr |
|---|---|---|---|---|---|---|
| Cu-ETP | ≥99.9 | 0.03 | - | - | - | - |
| Steel | 0.02 | 98.3 | 0.13 | 1.04 | 0.02 | 0.03 |
Publisher’s Note: MDPI stays neutral with regard to jurisdictional claims in published maps and institutional affiliations. |
© 2021 by the authors. Licensee MDPI, Basel, Switzerland. This article is an open access article distributed under the terms and conditions of the Creative Commons Attribution (CC BY) license (https://creativecommons.org/licenses/by/4.0/).
Share and Cite
Kammerloher, S.; Hoyer, J.; Lechner, P.; Mittler, T.; Volk, W. A Method for Characterising the Influence of Casting Parameters on the Metallurgical Bonding of Copper and Steel Bimetals. Materials 2021, 14, 6223. https://0-doi-org.brum.beds.ac.uk/10.3390/ma14206223
Kammerloher S, Hoyer J, Lechner P, Mittler T, Volk W. A Method for Characterising the Influence of Casting Parameters on the Metallurgical Bonding of Copper and Steel Bimetals. Materials. 2021; 14(20):6223. https://0-doi-org.brum.beds.ac.uk/10.3390/ma14206223
Chicago/Turabian StyleKammerloher, Simon, Julika Hoyer, Philipp Lechner, Tim Mittler, and Wolfram Volk. 2021. "A Method for Characterising the Influence of Casting Parameters on the Metallurgical Bonding of Copper and Steel Bimetals" Materials 14, no. 20: 6223. https://0-doi-org.brum.beds.ac.uk/10.3390/ma14206223