
Investigations of the Influence of Nano-Admixtures on Early Hydration and Selected Properties of Calcium Aluminate Cement Paste


Abstract
:1. Introduction
2. Materials and Research Methods
3. Results and Discussion
3.1. Calorimetry Measurements
3.2. Flowability Properties of Cement Paste
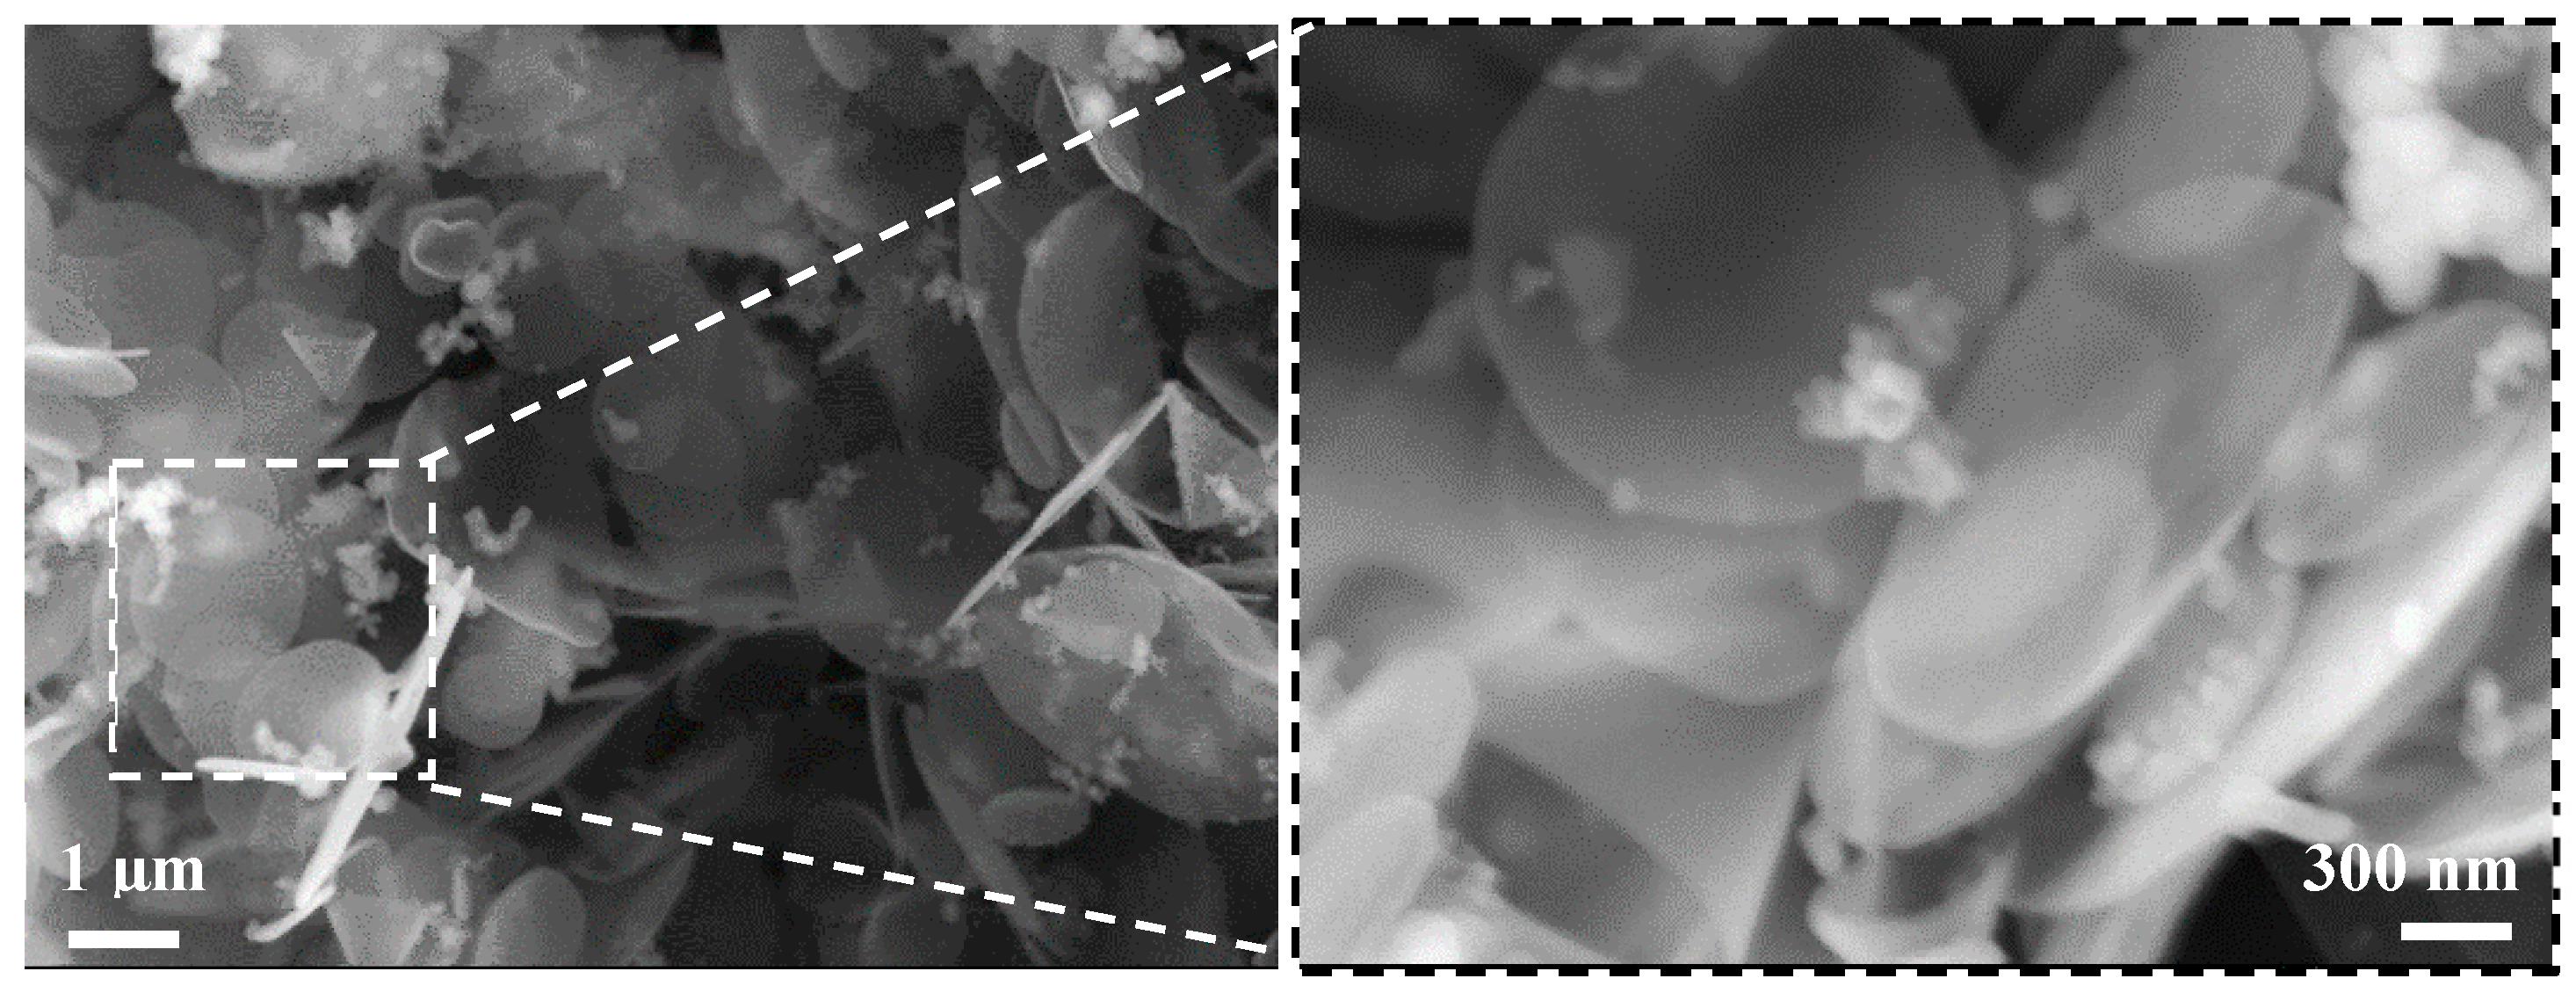
3.3. SEM Analysis
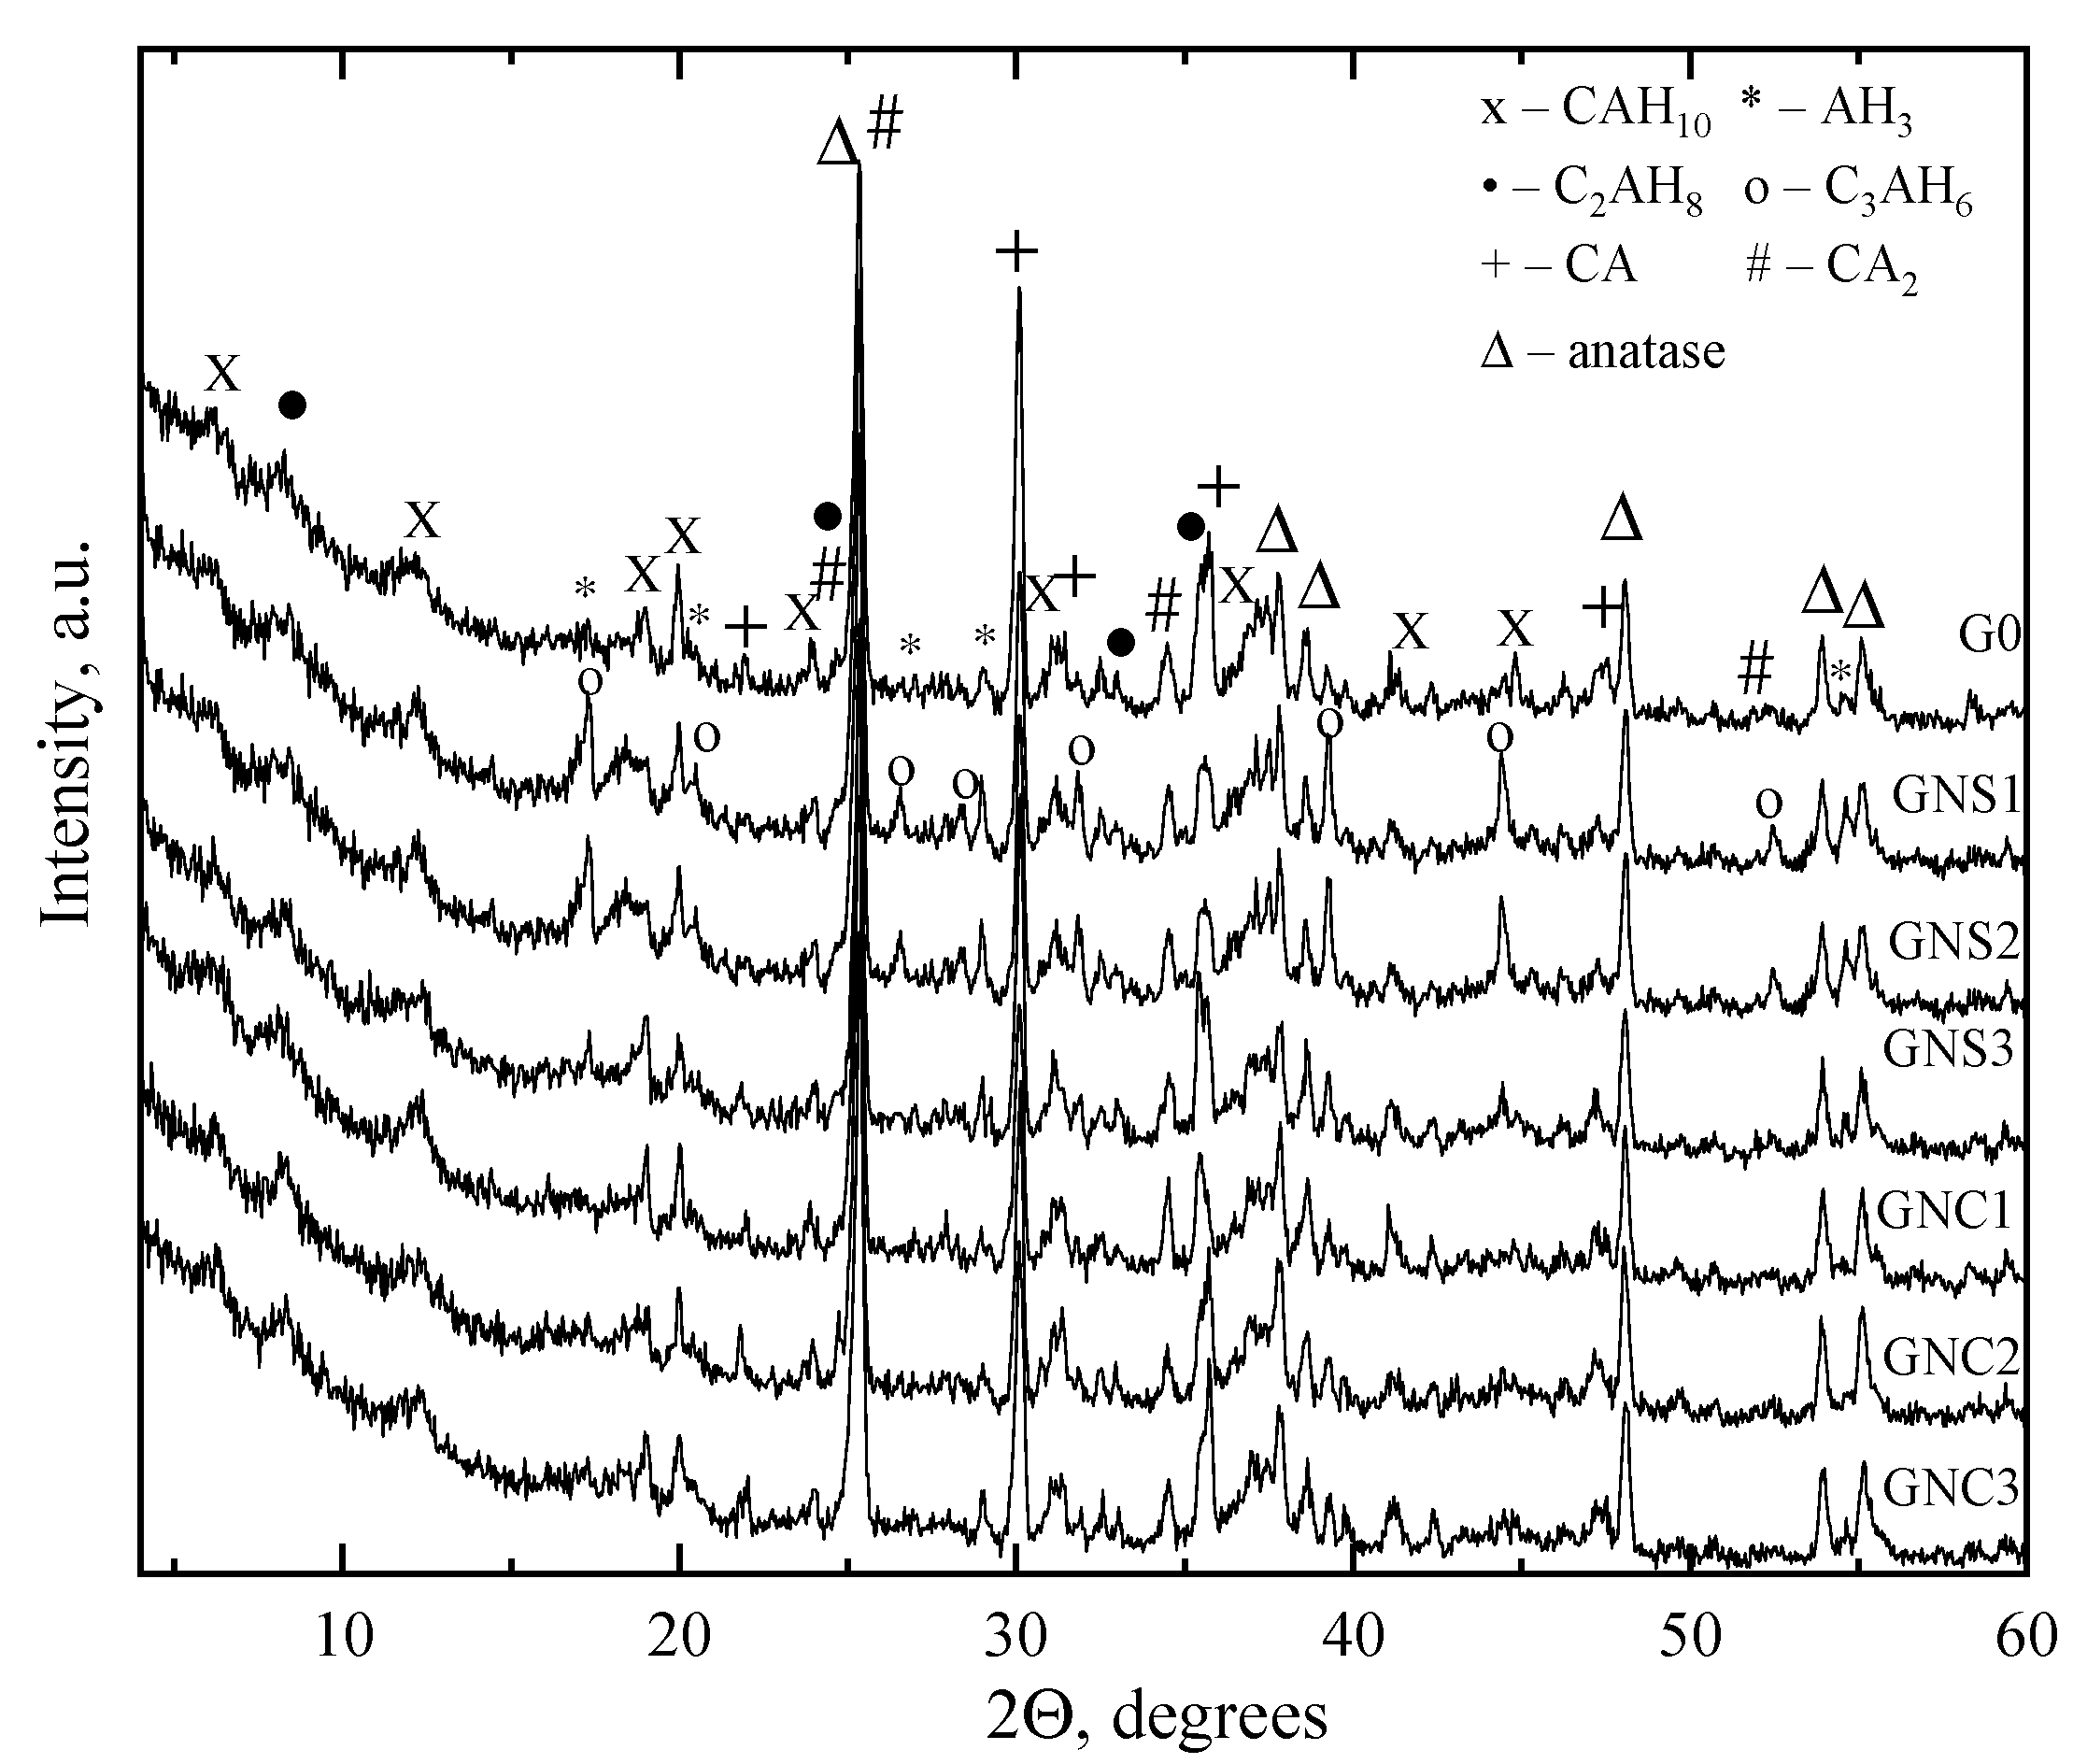
3.4. XRD Analysis
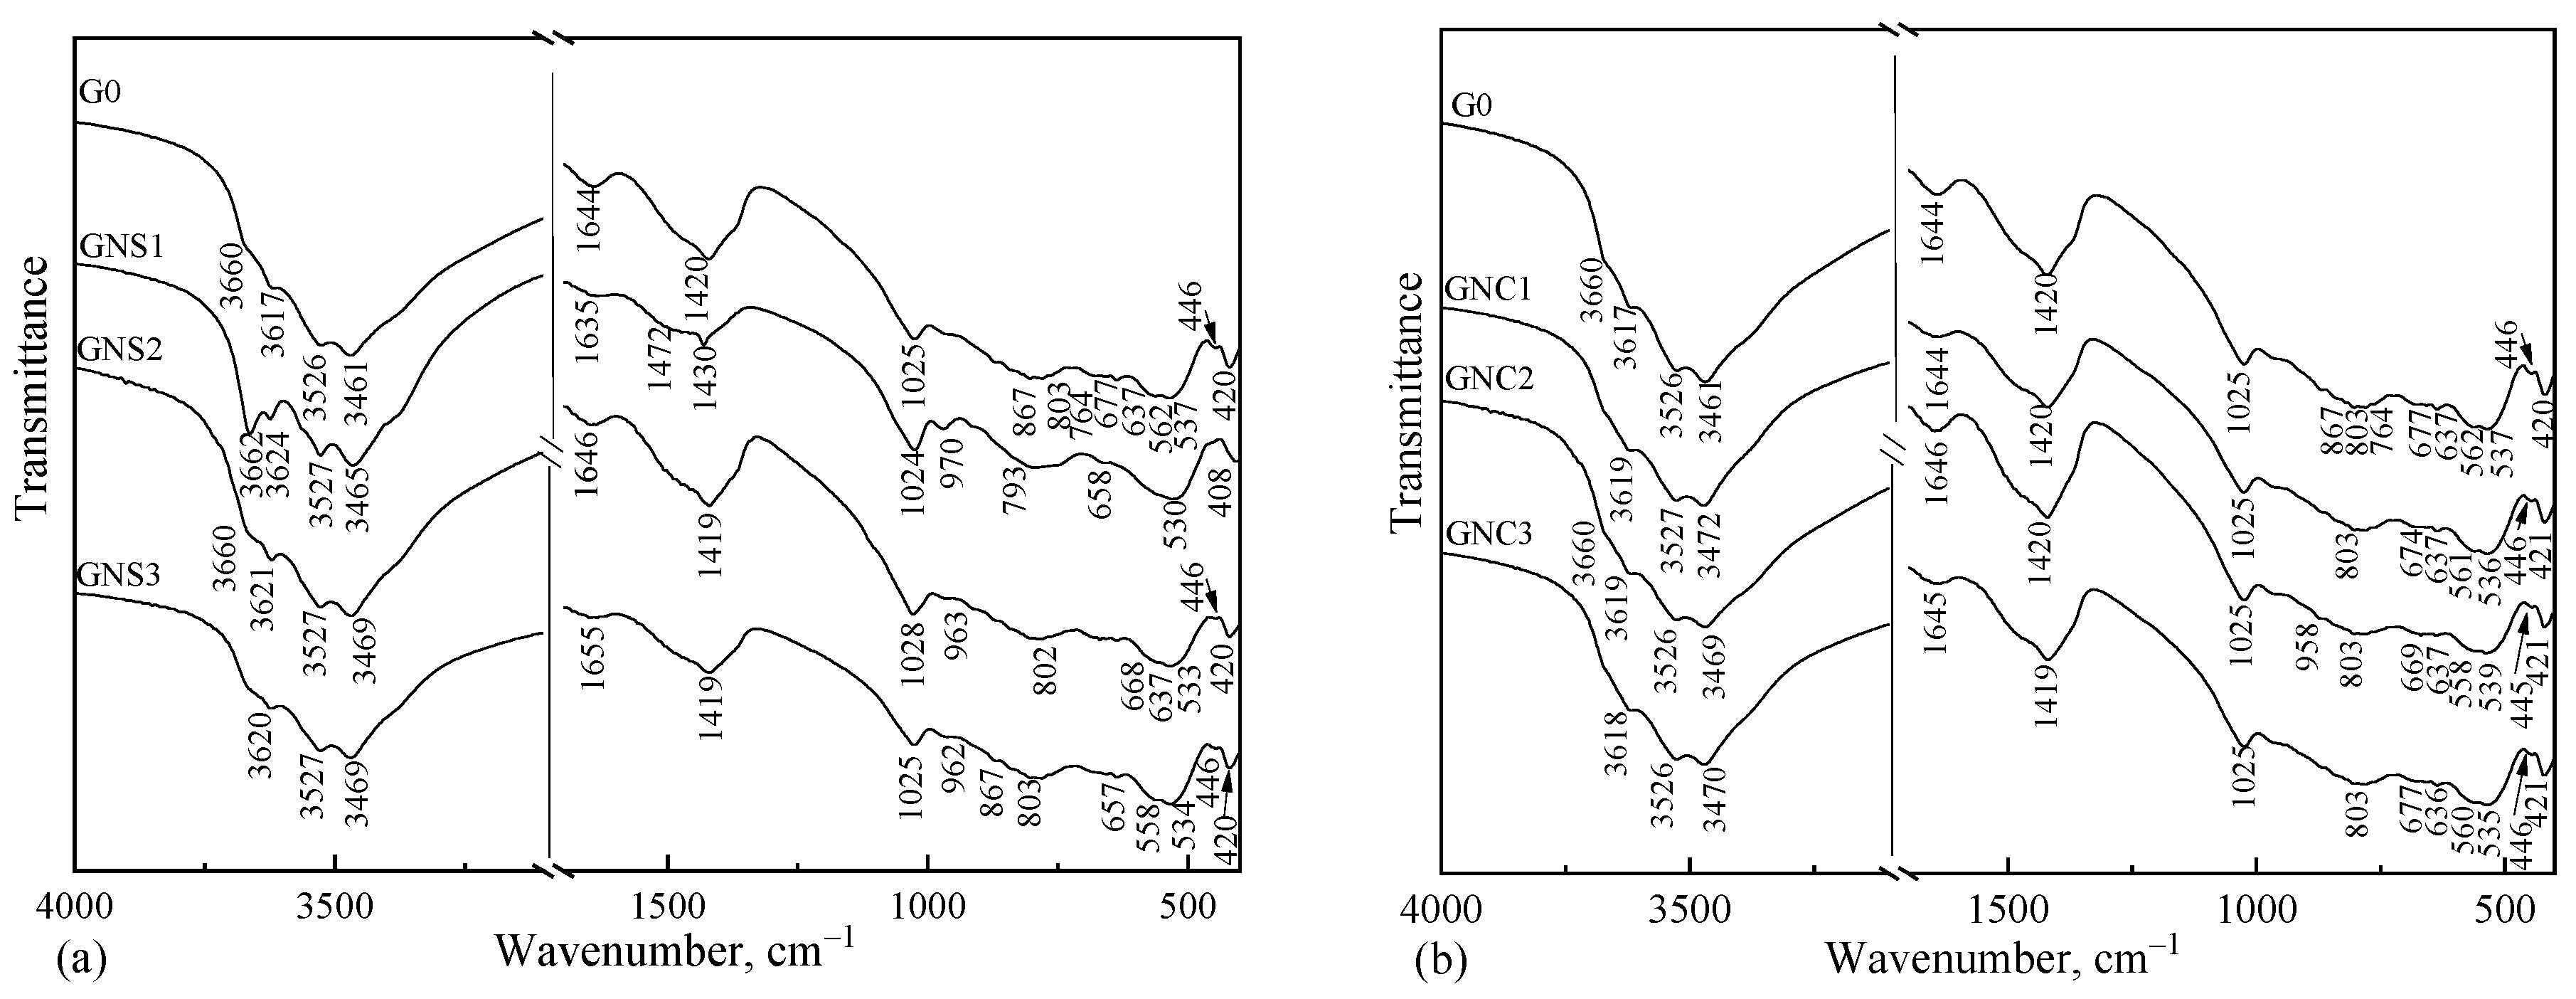
3.5. Infrared Spectroscopy
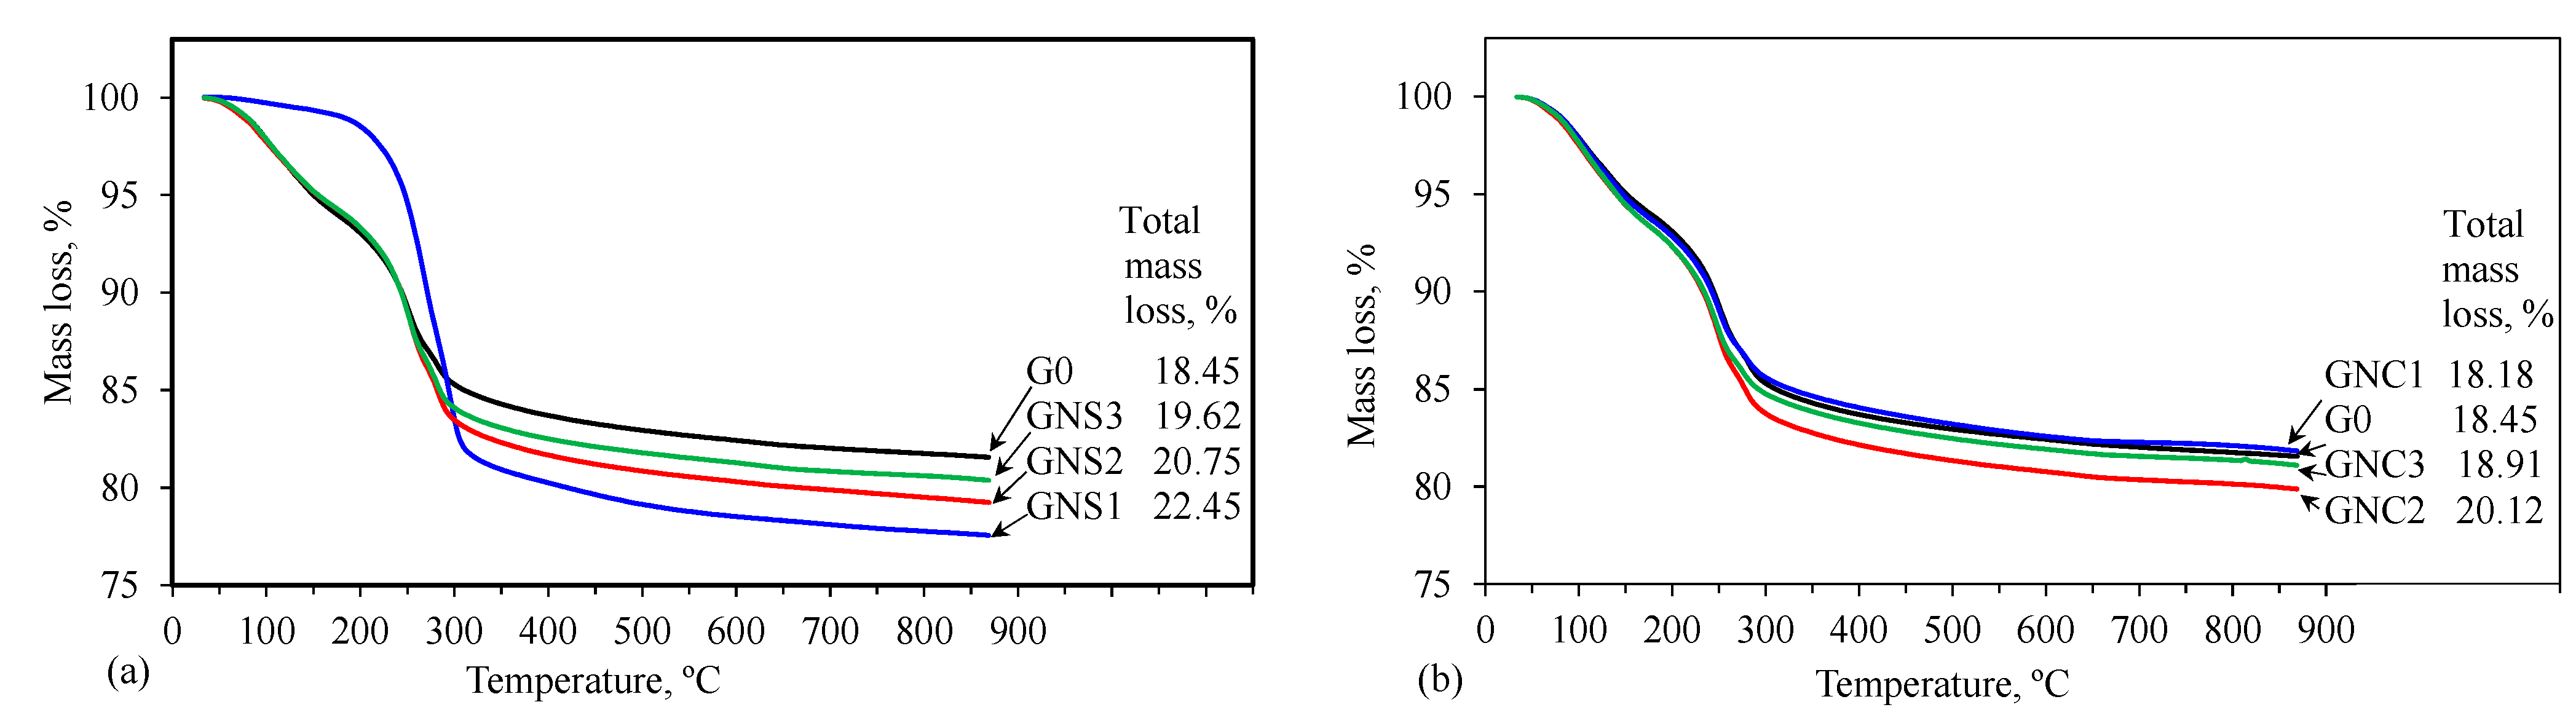
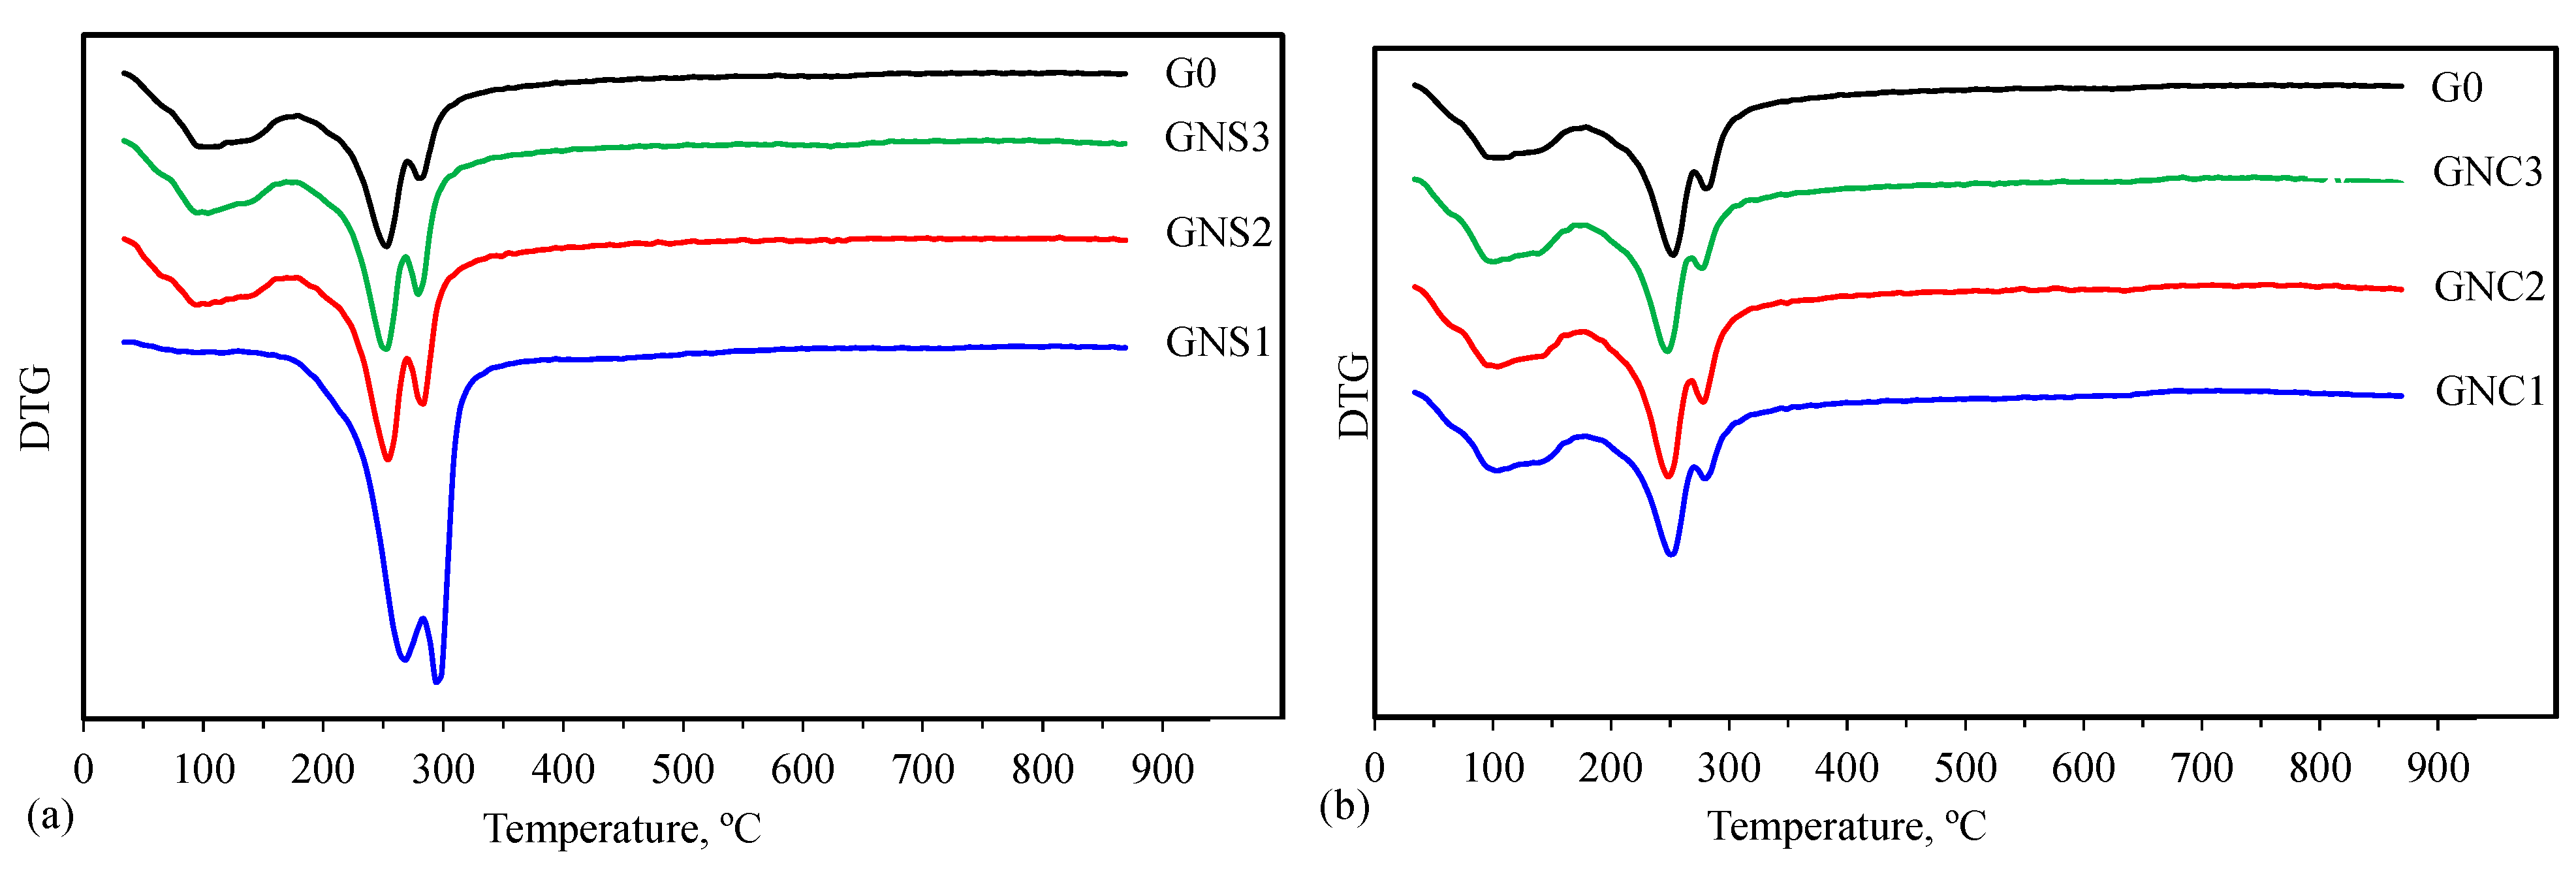
3.6. Thermal Analysis
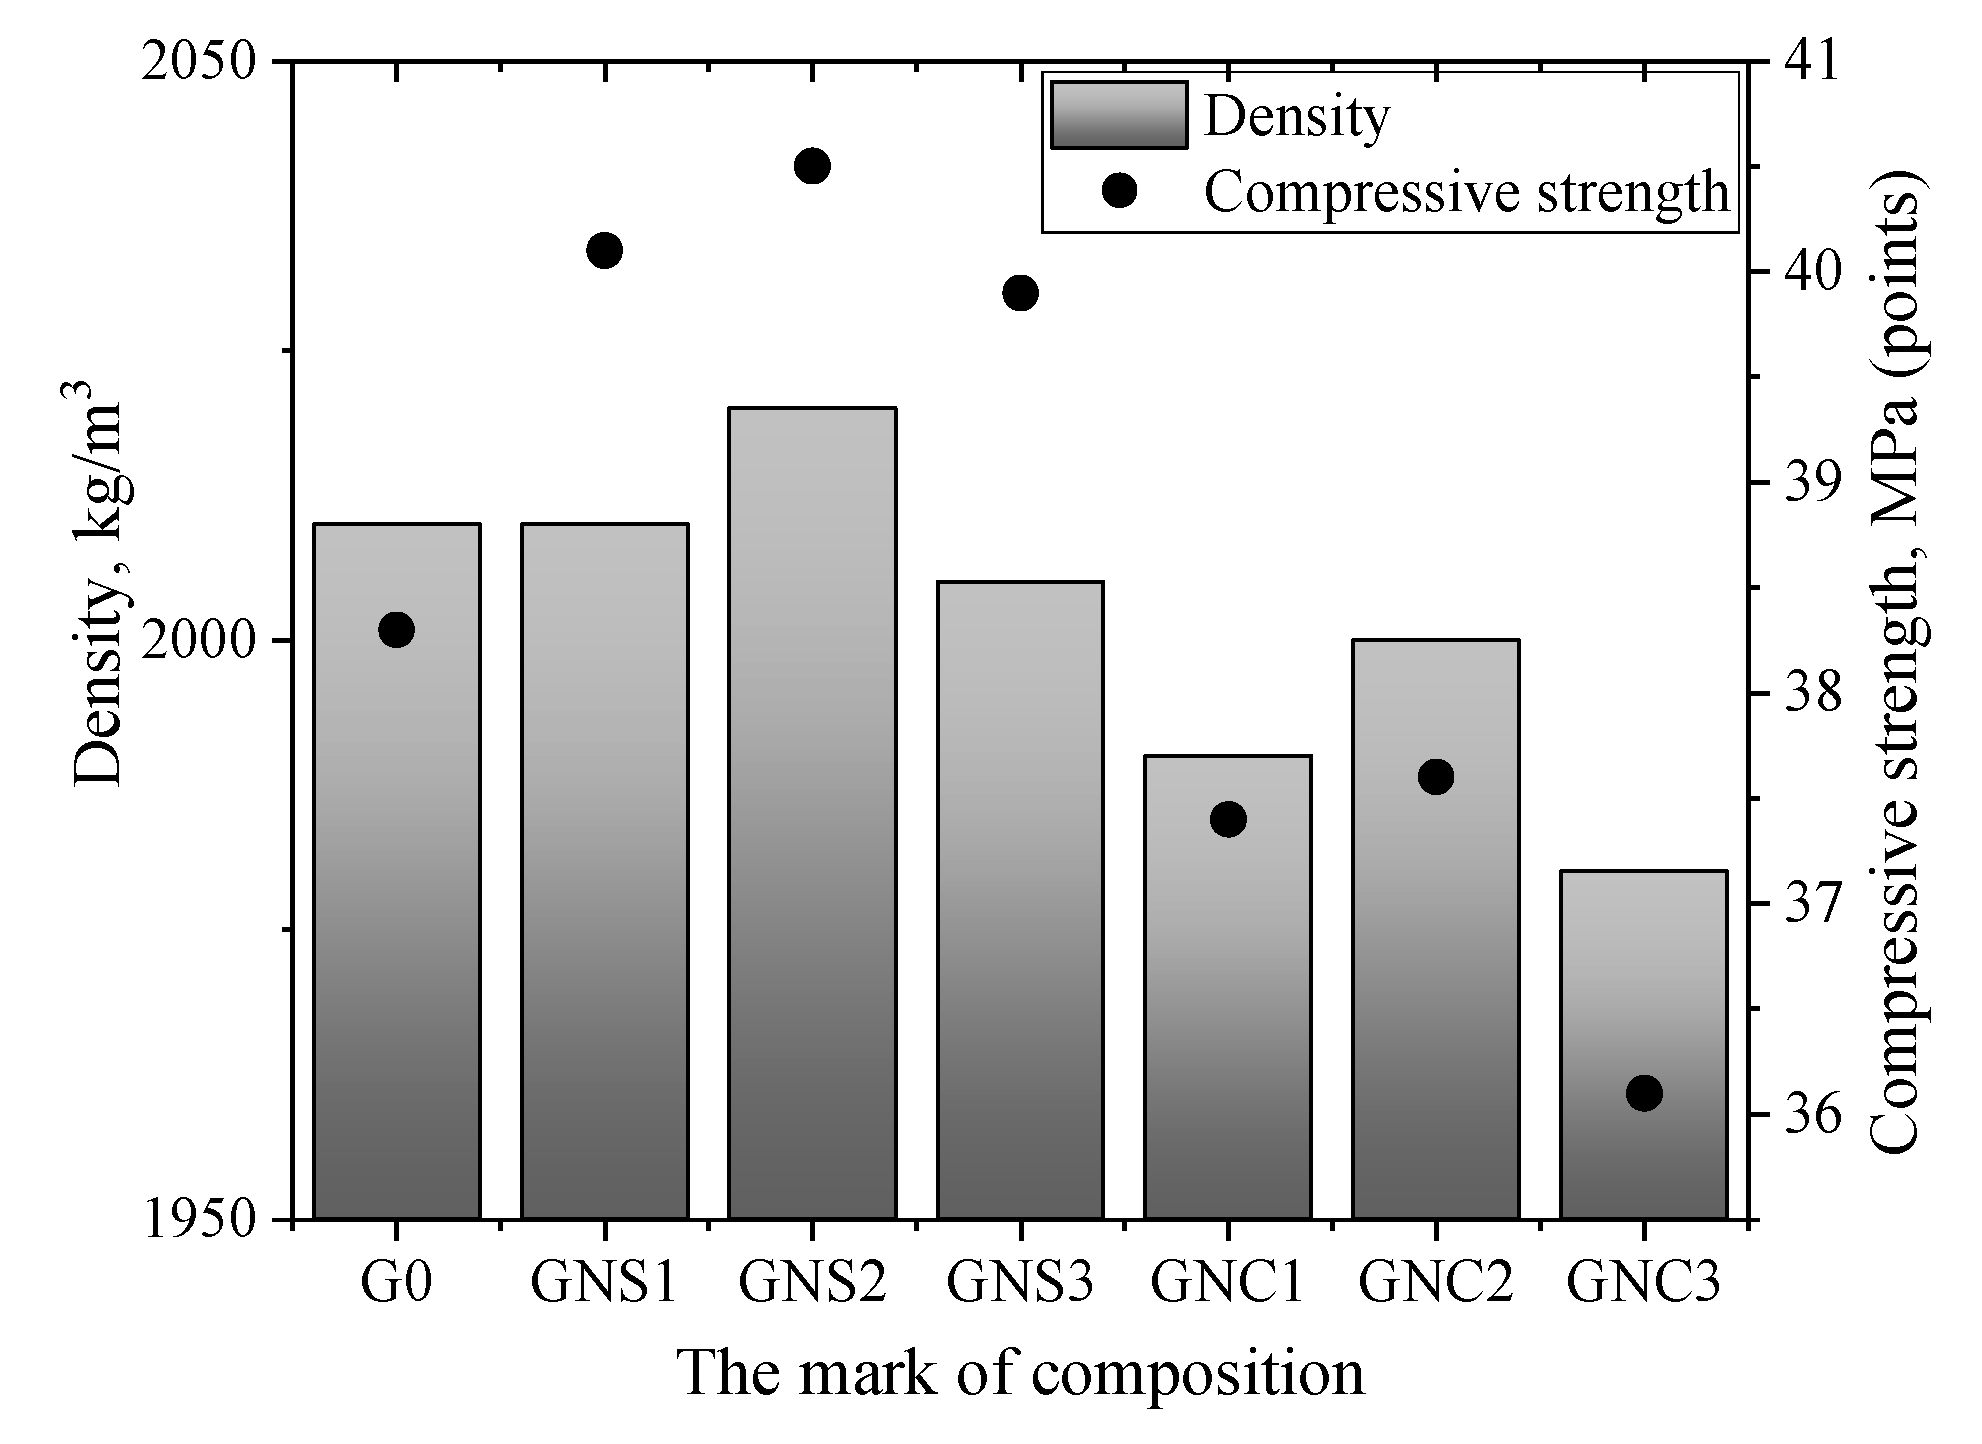
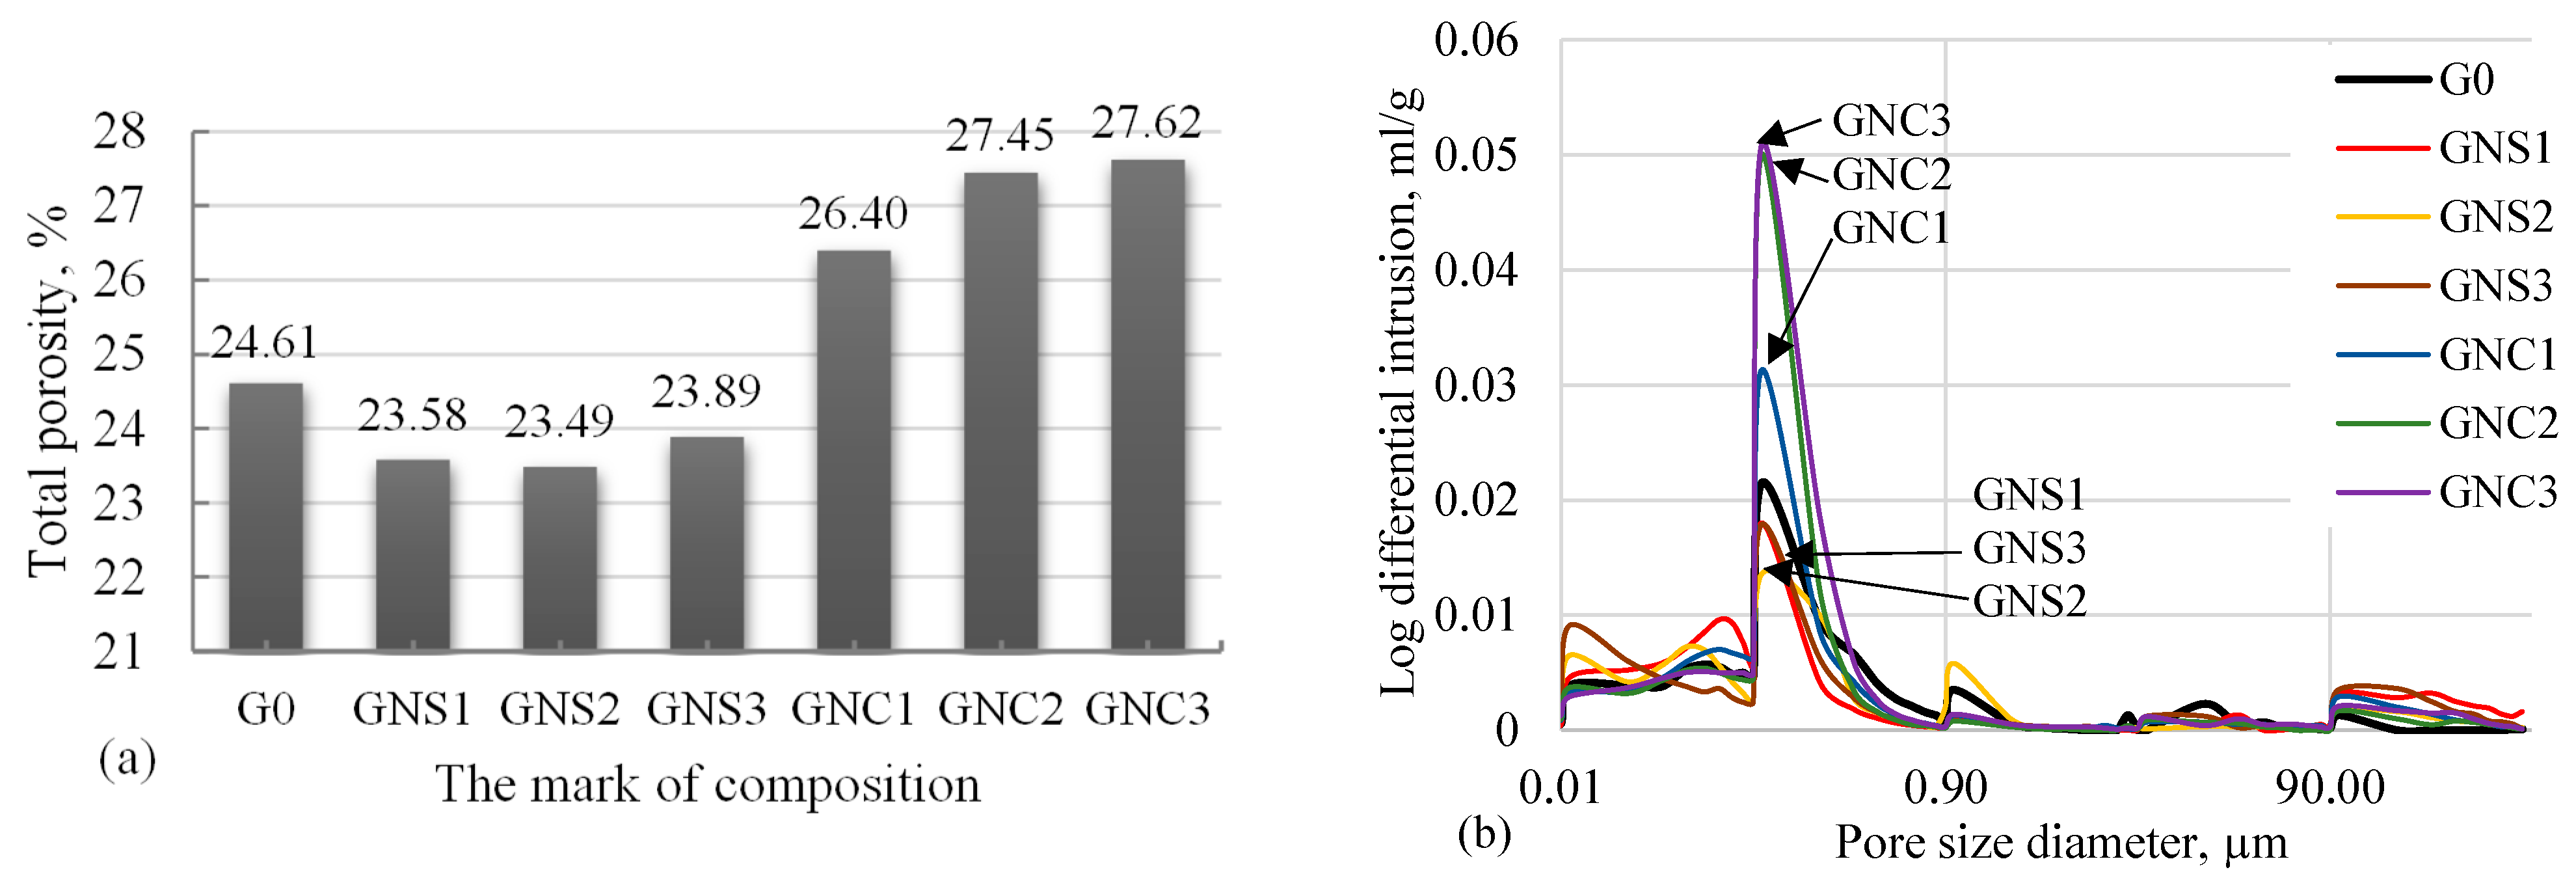
3.7. Density, Compressive Strength and MIP Results
4. Conclusions
- Based on the analysis of calorimetry results, it can be concluded that the admixtures change the kinetics of early cement hydration: NS accelerates the hydration processes and generates more heat, NC retard cement hydration and decrease the cumulative heat evolved. This is the effect of nucleating activity of NS grains which are significantly smaller compared to the grains of NC.
- The presence of NS, especially used in the smallest amount, improves the flowability of the cement paste, while NC do not affect it significantly.
- When NS was added to the CAC paste, after 3 days of hardening the cement paste showed better agglomeration of the particles, the microstructure was more densified, and small-size hydrates were formed. The samples containing NS also exhibited lower porosity. In the case of the pastes with NC, the microstructure was more porous with cracks in some places, and the total porosity was higher.
- In general, the same kinds of hydration products were created in all CAC pastes tested, although the quantitative composition was different. NC practically had no influence on the hydration products formed compared to the results of the reference paste, while the presence of NS changed the hydration mechanism.
- In the case of NS, more hydrates C3AH6 and AH3 were formed compared to the reference paste and the pastes containing NC. This is especially visible in the pastes with the lowest content of NS admixture. This is probably due to the complex effect of self-heating of the paste, low w/c ratio, an improvement of dissolution of cement grains, and acceleration of its hydration.
- The compressive strength of cement pastes after 3 days of hydration was higher in NS-admixtured pastes, and lower for NC-admixtured samples, compared to the results of the reference sample.
Author Contributions
Funding
Institutional Review Board Statement
Informed Consent Statement
Conflicts of Interest
References
- Heikal, M.; Radwan, M.M.; Morsy, M.S. Influence of curing temperature on the physicomechanical, characteristics of calcium aluminate cement with air-cooled slag or water-cooled slag. Ceram. Sil. 2004, 48, 185–196. Available online: https://www.ceramics-silikaty.cz/2004/pdf/2004_04_185.pdf (accessed on 1 November 2021).
- Roy, J.; Chandra, S.; Maitra, S. Nanotechnology in castable refractory. Ceram. Int. 2019, 45, 19–29. [Google Scholar] [CrossRef]
- Garbers-Craig, A.M. How cool are refractory materials? J. S. Afr. Inst. Min. Metall. 2008, 108, 491–506. Available online: https://www.scielo.org.za/scielo.php?script=sci_arttext&pid=S2225-62532008000800001 (accessed on 2 October 2021).
- Shiri, S.; Abbasi, M.H.; Monshi, A.; Karimzadeh, F. A study on mechanical and physical properties of monocalcium aluminate cement reinforced with nano-SiO2 particles. Compos. Part B-Eng. 2014, 56, 30–33. [Google Scholar] [CrossRef]
- Li, H.; Hui-gang Xiao, H.G.; Ou, J.P. A study on mechanical and pressure-sensitive properties of cement mortar with nanophase materials. Cem. Concr. Res. 2004, 34, 435–438. [Google Scholar] [CrossRef]
- Abd El-Hamid, H.K.; Radwan, M.M. Influence of nano-silica additions on hydration characteristics and cytotoxicity of calcium aluminate as biomaterial. Heliyon 2019, 5, 21–35. [Google Scholar] [CrossRef] [Green Version]
- Guo, C.; Wang, E.; Hou, X.; Chen, J.; Zhang, W.; Ye, J.; Qin, S. Characterization and mechanism of early hydration of calcium aluminate cement with anatase-TiO2 nanospheres additive. Constr. Build. Mater. 2020, 20, 119922. [Google Scholar] [CrossRef]
- Rodger, S.A.; Double, D.D. The chemistry of hydration of high alumina cement in the presence of accelerating and retarding admixtures. Cem. Concr. Res. 1984, 14, 73–82. [Google Scholar] [CrossRef]
- Du, S.; Wu, J.; AlShareedah, O.; Shi, X. Nanotechnology in Cement-Based Materials: A Review of Durability, Modeling, and Advanced Characterization. Nanomaterials 2019, 9, 1213. [Google Scholar] [CrossRef] [Green Version]
- Zhang, M.H.; Islam, J. Use of nano-silica to reduce setting time and increase early strength of concretes with high volumes of fly ash or slag. Constr. Build. Mater. 2012, 29, 573–580. [Google Scholar] [CrossRef]
- Kawashima, S.; Hou, P.; Corr, D.J.; Shah, S.P. Modification of cement-based materials with nanoparticles. Cem. Concr. Compos. 2013, 36, 8–15. [Google Scholar] [CrossRef] [Green Version]
- Wang, L.; Zheng, D.; Zhang, S.; Cui, H.; Li, D. Effect of nano-SiO2 on the hydration and microstructure of portland cement. Nanomaterials 2016, 6, 241. [Google Scholar] [CrossRef] [PubMed] [Green Version]
- Hui Li, H.; Xiao, H.G.; Yuan, J.; Ou, J. Microstructure of cement mortar with nano-particles. Compos. Part B-Eng. 2004, 35, 185–189. [Google Scholar] [CrossRef]
- Singh, L.P.; Karade, S.R.; Bhattacharyya, S.K.; Yousuf, M.M.; Ahalawat, S. Beneficial role of nanosilica in cement based materials—A review. Constr. Build. Mater. 2013, 47, 1069–1077. [Google Scholar] [CrossRef]
- Malaiškienė, J.; Costa, C.; Banevičienė, V.; Antonovič, V.; Vaičienė, M. The effect of nano SiO2 and spent fluid catalytic cracking catalyst on cement hydration and physical mechanical properties. Constr. Build. Mater. 2021, 299, 124281. [Google Scholar] [CrossRef]
- Wang, F.; Chen, P.; Li, X.C.; Zhu, B. Effect of Colloidal silica on the hydration behavior of calcium aluminate cement. Materials 2018, 11, 1849. [Google Scholar] [CrossRef] [Green Version]
- Son, H.M.; Park, S.M.; Jang, J.G.; Lee, H.K. Effect of nano-silica on hydration and conversion of calcium aluminate cement. Constr. Build. Mater. 2018, 169, 819–825. [Google Scholar] [CrossRef]
- Chavda, M.A.; Bernal, S.A.; Apperley, D.C.; Kinoshita, H.; Provis, J.L. Identification of the hydrate gel phases present in phosphate-modified calcium aluminate binders. Cem. Concr. Res. 2015, 70, 21–28. [Google Scholar] [CrossRef]
- Shinmei, T.; Ohkawa, M.; Borovsky, A.; Iiyama, M.; Parr, C. The Formation of Stratlingite in Calcium Aluminate Containing Castable Systems. Refract. Worldforum 5 2013, 3, 89–96. [Google Scholar]
- Du, M.; Jing, H.; Gao, Y.; Su, H.; Fang, H. Carbon nanomaterials enhanced cement-based composites: Advances and challenges. Nanotechnol. Rev. 2020, 9, 115–135. [Google Scholar] [CrossRef] [Green Version]
- Kudžma, A. Effect Of Graphene Oxide on the Hydration, Structure and Properties of Cementitious Materials. Ph.D. Thesis, Vilnius Gediminas Technical University, Sauletekio ave. 11, Vilnius, Lithuania, 2020. Available online: https://dspace.vgtu.lt/handle/1/3837 (accessed on 2 October 2021). (In Lithuanian, Vilnius Technika, Vilnius, Lithuania).
- Liu, T.T.; Cao, M.Q.; Fanga, Y.S.; Zhu, Y.H.; Cao, M.S. Green building materials lit up by electromagnetic absorption function:A review. J. Mater. Sci. Technol. 2022, 112, 329–344. [Google Scholar] [CrossRef]
- Chen, J.; Liang, C.; Li, B.; Wang, E.; Li, G.; Hou, X. The effect of nano-γAl2O3 additive on early hydration of calcium aluminate cement. Constr. Build. Mater. 2018, 158, 755–760. [Google Scholar] [CrossRef]
- Claramunt, J.; Ventura, H.; Filho, R.D.T.; Ardanuy, M. Effect of nanocelluloses on the microstructure and mechanical performance of CAC cementitious matrices. Cem. Concr. Res. 2019, 119, 64–76. [Google Scholar] [CrossRef]
- Sanchez, F.; Zhang, L.; Ince, C. Multi-scale performance and durability of carbon nanofiber/cement composites. In Nanotechnology Construction 3; Bittnar, Z., Bartos, P.J.M., Nemecek, J., Smilauer, V., Zeman, J., Eds.; Springer: Berlin/Heidelberg, Germany, 2009; pp. 345–350. [Google Scholar] [CrossRef]
- Rambo, D.A.S.; Ukrainczyk, N.; Silva, F.A.; Koenders, E.; Filho, R.D.T.; Gomes, O.F.M. Calcium-aluminate mortars at high temperatures: Overcoming adverse conversion effects using clinker aggregates. Cem. Concr. Compos. 2019, 96, 212–224. [Google Scholar] [CrossRef]
- Antonovič, V.; Pundienė, I.; Stonys, R.; Čėsnienė, J.; Kerienė, J. A review of the possible applications of nanotechnology in refractory concrete. J. C. Eng. Manag. 2010, 16, 595–602. Available online: https://0-www-tandfonline-com.brum.beds.ac.uk/doi/abs/10.3846/jcem.2010.66 (accessed on 2 October 2021). [CrossRef]
- Sakai, E.; Sugiyama, T.; Saito, T.; Daimon, M. Mechanical properties and micro-structures of calcium aluminate based ultra-high strength cement. Cem. Concr. Res. 2010, 40, 966–970. [Google Scholar] [CrossRef]
- Antonovič, V.; Aleknevičius, M.; Keriene, J.; Pundienė, I.; Stonys, R. Investigating the hydration of deflocculant calcium aluminate cement-based binder with catalyst waste. J. Therm. Anal. Calorim. 2012, 109, 537–544. [Google Scholar] [CrossRef]
- Collier, N.C.; Sharp, J.H.; Milestone, N.B.; Hill, J.; Godfrey, I.H. The influence of water removal techniques on the composition and microstructure of hardened cement pastes. Cem. Concr. Res. 2008, 38, 737–744. [Google Scholar] [CrossRef]
- Pacewska, B.; Nowacka, M.; Antonovic, V.; Aleknevicius, M. Investigation of early hydration of high aluminate cement-based binder at different ambient temperatures. J. Therm. Anal. Calorim. 2012, 109, 717–726. [Google Scholar] [CrossRef]
- Pacewska, B.; Wilinska, I.; Bukowska, M. Calorimetric investigations of the influence of waste aluminosilicate on the hydration of different cements. J. Therm. Anal. Calorim. 2009, 97, 61–66. Available online: https://0-link-springer-com.brum.beds.ac.uk/article/10.1007/s10973-008-9668-9 (accessed on 2 October 2021). [CrossRef]
- Puerta-Falla, G.; Kumar, A.; Gomez-Zamorano, L.; Bauchy, M.; Neithalath, N.; Sant, G. The influence of filler type and surface area on the hydration rates of calcium aluminate cement. Constr. Build. Mater. 2015, 96, 657–665. [Google Scholar] [CrossRef] [Green Version]
- Juan Wang, J.; Xu, Y.; Wu, X.; Zhang, P.; Hu, S. Advances of graphene- and graphene oxide-modified cementitious materials. Nanotechnol. Rev. 2020, 9, 465–477. [Google Scholar] [CrossRef]
- Rashad, A.M. Effects of ZnO2, ZrO2, Cu2O3, CuO, CaCO3, SF, FA, cement and geothermal silica waste nanoparticles on properties of cementitious materials–a short guide for Civil Engineer. Constr. Build. Mater. 2013, 48, 1120–1133. [Google Scholar] [CrossRef]
- Torrens-Martın, D.; Fernandez-Carrasco, L.; Blanco-Varela, M.T. Conduction calorimetric studies of ternary binders based on Portland cement, calcium aluminate cement and calcium sulphate. J. Therm. Anal. Calorim. 2013, 114, 799–807. Available online: https://0-link-springer-com.brum.beds.ac.uk/article/10.1007/s10973-013-3003-9 (accessed on 2 October 2021). [CrossRef]
- Fernandez-Carrasco, L.; Torrens-Martın, D.; Morales, L.M.; Martinez-Ramirez, S. Infrared spectroscopy in the analysis of building and construction materials. In Infrared Spectroscopy; Theophanides, T., Ed.; Intech: Rijeka, Croatia, 2012; pp. 369–382. Available online: http://www.intechopen.com/books/infrared-spectroscopy-materials-science-engineering-andtechnology/infrared-spectroscopy-of-cementitious-materials (accessed on 2 October 2021). [CrossRef] [Green Version]
- Hidalgo, A.; García, J.L.; Cruz Alonso, M.; Fernández, L.; Andrade, C. Microstructure development in mixes of calcium aluminate cement with silica fume or fly ash. J. Therm. Anal. Calorim. 2009, 96, 335–345. [Google Scholar] [CrossRef]
- Madej, D.; Szczerba, J. Study of the hydration of calcium zirconium aluminate (Ca7ZrAl6O18) blended with reactive alumina by calorimetry, thermogravimetry and other methods. J. Therm. Anal. Calorim. 2015, 121, 579–588. [Google Scholar] [CrossRef] [Green Version]
- Tarte, P. Infra-red spectra of inorganic aluminates and characteristic vibrational frequencies of AlO4 tetrahedra and AlO6 octahedra. Spectrochim Acta A Mol Spectrosc. 1967, 23, 2127–2143. Available online: https://0-www-sciencedirect-com.brum.beds.ac.uk/science/article/abs/pii/0584853967801004 (accessed on 2 October 2021). [CrossRef]
- Fernandez-Carrasco, L.; Vazquez, T. Aplicacion de la espectroscopıa infrarroja al studio de cement aluminoso. Mater. Constr. 1996, 46, 39–51. [Google Scholar] [CrossRef] [Green Version]
- Bushnell-Watson, S.M.; Sharp, J.H. The application of thermal analysis to the hydration and conversion Reactions of calcium aluminate cements. Mater. Constr. 1992, 42, 13–32. [Google Scholar] [CrossRef] [Green Version]
- Ukrainczyk, N.; Matusovic, T.; Kurajica, S.; Zimmermann, B.; Sipusic, J. Dehydration of layered double hydroxide–C2AH8. Thermochim. Acta. 2007, 464, 7–15. [Google Scholar] [CrossRef]
- Scrivener, K.L.; Cabiron, J.L.; Letourneux, R. High-performance concretes from calcium aluminate cements. Cem. Concr. Res. 1999, 29, 1215–1223. [Google Scholar] [CrossRef]
- Kim, H.; Son, H.M.; Lee, H.K. Review on recent advances in securing the long-term durability of calcium aluminate cement (CAC)-based systems. Funct. Compos. Struct. 2021, 3, 035002. Available online: https://0-iopscience-iop-org.brum.beds.ac.uk/article/10.1088/2631-6331/ac1913/meta (accessed on 2 October 2021). [CrossRef]
- Mostafa, N.Y.; Zaki, Z.I.; Elkader, O.H.A. Chemical activation of calcium aluminate cement composites cured at elevated temperature. Cem. Concr. Compos. 2012, 34, 1187–1193. [Google Scholar] [CrossRef]
- Gosselin, C. Microstructural Development of Calcium Aluminate Cement Based Systems with and without Supplementary Cementitious Materials. Ph.D. Thesis, Swiss Federal Institute of Technology in Lausanne, Lausanne, Switzerland, 2009. [Google Scholar] [CrossRef]
- Ding, J.; Fu, Y.; Beaudoin, J.J. Study of hydration mechanisms in the high alumina cement–sodium silicate system. Cem. Concr. Res. 1996, 26, 799–804. [Google Scholar] [CrossRef]
- Luz, A.P.; Moreira, M.H.; Wöhrmeyer, C.; Parr, C.; Pandolfelli, V.C. Drying behavior optimization of dense refractory castables by adding a permeability enhancing active compound. Ceram. Int. 2019, 45, 9048–9060. [Google Scholar] [CrossRef]
- Nouri-Khezrabad, N.; Braulio, M.A.L.; Pandolfelli, V.C.; Golestani-Fard, F.; Rezaie, H.R. Nano-bonded refractory castables. Ceram. Int. 2013, 39, 3479–3497. [Google Scholar] [CrossRef]


| Component | Typical Values (%) | Main Phases |
|---|---|---|
| Al2O3 | 71.1 | CA:CaO·Al2O3, CA2:CaO·2Al2O3, Additional phases: C12A7:12CaO·7Al2O3, A:α-Al2O3 |
| CaO | 28.0 | |
| SiO2 | <0.5 | |
| Fe2O3 | <0.3 | |
| Na2O + K2O | <0.5 |
| The Mark of Composition | G70 (%) | NS (%) | NC (%) | W/C |
|---|---|---|---|---|
| G0 | 100 | - | - | 0.35 |
| GNS1 | 100 | 0.05 | - | 0.35 |
| GNS2 | 100 | 0.1 | - | 0.35 |
| GNS3 | 100 | 0.2 | - | 0.35 |
| GNC1 | 100 | - | 0.05 | 0.35 |
| GNC2 | 100 | - | 0.1 | 0.35 |
| GNC3 | 100 | - | 0.2 | 0.35 |
| The Mark of Compositions | CAH10 | C2AH8 | AH3 | C3AH6 | H* | CA2 | CA | N* | Anatase |
|---|---|---|---|---|---|---|---|---|---|
| G0 | 117 | 64 | 101 | - | 282 | 497 | 401 | 898 | 450 |
| GNS1 | 97 | 54 | 139 | 231 | 521 | 525 | 250 | 775 | 450 |
| GNS2 | 114 | 64 | 141 | 230 | 549 | 519 | 283 | 802 | 450 |
| GNS3 | 114 | 53 | 105 | 138 | 410 | 482 | 335 | 817 | 450 |
| GNC1 | 125 | 67 | 108 | - | 300 | 530 | 280 | 810 | 450 |
| GNC2 | 114 | 69 | 106 | - | 289 | 514 | 319 | 833 | 450 |
| GNC3 | 107 | 72 | 104 | - | 283 | 553 | 303 | 856 | 450 |
Publisher’s Note: MDPI stays neutral with regard to jurisdictional claims in published maps and institutional affiliations. |
© 2022 by the authors. Licensee MDPI, Basel, Switzerland. This article is an open access article distributed under the terms and conditions of the Creative Commons Attribution (CC BY) license (https://creativecommons.org/licenses/by/4.0/).
Share and Cite
Boris, R.; Wilińska, I.; Pacewska, B.; Antonovič, V. Investigations of the Influence of Nano-Admixtures on Early Hydration and Selected Properties of Calcium Aluminate Cement Paste. Materials 2022, 15, 4958. https://0-doi-org.brum.beds.ac.uk/10.3390/ma15144958
Boris R, Wilińska I, Pacewska B, Antonovič V. Investigations of the Influence of Nano-Admixtures on Early Hydration and Selected Properties of Calcium Aluminate Cement Paste. Materials. 2022; 15(14):4958. https://0-doi-org.brum.beds.ac.uk/10.3390/ma15144958
Chicago/Turabian StyleBoris, Renata, Iwona Wilińska, Barbara Pacewska, and Valentin Antonovič. 2022. "Investigations of the Influence of Nano-Admixtures on Early Hydration and Selected Properties of Calcium Aluminate Cement Paste" Materials 15, no. 14: 4958. https://0-doi-org.brum.beds.ac.uk/10.3390/ma15144958