Time Series Clustering Model based on DTW for Classifying Car Parks

School of Maritime Economics and Management, Dalian Maritime University, Dalian 116026, China
*
Author to whom correspondence should be addressed.
Algorithms 2020, 13(3), 57; https://0-doi-org.brum.beds.ac.uk/10.3390/a13030057
Submission received: 4 February 2020
/
Revised: 26 February 2020
/
Accepted: 1 March 2020
/
Published: 2 March 2020
(This article belongs to the Special Issue Supervised and Unsupervised Classification Algorithms)
Abstract
:An increasing number of automobiles have led to a serious shortage of parking spaces and a serious imbalance of parking supply and demand. The best way to solve these problems is to achieve the reasonable planning and classify management of car parks, guide the intelligent parking, and then promote its marketization and industrialization. Therefore, we aim to adopt clustering method to classify car parks. Owing to the time series characteristics of car park data, a time series clustering framework, including preprocessing, distance measurement, clustering and evaluation, is first developed for classifying car parks. Then, in view of the randomness of existing clustering models, a new time series clustering model based on dynamic time warping (DTW) is proposed, which contains distance radius calculation, obtaining density of the neighbor area, k centers initialization, and clustering. Finally, some UCR datasets and data of 27 car parks are employed to evaluate the performance of the models and results show that the proposed model performs obviously better results than those clustering models based on Euclidean distance (ED) and traditional clustering models based on DTW.
1. Introduction
Thanks to the rapid development of science and technology recently and the popularity of transportation tools, the automobile, as one of the most important means of transportation in human society, has brought great convenience to people’s travel and life. As the demand for the number and capacity of car parks increases with the number of automobiles, an increasing number of car parks are built and put into use. However, parking difficulty still is a prominent traffic problem in cities, especially in big cities. An article in Washington Post [1] pointed out that: “parking difficulty produces more than frustration. It also waste more gas and produce more carbon dioxide in the course of a year.” Therefore, it becomes urgent to solve this problem and some studies found that the main reasons of parking difficulty can be summarized as independent operation of car parks, unshared data and inefficient operation management [2]. Kubota et al. [3] reported that the reasonable planning and classifying management of car parks can improve the problem of inefficient operation management. It is essential to classify car parks and analyze the similarity of car parks for guiding people to park and balance the occupancy rate of car parks, and help operators of car parks to improve the efficiency and ability for relieving the problem of parking difficulty.
We review existing studies related to analyzing the similarity of occupancy rate change of car parks, only a number of references are found. Klappenecker et al. [4] calculated the probability of available parking spaces upon arrival, predicted the number of available parking spaces in a car park, and simplified the calculation of the transition probability in a vehicle navigation system. Few systems provided data on the predicted usage at a specific time. Caicedo et al. [5] proposed a methodology for predicting real-time parking space availability in IPR architectures. In order to improve the availability of parking resources, Cheng et al. [6] proposed a programming model for designing a time limited-parking management plan. Kubota et al. [3] classified the characteristics of small areas through Okayama parking data and visualized the results of clustering analysis. Effective parking management can not only facilitate people’s travel, improve the working efficiency of operation management of car parks, but also reduce their operating costs. However, few existing references focus on the change of occupancy rate of car parks, to a certain extent, and it can reflect the location, the surrounding working and living conditions of the car parks, which will be very important for improving the operation management of car parks. Therefore, the similarity between different car parks is analyzed by clustering methods in this paper, and then their operators are able to learn more experience from other car parks and traffic management department can develop effective parking guidance services for alleviating parking difficulties.
By analyzing the data of car parks, we find that it has obviously characteristics of time series and periodicity, so it is vital to apply time series methods for classifying car parks. Time series data [7] is a type of data that is very common in people’s daily lives, which is also the main research object in the field of data mining [8]. Time series data is composed of a set of series data that is generally related to a potential process where data is obtained in the same time interval by sampling. Time series mining is to find useful time-related knowledge hidden behind time series data, reveal hidden rules, and apply the mining results in social production practices. For example, Bokelmann et al. [9] proposed a method for purifying Google trend data and reducing the adverse effects of false patterns, thus paving the way for the development of statistically reasonable tourism demand forecasts. Karim et al. [10] proposed the augmentation of fully convolutional networks with long short term memory recurrent neural network sub-modules for time series classification. Time series mining involves many aspects, such as time series classification, prediction, clustering, etc.
The main processes of time series clustering are distance measurement [11] and clustering [12,13]. In the process of distance measurement, there are many different distance measurement methods for time series mining, including Hausdorff distance [14], Minkowski [15], hidden Markov model-based distance [16], Euclidean distance [17], and dynamic time warping [18], and the most commonly used ones for time series clustering are Euclidean distance (ED) and dynamic time warping (DTW) [19]. For instance, Wang et al. [20] evaluated nine distance measures and several variants thereof, and found that ED is the most efficient measure with a reasonably high accuracy while DTW often performs well. DTW is able to overcome the defect of ED point-to-point, and measure time series data with unequal length by warping time to achieve one-to-many matching of data points, which means that it has strong robustness to time deviation and amplitude change [21]. Yao et al. [22] realized the initial clustering by DTW and hierarchical clustering, and then put the clustering results into hidden Markov model (HMM) for iterative optimization. Petitjean et al. [23] proposed an analysis framework for classifying the average technology based on DTW. Chen et al. [24] applied a DTW distance based k-medoids method to group buildings with similar social media activities into functional areas. It is necessary to adopt the DTW to calculate the distance of occupancy rate of car parks. For clustering, we can obtain a lot of experiences and knowledge from the existing literature. Izakian et al. [25] combined fuzzy c-means and fuzzy c-medoids to deal with time series clustering. In order to effectively utilize the inherent subspace information of time series data set and improve clustering performance, Huang et al. [26] proposed a time series k-means (TSkmeans). The k-means clustering method is sensitive to outliers of the data. To solve this problem, Johnson et al. [27] introduced a k-medoids clustering approach to identify the minimum number of sequences necessary to represent each coding sequence in the final probe set. Garain et al. [28] proposed a cohort selection method called k-medoids cohort selection (KMCS) to select a reference set of non-matched templates which are almost appropriate to the respective subjects. There are many random factors during the process of k-medoids algorithm, so it is essential to avoid the randomness of clustering process. Therefore, a time series clustering framework is developed for classifying car parks, which contains four aspects, including data preprocessing, distance measurement, clustering, and evaluation.
2. Data and methodology
2.1. Dataset
The data collected from 27 car parks operated by the Birmingham City Council NCP (https://archive.ics.uci.edu/ml/datasets/Parking+Birmingham) is chosen as the dataset, which contains 4 features, including car park’s name, capacity, occupancy, the date, and time of the data collected. The dataset indicates the change of the occupancy rate of these 27 car parks during 2016.10.4 to 2016.12.19, which means that it is obviously time series data. Then the data of the car parks in November, 2016 (see Figure 1) is chosen as samples for classifying the car parks, the reasons can be described in two aspects, one is that the data of car parks is time series, so it is essential to select a continuous time data; another is that car park data in different seasons are clearly different, so the sample data cannot cover a long period.
In Figure 1, the horizontal coordinate is the hour of the date from 2016.11.01 to 2016.11.30, and the vertical coordinate is the occupancy rate of individual car park. The top right corner of each curve indicates the maximum capacity of this car park. Figure 1 shows that the change of occupancy rate of these car parks evidently has two periodic characteristics, namely daily periodicity and weekly periodicity. Subsequently, we can classify the car parks by their occupancy rate or their weekly occupancy rate. However, the occupancy rate of car parks on weekend and workday are significantly different. In order to ensure the validity of clustering results, it is very critical to classify car parks by weekly occupancy rate. In order to test whether holidays will affect the results of car park clustering, two consecutive time series data, data1 from Nov. 13 (Sunday) to Nov.19 (Saturday) and data2 from Nov. 20 (Sunday) to Nov. 26 (Saturday), are selected as training data.
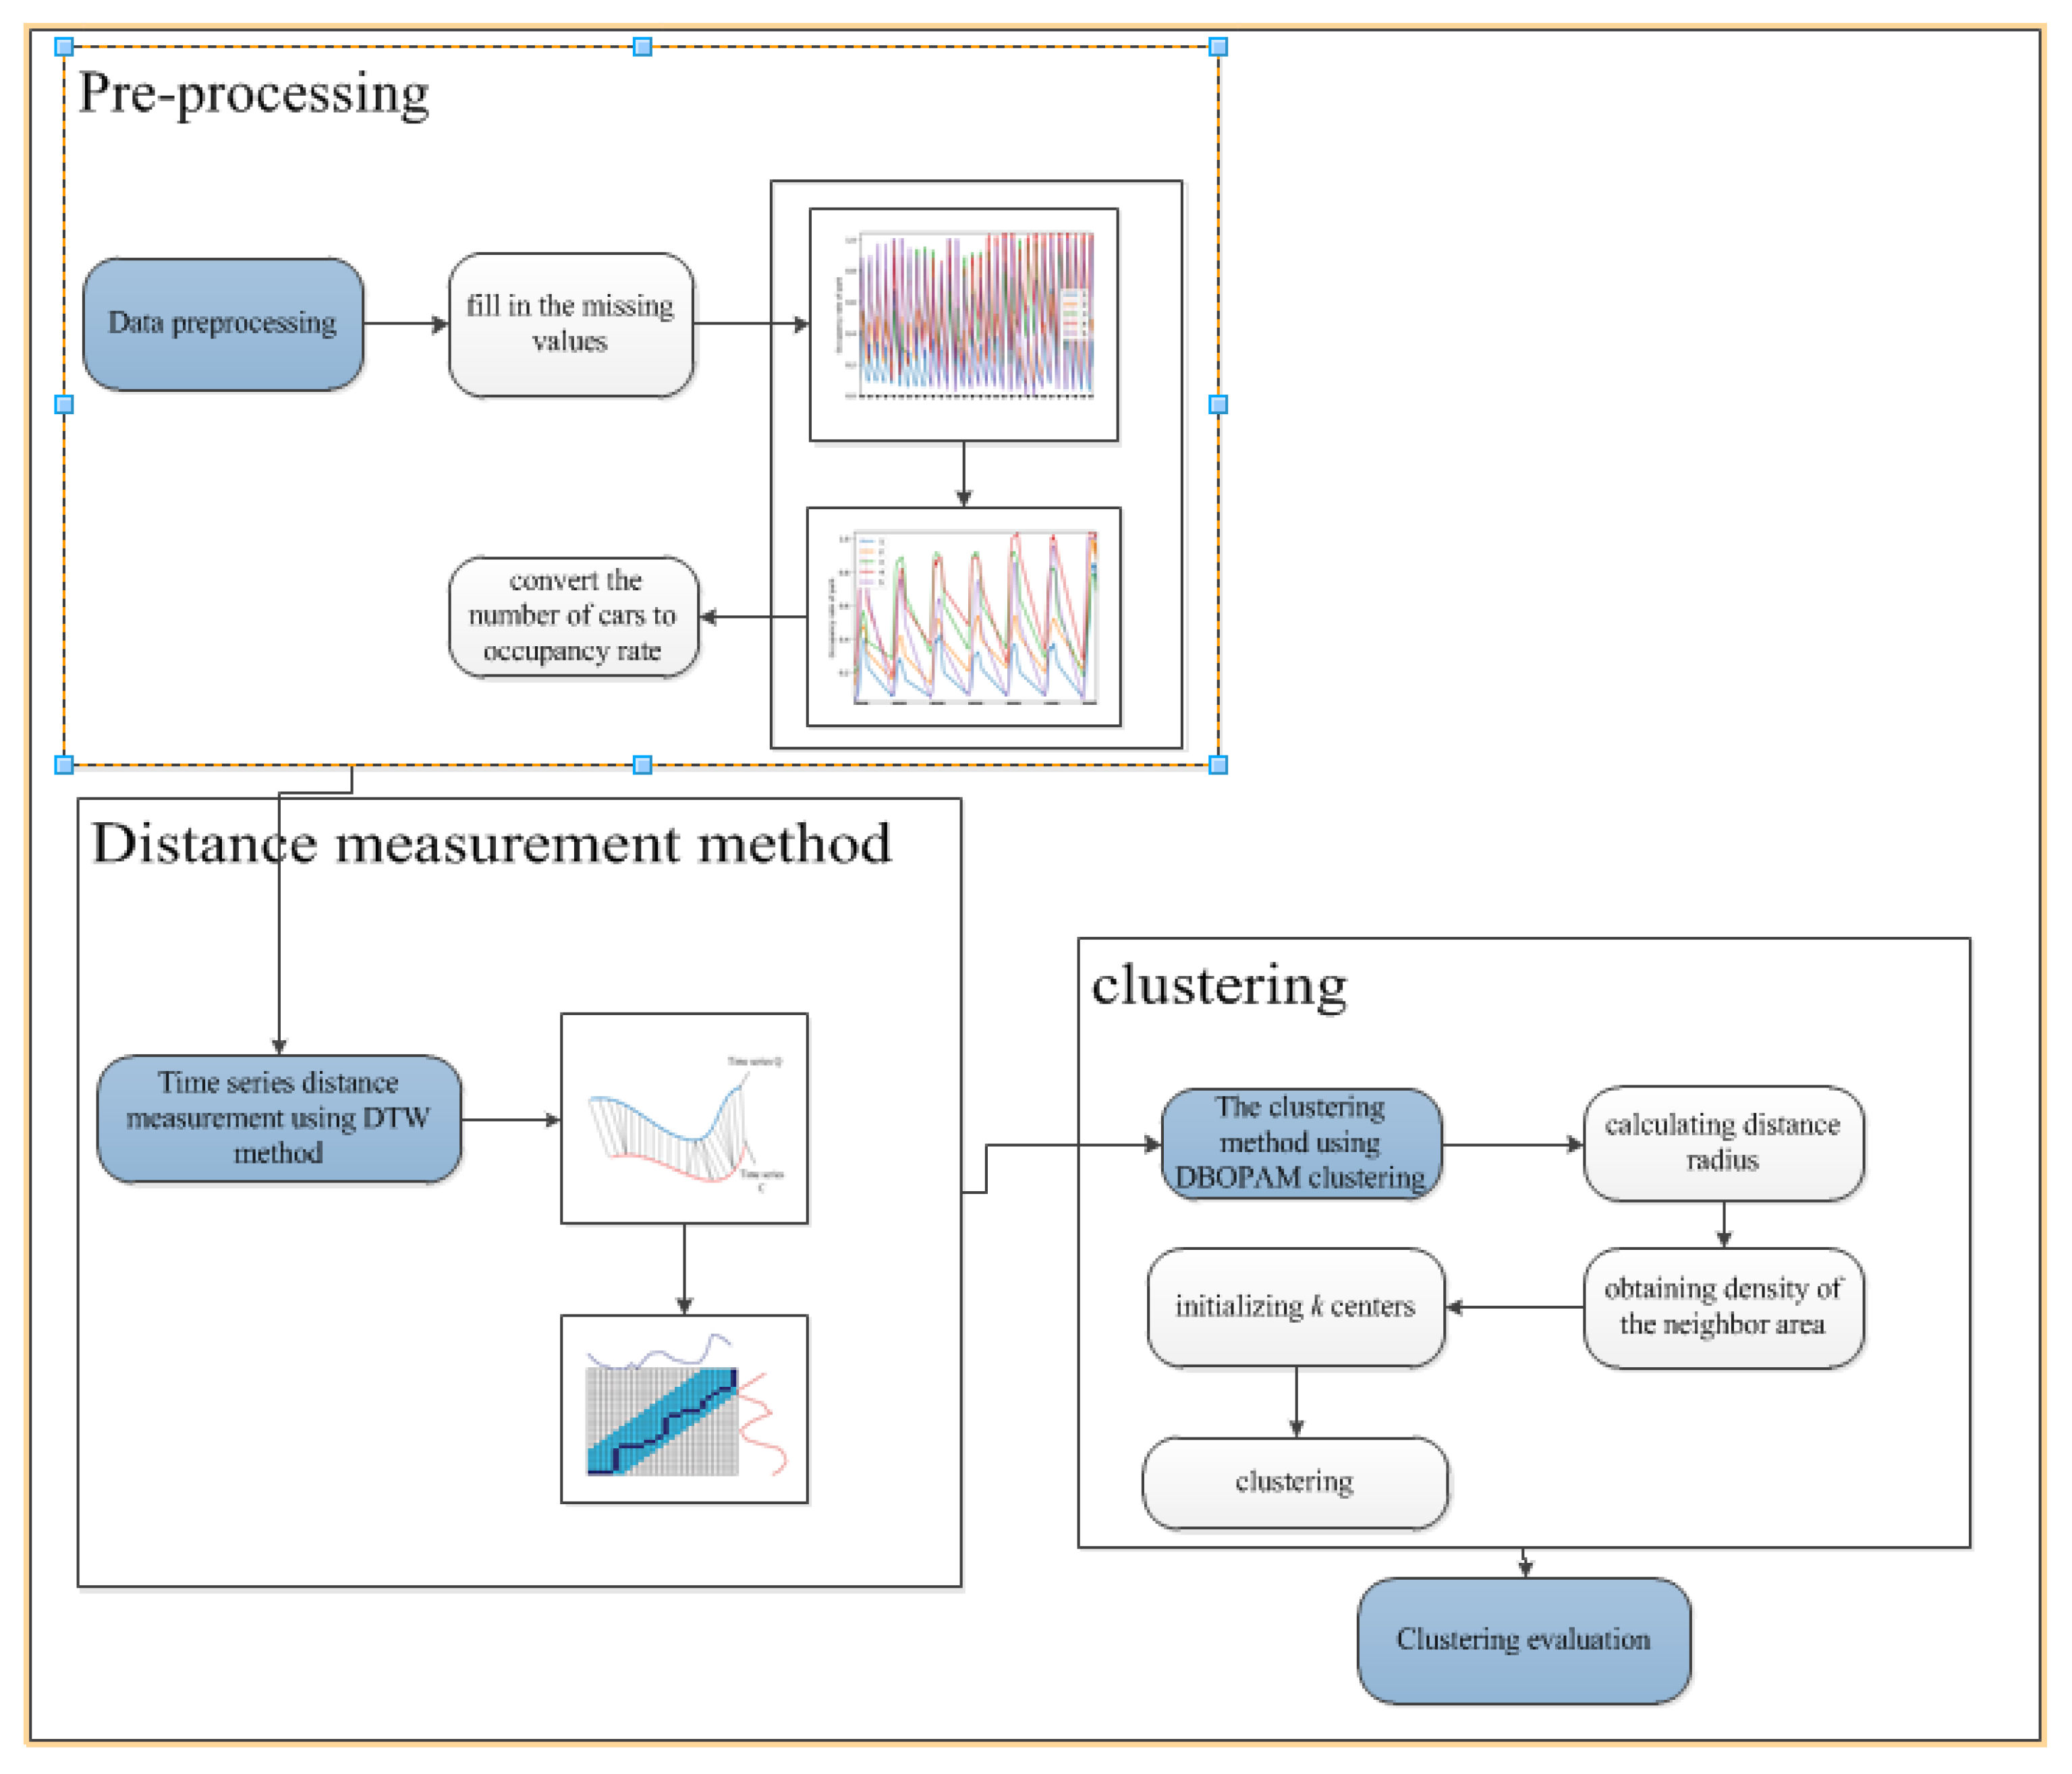
2.2. Framework for Classifying Car Parks
In order to classify the car parks, we develop a framework containing four aspects, including preprocessing, distance measurement, clustering, and evaluation, which is given in Figure 2.
The framework in Figure 2 can be described as follows:
Firstly, we employ the weekly periodicity of the data to fill in the missing values, and then convert the number of parking cars into the occupancy rate by Equation (1). It is obvious that the occupancy rate of each car park changes in one week’s periodicity, which means that the training data could be reduced to one week.
where occupancy is the number of parking cars, and capacity is the maximum number of cars that can be parked in the car park.
Secondly, according to the characteristics of the time series data, the DTW distance is employed as the distance measurement for the time series data of the car parks.
Thirdly, density-based partition around medoids (DBPAM) clustering method is proposed to obtain the robust clustering results, which contains multiple steps, including calculating distance radius, obtaining density of the neighbor area, initializing k centers, and clustering.
The last but not the least is to evaluate the performance of the proposed model.
2.2.1. Data Preprocessing
Sometimes, the data is not very accurate due to containing faulty and missing values. For those missing values, we can use the value of the last week to fill in, which means that if the data of Tuesday 8th is lost, we will replace it with the data of Tuesday 1st. Then we convert the number of parking cars into occupancy rate. In order to eliminate the dimensional relationship between variables, we normalize the values of 27 car parks to fall within the range of 0 to 1.
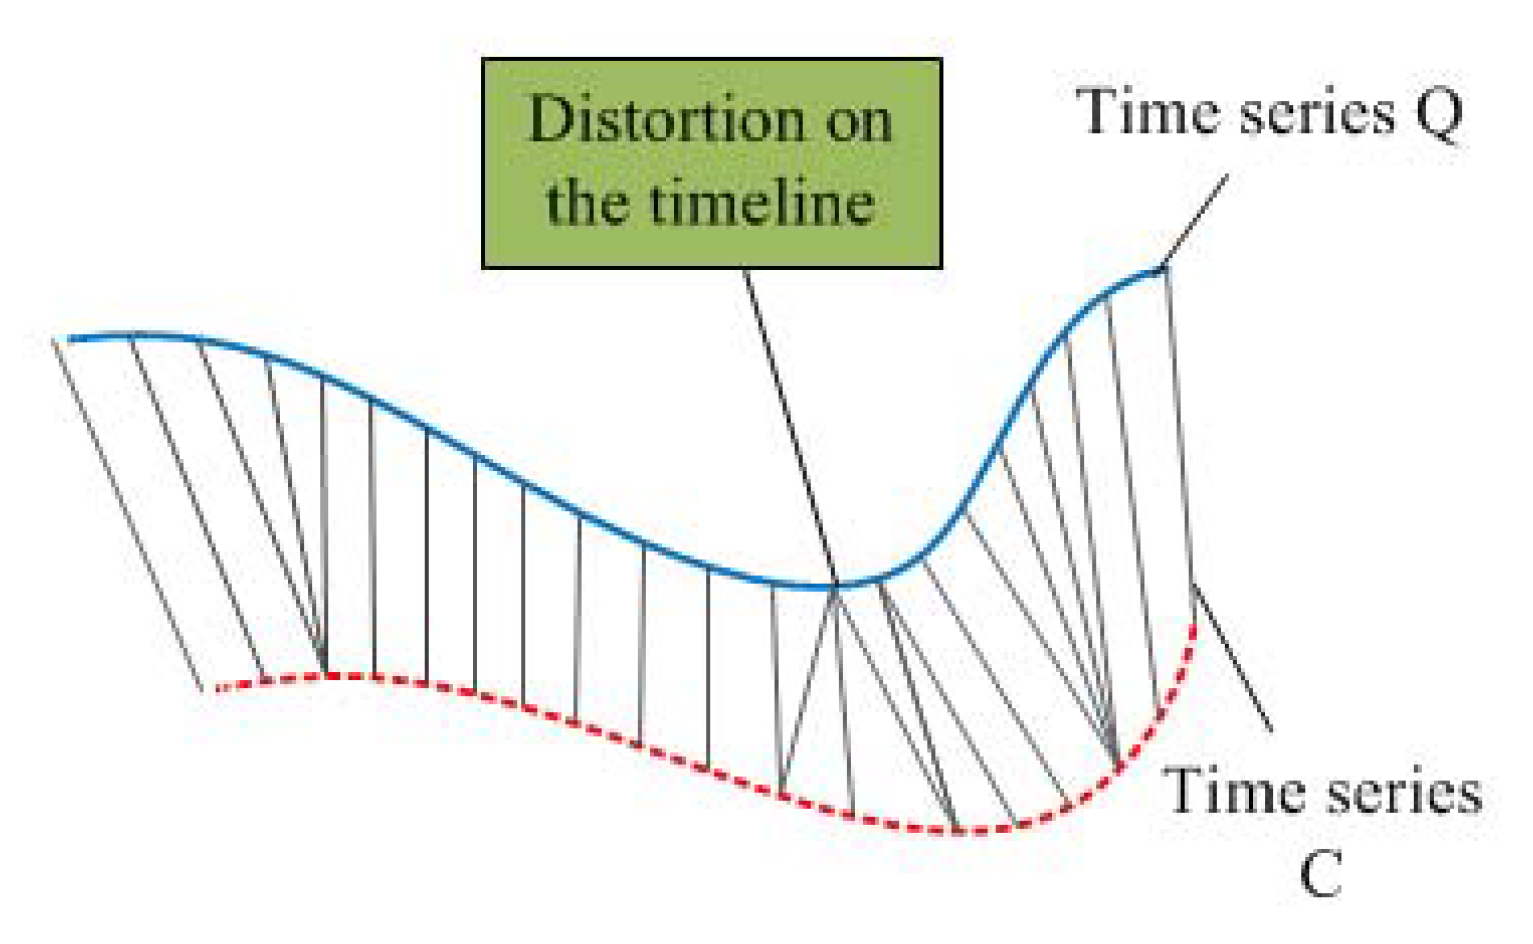
2.2.2. DTW
DTW is a family of algorithms which compute the local stretch or compression to apply to the time axes of two time series objects in order to optimally map one (query) onto the other (reference), and is good at calculating the distance between non-equal-length sequences. Figure 3 shows how to calculate the distance between two time series objects with different time length.
Suppose that two time series sequences are Q and C, where , , and their lengths are n and m, respectively. The traditional Euclidean distance (ED) as distance is defined in Equation (2) and the DTW for time series sequences is defined as Equation (3), which is an extension of ED for a local (non-linear) alignment. In order to obtain the DTW distance between two time series sequences, we construct a n-by-m path matrix where the element (ith, jth ) contains the distance between the two points and , . Each path matrix element (ith, jth) corresponds to the alignment between the points and . The best match between two time series sequences is the one with the lowest distance path after aligning one time series sequence to the other. Therefore, the optimal warping path can be found by using recursive formula given by Equation (3).
where is the cumulative distance.
This path is very efficient to evaluate the following recurrence which defines the cumulative distance as the distance d(i,j) in the current cell and the minimum of the cumulative distances of the adjacent elements:
here, min represents the minimum of the cumulative distances of the adjacent elements.
2.2.3. Clustering Algorithm
Clustering algorithm is to group objects into some clusters and makes the similarity between objects from the same cluster maximum and the similarity of objects from different clusters minimum. As analyzed above, k-medoids is a commonly used clustering method for time series data. The partitioning around medoids (PAM) clustering method [29] as one of the k-mediods algorithms is adopted in this paper. Due to the randomness and uncertainty of the PAM, a new clustering model, namely DBPAM, is proposed in this paper, whose process is carried out by the following steps.
Step1: Calculate distance radius.
Firstly, we calculate the distance between any two different time series objects to obtain an n-by-n matrix, where the ith column of matrix represents the distance between the ith time series object and all of time series objects. Then we sort the values of the ith column of matrix in ascending order as shown in Equation (5). Secondly, the kth distance of each time series object is selected and represented as e = {e(1), e(2),..., e(n)}. Thirdly, we obtain the e’ by sorting the e in ascending order. e’ shows the trend of the kth distance, which can be plotted as a curve. Fourthly, the value of the kth distance where the curve changes sharply is defined as the value of the radius r.
here, k is the number of clusters, represents kth distance of the ith time series object.
Step2: Calculate the density of the neighbor area of the ith time series object i (i=1 to N) where the ith time series object is taken as center and r as radius, which is obtained by counting the number of the time series objects in this neighbor area.
Step3: Initialize k centers based on density.
The k initial centers can be obtained by following steps. Above all, we select the time series object whose neighbor area has the largest density δimax as the first cluster center shown in Equation (6). Then, the time series object farthest from the first cluster center is chosen as the second cluster center shown in Equation (7). Subsequently, the time series object who has the largest sum of distances to the first and second centers is considered as the third cluster center defined in Equation (8). We repeat the steps mentioned above until the kth cluster center is obtained as shown in Equation (9).
Step4: Assign each non-central time series object to its nearest cluster.
Step5: Update each center with time series object which makes the loss function S of this cluster minimum, and the loss function of the ith cluster is defined as Equation (10).
here .
where indicates the set of objects in the ith cluster, is the center of , j is the jth time series object, and n is the number of time series objects.
Step6: Repeat Step4 and Step5 until the centers no longer change.
2.2.4. Performance Evaluation
Some methods, including exterior evaluation method, interior evaluation method, relative evaluation method and fuzzy evaluation method, could be adopted for evaluating the performance of the clustering methods [30]. However, we do not know the labels of the car park data and cannot evaluate the proposed method by this dataset. Therefore, it is vital to select some common datasets for testing the proposed method. Purity defined in Equation (11) is one of the widely used methods for evaluating the performance of classification and clustering methods, and the higher the purity, the better the results of clustering.
here, k is the number of clusters, nij represents the number of time series objects in , which belongs to the true class j (j=1,2,…,k).
2.3. Comparative Analysis of Experiments
In this section, 9 UCR datasets (http://www.timeseriesclassification.com/dataset.php) given in Table 1 are employed to evaluate the performance of the proposed method.
In Table 1, k is the number of clusters, train is the number of objects in training dataset, test is the number of objects in test dataset, and total is the sum of train and test.
Since the training data of the 9 public datasets is relatively small, in order to compare the accuracy of the models more generally, we re-divide each dataset into training data (80%) and test data (20%). Subsequently, we compare the performance of 4 methods on these 9 datasets, and results are given in Table 2.
Table 2 shows the purity of these 4 methods. In order to make the results more intuitively and obviously, the best results of the training data and test data are in bold, respectively, which can be concluded as two aspects:
(1) No matter which measurement method ED and DTW is chosen, the proposed DBPAM clustering method performs better results than others.
(2) Clustering methods based on DTW show higher purity than those based on ED.
(3) The performance of the proposed DTW +DBPAM model is better than ED+PAM, ED+DBPAM and DTW +PAM.
In a word, the proposed DTW +DBPAM model is effective for classifying the time series data. We adopt it to classify the car parks in the next section.
3. Results and Discussion of Car Parks Clustering
After consulting and understanding the managers’ demand of car parks, we divide the car parks into 3 clusters (groups) for the purpose of being easy to manage.
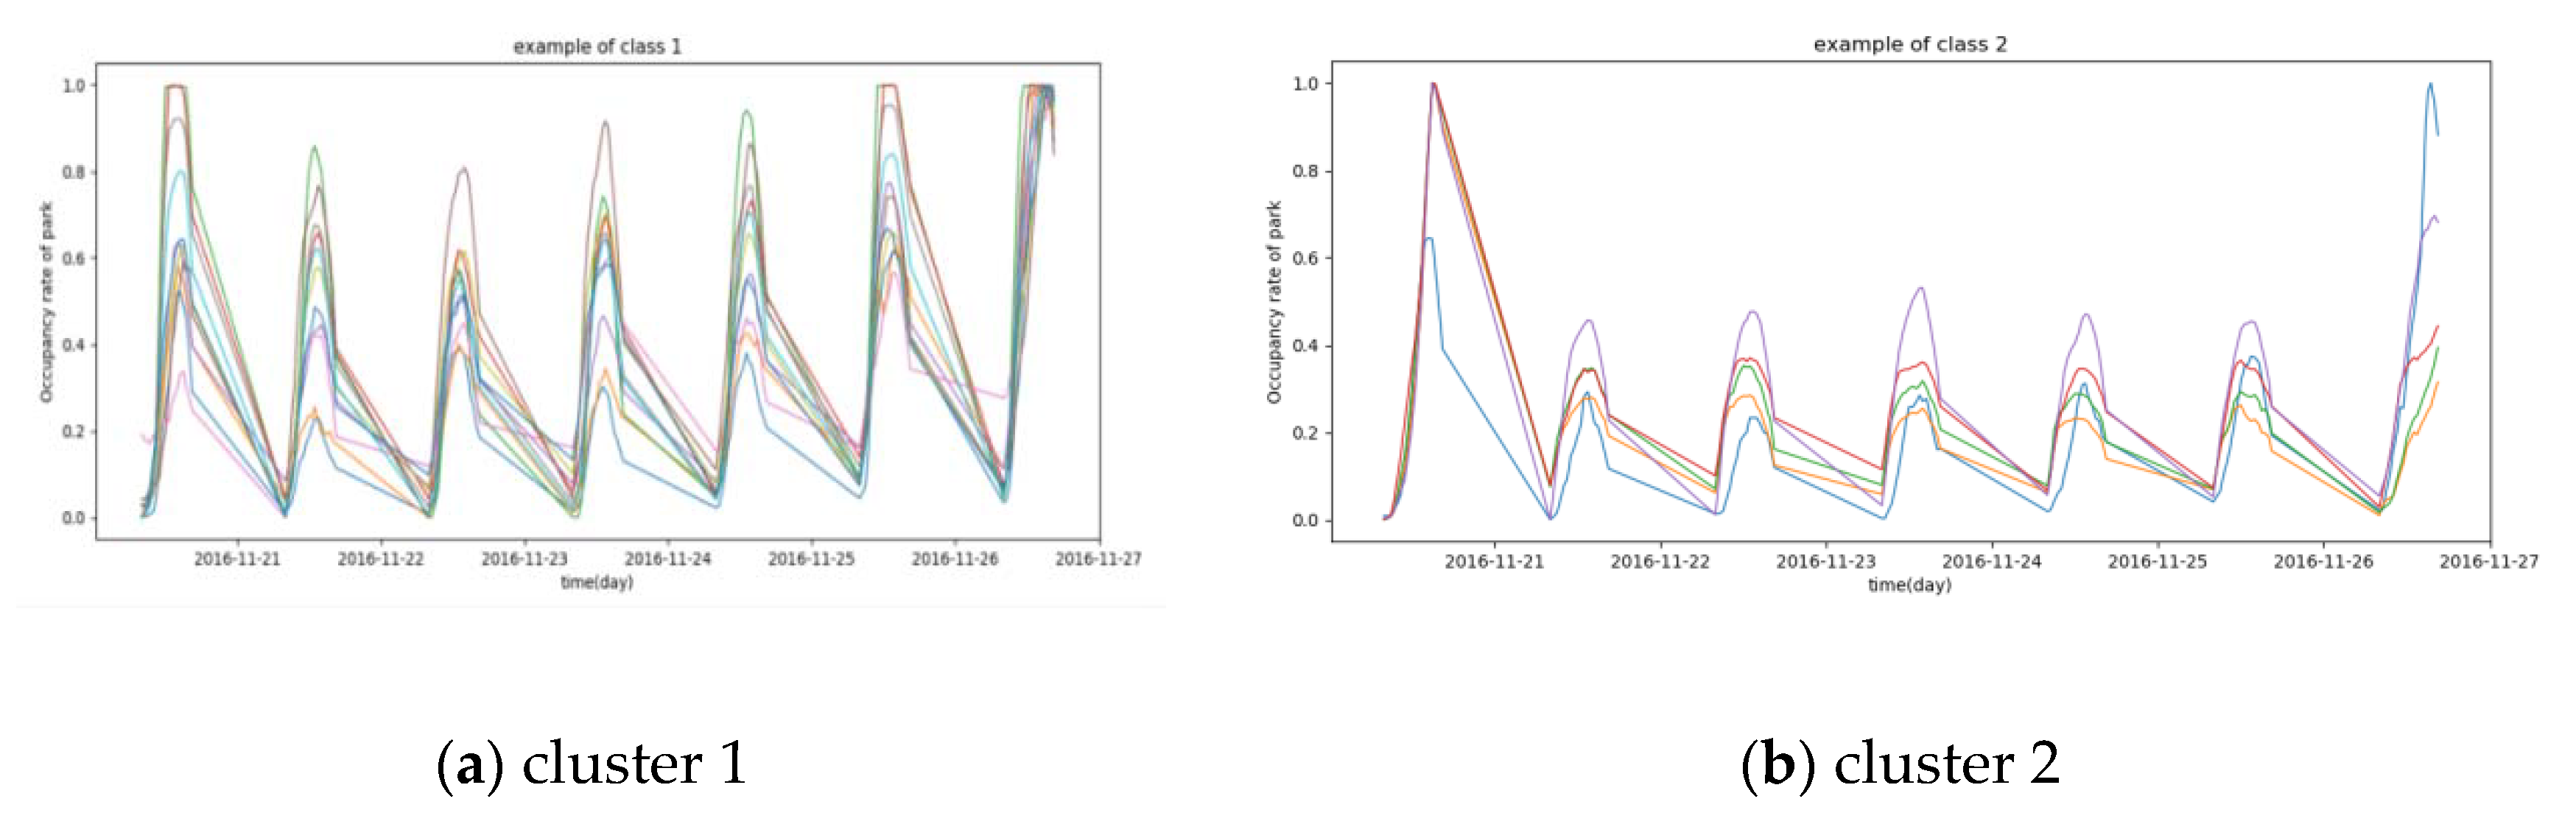
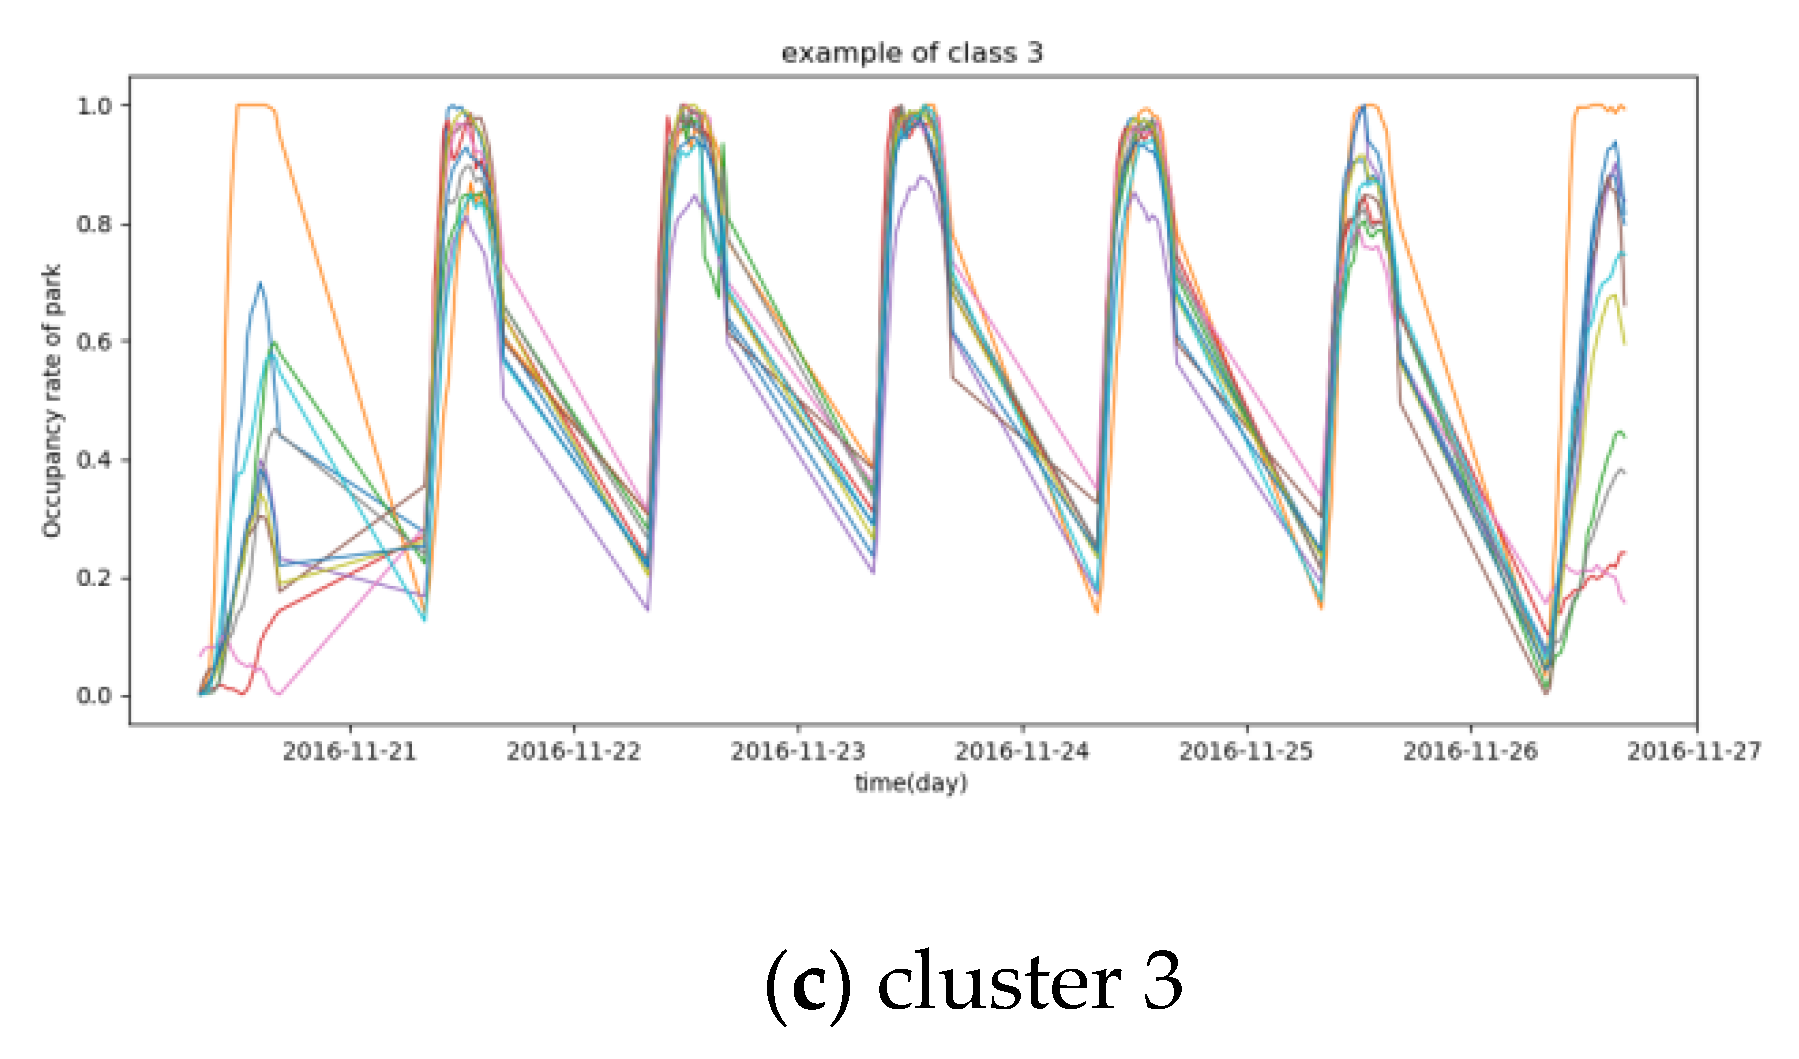
The proposed DTW +DBPAM model is employed to classify data1 and results are given in Figure 4.
Figure 4 shows that the occupancy rates of car parks during 2019.11.13 (Sunday) and 2019.11.19 (Saturday) are obviously different. Most of these 27 car parks have different occupancy rates between workday and weekend. The occupancy rates of car parks on Saturday-Sunday in cluster 1 is slightly higher than that on Monday to Friday while the occupancy rates of car parks on Saturday-Sunday in cluster 3 are absolutely lower than those on Monday to Friday, and the occupancy rates of car parks on Sunday-Monday in cluster 2 are obviously lower than those on Tuesday to Saturday.
Similarly, we also group these 27 car parks by the proposed DTW +DBPAM on data2 and results are given in Figure 5.
Figure 5 also shows that the occupancy rates of car parks on 2019.11.20 (Sunday) to 2019.11.26 (Saturday) are obviously different. Although the results of data2 is same to results of data1, the occupancy rates of car parks between Monday to Friday and Saturday-Sunday in each class are clearly different. The occupancy rates of car parks on Saturday-Sunday in cluster 1 is slightly higher than that on Monday to Friday while the occupancy rates of car parks on Saturday-Sunday in cluster 2 is obviously higher than that on Monday to Friday and the occupancy rates of car parks on Saturday-Sunday in cluster 3 is obviously lower than that on Monday to Friday.
According to the analysis mentioned above, the change of occupancy rates of car parks in cluster 2 is sensitive to the holiday, which means that occupancy rates of car parks decreases during holidays. Therefore, we know that the location of the car parks in cluster 2 is near the office area. However, the change of occupancy rates of car parks in cluster 1 and cluster 3 is insensitive to the holiday, which means that occupancy rates do not change during holidays. However, the change of the occupancy rates on Monday to Friday is obviously different from that on Saturday-Sunday in cluster 1 and cluster 3. The occupancy rates of car parks on Saturday-Sunday in cluster 1 are slightly higher than those on Monday to Friday. The reason is that people like to go shopping or entertainment on weekends. We know that the location of the car parks in cluster 1 is closer to the places of entertainment. Meanwhile, people like to go out for travel, shopping and entertainment at weekends, the occupancy rates of car parks on Saturday-Sunday in cluster 3 is obviously lower than those on Monday to Friday. Therefore, the location of the car parks in cluster 3 is near the residential area. Moreover, we investigated the situation around all of the car parks and found that the location of most car parks is consistent with our analysis. Taking the others-cccps105a car parks in cluster 2 for example, there are some plantations and farms nearby, which are verified that the location of the car parks in cluster 2 is near the office area. BHMBRCBRG01 and BHMMBMMBX01 in cluster 1 and BHMBRCBRG01 near Bull Ring Centre and BHMMBMMBX01 is near to Mailbox with large shopping options. BHMBCCTHL01 in cluster 3 is close to Town Hall and the residential area.
4. Conclusions
The data of 27 car parks has the characteristics of the time series, so the DTW distance is employed as the distance measurement for classifying the car parks in this paper. Meanwhile, a new framework for classifying car parks, which contains four steps, including preprocessing, distance measurement, clustering, and evaluation. Due to the randomness of existing clustering algorithms, a new clustering algorithm, namely DTW+ DBPAM, is proposed. In order to evaluate the performance of the proposed method, nine public UCR datasets are employed and results show that the proposed method has obviously higher purity than clustering algorithms based on ED and traditional clustering algorithms based on DTW. Subsequently, these 27 car parks are divided into three clusters according to managers’ demand. Considering the periodic characteristics of occupancy rates of car parks and the impact of holidays on occupancy rates of car parks, two datasets are selected from data of these car parks, one is regular one week data from Sunday to Saturday, the other is one week data from Sunday to Saturday containing Thanksgiving Day. The results of these two datasets can be summarized as follows:
(1) Different locations of the car parks may result in different occupancy rates of the car parks.
(2) The occupancy rates of car parks near workplaces are susceptible to holidays.
(3) The occupancy rates of car parks on weekend and that on weekday are significantly different.
There are many similarities in the change of occupancy rate of car parks in each cluster. The daily traffic situation of car parks and their peaks and low peaks can be observed by the occupancy rate of the car parks. Then operators and managers of these car parks can learn some experience from other car parks and then guide people’s parking when needed for easing the parking difficulties and congestion.
In this paper, only one feature, occupancy rate, is used for classifying the car parks, and other features, geographic location, weather, etc., are not considered. In future, we will consider more related features for more effective clustering.
Author Contributions
Conceptualization, T.L. and J.Z.; methodology, T.L. and X.W.; validation, X.W.; formal analysis, T.L.; investigation, X.W.; resources, X.W.; data curation, J.Z.; writing—original draft preparation, T.L. and X.W.; writing—review and editing, T.L. and J.Z.; visualization, X.W.; supervision, T.L.; project administration, T.L.; funding acquisition, T.L. All authors have read and agreed to the published version of the manuscript.
Funding
This research was funded by the National Natural Science Foundation of China, grant number 71271034, 51939001 and 61976033, the National Social Science Foundation of China, grant number 15CGL031, the Liaoning Revitalization Talents Program, grant number XLYC1907084, the Natural Science Foundation of Liaoning Province, grant number 20180550307, the Science & Technology Innovation Funds of Dalian, grant number 2018J11CY022, the Fundamental Research Funds for the Central Universities, grant number 3132019353 and 3132019345.
Conflicts of Interest
The authors declare no conflict of interest.
References
- Halsey III, A. DC tests new parking technology to help drivers find space, pay more easily. Wash. Post. 2010, 13, 479–486. [Google Scholar]
- Al-Turjman, F.; Malekloo, A. Smart parking in IoT-enabled cities: A survey. Sustain. Cities Soc. 2019, 49, 101608. [Google Scholar] [CrossRef]
- Kubota, T.; Hayashi, T.; Tarumi, T. Cluster analysis of car parking data, and development of their web applications. Commun. Stat. Appl. Methods 2011, 18, 549–557. [Google Scholar] [CrossRef] [Green Version]
- Klappenecker, A.; Lee, H.; Welch, J.L. Finding available parking spaces made easy. Ad Hoc Netw. 2014, 12, 243–249. [Google Scholar] [CrossRef]
- Caicedo, F.; Blazquez, C.; Miranda, P. Prediction of parking space availability in real time. Expert Syst. Appl. 2012, 39, 7281–7290. [Google Scholar] [CrossRef]
- Cheng, C.; Ji, Y.; Yin, Y.; Du, Y.; Sun, L. Designing a time limited-parking management plan for large-scale parking lots. J. Transp. Eng. Pt A Syst. 2018, 144, 04018027. [Google Scholar] [CrossRef]
- Fu, T. A review on time series data mining. Eng. Appl. Artif. Intell. 2011, 24, 164–181. [Google Scholar] [CrossRef]
- Esling, P.; Agon, C. Time-series data mining. ACM Comput. Surv. 2012, 45, 12. [Google Scholar] [CrossRef] [Green Version]
- Bokelmann, B.; Lessmann, S. Spurious patterns in google trends data-an analysis of the effects on tourism demand forecasting in Germany. Tour. Manag. 2019, 75, 1–12. [Google Scholar] [CrossRef]
- Karim, F.; Majumdar, S.; Darabi, H.; Chen, S. LSTM fully convolutional networks for time series classification. IEEE Access. 2017, 6, 1662–1669. [Google Scholar] [CrossRef]
- Sadi-Nezhad, S.; Damghani, K.K. Application of a fuzzy TOPSIS method base on modified preference ratio and fuzzy distance measurement in assessment of traffic police centers performance. Appl. Soft Comput. 2010, 10, 1028–1039. [Google Scholar] [CrossRef]
- Xu, R.; Wunsch, D. Survey of clustering algorithms. IEEE Trans. Neural Netw. 2005, 16, 645–678. [Google Scholar] [CrossRef] [PubMed] [Green Version]
- Liao, T.W. Clustering of time series data—A survey. Pattern Recognit. 2005, 38, 1857–1874. [Google Scholar] [CrossRef]
- Hung, W.L.; Yang, M.S. Similarity measures of intuitionistic fuzzy sets based on Hausdorff distance. Pattern Recognit. Lett. 2004, 25, 1603–1611. [Google Scholar] [CrossRef]
- Xu, H.; Zeng, W.; Zeng, X.; Yen, G.G. An evolutionary algorithm based on Minkowski distance for many-objective optimization. IEEE Trans. Cybern. 2018, 49, 3968–3979. [Google Scholar] [CrossRef] [PubMed]
- Ioannidou, Z.S.; Theodoropoulou, M.C.; Papandreou, N.C.; Willis, J.H.; Hamodrakas, S.J. CutProtFam-Pred: Detection and classification of putative structural cuticular proteins from sequence alone, based on profile hidden Markov models. Insect Biochem. Mol. Biol. 2014, 52, 51–59. [Google Scholar] [CrossRef] [Green Version]
- Liu, H.C.; Liu, L.; Li, P. Failure mode and effects analysis using intuitionistic fuzzy hybrid weighted Euclidean distance operator. Int. J. Syst. Sci. 2014, 45, 2012–2030. [Google Scholar] [CrossRef]
- Guan, X.; Huang, C.; Liu, G.; Meng, X.; Liu, Q. Mapping rice cropping systems in Vietnam using an NDVI-based time-series similarity measurement based on DTW distance. Remote Sens. 2016, 8, 19. [Google Scholar] [CrossRef] [Green Version]
- Wang, J.; Wu, J.; Ni, J.; Chen, J.; Xi, C. Relationship Between Urban Road Traffic Characteristics and Road Grade Based on a Time Series Clustering Model: A Case Study in Nanjing, China. Chin. Geogra. Sci. 2018, 28, 144–156. [Google Scholar] [CrossRef] [Green Version]
- Wang, X.; Mueen, A.; Ding, H.; Trajcevski, G.; Scheuermann, P.; Keogh, E. Experimental comparison of representation methods and distance measures for time series data. Data Min. Knowl. Discov. 2013, 26, 275–309. [Google Scholar] [CrossRef] [Green Version]
- Cánovas, J.S.; Guillamón, A.; Ruiz-Abellón, M.C. Using permutations for hierarchical clustering of time series. Entropy 2019, 21, 306. [Google Scholar] [CrossRef] [Green Version]
- Yao, Y.; Zhao, X.; Wu, Y.; Zhang, Y.; Rong, J. Clustering driver behavior using dynamic time warping and hidden Markov model. J. Intell. Transport. Syst. 2019, 1–14. [Google Scholar] [CrossRef]
- Petitjean, F.; Ketterlin, A.; Gançarski, P. A global averaging method for dynamic time warping, with applications to clustering. Pattern Recognit. 2011, 44, 678–693. [Google Scholar] [CrossRef]
- Chen, Y.; Liu, X.; Li, X.; Liu, X.; Yao, Y.; Hu, G.; Xu, X.; Pei, F. Delineating urban functional areas with building-level social media data: A dynamic time warping (DTW) distance based k-medoids method. Landsc. Urban Plan 2017, 160, 48–60. [Google Scholar] [CrossRef]
- Izakian, H.; Pedrycz, W.; Jamal, I. Fuzzy clustering of time series data using dynamic time warping distance. Eng. Appl. Artif. Intell. 2015, 39, 235–244. [Google Scholar] [CrossRef]
- Huang, X.; Ye, Y.; Xiong, L.; Lau, R.Y.; Jiang, N.; Wang, S. Time series k-means: A new k-means type smooth subspace clustering for time series data. Inf. Sci. 2016, 367, 1–13. [Google Scholar] [CrossRef]
- Johnson, M.G.; Pokorny, L.; Dodsworth, S.; Botigue, L.R.; Cowan, R.S.; Devault, A.; Eiserhardt, W.L.; Epitawalage, N.; Forest, F.; Kim, J.T.; et al. A universal probe set for targeted sequencing of 353 nuclear genes from any flowering plant designed using k-medoids clustering. Syst. Biol. 2018, 68, 594–606. [Google Scholar] [CrossRef] [Green Version]
- Garain, J.; Kumar, R.K.; Kisku, D.R.; Sanyal, G. Addressing facial dynamics using k-medoids cohort selection algorithm for face recognition. Multimed. Tools Appl. 2019, 78, 18443–18474. [Google Scholar] [CrossRef]
- Li, Z.; Wang, G.; He, G. Milling tool wear state recognition based on partitioning around medoids (PAM) clustering. Int. J. Adv. Manuf. Technol. 2017, 88, 1203–1213. [Google Scholar] [CrossRef]
- Kou, G.; Peng, Y.; Wang, G. Evaluation of clustering algorithms for financial risk analysis using MCDM methods. Inf. Sci. 2014, 275, 1–12. [Google Scholar] [CrossRef]
Figure 1.
The occupancy rate of 27 car parks in Nov., 2016.

Figure 2.
Framework of car park clustering.

Figure 3.
Distance measurement method dynamic time warping (DTW).

Figure 4.
Results of clustering on data1. Figure 4 contains three graphs which were listed by clusters: (a) cluster 1, (b) cluster 2, (c) cluster 3.
Figure 4.
Results of clustering on data1. Figure 4 contains three graphs which were listed by clusters: (a) cluster 1, (b) cluster 2, (c) cluster 3.

Figure 5.
Results of clustering on data2. Figure 5 contains three graphs which were listed by clusters: (a) cluster 1, (b) cluster 2, (c) cluster 3.
Figure 5.
Results of clustering on data2. Figure 5 contains three graphs which were listed by clusters: (a) cluster 1, (b) cluster 2, (c) cluster 3.


Table 1.
Review of raw 9 UCR public datasets.
| Dataset | k | train | test | total |
|---|---|---|---|---|
| EthanolLevel | 4 | 804 | 200 | 1004 |
| SyntheticControl | 6 | 480 | 120 | 600 |
| Strawbeerry | 2 | 787 | 196 | 983 |
| CBF | 3 | 744 | 186 | 930 |
| Beef | 5 | 48 | 12 | 60 |
| Coffee | 2 | 45 | 11 | 56 |
| SmoothSubspace | 3 | 240 | 60 | 300 |
| MoteStrain | 2 | 1018 | 254 | 1272 |
| SonyAIBORobotsurface1 | 2 | 497 | 124 | 621 |
Table 2.
Results of 4 methods on 9 datasets.
| DataSet | Purity | |||||||
|---|---|---|---|---|---|---|---|---|
| ED+PAM | ED+DBPAM | DTW +PAM | DTW +DBPAM | |||||
| Train | Test | Train | Test | Train | Test | Train | Test | |
| EthanolLevel | 0.3188 | 0.38555 | 0.3562 | 0.408 | 0.35495 | 0.3532 | 0.3935 | 0.4726 |
| SyntheticControl | 0.67875 | 0.723333 | 0.7213 | 0.7867 | 0.71375 | 0.745 | 0.76875 | 0.791667 |
| Strawbeerry | 0.76132 | 0.75938 | 0.8066 | 0.7767 | 0.671749 | 0.6802 | 0.820611 | 0.8223 |
| CBF | 0.597043 | 0.627957 | 0.6022 | 0.64 | 0.709409 | 0.683871 | 0.553763 | 0.575269 |
| Beef | 0.53334 | 0.68334 | 0.5236 | 0.7225 | 0.54584 | 0.7 | 0.4792 | 0.75 |
| Coffee | 0.87112 | 0.89092 | 0.9115 | 0.9461 | 0.8667 | 0.94546 | 0.9556 | 0.9091 |
| SmoothSubspace | 0.63832 | 0.63998 | 0.6017 | 0.6549 | 0.70334 | 0.77998 | 0.6125 | 0.6833 |
| MoteStrain | 0.83558 | 0.8173 | 0.8722 | 0.8934 | 0.83538 | 0.82124 | 0.9855 | 0.9843 |
| SonyAIBORobotsurface1 | 0.8012 | 0.78388 | 0.83148 | 0.86844 | 0.73118 | 0.76844 | 0.992 | 1 |
| 0 | 0 | 0 | 1 | 3 | 2 | 6 | 6 | |
© 2020 by the authors. Licensee MDPI, Basel, Switzerland. This article is an open access article distributed under the terms and conditions of the Creative Commons Attribution (CC BY) license (http://creativecommons.org/licenses/by/4.0/).
Share and Cite
MDPI and ACS Style
Li, T.; Wu, X.; Zhang, J. Time Series Clustering Model based on DTW for Classifying Car Parks. Algorithms 2020, 13, 57. https://0-doi-org.brum.beds.ac.uk/10.3390/a13030057
AMA Style
Li T, Wu X, Zhang J. Time Series Clustering Model based on DTW for Classifying Car Parks. Algorithms. 2020; 13(3):57. https://0-doi-org.brum.beds.ac.uk/10.3390/a13030057
Chicago/Turabian StyleLi, Taoying, Xu Wu, and Junhe Zhang. 2020. "Time Series Clustering Model based on DTW for Classifying Car Parks" Algorithms 13, no. 3: 57. https://0-doi-org.brum.beds.ac.uk/10.3390/a13030057
Note that from the first issue of 2016, this journal uses article numbers instead of page numbers. See further details here.