Fuzzy C-Means Clustering Algorithm with Multiple Fuzzification Coefficients


1
Department of Information Systems, Hanoi University of Science and Technology, Hanoi 10000, Vietnam
2
Department of Chemical Engineering, University of Waterloo, Waterloo, ON N2L 3G1, Canada
*
Authors to whom correspondence should be addressed.
Algorithms 2020, 13(7), 158; https://0-doi-org.brum.beds.ac.uk/10.3390/a13070158
Submission received: 7 June 2020
/
Revised: 24 June 2020
/
Accepted: 28 June 2020
/
Published: 30 June 2020
(This article belongs to the Special Issue Supervised and Unsupervised Classification Algorithms)
Abstract
:Clustering is an unsupervised machine learning technique with many practical applications that has gathered extensive research interest. Aside from deterministic or probabilistic techniques, fuzzy C-means clustering (FCM) is also a common clustering technique. Since the advent of the FCM method, many improvements have been made to increase clustering efficiency. These improvements focus on adjusting the membership representation of elements in the clusters, or on fuzzifying and defuzzifying techniques, as well as the distance function between elements. This study proposes a novel fuzzy clustering algorithm using multiple different fuzzification coefficients depending on the characteristics of each data sample. The proposed fuzzy clustering method has similar calculation steps to FCM with some modifications. The formulas are derived to ensure convergence. The main contribution of this approach is the utilization of multiple fuzzification coefficients as opposed to only one coefficient in the original FCM algorithm. The new algorithm is then evaluated with experiments on several common datasets and the results show that the proposed algorithm is more efficient compared to the original FCM as well as other clustering methods.
1. Introduction
Clustering is a machine learning technique that involves the grouping of data points into different clusters, where data points in the same cluster have a higher degree of similarity and any two data points in two different clusters have a lower degree of similarity. This technique improves the effectiveness of data mining, especially in big-data problems, as the data points are grouped into clusters with distinctive characteristics [1]. There are many different clustering techniques, such as centroid- based, hierarchical, density-based, distribution-based and grid-based clustering.
In practical problems, some data elements may be missing information or containing uncertain information. The fuzzy set theory provides an appropriate method of representing and processing these types of data elements, along with the concept of membership function defined in the range [0,1]. In this concept, each element can belong to more than one cluster. The fuzzy C-means (FCM) algorithm [2], a method of fuzzy clustering, is an efficient algorithm for extracting rules and mining data from a dataset in which the fuzzy properties are highly common [3]. Many new methods based on the FCM algorithm were introduced, in order to overcome the limitations and improve the clustering ability of this algorithm in different cases. The performance of these new methods is summarized in [4]. The new and improved FCM-based methods extend or modify the distance metric between elements and cluster center, use different fuzzy measures for the membership of an element to a cluster or modify the exponential parameter for fuzzifying [3,5].
An improvement direction is given by Hwang et al. in [6], which is the interval type-2 fuzzy C-means clustering (FCMT2I) algorithm. The study gives a fuzzy extension of the fuzzification coefficient m, thereby applying the type-2 fuzzy set into the membership matrix U. The parameter m in the FCMT2I algorithm can be any value in the range . A few articles [7,8,9,10] discuss this approach further; after every iteration, an element belonging to the clusters is represented by an interval type-2 fuzzy set and further calculations are needed for type-reduction when calculating the cluster centers for the next steps. According to the type-reduction algorithm [6,10], the cluster centers are calculated separately with the exponential parameters , , and then combined through the defuzzification step. In essence, after the type-reduction algorithm is executed, the resulting cluster center value is the same as the value calculated using an exponential parameter in the range . The exponential parameter is used to adjust the membership level of the elements in the clusters and its value can vary with clusters and steps. Thus, the FCMT2I algorithm allows the use of different exponential parameters.
This study presents an approach that utilizes multiple different fuzzification coefficients as opposed to only one coefficient in the FCM algorithm. While in other past papers, the determination of fuzzification coefficients corresponds to the type-reduction calculations for the cluster centers, in this study, the fuzzification coefficients are determined for each element prior to calculations, depending on the characteristics of such element in the entire dataset. In a dataset, the density of each element, represented by its distance from the “neighboring” elements, is a useful measurement [6,11,12]. This study uses that measurement to determine the exponential parameter for each element during the clustering process. The main contribution of this study is the proposition of the use and manipulation of multiple fuzzification coefficients to enhance the performance of the original FCM algorithm. The experimental evaluation of the efficiency of the proposed algorithm is conducted using several common datasets from the University of California, Irvine (UCI) machine learning repository.
2. Preliminaries
2.1. Standard Fuzzy C-Means (FCM) Algorithm
The FCM algorithm [2] partitions a finite collection of elements into a collection of C clusters with respect to some given criteria. Each element , , is a vector with d dimensions. We define a way to divide X into C clusters with cluster centers in the centroid set V.
In the FCM algorithm, U is a representative matrix for the membership of each element in each cluster. The matrix U has some characteristics as below:
- is the membership value of the element in a cluster with center , ;
- , ; and for each .
- The larger is, the higher the degree of confidence that the element belongs to the cluster .
An objective function is defined such that the clustering algorithm minimizes the objective function
where,
- is the squared distance between the element Xi and the cluster center Vk.
- m is the fuzzification coefficient of the algorithm.
Summary of steps for the FCM algorithm:
Input: the dataset , the fuzzification coefficient .
Output: the partition of into clusters.
Steps:
- Step 1: Initialize value for , let , set and .
- Step 2: At the loop, update according to the formula:
- Step 3: Update for the next step , according to the formula:
- Step 4: If then go to Step 5; otherwise, let and return to Step 2.
- Step 5: End.
2.2. Interval Type-2 Fuzzy C-Means (FCMT2I) Clustering
FCM is a breakthrough algorithm compared to other well-known clustering algorithms because FCM has a more general representation and more accurate clustering results in many cases. However, the FCM algorithm has some disadvantages:
- The algorithm is sensitive to noise and foreign elements;
- Clustering is not accurate and valid for elements located at the boundary between clusters;
- There is no specific criterion to select the value for the parameter m, which is often selected after testing multiple times.
With these disadvantages, the FCM algorithm requires more research and development to be further improved.
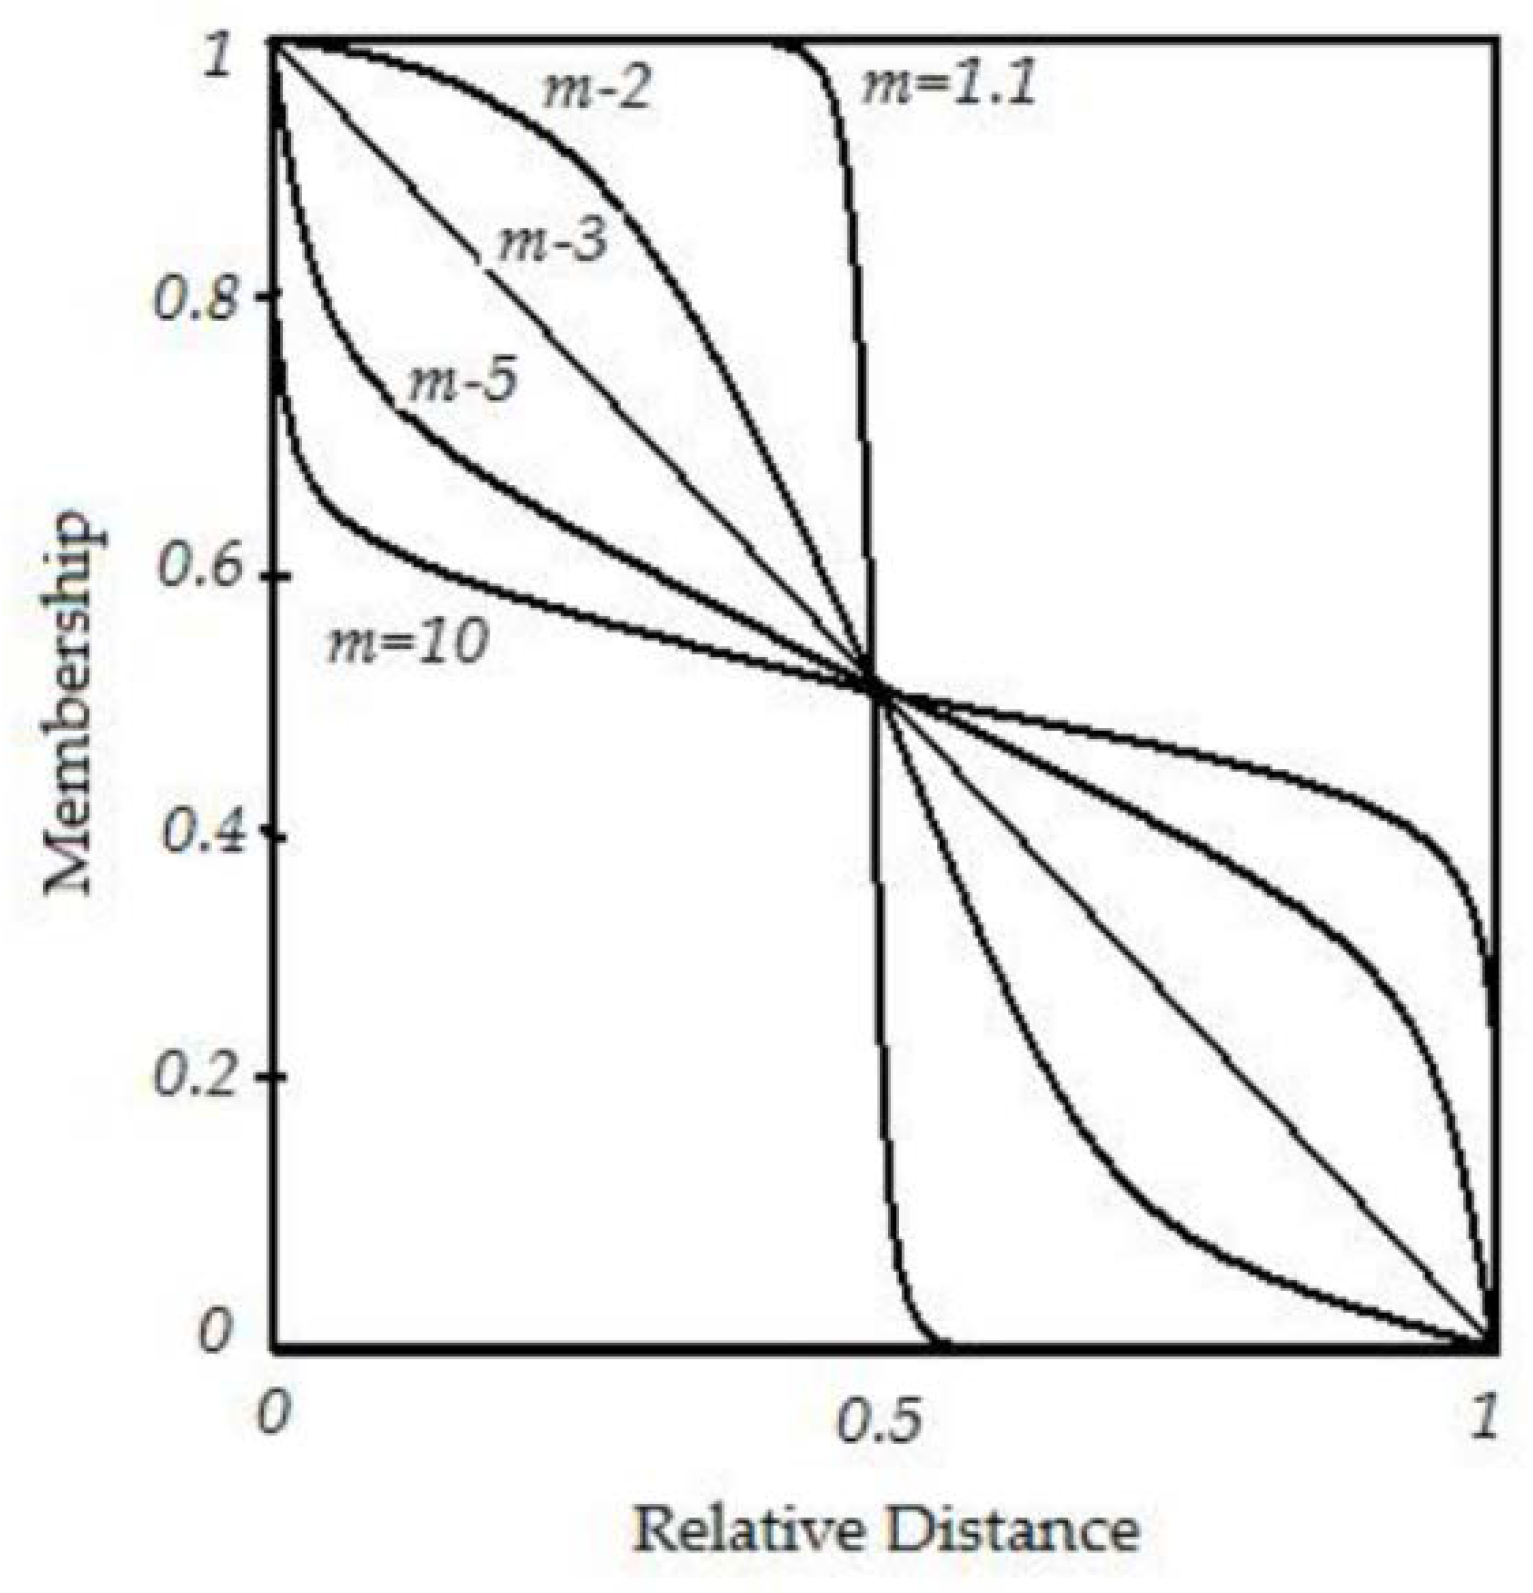
A research [6] on the extension or modification of the distance metrics D(i, k) uses different fuzzy metrics for U(i, k) or discusses the exponential parameter m. The clustering decisions made in FCM is based on Equation (2), which presents the fuzzy membership of element Xi that is assigned by the relative distance between Xi and Vk. This formula has a characteristic that is, the smaller m, the higher the absolute membership U, as shown in Figure 1 by the case of C = 2.
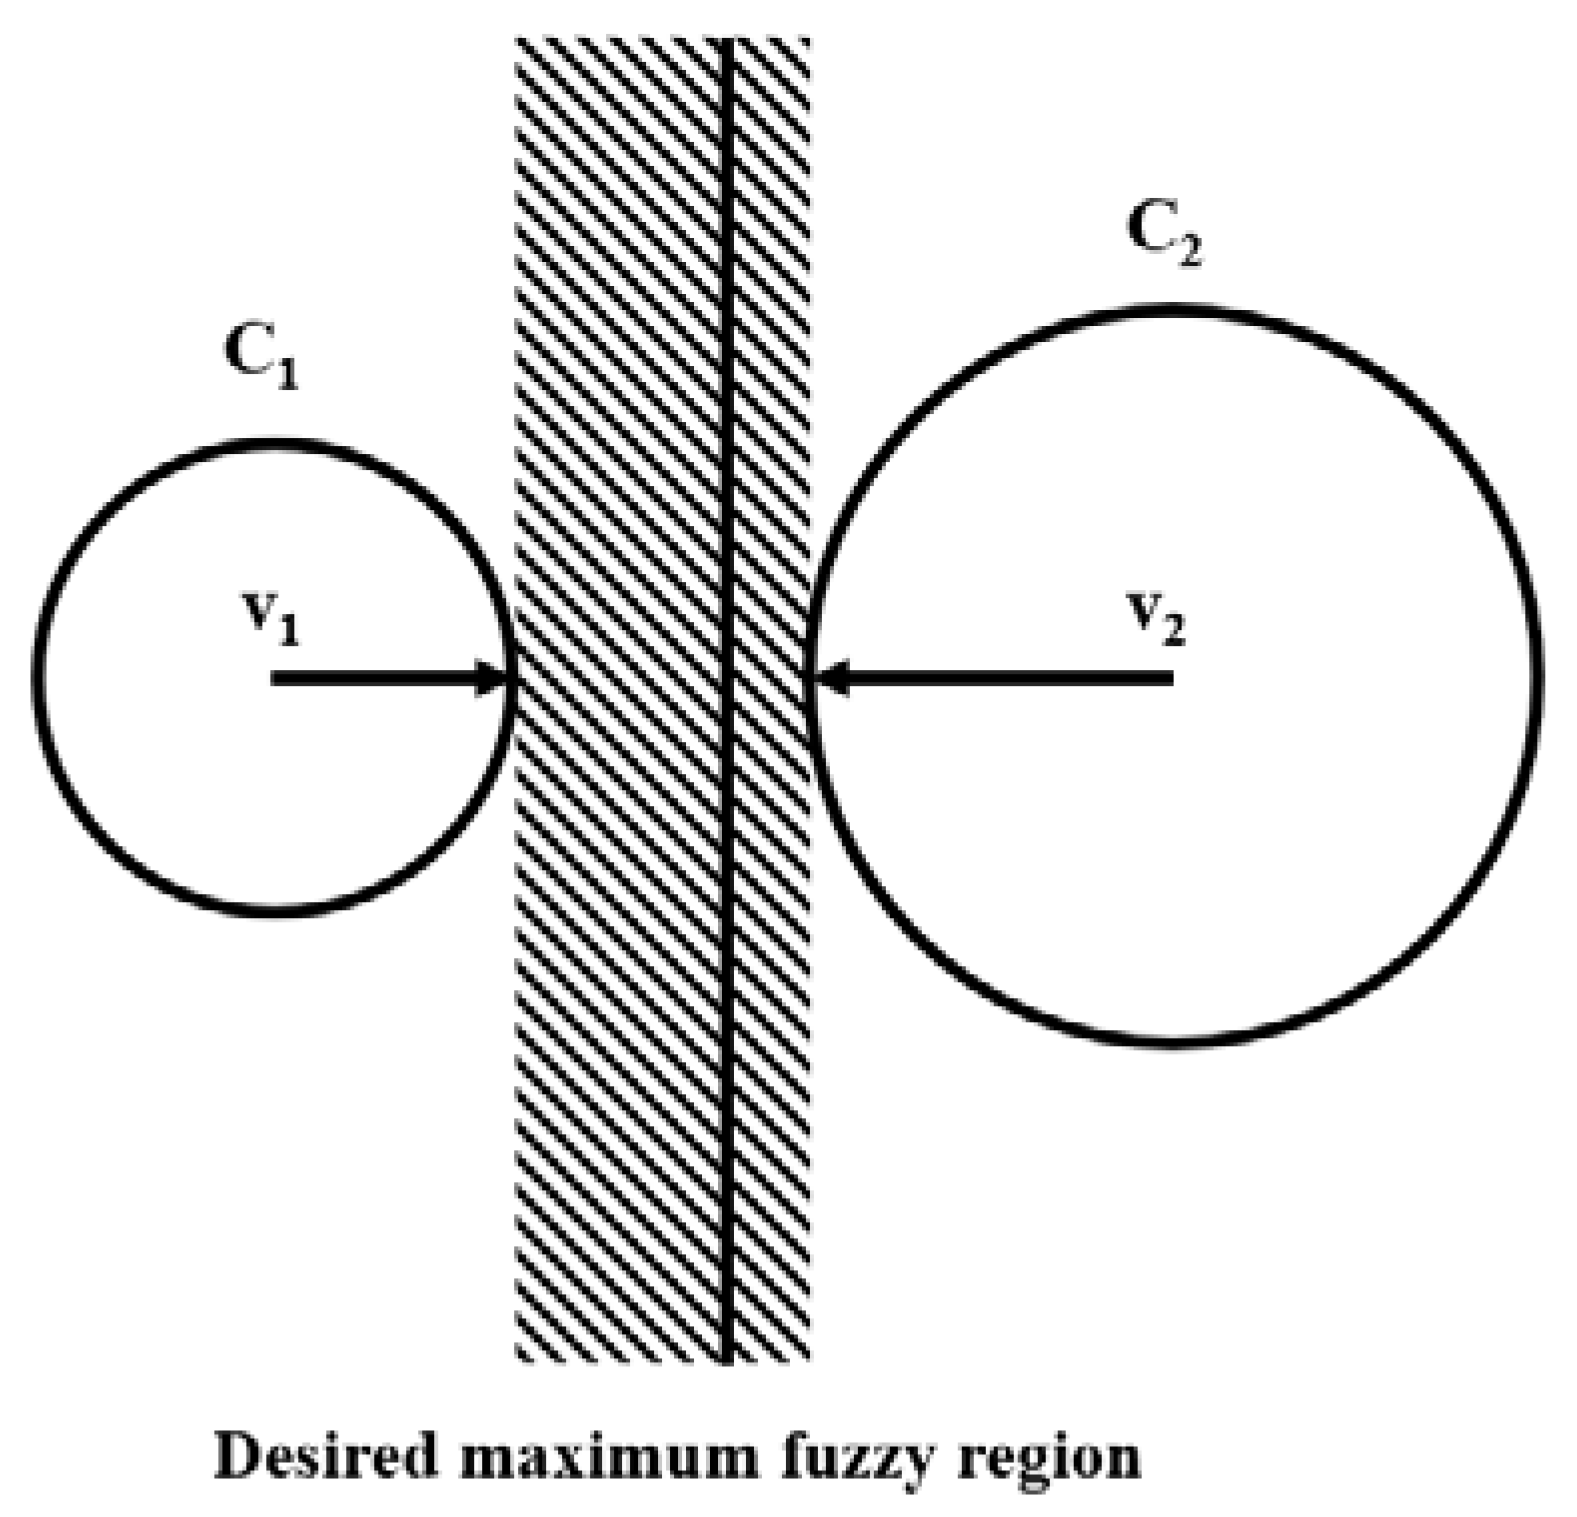
For the elements on the cluster boundary, the absolute degree of U must be lower than the elements near the center of the cluster. The reason is that we cannot make a clustering decision with elements at the immediate boundary, so we need the U graph to be more flexible in terms of cluster selection for these elements. Meanwhile, the elements near the center of the cluster should have a steeper U graph to ensure that the clustering control is always in place in the nearest cluster. Since FCM only uses a single m value, the absolute level of U is the same for the elements near the center of the cluster and the elements at the boundary, which is not reasonable. Hwang et al. [6] studied the elements on the boundary of two clusters. It was found that when choosing a large m for the degree of U to cluster center V1 and choosing a small m for the degree of U to cluster center V2, the cluster boundary would be distributed with a wide left region and narrow right region, as shown in Figure 2.
As seen from the above analysis, different exponential parameters m can be determined depending on the distance between the element and the cluster center. The interval type-2 fuzzy C-means clustering (FCMT2I) method, proposed in [6], uses two parameters mL and mU. These calculations are derived from Equations (2) and (3). However, the membership of Xi in the cluster k becomes a range of values, hence, the calculation of the cluster center in FCMT2I requires additional steps from the type-reduction algorithm to obtain a single final value. Therefore, even though the performance of the FCMT2I algorithm is, in general, better than that of the FCM with one exponential parameter, the FCMT2I algorithm requires more calculations because the exponential parameters depend on the distance to the cluster center and the cluster center changes after every iteration.
The proposed idea in this study is to assign each element Xi an exponential parameter mi which is constant throughout the entire clustering process. The determination of mi depends on the characteristics of the corresponding element Xi in the dataset.
3. Fuzzy C–Means Clustering with Multiple Fuzzification Coefficients (MC-FCM)
3.1. The Fuzzification Coefficients
Each element is assigned its own fuzzification coefficient. The fuzzification coefficient of an element is calculated based on the concentration of other elements surrounding that element. If the concentration is high, meaning a high chance to create a cluster, the fuzzification coefficient will be small for faster convergence. If the concentration is low, the fuzzification coefficient will be large to increase the ability to select a cluster through iterations.
With each element , , let be the distance between the elements Xi and Xj, . In the dataset, we can treat the total distance between Xi and N/C elements with the closest distance to Xi as a heuristic metric for the concentration surrounding Xi, notated . Afterward, the fuzzification coefficient mi can be calculated from , as shown below.
Summary of steps for computingmi
Input: the dataset , the interval for fuzzification coefficients , and a parameter α.
Output: the fuzzification coefficient mi for each element
Steps:
- Step 1: Calculate the distance between two elements , ; .
- Step 2: Rearrange with index , we have in non-decreasing order. Calculate .
- Step 3: Calculate and . For each , , calculate
The algorithm to calculate is carried out once before clustering, with a complexity of . The parameter is utilized to adjust the mapping of the distance between and its neighboring elements with the exponential parameter in the range of . If , it indicates linear mapping; if , the distribution is skewed toward ; and if , the distribution skewed toward .
3.2. Derivation of the MC-FCM Clustering Algorithm
In this section, we derive the fuzzy C-means clustering algorithm with multiple fuzzification coefficients (MC-FCM). The objective function to be minimized in the MC-FCM algorithm is formulated as follows,
where is the dataset, is the number of elements, is the number of clusters, is the membership value of element in the cluster with center , , , , , , is the fuzzification coefficient of and is the distance between two vectors and .
To solve the optimization problem shown in Equation (5), we employ the Lagrange multiplier method. Let
Furthermore, with
we can compute using
hence, we have
or
Next, we compute using
which implies
Because , we have ,
or ,
Replacing (9) into (8), we have
Summary of steps for the MC-FCM algorithm
Input: the dataset , the fuzzification coefficients of each .
Output: the partition of into clusters.
Steps:
- Step 1: Initialize value for , let , set .
- Step 2: At the loop, update according to Equation (10).
- Step 3: Update for the next step , according to Equation (7).
- Step 4: If , then go to Step 5; otherwise, let and return to Step 2.
- Step 5: End.
The MC-FCM algorithm has similar steps to the FCM, except for Equations (10), (7) replacing (2), (3) in FCM.
4. Evaluation of the Proposed MC-FCM Algorithm
In order to evaluate the performance of the proposed MC-FCM algorithm, we tested it using several UCI-benchmark datasets [13], described in Table 1 and compared it with FCM and FCMT2I. The algorithm was built and tested using C#. To make our comparison objective, we adopted the following performance indices outlined in [14]:
- The Davies–Bouldin (DB) index is based on a ratio involving within-group and between-group distances. , where , is the within-to-between cluster spread for the j-th and k–th clusters, i.e., , where and are the average within-group distances for the j-th and k–th clusters, respectively and is the inter-group distance between these clusters. These distances are defined as and . Here, represents the worst-case within-to-between cluster spread involving the j-th cluster. Minimizing for all clusters minimizes the DB index. Hence, good partitions, which are comprised of compact and separated clusters, are distinguished by small values of DB.
- The Alternative Silhouette Width Criterion (ASWC) is the ratio between the inter-group distance and the intra-group distance. , where . Let us consider that the i-th element of the dataset, belongs to a given cluster then is the average distance of to all other elements in this cluster, is the average distance of to all elements in another cluster , with , is the minimum of computed over with and is a small constant (e.g., 10−6 for normalized data) used to avoid division by zero when . Large ASWC values indicate good partitions.
- The PBM index is also based on the within-group and between-group distances. , where denotes the sum of distances between the elements and the grand mean of the data, represents the sum of within-group distances and is the maximum distance between group centroids. The best partition is indicated when PBM is maximized.
- The Rand index (RI) can be seen as an absolute criterion that allows the use of properly labeled datasets for performance assessment of clustering results. This simple and intuitive index handles two hard partition matrices ( and ) of the same dataset. The reference partition, , encodes the class labels, while the partition partitions the data into clusters and is the one to be evaluated. We have , where denotes the number of pairs of data elements belonging to the same class in and to the same cluster in , denotes the number of pairs of data elements belonging to different classes in and to different clusters in . Large RI values indicate compatible clustering with the given class labels.
- Mean accuracy (MA), , where is the number of elements in the cluster after clustering and is the actual number of elements in cluster . Large MA values often indicate good clustering.
The DB, ASWC and PBM indices show the compact and separated level of the clusters, while the MA and RI indices measure the quality of the clusters for the labeled datasets, to see the compatibility between the clusters and the labeled groups. When performing the evaluation in this study, we focused on the MA and DB indices. Since the clustering algorithm is affected by the initial step, each run with the parameters set was conducted several times.
We considered these scenarios:
- (i)
- Perform FCM with m = 2 several times and record the run with the best MA index result;
- (ii)
- Perform FCM with changing m and record the run with the best MA index result;
- (iii)
- Perform MC-FCM with changing mL, mU and α and record the run with the best MA index result;
- (iv)
- Perform MC-FCM with the same mL and mU as in (iii), adjust α and record the run with the best DB index result;
- (v)
- Perform FCMT2I several times with the same mL and mU as in (iii) and record the run with the best MA index result.
The comparison results of various clustering algorithms on the five UCI-benchmark datasets are shown below.
The results of the 5 indices for each algorithm implemented in 5 different datasets are shown in Table 2, Table 3, Table 4, Table 5 and Table 6, with the best index results bolded in the tables. The results show that the proposed MC-FCM algorithm gives better results for most of the indices in all five datasets. The MA index results using MC-FCM are consistently the best when compared to FCM and FCMT2I. For the DB index, MC-FCM gives the significantly better results in four out of five datasets. Other indices are similar for all cases. Regarding the number of iterations in the clustering process using MC-FCM, after averaging multiple runs, the WINE and IRIS datasets have a fewer number of iterations than FCM and a similar number of iterations compared to FCMT2I. The HEART dataset has similar numbers of iterations compared to both FCM and FCMT2I, while the WDBC and ECOLI datasets have a similar number of iterations compared to FCM and fewer than FCMT2I. Therefore, overall, the proposed MC-FCM algorithm outperformed the FCM and FCMT2I algorithms in terms of both clustering accuracy and clustering efficiency.
The MC-FCM algorithm can be improved even further by determining the parameter mi for the elements to replace the algorithm in Section 3.1. The value mi represents the fuzzy parameter, which corresponds to the type-2 fuzzy set membership representation of the element Xi in the clusters. The next step for this research is to apply hedge algebraic type-2 fuzzy sets [15,16,17] to determine the parameter mi.
5. Conclusions
This study proposed a novel clustering algorithm FCM using multiple fuzzification coefficients, corresponding to each element of the dataset. The formulas for calculating U(i,k) and Vk were derived to ensure algorithm convergence. The experimental results using several UCI-benchmark datasets demonstrated that the proposed MC-FCM algorithm gave better results in terms of accuracy and efficiency compared to the standard FCM and FCMT2I algorithms. Calculations of fuzzification coefficients for each element in the preprocessing steps before clustering were based on its distance to its neighboring elements. The content of this study can be further expanded to find more appropriate exponential parameters by applying different kinds of type-2 fuzzy sets.
Author Contributions
Conceptualization, T.D.K.; methodology, T.D.K., N.D.V. and M.-K.T.; software, N.D.V.; validation, T.D.K., N.D.V., M.-K.T. and M.F.; formal analysis, N.D.V.; writing—original draft preparation, T.D.K. and M.-K.T.; writing—review and editing, M.F.; supervision, T.D.K. and M.F. All authors have read and agreed to the published version of the manuscript.
Funding
This research is funded by the Vietnam National Foundation for Science and Technology Development (NAFOSTED) under Grant Number 102.05–2018.02.
Acknowledgments
Special thanks to Danielle Skeba for the contribution in editing the study.
Conflicts of Interest
The authors declare no conflict of interest.
References
- Everitt, B.S.; Landau, S.; Leese, M.; Stahl, D. Cluster Analysis, 5th ed.; John Wiley & Sons, Ltd.: Hoboken, NJ, USA, 2011. [Google Scholar]
- Bezdek, J.C.; Ehrlich, R.; Full, W. FCM: The fuzzy c-mean clustering algorithm. Comput. Geosci. 1984, 10, 191–203. [Google Scholar] [CrossRef]
- Ruspini, E.H.; Bezdek, J.C.; Keller, J.M. Fuzzy Clustering: A Historical Perspective. IEEE Comput. Intell. Mag. 2019, 14, 45–55. [Google Scholar] [CrossRef]
- Gosain, A.; Dahiya, S. Performance Analysis of Various Fuzzy Clustering Algorithms: A Review. Procedia Comput. Sci. 2016, 79, 100–111. [Google Scholar] [CrossRef] [Green Version]
- Arora, J.; Khatter, K.; Tushir, M. Fuzzy c-Means Clustering Strategies: A Review of Distance Measures. Softw. Eng. 2018, 731, 153–162. [Google Scholar]
- Hwang, C.; Rhee, F.C.-H. Uncertain Fuzzy Clustering: Interval Type-2 Fuzzy Approach to C-Means. IEEE Trans. Fuzzy Syst. 2007, 15, 107–120. [Google Scholar] [CrossRef]
- Ji, Z.; Xia, Y.; Sun, Q.; Cao, G. Interval-valued possibilistic fuzzy C-means clustering algorithm. Fuzzy Sets Syst. 2014, 253, 138–156. [Google Scholar] [CrossRef]
- Linda, O.; Manic, M. General Type-2 Fuzzy C-Means Algorithm for Uncertain Fuzzy Clustering. IEEE Trans. Fuzzy Syst. 2012, 20, 883–897. [Google Scholar] [CrossRef]
- Pagola, M.; Jurio, A.; Barrenechea, E.; Fernández, J.; Bustince, H. Interval-valued fuzzy clustering. In Proceedings of the 16th World Congress of the International Fuzzy Systems Association (IFSA) and 9th Conference of the European Society for Fuzzy Logic and Technology (EUSFLAT), Paris, France, 30 June–3 July 2015; pp. 1288–1294. [Google Scholar]
- Wu, D.; Mendel, J.M. Enhanced Karnik-Mendel Algorithms for Interval Type-2 Fuzzy Sets and Systems. In Proceedings of the NAFIPS ’07, Annual Meeting of the North American Fuzzy Information Processing Society, San Diego, CA, USA, 24–27 June 2007; pp. 184–189. [Google Scholar]
- Du, M.; Ding, S.; Xue, Y. A robust density peaks clustering algorithm using fuzzy neighborhood. Int. J. Mach. Learn. Cyber 2017, 9, 1131–1140. [Google Scholar] [CrossRef]
- Trabelsi, M.; Frigui, H. Robust fuzzy clustering for multiple instance regression. Pattern Recognit. 2019, 90, 424–435. [Google Scholar] [CrossRef] [Green Version]
- Bache, K.; Lichman, M. UCI Machine Learning Repository; Univ. California, School of Information and Computer Science: Irvine, CA, USA, 2013; Available online: http://archive.ics.uci.edu/ml (accessed on 19 September 2019).
- Vendramin, L.; Campello, R.J.G.B.; Hruschka, E.R. Relative Clustering Validity Criteria: A Comparative Overview. Stat. Anal. Data Min. 2010, 3, 209–235. [Google Scholar] [CrossRef]
- Nguyen, C.H.; Tran, D.K.; Nam, H.V.; Nguyen, H.C. Hedge Algebras, Linguistic-Valued Logic and Their Application to Fuzzy Reasoning. Int. J. Uncertain. Fuzziness Knowl. Based Syst. 1999, 7, 347–361. [Google Scholar] [CrossRef]
- Anh Phong, P.; Dinh Khang, T.; Khac Dong, D. A fuzzy rule-based classification system using Hedge Algebraic Type-2 Fuzzy Sets. In Proceedings of the Annual Conference of the North American Fuzzy Information Processing Society (NAFIPS), El Paso, TX, USA, 31 October–4 November 2016; pp. 265–270. [Google Scholar]
- Khang, T.D.; Phong, P.A.; Dong, D.K.; Trang, C.M. Hedge Algebraic Type-2 Fuzzy Sets. In Proceedings of the Conference: FUZZ-IEEE 2010, IEEE International Conference on Fuzzy Systems, Barcelona, Spain, 18–23 July 2010; pp. 1850–1857. [Google Scholar]
Figure 1.
Membership of an element to a cluster for different values of m.

Figure 2.
The cluster boundary between two clusters for different values of m.


Table 1.
Summarized descriptions of the experimental datasets.
| Dataset | Samples | Attributes | Classes | Description |
|---|---|---|---|---|
| ECOLI | 336 | 7 | 8 | This dataset consists of 7 characteristics of 8 E. coli bacteria types used to identify them. |
| HEART | 303 | 13 | 2 | This dataset consists of 13 symptoms used to determine if one has heart disease. |
| WDBC | 569 | 32 | 2 | This dataset consists of 32 metrics obtained from X-ray images of breast cancer tumors used to determine if one has breast cancer. |
| IRIS | 150 | 4 | 3 | This dataset consists of 4 characteristics of 3 types of irises used to identify them. |
| WINE | 178 | 13 | 3 | This dataset consists of 13 chemical constituents in 3 types of Italian wine used to identify them. |
Table 2.
Experimental results with the ECOLI dataset, 336 samples, 8 clusters, mL = 5.5, mU = 6.5.
| Algorithms | DB | ASWC | PBM | RI | MA |
|---|---|---|---|---|---|
| FCM, m = 2 | 2.5855 | 0.8183 | 0.0098 | 0.8403 | 0.7652 |
| FCM, m = 6.1 | 2.8955 | 0.8657 | 0.0091 | 0.8604 | 0.8077 |
| MC-FCM, α = 0.1 | 2.8329 | 0.8995 | 0.0084 | 0.8699 | 0.8244 |
| MC-FCM, α = 1.9 | 2.4021 | 0.895 | 0.0089 | 0.8644 | 0.8125 |
| FCMT2I | 3.4561 | 0.8581 | 0.0091 | 0.8546 | 0.8184 |
Table 3.
Experimental results with the HEART dataset, 303 samples, 2 clusters, mL = 1.1, mU = 4.1.
| Algorithms | DB | ASWC | PBM | RI | MA |
|---|---|---|---|---|---|
| FCM, m = 2 | 0.7445 | 0.8182 | 0.8118 | 0.5154 | 0.5926 |
| FCM, m = 3 | 0.9044 | 0.8159 | 0.8102 | 0.5213 | 0.6074 |
| MC-FCM, α = 0.8 | 0.7319 | 0.8140 | 0.8124 | 0.5229 | 0.6148 |
| MC-FCM, α = 1.7 | 0.7306 | 0.8159 | 0.8102 | 0.5213 | 0.6074 |
| FCMT2I | 0.7684 | 0.8166 | 0.8186 | 0.5168 | 0.5963 |
Table 4.
Experimental results with the WDBC dataset, 569 samples, 2 clusters, mL = 3.1, mU = 9.1.
| Algorithms | DB | ASWC | PBM | RI | MA |
|---|---|---|---|---|---|
| FCM, m = 2 | 1.2348 | 2.2109 | 23.036 | 0.7504 | 0.8541 |
| FCM, m = 6 | 1.0618 | 2.0409 | 22.566 | 0.7707 | 0.8682 |
| MC-FCM, α = 0.7 | 0.6508 | 1.588 | 20.147 | 0.8365 | 0.9104 |
| MC-FCM, α = 0.4 | 0.6298 | 1.4938 | 19.897 | 0.8216 | 0.9051 |
| FCMT2I | 0.7847 | 1.588 | 20.147 | 0.8365 | 0.9104 |
Table 5.
Experimental results with the IRIS dataset, 150 samples, 3 clusters, mL = 1.1, mU = 9.1.
| Algorithms | DB | ASWC | PBM | RI | MA |
|---|---|---|---|---|---|
| FCM, m = 2 | 3.4835 | 1.7587 | 0.1574 | 0.8797 | 0.8933 |
| FCM, m = 9 | 2.0737 | 1.6771 | 0.1498 | 0.9124 | 0.9267 |
| MC-FCM, α = 2.5 | 2.1388 | 1.6824 | 0.1471 | 0.9195 | 0.9333 |
| MC-FCM, α = 9.9 | 2.0714 | 1.6794 | 0.1489 | 0.8797 | 0.92 |
| FCMT2I | 1.3406 | 1.7548 | 0.1377 | 0.8464 | 0.8533 |
Table 6.
Experimental results with the WINE dataset, 178 samples, 3 clusters, mL = 1.1, mU = 6.1.
| Algorithms | DB | ASWC | PBM | RI | MA |
| FCM, m = 2 | 2.6983 | 1.2521 | 2.3675 | 0.7105 | 0.6854 |
| FCM, m = 10 | 2.2146 | 1.3040 | 2.3711 | 0.7204 | 0.7079 |
| MC-FCM, α = 0.7 | 3.7023 | 1.2867 | 2.2668 | 0.7363 | 0.7303 |
| MC-FCM, α = 8.7 | 1.2995 | 1.3131 | 2.3649 | 0.7187 | 0.7022 |
| FCMT2I | 2.0272 | 1.3308 | 2.2763 | 0.7254 | 0.6910 |
© 2020 by the authors. Licensee MDPI, Basel, Switzerland. This article is an open access article distributed under the terms and conditions of the Creative Commons Attribution (CC BY) license (http://creativecommons.org/licenses/by/4.0/).
Share and Cite
MDPI and ACS Style
Khang, T.D.; Vuong, N.D.; Tran, M.-K.; Fowler, M. Fuzzy C-Means Clustering Algorithm with Multiple Fuzzification Coefficients. Algorithms 2020, 13, 158. https://0-doi-org.brum.beds.ac.uk/10.3390/a13070158
AMA Style
Khang TD, Vuong ND, Tran M-K, Fowler M. Fuzzy C-Means Clustering Algorithm with Multiple Fuzzification Coefficients. Algorithms. 2020; 13(7):158. https://0-doi-org.brum.beds.ac.uk/10.3390/a13070158
Chicago/Turabian StyleKhang, Tran Dinh, Nguyen Duc Vuong, Manh-Kien Tran, and Michael Fowler. 2020. "Fuzzy C-Means Clustering Algorithm with Multiple Fuzzification Coefficients" Algorithms 13, no. 7: 158. https://0-doi-org.brum.beds.ac.uk/10.3390/a13070158
Note that from the first issue of 2016, this journal uses article numbers instead of page numbers. See further details here.