Oil Spill Monitoring of Shipborne Radar Image Features Using SVM and Local Adaptive Threshold


1
Navigation College, Dalian Maritime University, Dalian 116026, China
2
Maritime College, Guangdong Ocean University, Zhanjiang 524088, China
3
Civil Aviation College, Shenyang Aerospace University, Shenyang 110000, China
4
Laboratory Department, Liaoning Hydrogeology and Engineering Geology Reconnaissance Institute, Dalian 116000, China
*
Authors to whom correspondence should be addressed.
Algorithms 2020, 13(3), 69; https://0-doi-org.brum.beds.ac.uk/10.3390/a13030069
Submission received: 14 February 2020
/
Revised: 9 March 2020
/
Accepted: 19 March 2020
/
Published: 21 March 2020
(This article belongs to the Special Issue Bio-Inspired Algorithms for Image Processing)
Abstract
:In the case of marine accidents, monitoring marine oil spills can provide an important basis for identifying liabilities and assessing the damage. Shipborne radar can ensure large-scale, real-time monitoring, in all weather, with high-resolution. It therefore has the potential for broad applications in oil spill monitoring. Considering the original gray-scale image from the shipborne radar acquired in the case of the Dalian 7.16 oil spill accident, a complete oil spill detection method is proposed. Firstly, the co-frequency interferences and speckles in the original image are eliminated by preprocessing. Secondly, the wave information is classified using a support vector machine (SVM), and the effective wave monitoring area is generated according to the gray distribution matrix. Finally, oil spills are detected by a local adaptive threshold and displayed on an electronic chart based on geographic information system (GIS). The results show that the SVM can extract the effective wave information from the original shipborne radar image, and the local adaptive threshold method has strong applicability for oil film segmentation. This method can provide a technical basis for real-time cleaning and liability determination in oil spill accidents.
Keywords:
oil spill; SVM; real-time monitoring; shipborne radar; remote sensing; image processing; GIS1. Introduction
Oil, including crude, gasoline, bulk oil, and fuel, spills into marine environments during off-shore well production, oil refining, oil tanker transportation, and pipeline ruptures. According to the European Space Agency (ESA), the amount of oil spilled annually worldwide is estimated to be more than 4.5 million tons, and 80% of this is due to operative discharges [1]. This has become a major man-made threat to marine and coastal environments, with adverse long-term impacts on economics and biological health [2]. For example, a recent oil spill disaster has continued to pollute many of Brazil’s coastlines for months, with the catastrophe exhausting the resources of the government and communities [3,4]. Marine oil spills can diffuse extensively the sea surface within several hours, leading to very serious consequences [5]. Billions of dollars are spent preventing pollution, but risk cannot be completely eliminated [6]. Technologies that can detect and monitor oil spills are, therefore, very important for rapid emergency response and contamination control.
With the ability to rapidly determine the scope and location of oil spills, remote sensing plays an increasingly important role in the emergency response of marine oil spills [7]. Among the remote sensing sensors, ultraviolet instruments, infrared detectors, microwave radiometers, and radar have been used to in an attempt to monitor oil spills [8]. Ultraviolet sensors can measure oil film thickness below 10 microns, but the correlation between thin oil slick and oil spill cleaning is very low, so the use of ultraviolet sensors for oil spills is minimal [9,10,11]. Infrared detectors are less expensive than other remote sensing sensors, but because the thermal radiation of seaweed is similar to that of an oil spill, the result can be falsely, requiring verification by other means [12,13]. Infrared sensors can work perfectly in the absence of clouds, rain, and fog [14]. Microwave radiometer sensors are relatively costly and complex for monitoring an oil spill and measuring oil thickness. A microwave radiometer can only work accurately with adequate environmental and oil property data. Furthermore, the results may be biased, with few interferences, and in practice, microwave radiometer sensors have not been used for monitoring oil spills [9,14]. Radar has been widely used in the research and application of monitoring oil spills, because it provides a long detection distance and is not limited by time and weather conditions [15,16,17].
Radar is the most widely used sensor on spaceborne, airborne, and shipborne platforms. More spaceborne synthetic aperture radar (SAR) oil spill monitoring research has been published because its fine spatial-resolution data are publicly accessible [18]. SAR oil spill detection can be summarized as (a) dark area detection, (b) feature extraction, and (c) discrimination between oil slicks and lookalikes [19,20]. The results are mostly used for liability and damage assessment because of the revisit time, which is not adequately frequent for ensuring good oil spill sampling [21]. Although this time interval is a key drawback, the application of spaceborne radar has played a major role in promoting the development of remote sensing for monitoring oil spills [22]. The application of airborne radar can compensate for the time interval shortcoming in the data acquisition of spaceborne radar, and research concerning remote sensing for the marine oil spill monitoring of airborne radar is increasing [23]. Initially, helicopter-borne radar was used to obtain the distribution range of oil films above the sea surface, but the emergence of the unmanned aerial vehicle (UAV) has greatly reduced the cost of airborne radar application [24]. The key disadvantage of airborne radar is that it cannot operate in severe weather [9]. Shipborne radar can overcome certain severe weather and can monitor oil spill in real-time with the cruise of the decontamination ship, and this has the potential for broad applicability.
Using shipborne radar to monitor an oil spill is physically possible because an oil slick on the sea surface has a different viscosity to that of water, and therefore attenuates the short gravity and capillary waves [25]. The roughness of the sea surface becomes less than that of water in an oil spill, and therefore, a lower radar backscattering of oil slicks is formed [26,27]. This results in oil slicks being displayed as relatively dark targets in the wave area on shipborne radar images. This differs from spaceborne and airborne radar, whereby the gray distribution of the wave in the original shipborne radar image is very uneven, and with increasing monitoring distance, the gray level continuously decreases because they are relatively dark targets. In short distance waves, the gray value of the oil spill may, therefore, be higher than that of the long distance waves. This creates significant difficulty for shipborne oil spill monitoring. Many research methods for spaceborne and airborne radar can be applied in the oil spill detection of shipborne radar images, including manual single threshold segmentation [28], the adaptive threshold segmentation method [29], the double threshold segmentation method [30], the active contour model (ACM) [31], neural networks, and machine learning algorithms [32,33]. The oil spill monitoring technology of shipborne radar remains in its infancy, and some related research findings have been published. Zhu et al. suggested that, after adjusting the entire gray level of a shipborne radar image, the manual single threshold segmentation should be used to extract oil spill [34], hence making exploratory progress. Based on manual single threshold segmentation, Xu et al. proposed a manual dual-threshold segmentation method for shipborne radar image oil spill monitoring after determining the range of effective wave information [35]. With the continuous development of oil spill detection technology in shipborne radar images, Xu et al. suggested an adaptive threshold method to automatically identify oil films [36]. In recent years, deep learning methods have been successfully applied in the pattern recognition of images. Liu et al. proposed the extraction of oil films by a local adaptive threshold after determining the surrounding oil spill areas using a deep learning method with textural features of a Gray Level Co-occurrence Matrix (GLCM) [37]. In view of the successful application of deep learning on shipborne radar oil spill monitoring, we propose extracting effective wave information from radar images based on a support vector machine (SVM), and then extracting oil films based on a local adaptive threshold.
In this study, a complete oil spill detection method of shipborne radar images is advocated. A large number of co-frequency interferences seriously affect the gray distribution of the original image, and we therefore offer a fast noise reduction method in a Cartesian coordinate system, with the SVM used to classify the waves and backgrounds. According to the gray distribution matrix, the effective wave monitoring zone is then chosen to segment oil films by a local adaptive threshold. The final result is mapped to the electronic chart through coordinate transformation. The successful application of this scheme will be an effective technical means for the real-time monitoring of oil spills.
The remainder of this paper is organized as follows: Section 2 focuses on the preparation process of the materials and methods, including the description, preprocessing, and major methods. Section 3 presents the results of our experiments and the validity of our method. The advantages of shipborne radar oil spill monitoring in comparison with other local adaptive thresholds as well as in comparison with other oil film classifications of shipborne radar are also provided. Section 4 provides a summary of the study.
2. Materials and Methods
2.1. Materials
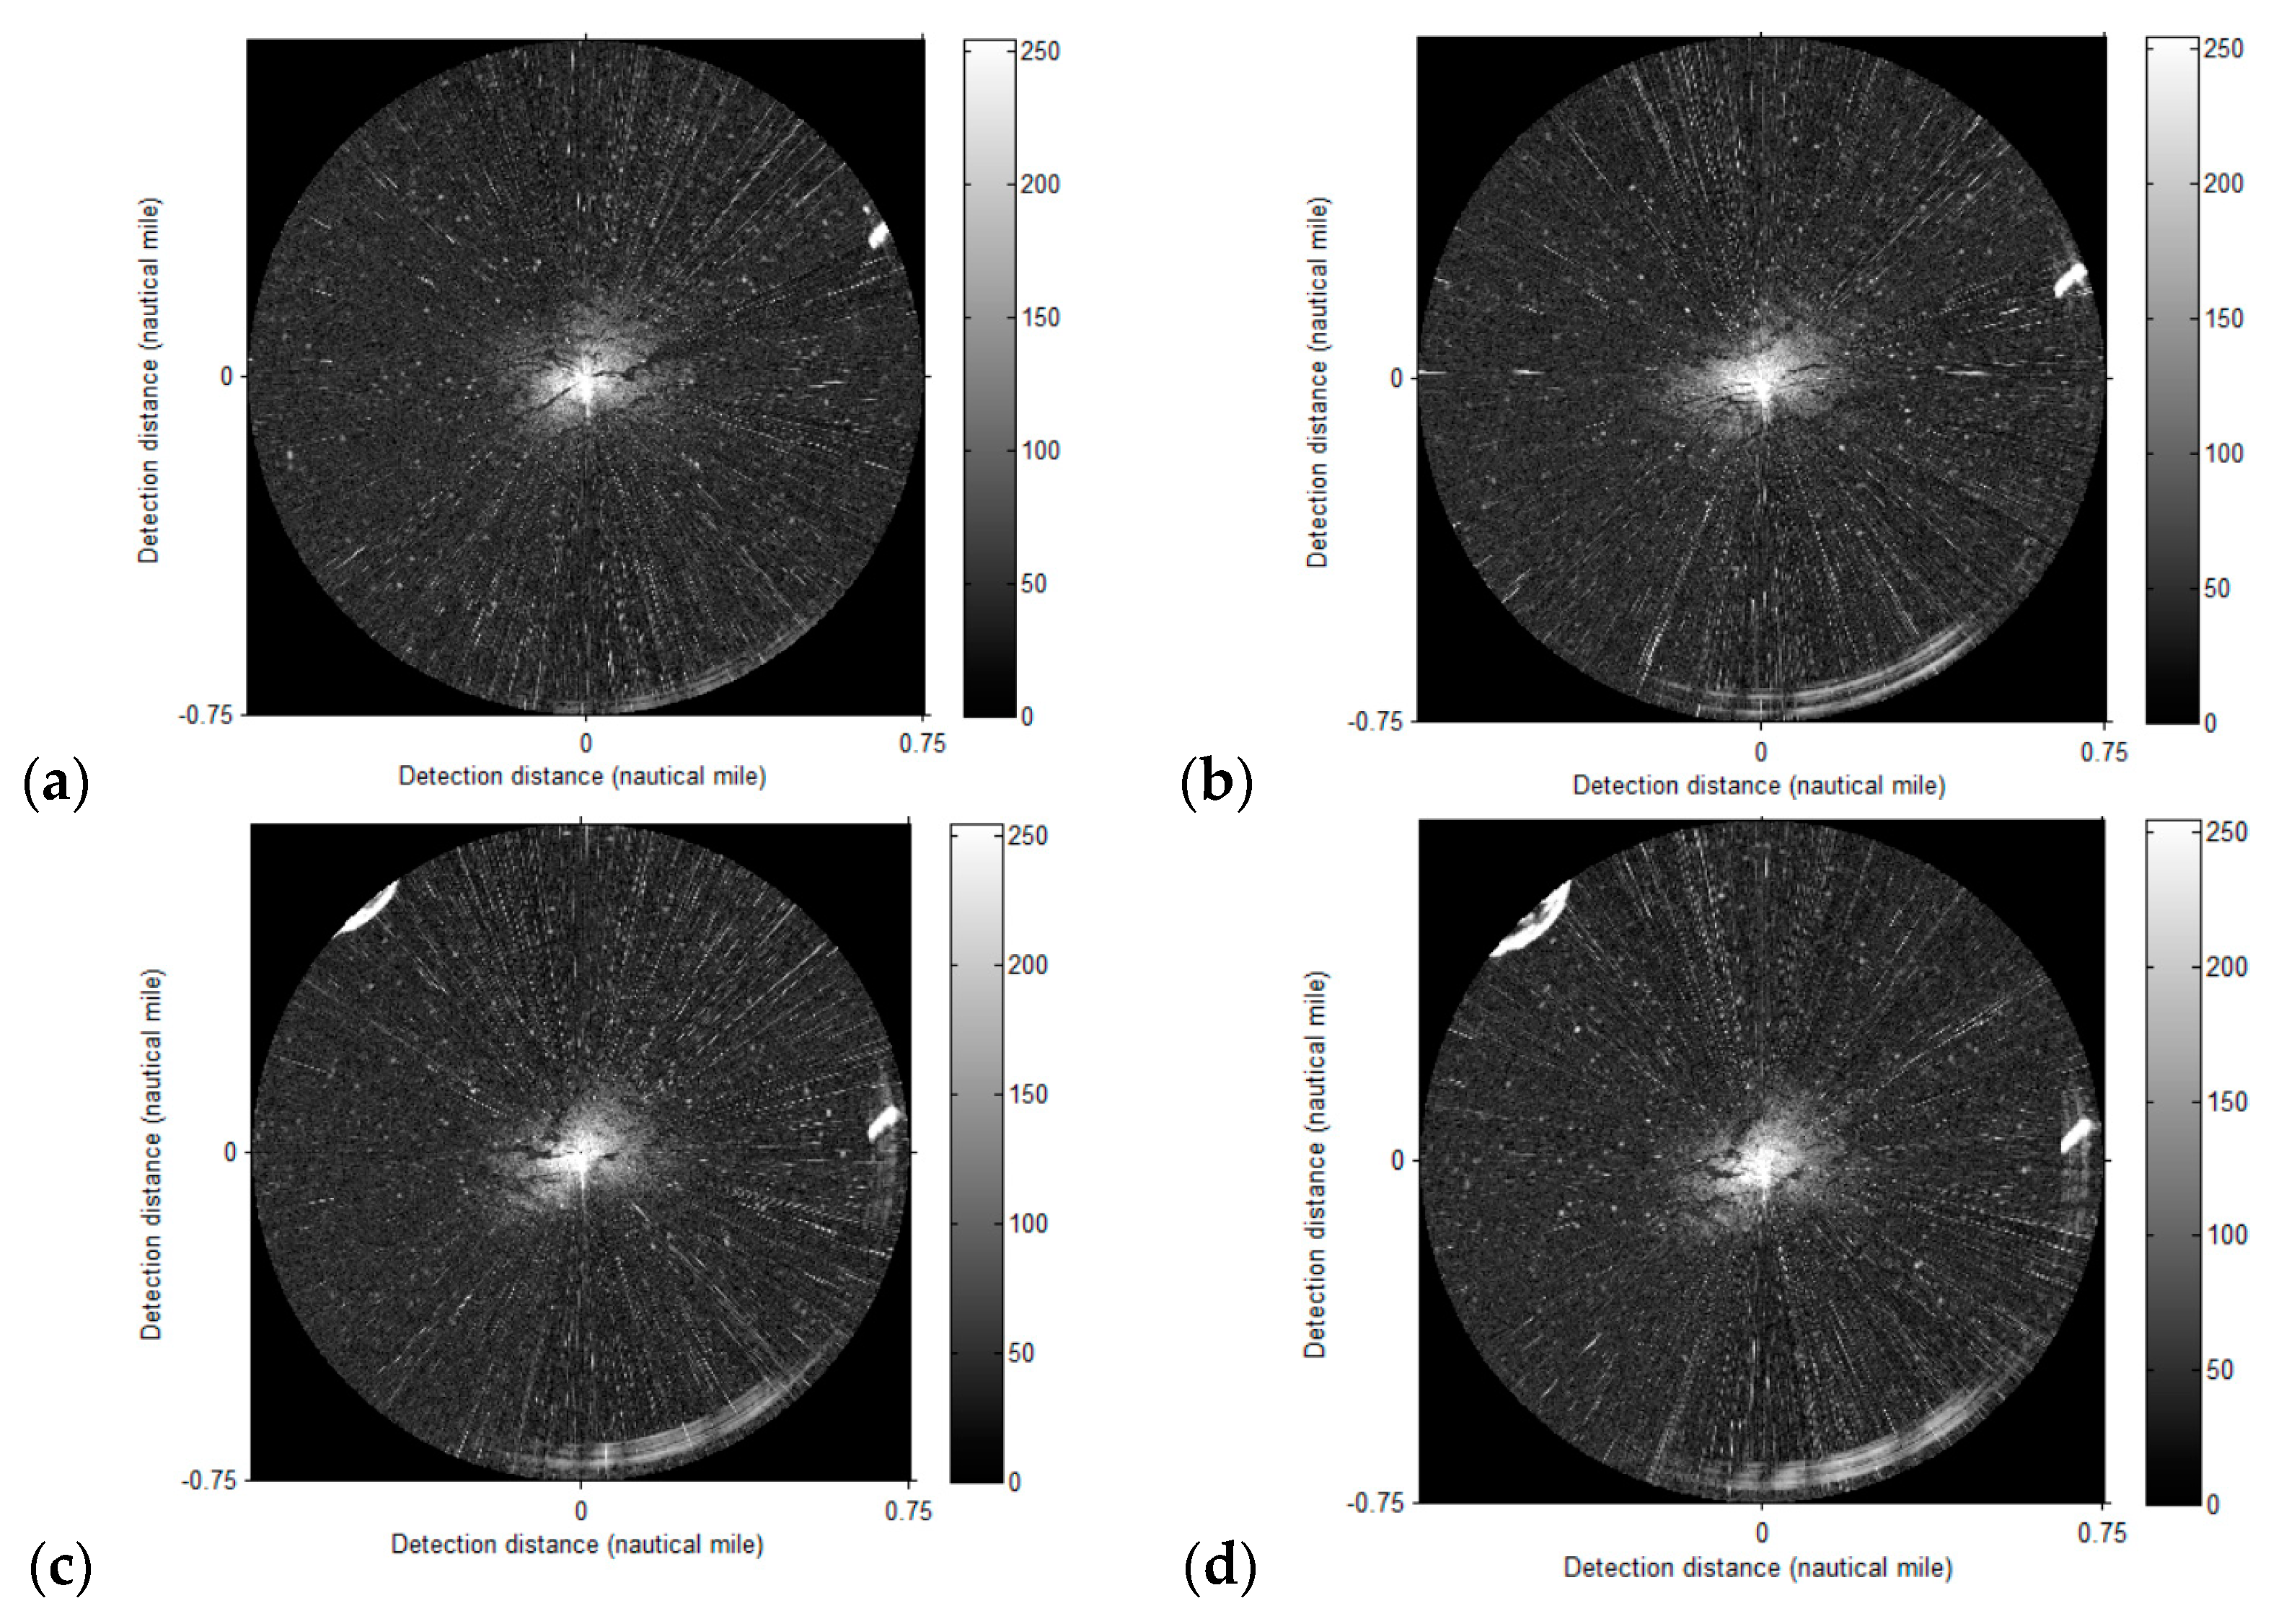
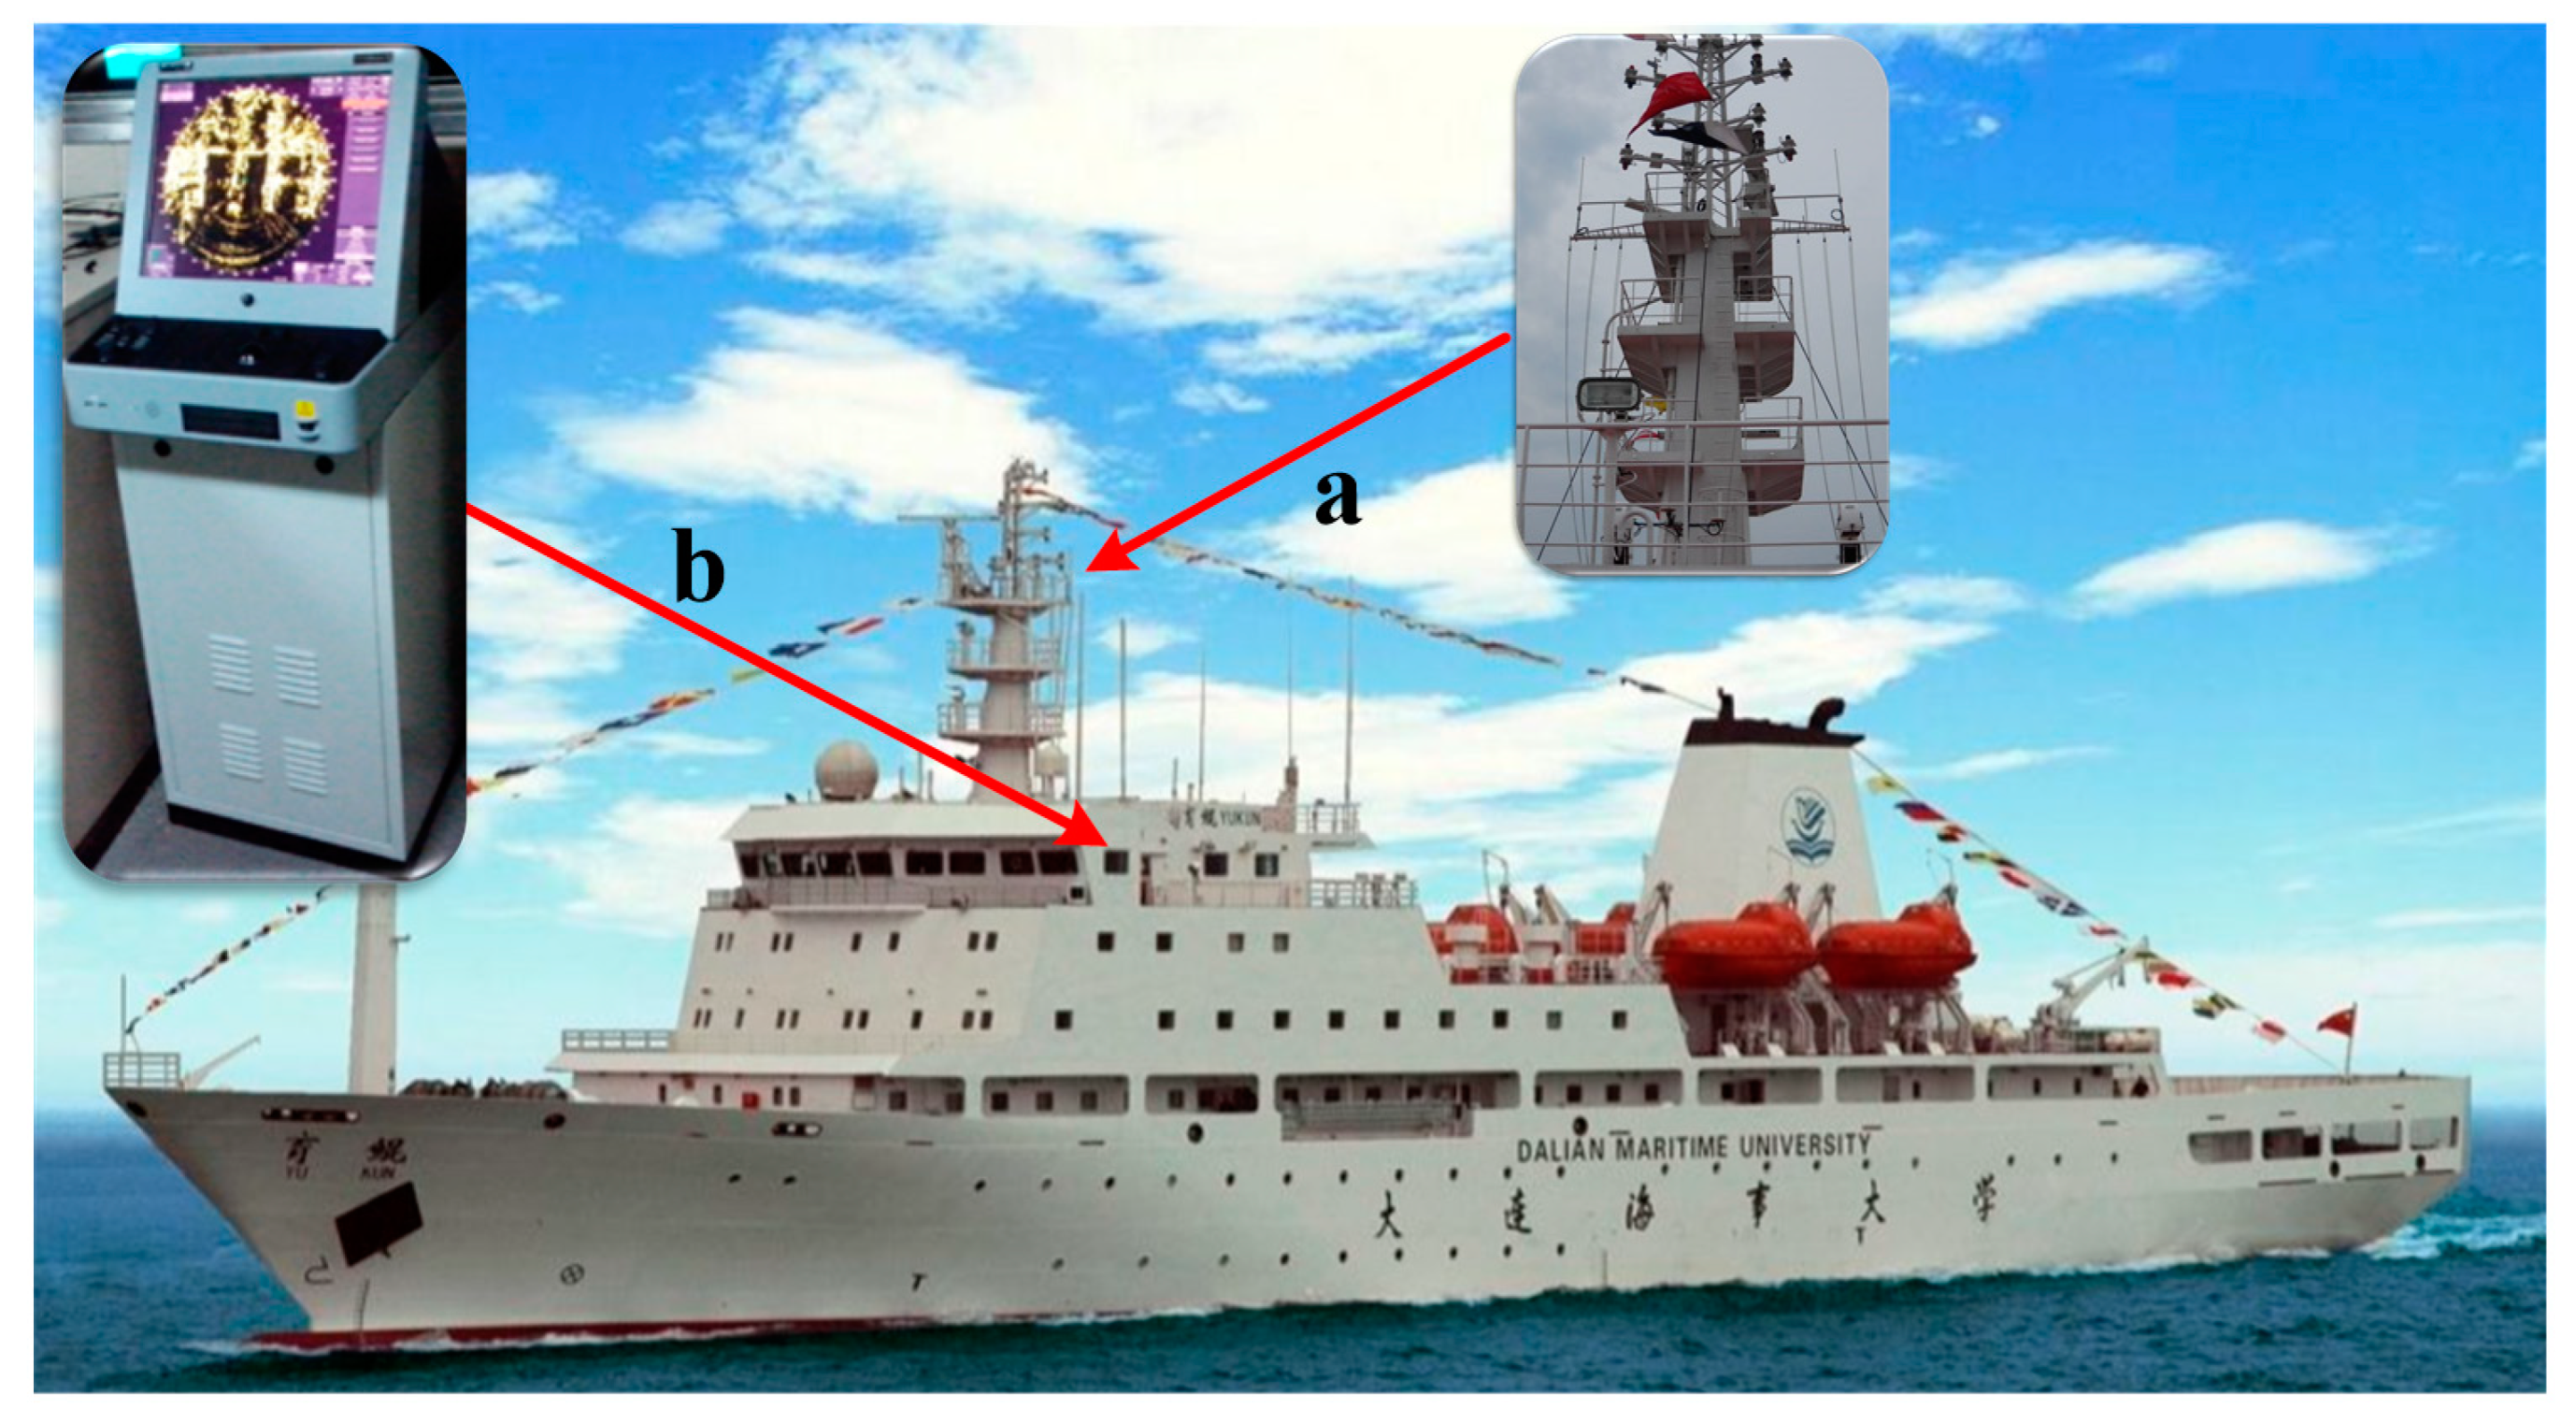
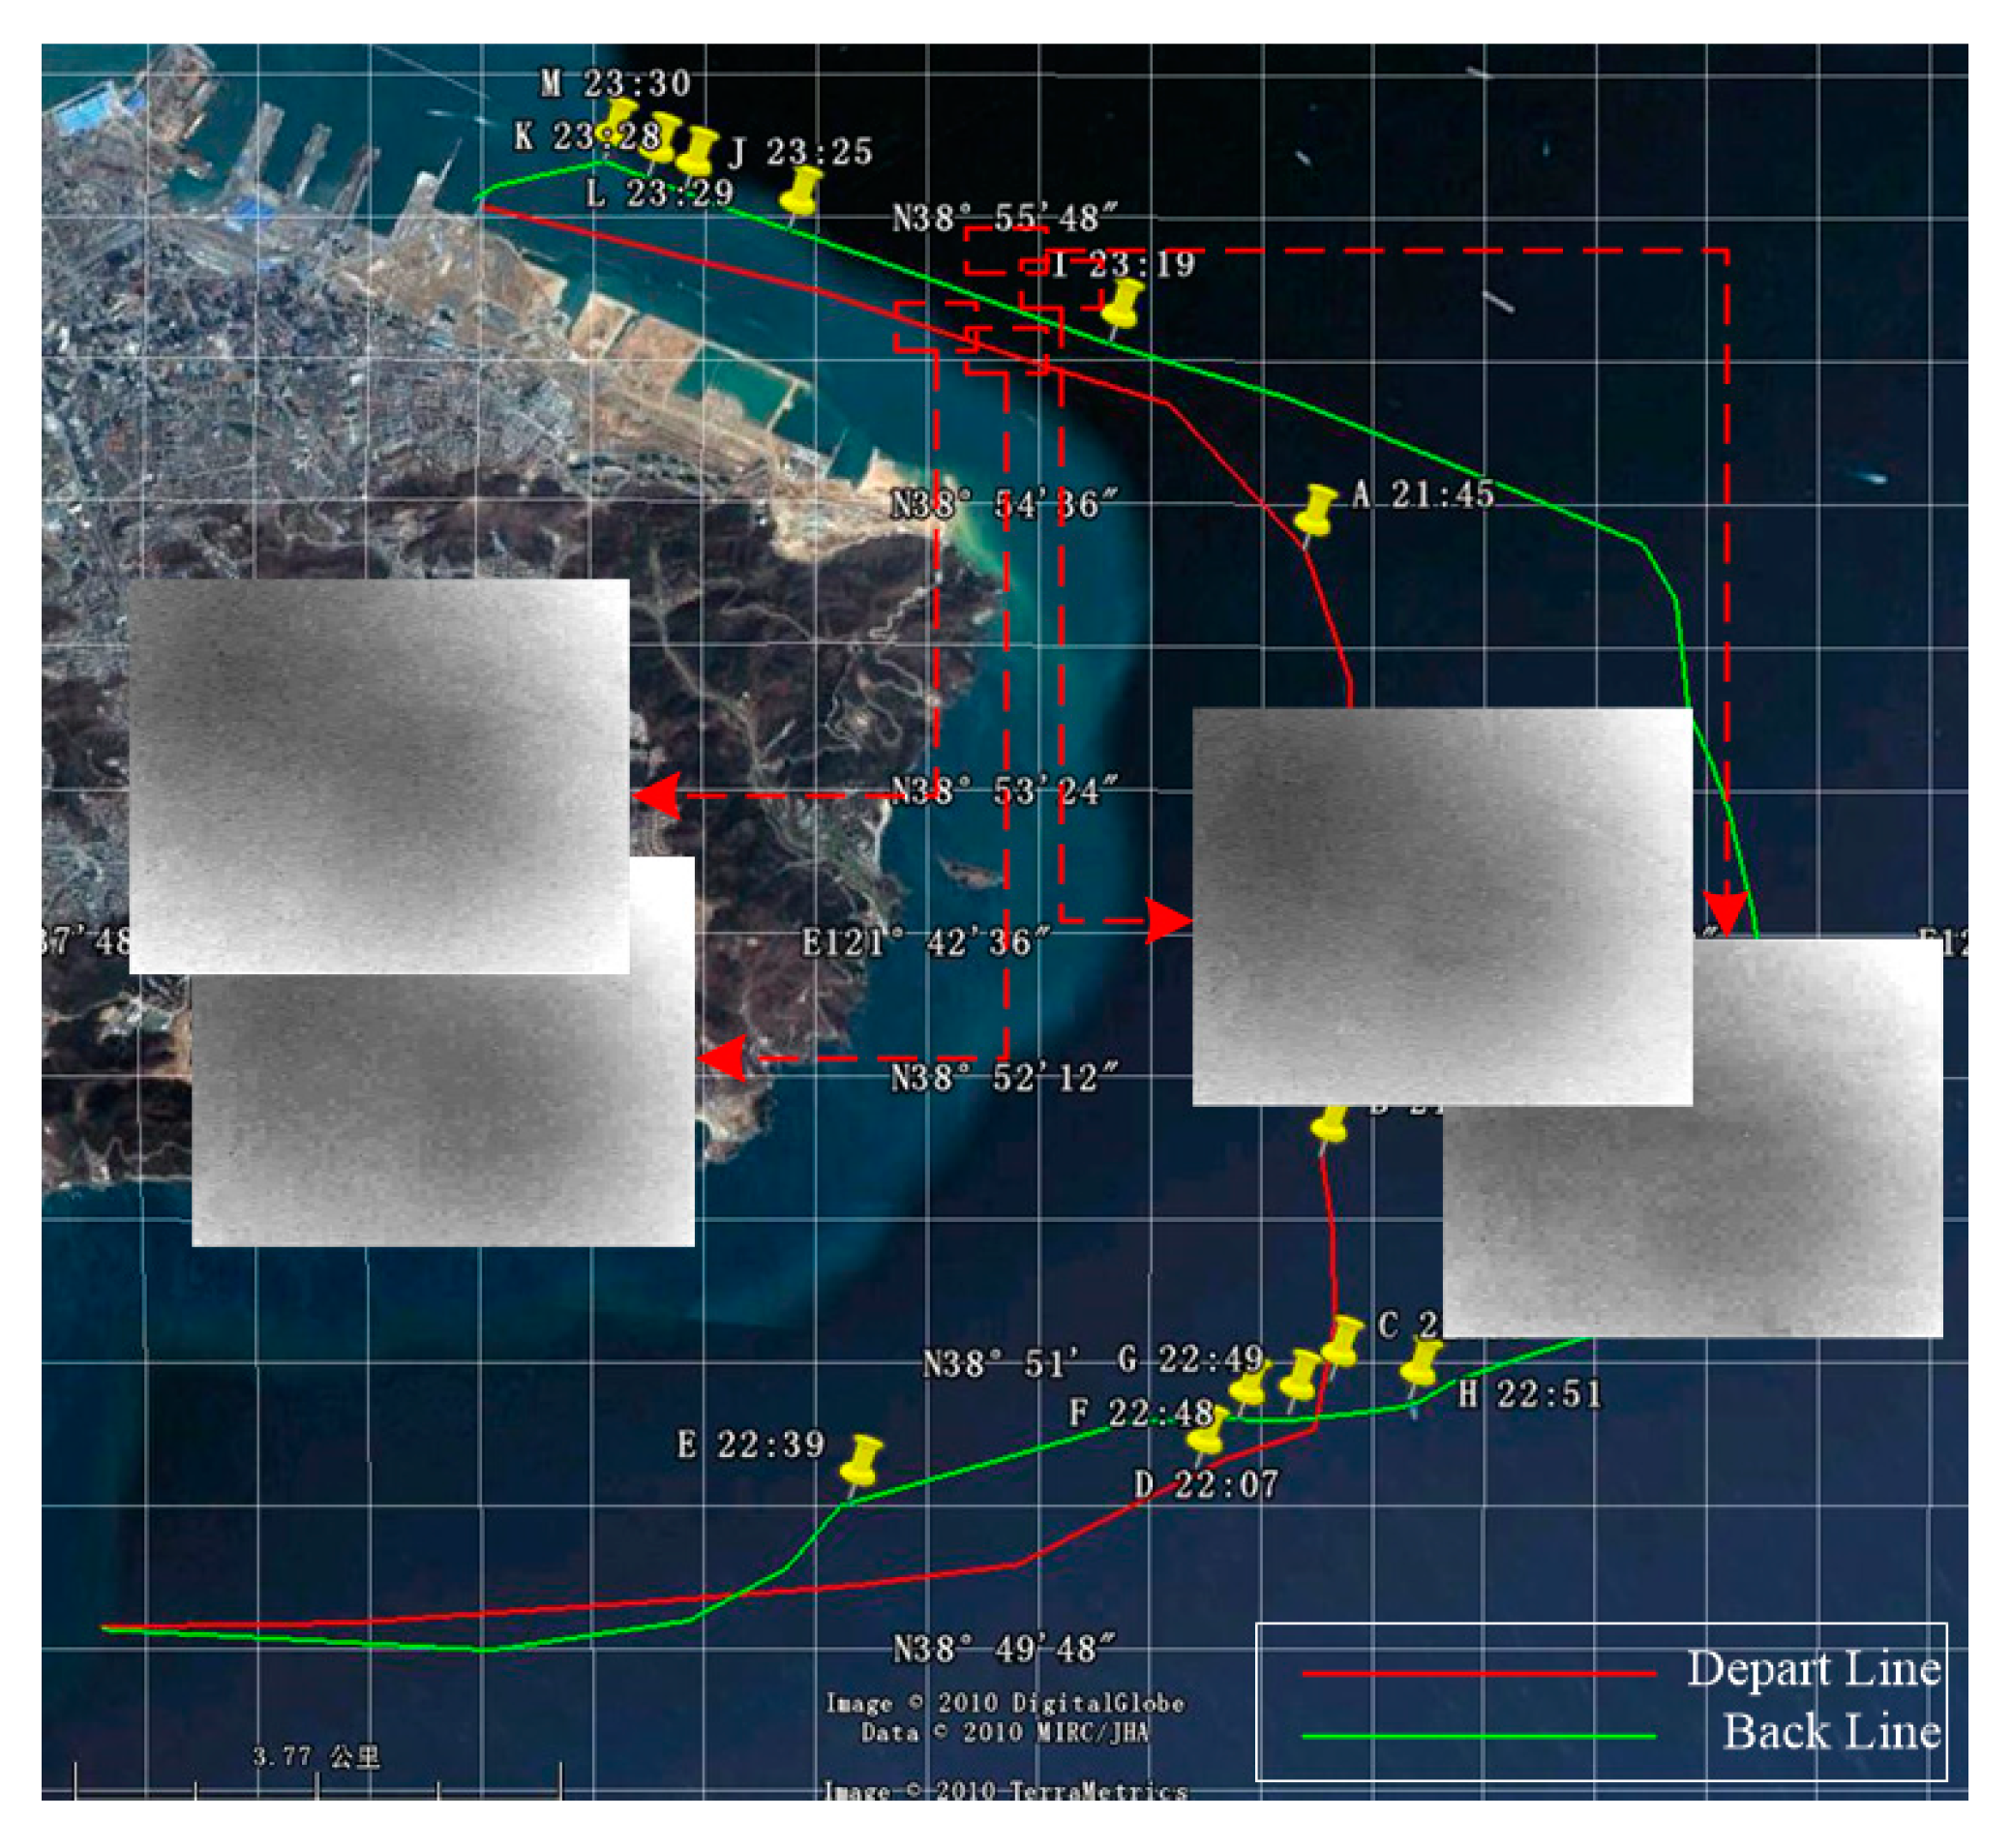
The shipborne radar images (Figure 1) were acquired during a clean-up mission (Figure 2) on 21 July 2010, of the teaching-training ship Yukun (Figure 3) of Dalian Maritime University. The monitoring radius in the image is 0.75 of a nautical mile (NM). The image resolution is 1024×1024 pixels. The image processing and analysis platform is MATLAB 2014a. The parameters of the shipborne radar are shown in Table 1.
2.2. Data Preprocessing
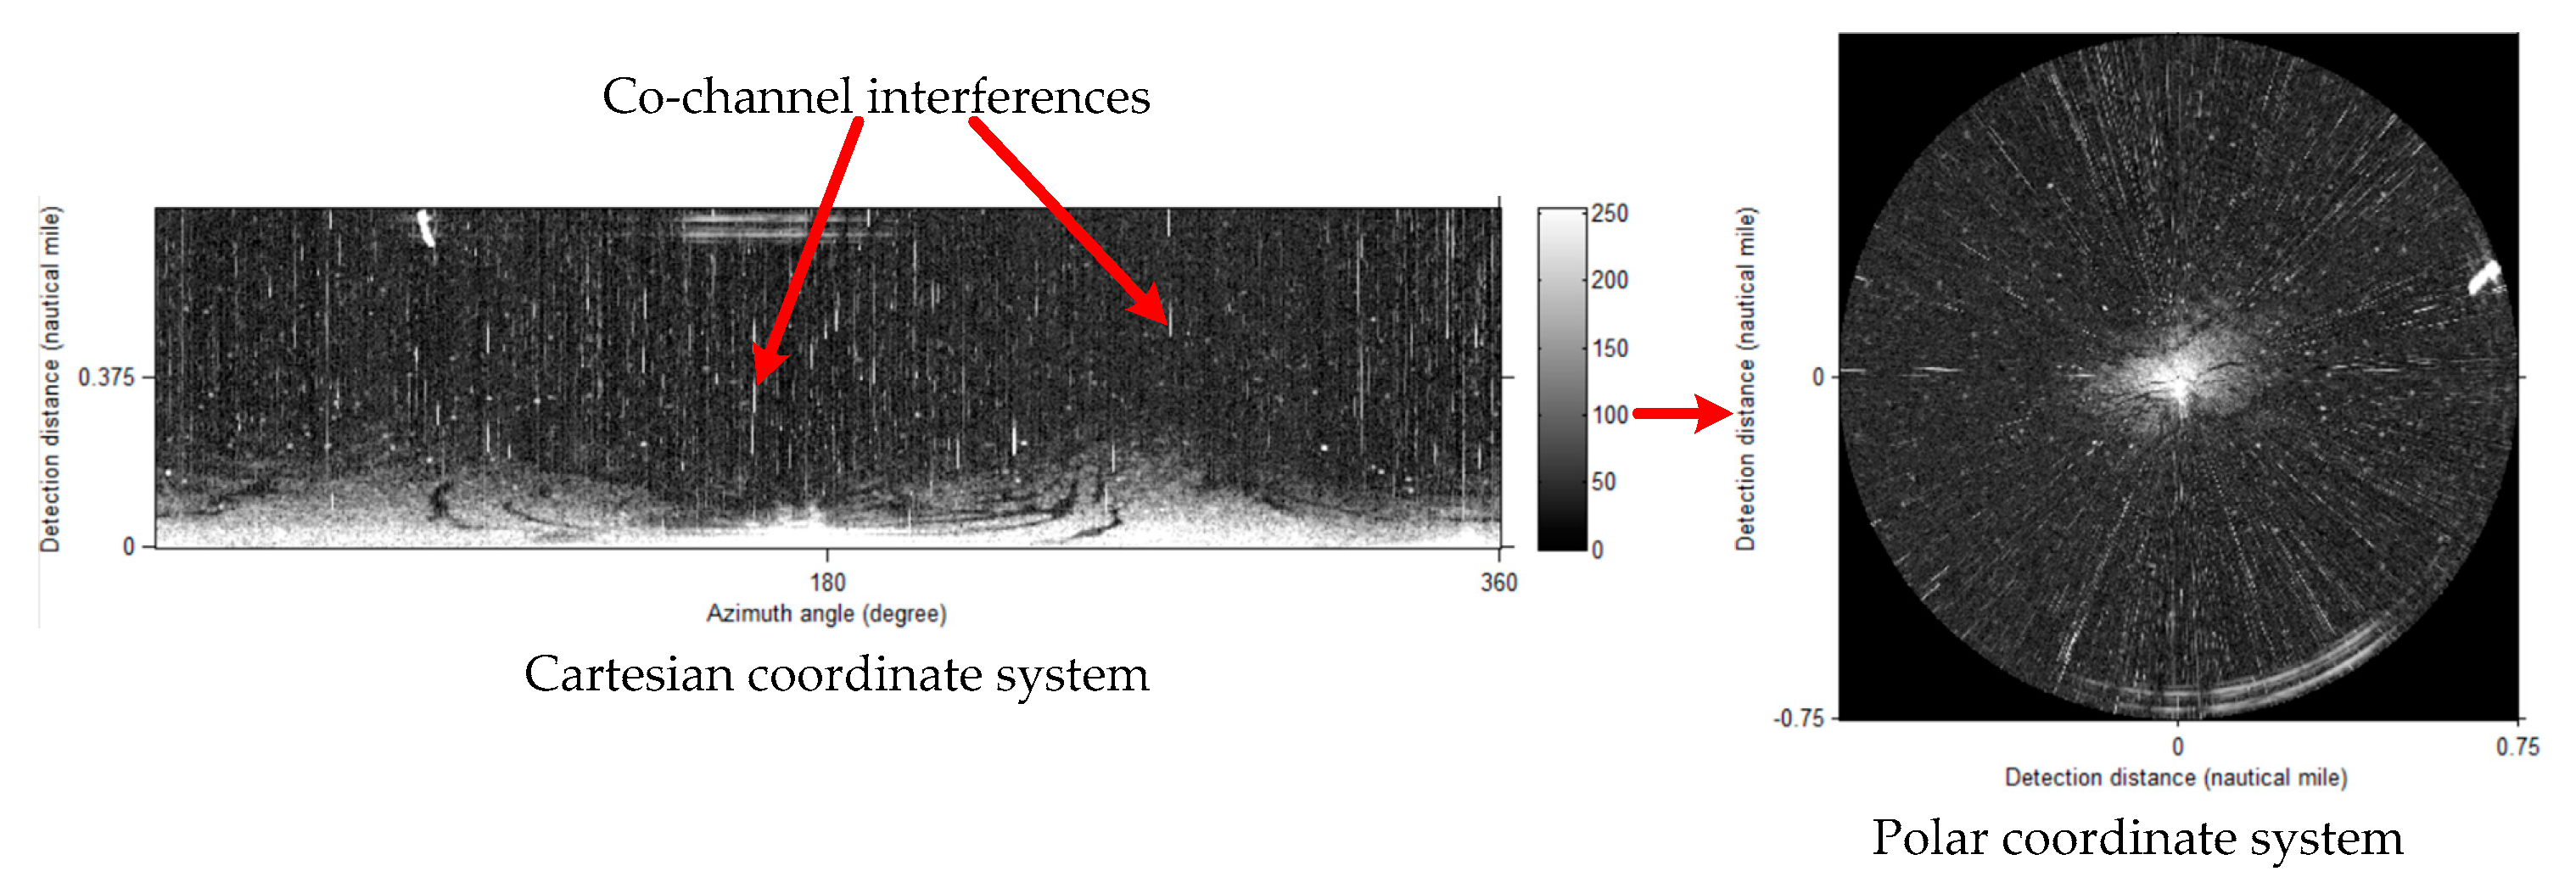
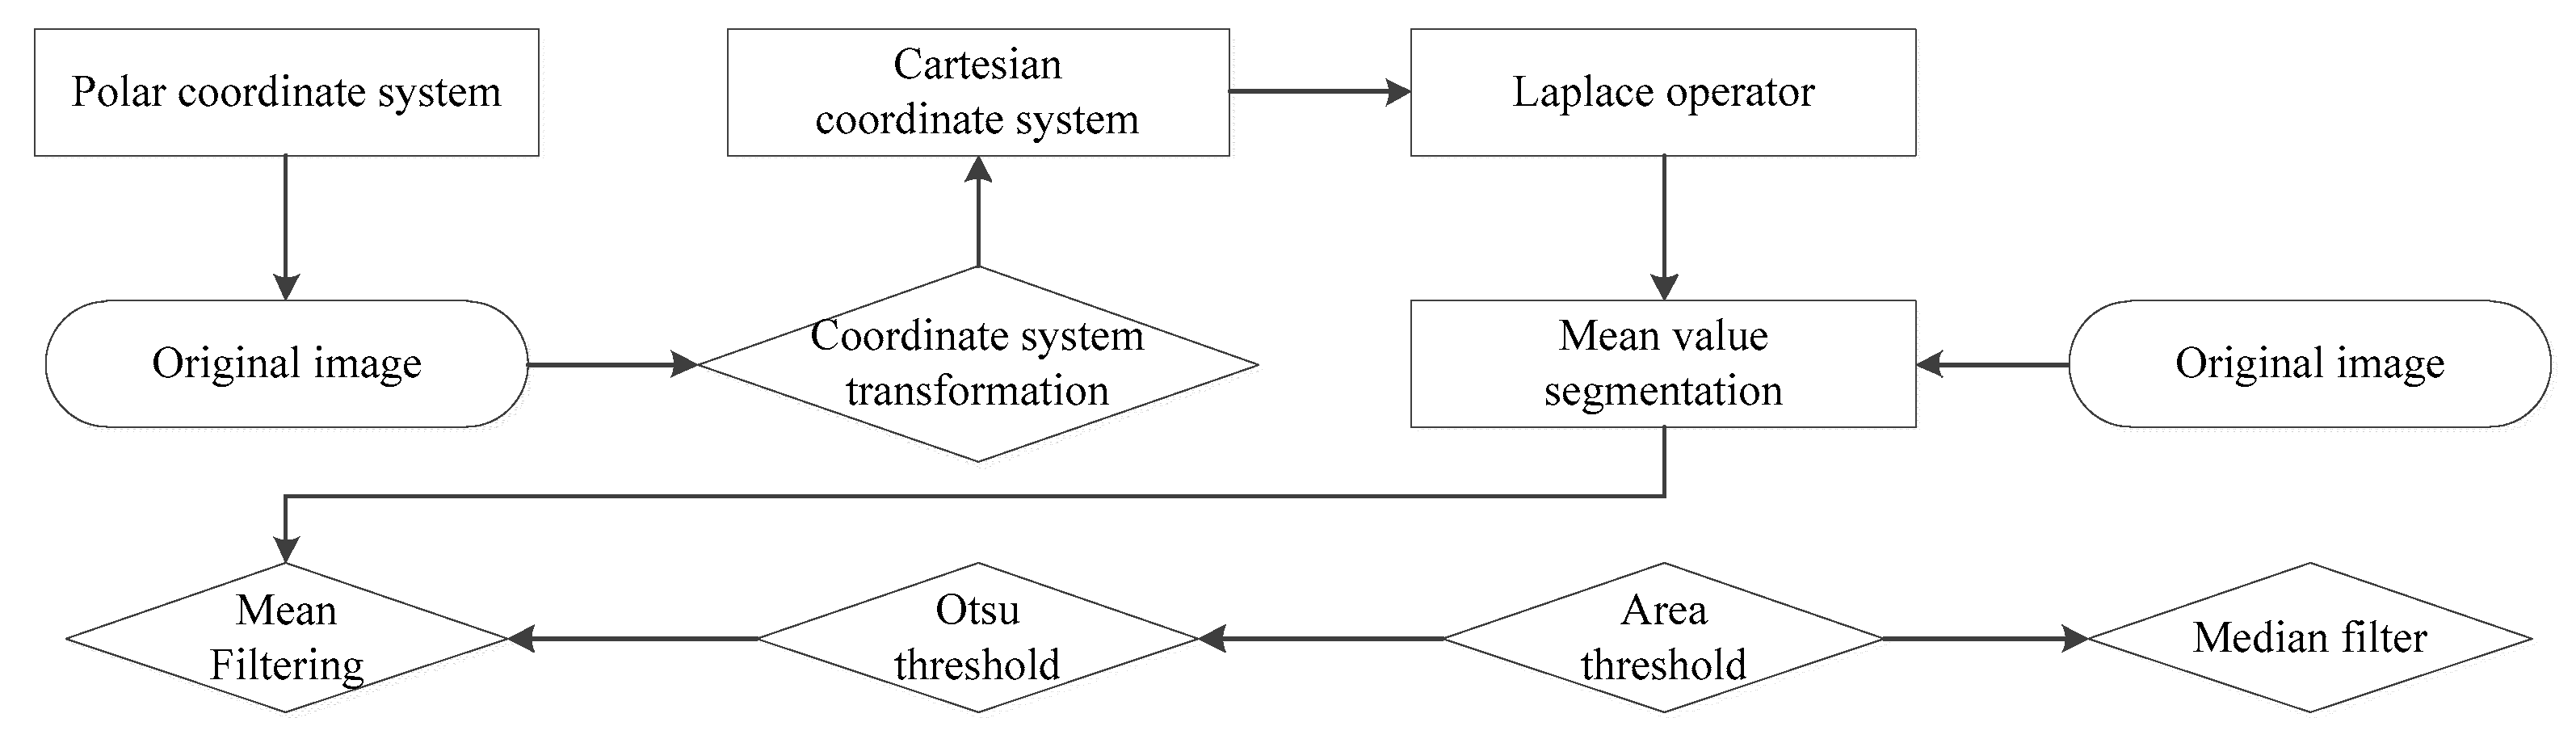
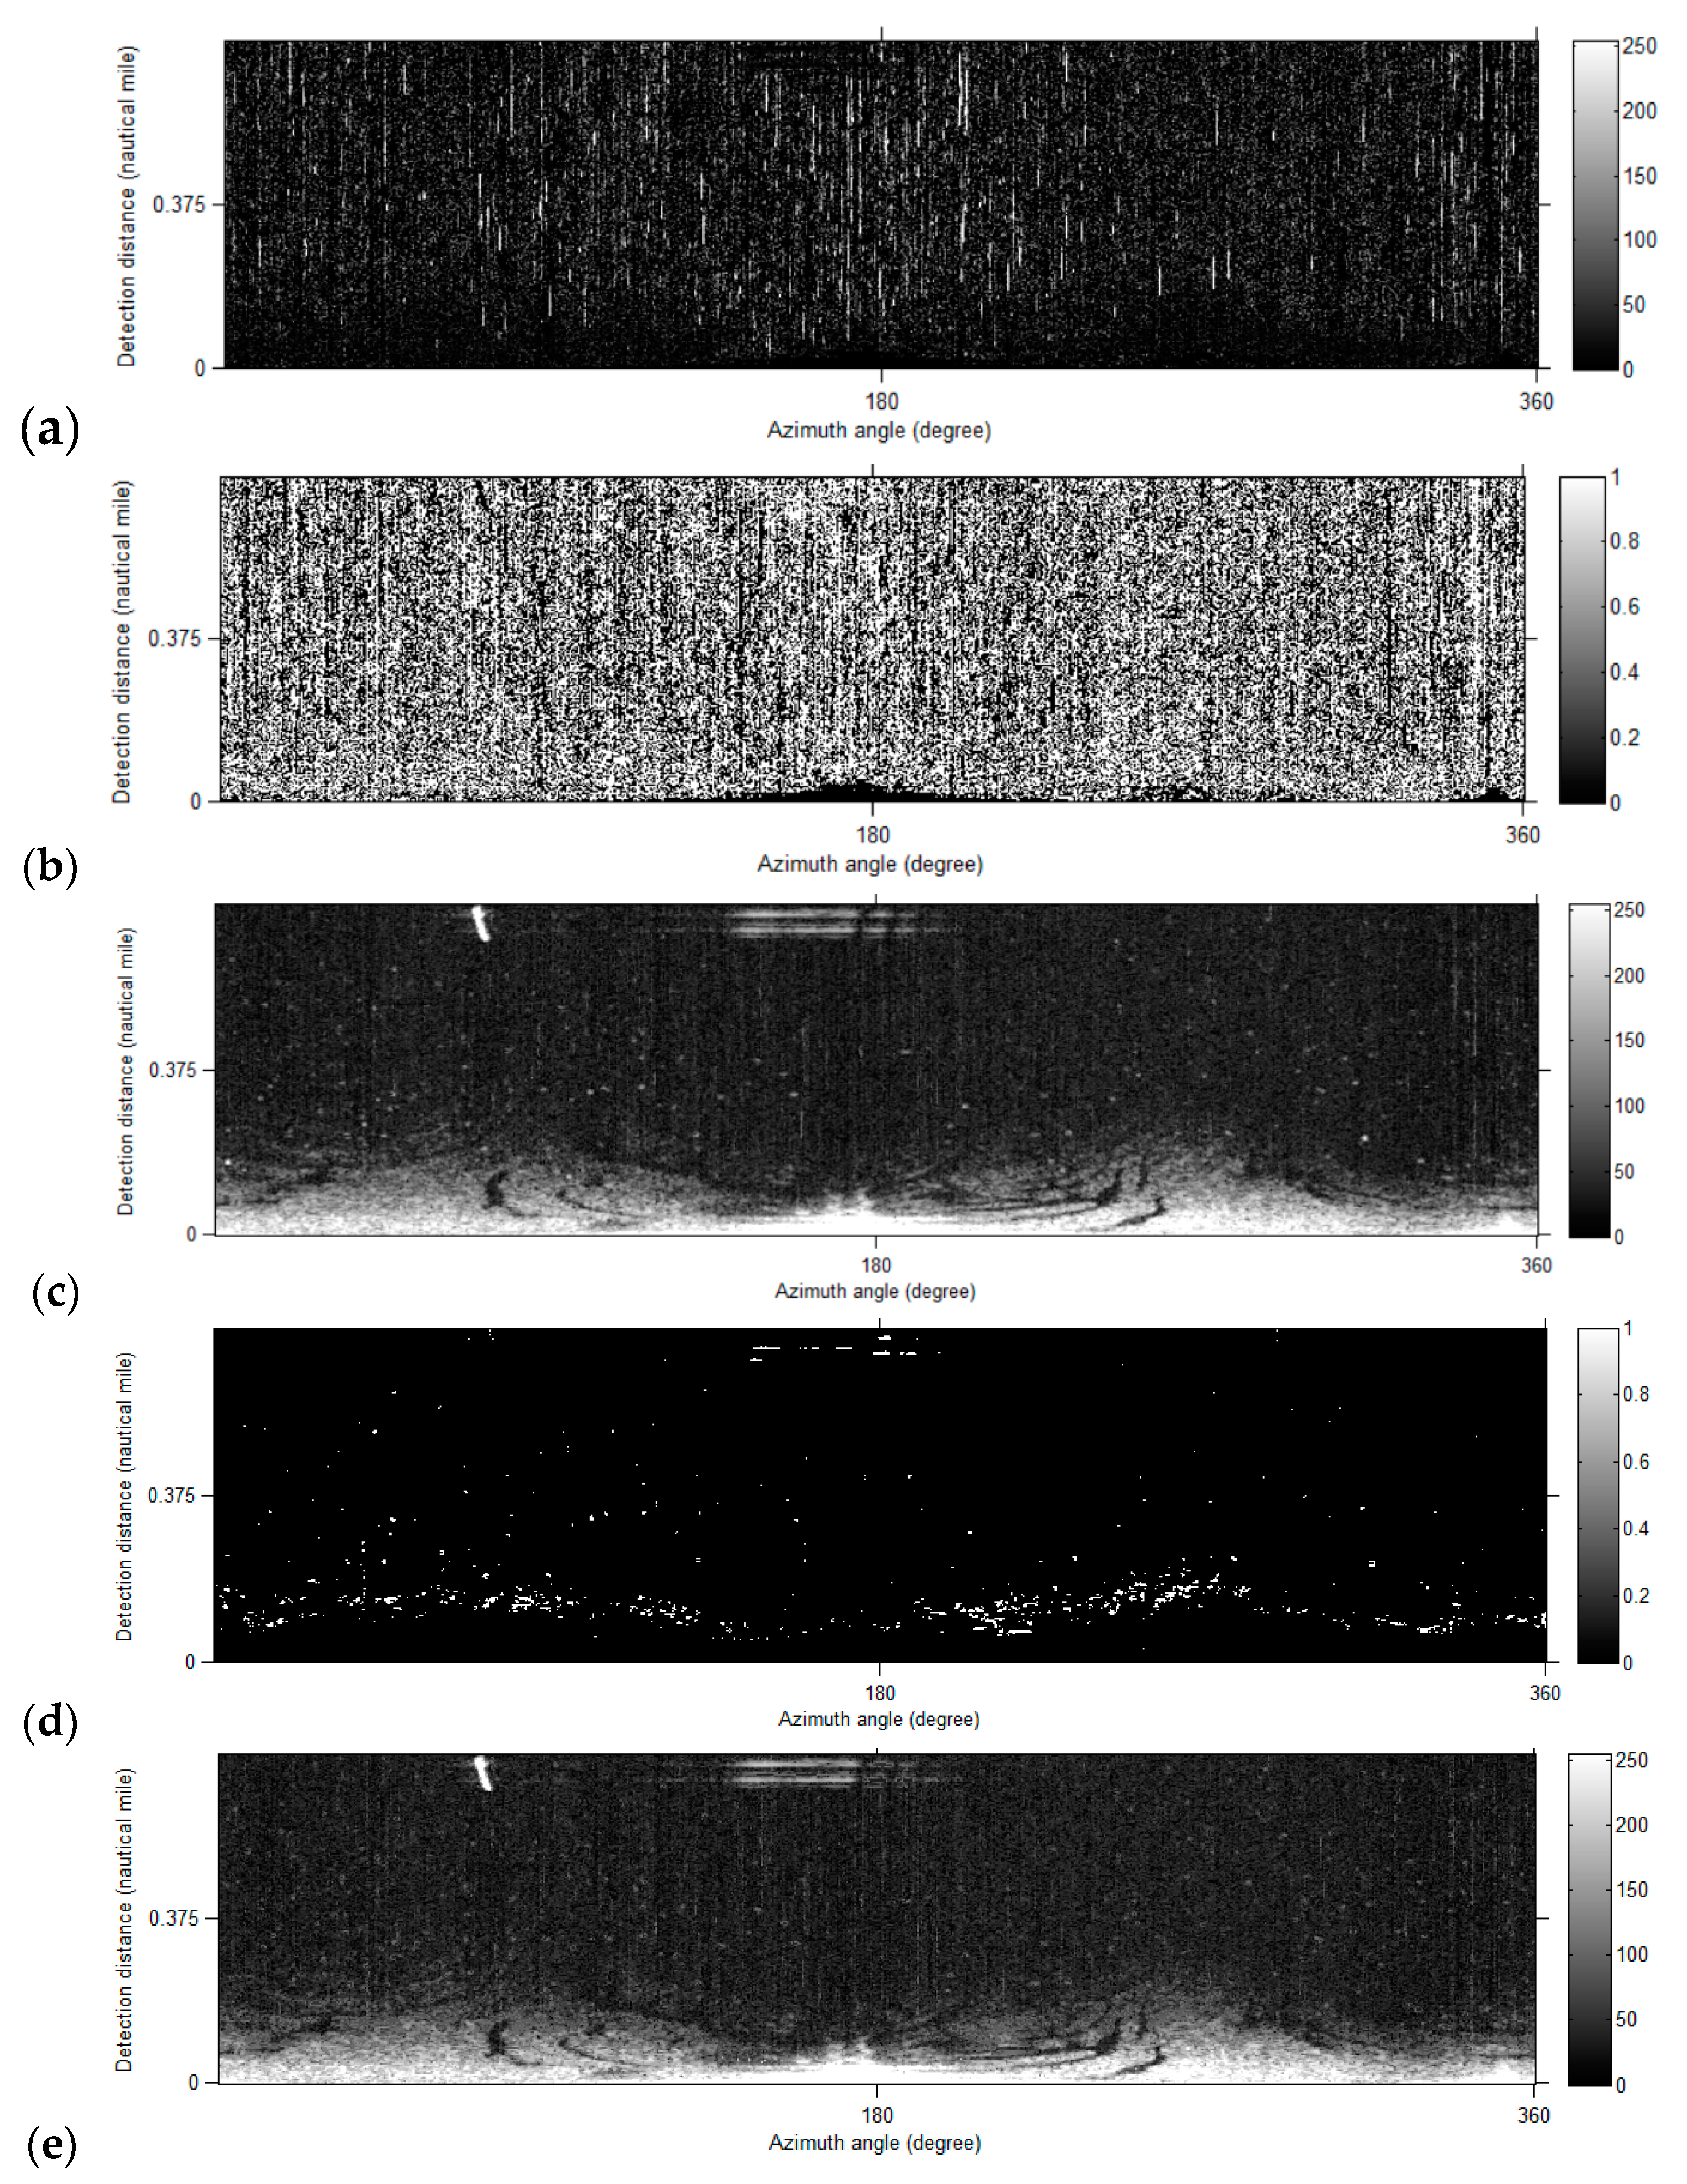
A shipborne radar image was collected in the Cartesian coordinate system and then transformed into the polar coordinate system. The morphological features of targets are easier to recognize in the Cartesian coordinates system. For example, the co-frequency interferences caused by the radars of other ships show high-bright linear noise in a vertical direction (Figure 4), and therefore, we first transformed the image back to the Cartesian coordinate system with the azimuth as the horizontal axis and the detection distance as the longitudinal axis. The flow of data preprocessing is shown in Figure 5. Firstly, the Laplace operator of Equation (1) was used to enhance the gray value of the highlighted pixels (Figure 6a). The image was then segmented according to the mean value (Figure 6b). The corresponding highlighted pixels in the original image were smoothed by a linear mean filter (Figure 6c). The isolated targets were extracted by the Otsu [38] threshold and the area threshold Tarea (Figure 6d), and then removed with a median filter (Figure 6e). The window of the median filter must be larger than Tarea.
2.3. Methods
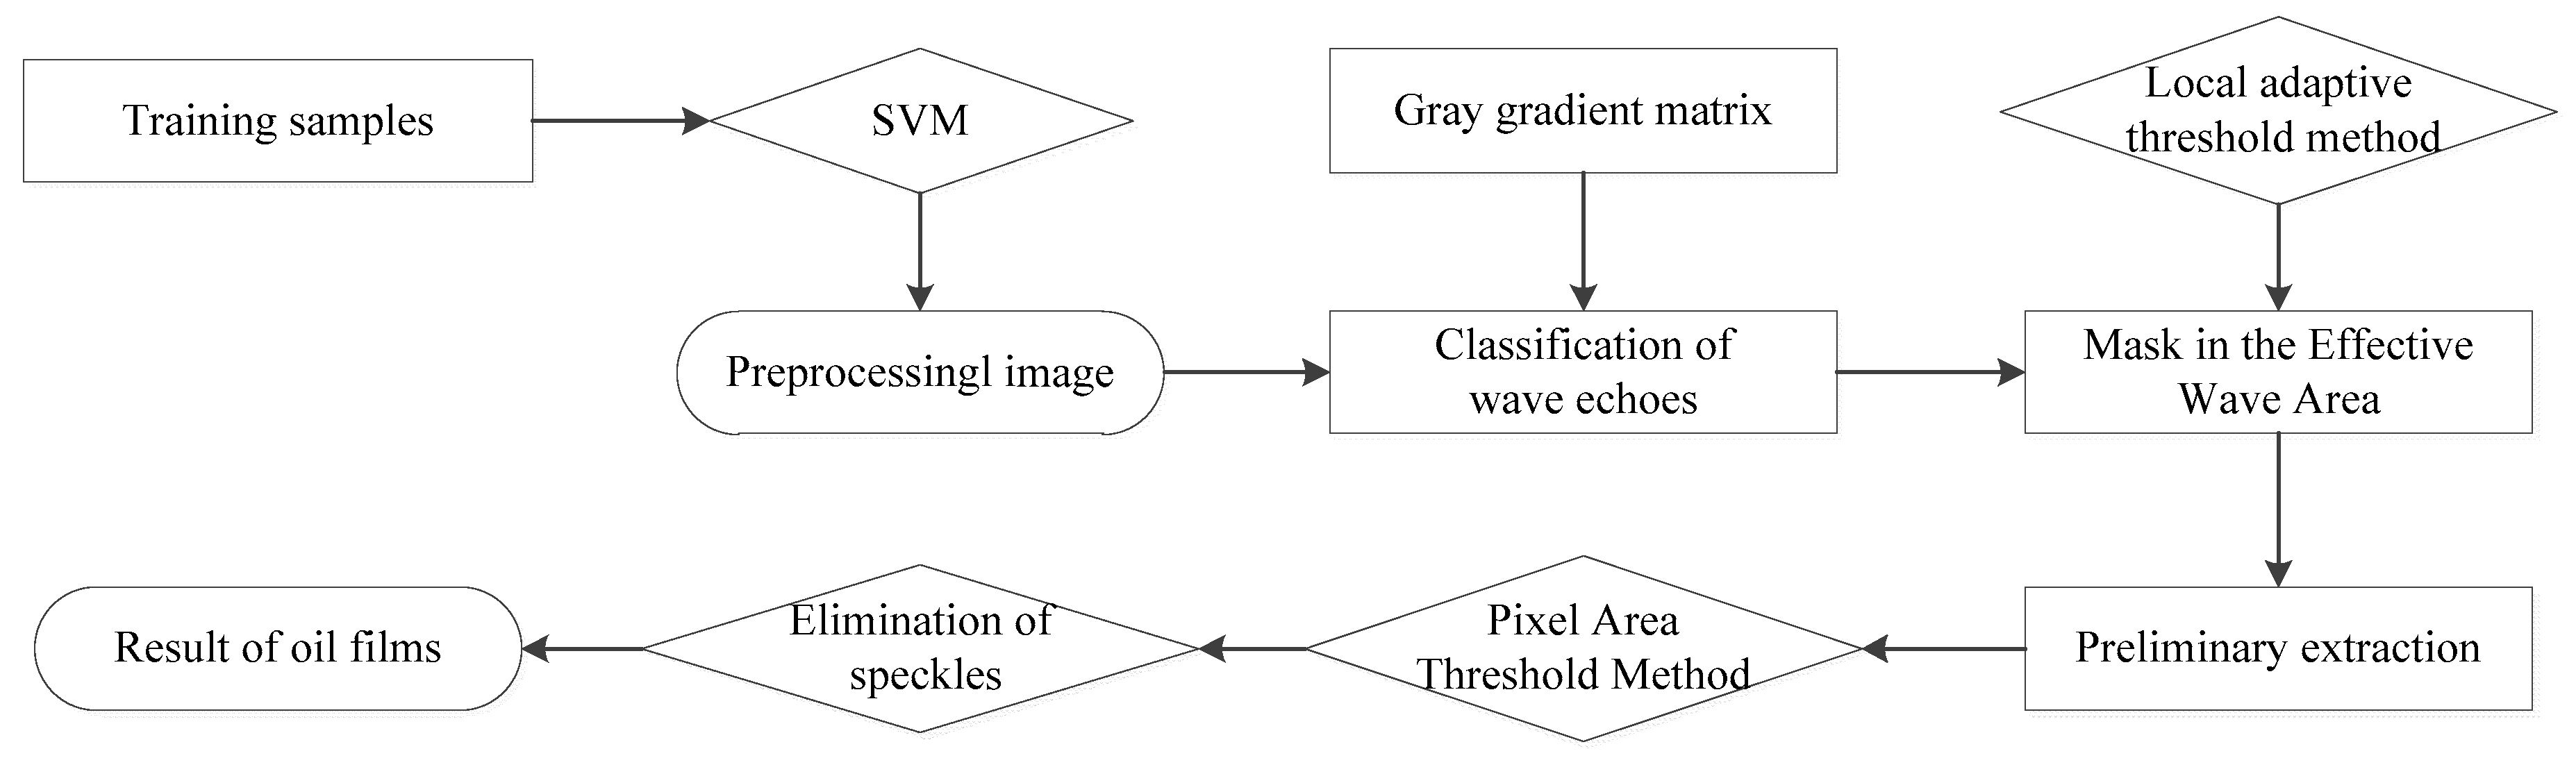
The flow of oil film classification is shown in Figure 7. The effective echo pixels were extracted from the preprocessed image using the SVM [39] classification method. Mean filtering was then applied to the effective wave echo image to generate the gray gradient matrix, and the mask of the effective wave area was generated accordingly. Next, the local adaptive threshold was used to preliminarily extract the oil films in the mask. Finally, the final oil film results were obtained by the pixel area threshold method.
2.3.1. SVM
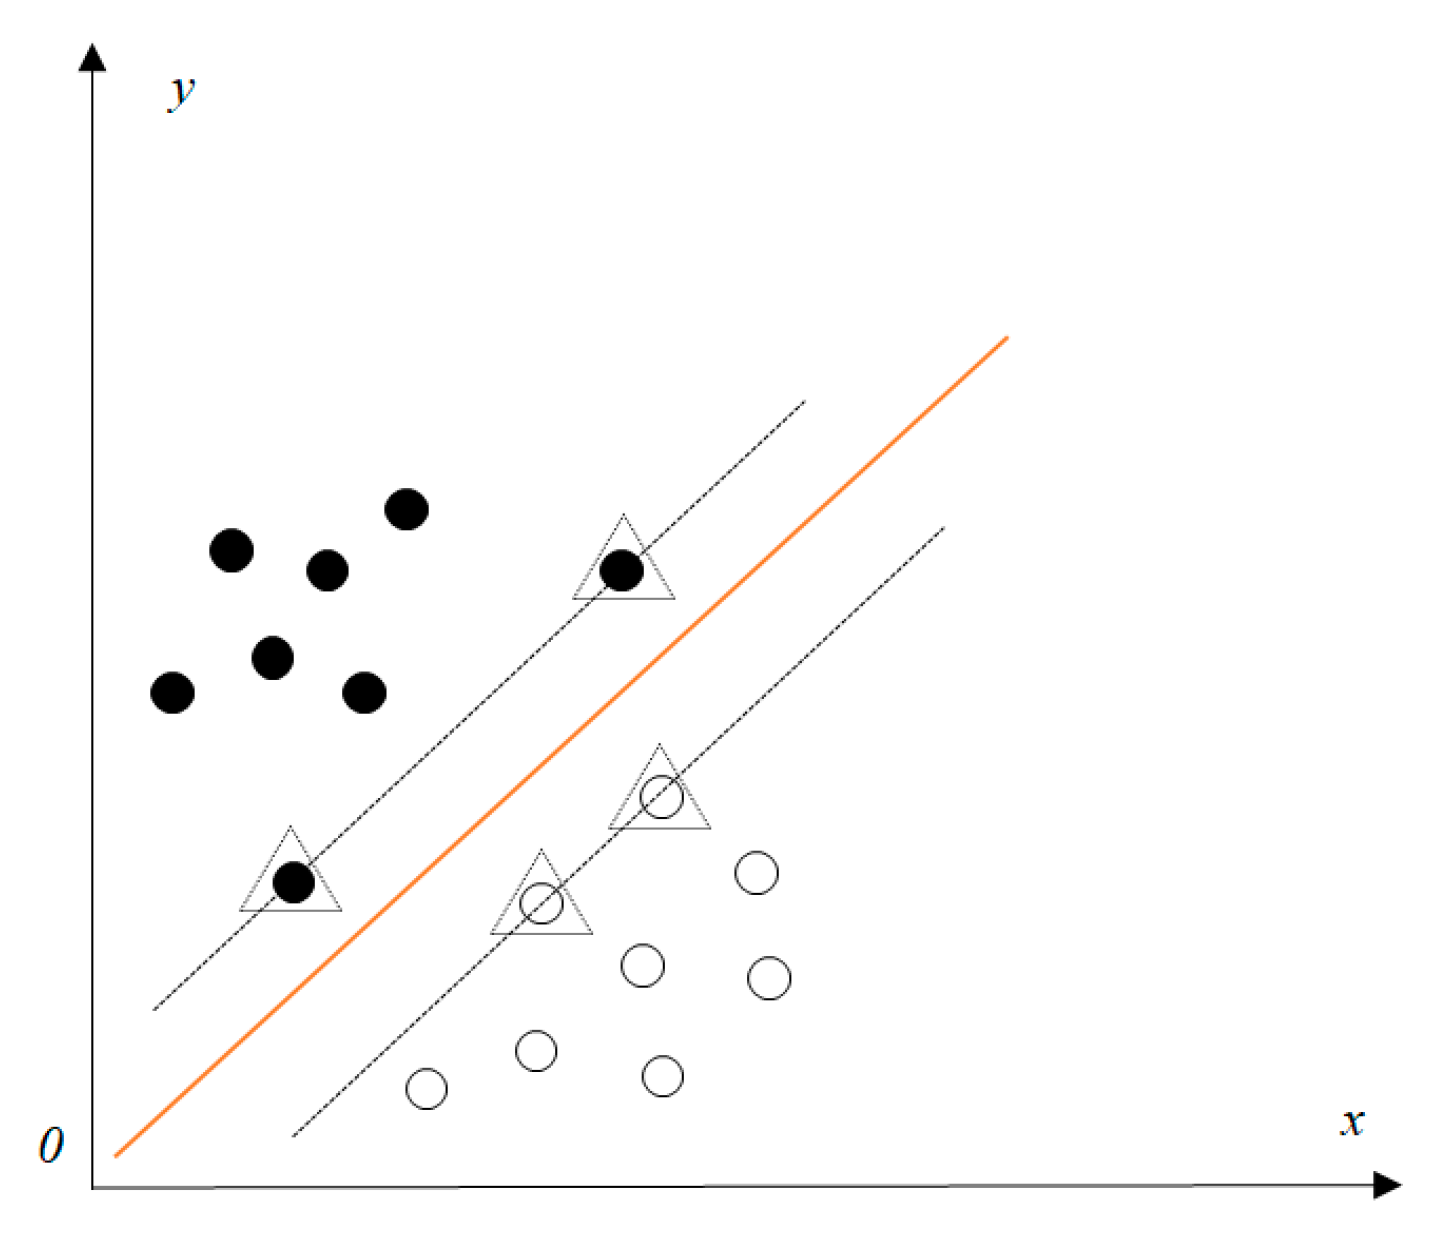
Support vector machine (SVM) is a type of generalized linear classifier for binary classification by supervised learning, and has been widely used for remote sensing [37,40] and computer graphics [41,42]. It can find an optimal hyperplane in the feature space and divide the data into two categories (Figure 8).
Matkan et al. confirmed the oil spill detection potential of Full Polar L-band SAR images based on SVM [43]. Zhang et al. successfully used the SVM method to carry out oil spill classification in Fully Polarimetric SAR images, and achieved a better performance than with an artificial neural network (ANN) and maximum likelihood classification (ML) [44]. Liu et al. attempted to use the SVM method to screen the approximate position of oil films in the wave area of shipborne radar images, and achieved good results [37]. In view of their work, we used the SVM method to classify the waves of shipborne radar, and placed SVM in the first step of oil film recognition.
Sixty-eight images with oil films, in the same cruise and sea conditions, were selected as training samples to distinguish the effective wave echo pixels from those that were invalid. Four wave pixels and background pixels with a 5×5 window were selected as the training samples. The mean gray value of each window was taken as the sample value to classify the pre-processed images as (Figure 9).
2.3.2. Gray Distribution Matrix
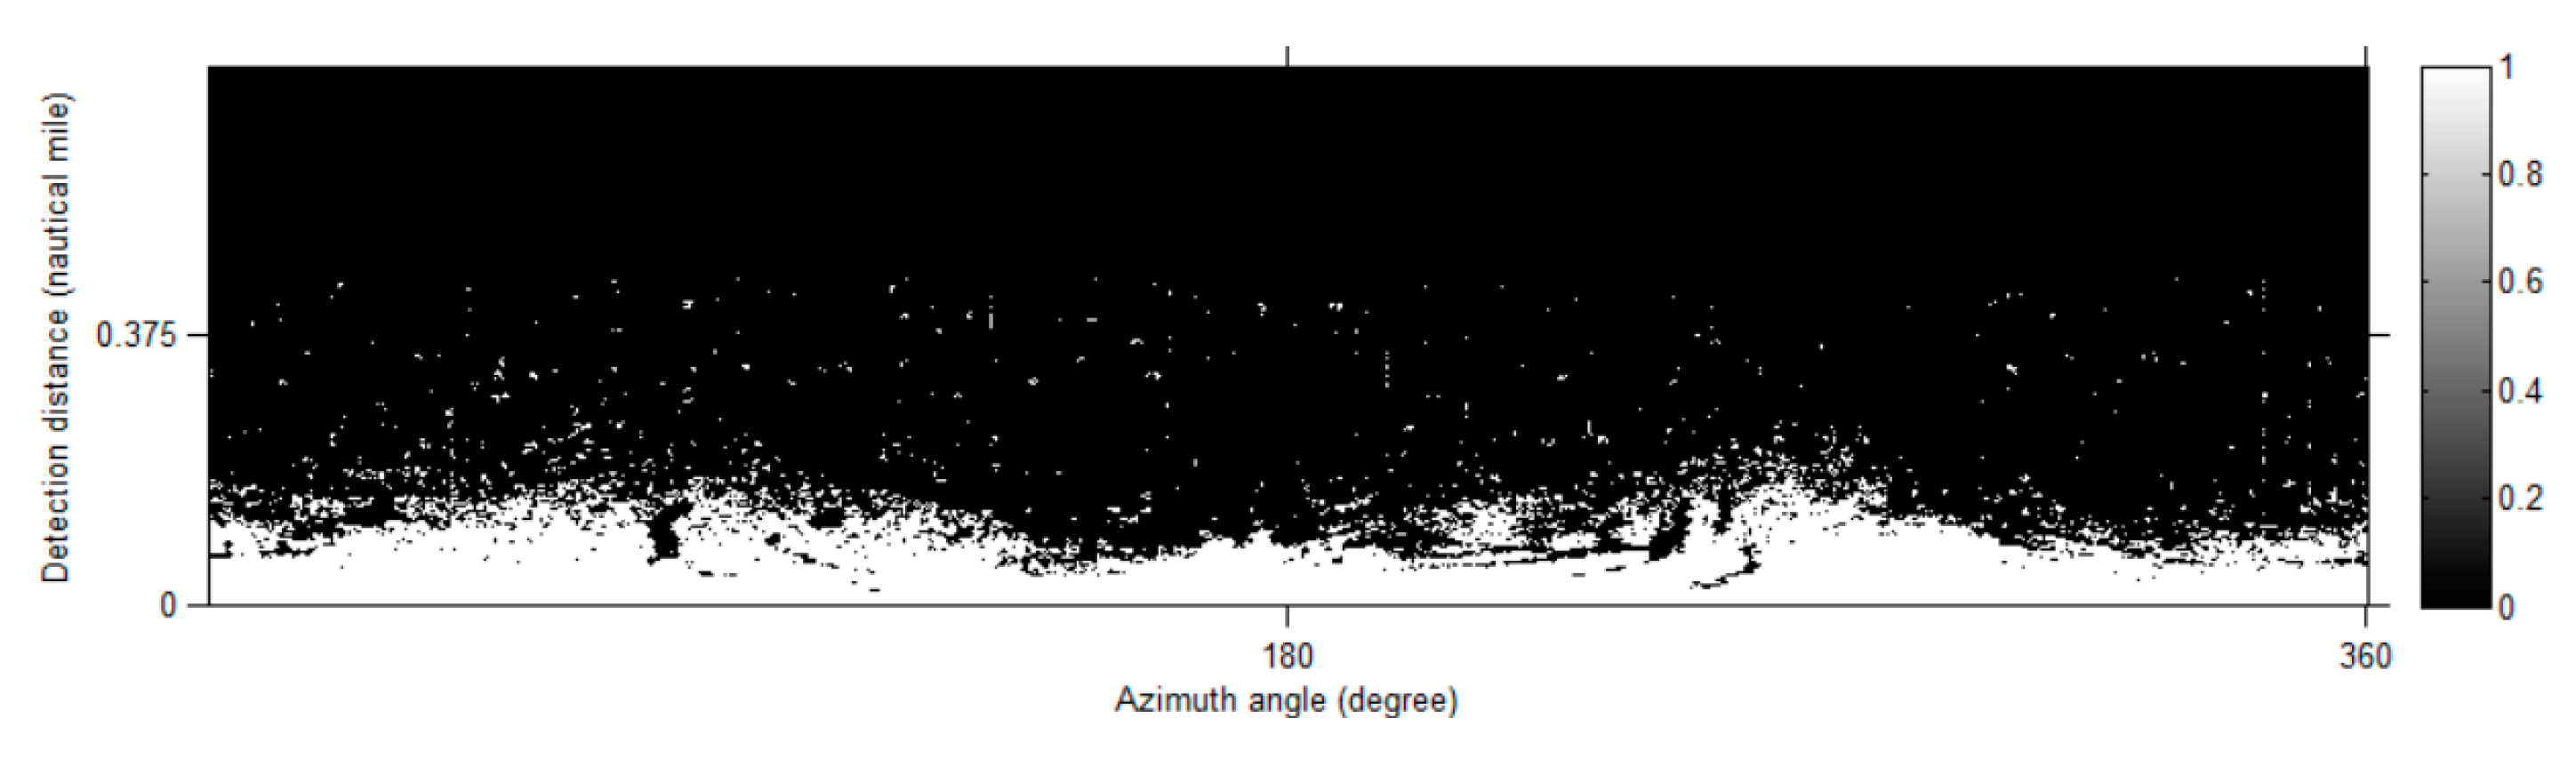
The effective monitoring range of ocean waves is limited in radar images, and so, the echo signals of ocean waves in farther regions are few or even none. It is therefore necessary to first determine the effective monitoring range of waves. The image was filtered by means of a window of 20×160, and a gray distribution matrix was generated (Figure 10a). According to the threshold of gray intensity, the mask of the effective range of the ocean wave was established in Figure 10b. The final pre-analyzed image area is shown in Figure 10c.
2.3.3. Local Adaptive Thresholding
Niblack [45] proposed a local thresholding method for digital image segmentation, as follows:
where m is the local mean, s is the local standard deviation, and k is a user-defined parameter, which takes negative values. Sauvola and Pietikäinen [46] modified the method to realize adaptive document image binarization, as follows:
where R is the dynamic range of standard deviation, and parameter k attains positive values.
In their experiments, Sauvola and Pietikäinen used R = 128 and k = 0.5 to obtain good results with eight-bit gray level images. Xu et al. [36] improved their method to segment the thin oil films, as follows:
where v is the local standard deviation. In their experiments, R = 128 and k = 0.25 are ideal values. Using this setting, we set the local window to 64×16 to analyze the wave area in Figure 11a. The speckles and wake disturbances were then removed in Figure 11b.
3. Results and Discussion
3.1. Results
3.2. Warning with GIS
In the case of a practical application, it is necessary to publish the data monitored by radar combined with an electronic chart. Using the ArcGIS Engine, the steps of merging the data of shipborne radar and electronic chart include the following:
- The Global Positioning System (GPS) geographic coordinates of the clean-up ship are transformed into plane Cartesian coordinates.
- Using the range of radar, image size, and ship projection coordinates obtained in step a, the image coordinates of the oil spill boundary points are transformed into the Beijing_1954 projection coordinate system.
- The projection coordinates of the oil spill boundary points are transformed into the WGS_1984 coordinate system.
- The target polygon is generated in an electronic chart.
3.3. Verification
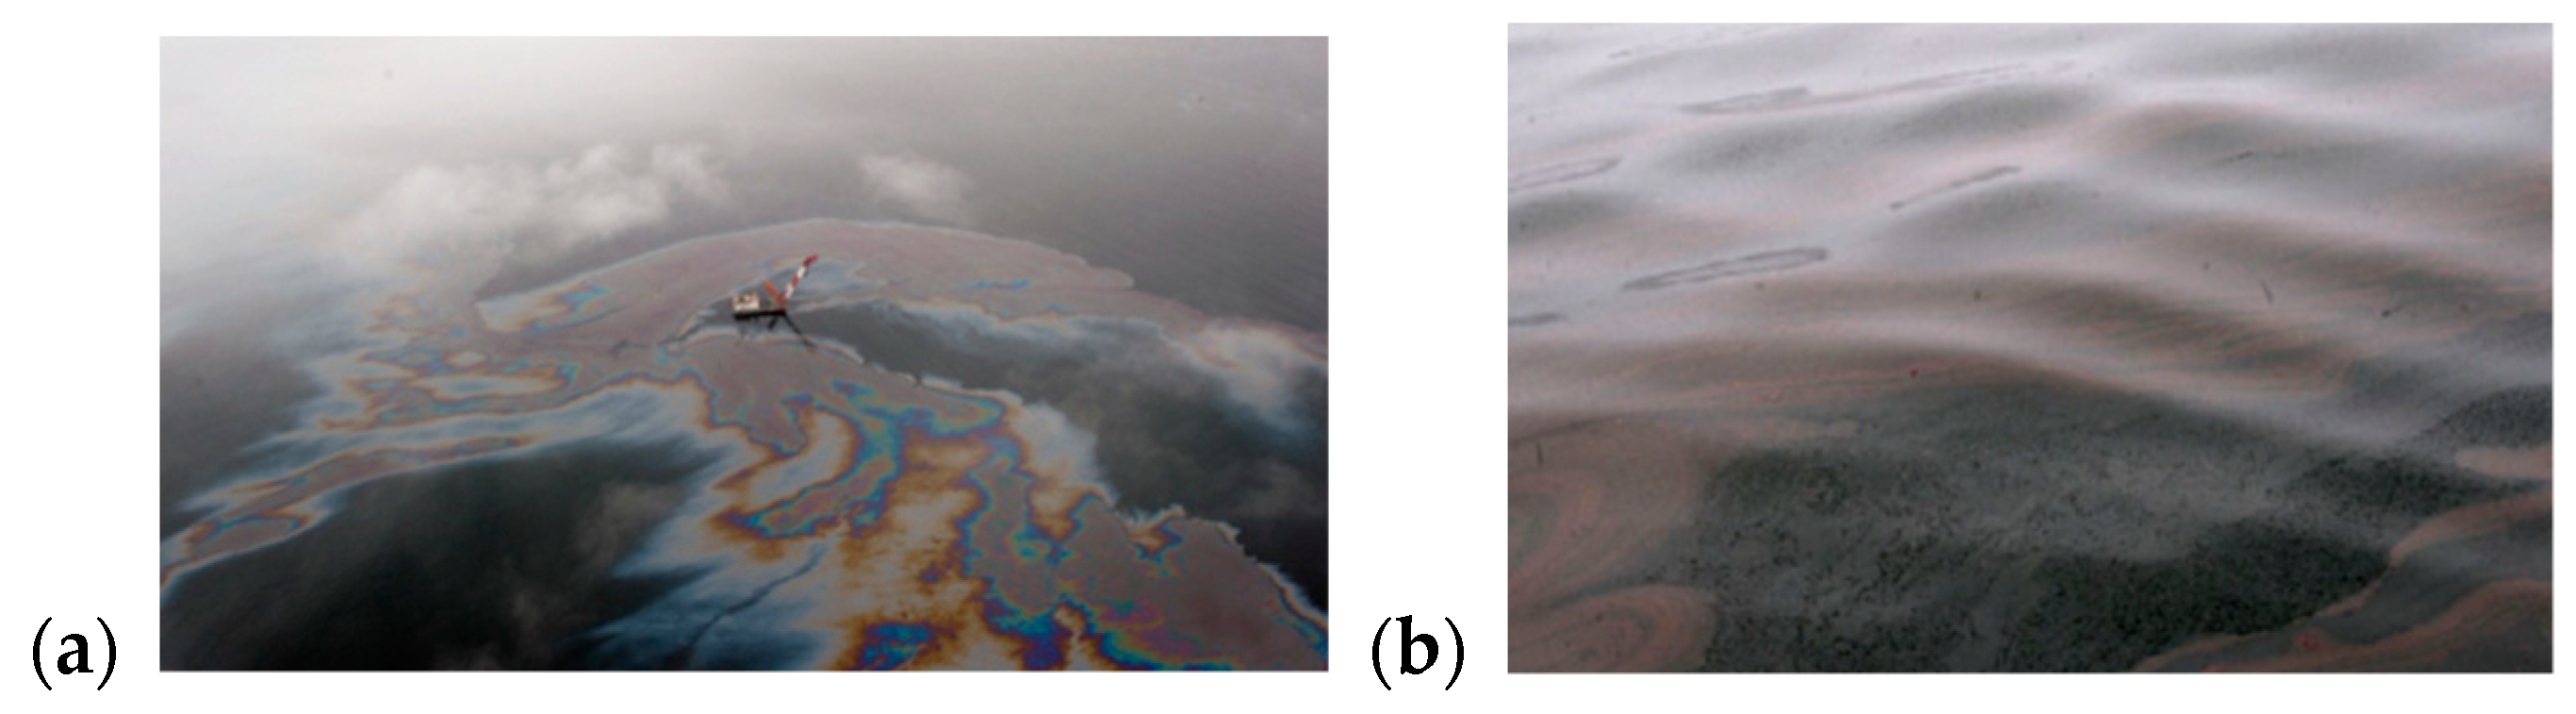
During the daytime, airborne visible light sensors captured many oil films at sea (Figure 14), but the cruise time of radar image data acquisition was during the nighttime. We validated the feasibility of our method by using images captured by shipborne infrared sensors in Figure 14. In the nighttime, thermal infrared images oil films have somewhat lower grey values than water in thermal infrared images [9,14]. In Figure 15, the position of the oil film in the infrared image is the same as the position in the radar image, and therefore, our method is feasible.
3.4. Advantages of Shipborne Radar Oil Spill Monitoring
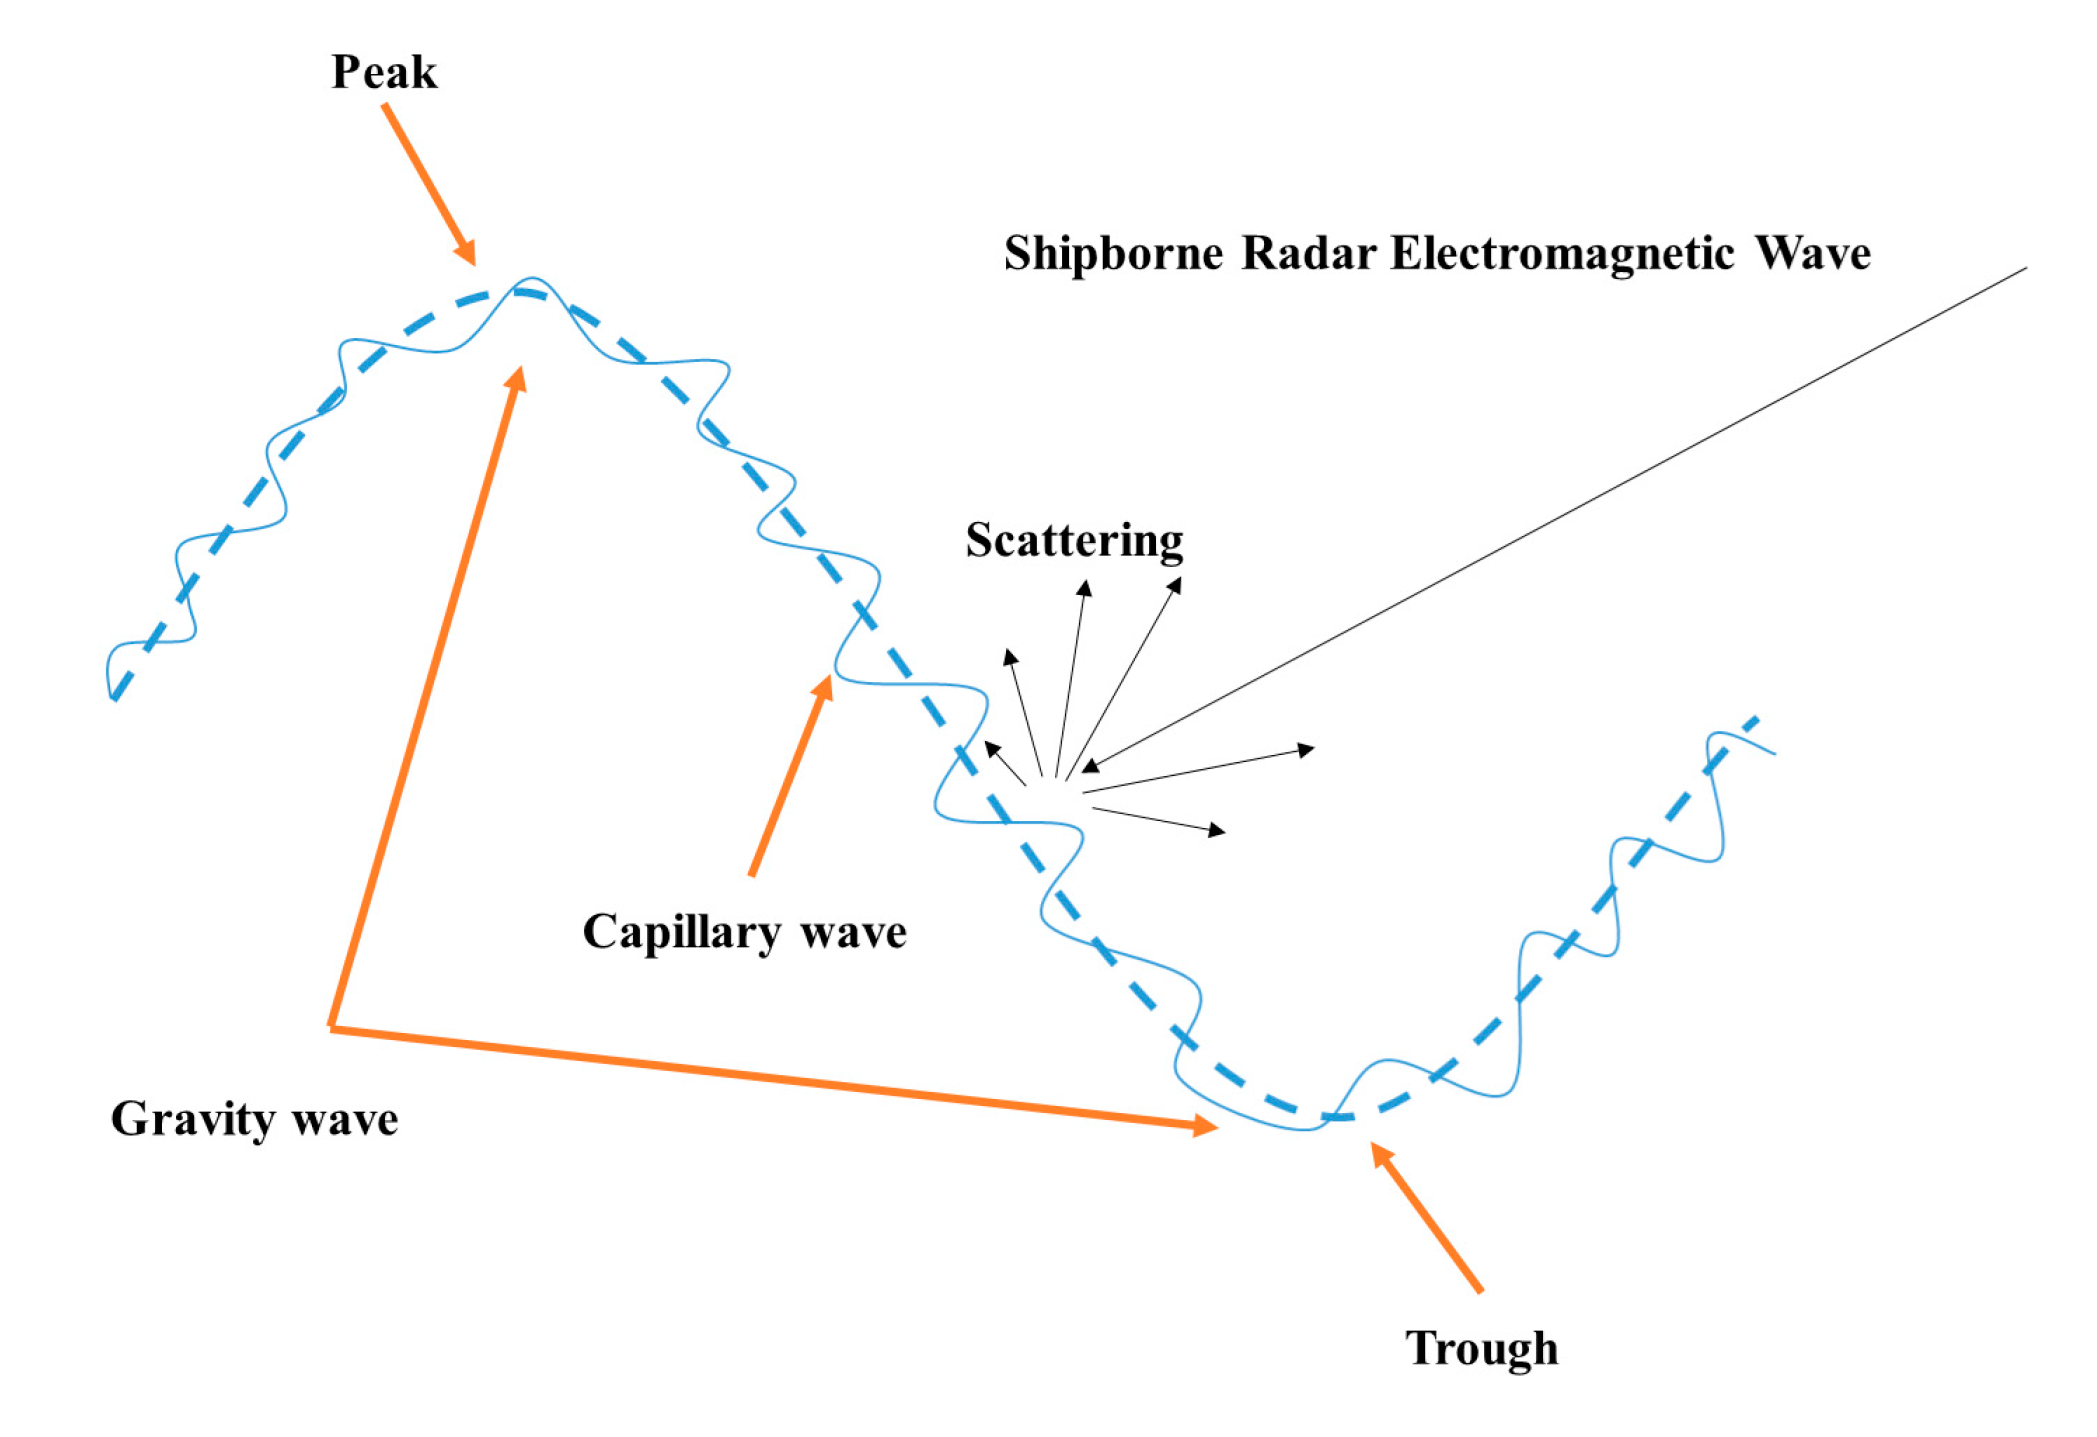
Shipborne radar oil spill monitoring is based on the characteristics of sea clutter. Figure 16 shows that shipborne radar transmits electromagnetic waves onto the sea surface with Bragg scattering. However, the oil film covers the surface and reduces the gap between peaks and wave troughs. A smooth oil film surface can reduce backscattering wave beams (Figure 17), weakening the signal in the oil film region more than in other regions.
Spaceborne radar data will always be affected by cloud, and there is a certain period of data acquisition. Shipborne radar can overcome these limitations and monitor in real-time, all day. Airborne radar often fails to work at night or in snowy and rainy weather. The shipborne radar can overcome bad weather for on-site monitoring. Compared with other sensors, a shipborne visible sensor can provide the most intuitive synthetic image, but it cannot detect an oil film at night. Shipborne infrared and laser fluorescence devices can work at night, but the monitoring range is too small. The shipborne radar can not only work at night, but also conduct omni-directional large-area monitoring. In summary, shipborne radar can play not only a role in ship navigation and collision avoidance, but also have significant application and promotion prospects in monitoring marine oil spill.
3.5. Comparison with Other Local Adaptive Thresholds
Sauvola’s method [46], Bernsen’s method [47], and Otsu method [38] were compared with our method in local threshold selection in Figure 18. Less oil films were identified in Sauvola’s method, and false excessive oil film were detected in Bernsen’s method. The Otsu algorithm is not suitable for our experimental process, yielding a poor result. Xu’s [36] adaptive threshold improved upon Sauvela’s method, and was adopted for an excellent performance in our experiment. Compared with the above three methods, our approach is more congruent with the results of visual interpretation.
3.6. Comparison with Other Oil Film Classifications of Shipborne Radar
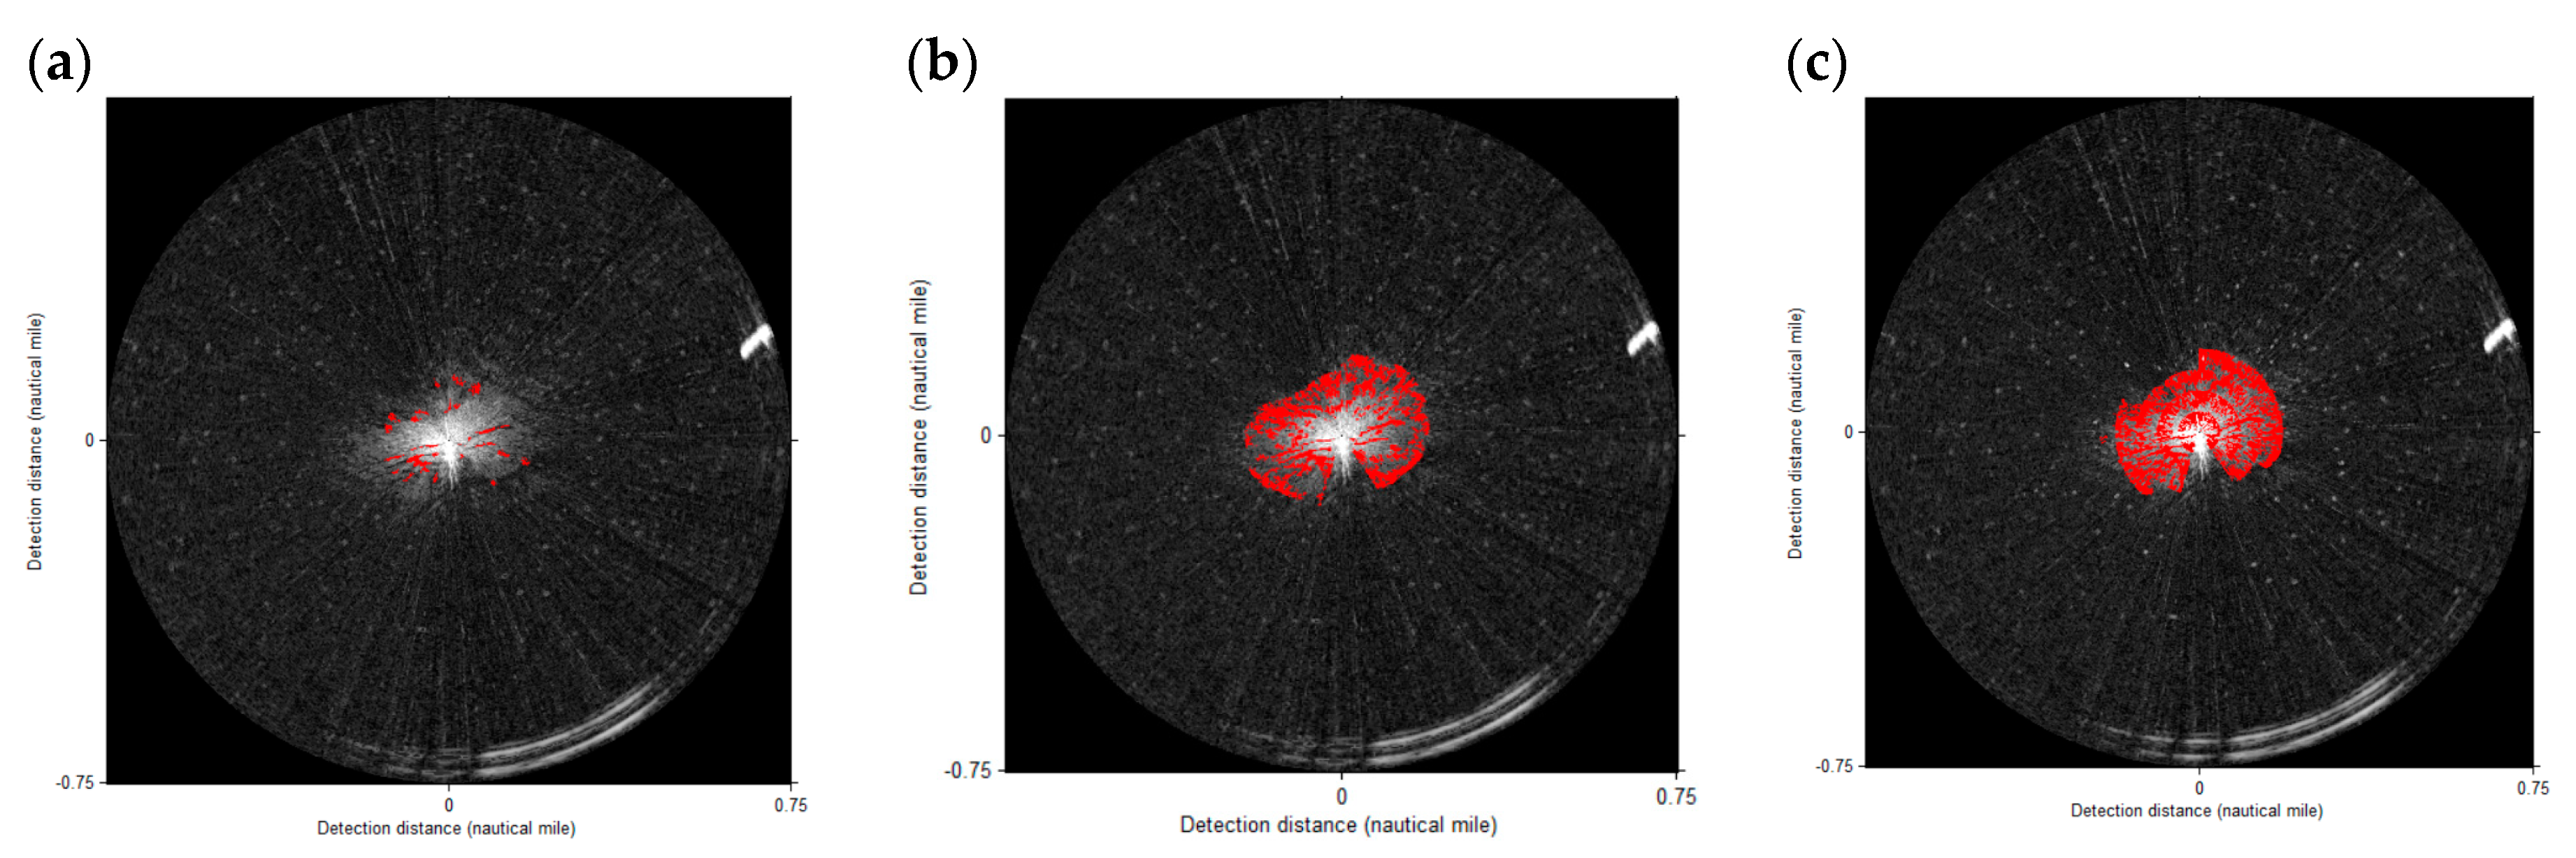
Zhu et al. [34] proposed a global threshold method for the identification of oil films in shipborne radar images. Based on the gray distribution matrix, Xu et al. [35] proposed a dual-threshold method (gray and area) to detect oil spills. Liu et al. [48] used an iterative method and an adaptive threshold to obtain the oil spills. These methods were used for comparisons with our method (Figure 19). The classification of oil films is based on the relative dark area, and the gray values of oil films are different in diversified wave areas. To reduce the misjudgments of oil films, Zhu’s and Xu’s methods therefore needed to adopt a lower global threshold value, but they still misinterpreted the long-distance weak waves as oil spills. In Liu’s method, the adaptive threshold was applied and better results were achieved, but some oil films were missed. In addition, their iterative method forgoes efficiency. Our result (Figure 12b) is closer to the expert visual interpretation than the three aforementioned methods. The results show that the local adaptive threshold is more suitable for the extraction of oil spills in shipborne radar images.
4. Conclusions
In this study, we proposed an oil spill classification method for shipborne radar gray images, including image preprocessing, wave classification, effective monitoring area selection, and oil spill extraction. The images collected during the cruise of the 7.16 oil spill in Dalian Port were used to illustrate the detailed process of the methodology. The feasibility of oil spill monitoring by shipborne radar was validated by real-time night shipborne infrared images. Compared with the global threshold method, the local adaptive threshold method is more suitable for the oil film segmentation of shipborne radar gray images because of the very uneven gray distribution of waves. The selection of the local adaptive threshold method is also very important. In comparison, the improved Sauvela’s method yielded optimal results. The successful application of this method will provide a safety guarantee for offshore oil production and transportation, as well as technical support for cleaning an oil spill after an accident.
The images used in our experiment were obtained on the same cruise and sea conditions. In future work, we will continue to collect shipborne radar images with oil films under different sea conditions on ship laneways, oil terminals, and oil platforms, thus perfecting the sample library of wave artificial intelligence classification. In addition, we will continue to investigate improving other local adaptive methods to enhance the effectiveness of oil film identification.
Author Contributions
J.X. conceived, performed the experiments; H.W. and C.C. collected data and helped perform the analysis with constructive discussions; B.Z. revised the manuscript; B.L. contributed to revisions and approved the final version. All authors have read and agreed to the published version of the manuscript.
Funding
This research was funded by the National Natural Science Foundation of China [grant number 51709031], the Fundamental Research Funds for the Central Universities [grant number 3132019138] and the Innovation Support Project of Dalian [grant number 2018RQ22].
Acknowledgments
The authors of this research would like to thank all the field management staff at the teaching-training ship Yukun for their support of our research.
Conflicts of Interest
The authors declare no conflict of interest.
References
- Agency, E.S. Oil Pollution Monitoring. In Remote Sensing Exploitation Division; ESRIN—European Space Agency (ESA): Frascati, Italy, 2018; p. 2. Available online: http://www.esa.int/esapub/br/br128/br128_1.pdf (accessed on 13 December 2019).
- Zanier, G.; Palma, M.; Petronio, A.; Roman, F.; Armenio, V. Oil Spill Scenarios in the Kotor Bay: Results from High Resolution Numerical Simulations. J. Mar. Sci. Eng. 2019, 7, 54. [Google Scholar] [CrossRef] [Green Version]
- Sissini, M.N.; Berchez, F.; Hall-Spencer, J.; Ghilardi-Lopes, N.; Carvalho, V.F.; Schubert, N.; Koerich, G.; Diaz-Pulido, G.; Silva, J.; Serrão, E.; et al. Brazil oil spill response: Protect rhodolith beds. Science 2020, 367, 156. [Google Scholar] [CrossRef]
- Brum, H.D.; Campos-Silva, J.V.; Oliveira, E.G. Brazil oil spill response: Government inaction. Science 2020, 367, 155–156. [Google Scholar] [CrossRef] [PubMed]
- Hammoud, B.; Ndagijimana, F.; Faour, G.; Ayad, H.; Jomaah, J. Bayesian Statistics of Wide-Band Radar Reflectionsfor Oil Spill Detection on Rough Ocean Surface. J. Mar. Sci. Eng. 2019, 7, 12. [Google Scholar] [CrossRef] [Green Version]
- Atta, A.M.; Abdullah, M.M.S.; Al-Lohedan, H.A.; Mohamed, N.H. Novel Superhydrophobic Sand and Polyurethane Sponge Coated with Silica/Modified Asphaltene Nanoparticles for Rapid Oil Spill Cleanup. Nanomaterials 2019, 2, 187. [Google Scholar] [CrossRef] [PubMed] [Green Version]
- Tong, S.; Liu, X.; Chen, Q.; Zhang, Z.; Xie, G. Multi-Feature Based Ocean Oil Spill Detection for Polarimetric SAR Data Using Random Forest and the Self-Similarity Parameter. Remote Sens. 2019, 11, 451. [Google Scholar] [CrossRef] [Green Version]
- Brekke, C.; Solberg, A.H.S. Oil spill detection by satellite remote sensing. Remote Sens. Environ. 2005, 95, 1–13. [Google Scholar] [CrossRef]
- Fingas, M.; Brown, C.E. A Review of Oil Spill Remote Sensing. Sensors 2018, 18, 91. [Google Scholar] [CrossRef] [Green Version]
- Liu, Z.; An, J.; Li, L. A two-stage registration algorithm for oil spill aerial image by invariants-based similarity and improved ICP. Int. J. Remote Sens. 2011, 32, 3649–3664. [Google Scholar] [CrossRef]
- Schrope, M. Oil spill: Deep wounds. Nature 2011, 472, 152–154. [Google Scholar] [CrossRef] [Green Version]
- Padova, D.D.; Mossa, M.; Adamo, M.; Carolis, G.D.; Pasquariello, G. Synergistic use of an oil drift model and remote sensing observations for oil spill monitoring. Environ. Sci. Pollut. Res. 2017, 24, 5530–5543. [Google Scholar] [CrossRef] [PubMed]
- Casciello, D.; Lacava, T.; Pergola, N.; Tramutoli, V. Robust Satellite Techniques for oil spill detection and monitoring using AVHRR thermal infrared bands. Int. J. Remote Sens. 2011, 32, 4107–4129. [Google Scholar] [CrossRef]
- Fingas, M.; Brown, C.E. Review of oil spill remote sensing. Mar. Pollut. Bull. 2014, 83, 9–23. [Google Scholar] [CrossRef] [PubMed] [Green Version]
- Guo, H.; Wei, G.; An, J. Dark Spot Detection in SAR Images of Oil Spill Using Segnet. Appl. Sci. 2018, 8, 2670. [Google Scholar] [CrossRef] [Green Version]
- Li, Y.; Zhang, Y.; Yuan, Z.; Guo, H.; Pan, H.; Guo, J. Marine Oil Spill Detection Based on the Comprehensive Use of Polarimetric SAR Data. Sustainability 2018, 10, 4408. [Google Scholar] [CrossRef] [Green Version]
- Gil, P.; Alacid, B. Oil Spill Detection in Terma-Side-Looking Airborne Radar Images Using Image Features and Region Segmentation. Sensors 2018, 18, 151. [Google Scholar] [CrossRef] [Green Version]
- Yu, L.; Hui, L.; Zhang, Y.; Jie, C. Comparisons of Circular Transmit and Linear Receive Compact Polarimetric SAR Features for Oil Slicks Discrimination. J. Sens. 2015, 2015, 1–14. [Google Scholar]
- Yin, J.; Jian, Y.; Zhou, Z.S.; Song, J. The Extended Bragg Scattering Model-Based Method for Ship and Oil-Spill Observation Using Compact Polarimetric SAR. IEEE J. Sel. Top. Appl. Earth Obs. Remote Sens. 2015, 8, 3760–3772. [Google Scholar] [CrossRef]
- Alireza, T.; Natascha, O. Adaptive Weibull Multiplicative Model and Multilayer Perceptron neural networks for dark-spot detection from SAR imagery. Sensors 2014, 14, 22798. [Google Scholar]
- Chen, G.; Li, Y.; Sun, G.; Zhang, Y. Application of Deep Networks to Oil Spill Detection Using Polarimetric Synthetic Aperture Radar Images. Appl. Sci. 2017, 7, 968. [Google Scholar] [CrossRef]
- Nunziata, F.; Buono, A.; Migliaccio, M. COSMO–SkyMed Synthetic Aperture Radar Data to Observe the Deepwater Horizon Oil Spill. Sustainability 2018, 10, 3599. [Google Scholar] [CrossRef] [Green Version]
- Guo, H.; Wu, D.; An, J. Discrimination of Oil Slicks and Lookalikes in Polarimetric SAR Images Using CNN. Sensors 2017, 17, 1837. [Google Scholar] [CrossRef] [PubMed] [Green Version]
- Jones, C.E.; Holt, B. Experimental L-Band Airborne SAR for Oil Spill Response at Sea and in Coastal Waters. Sensors 2018, 18, 641. [Google Scholar] [CrossRef] [PubMed] [Green Version]
- Alpers, W.; Hühnerfuss, H. The Damping of Ocean Waves by Surface Films: A New Look at an Old Problem. J. Geophys. Res. Atmos. 1989, 94, 6251–6265. [Google Scholar] [CrossRef]
- Yu, L.; Zhang, Y.; Jie, C.; Zhang, H. Improved Compact Polarimetric SAR Quad-Pol Reconstruction Algorithm for Oil Spill Detection. IEEE Geosci. Remote Sens. Lett. 2014, 11, 1139–1142. [Google Scholar]
- Buono, A.; Nunziata, F.; Migliaccio, M.; Li, X. Polarimetric Analysis of Compact-Polarimetry SAR Architectures for Sea Oil Slick Observation. IEEE Trans. Geosci. Remote Sens. 2016, 54, 1–14. [Google Scholar] [CrossRef]
- Bern, T.I.; Wahl, T.; Andersen, T.; Olsen, R. Oil spill detection using satellite based SAR - Experience from a field experiment. Photogramm. Eng. Remote Sens. 1993, 59, 423–428. [Google Scholar]
- Solberg, A.H.S.; Storvik, G.; Solberg, R.; Volden, E. Automatic detection of oil spills in ERS SAR images. IEEE Trans. Geosci. Remote Sens. 1999, 37, 1916–1924. [Google Scholar] [CrossRef] [Green Version]
- Kanaa, T.F.N.; Tonye, E.; Mercier, G.; Onana, V.P.; Ngono, J.M.; Frison, P.L.; Rudant, J.P.; Garello, R. In Detection of Oil Slick Signatures in SAR Images by Fusion of Hysteresis Thresholding Responses. In Proceedings of the 2003 IEEE International Geoscience & Remote Sensing Symposium, Toulouse, France, 21–25 July 2003. [Google Scholar]
- Wang, H.; Huang, T.Z.; Du, Y.Q. A global minimization hybrid active contour model with applications to oil spill images. Comput. Math. Appl. 2014, 68, 353–362. [Google Scholar] [CrossRef]
- Lyu, X. In Oil Spill Detection Based on Features and Extreme Learning Machine Method in SAR Images. In Proceedings of the 2018 3rd International Conference on Mechanical, Control and Computer Engineering (ICMCCE), Huhhot, China, 14–16 September 2018. [Google Scholar]
- Taravat, A.; Frate, F.D. Weibull Multiplicative Model and machine learning models for full-automatic dark-spot detection from SAR images. ISPRS Int. Arch. Photogramm. Remote Sens. Spat. Inf. Sci. 2013, 40, 421–424. [Google Scholar] [CrossRef] [Green Version]
- Zhu, X.; Ying, L.; Feng, H.; Liu, B.; Jin, X. Oil spill detection method using X-band marine radar imagery. J. Appl. Remote Sens. 2015, 9, 95985. [Google Scholar] [CrossRef]
- Xu, J.; Liu, P.; Wang, H.; Lian, J.; Li, B. Marine Radar Oil Spill Monitoring Technology Based on Dual-Threshold and C-V Level Set Methods. J. Indian Soc. Remote 2018, 46, 1949–1961. [Google Scholar] [CrossRef]
- Xu, J.; Cui, C.; Feng, H.; You, D.; Wang, H.; Li, B. Marine Radar Oil-Spill Monitoring through Local Adaptive Thresholding. Environ. Forensics 2019, 20, 196–209. [Google Scholar] [CrossRef]
- Liu, P.; Li, Y.; Liu, B.; Chen, P.; Xu, J. Semi-Automatic Oil Spill Detection on X-Band Marine Radar Images Using Texture Analysis, Machine Learning, and Adaptive Thresholding. Remote Sens. 2019, 11, 756. [Google Scholar] [CrossRef] [Green Version]
- Otsu, N. A threshold selection method from gray-level histograms. IEEE Trans. Syst. Man Cybern. 1979, 9, 62–66. [Google Scholar] [CrossRef] [Green Version]
- Cortes, C.; Vapnik, V. Support-vector networks. Mach. Learn. 1995, 20, 273–297. [Google Scholar] [CrossRef]
- Zhu, X.; Li, N.; Pan, Y. Optimization Performance Comparison of Three Different Group Intelligence Algorithms on a SVM for Hyperspectral Imagery Classification. Remote Sens. 2019, 11, 734. [Google Scholar] [CrossRef] [Green Version]
- Phyo, C.N.; Zin, T.T.; Tin, P. Complex Human–Object Interactions Analyzer Using a DCNN and SVM Hybrid Approach. Appl. Sci. 2019, 9, 1869. [Google Scholar] [CrossRef] [Green Version]
- Liu, P.; Chen, X. Intercropping Classification From GF-1 and GF-2 Satellite Imagery Using a Rotation Forest Based on an SVM. ISPRS Int. J. Geo-Inf. 2019, 8, 86. [Google Scholar] [CrossRef] [Green Version]
- Matkan, A.A.; Hajeb, M.; Azarakhsh, Z. Oil spill detection from SAR image using SVM based classification. Int. Arch. Photogramm. Remote Sens. Spat. Inf. Sci. 2013, 1, 55–60. [Google Scholar] [CrossRef] [Green Version]
- Zhang, Y.; Li, Y.; Liang, X.S.; Tsou, J. Comparison of Oil Spill Classifications Using Fully and Compact Polarimetric SAR Images. Appl. Sci. 2017, 7, 193. [Google Scholar] [CrossRef] [Green Version]
- Niblack, W. An Introduction to Digital Image Processing; Prentice Hall: Englewood Cliffs, NJ, USA, 1986; pp. 115–116. [Google Scholar]
- Sauvola, J.; Pietikäinen, M. Adaptive document image binarization. Pattern Recognit. 2000, 33, 225–236. [Google Scholar] [CrossRef] [Green Version]
- Bernsen, J. In Dynamic Thresholding of Grey-Level Images. In Proceedings of the Eigth International Conference Pattern Recognition, ICPR 1986, Paris, France, 27–31 October 1986; pp. 1251–1255. [Google Scholar]
- Liu, P.; Li, Y.; Xu, J.; Zhu, X. Adaptive enhancement of x-band marine radar imagery to detect oil spill segments. Sensors 2017, 17, 2349. [Google Scholar] [CrossRef] [Green Version]
Figure 1.
Original radar images, where (a–d) were acquired at 23:19:58, 23:20:27, 23:21:03, and 23:21:09, respectively.
Figure 1.
Original radar images, where (a–d) were acquired at 23:19:58, 23:20:27, 23:21:03, and 23:21:09, respectively.

Figure 2.
Clean-up mission. The red line indicates the departure route and the green line indicates the return route.
Figure 2.
Clean-up mission. The red line indicates the departure route and the green line indicates the return route.

Figure 3.
Hardware architecture showing (a) the installation position of the radar antenna and the (b) radar data acquisition system.
Figure 3.
Hardware architecture showing (a) the installation position of the radar antenna and the (b) radar data acquisition system.

Figure 4.
Image generation mechanism.

Figure 5.
Flow of data preprocessing.

Figure 6.
Result of data preprocessing showing (a) convolution of the Laplace operator, (b) threshold segmentation, T = 128, (c) in the 1 × 7 window centered on the highlighted pixels of the original image, with two nearest non-highlighted points selected to replace the highlighted pixel with the mean value, (d) segmentation of isolated targets, Tarea = 200, and (e) the window of median filtering, which is 21×21.

Figure 7.
Flow of oil film classification. SVM—support vector machine.

Figure 8.
Optimal hyperplane for binary classification.

Figure 9.
Classification of Figure 6e. Long-range shoreline echoes have been deleted.
Figure 9.
Classification of Figure 6e. Long-range shoreline echoes have been deleted.

Figure 10.
Determination of effective wave area showing (a) gray gradient matrix of Figure 9, (b) the mask of gray threshold “20”, and (c) the final, pre-analyzed area.
Figure 10.
Determination of effective wave area showing (a) gray gradient matrix of Figure 9, (b) the mask of gray threshold “20”, and (c) the final, pre-analyzed area.

Figure 11.
Results of the local adaptive threshold with (a) initial identification and (b) fine identification.
Figure 11.
Results of the local adaptive threshold with (a) initial identification and (b) fine identification.

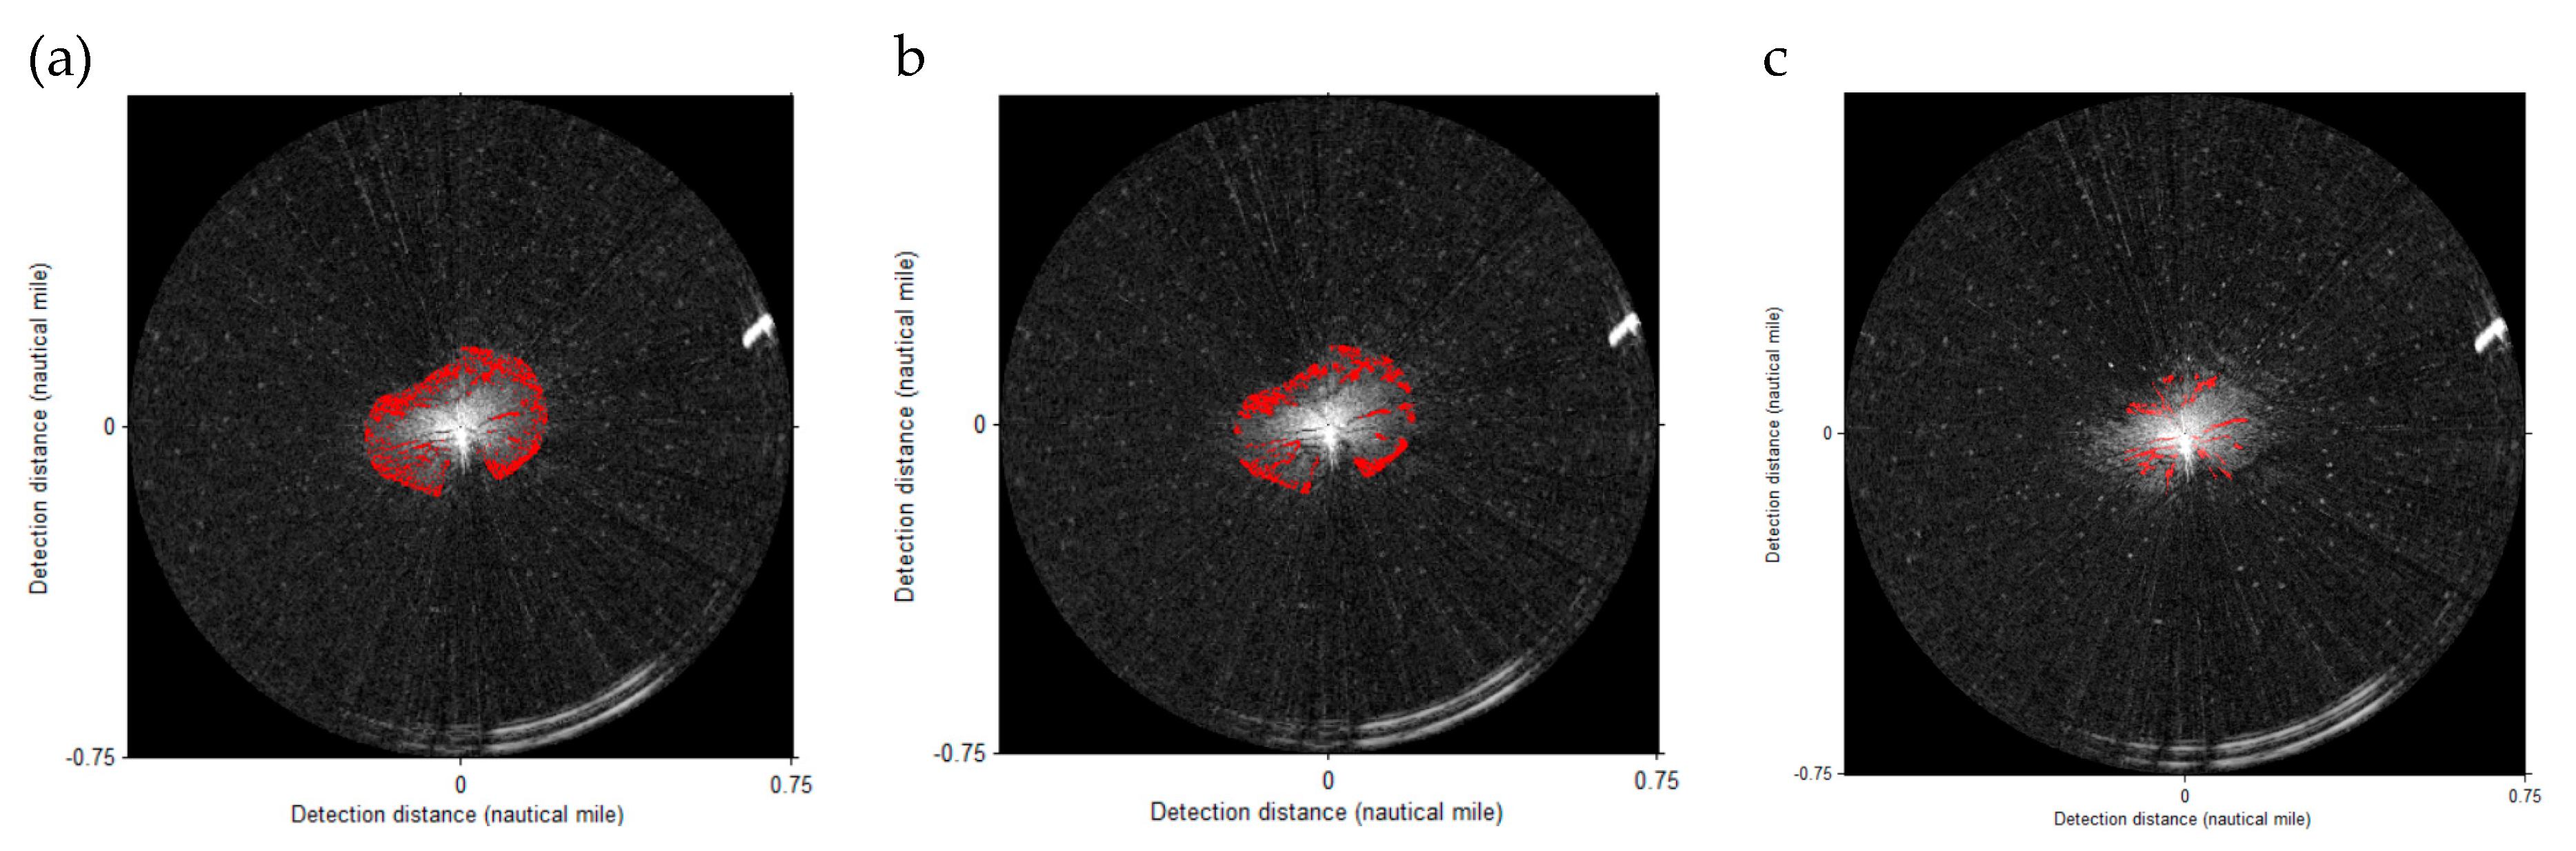
Figure 12.
Oil film classification results, where (a–d) are results of Figure 1a–d, respectively.
Figure 12.
Oil film classification results, where (a–d) are results of Figure 1a–d, respectively.

Figure 13.
Location of the oil spill shown in the electronic chart.

Figure 14.
Visible light images with oil films were acquired during the day. (a,b) are airborne and shipborne visible light images, respectively.
Figure 14.
Visible light images with oil films were acquired during the day. (a,b) are airborne and shipborne visible light images, respectively.

Figure 15.
Thermal infrared images with oil films were acquired during the night.

Figure 16.
Scattering mechanism of shipborne radar electromagnetic waves.

Figure 17.
Oil spill imaging mechanism of the shipborne radar images. Oil film reduces the backscatter of the shipborne radar image.
Figure 17.
Oil spill imaging mechanism of the shipborne radar images. Oil film reduces the backscatter of the shipborne radar image.

Figure 18.
Comparison with other local adaptive thresholds of Figure 1b showing (a) Sauvola’s method, (b) Bernsen’s method, and (c) the Otsu method.
Figure 18.
Comparison with other local adaptive thresholds of Figure 1b showing (a) Sauvola’s method, (b) Bernsen’s method, and (c) the Otsu method.

Figure 19.
Comparison with other oil film classifications of Figure 1b showing (a) Liu’s method, (b) Zhu’s method (Tgray = 55), and (c) Xu’s method (Tgray = 100, Tarea = 30).
Figure 19.
Comparison with other oil film classifications of Figure 1b showing (a) Liu’s method, (b) Zhu’s method (Tgray = 55), and (c) Xu’s method (Tgray = 100, Tarea = 30).


Table 1.
Parameters of the shipborne radar.
| Parameter | Value |
|---|---|
| Product type | Sperry Marine B.V. |
| Band | X-band |
| Detection distance | 0.5/0.75/1.5.3.6.12 NM |
| Image size | 1024 × 1024 |
| Antenna type | Waveguide split antenna |
| Polarization mode | Horizontal |
| Horizontal detection angle | 360° |
| Rotation speed | 28–45 revolutions/min |
| Length of antenna | 8 ft |
| Pulse repetition frequency | 3000 Hz/1800 Hz/785 Hz |
| Pulse width | 50 ns/250 ns/750 ns |
| Data acquisition period | 2 s |
© 2020 by the authors. Licensee MDPI, Basel, Switzerland. This article is an open access article distributed under the terms and conditions of the Creative Commons Attribution (CC BY) license (http://creativecommons.org/licenses/by/4.0/).
Share and Cite
MDPI and ACS Style
Xu, J.; Wang, H.; Cui, C.; Zhao, B.; Li, B. Oil Spill Monitoring of Shipborne Radar Image Features Using SVM and Local Adaptive Threshold. Algorithms 2020, 13, 69. https://0-doi-org.brum.beds.ac.uk/10.3390/a13030069
AMA Style
Xu J, Wang H, Cui C, Zhao B, Li B. Oil Spill Monitoring of Shipborne Radar Image Features Using SVM and Local Adaptive Threshold. Algorithms. 2020; 13(3):69. https://0-doi-org.brum.beds.ac.uk/10.3390/a13030069
Chicago/Turabian StyleXu, Jin, Haixia Wang, Can Cui, Baigang Zhao, and Bo Li. 2020. "Oil Spill Monitoring of Shipborne Radar Image Features Using SVM and Local Adaptive Threshold" Algorithms 13, no. 3: 69. https://0-doi-org.brum.beds.ac.uk/10.3390/a13030069
Note that from the first issue of 2016, this journal uses article numbers instead of page numbers. See further details here.