Article

Commonly Used External TAM Variables in e-Learning, Agriculture and Virtual Reality Applications

by
Ivonne Angelica Castiblanco Jimenez
*,
Laura Cristina Cepeda García
,
Maria Grazia Violante
,
Federica Marcolin
and
Enrico Vezzetti
*
Department of Management and Production Engineering, Politecnico di Torino, Corso Duca degli Abruzzi 24, 10129 Torino, Italy
*
Authors to whom correspondence should be addressed.
Submission received: 20 December 2020 / Revised: 28 December 2020 / Accepted: 30 December 2020 / Published: 31 December 2020
(This article belongs to the Special Issue VR, AR, and 3-D User Interfaces for Measurement and Control)

Abstract

:
In recent years information and communication technologies (ICT) have played a significant role in all aspects of modern society and have impacted socioeconomic development in sectors such as education, administration, business, medical care and agriculture. The benefits of such technologies in agriculture can be appreciated only if farmers use them. In order to predict and evaluate the adoption of these new technological tools, the technology acceptance model (TAM) can be a valid aid. This paper identifies the most commonly used external variables in e-learning, agriculture and virtual reality applications for further validation in an e-learning tool designed for EU farmers and agricultural entrepreneurs. Starting from a literature review of the technology acceptance model, the analysis based on Quality Function Deployment (QFD) shows that computer self-efficacy, individual innovativeness, computer anxiety, perceived enjoyment, social norm, content and system quality, experience and facilitating conditions are the most common determinants addressing technology acceptance. Furthermore, findings evidenced that the external variables have a different impact on the two main beliefs of the TAM Model, Perceived Usefulness (PU) and Perceived Ease of Use (PEOU). This study is expected to bring theoretical support for academics when determining the variables to be included in TAM extensions.

1. Introduction

In the current high-speed connected world, there is a growing awareness of the advantages offered by information and communication technologies (ICT) and their crucial role in fostering human progress, promoting knowledge societies, supporting sustainable development [1,2] and accelerating economic growth [3]. Hence, integrating ICTs in all aspects of socio-economic agendas has become a cutting edge challenge [4], and, as years go by, billions of dollars are invested in technological initiatives in various development sectors [5]. However, the benefits of such technologies can only be appreciated if people use them [6].
Researchers from different science and technical areas have developed a set of complementary and extended frameworks to predict and evaluate the adoption of new technological tools. The most diffused approach is the Technology Acceptance Model (TAM), proposed by Davis [7]. This model investigates the drivers of technology acceptance, from the perspective of users’ perceptions about innovations and social and contextual factors. The validity of the TAM has been examined in sectors such as food industry [8], wearable technologies [9], health [10], social media [11], electronic commerce [12], energy services [13], financial services [14], among others. Under this model’s theoretical and practical logic, we want to measure the potential acceptance of an e-learning tool designed for 29 EU farmers and agricultural entrepreneurs within a European Erasmus + project (FARMER 4.0—Farmer teaching and training laboratories).
The contribution of tools such as FARMER 4.0, should not be overlooked as it helps to the strengthening of two fundamental sectors for sustainable development, namely e-learning and agriculture. As pointed out by Nie et al. [2], the e-learning sector and sustainability are closely related. Online education, aiming to improve the quality of learning programs, promote the acquisition of sustainability-related values and skills, and increase awareness about sustainable development initiatives, can positively affect local and global development.

1.1. Problem Formulation

Farmer4.0 wants to actively contribute to the achievement of the EU priority’s objectives, developing a new training model to foster the transfer of skills between “traditional” farmers, technologists, researchers and agricultural entrepreneurs of the digital age. Thanks to the proposed training, the digital age agricultural entrepreneur (farmer4.0) could use the most modern digital manufacturing technologies to create tools, models, and practices that will revolutionize the agricultural sector by taking advantage of digital creativity and interactivity of high-quality solutions. However, in addition to the farmers’ concerns regarding the use of new technologies, EU agriculture suffers from delays in keeping up with modern technologies and skills, which would allow a more significant safeguard of the competitive advantage in comparison with non-EU markets. In line with the previous context, we posed the following research question:
  • What are the external TAM variables that drive the acceptance of the e-learning tool FARMER 4.0?
To answer this question, in this paper we intend to identify the most commonly used external determinants in e-learning, agriculture and VR applications. We want to understand how traditional farmers, people who are used to getting by and who find solutions when problems arise using hands and traditional tools, are ready for new digital technologies. To comprehend the relationships between research topics and TAM variables, Quality Function Deployment (QFD) methodology is used.

1.2. Research Objectives

The present study pursues a threefold objective: (1) Identify and prioritize the most commonly used external factors affecting the two primary constructs, such as perceived usefulness (PU) and perceived ease of use (PEOU) of the Technology Acceptance Model (TAM) in e-learning, agricultural and virtual reality innovations. Those three sectors are selected based on the innovative tool’s nature under analysis. (2) Identify the main research topics addressed in the literature of TAM in e-learning, agriculture and virtual reality. (3) Extend the application of the Quality Function Deployment (QFD) as an organizing framework for the literature review. The results obtained are useful for academics and practitioners conducting similar research to have a general idea and theoretical evidence about the external factors driving the acceptance of technologies. The paper starts with a brief description of the TAM and QFD models (Section 2) and the proposed research methodology (Section 3). Then, we proceeded to the case study (Section 4) and discussion (Section 5), to analyze thanks to QFD the most commonly used external variables in the fields of interest that affected perceived usefulness (PU) and perceived ease of use (PEOU) of the Technology Acceptance Model. Based on the most commonly used external variables, we proposed a TAM extension for further validation within the context of the FARMER 4.0. Finally, we reported our conclusions and future directions of investigation in Section 6.

2. Background Research Models

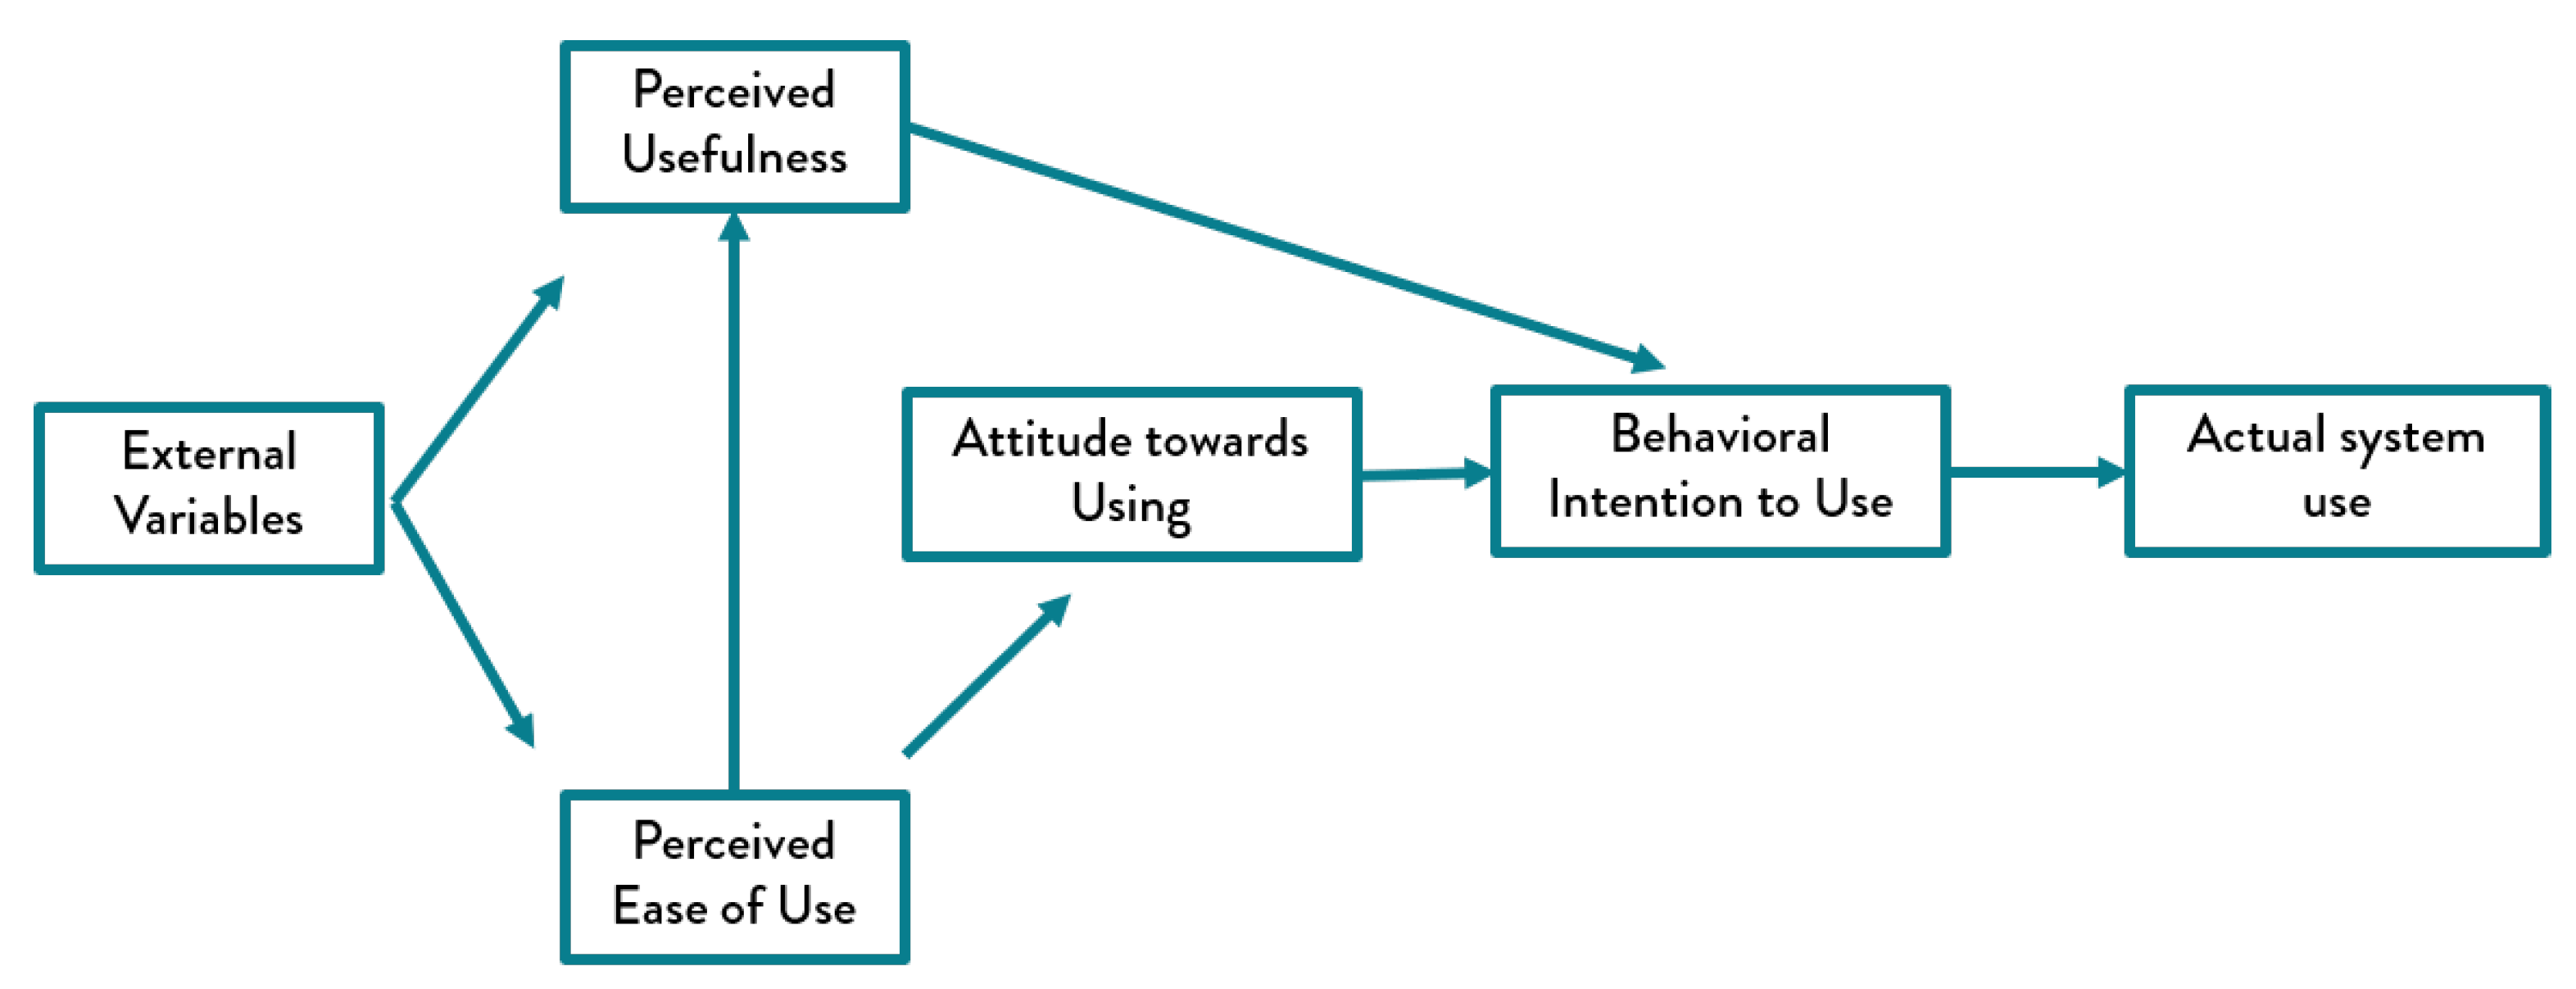
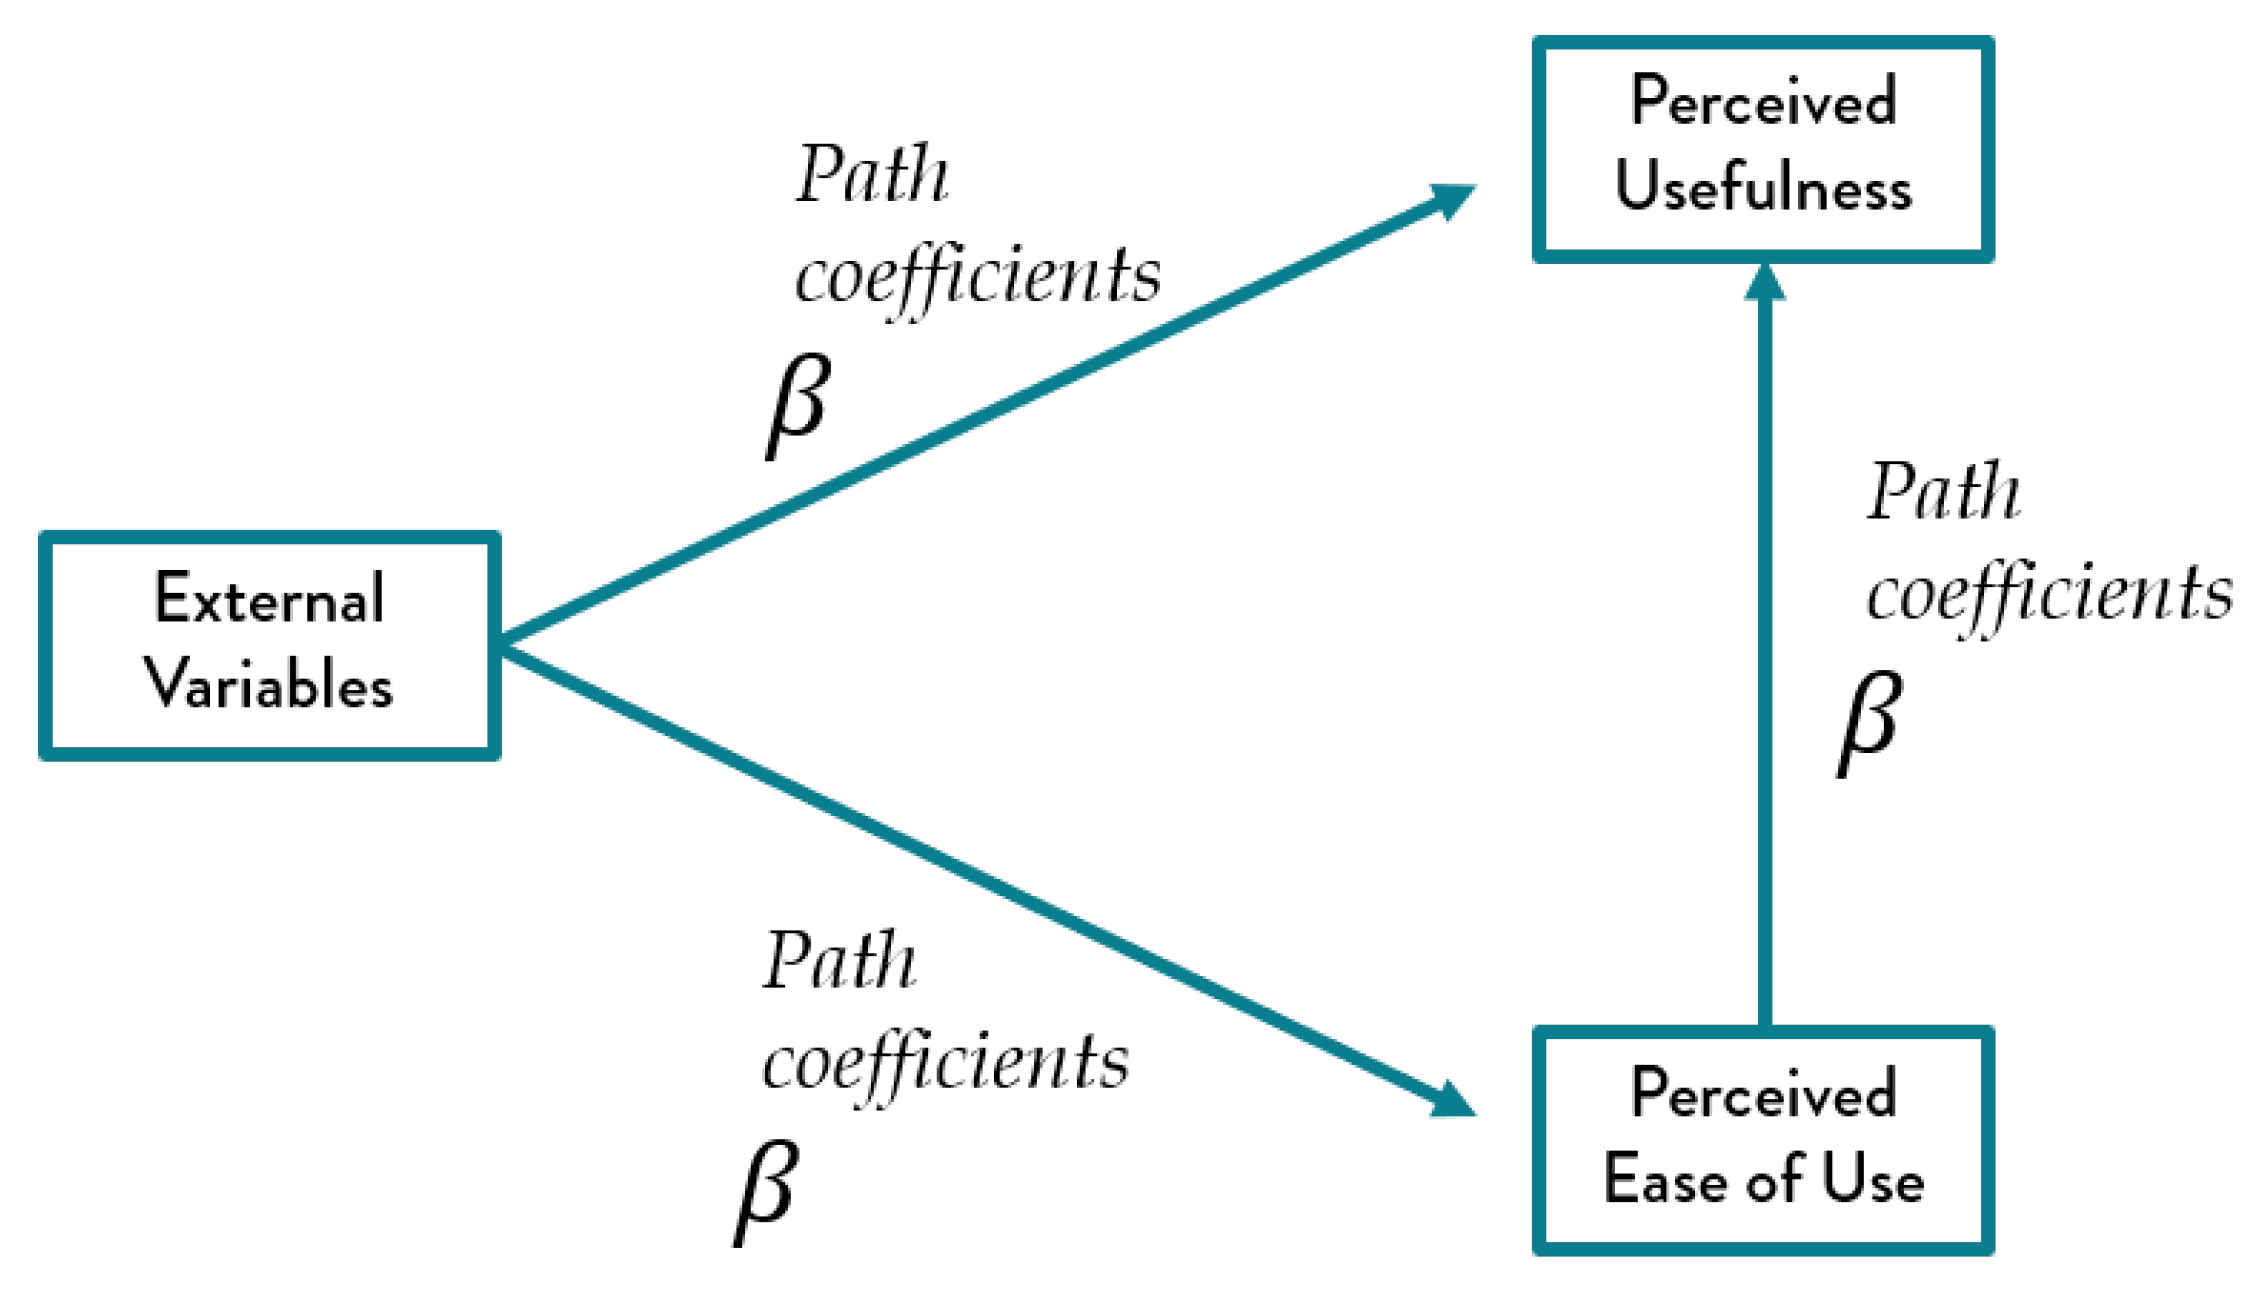
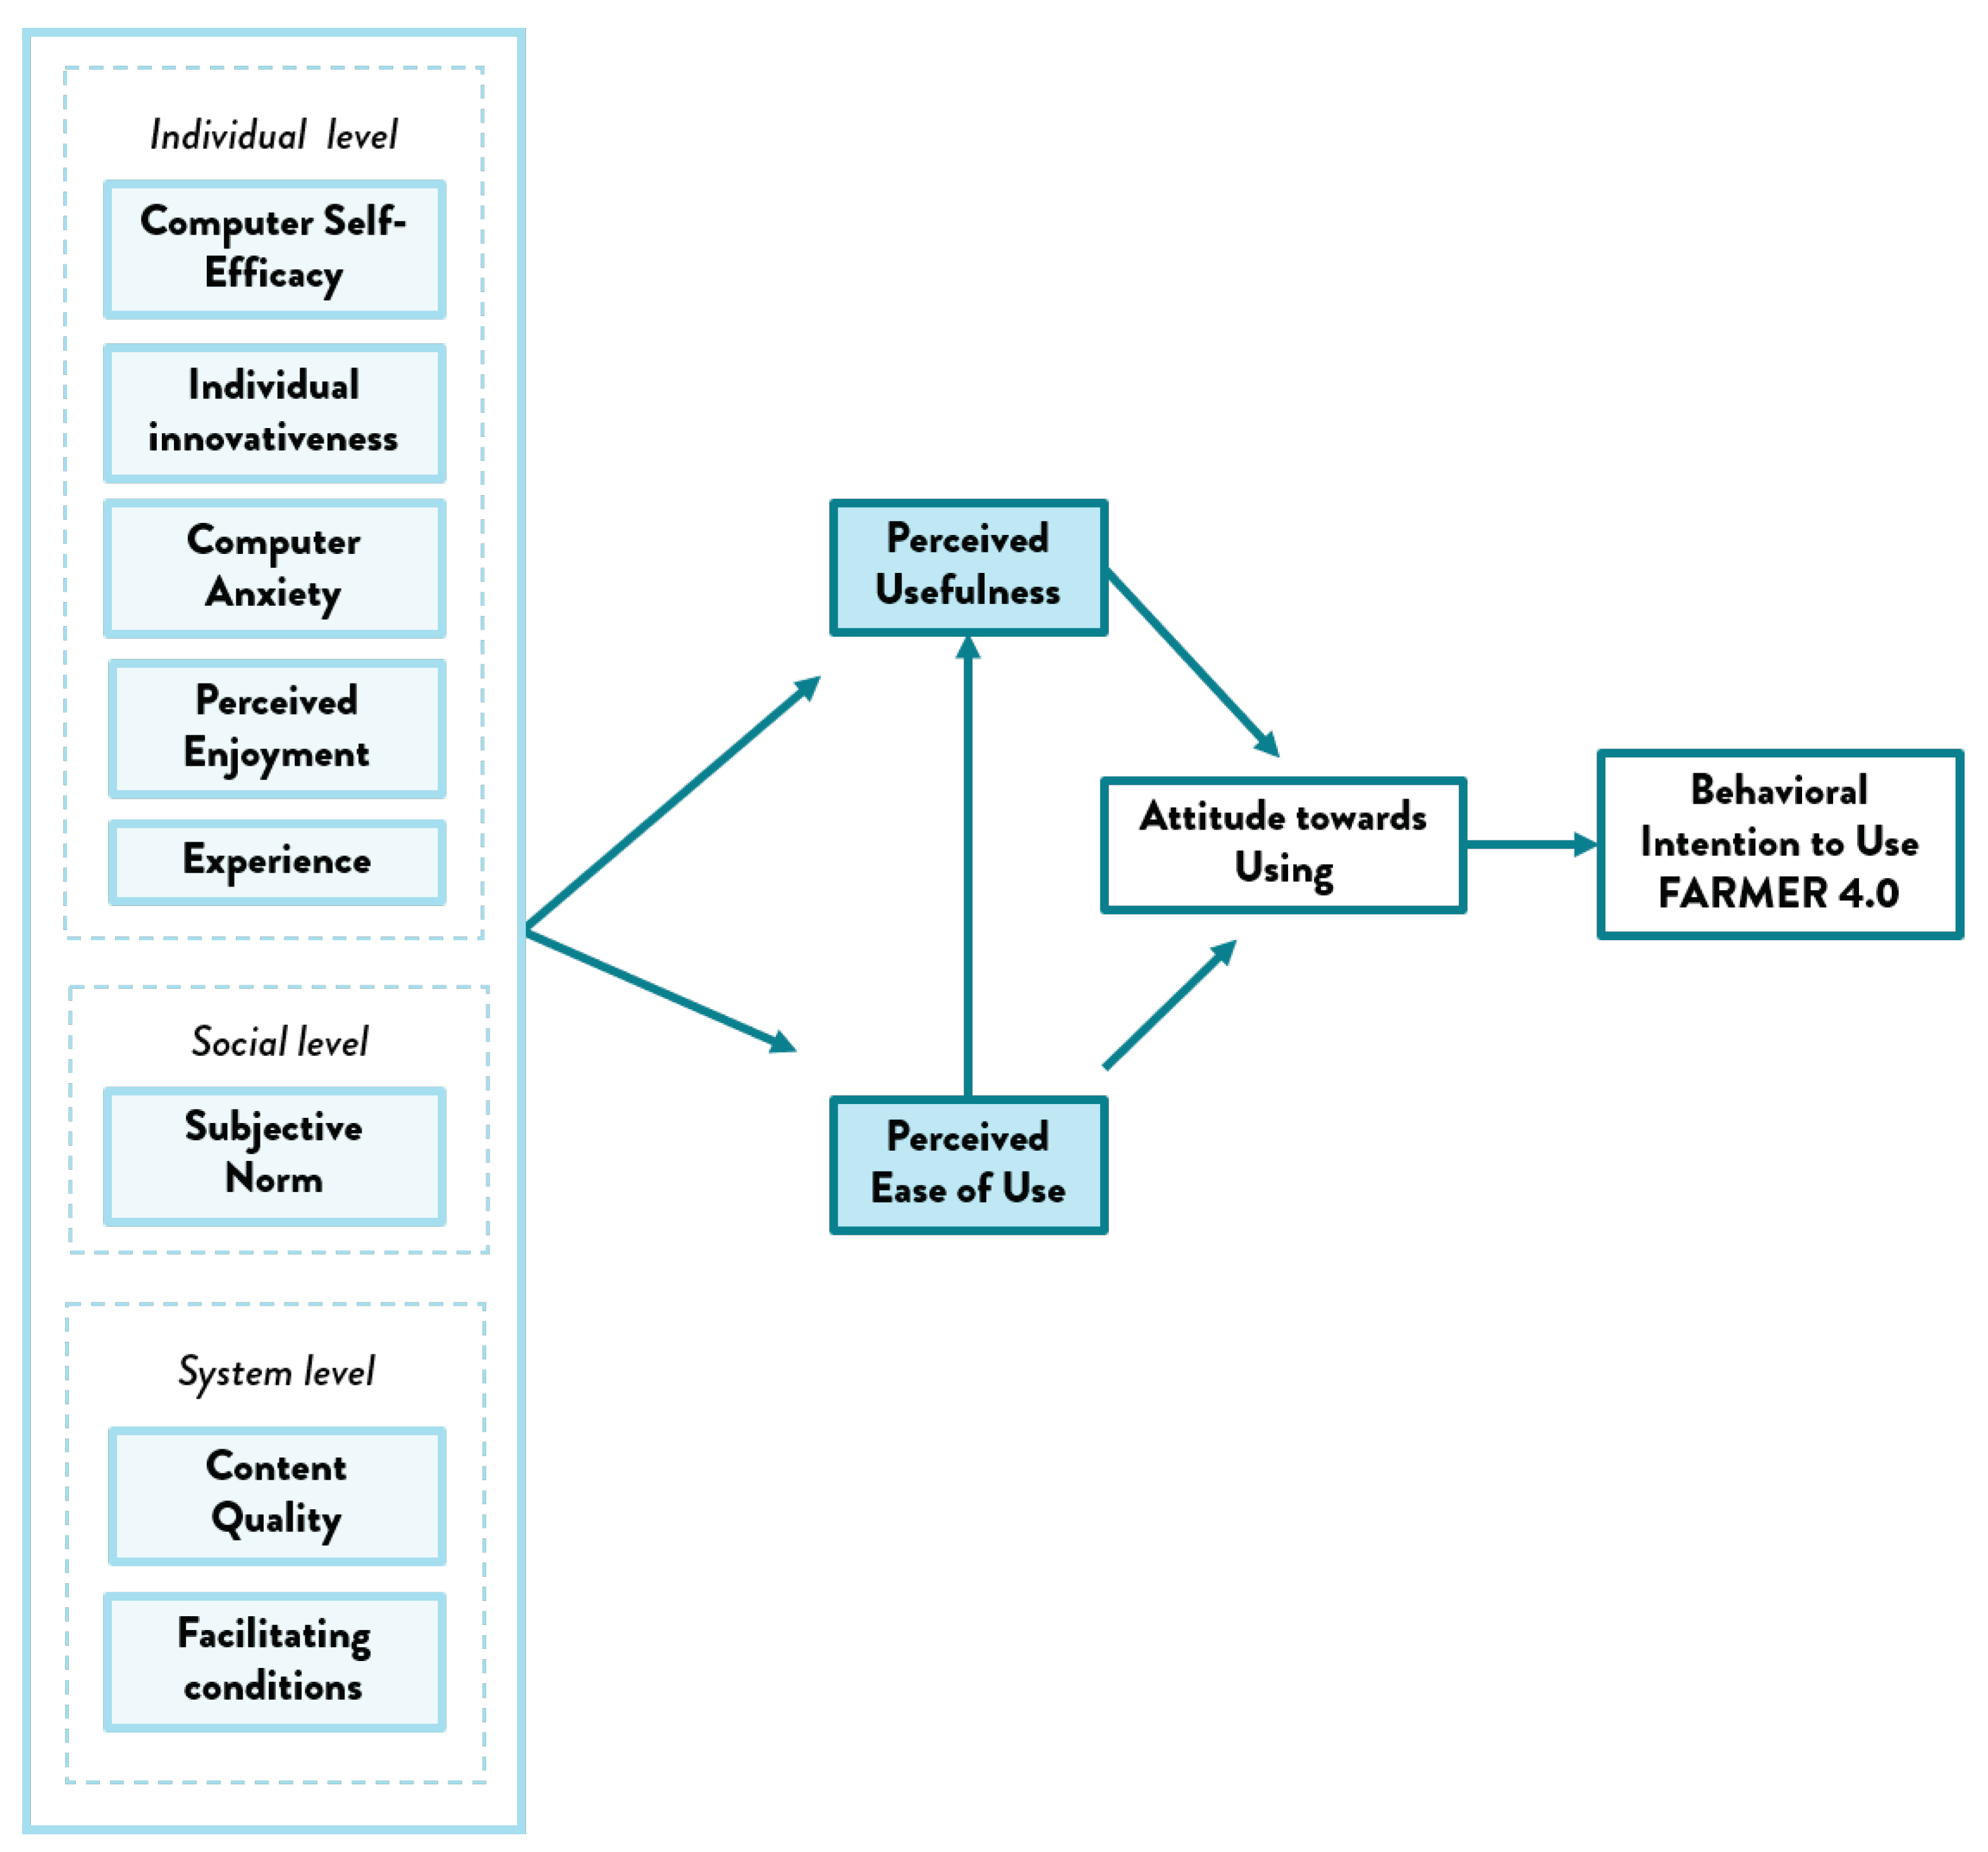
2.1. The Technology Acceptance Model

In 1985 Fred Davis developed The Technology Acceptance Model (TAM) [7] as a contribution to the field of Management Information Systems (MIS). Since its origin, the model has been a significant step forward in the research area because it enhances the design and development of information systems and represents a practical testing tool to assess systems acceptance in ex-ante use scenarios. Its applicability and validity in a wide range of contexts make it the most utilized theoretical model in Information Systems (IS) [15,16]. Figure 1 depicts the model.
To uncover the reasons behind computer-based technology adoption, Davis adapted the Theory of Reasoned Act (TRA) [17] and the Theory of Planned Behavior [18] to the technology context. Under the TRA theory, Ajzen et al. identified two factors that significantly influence the user’s intention: the attitude toward the behavior and the subjective norms. On the other hand, in the TPB theory Ajzen stated that additionally to the factors comprised by the TRA, the adoption of a given behavior is influenced by the ease or difficulty in the implementation. Generally speaking, those two complementary theories formulate that there is a sequence of causal relationships among what individuals believe about using a system and the actual use. The authors state that users’ beliefs influence the attitude, which in turn modifies the intention to use or not a given technology. The intention is the primary determinant of actual use. On this basis, Davis [7] identified two main beliefs, namely Perceived Usefulness (PU) and Perceived Ease of Use (PEOU), which are defined as [19]:
PU is “The degree to which the person believes that using the particular system would enhance her/his job performance.”
On the other hand,
PEOU is “The degree to which the person believes that using the particular system would be free of effort.”
According to the TAM [20], the two main determinants, PU and PEOU, are affected by external and context-dependent factors as shown in Figure 1. In this sense, the TAM’s consolidation has been a multi-stage process [21], and multiple extensions have been developed according to the research field. TAM 2 and TAM 3 are the prevailing and more comprehensive extensions. The TAM 2 by Venkatesh and Davis [22] focuses on the factors influencing PU and some mediating variables, while TAM 3 unveils the aspects accountable for PEOU [23]. King and He [24] elucidated that there were different types of TAM’s applications and classified them in four groups [25] based on whether the analysis focus was: (a) factors predicting PU and PEOU, (b) factors included from other technology acceptance frameworks, (c) variables with potential moderating or controlling effect, and (d) consequent factors which are the attitudes and usage. The present study belongs to the first type.

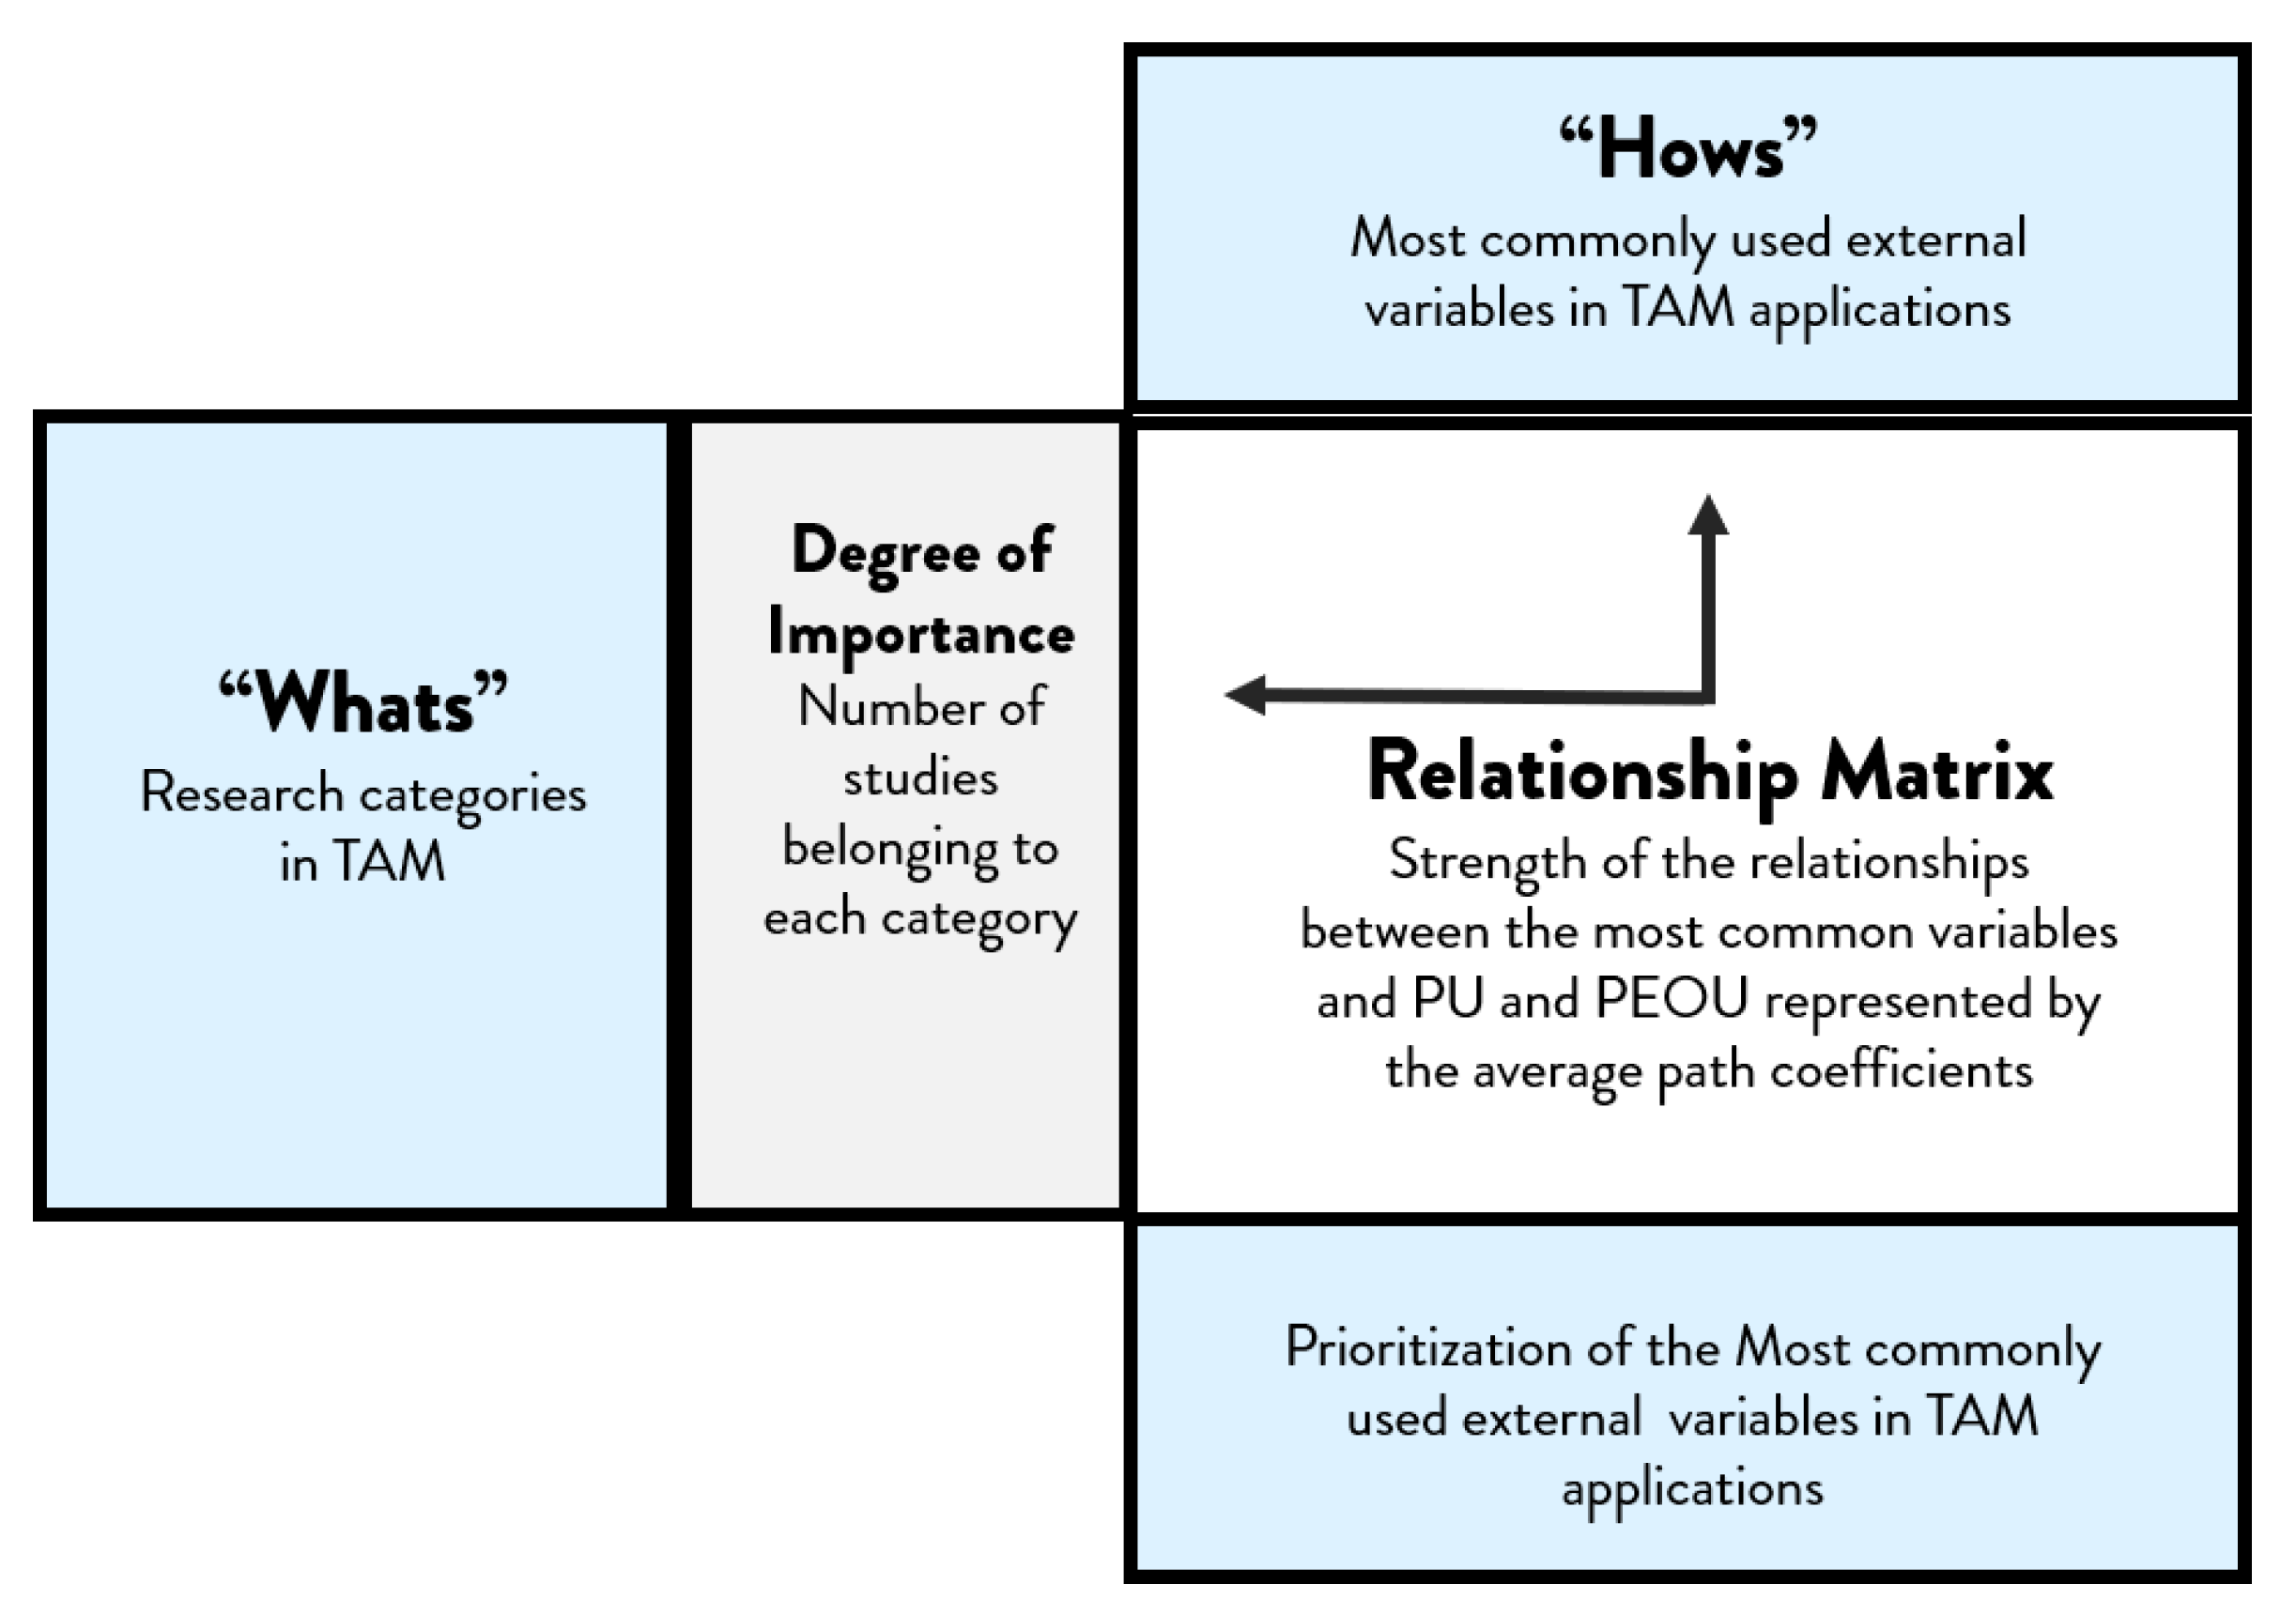
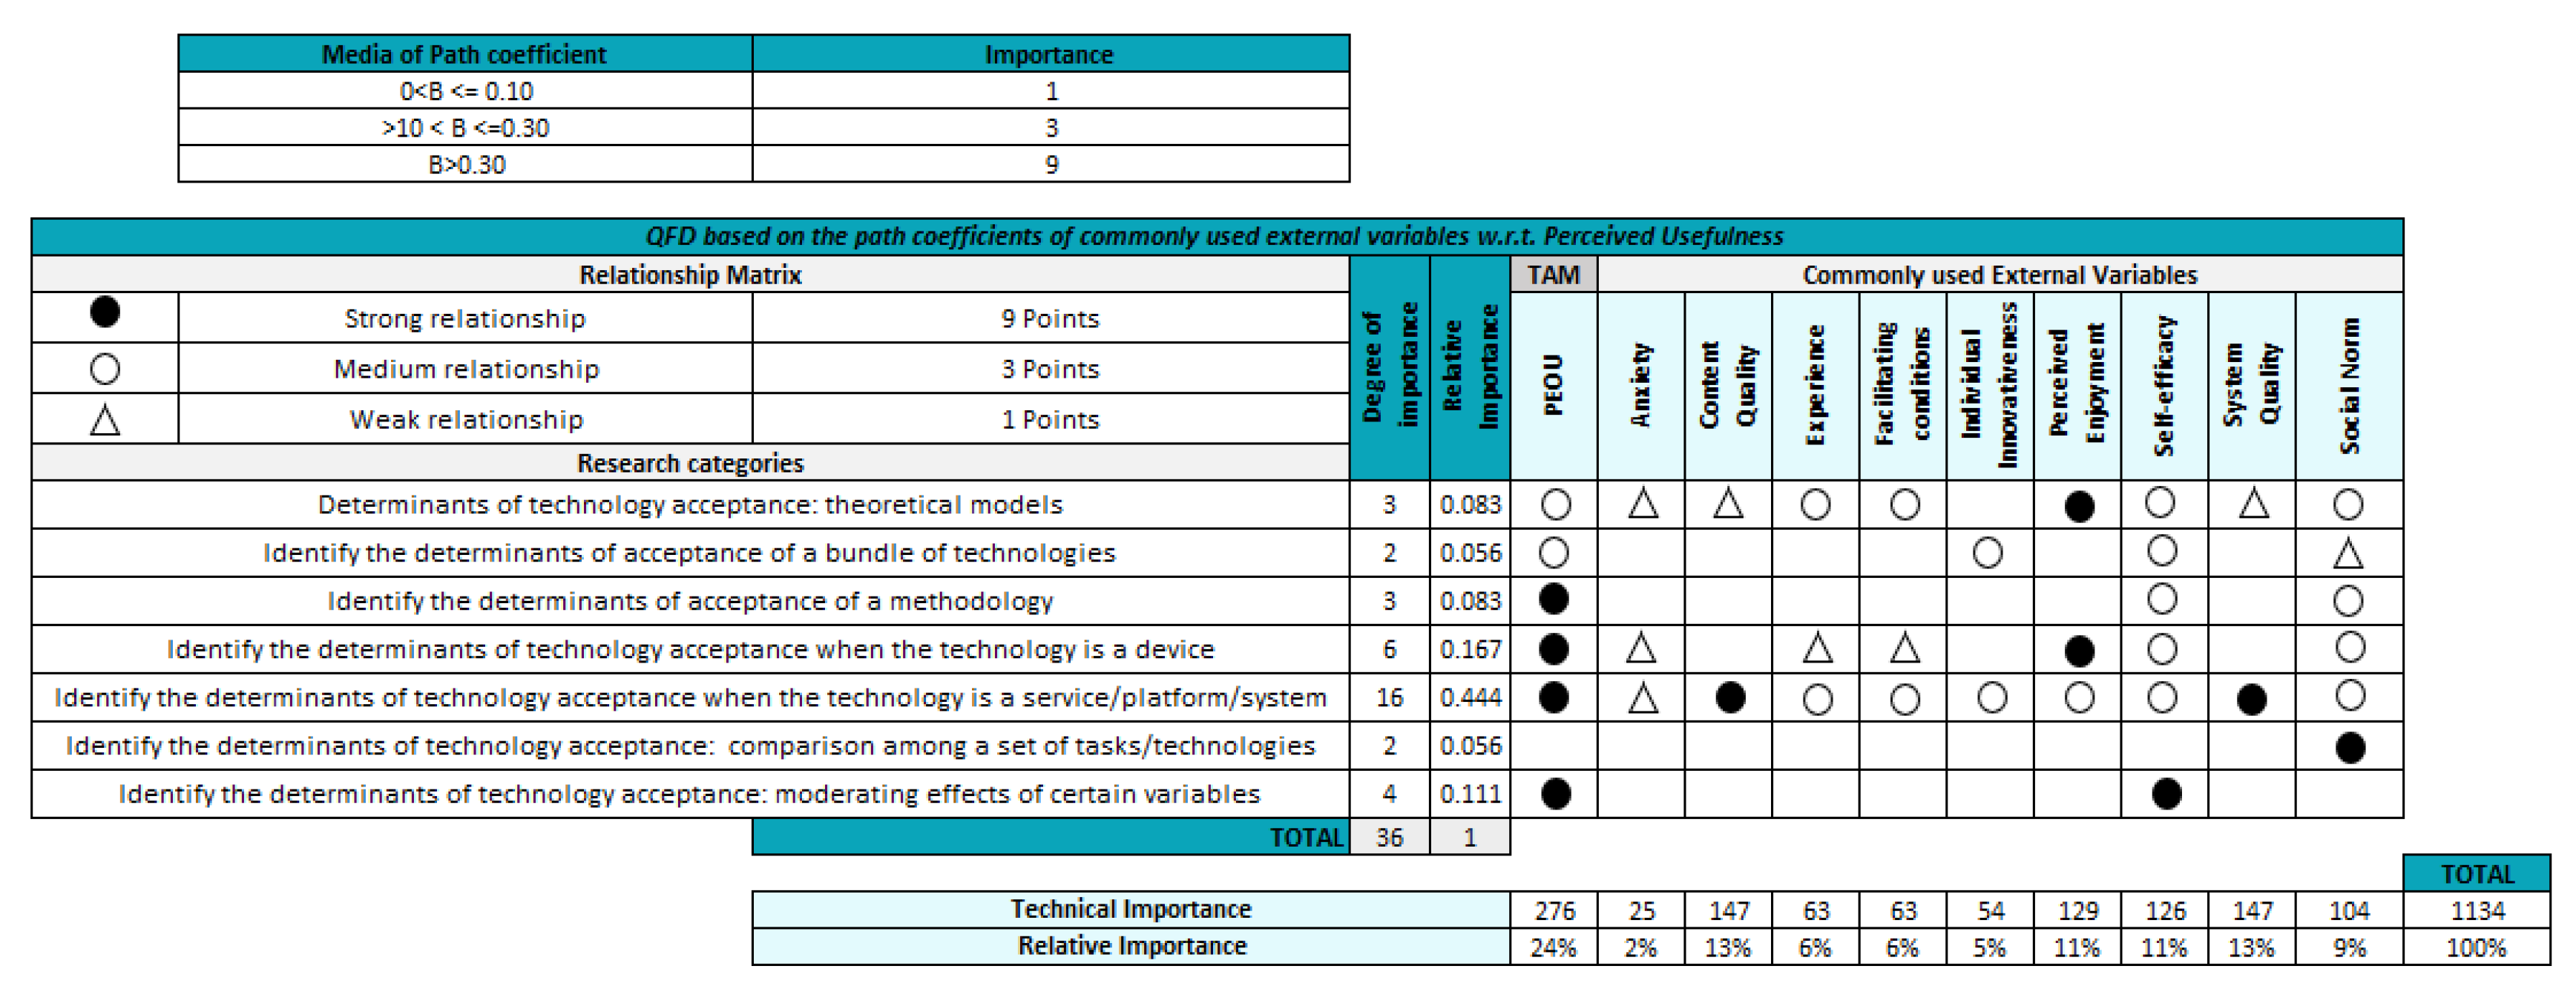
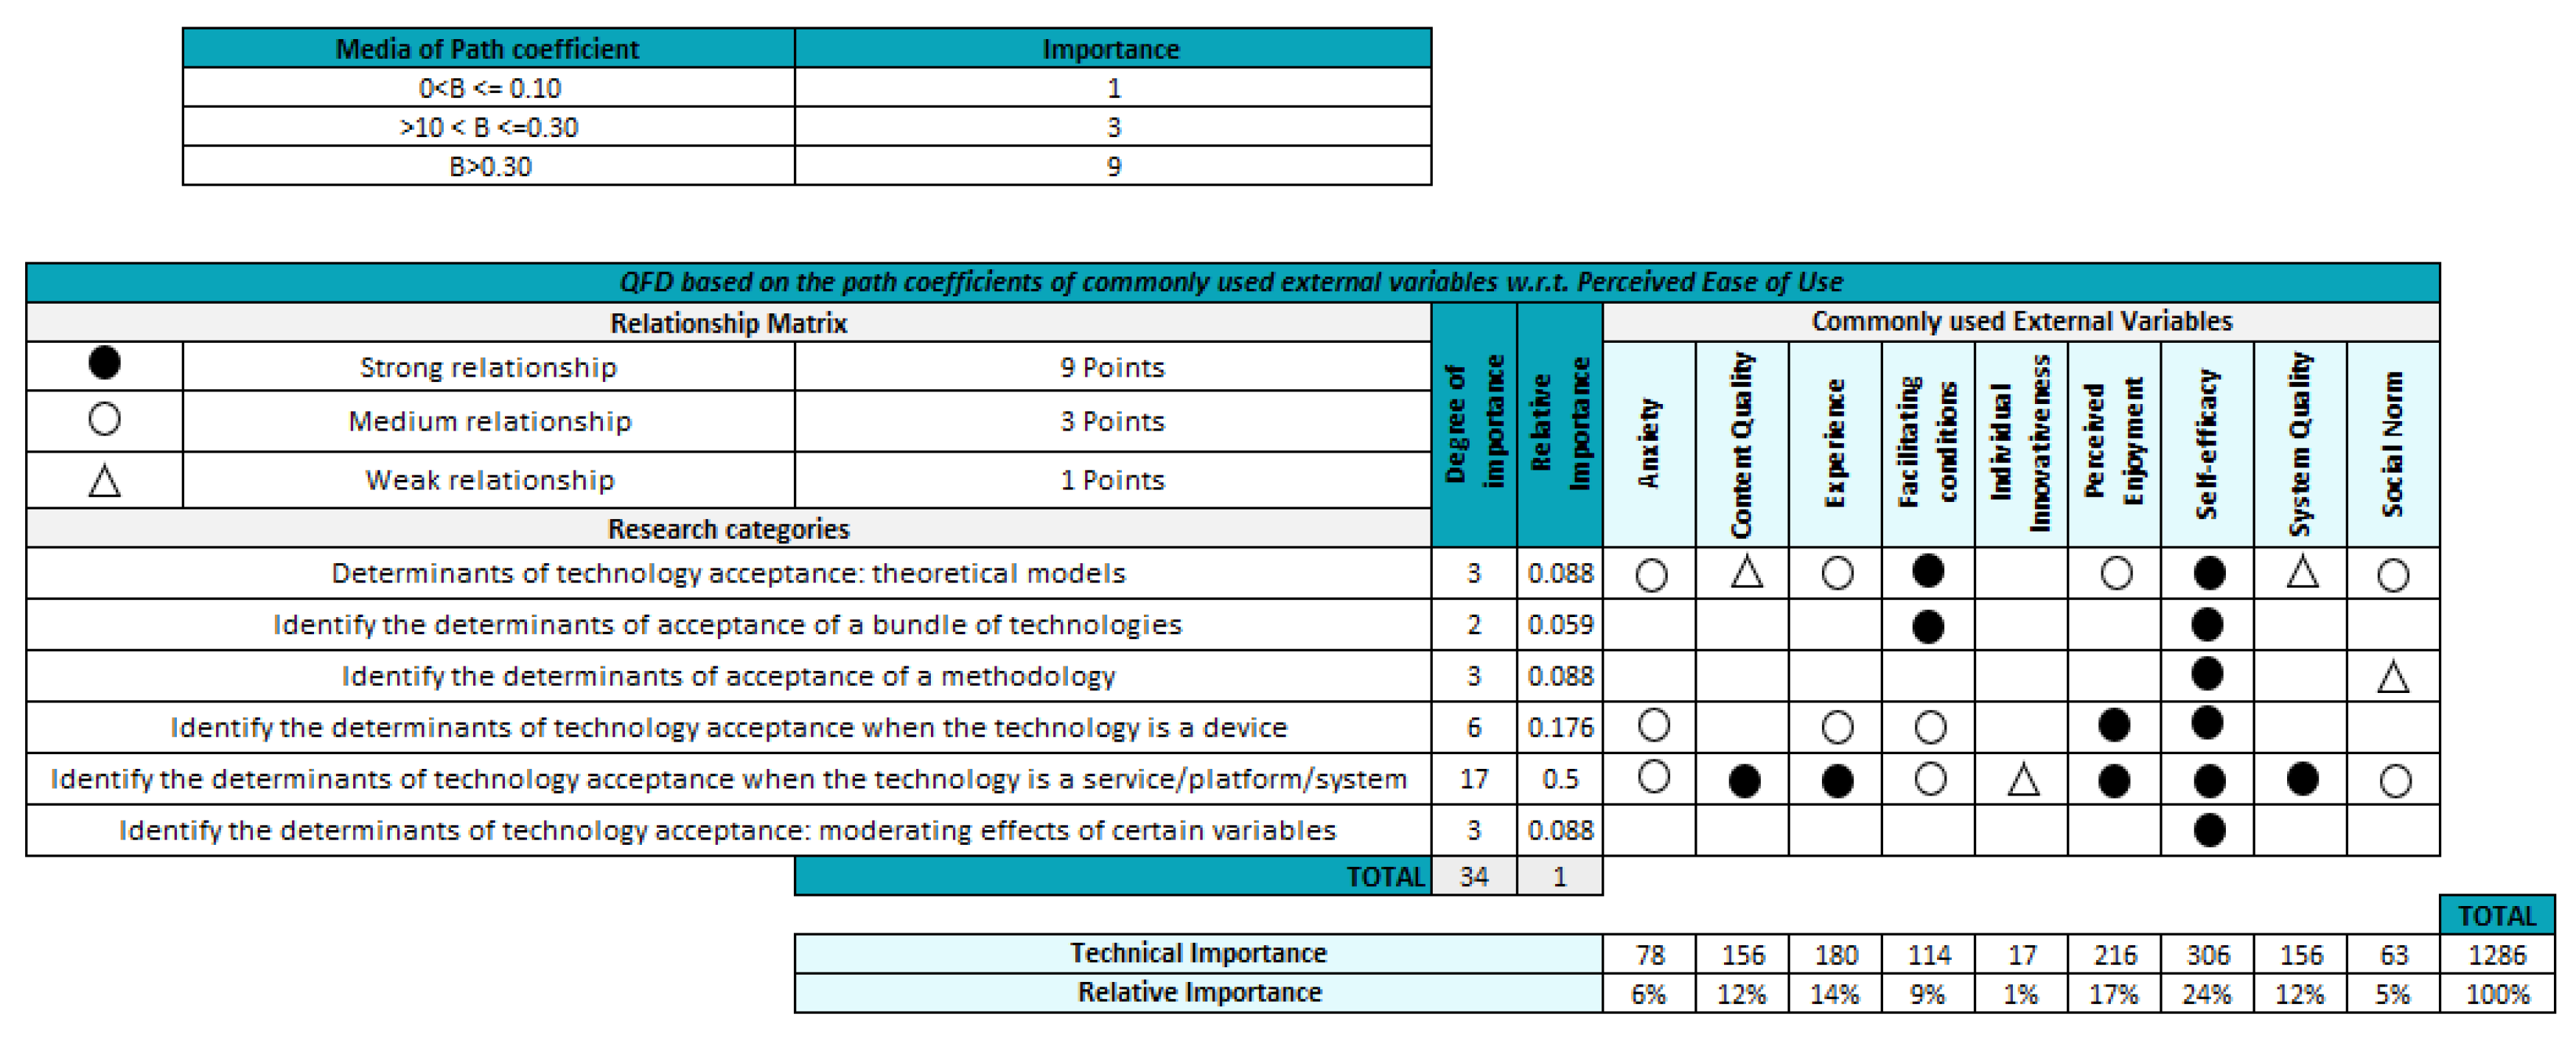
2.2. The Quality Function Deployment
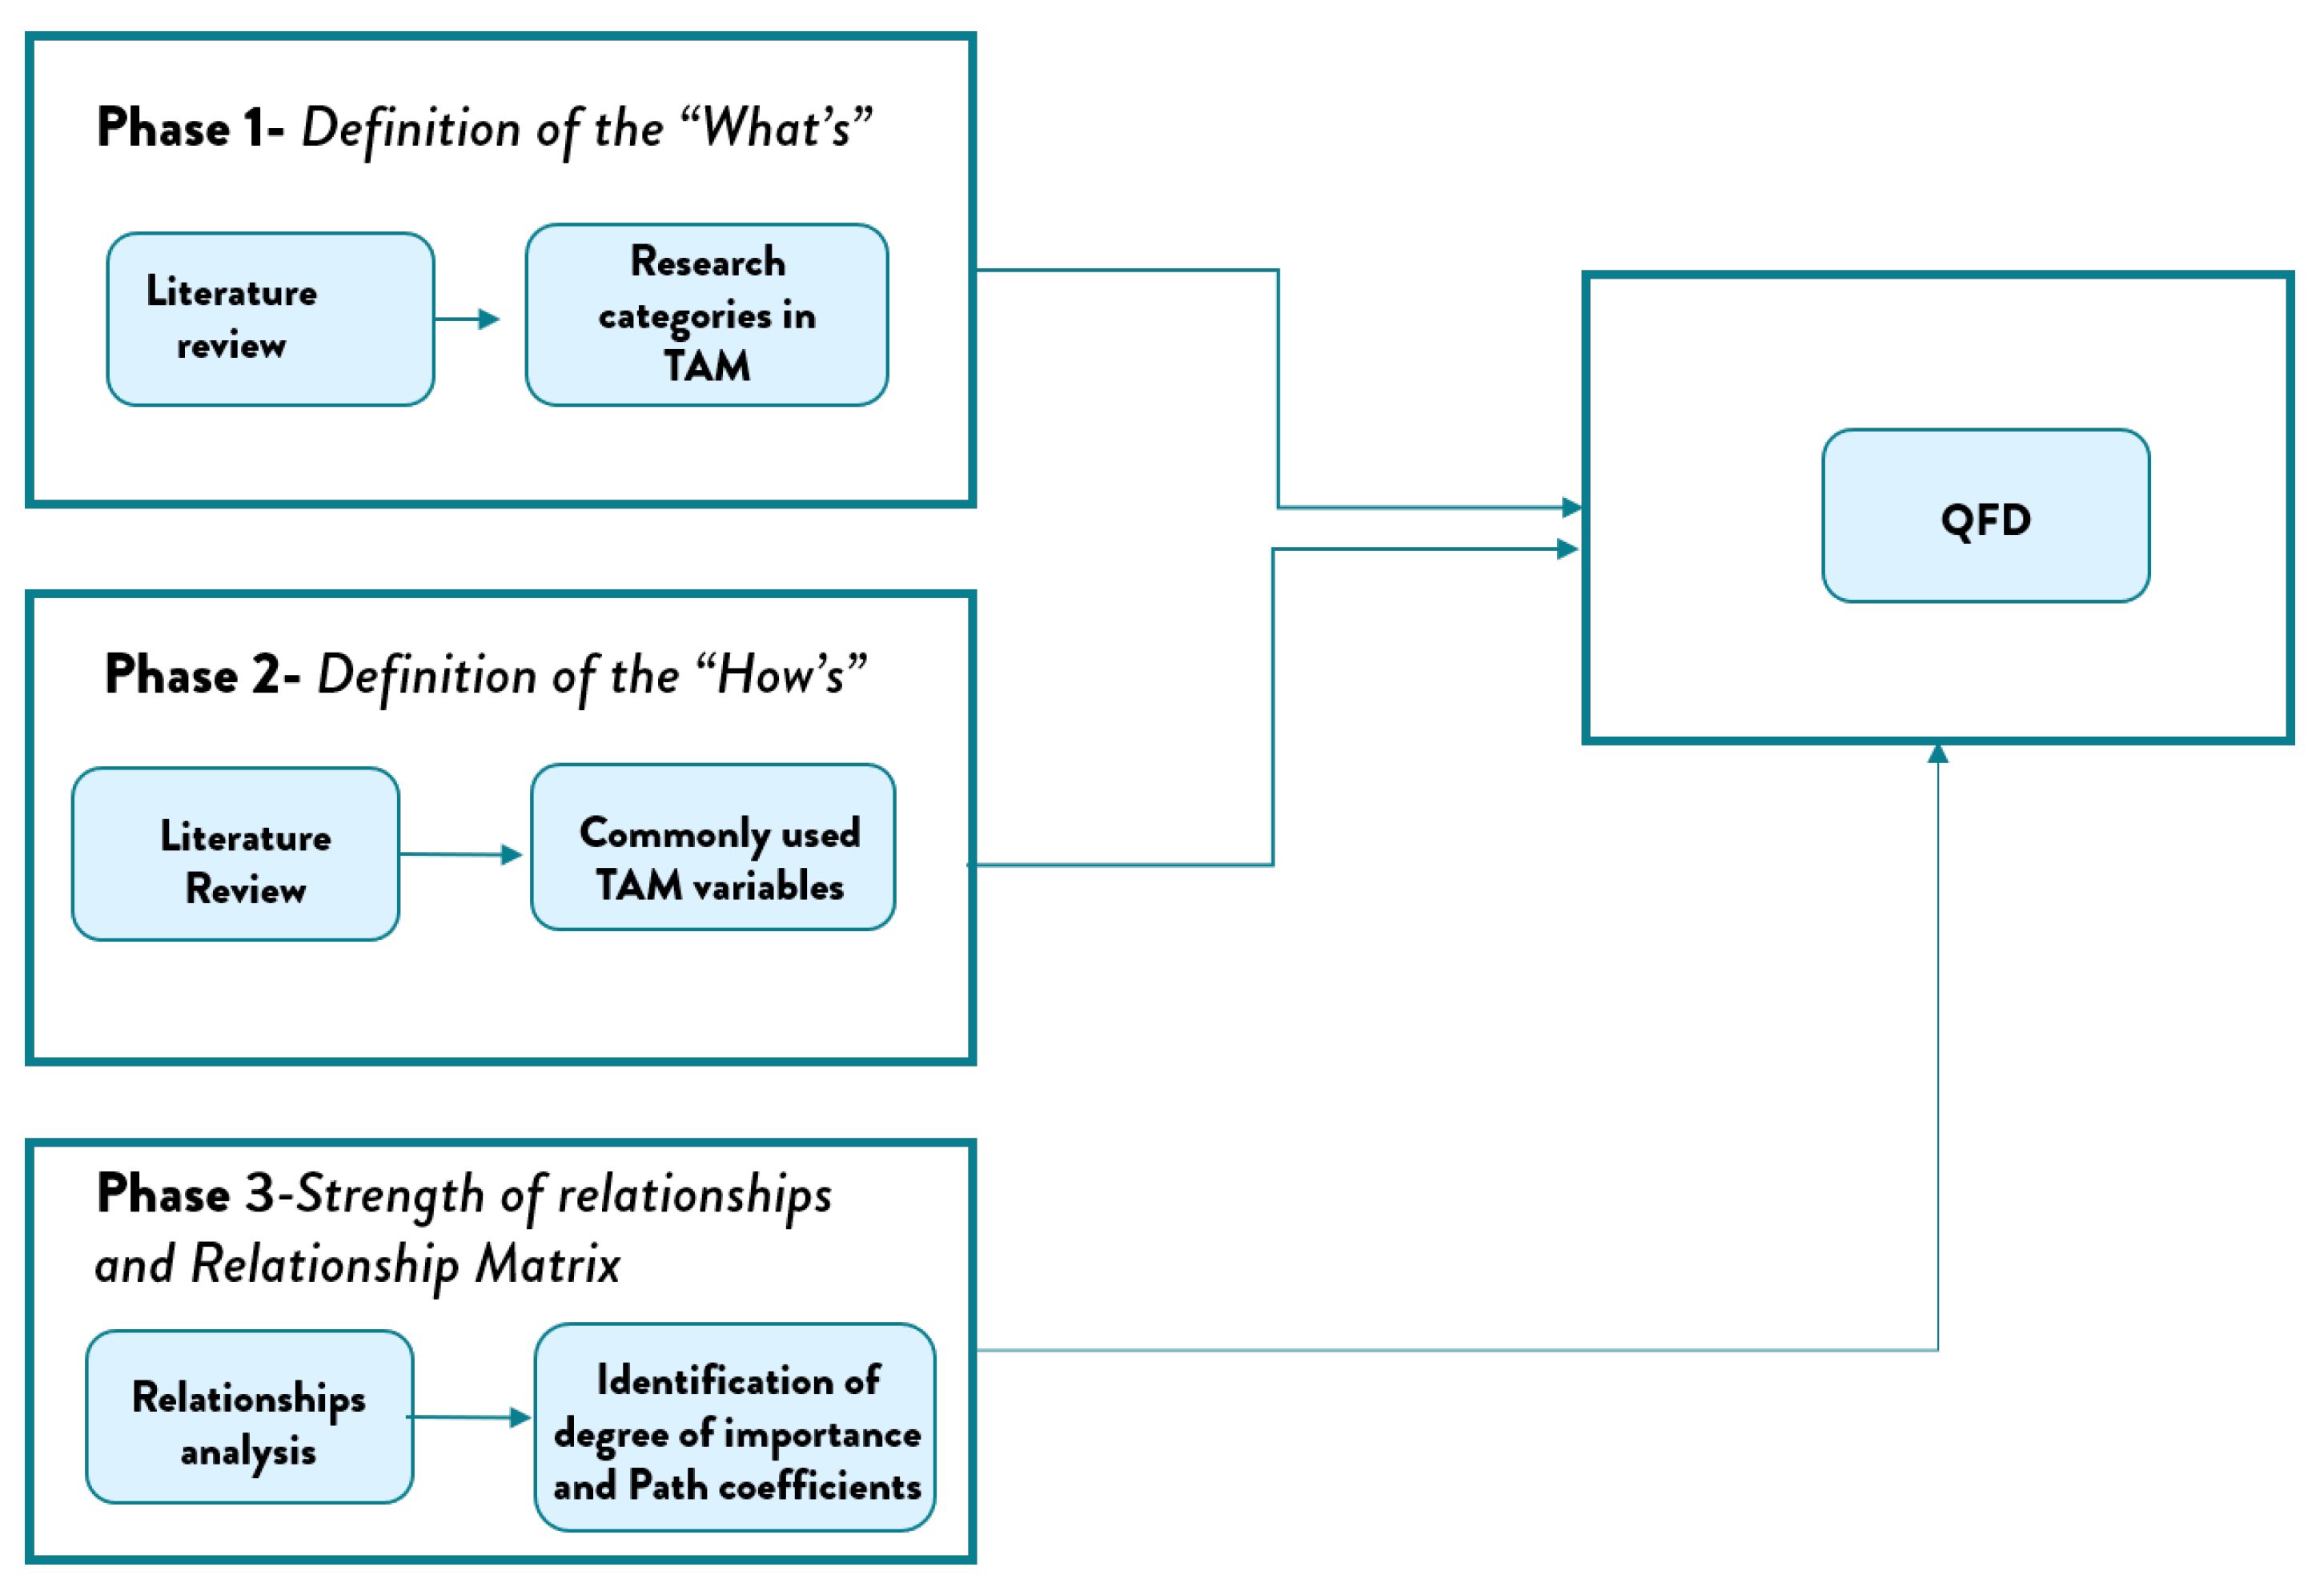
The Quality function deployment (QFD) is a practical customer-driven tool particularly appreciated for product design and development [26,27,28]. This framework was introduced in 1960 by Yoji Akao and appropriated by Mitsubishi in 1972 [29,30,31]. The general purpose of the QFD is to act as a bridge between what customers want (Customer Requirements (CRs)) and the manners in which products or services will respond with their design features (Technical Characteristics (TCs)) to those desires. Therefore, the QFD provides a systematic structure to map user needs and identify and prioritize design parameters to address those needs from an organizational perspective: there will be the assessment of the impact of design characteristics on customer needs, as well as the correlations among design features and the corresponding prioritization. [26,32,33,34,35].
Many authors have implemented the QFD in their studies addressing the design of products and services with particular focus on customer experience and alternative ways to capture user’s feedback as in the works by Iranmanesh et al., Choi et al., Vezzetti et al., Violante et al., Sun et al. [36,37,38,39,40]. The reputation of the QFD as a reference framework for design and quality management can be attributable to the multiple advantages it offers. Dolgun and Köksal [35] investigated the main benefits of the framework reported in the literature and among the most outstanding they found: (i) improves customer satisfaction by granting users involvement during the design process, (ii) allows a more informed and documented decision-making regarding customer demands and the company possibilities to satisfy them, (iii) strengthens team communication, (iv) reduces time to market and costs by minimizing the risk of errors.
In general the QFD offers the possibility to systematically identify fundamental aspects in the analysis and depict the variables of interest in the same layout, rank them, and examine the existing relationships. On this basis, we considered the QFD to be the most appropriate framework to give a solid foundation to our study, assuring a user-centered perspective.

3. Method

For the analysis of the literature the study was based on QFD and structured in 3 phases (Figure 2): definition of research categories in TAM, identification of commonly used TAM variables, and analysis of the strength of the relationships represented by the path coefficients.
For the research purposes we conducted a literature review of theoretical and empirical studies within the last ten years and grouped them into seven categories according to the topic and the research perspective. Papers were selected similarly to the quantitative meta-analysis proposed by Abdullah and Ward [6] and adapted for this study, to identify commonly used external factors in TAM extensions in e-learning, agriculture and VR. In the third phase a more strict selection of papers was done in order to analyze the degree of importance of the research categories (What’s) and the strength of the relationships between commonly used TAM variables (How’s) and the two main constructs of TAM, PU and PEOU. The degree of importance is represented by the number of works belonging to each research category. The strength of the relationships between most common external variables and PU and PEOU is represented by the path coefficient. Therefore, only studies reporting the path coefficients were considered. Finally, we gathered the previous information to construct the QFD matrix proposed in Figure 3. The papers’ selection and classification process is explained in detail in Figure 4.

4. Identification of Commonly Used External TAM Variables in e-Learning, Agriculture and VR Applications

To analyze the current state of the art of the technology acceptance model and apply QFD, we followed the selection criteria mentioned in the methodology and obtained a first sample of 67 papers. The selected works were further analyzed to identify types of applications and the recurrent variables used in TAM extensions.

4.1. Phase 1—Definition of the “What’s”

We started by analyzing the researchers’ perspectives on the main objectives for the implementation of the TAM. In our study’s QFD application, the customer requirements are represented by the different topics that our potential customers, i.e., the researchers, want to approach by using the TAM. We found that the topics could be divided into seven categories addressing the determinants of the acceptance of innovations as shown in Table 1.

4.1.1. Technology Acceptance: Theoretical Models

Works classified under this category include extensive literature reviews whose objective was to propose theoretical models to predict and evaluate the technology acceptance or systematically analyze previous empirical research. Abdullah and Ward [6] developed a General Extended Technology Acceptance Model for e-learning (GETAMEL) by analyzing the external variables used in TAM extensions from the perspective of technology and user types. Similarly, Salloum et al. [41] explored the literature in the field of e-learning to identify the most commonly used external factors explaining students’ acceptance. The resulting model was validated with students of five universities in the United Arab of Emirates (UAE). Wingo et al. [42] organized a literature review considering each one of the constructs of the TAM2 and used the results to evaluate faculty’s adoption of online teaching practices. In this same context, Scherer et al. [43] conducted a throughout literature review to deepen and synthesize TAM studies in digital technologies in education. The acceptance of everyday technologies in the context of education, such as mobile technologies, have been analyzed using TAM as in work by Sánchez-Prieto et al. [44] who developed a model to evaluate teachers’ intention to use mobile technologies in formal education. A more profound analysis of TAM applications in M-learning is presented in the research by Al-Emran et al. [25]. In the Virtual reality field, Tom Dieck and Jung [45] adopted a qualitative approach to identify the external dimensions influencing the acceptance of a mobile augmented reality application. The results were included in an extended TAM, especially useful for virtual reality innovations within the tourism sector.

4.1.2. Acceptance of a Bundle of Technologies

Empirical works grouped under this category measured the acceptance of a set of available technologies and practices analyzed as a whole and without making specific distinctions of any nature. For instance, Silva et al. [46] recognized the complementarity existing among sustainable agricultural practices and studied the adoption and use of Integrated Production technologies by Brazilian common beans’ farmers. In an attempt to measure the potential acceptability of smart farm technologies for guava farmers in Thailand, Tubtiang and Pipatpanuvittaya [47] developed and validated an extension of TAM. Analyzing these technologies as a bunch was fundamental to determine the impact of their implementation in the farming supply chain. Far and Rezaei-Moghaddam [48] explored the experts, i.e., personnel and consultants’ intention to use precision agricultural technologies (PA). Since PA is defined as a combination of information and communication technologies allowing the technical and environmental optimization of resources in agriculture [49], we classified this study belonging to this category. Another bundle of techniques is that consisting of the available tools for food manufacturing. The paramount role of the food processing sector to overcome economic development challenges of the increasingly growing world population aroused the interest of Okumua et al. [50] whose study focuses on the acceptance of food processing technologies by micro and small entrepreneurs in Kenya. A recent work by Rezaei et al. [51] assessed the adoption of Integrated Pest Management (IPM) practices by Iranian tomato growers. In the context of the study, PEST practices include cultural, mechanical, chemical, and biological strategies to reduce and refrain the negative impact of plant pests, improving farm sustainability [52]. As for the e-learning sector, Nam et al. [53] applied the TAM to investigate the ultimate effect of its constructs on the acceptance of assistive technologies by special education teachers. According to the definition provided by Cowan and Turner-Smith [54], assistive technology covers any device or system that makes possible the execution of a task safely and facilitates the performance, impossible to obtain otherwise.

4.1.3. Technology Acceptance When the Technology Is a Device

The TAM was initially conceived as a framework to understand the grounds for computer technology acceptance [7]. In keeping with its initial purpose, Teo et al., Teo [55,56] validated the TAM in an attempt to identify the factors predicting pre-service teachers’ intention to use computers at the National Institute of Education in Singapore, and Wong et al. [57] studied teachers’ intention to use computers in their pedagogical practices in a university in Malaysia. Analogously, Sánchez-Prieto et al. [58] examined the behavioral intention of primary education teacher students of the University of Salamanca, towards to use mobile devices for teaching practices to be developed in the future. Cellular technologies are attractive tools for educational purposes and also have a fundamental role in fostering rural development. With that in mind, Islam and Grönlund [59] surveyed the adoption reasons for mobile phones among farmers in Bangladesh. The proposed Rural Technology Acceptance Model (RUTAM) pointed out the significant influence of social ties at the early stages of adoption. Carrying on with the agricultural sector, Zhou and Abdullah [60] delved into the attributes responsible for a favorable reception of solar water pump (SWP) technology among rural farmers of Pakistan. The outcomes confirm the influence of perceived usefulness and perceived ease of use on SWP usage. On VR technologies, the TAM was tested to determine the acceptance of googles [61] and virtual reality devices in general [62]. In both cases, perceived enjoyment was a significant and positive predictor of attitude towards using and purchasing.

4.1.4. Technology Acceptance When the Technology Is a Service/Platform/System

The number of articles belonging to this category is significantly higher than the others, totaling thirty-one works. The recurrent TAM applications of this nature can be due to the extensive Internet use and its paramount role in developing new technologies [63] thanks to the advantages it offers, such as speed and reliability [64]. This categorization contains TAM applications to predict and evaluate the acceptance of specific software, systems, or platforms. The most customary TAM validation within the e-learning sector is to assess the acceptance of learning management systems (LMS) as in the works by Alharbi and Drew, Shin and Kang, Calisir et al., Mohammadi, Al-Rahmi et al., Binyamin et al., Al-Adwan et al., Fathema et al., Chang et al., Al-Gahtani and Lee et al. [65,66,67,68,69,70,71,72,73,74,75]. Regarding learning environments, contributions on TAM research have been made by Yeou, Estriegana et al. [76,77] and Shyu and Huang [78] and authors like Wu and Chen and Revythi and Tselios [79,80] have investigated the intention to benefit from online courses. Understanding users’ motivations that trigger instructional resources acceptance is a key process in developing learning platforms and systems. Amongst the examined tools are Compliant Learning Object (SCLO) [81], educational wikis [82], web feeds [83], platforms supported by google sites and apps [84], as well as apps such YouTube for learning assistance [85]. Moving to the agricultural field, Vidanapathirana et al. [86] tested an Online Agro-technology Diploma program from the TAM perspective. Moreover, innovative technologies like mobile-based agricultural services and information systems were under the scope of analysis of the work by Verma and Sinha, Verma and Sinha [87,88] and Mercurio and Hernandez [16]. Some other interesting TAM implementations evaluated farmers’ intention to use a microfinance platform [89], the acceptance of a QR Code for a food traceability system [8] and the usage of Cloud Computing technologies for farming in Ireland [90]. As for the VR sector, the contributions made by Huang and Liao and Huang et al. [91,92] explored the determinants of acceptance of augmented-reality interactive systems.

4.1.5. Comparison of the Acceptance among a Set of Tasks/Technologies

TAM application in this type of study is not very diffused. Only three papers were found to analyze the TAM to understand users’ preferences of specific techniques, technologies, or tasks over others. Broadly speaking, these studies evaluated how the TAM constructs, such as perceived usefulness and perceived ease of use, tilted the balance in favor of some innovations. In the agriculture field, Naspetti et al. [93] contrasted three environment-friendly production techniques: Agroforestry, Alternative protein source, and Prolonged maternal feeding, and validated the predictive power of perceived usefulness over the intention to use. Caffaro et al. [94] tried to understand the factors responsible for the scarce adoption of smart farming technologies (SFTs). The authors clustered some SFTs into two groups: drones, sensors for data acquisition and automatic download, and agricultural apps belonged to the first type. Agricultural robots and autonomous machines formed the second one. They also investigated the effect of exposure to different forms of interpersonal communication on perceived usefulness and perceived ease of use. As for the e-learning sector, schoonenboom [95] examined teachers’ intention to use a learning management system for eighteen instructional tasks. The results showed that using the LMS is preferred for some activities, mainly due to task importance, LMS’ usefulness for performing the job, and the ease of use.

4.1.6. Acceptance of a Methodology

We found theoretical evidence that the TAM has been validated not only at product/service level but also it has the potential to predict the acceptance at process/practice level. Specifically, this category gathers papers analyzing the implementation of a particular methodology by looking beyond the mere technologies involved. Sharifzadeh et al. [96] examined the acceptance of a behavioral control strategy, namely, the use of Trichogramma spp for pests control by Iranian rice farmers, broadening the existent research body on crop protection techniques. Bahtera et al. [97] validated the TAM to provide a strategic perspective for the use of the internet in agricultural endeavors that is frequently overlooked. The authors emphasized the outstanding importance of marketing strategies for farmers’ welfare and tried to understand the determinants of ICT use for this specific purpose. In the learning sector, e-learning and mobile learning, as well as mobile-based assessment, were analyzed from a methodology perspective. Several investigations look at students’ acceptance of e-learning as a novel learning method. Punnoose [98] dug into the determinants of student’s intention to study remotely by polling a sample of master scholars from the Assumption University of Thailand. This concern was also discussed in the research by Ibrahim et al. [99] validated with 95 undergraduate students at Tunku Abdul Rahman University College (TARUC). As for mobile learning, significantly fewer studies have addressed this methodology and analyzed its advantages and shortcomings over e-learning. Park et al. [100] investigated the process by which Konkuk university students adopted mobile learning and focused on the possibilities for learning evaluation through handheld or palmtop devices. Nikou and Economides [101] validated the TAM in the context of mobile-based assessment.

4.1.7. Technology Acceptance Analyzing the Effect of Certain Moderating Variables

In addition to the original TAM determinants, PU and PEOU, papers under this category give special attention to the moderating role of some variables being age and gender the most used. Ahmad et al. [102] applied an extension of the TAM in a public university in Malaysia to understand how age and gender affected the acceptance of computer-based technologies by faculty members. The results evidenced that the causal relationships among exogenous variables and the TAM were invariant for female and male staff members. However, age seemed to have moderating effects over the use of technology. In line with the previous study, Wong et al. [103] analyzed the influence of gender in student teachers’ intention to use computers. Once more, the findings showed that gender had no moderating effects within the context of the study. Unlike the precedent researches, Padilla-Meléndez et al. [104] found that females had a higher perception of playfulness and attitude towards the use of blended learning environments than males, and males, on the other hand, seemed to have higher intention to use this type of technology. Tarhini et al. [105] explored the moderating effect of age and gender in the students’ acceptance of a Web-based learning system at Brunel University in England. The study outcomes reflected that younger students had a higher perception of usefulness, while older users perceived the system more comfortable to use. Gender was also found to affect some of the relationships within the extended TAM. In addition to gender influence on TAM factors, Al-Azawei and Lundqvist [106] considered the effect of students’ learning styles defined by Felder and Silverman [107], namely, active, sensing, visual and sequential learners, on user satisfaction towards an online learning system. No gender nor learning styles reported significant effects. Likewise, Al-Azawei et al. [108] assessed the impact of learning preferences in a blended e-learning system (BELS). They found no mediating relationships among those psychological traits and learner satisfaction or e-learning adoption. From a cultural approach, Tarhini et al. [109] investigated the effects of four cultural dimensions of individuals on the adoption of e-learning tools by students in Lebanon. The research included the factors masculinity/femininity, individualism/collectivism, power distance, and uncertainty avoidance within the TAM. The validation process evidenced the existing relationship between culture and social norm, perceived usefulness, and perceived ease of use.

4.2. Phase 2—Definition of the “How’s”

The aim of this phase was to identify the external variables that academics and practitioners included more frequently in TAM extensions, in order to approach the research purposes. After individuating the variables included by each one of the selected studies, we calculated the frequency of appearance of each one of the determinants. The most common variables are depicted in Table 2. The definitions of each one of the identified variables are provided in Table 3.

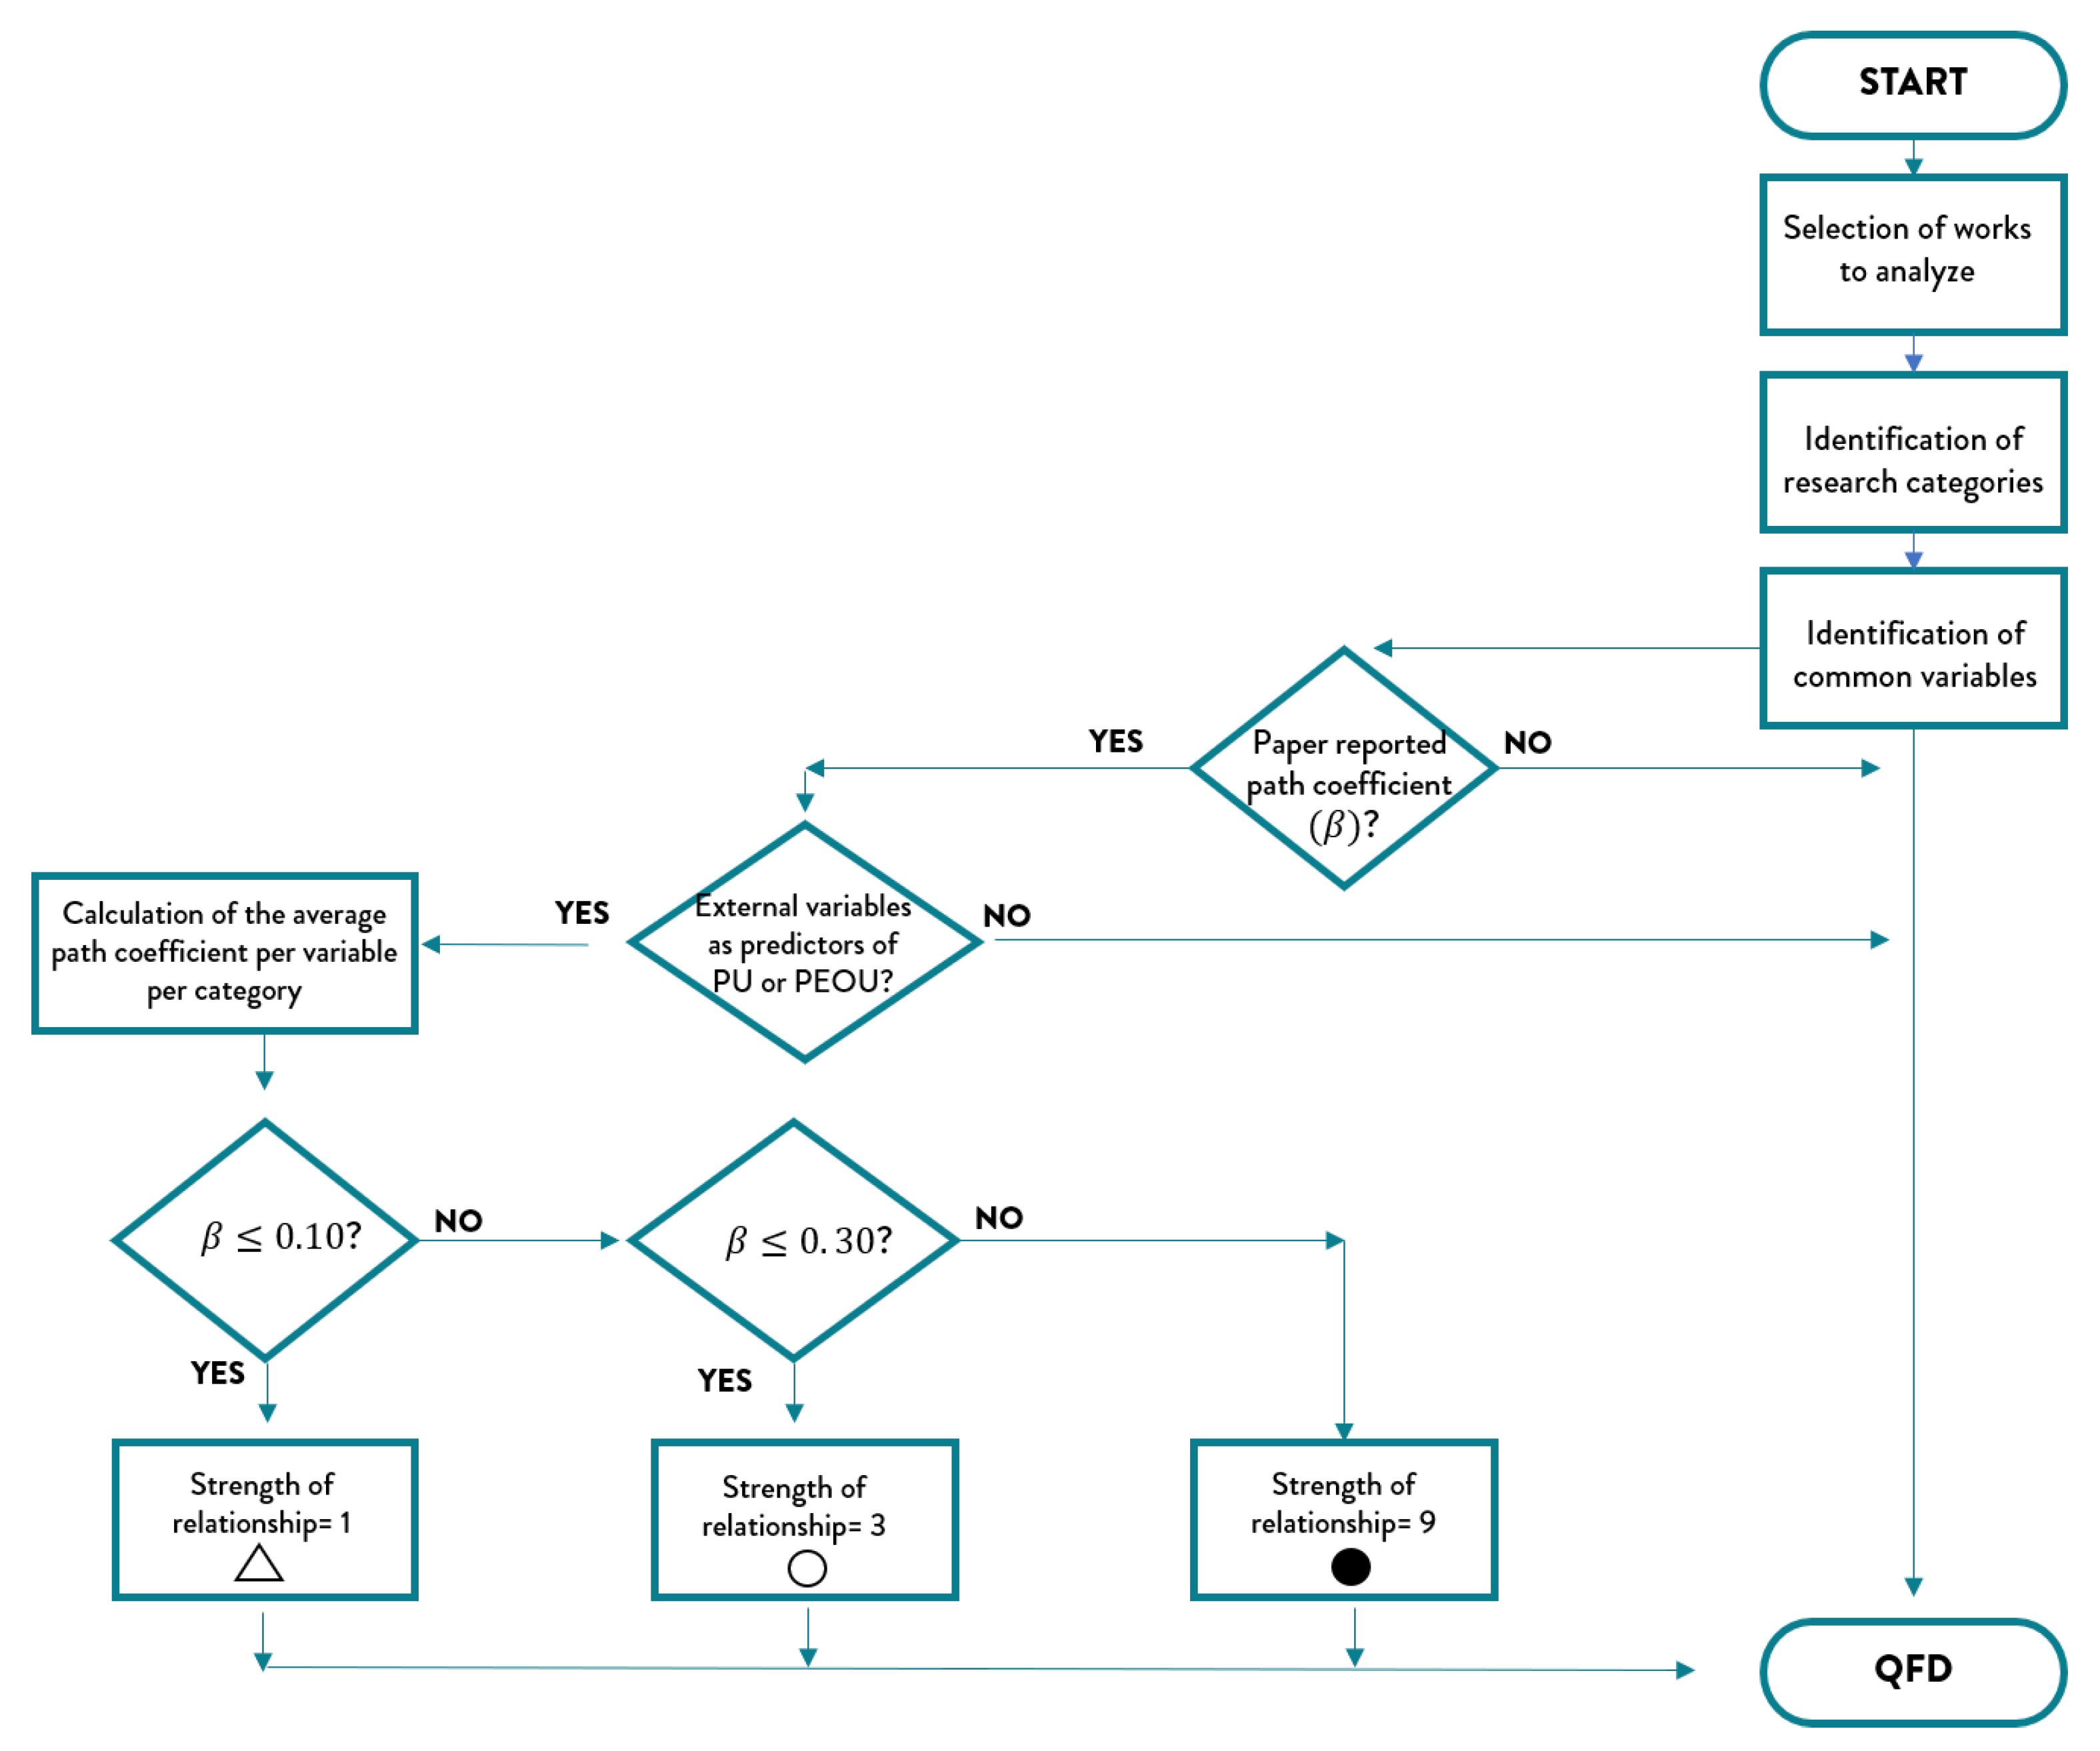
4.3. Phase 3—Strength of the Relationships and Relationship Matrix
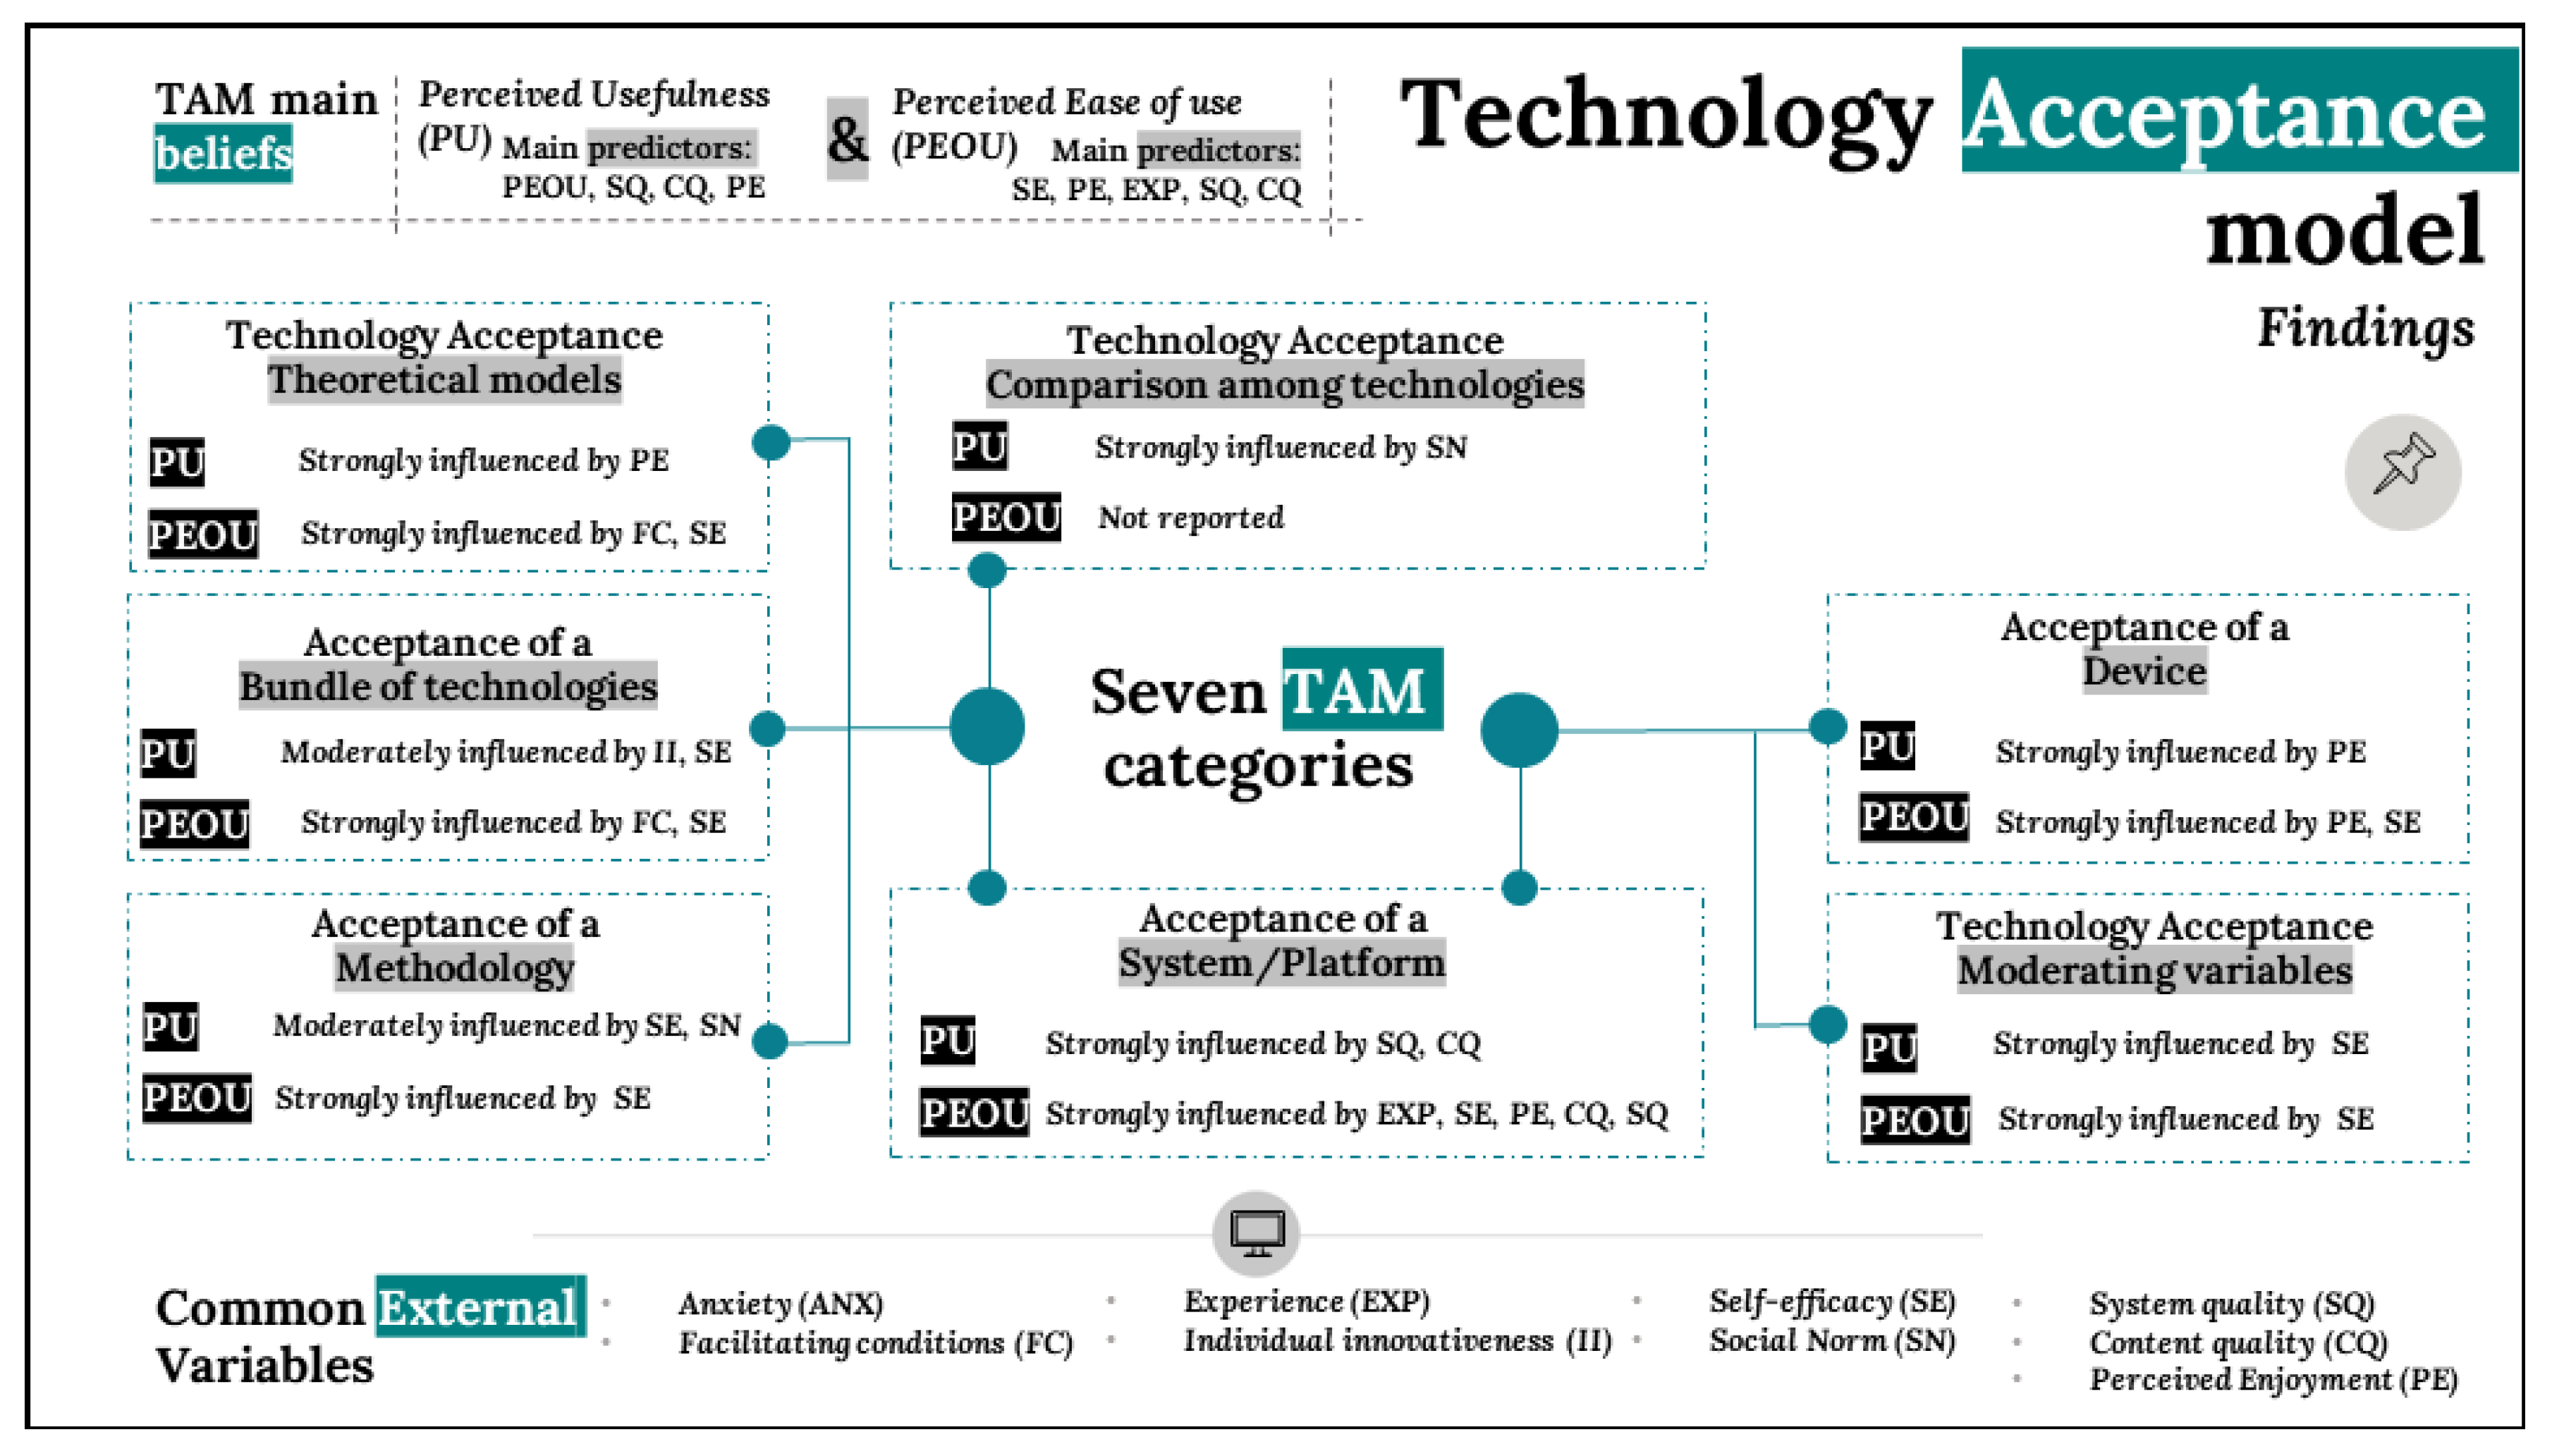
It is a common interest among academics who develop TAM extensions, to comprehend the relationships existing between external variables and TAM’s two main determinants PU and PEOU [6]. For this reason, two QFD matrices, one for each of the TAM’s two primary constructs, were constructed and considering that in the TAM, PEOU is also a determinant of PU [7], we included the construct PEOU within the PU matrix to analyze its effect. One of the most commonly reported statistical indexes in TAM studies is the Path coefficient ( β ) . Path coefficients indicate not only the strength of the relationships but also the causal effect of the common external factors (independent variables) on the dependent variables (PU and PEOU) and the effect of PEOU on PU as depicted in Figure 5 [126].
However, some of the analyzed studies did not report this information directly, and in some others, the independent and dependent variables were not directly linked. The number of works grouped in each category reporting the path coefficients is shown in Table 4. In addition, Table 4 specifies the quantity of studies reporting the relationship for each one of the TAM determinants, PU and PEOU.
Deviating from the conventional QFD matrix in which the importance of customer requirements is assigned using a Likert scale of points 1 to 5, the degree of importance of our study’s research problematics was determined based on the number of studies belonging to each category and reporting path coefficients. The relative importance was calculated as the coefficient of articles per category over the total of works reporting path coefficients.
For the relationship matrix construction, we assigned the values of the relationship between How’s and What’s using the average path coefficients between external variables and PU, external variables and PEOU and between PEOU and PU. We followed the criteria suggested by Cohen [127]. Values in the range from 0 to 0.10 included were assigned the value of “1”, reflecting a weak relationship. For indexes higher than 0.10 and up to 0.30 included, the importance was “3”, indicating a medium relationship. Average coefficients higher than 0.30 were said to have a strong link and importance of “9”.
Finally, the technical importance of external variables was calculated by the products’ cumulative sum between the degree of importance of each category and the relationships’ strength. The relative importance permitted the prioritization of the external variables. The discussion of the findings is present in the following section.

5. Discussion

To understand the external variables that could influence the acceptance of a 3D learning environment for farmers in Europe, we consulted previous TAM applications in e-learning, agriculture, and virtual reality sectors. TAM extensions on e-learning technologies have been a research topic for more than a decade [6]. On the contrary, significantly fewer studies investigated the acceptance of VR technologies, and that gap of knowledge is also mentioned in recent work by Sagnier et al. [128]. To facilitate the analysis, we considered the effects of the external variables in PU and PEOU separately. The impact of each factor per category is depicted in Figure 6 and Figure 7. As reported in Table 4, only two of the three researches belonging to the category: “Comparison of the acceptance among different tasks or technologies” provided information about path coefficients. However, none of them delved into the determinants of PEOU. On this basis, we excluded the mentioned category from the QFD matrix of PEOU. Considering that in the TAM, PEOU is also a determinant of PU [7], we included the construct PEOU within the PU matrix to analyze its effect.
In general, the findings suggest that the best predictor of PU is PEOU, followed by content and system quality, perceived enjoyment, self-efficacy, social norm, facilitating conditions, experience, individual innovativeness, and finally, anxiety. As for PEOU, it is mainly predicted by self-efficacy, followed by perceived enjoyment, experience, system and content quality, anxiety, social norm, and finally, individual innovativeness. Therefore, we can confirm that the external variables have different effects on PU and PEOU.
PEOU is not considered as external variable because it is one of the TAM’s two main determinants. Studies from the categories measuring the acceptance of a new methodology, a device, and a system or service, reported a strong predictive power of PEOU on PU. That was also the case for studies analyzing the moderating effect of some variables. A weaker but still significant influence of PEOU on PU was found in theoretical models and in cases-study evaluating the acceptance of a bundle of technologies. This study confirmed the presence of a strong and significant impact of the PEOU on PU in most cases, which validates the significance of the relationship established by Davis [7] in the original TAM.
The concept of ANX is often associated with negative feelings of nervousness, fear, and uncertainty about the outcomes of using innovations [58]. Li et al. [129] pointed out that in software applications, the effect of ANX is often analyzed, and that is evident in our study. Only works evaluating the acceptance of a device and a system or service, and theoretical extensions of the model, reported the causal link among ANX and the two main TAM determinants. The average effect size evidenced a weak relationship of anxiety with PU and a medium impact on PEOU. These results are in line with the investigation conducted by Van Raaij and Schepers [130], who reported a direct effect of ANX on PEOU and an indirect effect on PU.
CQ is a variable especially crucial in learning platforms. By designing and organizing the content in a challenging, reasonable, appropriate, and understandable manner, users’ autonomy and competence may be enhanced [101]. Solely researchers interested in assessing the acceptance of systems/platforms/or services, which belong to the same category, and theoretical works, registered the direct effect of content quality on PU and PEOU. Theoretical studies reported a weak influence of CQ in PU and PEOU. On the contrary, PU and PEOU of systems, platforms, and services are strongly affected by the CQ. The influence of CQ on PU and PEOU mentioned in the last category is in accordance with the study conducted by Almaiah et al. [131] who reported that CQ has positive effects on the two TAM beliefs.
According to Venkatesh and Bala [23], increasing the EXP will give the user a better idea about the required effort to develop a specific task using the technology [132,133] and may also create a favorable feeling about system usefulness [75,134]. In line with those authors, our findings suggest that previous interactions with innovations have a larger effect on PEOU than in PU. Specifically, EXP has a strong predictive influence in PEOU and a medium impact on PU in the systems’ acceptance category. In the case of devices’ acceptance, prior use has a moderate effect on PEOU and little effect on PU. Literature reviews examined in our study found that EXP has moderate importance in determining PU and PEOU.
FC are a measure of the available resources to support a given behavior [58,60], and the expertise required [21]. Similarly to Cheng et al. [135], we also found evidence that FC can enhance the idea of how easy it can be to perform a task [135]. Our study’s outcomes indicate that users’ perception of FC is a crucial determinant of PEOU when the acceptance of a set of complementary technologies is being assessed. FC’s decisive role in determining the PEOU was also evident in theoretical studies, which in turn reported a medium impact of FC in PU. We also found that when the technology was a system or service, FCs have a medium influence in PU and PEOU. When the research interest was to predict a device’s acceptance, FC moderately affected PEOU and slightly determined PU of this type of technology. One of the most noteworthy findings suggests that users PEOU of a bundle of innovations will be strongly influenced by the FC associated with the complementarity of those technologies. Additionally, FC’s role is more appreciated when it comes to the use of platforms than in the case of a device.
II is considered a personal trait. An innovative person will be eager to face the risks associated with the early stages of technology readiness and will have more definite intentions to use new IT [136]. We observed that this external factor has a medium-sized relationship with PU in situations in which users have to express their preferences from a group of technologies available. II also moderately influences PU of systems, services, or platforms. For this same category, the importance of II seems to be considerably less in PEOU. Only studies concerning the acceptance of systems reported the relationship between II and PEOU, indicating that its effect is insignificant on PEOU for our research categories.
PE is understood as an intrinsic motivational factor [137]. PE is a significant predictor of PEOU in the context of devices and systems or services acceptance scenarios. The theoretical category reported a medium strength of the relationship between PE and PEOU. PU is also primarily affected by PE of using devices, and this is in line with the category of theoretical studies. As for systems and services, PE has a medium impact on PU.
Compeau and Higgins [121] stated that the higher the SE expectations, the higher likelihood of succeeding in a particular assignment. The effect of SE as an external variable is the most studied in the TAM works we analyzed. Only one category out of seven didn’t report the relationship between SE and PU or PEOU, namely, studies comparing a set of technologies. In all the other research topics, SE showed a significantly strong influence on the perception of how ease could be to use technology as Venkatesh and Davis [138] suggested. For PU, the predictive power of SE was strong when moderating variables such as gender and age were being contemplated. All the other categories mentioned a medium effect of SE in PU.
As can be expected, the SQ is particularly relevant for studies analyzing the acceptance of a system or service. If a platform does not run smoothly, users may lose interest in using it, and their perception of ease of use will decrease, as well as their satisfaction [139,140]. Our study confirmed the results obtained by Almaiah et al. [131], pointing out that SQ has a substantial impact on PU and PEOU of platforms and systems. In contrast, the theoretical studies category reported a minimum effect of SQ on both TAM’s determinants.
The logic behind SN is that human behavior is somehow affected by the opinions of the individuals’ closer social spheres. In some cases, people may use a technology based on others’ perceptions about the convenience of the use over his or her own emotions and beliefs [19]. Our results suggest that social pressure can have a more significant influence on users’ perceptions of usefulness than in PEOU. Academic works comparing the acceptance of a set of technologies reported that users tend to perceive innovations as more useful, based on the recommendations of individuals closest to them. In those cases, SN seems to have a strong predictive power on PU. Theoretical studies and researches investigating the acceptance of methodologies, devices, or systems, showed a medium explanatory impact of SN in PU. When innovations are considered a bunch of technologies, SN had a low effect on PU. Concerning PEOU, theoretical studies registered a moderate effect of SN on this TAM determinant, as well as studies assessing the acceptance of systems. When the acceptance of a methodology is under analysis, SN seems to have little effect on PEOU.
The main findings and correlations are summarized in Figure 8. Only variables reporting a more significant influence in the two TAM’s beliefs are included for each of the seven study categories. Common factors used in TAM extensions in the fields of interest are also listed.
Based on the previous analysis, the TAM extension that better fits the context of the e-learning tool FARMER 4.0. is depicted in Figure 9. The validation of the proposed model corresponds to the subsequent phase of the present study and will be developed in the near future.

6. Conclusions

The present study is developed in the context of an agricultural project in Europe. Our objective was to conduct a literature review to identify the most common external variables used in TAM applications using the QFD to give structure to the research. Our analysis focused on three sectors, namely, e-learning, agriculture, and virtual reality. We found evidence that among those three sectors, the less explored is the VR sector.
By setting apart the variables included in the models we analyzed, we identified the most commonly used variables: anxiety, content quality, experience, facilitating conditions, individual innovativeness, perceived enjoyment, self-efficacy, system quality, and social norm. Our findings provide evidence that external variables influence in a different manner the two personal beliefs proposed by Davis [7] in the TAM. In our case study, PU’s primary determinant was PEOU, followed by system and content quality and perceived enjoyment. As for PEOU, it was significantly predicted by self-efficacy, followed by perceived enjoyment, and experience.
The seven research categories and the different impacts of external variables demonstrated the context-dependency of technology use. As an acceptance measurement tool, the TAM provides flexibility and accuracy by leaving the doors open for several extensions and applications.
The QFD proposed in the present study seems to provide a functional framework for organizing and prioritizing the information.
Considering the knowledge gap of technology acceptance in VR innovations and task-level TAM applications, more investigations of those types should be developed. We encourage TAM researchers to provide the existence and validity of relationships along with the effect size. By knowing the variables with a more significant influence on technology acceptance, innovators’ efforts will be better oriented.
Further research is required to validate the proposed model in the context of FARMER 4.0 and make the most out of the platform. However, the ultimate benefit extracted from the e-learning tool will also depend on reducing infrastructure and resource limitations. Electricity and internet connectivity should be accessible in rural areas where our target users develop their daily activities. This is especially important as suggested by Yumashev et al. [141] because lack of the proper electricity supply can affect the quality of life, reduce the incentives to develop agricultural activities, hamper access to education, and needless to say, will directly affect the usage of the designed tool. Education institutions can also become key players in reducing resource barriers. They can design and implement strategies aiming to increase learning courses, develop new technological capabilities, gain learning flexibility [2], and make available laboratories and technological tools to allow access to platforms such as FARMER 4.0.

Author Contributions

Conceptualization, L.C.C.G., I.A.C.J. and M.G.V.; data curation, L.C.C.G. and I.A.C.J.; formal analysis, L.C.C.G., I.A.C.J., and M.G.V.; funding acquisition, M.G.V.; investigation, L.C.C.G. and I.A.C.J.; methodology, M.G.V., I.A.C.J., and L.C.C.G.; supervision, M.G.V., I.A.C.J., F.M., and E.V.; visualization, M.G.V., F.M., E.V., I.A.C.J. and L.C.C.G.; writing—original draft, L.C.C.G. and I.A.C.J.; writing—review and editing, L.C.C.G., I.A.C.J., M.G.V., F.M., E.V. All authors have read and agreed to the published version of the manuscript.

Funding

This work was supported by European Erasmus+ project “Farmer 4.0”, project number: 2018-1-IT01-KA202-006775.

Conflicts of Interest

The authors declare no conflict of interest. The funders had no role in the design of the study; in the collection, analyses, or interpretation of data; in the writing of the manuscript, or in the decision to publish the results.

Abbreviations

The following abbreviations are used in this manuscript:
TAMTechnology Acceptance Model
ICTInformation and Communication Technologies
E-learningElectronic Learning
VRVirtual Reality
QFDQuality Function Deployment
HoQHouse of Quality
CRCustomer Requirements
TCTechnical Characteristics
PUPerceived Usefulness
PEOUPerceived Ease of Use
ANXAnxiety
CQContent Quality
SQSystem Quality
EXPExperience
FCFacilitating Conditions
IIIndividual Innovativeness
PEPerceived Enjoyment
SESelf-efficacy
SNSocial Norm

References

  1. United Nations. Transforming Our World: The 2030 Agenda for Sustainable Development; Division for Sustainable Development Goals: New York, NY, USA, 2015. [Google Scholar]
  2. Nie, D.; Panfilova, E.; Samusenkov, V.; Mikhaylov, A. E-Learning Financing Models in Russia for Sustainable Development. Sustainability 2020, 12, 4412. [Google Scholar] [CrossRef]
  3. World Bank. Information and Communications for Development 2018: Data-Driven Development; World Bank: Washington, DC, USA, 2018. [Google Scholar]
  4. Mkude, C.G.; Wimmer, M.A. Using PESTELMO to Frame HCI Contextual Development in Developing Countries. In Proceedings of the International Conference on Social Implications of Computers in Developing Countries, Dar es Salaam, Tanzania, 1–3 May 2019; Springer: Cham, Switzerland, 2019; pp. 326–333. [Google Scholar]
  5. Li, Y.; Thomas, M.A. Adopting a Theory of Change Approach for ICT4D Project Impact Assessment-The Case of CMES Project. In Proceedings of the International Conference on Social Implications of Computers in Developing Countries, Dar es Salaam, Tanzania, 1–3 May 2019; Springer: Cham, Switzerland, 2019; pp. 95–109. [Google Scholar]
  6. Abdullah, F.; Ward, R. Developing a General Extended Technology Acceptance Model for E-Learning (GETAMEL) by analysing commonly used external factors. Comput. Hum. Behav. 2016, 56, 238–256. [Google Scholar] [CrossRef]
  7. Davis, F.D. A Technology Acceptance Model for Empirically Testing New End-User Information Systems: Theory and Results. Ph.D. Thesis, Massachusetts Institute of Technology, Cambridge, MA, USA, 1985. [Google Scholar]
  8. Kim, Y.G.; Woo, E. Consumer acceptance of a quick response (QR) code for the food traceability system: Application of an extended technology acceptance model (TAM). Food Res. Int. 2016, 85, 266–272. [Google Scholar] [CrossRef] [PubMed]
  9. Chuah, S.H.W.; Rauschnabel, P.A.; Krey, N.; Nguyen, B.; Ramayah, T.; Lade, S. Wearable technologies: The role of usefulness and visibility in smartwatch adoption. Comput. Hum. Behav. 2016, 65, 276–284. [Google Scholar] [CrossRef]
  10. Chen, K.; Chan, A.H.S. Gerontechnology acceptance by elderly Hong Kong Chinese: A senior technology acceptance model (STAM). Ergonomics 2014, 57, 635–652. [Google Scholar] [CrossRef]
  11. Chang, C.C.; Hung, S.W.; Cheng, M.J.; Wu, C.Y. Exploring the intention to continue using social networking sites: The case of Facebook. Technol. Forecast. Soc. Chang. 2015, 95, 48–56. [Google Scholar] [CrossRef]
  12. Koenig-Lewis, N.; Marquet, M.; Palmer, A.; Zhao, A.L. Enjoyment and social influence: Predicting mobile payment adoption. Serv. Ind. J. 2015, 35, 537–554. [Google Scholar] [CrossRef]
  13. Chen, C.F.; Xu, X.; Arpan, L. Between the technology acceptance model and sustainable energy technology acceptance model: Investigating smart meter acceptance in the United States. Energy Res. Soc. Sci. 2017, 25, 93–104. [Google Scholar] [CrossRef]
  14. Muñoz-Leiva, F.; Climent-Climent, S.; Liébana-Cabanillas, F. Determinants of intention to use the mobile banking apps: An extension of the classic TAM model. Span. J. Mark. ESIC 2017, 21, 25–38. [Google Scholar] [CrossRef]
  15. Giovanis, A.N.; Binioris, S.; Polychronopoulos, G. An extension of TAM model with IDT and security/privacy risk in the adoption of internet banking services in Greece. EuroMed. J. Bus. 2012, 7, 24–53. [Google Scholar] [CrossRef]
  16. Mercurio, D.I.; Hernandez, A.A. Understanding User Acceptance of Information System for Sweet Potato Variety and Disease Classification: An Empirical Examination with an Extended Technology Acceptance Model. In Proceedings of the 2020 16th IEEE International Colloquium on Signal Processing & Its Applications (CSPA), Langkawi, Malaysia, 28–29 February 2020; pp. 272–277. [Google Scholar]
  17. Ajzen, I.; Fishbein, M.; Heilbroner, R.L. Understanding Attitudes and Predicting Social Behavior; Prentice-Hall: Englewood Cliffs, NJ, USA, 1980; Volume 278. [Google Scholar]
  18. Ajzen, I. From intentions to actions: A theory of planned behavior. In Action Control; Springer: Berlin/Heidelberg, Germany, 1985; pp. 11–39. [Google Scholar]
  19. Davis, F.D. Perceived usefulness, perceived ease of use, and user acceptance of information technology. MIS Q. 1989, 13, 319–340. [Google Scholar] [CrossRef] [Green Version]
  20. Davis, F.D.; Bagozzi, R.P.; Warshaw, P.R. User acceptance of computer technology: A comparison of two theoretical models. Manag. Sci. 1989, 35, 982–1003. [Google Scholar] [CrossRef] [Green Version]
  21. Tarhini, A.; Arachchilage, N.A.G.; Abbasi, M.S.; Masa’deh, R. A critical review of theories and models of technology adoption and acceptance in information system research. Int. J. Technol. Diffus. (IJTD) 2015, 6, 58–77. [Google Scholar] [CrossRef]
  22. Venkatesh, V.; Davis, F.D. A theoretical extension of the technology acceptance model: Four longitudinal field studies. Manag. Sci. 2000, 46, 186–204. [Google Scholar] [CrossRef] [Green Version]
  23. Venkatesh, V.; Bala, H. Technology acceptance model 3 and a research agenda on interventions. Decis. Sci. 2008, 39, 273–315. [Google Scholar] [CrossRef] [Green Version]
  24. King, W.R.; He, J. A meta-analysis of the technology acceptance model. Inf. Manag. 2006, 43, 740–755. [Google Scholar] [CrossRef]
  25. Al-Emran, M.; Mezhuyev, V.; Kamaludin, A. Technology Acceptance Model in M-learning context: A systematic review. Comput. Educ. 2018, 125, 389–412. [Google Scholar] [CrossRef]
  26. Akao, Y.; King, B. Quality Function Deployment: Integrating Customer Requirements into Product Design; Productivity Press: Cambridge, MA, USA, 1990; Volume 21. [Google Scholar]
  27. Bevilacqua, M.; Ciarapica, F.; Giacchetta, G. A fuzzy-QFD approach to supplier selection. J. Purch. Supply Manag. 2006, 12, 14–27. [Google Scholar] [CrossRef]
  28. Zhang, Z.; Chu, X. Risk prioritization in failure mode and effects analysis under uncertainty. Expert Syst. Appl. 2011, 38, 206–214. [Google Scholar] [CrossRef]
  29. Ansari, A.; Modarress, B. Quality function deployment: The role of suppliers. Int. J. Purch. Mater. Manag. 1994, 30, 27–35. [Google Scholar] [CrossRef]
  30. Luo, X.; Tang, J.; Wang, D. An optimization method for components selection using quality function deployment. Int. J. Adv. Manuf. Technol. 2008, 39, 158–167. [Google Scholar] [CrossRef]
  31. Li, Y.L.; Tang, J.F.; Luo, X.G. An ECI-based methodology for determining the final importance ratings of customer requirements in MP product improvement. Expert Syst. Appl. 2010, 37, 6240–6250. [Google Scholar] [CrossRef]
  32. Jeong, M.; Oh, H. Quality function deployment: An extended framework for service quality and customer satisfaction in the hospitality industry. Int. J. Hosp. Manag. 1998, 17, 375–390. [Google Scholar] [CrossRef]
  33. Cohen, L. Quality Function Deployment: How to Make QFD Work for You; Prentice Hall: Upper Saddle River, NJ, USA, 1995. [Google Scholar]
  34. Bickness, B.; Bicknell, K.D. The Road Map to Repeatable Success: Using QFD to Implement Change; CRC Press: Boca Raton, FL, USA, 1995. [Google Scholar]
  35. Dolgun, L.E.; Köksal, G. Effective use of quality function deployment and Kansei engineering for product planning with sensory customer requirements: A plain yogurt case. Qual. Eng. 2018, 30, 569–582. [Google Scholar] [CrossRef]
  36. Iranmanesh, S.H.; Thomson, V.; Salimi, M.H. Design parameter estimation using a modified QFD method to improve customer perception. Concurr. Eng. 2005, 13, 57–67. [Google Scholar] [CrossRef]
  37. Choi, I.K.; Kim, W.S.; Lee, D.; Kwon, D.S. A weighted qfd-based usability evaluation method for elderly in smart cars. Int. J. Hum. Comput. Interact. 2015, 31, 703–716. [Google Scholar] [CrossRef]
  38. Vezzetti, E.; Marcolin, F.; Guerra, A.L. QFD 3D: A new C-shaped matrix diagram quality approach. Int. J. Qual. Reliab. Manag. 2016, 33, 178–196. [Google Scholar] [CrossRef]
  39. Violante, M.G.; Marcolin, F.; Vezzetti, E.; Ulrich, L.; Billia, G.; Di Grazia, L. 3D Facial Expression Recognition for Defining Users’ Inner Requirements—An Emotional Design Case Study. Appl. Sci. 2019, 9, 2218. [Google Scholar] [CrossRef] [Green Version]
  40. Sun, S.; Ma, D.; Qian, H. Study on user experience of airport rail to air Transfer Mode based on QFD and service design methods. E3S Web Conf. 2020, 179, 02030. [Google Scholar] [CrossRef]
  41. Salloum, S.A.; Alhamad, A.Q.M.; Al-Emran, M.; Monem, A.A.; Shaalan, K. Exploring students’ acceptance of e-learning through the development of a comprehensive technology acceptance model. IEEE Access 2019, 7, 128445–128462. [Google Scholar] [CrossRef]
  42. Wingo, N.P.; Ivankova, N.V.; Moss, J.A. Faculty perceptions about teaching online: Exploring the literature using the technology acceptance model as an organizing framework. Online Learn. 2017, 21, 15–35. [Google Scholar] [CrossRef]
  43. Scherer, R.; Siddiq, F.; Tondeur, J. The technology acceptance model (TAM): A meta-analytic structural equation modeling approach to explaining teachers’ adoption of digital technology in education. Comput. Educ. 2019, 128, 13–35. [Google Scholar] [CrossRef]
  44. Sánchez-Prieto, J.C.; Olmos-Migueláñez, S.; García-Peñalvo, F.J. Informal tools in formal contexts: Development of a model to assess the acceptance of mobile technologies among teachers. Comput. Hum. Behav. 2016, 55, 519–528. [Google Scholar] [CrossRef]
  45. Tom Dieck, M.C.; Jung, T. A theoretical model of mobile augmented reality acceptance in urban heritage tourism. Curr. Issues Tour. 2018, 21, 154–174. [Google Scholar] [CrossRef]
  46. Silva, A.G.; Canavari, M.; Sidali, K.L. A Technology Acceptance Model of common bean growers’ intention to adopt Integrated Production in the Brazilian Central Region. Die Bodenkultur J. Land Manag. Food Environ. 2018, 68, 131–143. [Google Scholar] [CrossRef] [Green Version]
  47. Tubtiang, A.; Pipatpanuvittaya, S. A study of factors that affect attitude toward deploying smart-farm technologies in Tanud subdistrict, Damnoen Saduak district in Ratchaburi province. J. Food Sci. Agric. Technol. (JFAT) 2015, 1, 144–148. [Google Scholar]
  48. Far, S.T.; Rezaei-Moghaddam, K. Determinants of Iranian agricultural consultants’ intentions toward precision agriculture: Integrating innovativeness to the technology acceptance model. J. Saudi Soc. Agric. Sci. 2017, 16, 280–286. [Google Scholar]
  49. Fountas, S.; Pedersen, S.M.; Blackmore, S. ICT in Precision Agriculture—Diffusion of technology. In ICT in Agriculture: Perspective of Technological Innovation; Gelb, E., Offer, A., Eds.; 2005; Available online: http://departments.agri.huji.ac.il/economics/gelb-main.html (accessed on 31 December 2020).
  50. Okumua, O.F.; Faith, M.; Irura, N.S. Extending Technology Acceptance Model to Predict Innovation in Micro and Small Food Manufacturing Enterprises in Kenya. AJBUMA J. 2018, 4, 34–46. [Google Scholar]
  51. Rezaei, R.; Safa, L.; Ganjkhanloo, M.M. Understanding farmers’ ecological conservation behavior regarding the use of integrated pest management-an application of the technology acceptance model. Glob. Ecol. Conserv. 2020, 22, e00941. [Google Scholar] [CrossRef]
  52. Stenberg, J.A. A conceptual framework for integrated pest management. Trends Plant Sci. 2017, 22, 759–769. [Google Scholar] [CrossRef]
  53. Nam, C.S.; Bahn, S.; Lee, R. Acceptance of assistive technology by special education teachers: A structural equation model approach. Int. J. Hum. Comput. Interact. 2013, 29, 365–377. [Google Scholar] [CrossRef]
  54. Cowan, D.; Turner-Smith, A. The Role of Assistive Technology in Alternative Models of Care for Older People; Research, HMSO; Citeseer: Princeton, NJ, USA, 1999. [Google Scholar]
  55. Teo, T.; Lee, C.B.; Chai, C.S. Understanding pre-service teachers’ computer attitudes: Applying and extending the technology acceptance model. J. Comput. Assist. Learn. 2008, 24, 128–143. [Google Scholar] [CrossRef]
  56. Teo, T. Examining the intention to use technology among pre-service teachers: An integration of the technology acceptance model and theory of planned behavior. Interact. Learn. Environ. 2012, 20, 3–18. [Google Scholar] [CrossRef]
  57. Wong, K.T.; Osman, R.b.; Goh, P.S.C.; Rahmat, M.K. Understanding Student Teachers’ Behavioural Intention to Use Technology: Technology Acceptance Model (TAM) Validation and Testing. Online Submiss. 2013, 6, 89–104. [Google Scholar]
  58. Sánchez-Prieto, J.C.; Olmos-Migueláñez, S.; García-Peñalvo, F.J. MLearning and pre-service teachers: An assessment of the behavioral intention using an expanded TAM model. Comput. Hum. Behav. 2017, 72, 644–654. [Google Scholar] [CrossRef]
  59. Islam, M.S.; Grönlund, Å. Factors influencing the adoption of mobile phones among the farmers in Bangladesh: Theories and practices. ICTer 2011, 4, 4–14. [Google Scholar] [CrossRef] [Green Version]
  60. Zhou, D.; Abdullah. The acceptance of solar water pump technology among rural farmers of northern Pakistan: A structural equation model. Cogent Food Agric. 2017, 3, 1280882. [Google Scholar] [CrossRef]
  61. Manis, K.T.; Choi, D. The virtual reality hardware acceptance model (VR-HAM): Extending and individuating the technology acceptance model (TAM) for virtual reality hardware. J. Bus. Res. 2019, 100, 503–513. [Google Scholar] [CrossRef]
  62. Lee, J.; Kim, J.; Choi, J.Y. The adoption of virtual reality devices: The technology acceptance model integrating enjoyment, social interaction, and strength of the social ties. Telemat. Inform. 2019, 39, 37–48. [Google Scholar] [CrossRef]
  63. Kucukusta, D.; Law, R.; Besbes, A.; Legohérel, P. Re-examining perceived usefulness and ease of use in online booking. Int. J. Contemp. Hosp. Manag. 2015, 27, 185–198. [Google Scholar] [CrossRef]
  64. Dumpit, D.Z.; Fernandez, C.J. Analysis of the use of social media in Higher Education Institutions (HEIs) using the Technology Acceptance Model. Int. J. Educ. Technol. High. Educ. 2017, 14, 5. [Google Scholar] [CrossRef]
  65. Alharbi, S.; Drew, S. Using the technology acceptance model in understanding academics’ behavioural intention to use learning management systems. Int. J. Adv. Comput. Sci. Appl. 2014, 5, 143–155. [Google Scholar] [CrossRef]
  66. Shin, W.S.; Kang, M. The use of a mobile learning management system at an online university and its effect on learning satisfaction and achievement. Int. Rev. Res. Open Distrib. Learn. 2015, 16, 110–130. [Google Scholar] [CrossRef]
  67. Calisir, F.; Altin Gumussoy, C.; Bayraktaroglu, A.E.; Karaali, D. Predicting the intention to use a web-based learning system: Perceived content quality, anxiety, perceived system quality, image, and the technology acceptance model. Hum. Factors Ergon. Manuf. Serv. Ind. 2014, 24, 515–531. [Google Scholar] [CrossRef]
  68. Mohammadi, H. Investigating users’ perspectives on e-learning: An integration of TAM and IS success model. Comput. Hum. Behav. 2015, 45, 359–374. [Google Scholar] [CrossRef]
  69. Al-Rahmi, W.M.; Yahaya, N.; Aldraiweesh, A.A.; Alamri, M.M.; Aljarboa, N.A.; Alturki, U.; Aljeraiwi, A.A. Integrating technology acceptance model with innovation diffusion theory: An empirical investigation on students’ intention to use E-learning systems. IEEE Access 2019, 7, 26797–26809. [Google Scholar] [CrossRef]
  70. Binyamin, S.S.; Rutter, M.; Smith, S. Extending the technology acceptance model to understand students’ use of learning management systems in Saudi higher education. Int. J. Emerg. Technol. Learn. (IJET) 2019, 14, 4–21. [Google Scholar] [CrossRef]
  71. Al-Adwan, A.; Al-Adwan, A.; Smedley, J. Exploring students acceptance of e-learning using Technology Acceptance Model in Jordanian universities. Int. J. Educ. Dev. Using ICT 2013, 9, 4–18. [Google Scholar]
  72. Fathema, N.; Shannon, D.; Ross, M. Expanding the Technology Acceptance Model (TAM) to examine faculty use of Learning Management Systems (LMSs) in higher education institutions. J. Online Learn. Teach. 2015, 11, 210–232. [Google Scholar]
  73. Chang, C.T.; Hajiyev, J.; Su, C.R. Examining the students’ behavioral intention to use e-learning in Azerbaijan? The general extended technology acceptance model for e-learning approach. Comput. Educ. 2017, 111, 128–143. [Google Scholar] [CrossRef]
  74. Al-Gahtani, S.S. Empirical investigation of e-learning acceptance and assimilation: A structural equation model. Appl. Comput. Inform. 2016, 12, 27–50. [Google Scholar] [CrossRef] [Green Version]
  75. Lee, Y.H.; Hsieh, Y.C.; Chen, Y.H. An investigation of employees’ use of e-learning systems: Applying the technology acceptance model. Behav. Inf. Technol. 2013, 32, 173–189. [Google Scholar] [CrossRef]
  76. Yeou, M. An investigation of students’ acceptance of Moodle in a blended learning setting using technology acceptance model. J. Educ. Technol. Syst. 2016, 44, 300–318. [Google Scholar] [CrossRef]
  77. Estriegana, R.; Medina-Merodio, J.A.; Barchino, R. Student acceptance of virtual laboratory and practical work: An extension of the technology acceptance model. Comput. Educ. 2019, 135, 1–14. [Google Scholar] [CrossRef]
  78. Shyu, S.H.P.; Huang, J.H. Elucidating usage of e-government learning: A perspective of the extended technology acceptance model. Gov. Inf. Q. 2011, 28, 491–502. [Google Scholar] [CrossRef]
  79. Wu, B.; Chen, X. Continuance intention to use MOOCs: Integrating the technology acceptance model (TAM) and task technology fit (TTF) model. Comput. Hum. Behav. 2017, 67, 221–232. [Google Scholar] [CrossRef]
  80. Revythi, A.; Tselios, N. Extension of Technology Acceptance Model by using System Usability Scale to assess behavioral intention to use e-learning. Educ. Inf. Technol. 2019, 24, 2341–2355. [Google Scholar] [CrossRef] [Green Version]
  81. Khor, E.T. An analysis of ODL student perception and adoption behavior using the technology acceptance model. Int. Rev. Res. Open Distrib. Learn. 2014, 15, 275–288. [Google Scholar] [CrossRef] [Green Version]
  82. Liu, X. Empirical testing of a theoretical extension of the technology acceptance model: An exploratory study of educational wikis. Commun. Educ. 2010, 59, 52–69. [Google Scholar] [CrossRef]
  83. Tarhini, A.; Hassouna, M.; Abbasi, M.S.; Orozco, J. Towards the Acceptance of RSS to Support Learning: An empirical study to validate the Technology Acceptance Model in Lebanon. Electron. J. E-Learn. 2015, 13, 30–41. [Google Scholar]
  84. Cheung, R.; Vogel, D. Predicting user acceptance of collaborative technologies: An extension of the technology acceptance model for e-learning. Comput. Educ. 2013, 63, 160–175. [Google Scholar] [CrossRef]
  85. Lee, D.Y.; Lehto, M.R. User acceptance of YouTube for procedural learning: An extension of the Technology Acceptance Model. Comput. Educ. 2013, 61, 193–208. [Google Scholar] [CrossRef]
  86. Vidanapathirana, N.; Hirimburegama, K.; Hirimburegama, W.; Nelka, S. Exploring farmers acceptance of e-learning using Technology Acceptance Model-case study in Sri Lanka. In Proceedings of the EDULEARN15 Conference, Barcelona, Spain, 6–8 July 2015. [Google Scholar]
  87. Verma, P.; Sinha, N. Technology acceptance model revisited for mobile based agricultural extension services in India. Manag. Res. Pract. 2016, 8, 29–38. [Google Scholar]
  88. Verma, P.; Sinha, N. Integrating perceived economic wellbeing to technology acceptance model: The case of mobile based agricultural extension service. Technol. Forecast. Soc. Chang. 2018, 126, 207–216. [Google Scholar] [CrossRef]
  89. Amin, M.K.; Li, J. Applying Farmer Technology Acceptance Model to Understand Farmer’s Behavior Intention to use ICT Based Microfinance Platform: A Comparative analysis between Bangladesh and China. In Proceedings of the WHICEB 2014, Wuhan, China, 31 May–1 June 2014; p. 31. [Google Scholar]
  90. Das, V.J.; Sharma, S.; Kaushik, A. Views of Irish farmers on smart farming technologies: An observational study. AgriEngineering 2019, 1, 164–187. [Google Scholar]
  91. Huang, T.L.; Liao, S. A model of acceptance of augmented-reality interactive technology: The moderating role of cognitive innovativeness. Electron. Commer. Res. 2015, 15, 269–295. [Google Scholar] [CrossRef] [Green Version]
  92. Huang, H.M.; Liaw, S.S.; Lai, C.M. Exploring learner acceptance of the use of virtual reality in medical education: A case study of desktop and projection-based display systems. Interact. Learn. Environ. 2016, 24, 3–19. [Google Scholar] [CrossRef]
  93. Naspetti, S.; Mandolesi, S.; Buysse, J.; Latvala, T.; Nicholas, P.; Padel, S.; Van Loo, E.J.; Zanoli, R. Determinants of the acceptance of sustainable production strategies among dairy farmers: Development and testing of a modified technology acceptance model. Sustainability 2017, 9, 1805. [Google Scholar] [CrossRef] [Green Version]
  94. Caffaro, F.; Cremasco, M.M.; Roccato, M.; Cavallo, E. Drivers of farmers’ intention to adopt technological innovations in Italy: The role of information sources, perceived usefulness, and perceived ease of use. J. R. Stud. 2020, 76, 264–271. [Google Scholar] [CrossRef]
  95. Schoonenboom, J. Using an adapted, task-level technology acceptance model to explain why instructors in higher education intend to use some learning management system tools more than others. Comput. Educ. 2014, 71, 247–256. [Google Scholar] [CrossRef]
  96. Sharifzadeh, M.S.; Damalas, C.A.; Abdollahzadeh, G.; Ahmadi-Gorgi, H. Predicting adoption of biological control among Iranian rice farmers: An application of the extended technology acceptance model (TAM2). Crop Prot. 2017, 96, 88–96. [Google Scholar] [CrossRef]
  97. Bahtera, N.I.; Atmaja, E.J.J.; Setiawan, I.; Irwanto, R. The technology acceptance model (tam) on pepper farmers in Bangka, Indonesia. J. Inf. 2019, 4, 48–58. [Google Scholar] [CrossRef]
  98. Punnoose, A.C. Determinants of intention to use eLearning based on the technology acceptance model. J. Inf. Technol. Educ. Res. 2012, 11, 301–337. [Google Scholar]
  99. Ibrahim, R.; Leng, N.; Yusoff, R.; Samy, G.; Masrom, S.; Rizman, Z. E-learning acceptance based on technology acceptance model (TAM). J. Fundam. Appl. Sci. 2017, 9, 871–889. [Google Scholar] [CrossRef] [Green Version]
  100. Park, S.Y.; Nam, M.W.; Cha, S.B. University students’ behavioral intention to use mobile learning: Evaluating the technology acceptance model. Br. J. Educ. Technol. 2012, 43, 592–605. [Google Scholar] [CrossRef]
  101. Nikou, S.A.; Economides, A.A. Mobile-Based Assessment: Integrating acceptance and motivational factors into a combined model of Self-Determination Theory and Technology Acceptance. Comput. Hum. Behav. 2017, 68, 83–95. [Google Scholar] [CrossRef]
  102. Ahmad, T.B.T.; Madarsha, K.B.; Zainuddin, A.M.H.; Ismail, N.A.H.; Nordin, M.S. Faculty’s acceptance of computer based technology: Cross-validation of an extended model. Australas. J. Educ. Technol. 2010, 26. [Google Scholar] [CrossRef] [Green Version]
  103. Wong, K.T.; Teo, T.; Russo, S. Influence of gender and computer teaching efficacy on computer acceptance among Malaysian student teachers: An extended technology acceptance model. Australas. J. Educ. Technol. 2012, 28. [Google Scholar] [CrossRef] [Green Version]
  104. Padilla-Meléndez, A.; Del Aguila-Obra, A.R.; Garrido-Moreno, A. Perceived playfulness, gender differences and technology acceptance model in a blended learning scenario. Comput. Educ. 2013, 63, 306–317. [Google Scholar] [CrossRef]
  105. Tarhini, A.; Hone, K.; Liu, X. Measuring the moderating effect of gender and age on e-learning acceptance in England: A structural equation modeling approach for an extended technology acceptance model. J. Educ. Comput. Res. 2014, 51, 163–184. [Google Scholar] [CrossRef]
  106. Al-Azawei, A.; Lundqvist, K. Learner Differences in Perceived Satisfaction of an Online Learning: An Extension to the Technology Acceptance Model in an Arabic Sample. Electron. J. E-Learn. 2015, 13, 408–426. [Google Scholar]
  107. Felder, R.M.; Silverman, L.K. Learning and teaching styles in engineering education. Eng. Educ. 1988, 78, 674–681. [Google Scholar]
  108. Al-Azawei, A.; Parslow, P.; Lundqvist, K. Investigating the effect of learning styles in a blended e-learning system: An extension of the technology acceptance model (TAM). Australas. J. Educ. Technol. 2017, 33. [Google Scholar] [CrossRef] [Green Version]
  109. Tarhini, A.; Hone, K.; Liu, X.; Tarhini, T. Examining the moderating effect of individual-level cultural values on users’ acceptance of E-learning in developing countries: A structural equation modeling of an extended technology acceptance model. Interact. Learn. Environ. 2017, 25, 306–328. [Google Scholar] [CrossRef] [Green Version]
  110. Venkatesh, V. Determinants of perceived ease of use: Integrating perceived behavioral control, computer anxiety and enjoyment into the technology acceptance model. Inf. Syst. Res. 2000, 11, 342–365. [Google Scholar] [CrossRef] [Green Version]
  111. Lee, B.C.; Yoon, J.O.; Lee, I. Learners’ acceptance of e-learning in South Korea: Theories and results. Comput. Educ. 2009, 53, 1320–1329. [Google Scholar] [CrossRef]
  112. Lee, Y.C. An empirical investigation into factors influencing the adoption of an e-learning system. Online Inf. Rev. 2006, 30, 517–541. [Google Scholar] [CrossRef] [Green Version]
  113. Thompson, R.; Compeau, D.; Higgins, C. Intentions to use information technologies: An integrative model. J. Organ. End User Comput. (JOEUC) 2006, 18, 25–46. [Google Scholar] [CrossRef] [Green Version]
  114. Fazio, R.H.; Zanna, M.P. Direct experience and attitude-behavior consistency. In Advances in Experimental Social Psychology; Elsevier: Amsterdam, The Netherlands, 1981; Volume 14, pp. 161–202. [Google Scholar]
  115. Karahanna, E.; Straub, D.W.; Chervany, N.L. Information technology adoption across time: A cross-sectional comparison of pre-adoption and post-adoption beliefs. MIS Q. 1999, 23, 183–213. [Google Scholar] [CrossRef]
  116. Venkatesh, V.; Morris, M.G.; Davis, G.B.; Davis, F.D. User acceptance of information technology: Toward a unified view. MIS Q. 2003, 27, 425–478. [Google Scholar] [CrossRef] [Green Version]
  117. Agarwal, R.; Prasad, J. A conceptual and operational definition of personal innovativeness in the domain of information technology. Inf. Syst. Res. 1998, 9, 204–215. [Google Scholar] [CrossRef]
  118. Liu, Y.; Li, H.; Carlsson, C. Factors driving the adoption of m-learning: An empirical study. Comput. Educ. 2010, 55, 1211–1219. [Google Scholar] [CrossRef]
  119. Park, Y.; Son, H.; Kim, C. Investigating the determinants of construction professionals’ acceptance of web-based training: An extension of the technology acceptance model. Autom. Constr. 2012, 22, 377–386. [Google Scholar] [CrossRef]
  120. Compeau, D.R.; Higgins, C.A. Application of social cognitive theory to training for computer skills. Inf. Syst. Res. 1995, 6, 118–143. [Google Scholar] [CrossRef]
  121. Compeau, D.R.; Higgins, C.A. Computer self-efficacy: Development of a measure and initial test. MIS Q. 1995, 19, 189–211. [Google Scholar] [CrossRef] [Green Version]
  122. Elliott, K.M.; Hall, M.C.; Meng, J.G. Consumers’ intention to use self-scanning technology: The role of technology readiness and perceptions toward self-service technology. Acad. Mark. Stud. J. 2013, 17, 129. [Google Scholar]
  123. Delone, W.H.; McLean, E.R. The DeLone and McLean model of information systems success: A ten-year update. J. Manag. Inf. Syst. 2003, 19, 9–30. [Google Scholar]
  124. Fishbein, M.; Ajzen, I. Belief, Attitude, Intention, and Behavior: An Introduction to Theory and Research; Addison-Wesley: Boston, MA, USA, 1977. [Google Scholar]
  125. Ajzen, I. The theory of planned behavior. Organ. Behav. Hum. Decis. Process. 1991, 50, 179–211. [Google Scholar] [CrossRef]
  126. Lleras, C. Path analysis. Encycl. Soc. Meas. 2005, 3, 25–30. [Google Scholar]
  127. Cohen, J. A power primer. Psychol. Bull. 1992, 112, 155. [Google Scholar] [CrossRef]
  128. Sagnier, C.; Loup-Escande, E.; Lourdeaux, D.; Thouvenin, I.; Valléry, G. User acceptance of virtual reality: An extended technology acceptance model. Int. J. Hum.—Interact. 2020, 36, 993–1007. [Google Scholar] [CrossRef]
  129. Li, Y.; Qi, J.; Shu, H. Review of relationships among variables in TAM. Tsinghua Sci. Technol. 2008, 13, 273–278. [Google Scholar] [CrossRef]
  130. Van Raaij, E.M.; Schepers, J.J. The acceptance and use of a virtual learning environment in China. Comput. Educ. 2008, 50, 838–852. [Google Scholar] [CrossRef]
  131. Almaiah, M.A.; Jalil, M.A.; Man, M. Extending the TAM to examine the effects of quality features on mobile learning acceptance. J. Comput. Educ. 2016, 3, 453–485. [Google Scholar] [CrossRef]
  132. Chen, K.; Chen, J.V.; Yen, D.C. Dimensions of self-efficacy in the study of smart phone acceptance. Comput. Stand. Interfaces 2011, 33, 422–431. [Google Scholar] [CrossRef]
  133. Wang, Y.S.; Wu, M.C.; Wang, H.Y. Investigating the determinants and age and gender differences in the acceptance of mobile learning. Br. J. Educ. Technol. 2009, 40, 92–118. [Google Scholar] [CrossRef]
  134. Purnomo, S.H.; Lee, Y.H. E-learning adoption in the banking workplace in Indonesia: An empirical study. Inf. Dev. 2013, 29, 138–153. [Google Scholar] [CrossRef]
  135. Cheng, S.I.; Chen, S.C.; Yen, D.C. Continuance intention of E-portfolio system: A confirmatory and multigroup invariance analysis of technology acceptance model. Comput. Stand. Interfaces 2015, 42, 17–23. [Google Scholar] [CrossRef]
  136. Jeong, N.; Yoo, Y.; Heo, T.Y. Moderating effect of personal innovativeness on mobile-RFID services: Based on Warshaw’s purchase intention model. Technol. Forecast. Soc. Chang. 2009, 76, 154–164. [Google Scholar] [CrossRef]
  137. Ryan, R.M.; Deci, E.L. Intrinsic and extrinsic motivations: Classic definitions and new directions. Contemp. Educ. Psychol. 2000, 25, 54–67. [Google Scholar] [CrossRef]
  138. Venkatesh, V.; Davis, F.D. A model of the antecedents of perceived ease of use: Development and test. Decis. Sci. 1996, 27, 451–481. [Google Scholar] [CrossRef]
  139. Chang, S.C.; Tung, F.C. An empirical investigation of students’ behavioural intentions to use the online learning course websites. Br. J. Educ. Technol. 2008, 39, 71–83. [Google Scholar] [CrossRef]
  140. Lee, J.K.; Lee, W.K. The relationship of e-Learner’s self-regulatory efficacy and perception of e-Learning environmental quality. Comput. Hum. Behav. 2008, 24, 32–47. [Google Scholar] [CrossRef]
  141. Yumashev, A.; Ślusarczyk, B.; Kondrashev, S.; Mikhaylov, A. Global Indicators of Sustainable Development: Evaluation of the Influence of the Human Development Index on Consumption and Quality of Energy. Energies 2020, 13, 2768. [Google Scholar] [CrossRef]
Figure 1. Technology Acceptance Model (TAM).
Futureinternet 13 00007 g001
Figure 2. Layout of the proposed methodology.
Futureinternet 13 00007 g002
Figure 3. Proposed QFD matrix.
Futureinternet 13 00007 g003
Figure 4. Papers selection process.
Futureinternet 13 00007 g004
Figure 5. Path Coefficients.
Futureinternet 13 00007 g005
Figure 6. Quality Function Deployment (QFD) matrix for Perceived Usefulness.
Futureinternet 13 00007 g006
Figure 7. QFD matrix for Perceived Ease of Use.
Futureinternet 13 00007 g007
Figure 8. Summary of findings.
Futureinternet 13 00007 g008
Figure 9. Proposed TAM extension for FARMER 4.0.
Futureinternet 13 00007 g009
Table 1. Identified research categories.
Defined CategoriesNumber of
Studies
Technology acceptance: theoretical models7
Acceptance of a bundle of technologies6
Acceptance of a methodology6
Acceptance of a device8
Acceptance of a service/platform/system30
Comparison of the acceptance among different tasks or technologies3
Technology acceptance: the effect of certain moderating variables7
Table 2. Most commonly used external variables in TAM applications.
External VariablesIncluded in the Proposed Model of Studies
Anxiety7
Content quality11
Experience7
Facilitating conditions10
Individual innovativeness8
Perceived enjoyment8
Self-efficacy30
Service/System quality7
Social norm24
Table 3. Definitions of the “How’s”.
External VariableDefinition
Anxiety (ANX)“An individual’s apprehension, or even fear when she/he is faced with the possibility of using computers.” [23,110].
Content quality (CQ)Extent to which the information fits user needs [111] in terms of information organization, relevance and actuality [112], availability of support materials, and accuracy of the terminology [70].
Experience (EXP)Past interactions or exposure of an individual to a system and the accumulated knowledge gained by usage [113,114,115].
Facilitating conditions (FC)Users’ beliefs about the existence of technical and organizational resources and infrastructure to facilitate the use of technology [116].
Individual innovativeness (II)Individual’s disposition towards adopting any new technology before others [117,118].
Perceived enjoyment (PE)Refers to how pleasant and entertaining is the use of the innovation, separately from any performance consequence that can be deducted from system usage [44,110,119].
Self-efficacy (SE)User’s confidence in his/her capabilities to perform a task, achieve a specific goal, or produce the desired outcomes by properly using an innovative system or device [120,121,122].
System quality (SQ)Technical achievements, the accuracy, and efficiency of the system [123].
Social norm (SN)The extent to which the ideas coming from others may foster or discourage the use of technology [22,124,125].
Table 4. Number of papers reporting path coefficients ( β ) .
Research CategoriesNum. of StudiesStudies with ( β ) w.r.t. PUStudies with ( β ) w.r.t. PEOU
Technology acceptance: theoretical models733
Acceptance of a bundle of technologies622
Acceptance of a methodology633
Acceptance of a device866
Acceptance of a service/platform/system301617
Comparison of the acceptance among different tasks/technologies320
Technology acceptance: the effect of certain moderating variables743
Publisher’s Note: MDPI stays neutral with regard to jurisdictional claims in published maps and institutional affiliations.

