Article

Modeling Land Suitability for Rice Crop Using Remote Sensing and Soil Quality Indicators: The Case Study of the Nile Delta

1
Soil and Water Department, Faculty of Agriculture, Tanta University, Tanta 31527, Egypt
2
Agrarian-Technological Institute of the Peoples’ Friendship University of Russia, ul. Miklukho-Maklaya 6, 117198 Moscow, Russia
3
National Authority for Remote Sensing and Space Sciences (NARSS), Cairo 11843, Egypt
4
Soil and Water Department, Faculty of Agriculture, Kafrelsheikh University, Kafrelsheikh 33516, Egypt
5
Ecological Faculty of the Peoples’ Friendship University of Russia, ul. Miklukho-Maklaya 6, 117198 Moscow, Russia
6
V.V. Dokuchaev Soil Science Institute, Pyzhevsky per., 7, 119017 Moscow, Russia
7
Haikou Experimental Station, Chinese Academy of Tropical Agricultural Sciences (CATAS), Haikou 570100, China
8
Soils, Water and Environment Research Institute, Agricultural Research Center, Giza 12112, Egypt
9
Geography Department, King Saud University, 11451 Riyadh, Saudi Arabia
10
Italian National Research Council, C.da Santa Loja, Tito Scalo, 85050 Potenza, Italy
*
Author to whom correspondence should be addressed.
Sustainability 2020, 12(22), 9653; https://0-doi-org.brum.beds.ac.uk/10.3390/su12229653
Submission received: 3 October 2020 / Revised: 4 November 2020 / Accepted: 13 November 2020 / Published: 19 November 2020
(This article belongs to the Special Issue Remote Sensing for Archaeology and Cultural Landscapes)

Abstract

:
Today, the global food security is one of the most pressing issues for humanity, and, according to Food and Agriculture Organisation (FAO), the increasing demand for food is likely to grow by 70% until 2050. In this current condition and future scenario, the agricultural production is a critical factor for global food security and for facing the food security challenge, with specific reference to many African countries, where a large quantities of rice are imported from other continents. According to FAO, to face the Africa’s inability to reach self-sufficiency in rice, it is urgent “to redress to stem the trend of over-reliance on imports and to satisfy the increasing demand for rice in areas where the potential of local production resources is exploited at very low levels” The present study was undertaken to design a new method for land evaluation based on soil quality indicators and remote sensing data, to assess and map soil suitability for rice crop. Results from the investigations, performed in some areas in the northern part of the Nile Delta, were compared with the most common approaches, two parametric (the square root, Storie methods) and two qualitative (ALES and MicrioLEIS) methods. From the qualitative point of view, the results showed that: (i) all the models provided partly similar outputs related to the soil quality assessments, so that the distinction using the crop productivity played an important role, and (ii) outputs from the soil suitability models were consistent with both the satellite Sentinel-2 Normalize Difference Vegetation Indices (NDVI) during the crop growth and the yield production. From the quantitative point of view, the comparison of the results from the diverse approaches well fit each other, and the model, herein proposed, provided the highest performance. As a whole, a significant increasing in R2 values was provided by the model herein proposed, with R2 equal to 0.92, followed by MicroLES, Storie, ALES and Root as R2 with value equal to 0.87, 0.86, 0.84 and 0.84, respectively, with increasing percentage in R2 equal to 5%, 6% and 8%, respectively. Furthermore, the proposed model illustrated that around (i) 44.44% of the total soils of the study area are highly suitable, (ii) 44% are moderately suitable, and (iii) approximately 11.56% are unsuitable for rice due to their adverse physical and chemical soil properties. The approach herein presented can be promptly re-applied in arid region and the quantitative results obtained can be used by decision makers and regional governments.

1. Introduction

The global food security is a key challenge for the 2030 Agenda for Sustainable Development and one of the most pressing issues for humanity, as highlighted by the annual reports jointly prepared by FAO, IFAD, UNICEF, WFP and WHO. Advances in ending hunger, achieving food security and improving nutrition can be faced also thanks to research and innovation devised for agricultural production. In particular, the possibility of finding the best locations for cultivation according to the specific use and crops can reduce negative environmental impact and increase food production and economic benefits [1,2]. The evaluation of land suitability, defined as an assessment of the “quality” for particular land uses and specific crops [3,4], is a significant step in the sustainable management and land use planning. The assessment of land suitability can not only enable the improvement of crop management system and the raise of land capacity [5,6], but also provide information related to the major factors of shortage in the production of a particular crop [7]. This approach is particularly relevant in arid and semiarid ecosystems, as, for example, in Egypt, where the agricultural activities play a key role in the national economy, and are considered a significant source of income for a sizable part of the population. The agricultural sector in Egypt currently accounts for 38.2% of the labor force and is able to account for an even higher percentage. In Egypt, the management of the different natural resources (land and water) is necessary to maintain food deliveries and for the achievement of agricultural development sustainability; unfortunately, however, the natural resources face critical pressures from the increasing number of people and a continuing land degradation [8]. Egypt has a population of around 100 million (with an increasing grown at a rate of 1.9% per year) mostly (around 97%) concentrated in the basin of the Nile river and the Nile Delta and a significant percentage (around 29%) of the total work force is the agricultural sector [9]. Actually, in Egypt, soil degradation is a pressing issue; as an example, around 809,400 hectares in the North Delta have been lost due to several factors including the increasing levels of water table along with the difficulty of the maintenance of drainage operations and the impacts of sand dunes that threaten the agricultural development. The current situation is critical not only for the sustainability of the agriculture but, and above all, for the entire ecological system [8,10]. The cultivation of rice is spread in all continents of the world (Europe, Africa, Asia, North America, South America and Australia). The total world production was 741 million tons in 2013. Rice (Oryza sativa L.) is one of the most important cereal grains in the world and provides a major contribution to fulfill the food needs across the globe, serving as a food source for more than half of the world’s population [11]. In addition, it supplies an amount of carbohydrates ranging between 20%–30% of the energy needed per capita, along with protein ranging between 10%–13% of the proteins consumed around the world [12]. Rice will become increasingly more valuable if the population of developing countries, which are highly dependent on rice, increases in the future. Rice is one of the most important export crops that bring in hard currency and affect the Egyptian economy; annually, about 0.5 million hectares are cultivated, and a total production is around 6.1 million tones [13]. Moreover, in many countries of Africa, rice is a major part of the diet and, therefore, it has an increasing growing importance in the strategic food security planning policies of many African countries, where a large quantities of rice are imported from other continents. According to FAO, to face Africa’s inability to reach self-sufficiency in rice, it is urgent “to redress to stem the trend of over-reliance on imports and to satisfy the increasing demand for rice in areas where the potential of local production resources is exploited at very low levels” (http://www.fao.org/3/X2243T/x2243t05.htm).
In this context, it is important to consider that the growth of rice plants depends on the physical and chemical conditions of the soil, which affect the ability of the crop root system to grow efficiently. Agricultural operations such as the preparation of the ground for cultivation, tillage, fertilization, irrigation management and planting methods alter the soil properties at short and long term, thus impacting directly both the sustainability and the crop performance system. To assess the land conditions, three general types of methods are generally used, as:
(i)
qualitative evaluations [14,15,16,17] that are mainly based on expert decisions and qualitative procedures to obtain physical suitability and categorize it in several ranked classes.
(ii)
parametric-quantitative methods [18,19,20,21], which are used to evaluate the degrees of soil suitability using a continuous scale instead of discrete land capability classes.
(iii)
simulation models [5,14,15,22,23], wherein performance of land is depending on land characteristics individually, and the final effect is evaluated using land function models.
Moreover, during the last four decades, remote sensing and GIS have been increasing used for several application fields including the assessment of land suitability [24,25,26]. Nevertheless, it is important to consider that to assess land suitability [24,25,26] and delineate various physiographic units, it is mandatory to integrate remote-sensing-based parameters (input factors of the models) with ancillary information related to site characteristics (including slope, aspect, elevation) and soil survey.
In the current study, to assess and map soil suitability for rice crop, a new method was designed for the land evaluation based on both soil quality indicators and remote sensing data. Results from the investigations, performed in some areas in the northern part of the Nile Delta, were compared with two parametric (the square root, Storie methods) and two qualitative (ALES and MicrioLEIS) methods selected among the most commonly used approaches.

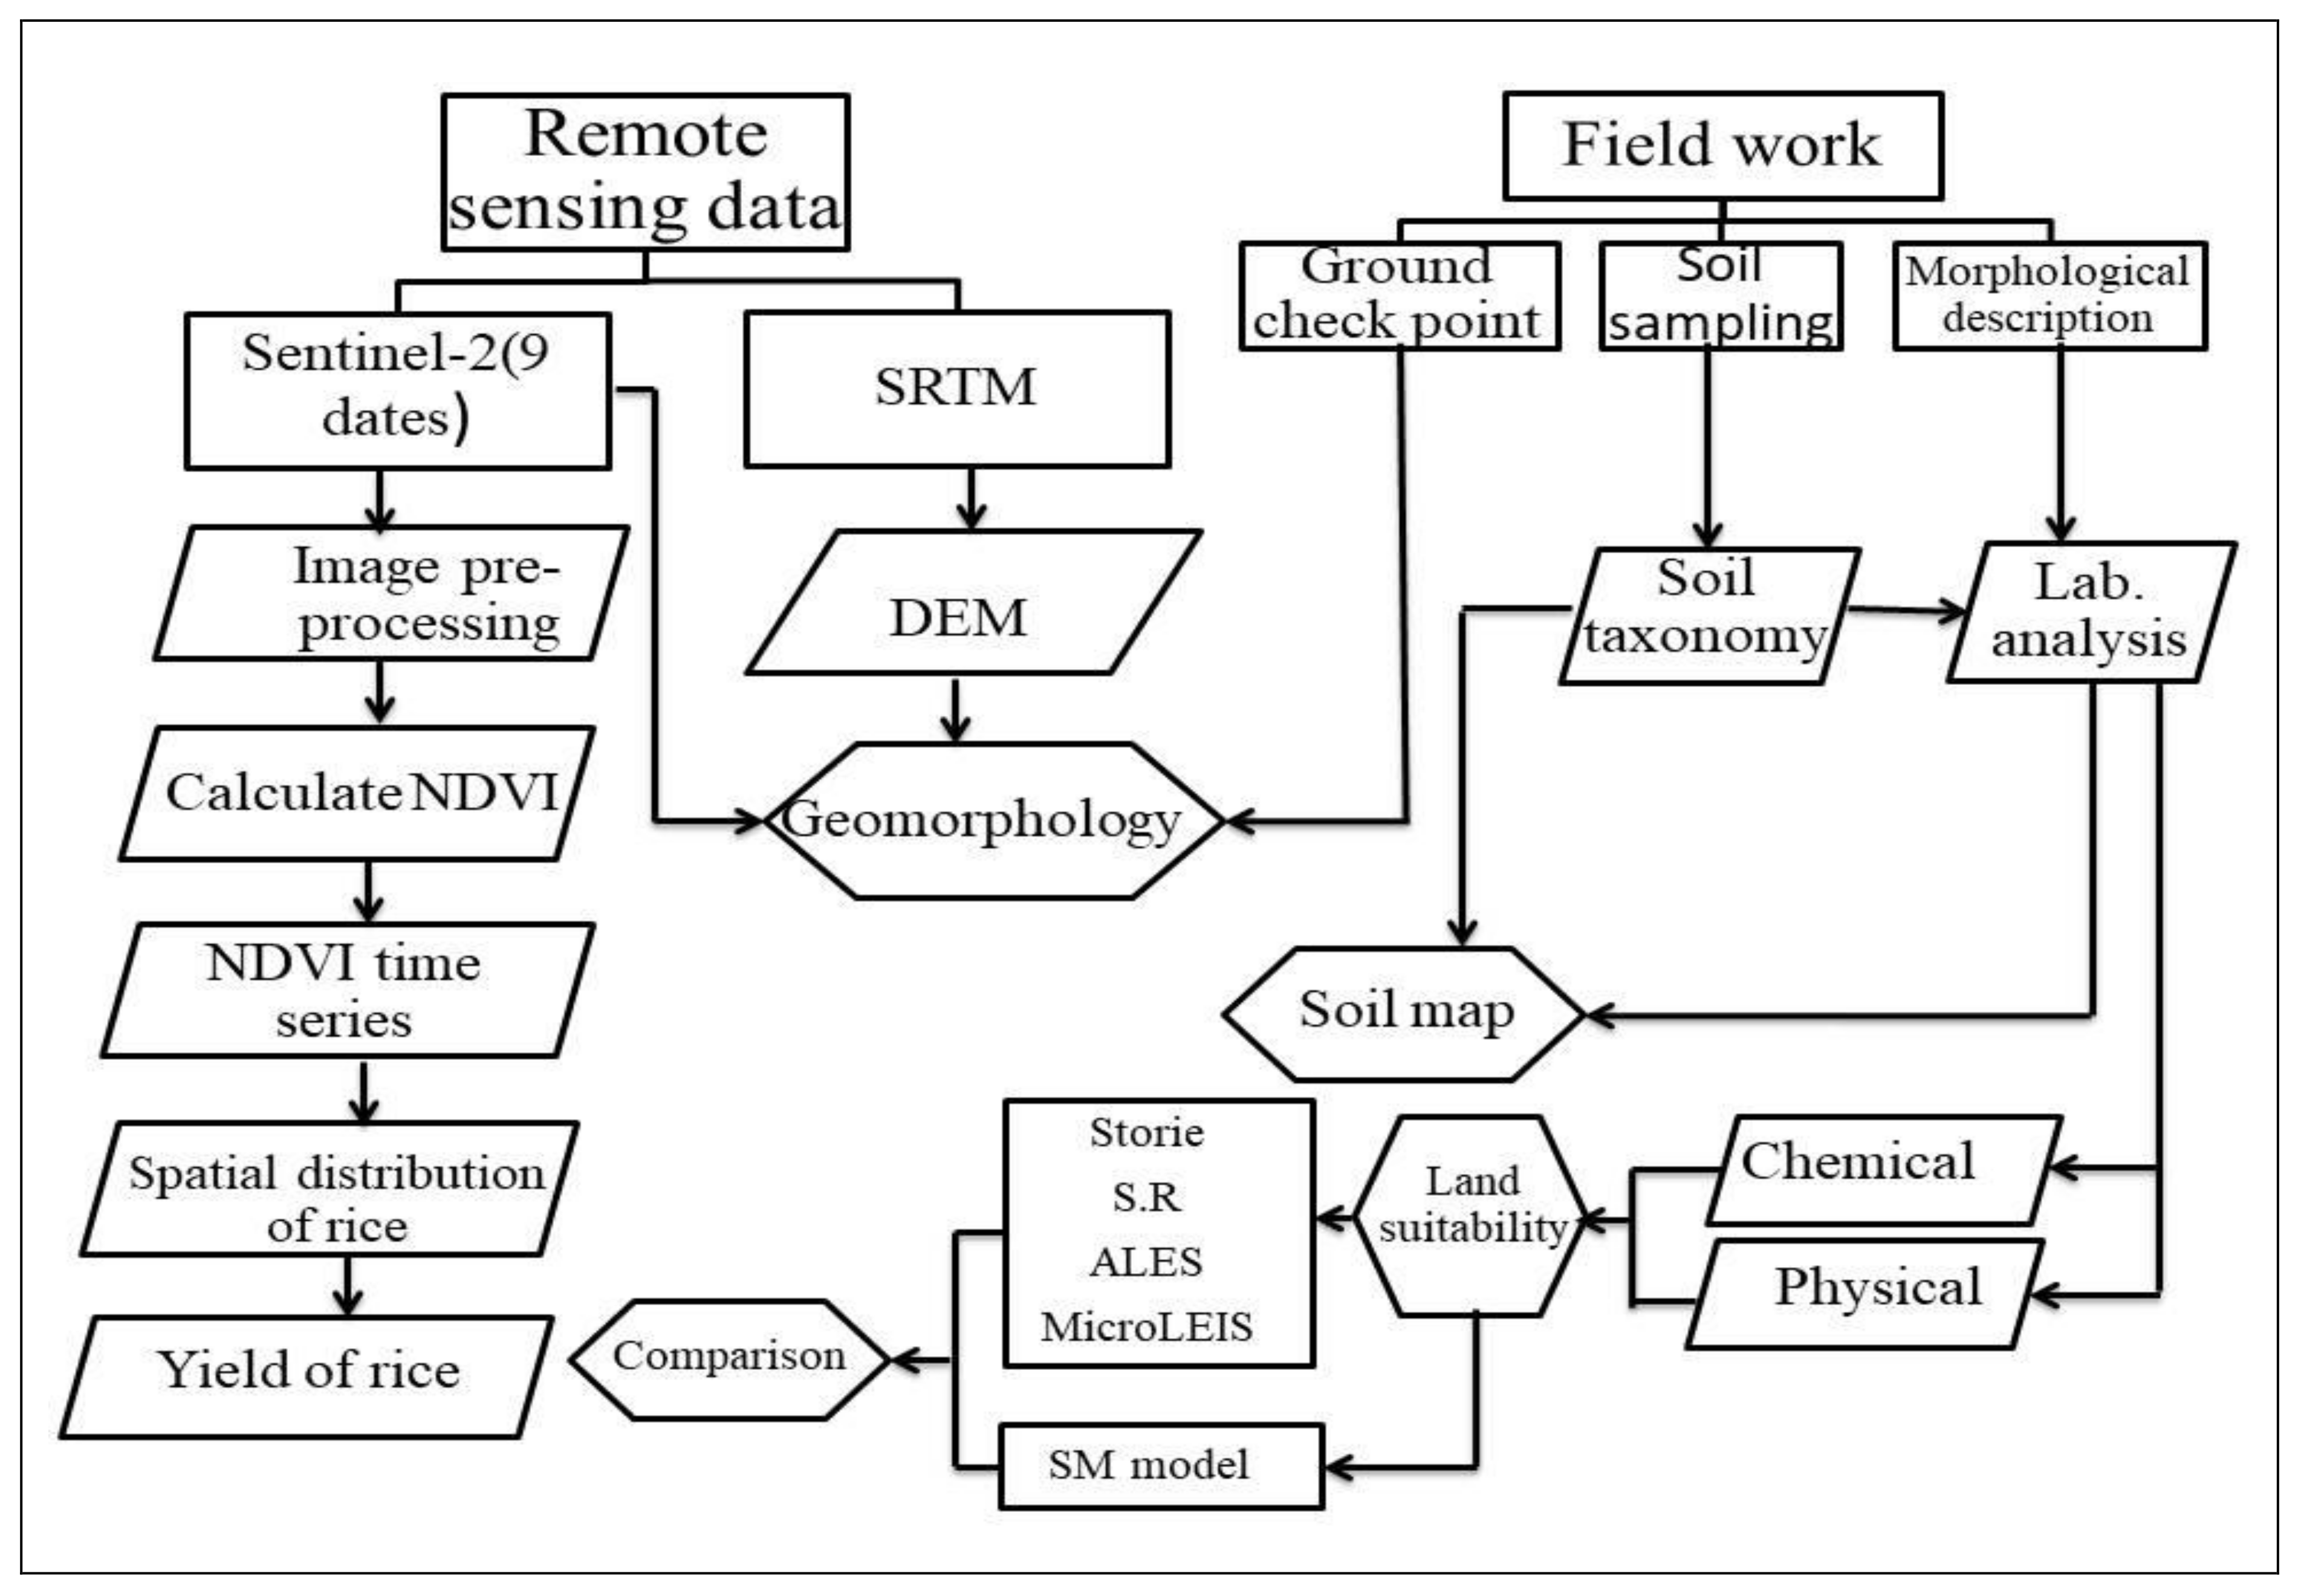
2. Materials and Methods

The method herein proposed is made up of four diverse steps, as depicted in Figure 1:
(i)
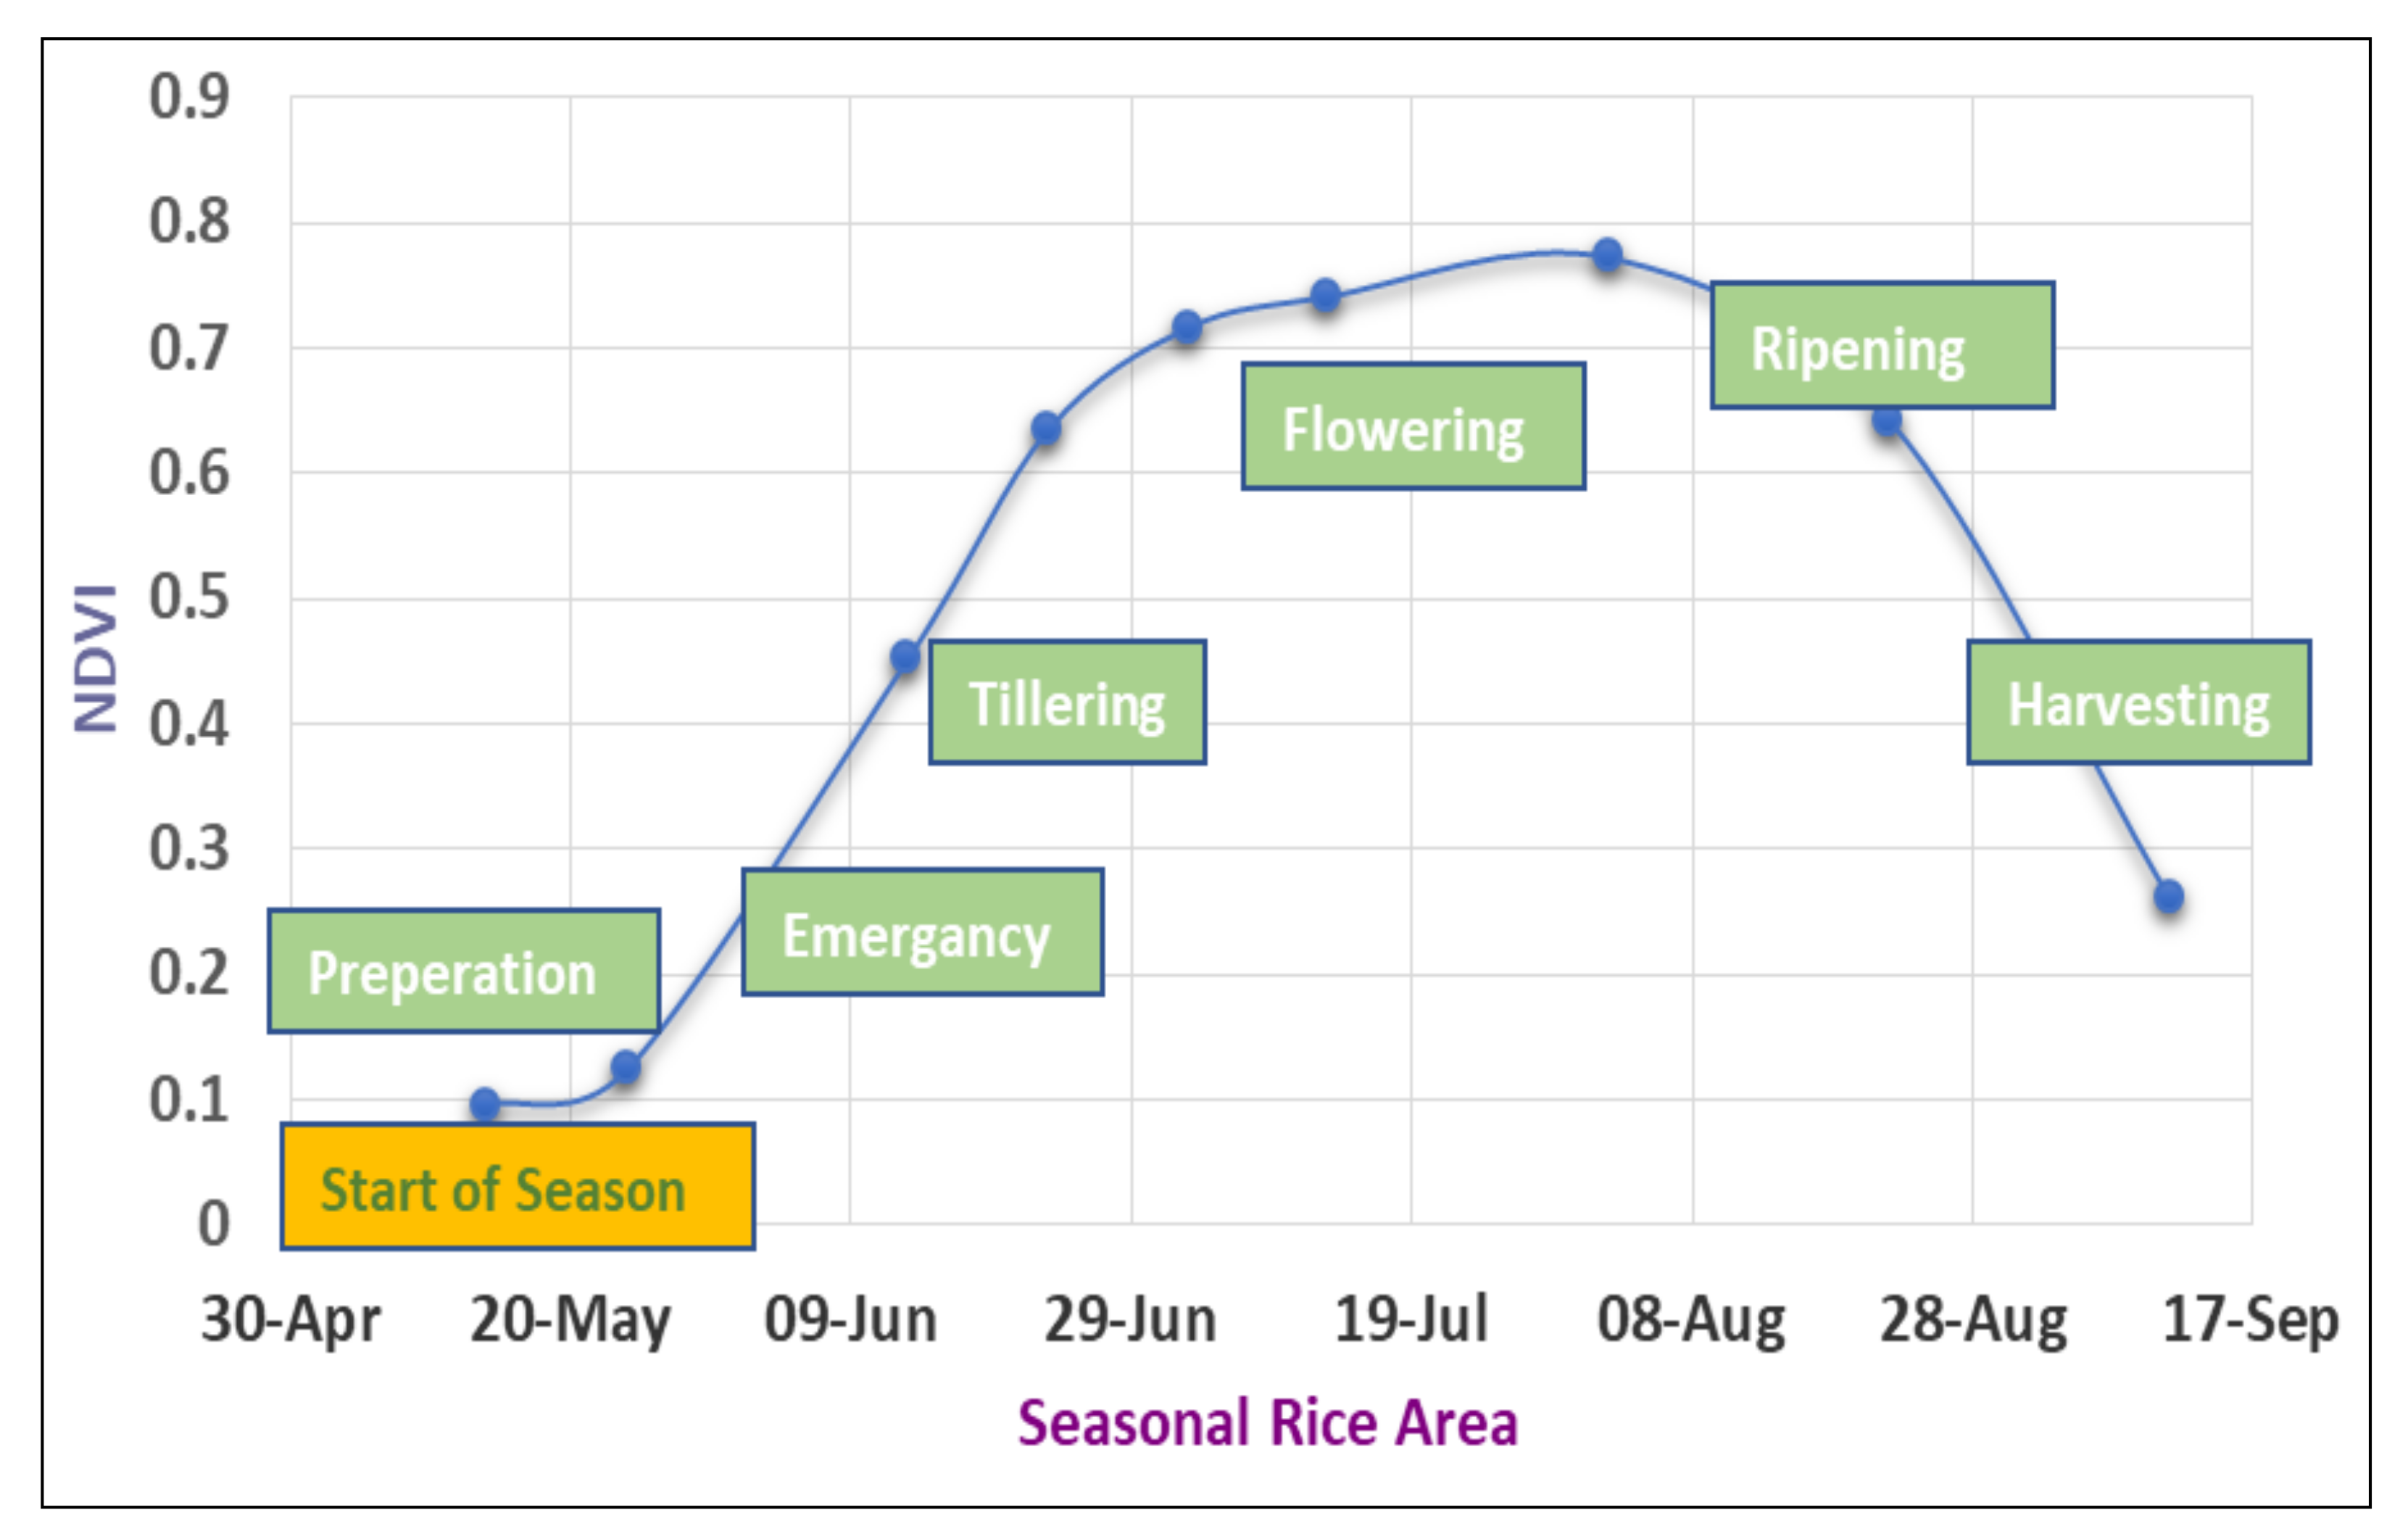
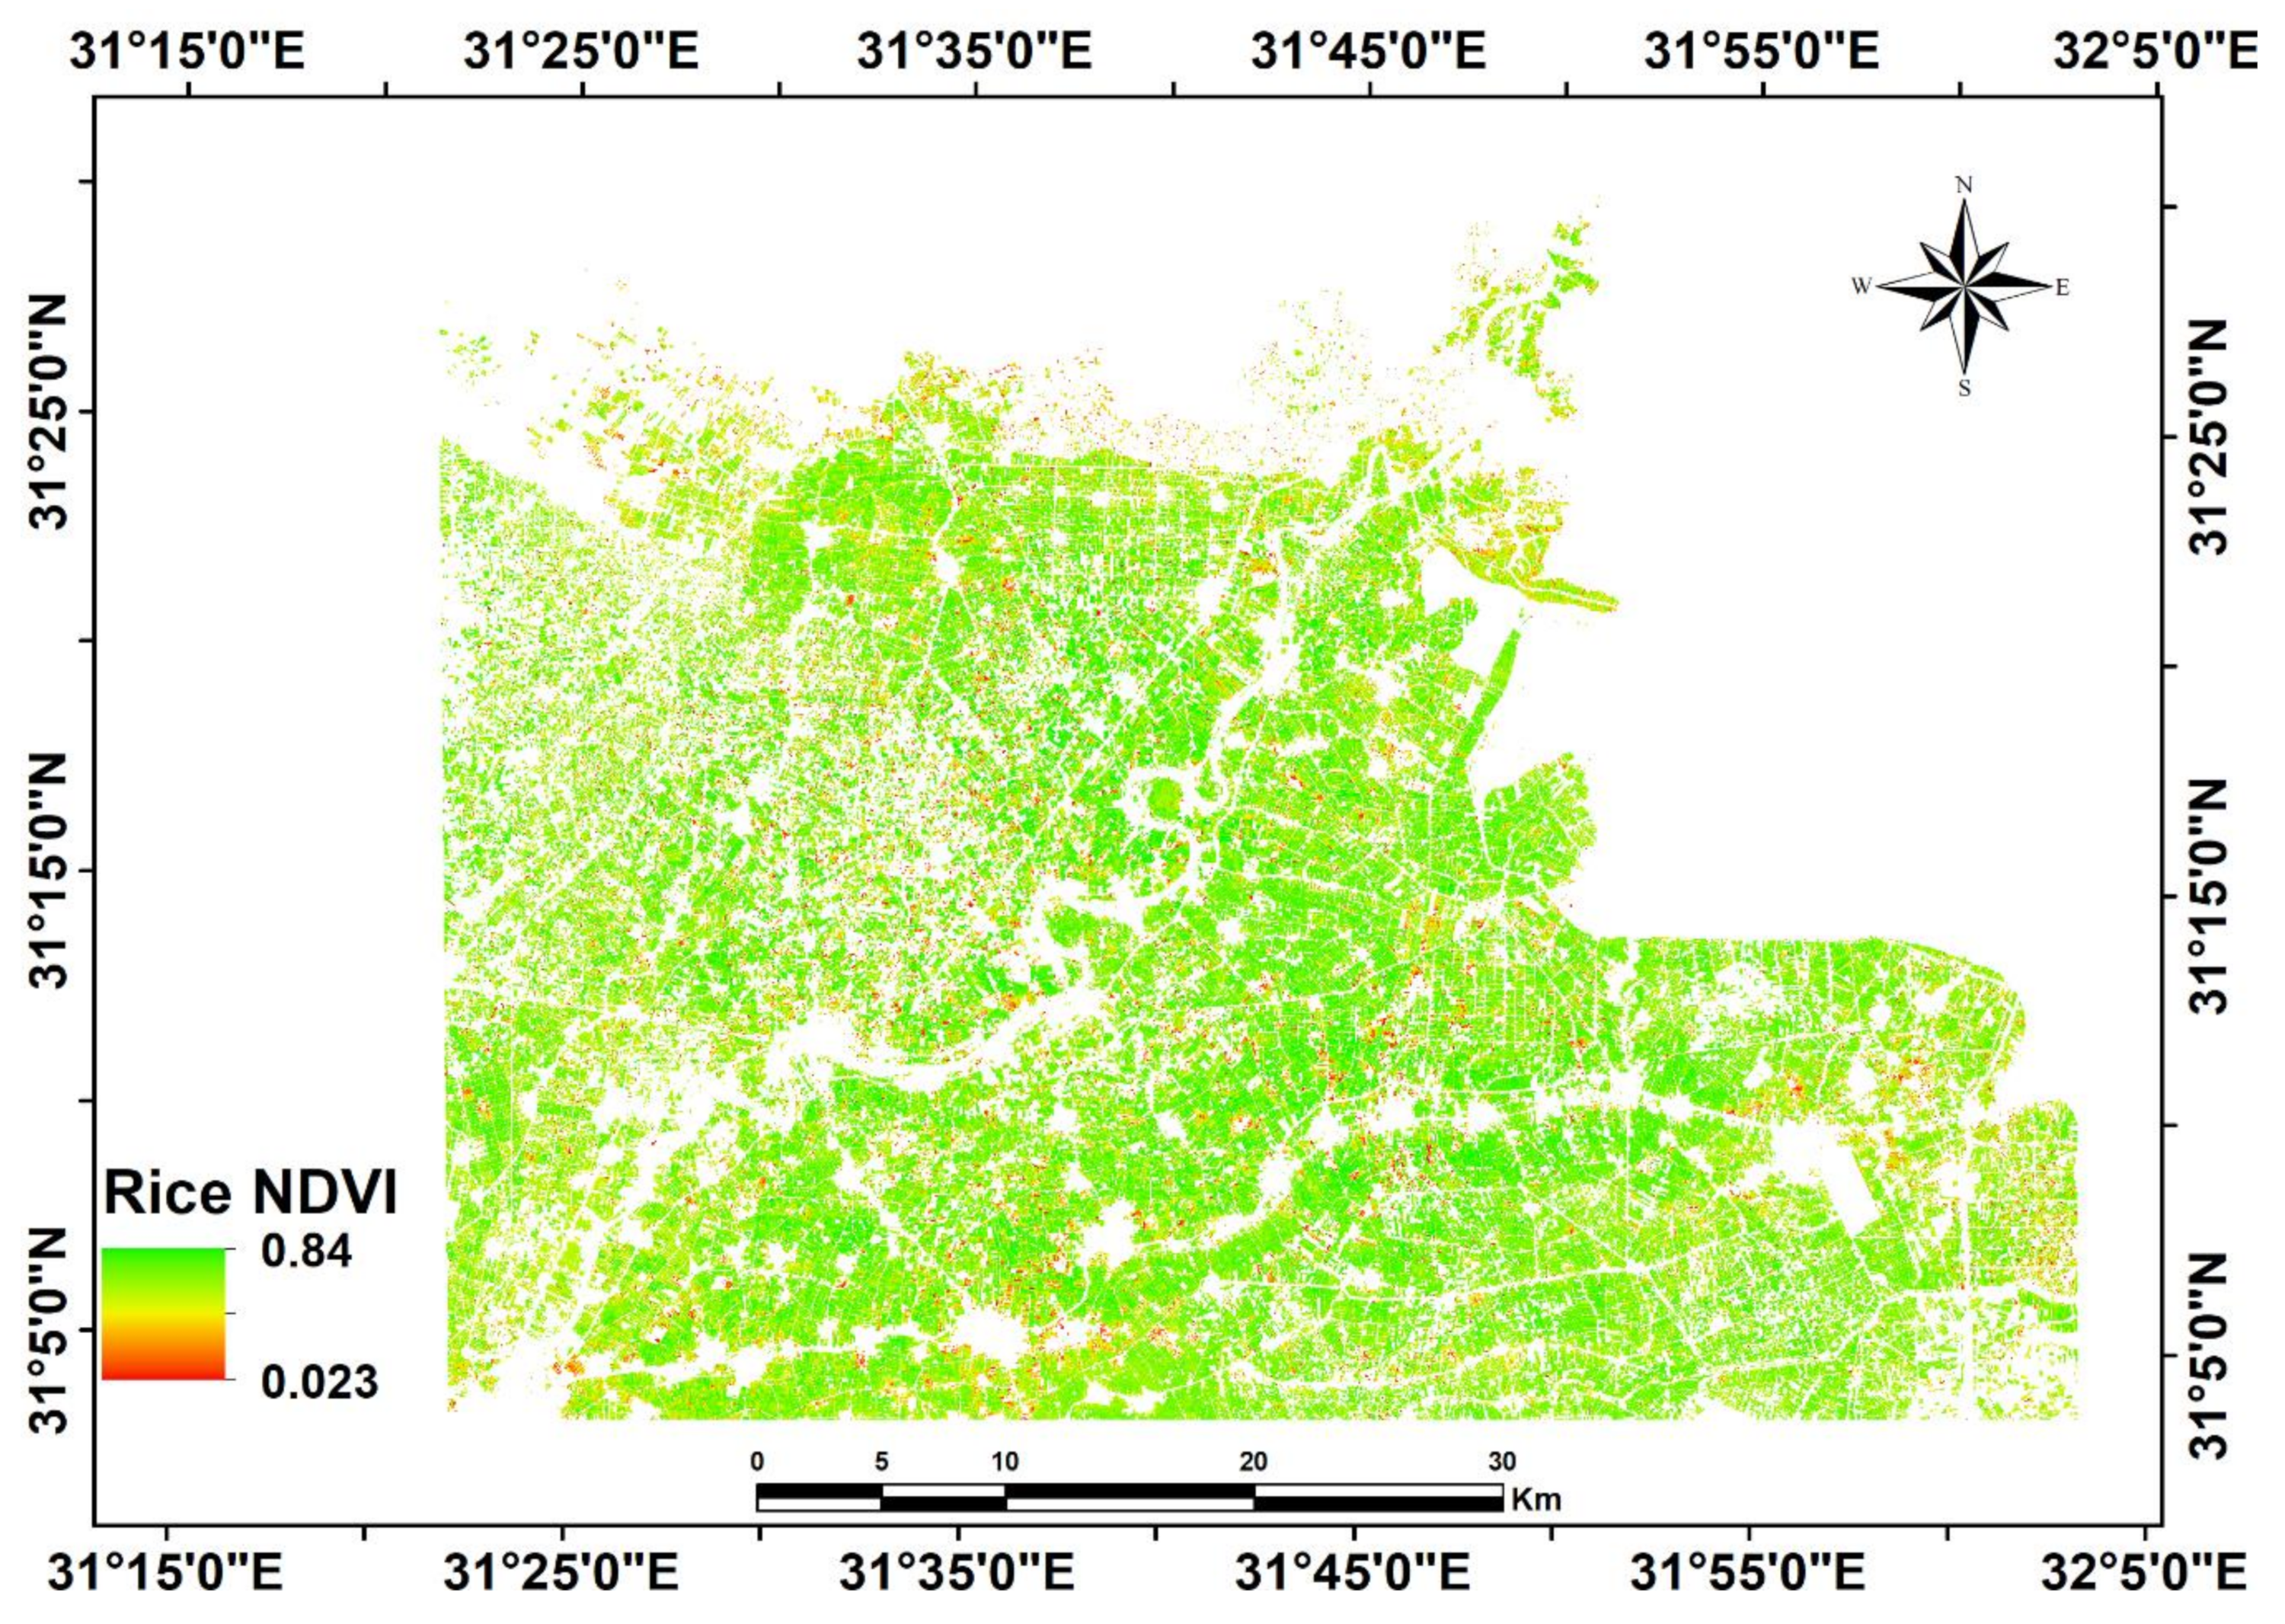
remote sensing data (based on Sentinel-2 images and SRTM DEM) were used to calculate Normalize Difference Vegetation Index time series (NDVITS) of rice crop (recognized as a suitably satellite based indicator of crop growth, state and production) and to extract geomorphologic units.
(ii)
fieldworks were conducted in the study area to collect primary data and ground reference information using a global positioning system (GPS) receiver to determine the locations of profiles and check the accuracy of mapping units boundaries.
(iii)
laboratory analyses were performed for obtaining physical and chemical soil properties.
(iv)
parametric and qualitative methods were applied to calculate land suitability.
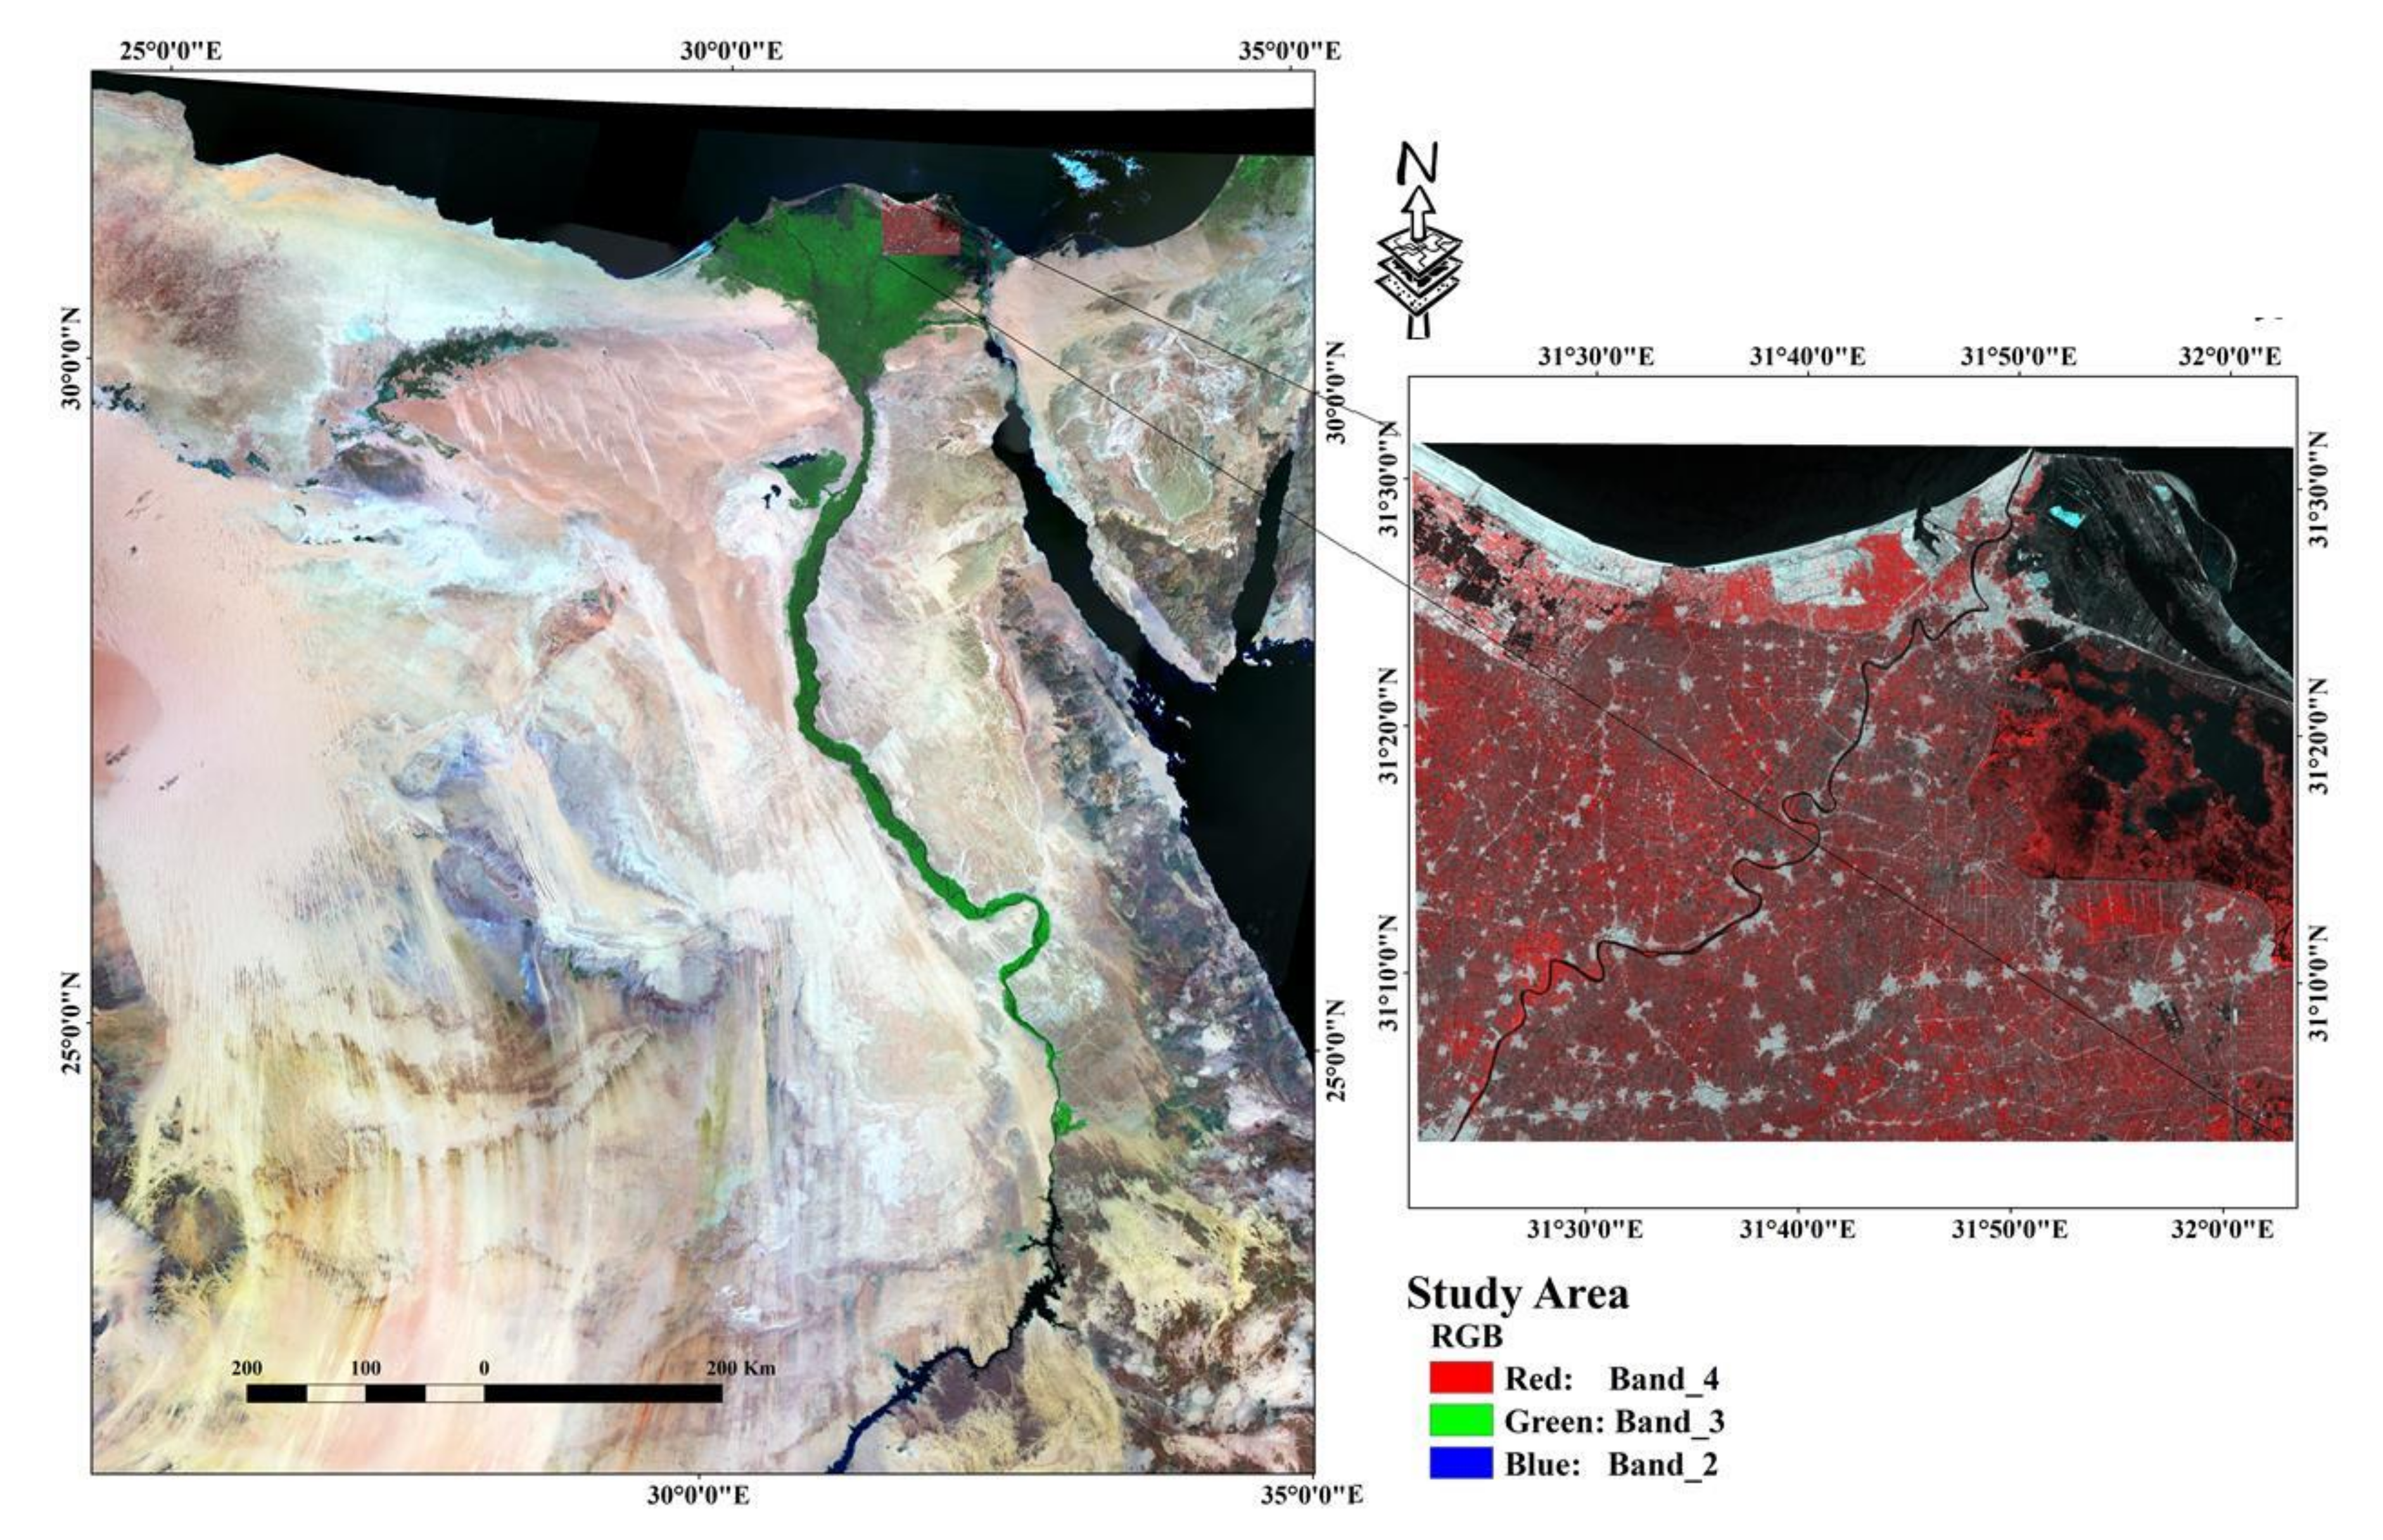
The proposed approach was used for assessing the land suitability for rice cultivation and validated using a comparison with the outputs obtained from other independent methods.

2.1. Study Area

The study area is located in the northeastern of the Nile Delta in geographical location UTM zone 36 (31°03′27″–31°31′36″ N; 31°21′40″–32°10′29″ E), covering about 2543 km2 (Figure 2). The study area is characterized by a Mediterranean climate (a hot arid summer and little rain in winter). The maximum rainfall varies from 49.0 to 59.5 mm and is recorded in January and December. Temperatures are depending on seasons as they are high during summer, reaching 31 °C in August, and relatively low in winter, where temperature reaches 18 °C in January. Coinciding with the advent of the summer season, when temperatures rise relatively between June and September, the potential evaporation increases (5.4 mm/day). The potential evaporation values are low (3.2 mm/day) between January and December [27,28], the soil temperature regime is “thermic,” and the soil moisture regime is “torric” according to the USDA soil taxonomy system [29]. Geological studies indicate that the region had been formed during the last part of Miocene and the beginning of Pliocene, the surface of the area occupied by formations of the Quaternary and Holocene. In the study area, the agricultural lands are generally irrigated from several sources, including freshwater, drainage water and mixed water [30]. The common cultivated orchards are date palm tree, guava, citrus, banana and orchards, and the main cultivated crops are rice, cotton, clover, corn, barley and beans. Vegetables, such as tomato, eggplant, potato, watermelon and others, are grown in small, scattered areas.

2.2. Digital Image Processing

In the current study, Sentinel-2 data were selected for their free availability and spatial accuracy (see Table 1). For the purposes of our investigations, we focused on the vegetation indices (VIs) obtained using the red, blue and infrared spectral bands. In particular, Sentinel-2 (10-days) composite of multispectral product at 10 m spatial resolution were downloaded from the ESA website for diverse seasons of the year 2017 (see Table 1) to cover each rice crop growth stage. Sentinel-2 data were atmospherically corrected using the FLAASH model available in ENVI 5.3 software [31,32].

2.3. Fieldwork and Laboratory Analyses

The fieldwork studies were conducted to collect ground truth data, identify the geomorphological units and assess the information obtained from the satellite data. To examine the precision of the units of map and represent the different map units, as a whole, 120 check points were collected and soil profiles (30) were dug. The morphological description was obtained from studying the soil profiles according to the procedure outlined by the FAO [33]. One hundred and fifteen representative soil samples were taken from the soil profiles, and the soil properties of the samples were assessed using standard analytical methods [34,35,36,37,38,39]. The soils were classified to the sub-group level based on the USDA soil taxonomy classification [29].

2.4. Land Suitability Assessment

Analysis of land sustainability according to this model can support the achievement of regional food security improving agricultural land use management through yield prediction [40].
Four indicators were used to assess the suitability degrees for rice crop (rice land suitability): soil fertility index, physical quality index, chemical quality index and the rice normalized difference vegetation index (RNDVI). The selection of the factors that influence the soil properties (fertility, chemical and physical) was based on the fundamental properties of soils i.e., parent materials, soil texture and depth, characteristics that can be altered by human management (e.g., drainage, salinity, nutrient concentration and vegetation cover) and the rice growth requirement according to [41,42,43,44,45]. In this paper, the NDVI of rice was used as it is correlated with a lot of important biophysical properties and generates several different crop indices [46].The percentage of vegetative biomass in the study as captured in satellite data is very important in the monitoring of rice crop and the estimation of crop yield.
The evaluation of the soil suitability for the rice crop production is based on several steps as follows: (i) the maps resulted from the soil Fertility quality index FQI, Chemical quality index CQI, Physical quality index PQI, and RNDVI were converted to raster; (ii) these raster were classified; (iii) each layer was weighted and overlaid to the other layers; (iv) each cell was reclassified to soil suitability degree, and, finally, (v) the output data were presented and evaluated as a map of land suitability (Figure 3).
Equation (1) was used to calculate suitability of land for rice crop using a GIS spatial capability, as shown in Figure 4:
LSR = (FQI × CQI × PQI × RNDVI)1/4
where LSR is the land suitability of rice crop; QI, CQI, and PQI are the fertility, soil chemical and soil physical quality indices, respectively; and RNDVI is the rice normalized difference vegetation index.
The fertility quality index (FQI) has been calculated based on the following Equation (2):
FQI = (Sn × Sp × Sk × Szn × SSOM)1/5
where Sn, Sp, and Sk, are parameters related to available macro nutrients (N, P, K, respectively), as well as SZn and SSOM available zinc and soil organic matter (SOM content), respectively.
The following Equation (3) was used to calculate the index of chemical quality:
CQI = (SS × SE × SC × SH)1/4
where SS, SE, SC, and SH are the soil salinity, Exchangeable sodium percent (ESP), CaCO3 content and soil pH parameters, respectively.
The physical quality index (PQI) was calculated using the following Equation (4):
PQI = (SR × ST × SD × SF × SY × SP × SG)1/7
where SR is drainage condition, ST is soil texture, SD is soil depth, SF is slope, SY is surface stoniness, SP is hardpan and SG is hydraulic conductivity, respectively.
A rating reflects, usually in numerical terms, how suitable a site is for supporting a specific land use, and there is no uniform standard for rating factors [3]. Table 2, Table 3 and Table 4 show the different rates where the acceptable scores range from 0.2 to 1, namely, from the worst condition to the best conditions [45,46].
The land suitability for rice was divided into the following classes (highly suitable (S1), moderately suitable (S2), marginally suitable (S3) and unsuitable (N). A comparison was done between the results obtained from the proposed model and the outputs from the two parametric (the Square root, Storie methods) and two qualitative methods ALES model and MicroLEIS modelS.
The Storie method was used to estimate the land suitability index according to the following Equation (5):
SI = A × B/100 × C/100 × D/100
where SI is the Storie index; A is soil parameter of surface texture rating, and B, C and D present the other parameters rating values. To generate an index rating, a score fluctuating from 0% to 100% is defined for each element; in addition, the scores are obtained [47]. The square root was used based on the following Equation (6):
I = Rmin√(A/100 × B/100 × C/100)
As I is the square root index; Rmin is the minimum rating, and A,B,C, are the other values of rating [45].
The automated land evaluation system (ALES) is a computer program that lets land assessors to build expert systems and assessment of land depends on the FAO method “Framework for Land Evaluation” [48].
MicroLEIS is a combined software for evaluating land data and agro-ecological systems. MicroLEIS is considered as a computer-based has set of functions for the systematic arrangement and gives a logical explanation of land resource [15]. The data input parameters for this model include the depth of roots, soil texture, calcium carbonate, drainage condition, salinity and soil profile development.
The validation of the results from these models was performed using the kappa test to check the fit among the different results [49] and assess the variance of the fitting degree. This actually is an indicator of the fit among the diverse outputs, so that Kappa values from 0 to 1 show a poor (in the case of 0) or an almost a perfect fit (in the case of 1), respectively.

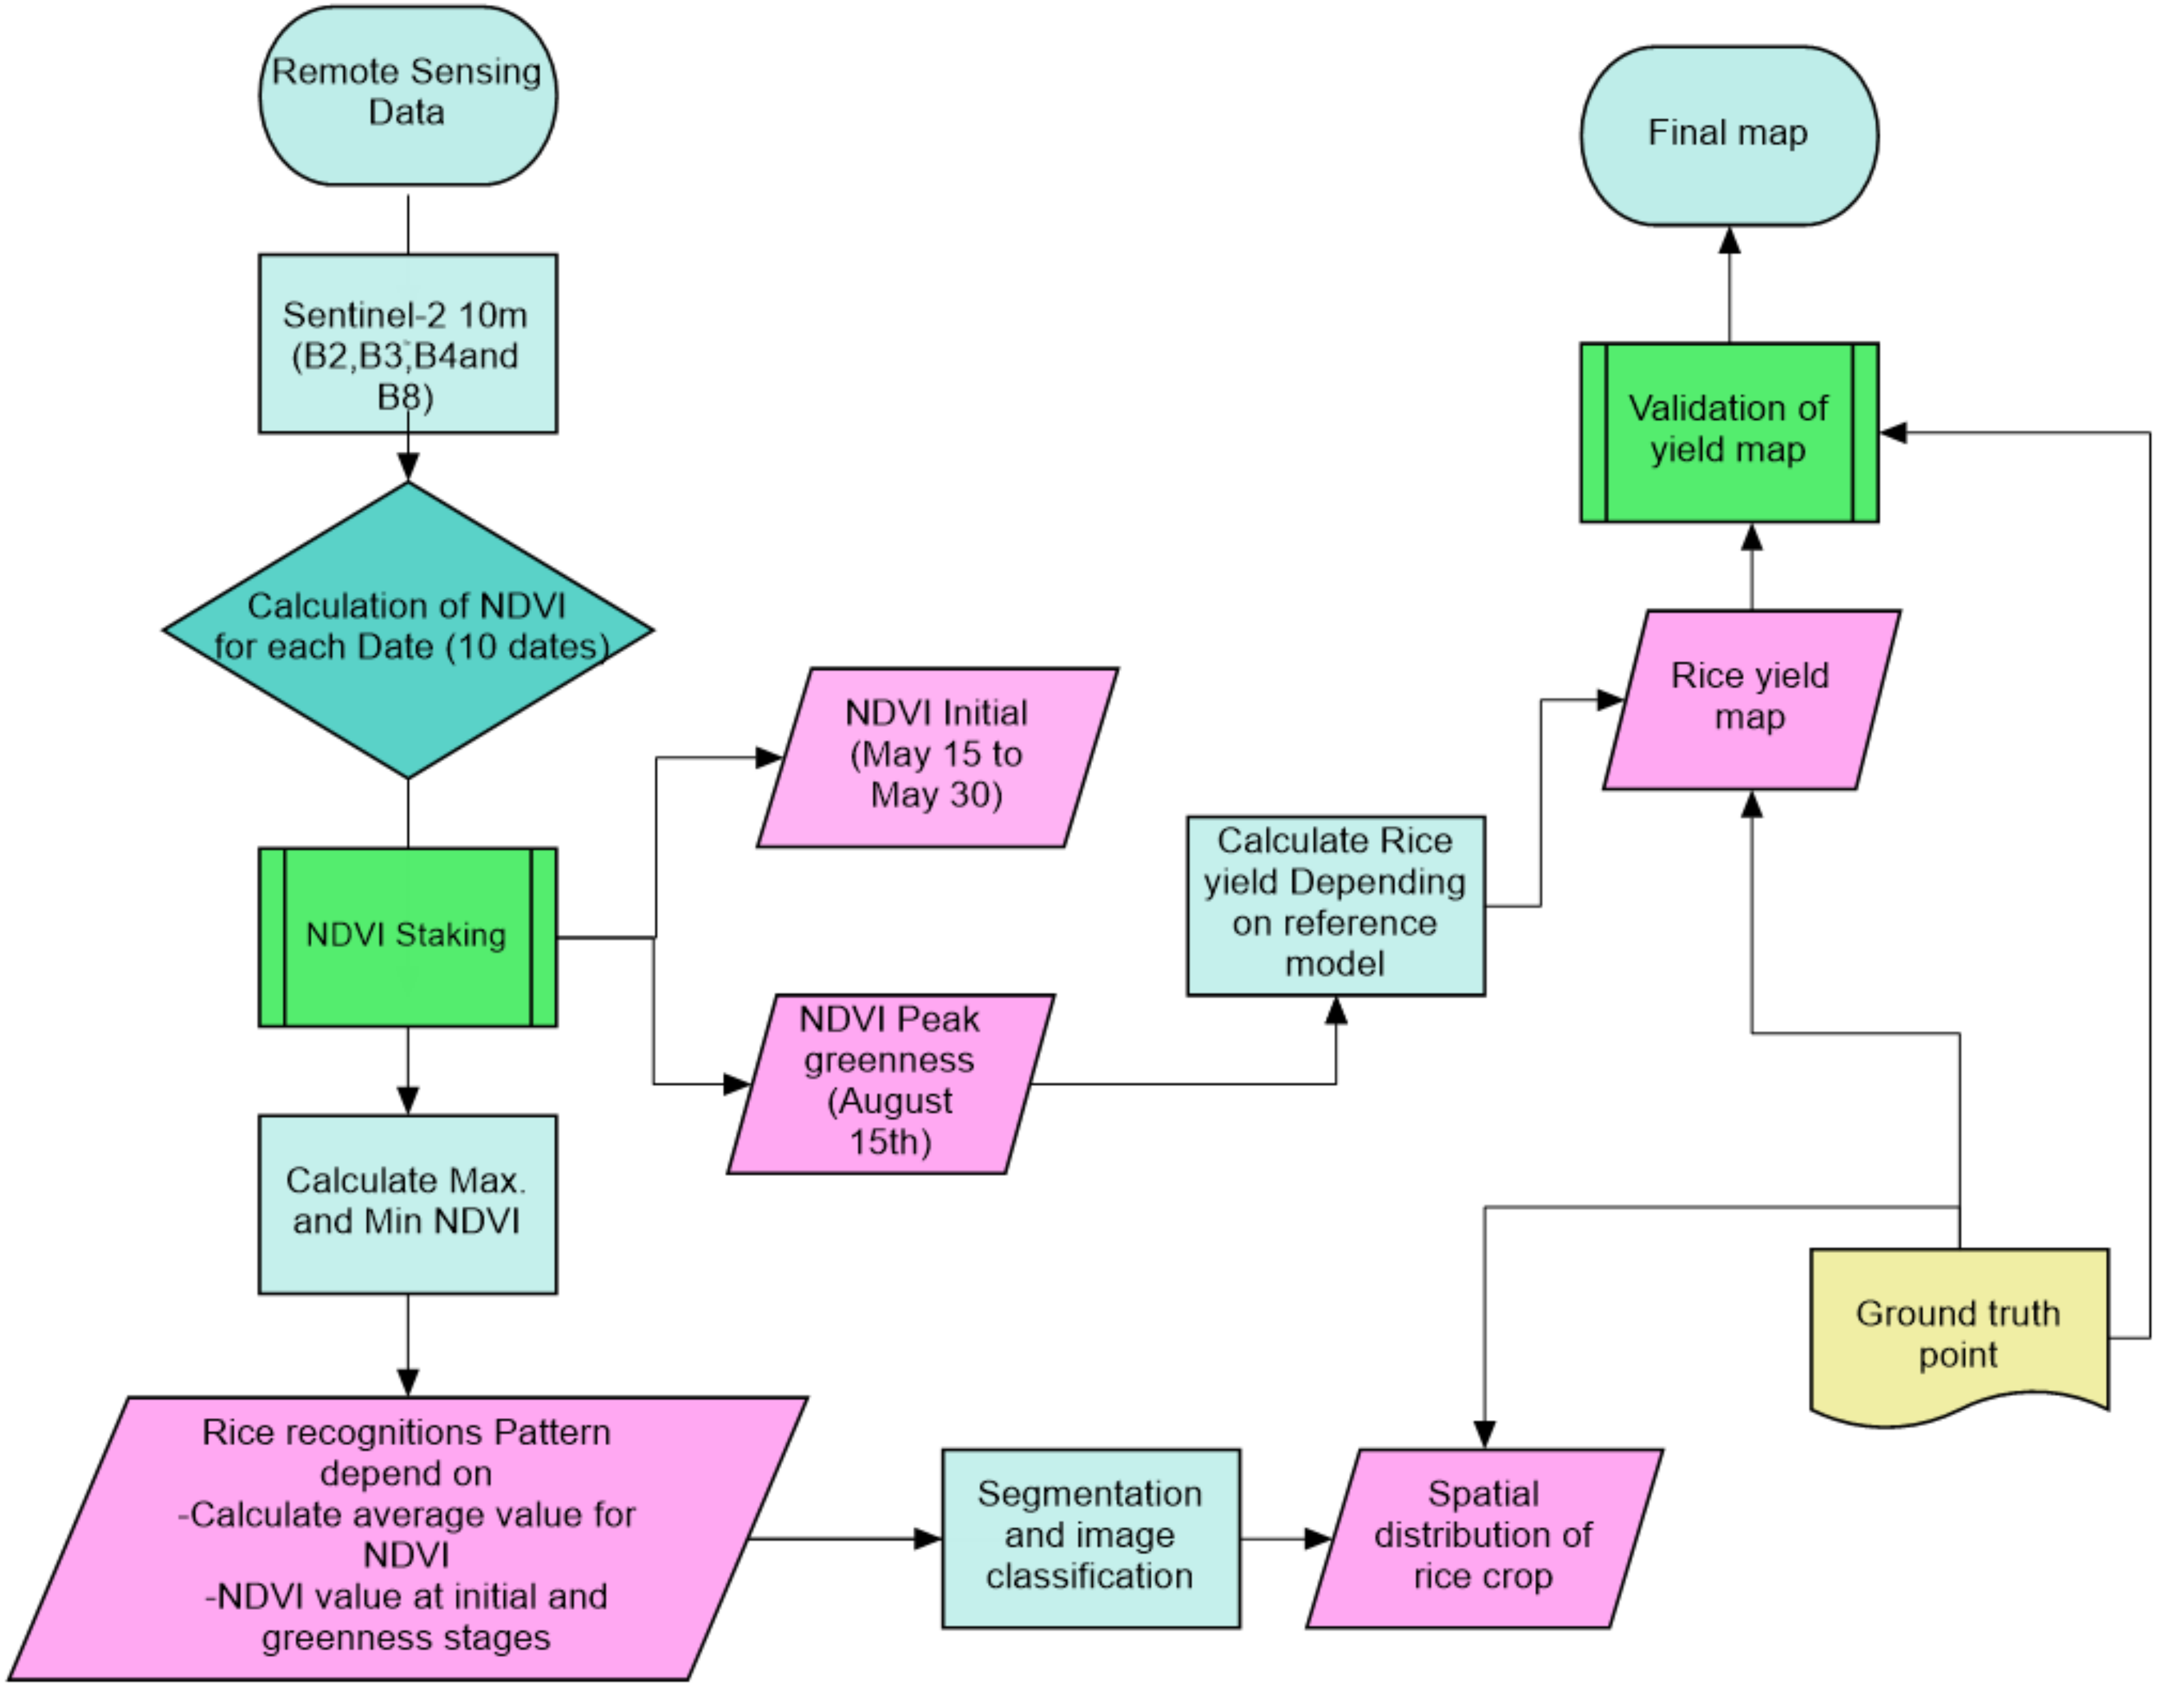
2.5. Calculation and Stacking of NDVI Images

Figure 4 shows the diagram of the proposed method devised to estimate how the area under investigation is suitable for the rice cultivation using remote sensing and GIS techniques. It depends on the following major components: (i) average and standard deviation of NDVI time series; (ii) threshold value for NDVI to mask non agriculture areas; (iii) many resolution segmentations along with post classification methods to define the signatures of rice in temporal dimension; (iv) classification, calibration and validation as well as the determination of the rice spatial distribution in the selected study area. The following flowchart shows the methods subsections in brief.
The identification of the NDVI-based temporal signatures of rice growth stage during the diverse seasons was made using the segmentation and clustering of the NDVI time-series (May–September 2017) on the basis of the NDVI distribution value. We considered nine classes obtained from the thresholds of the average values (0.85), similarly to previous studies [50,51,52] adopted for the ability to: (i) categorize both the spectral and temporal similarities; (ii) determine classes on the basis of the characteristics of the time-series; and (iii) discriminate areas covered by different crop types and heterogeneous landscape.
The signature was temporally defined by determining the average of NDVI changes during the crop growth stages and validated using data obtained from field survey, which clearly confirmed the capability of Sentinel-2 data to discriminate (i) rice crops from irrigation systems [53], and (ii) the phenology of rice crop from the NDVI temporal characteristics NDVI-values.
The average and standard deviation values of NDVI were used to determine the thresholds, which capture the NDVI images during the season of rice (from May to September) and produced rice area map. These were evaluated against ground-based information.

2.6. Object-Based Classification

The classification methods to discriminate rice yield was made using an object-based classification, based on a multi-resolution segmentation available in the eCognition® software.
After the segmentation, a standard nearest-neighbor algorithm (with manual sample selection) was used to classify objects into nine layer basic classes; among them, eight classes identified the diverse crops as: rice, maize, orange, banana, peanut, grape, cabbage and mango, and the other class as non-cultivated lands (as bare soil, urban, etc.). [54].

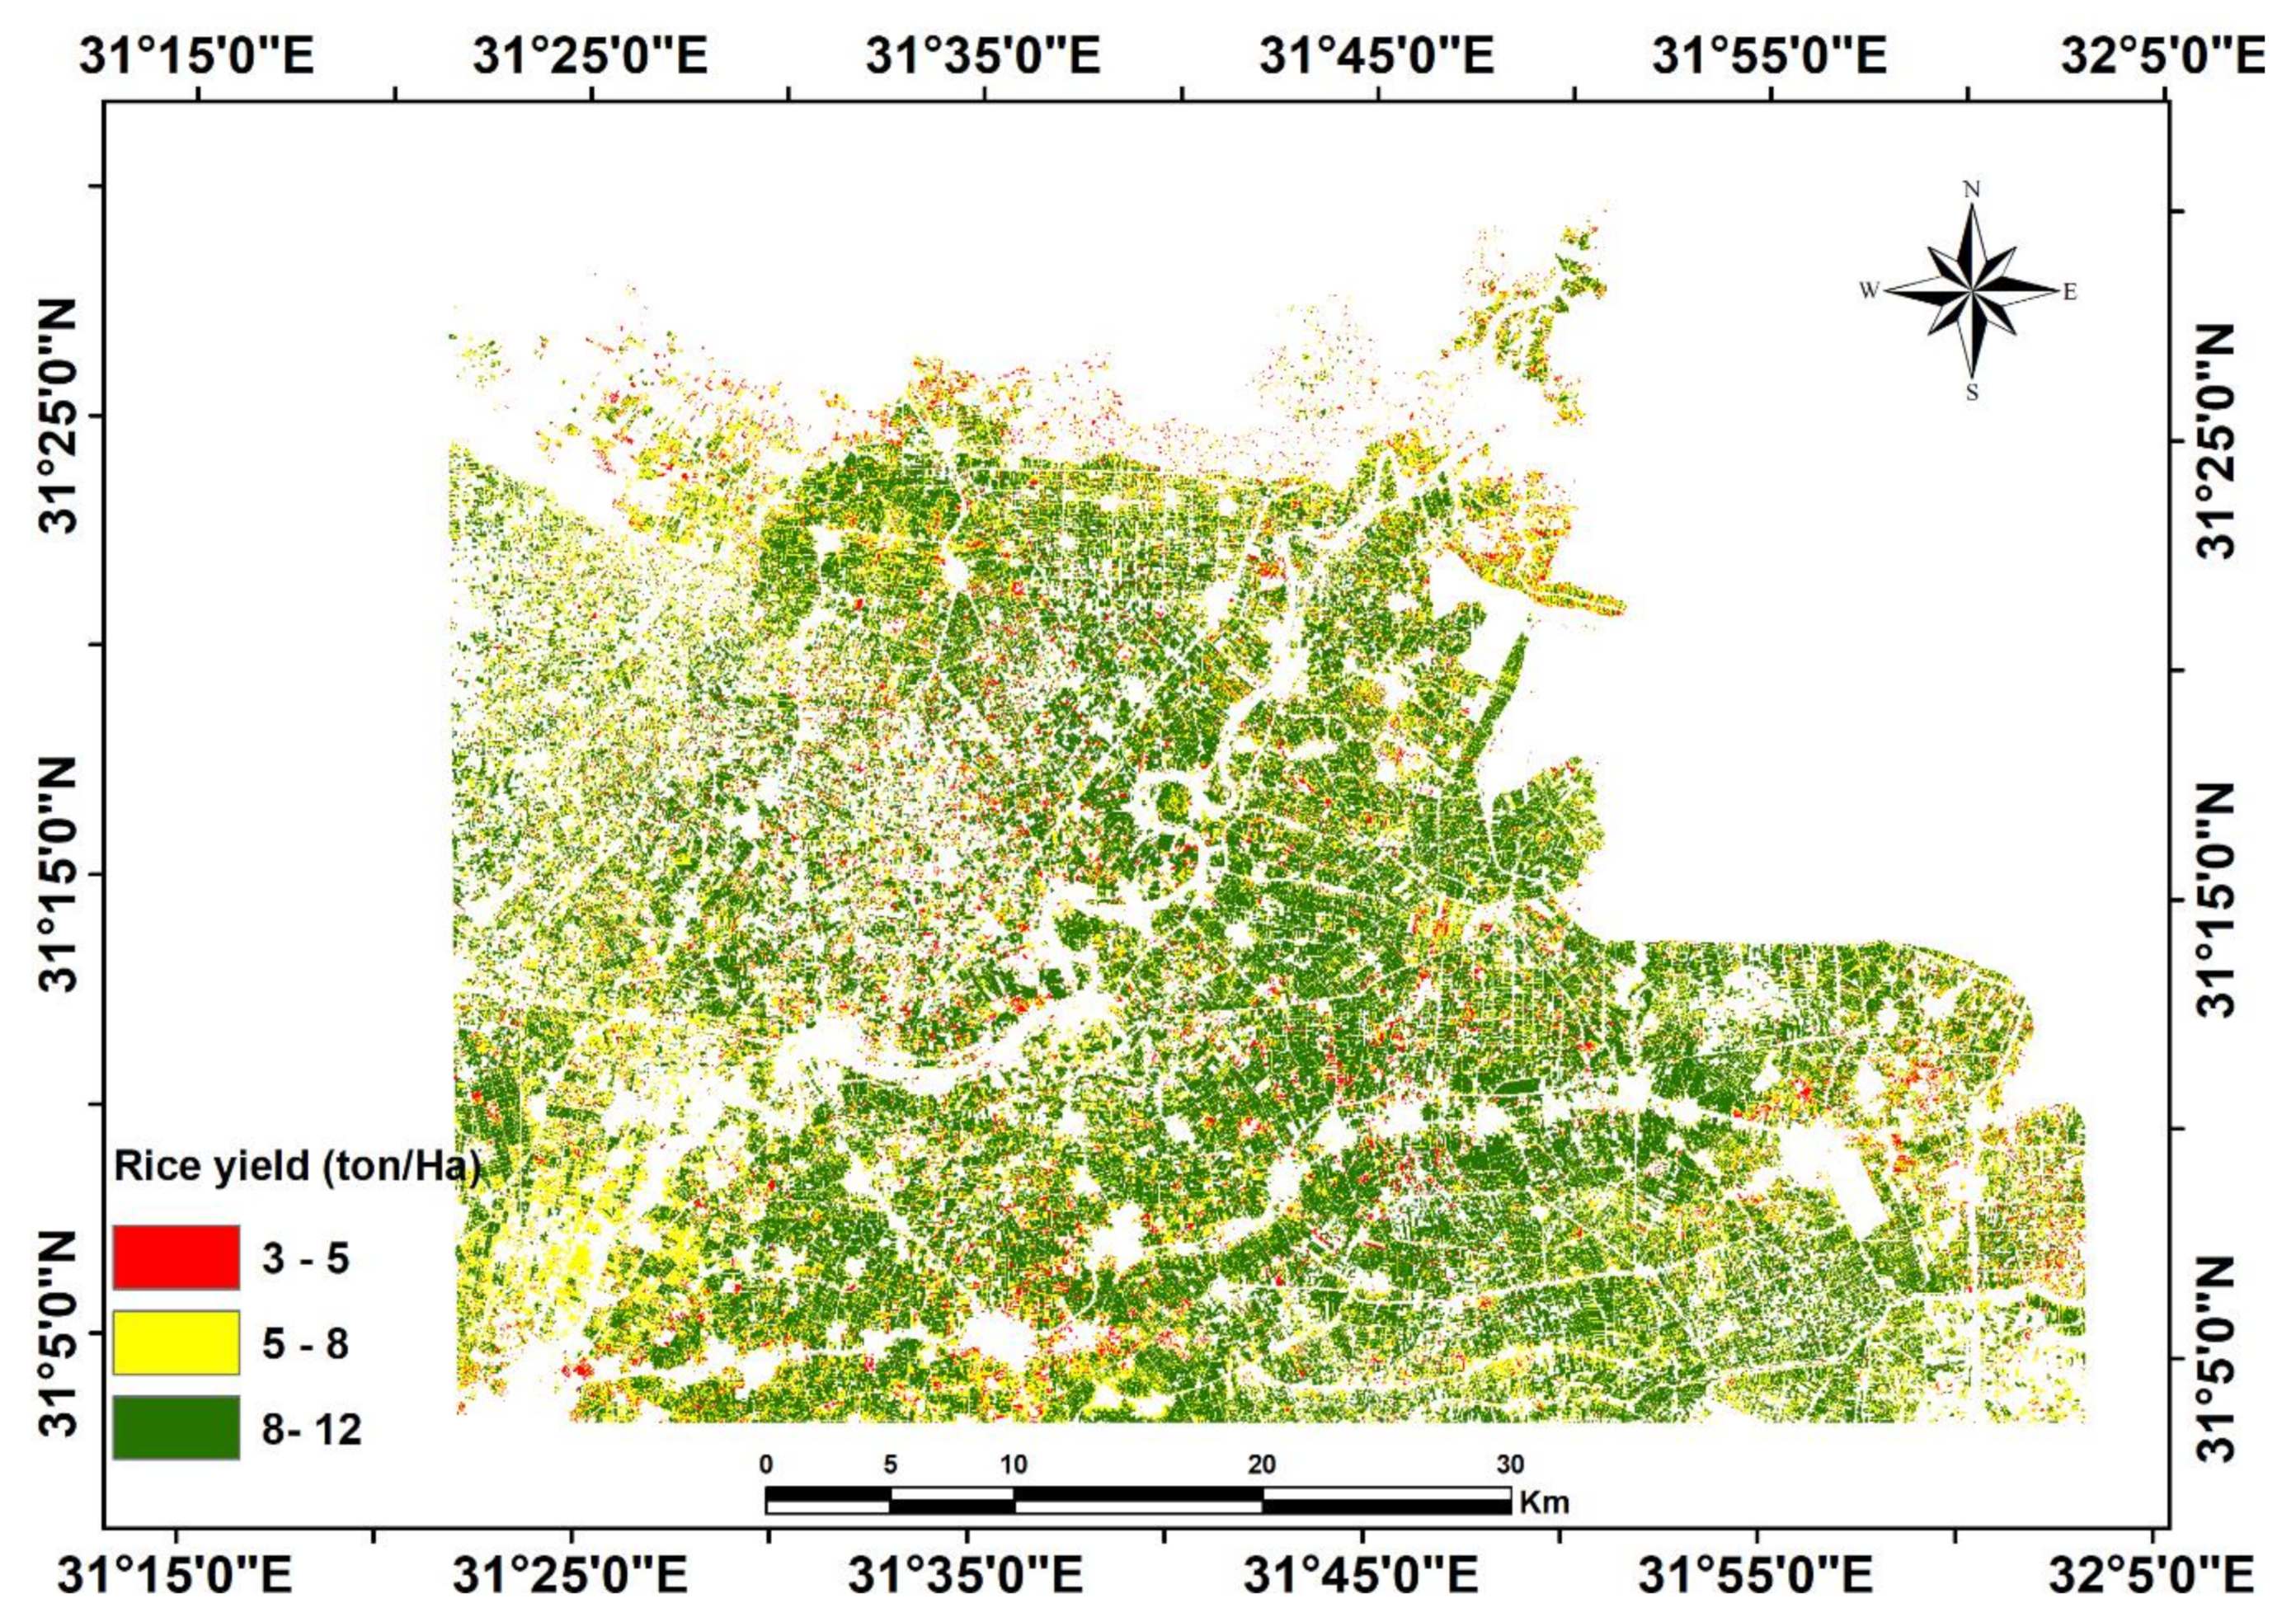
2.7. Crop Yield Estimation

The rice yield estimation was made using the multi-temporal variability with specific reference to the changes of NDVI values over time, as common in previous studies, as in [55] and from several satellite data, such as Landsat (TM, ETM, OLI), Sentinel-2 and others. The following Equation (7) was developed to predict the rice yield production based on NDVI values at the peak of the greenness of rice phenology stage:
Y = 2.355 + 22.928 · NDVI
The performance of the rice yield map was validated using the R2 coefficient, which describes the correlation between the actual yield collected during the field surveys and the predicted amount.

3. Results

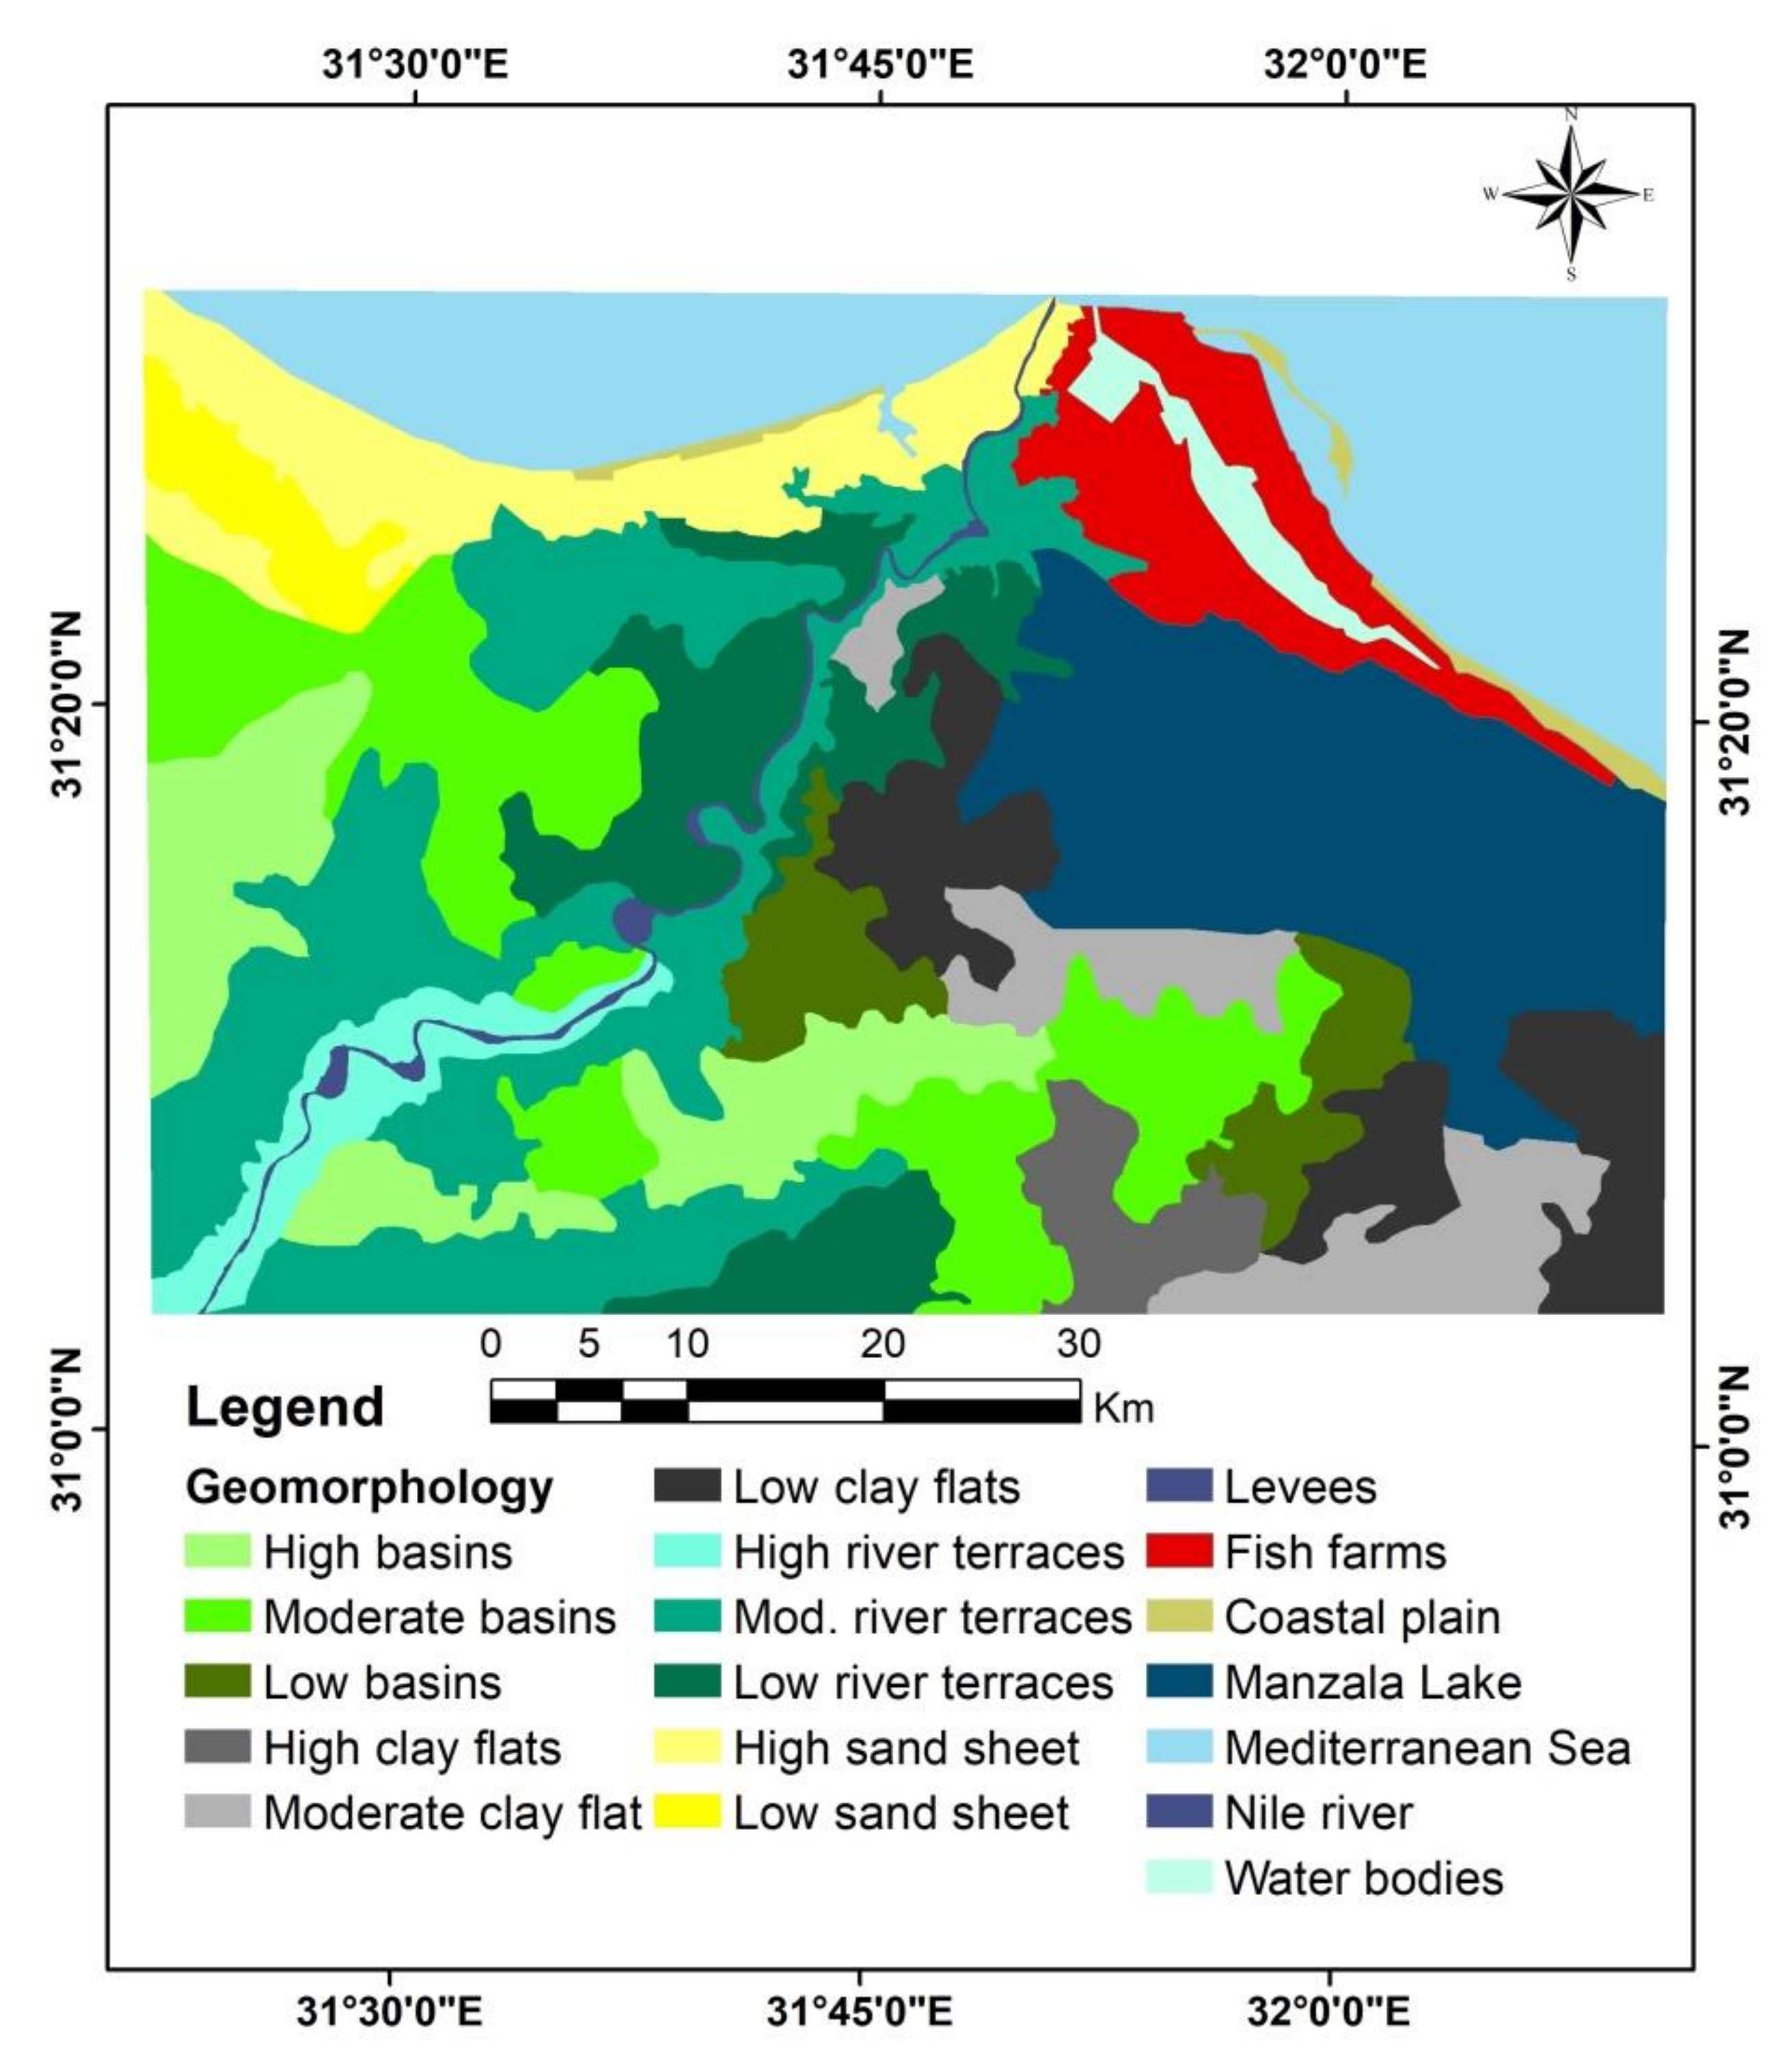
3.1. Geomorphological Description of the Study Area

The landforms of the investigated area were identified and delineated using Sentinel-2 images, SRTM DEM and field trips. Figure 5 indicates that the major landscapes units are alluvial, lacustrine and marine plains. The main landscape is an alluvial plain covering approximately 1741 km2 and dominating the southern part of the area. The lacustrine plain (results from the action of the Nile and El-Manzala Lake deposits) covers 684 km2 of the study area. The marine plain is the main feature of the north of the area, covering 322 km2. The alluvial plain landscape includes different landforms, high river terraces (90 km2), moderate river terraces (584 km2), low river terraces (171 km2), high basins (275 km2), moderate basins (474 km2), low basins (137 km2) and river levees (10 km2). The landforms of the lacustrine landscape are high clay flats, moderate clay flats, low clay flats, fish farms and water bodies with areas of approximately 76, 192, 240, 176 and 42 km2, respectively. Sand sheet and coastal plain landforms encompass the marine plain landscape (Figure 5).

3.2. The Soil Characteristics of Study Area

The soil texture varies from one location to another according to the magnitude of the sediments and according to the distance from the river branch as it generally ranges between sand and clay. Soil salinity varied from low to high as EC values ranging from 0.48 to 23.6 dS/m. ESP (4.31 to 26.31%), and hydraulic conductivity varies from 0.237 to 14.95 cm/h. The soil pH ranges between 7.7 and 8.1, the CaCO3 content ranges between 2.38% and 8.74%, and the shell fragments occurrence in some areas of study area cause increasing in values of calcium carbonate content. Vertic Torrifluvents, Typic Torrifluvents and Typic Torripssaments are the main soil subgroups in the study.

3.3. Land Suitability

The method proposed to evaluate the soil suitability for the rice crop is based on the analyses of the state of soil fertility, the physical and chemical properties, along with the assessment of the state of the plant’s biomass represented by NDVI. Finally, the results of the proposed method were compared with the results obtained from the: square root (Sq), Storie index (St), ALES (Al) and MicroLEIS (Micro) methods.

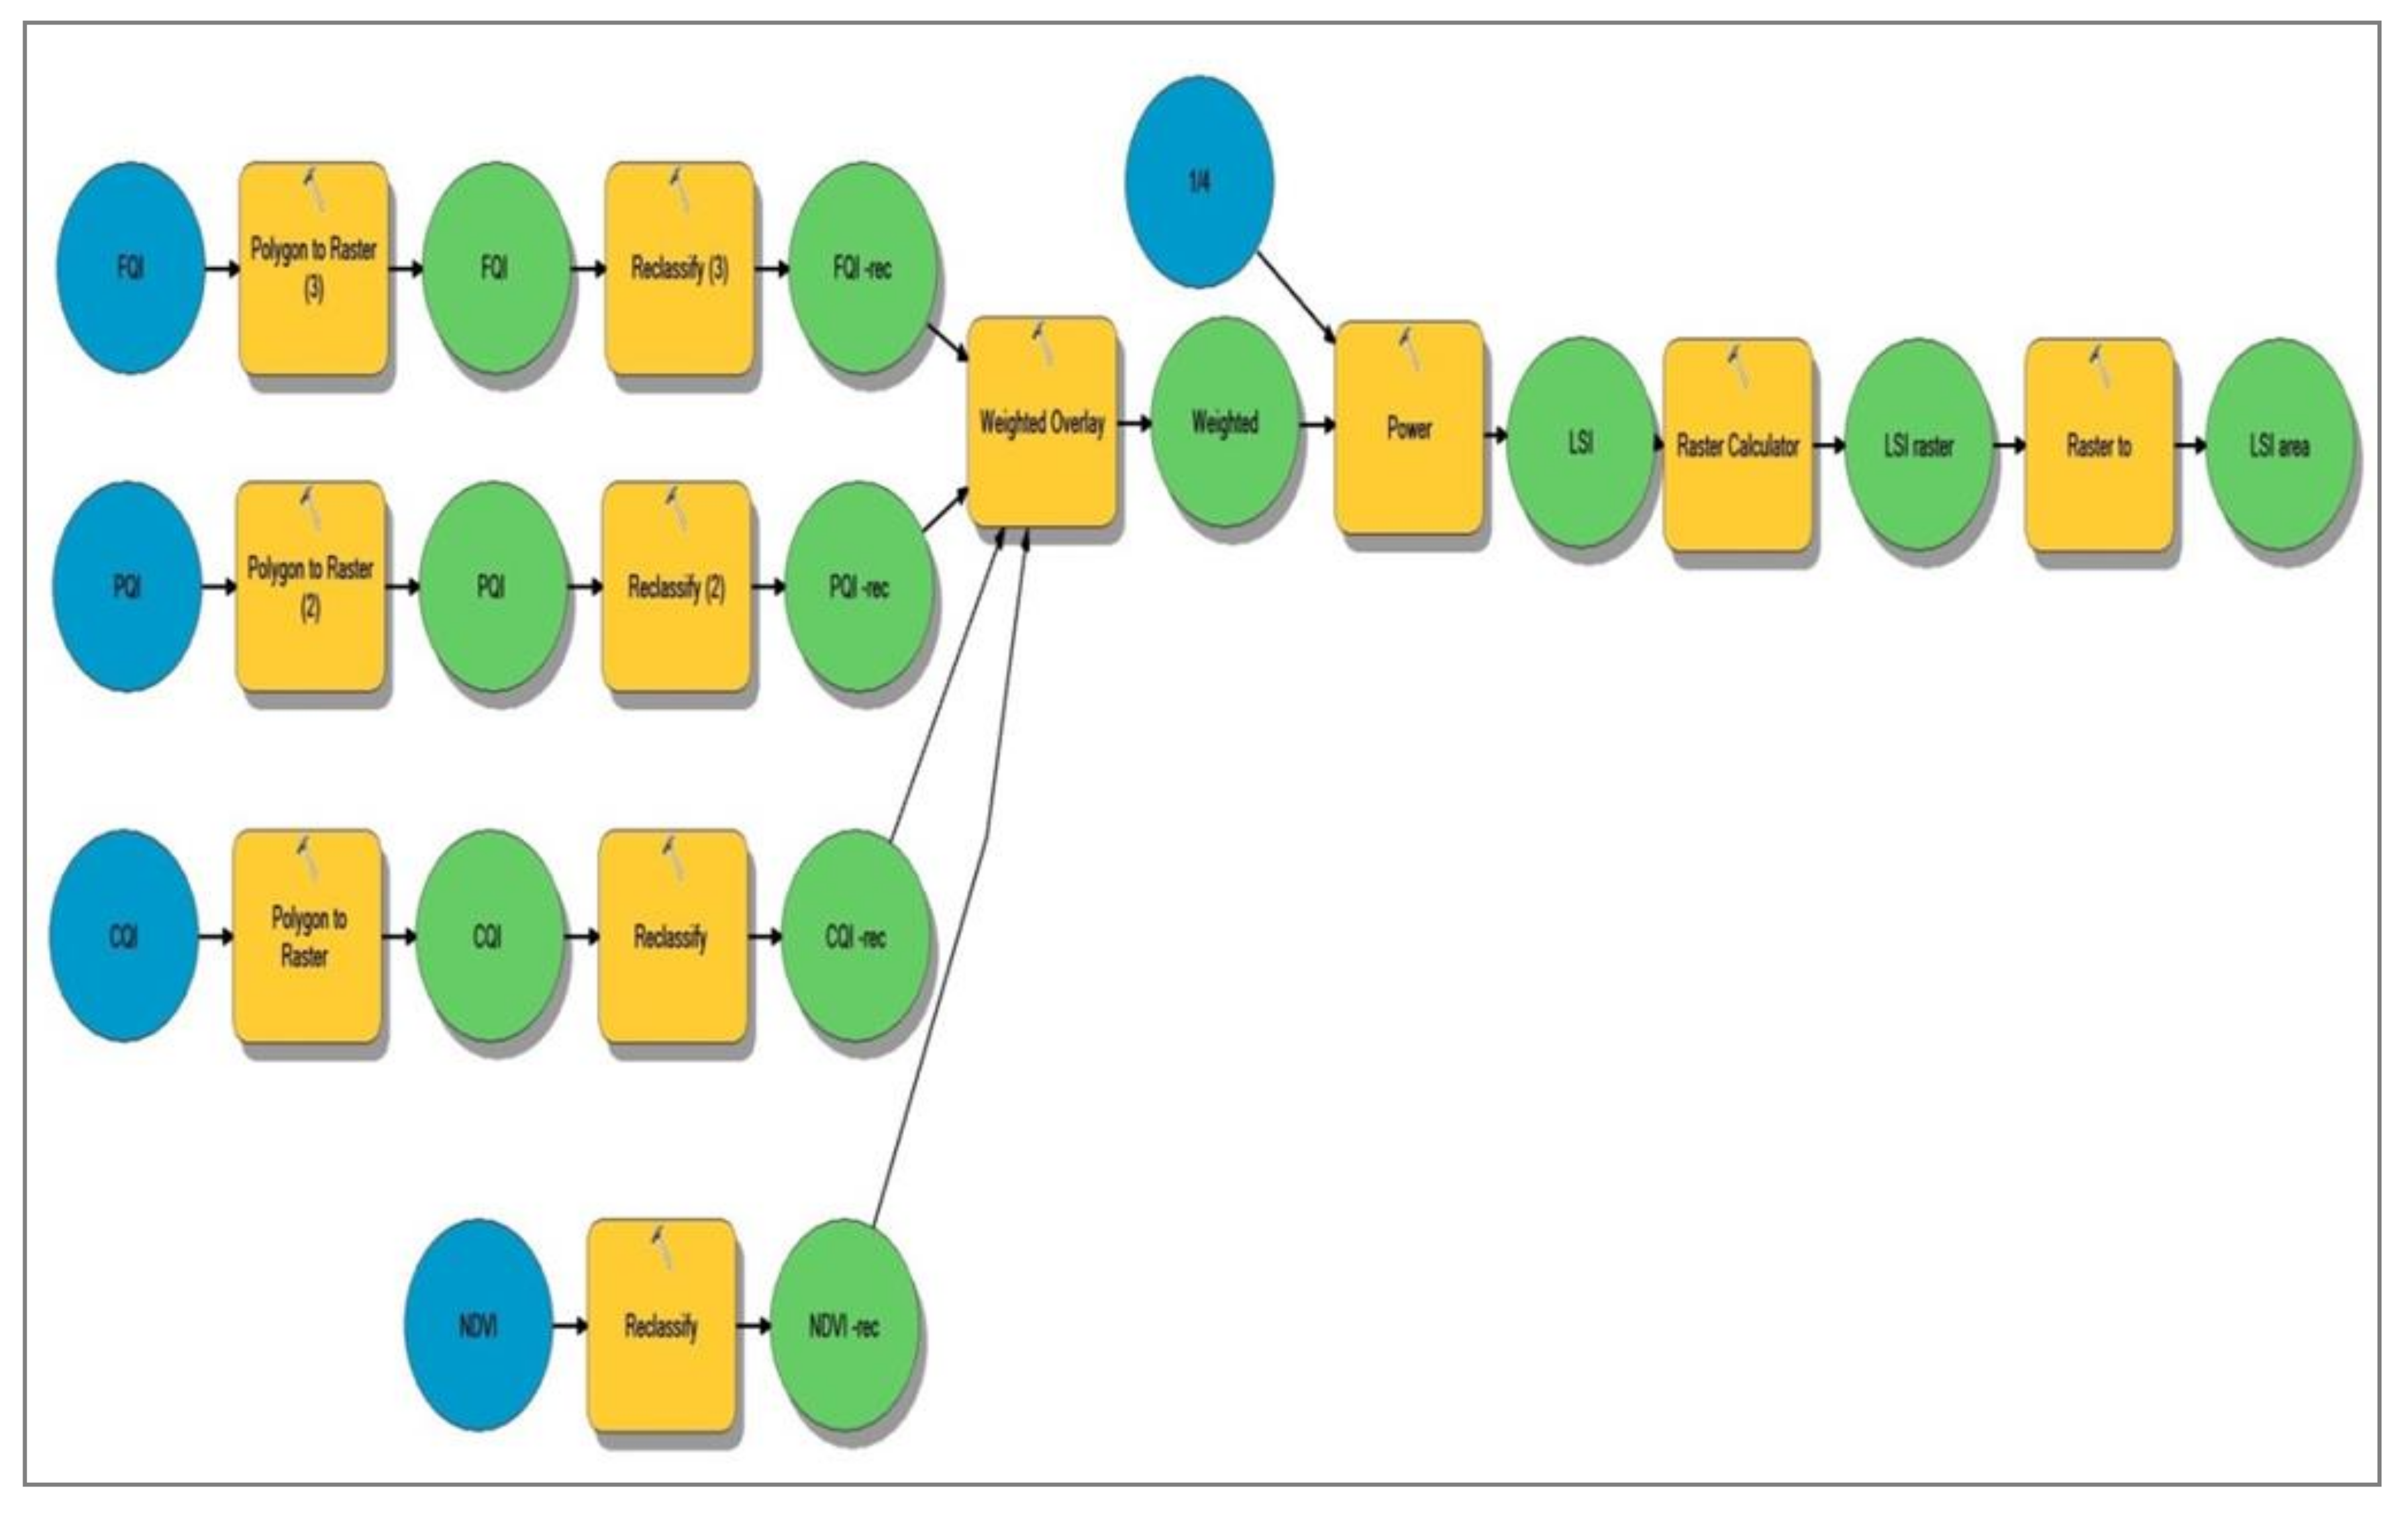
3.3.1. Land Suitability Methods

GIS was used to build data base and map the different factors of soil suitability degrees to rice crop production as follows:
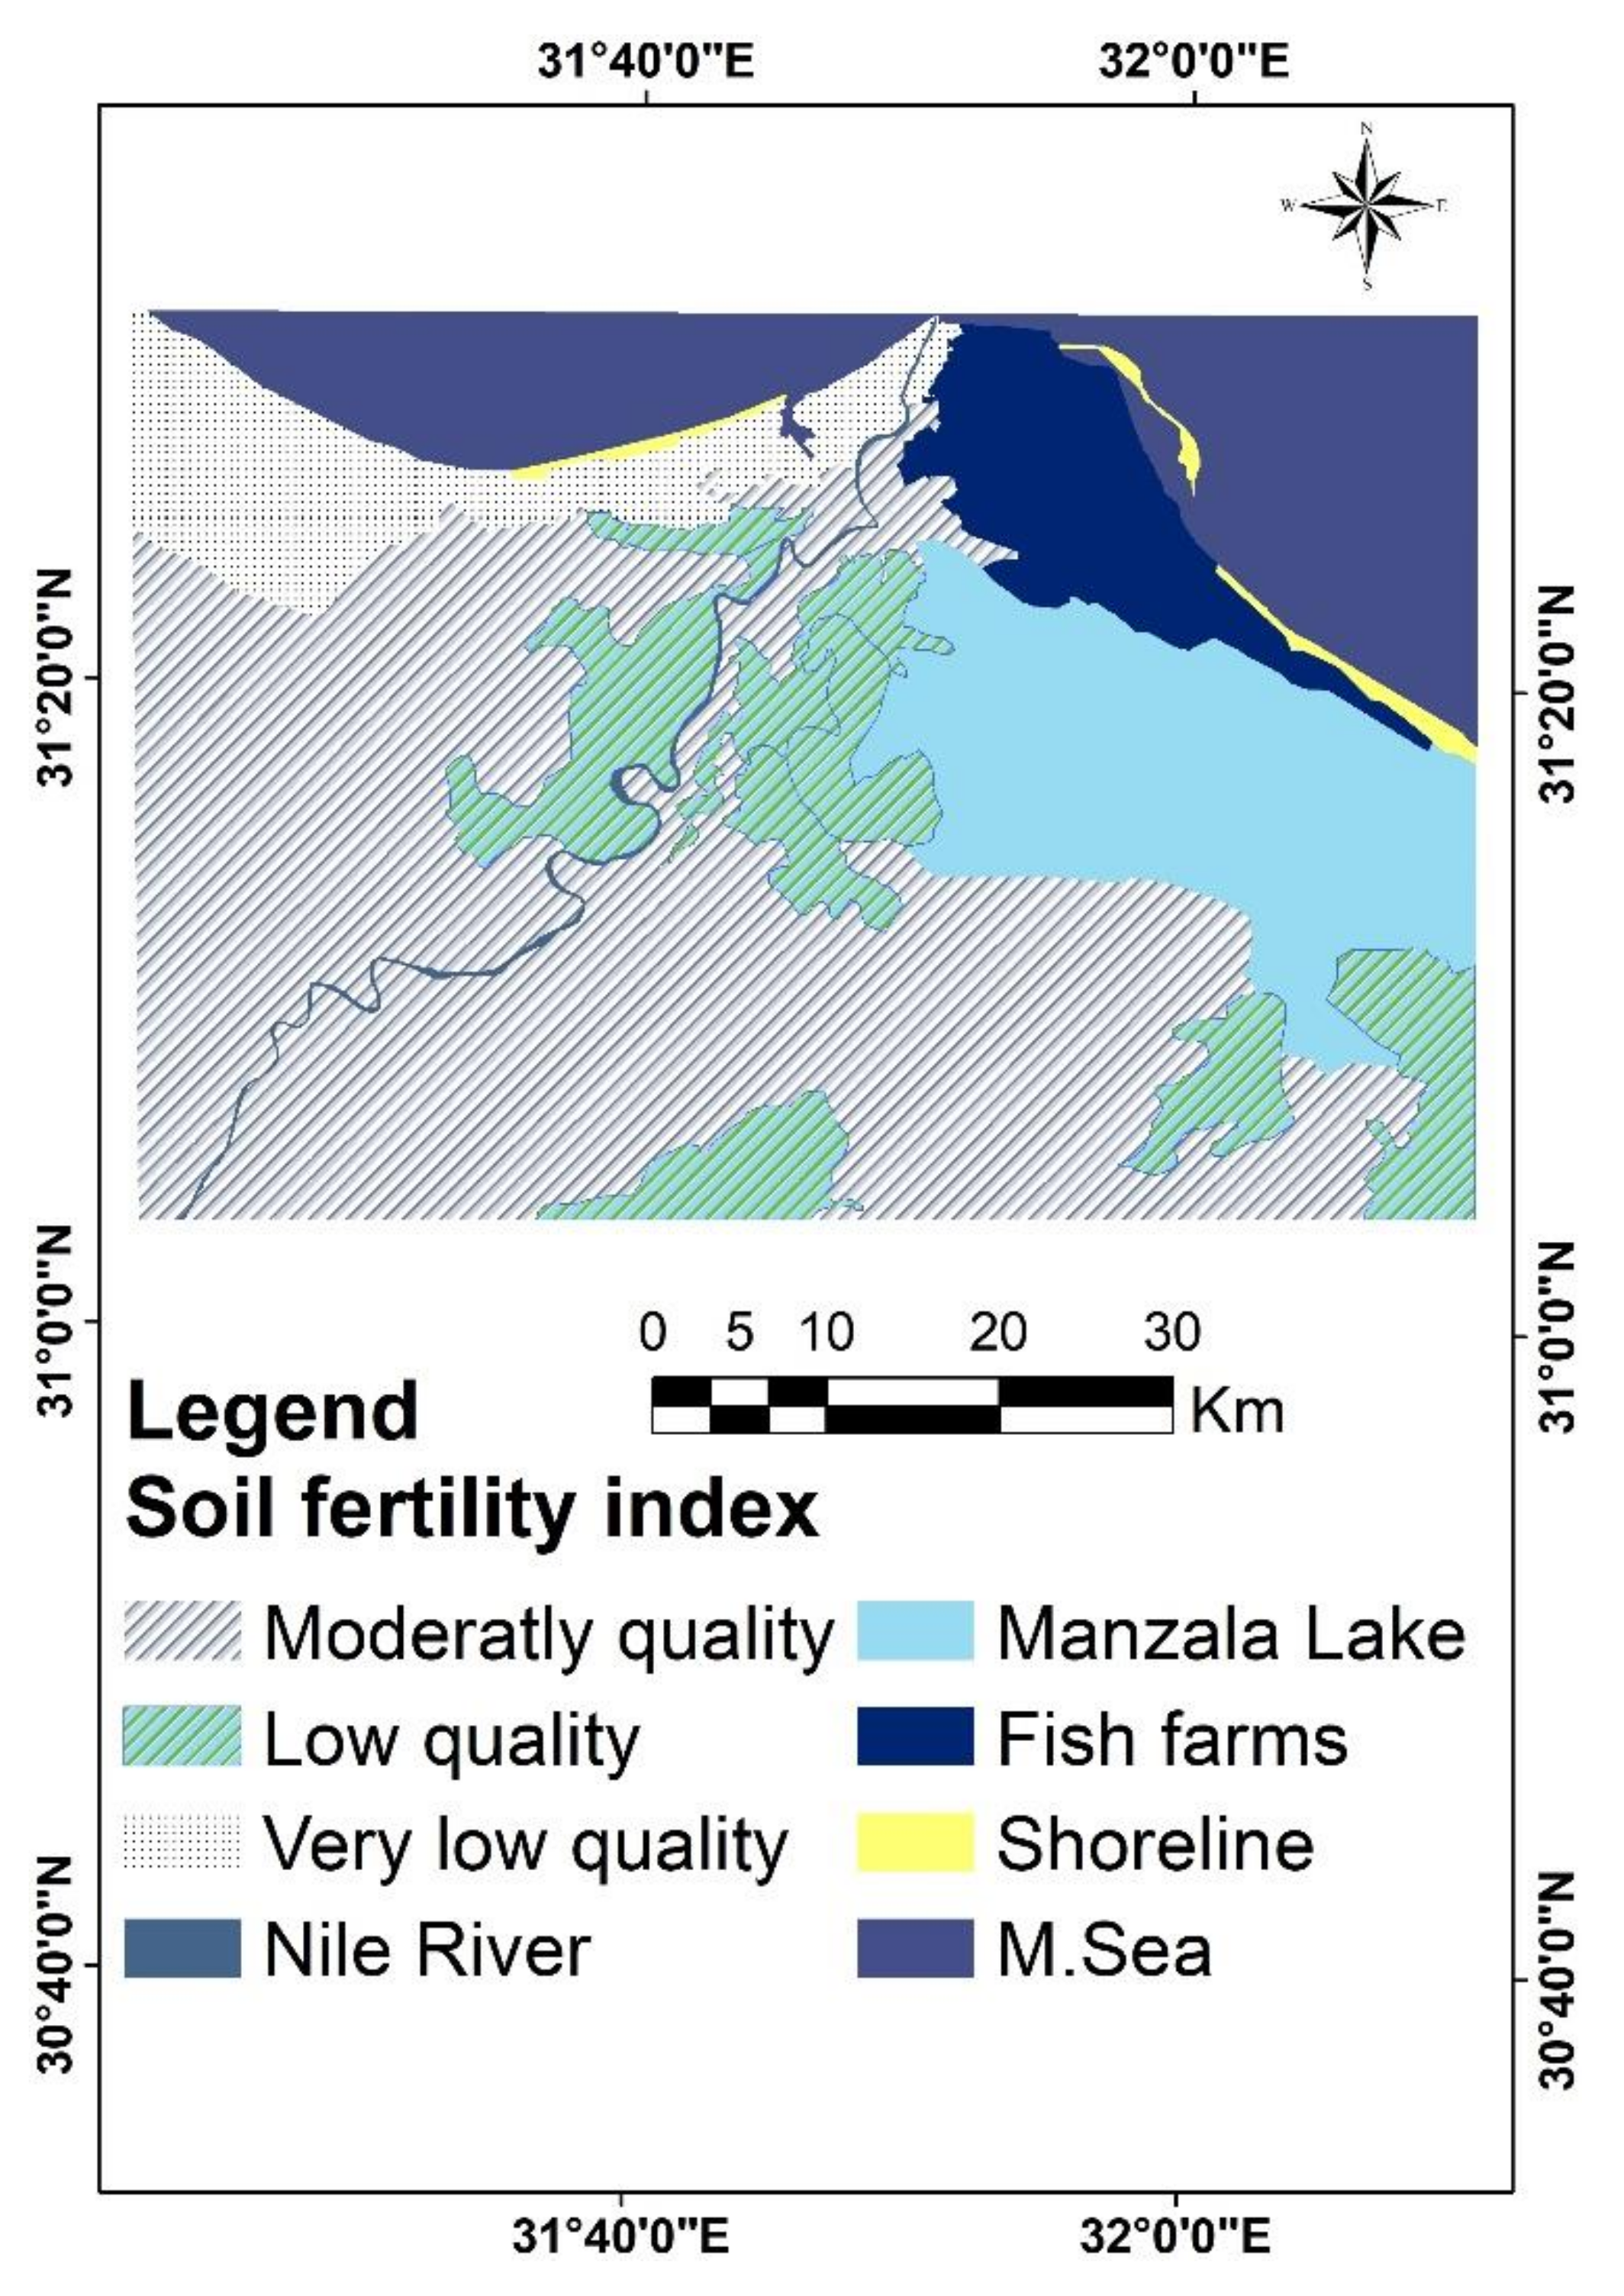
  • Soil fertility quality index (FQI)
The results of SQI reveal that 11.56% and 16.16% of the total study area is characterized by very low to low soil fertility, respectively. The moderate fertility class accounted for 1838 km2 of the total study area dominating the high river terrace, moderate river terrace, high basin, moderate basin, low basin, river levee, high clay flat and moderate clay flat landforms in Table 5 and Figure 6.
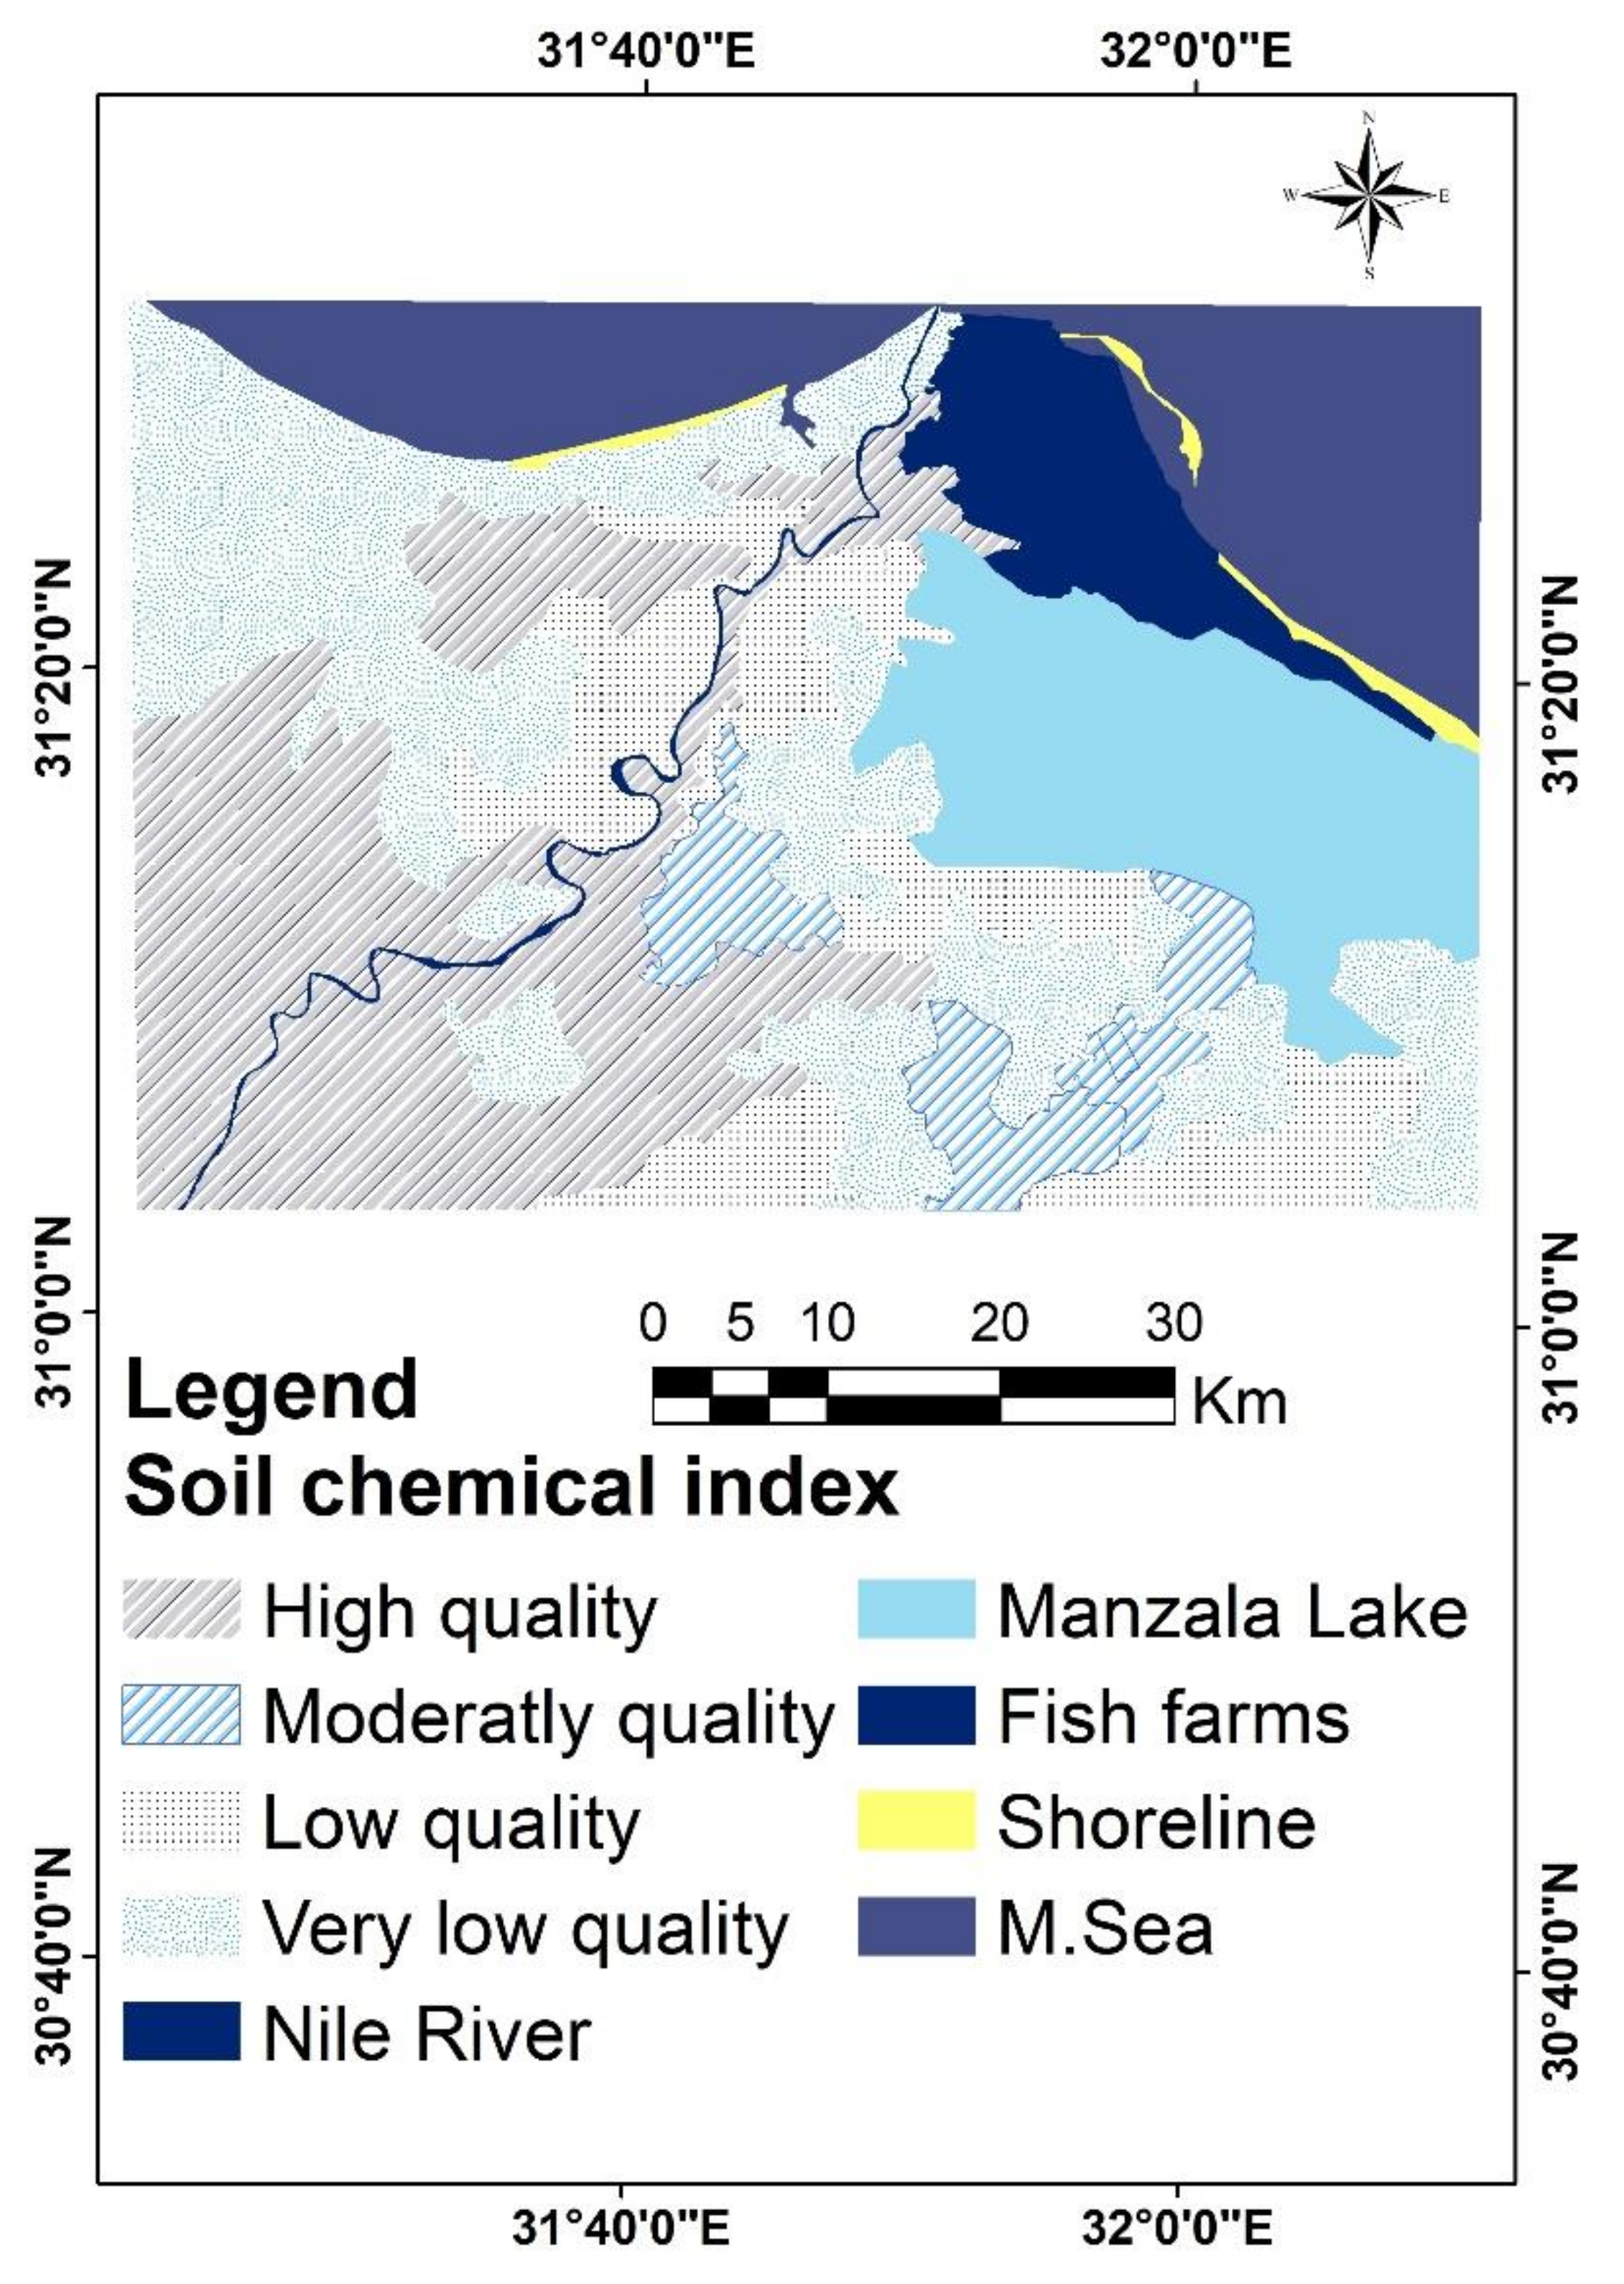
  • Soil chemical quality index (CQI)
Figure 7 and Table 6 show the spatial distribution of the CQI and indicate that the study area classified four classes: “high” (37.31%) was observed in high basin, high river terrace, moderate river terrace and levee area; “moderate” (2.99%) was dominated by high clay flat units, and low quality was observed in moderate clay flats, low clay flats and low river terraces, “low” (23.71%) and “very low” (35.59%) was found in moderate basins, low basins and sand sheet units, and this class may be related to limitations such as a high pH, high salinity and high ESP.
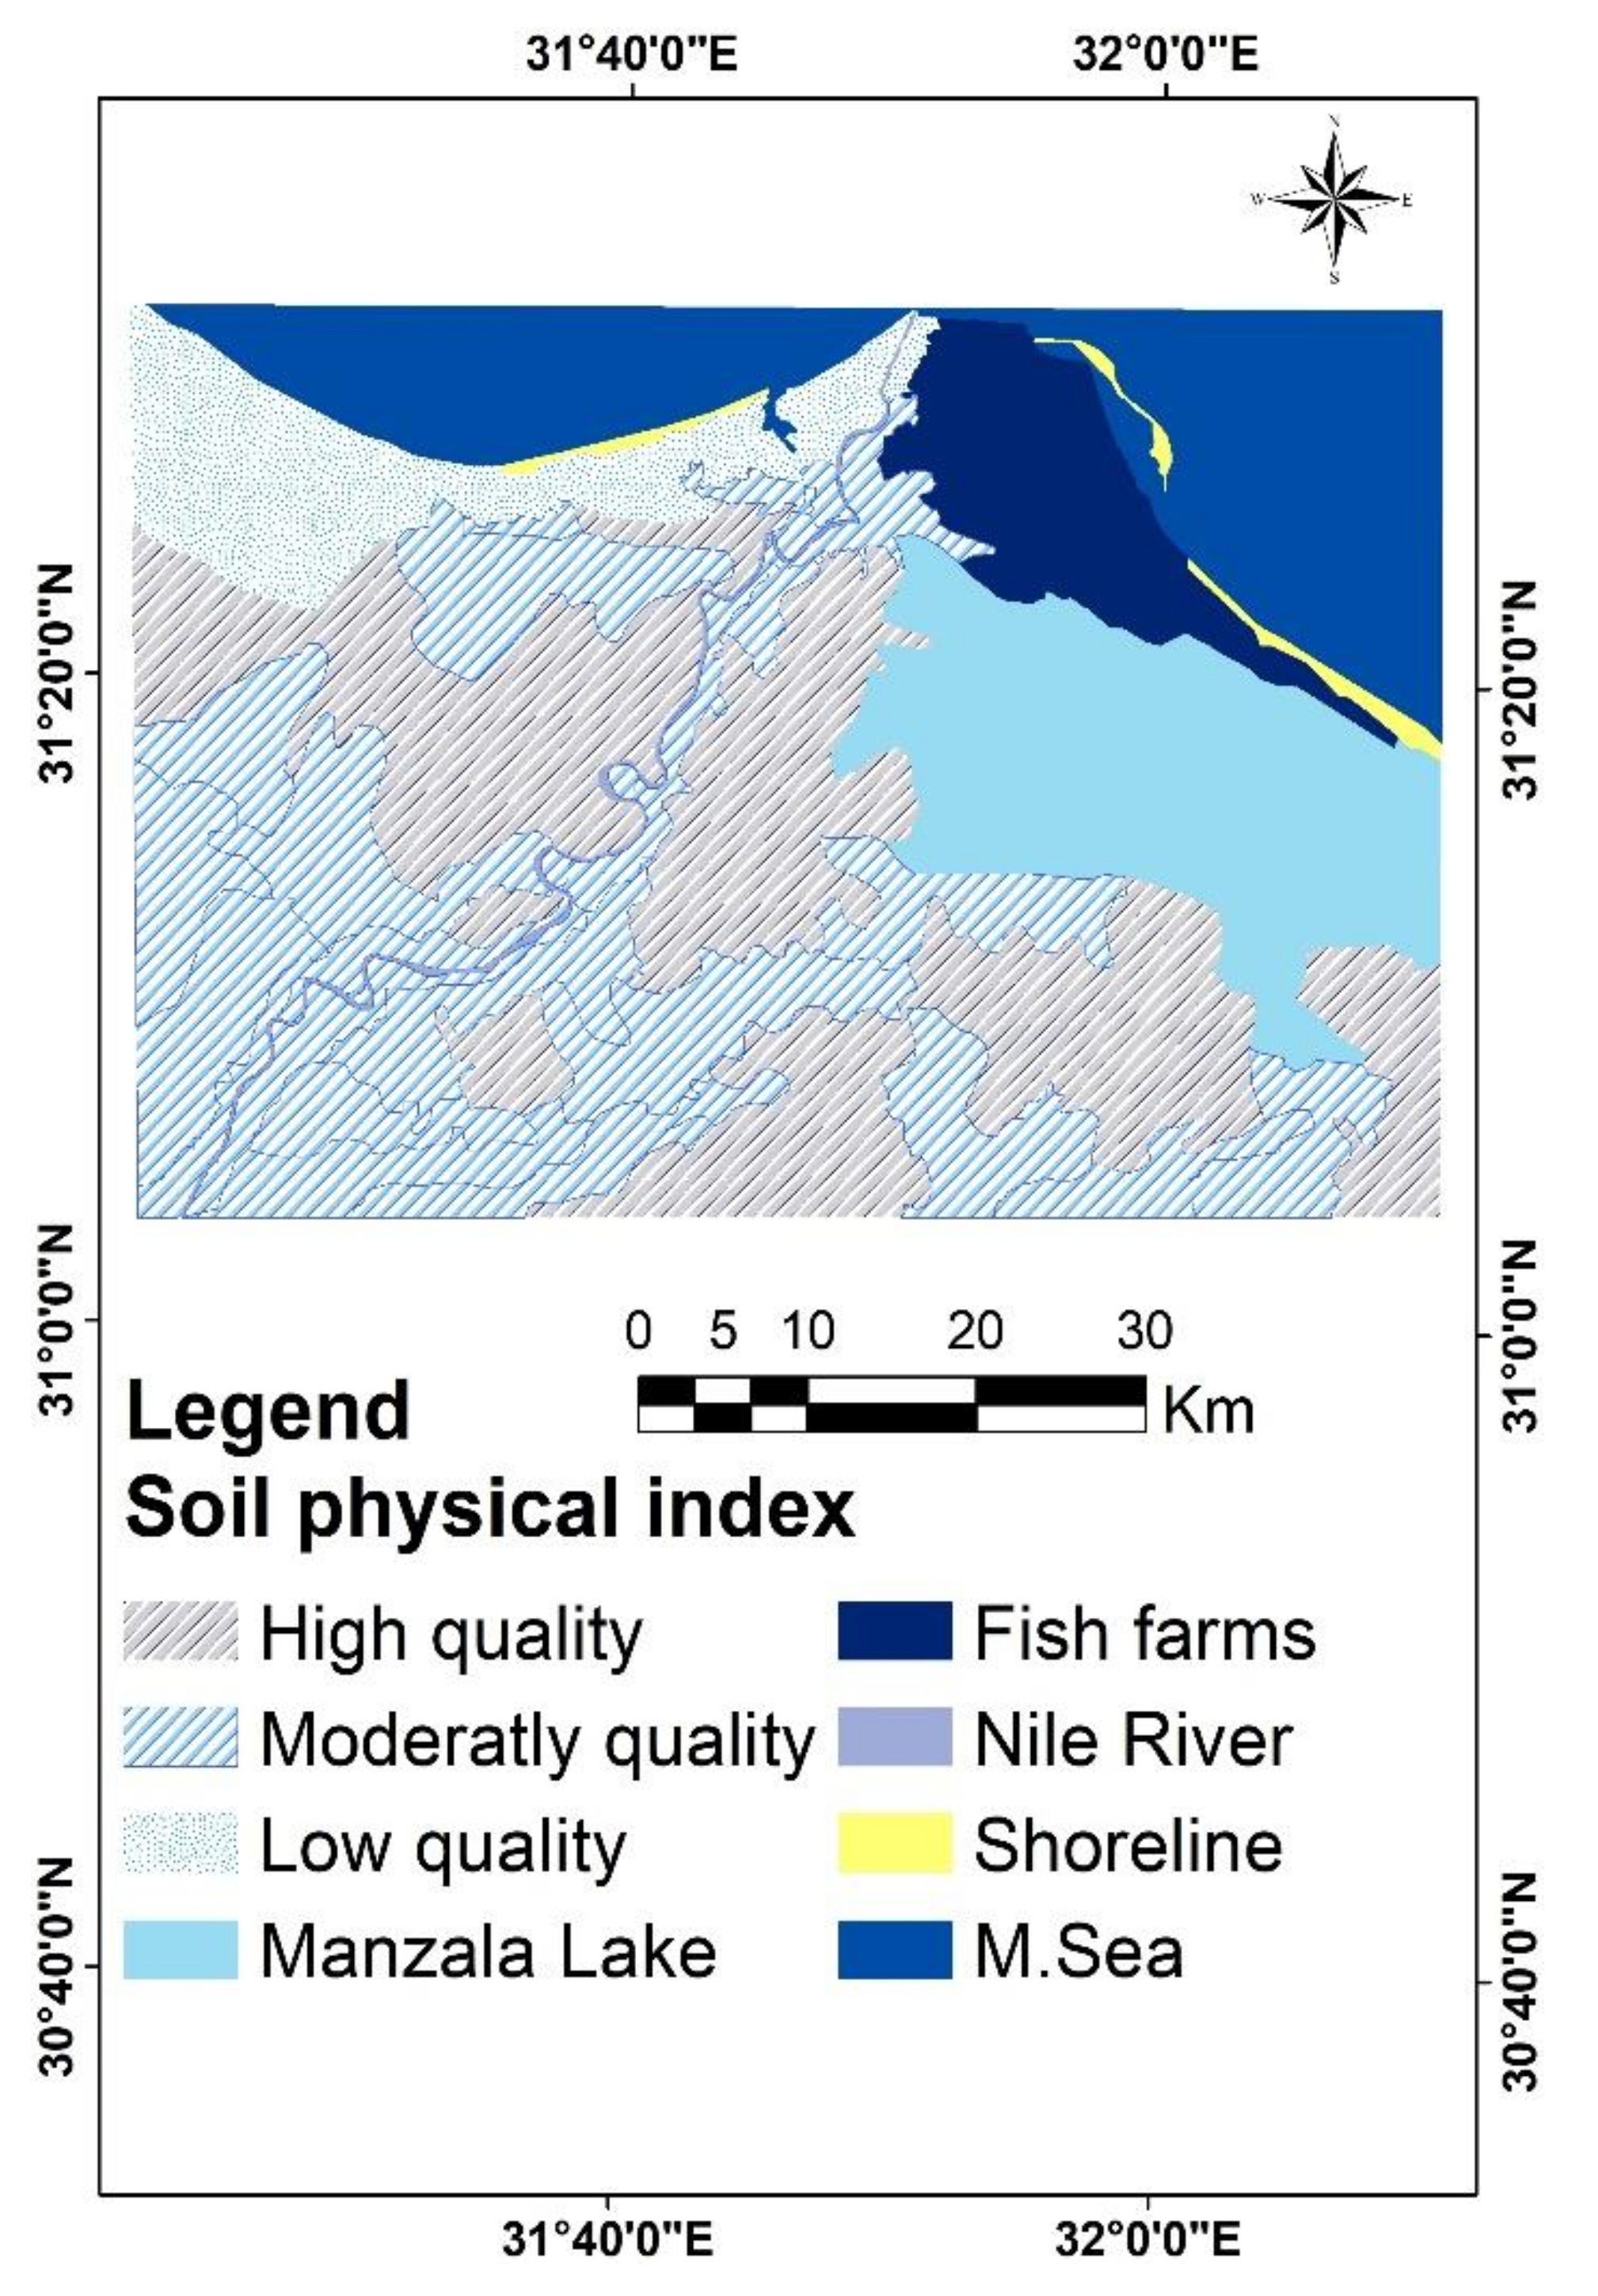
  • Soil physical quality index (PQI)
The PQI of the investigated area showed the following: high quality (40.19%) occurred in moderate basin, low basin, low clay flat and low river terrace areas; moderate quality (48.25%) was observed in high clay flat, moderate clay flat, high river terrace, moderate river terrace and levee areas and low quality (11.56%) as shown in Figure 8 and Table 7.
  • Rice normalized difference vegetation index (RNDVI)
Table 8 presents the spatial distribution of the RNDVI of the study area. Four RNDVI classes were obtained. High-density vegetation of the rice crop that represented about 37.71% of the total area is located in the geomorphic units of high basin, high river terrace, moderate river terrace and levee areas. Moderate density vegetation that represented an about 10.54% of the total study area is prevalent in the geomorphological units of high clay flat and moderate clay flat units. The low density vegetation was observed in moderate basins, low basins, low clay flats and low river terraces, which covered about 40.19% of the study area. On the other hand, very low density vegetation occupy about 11.56% of the total area, which was located in sand sheet units.
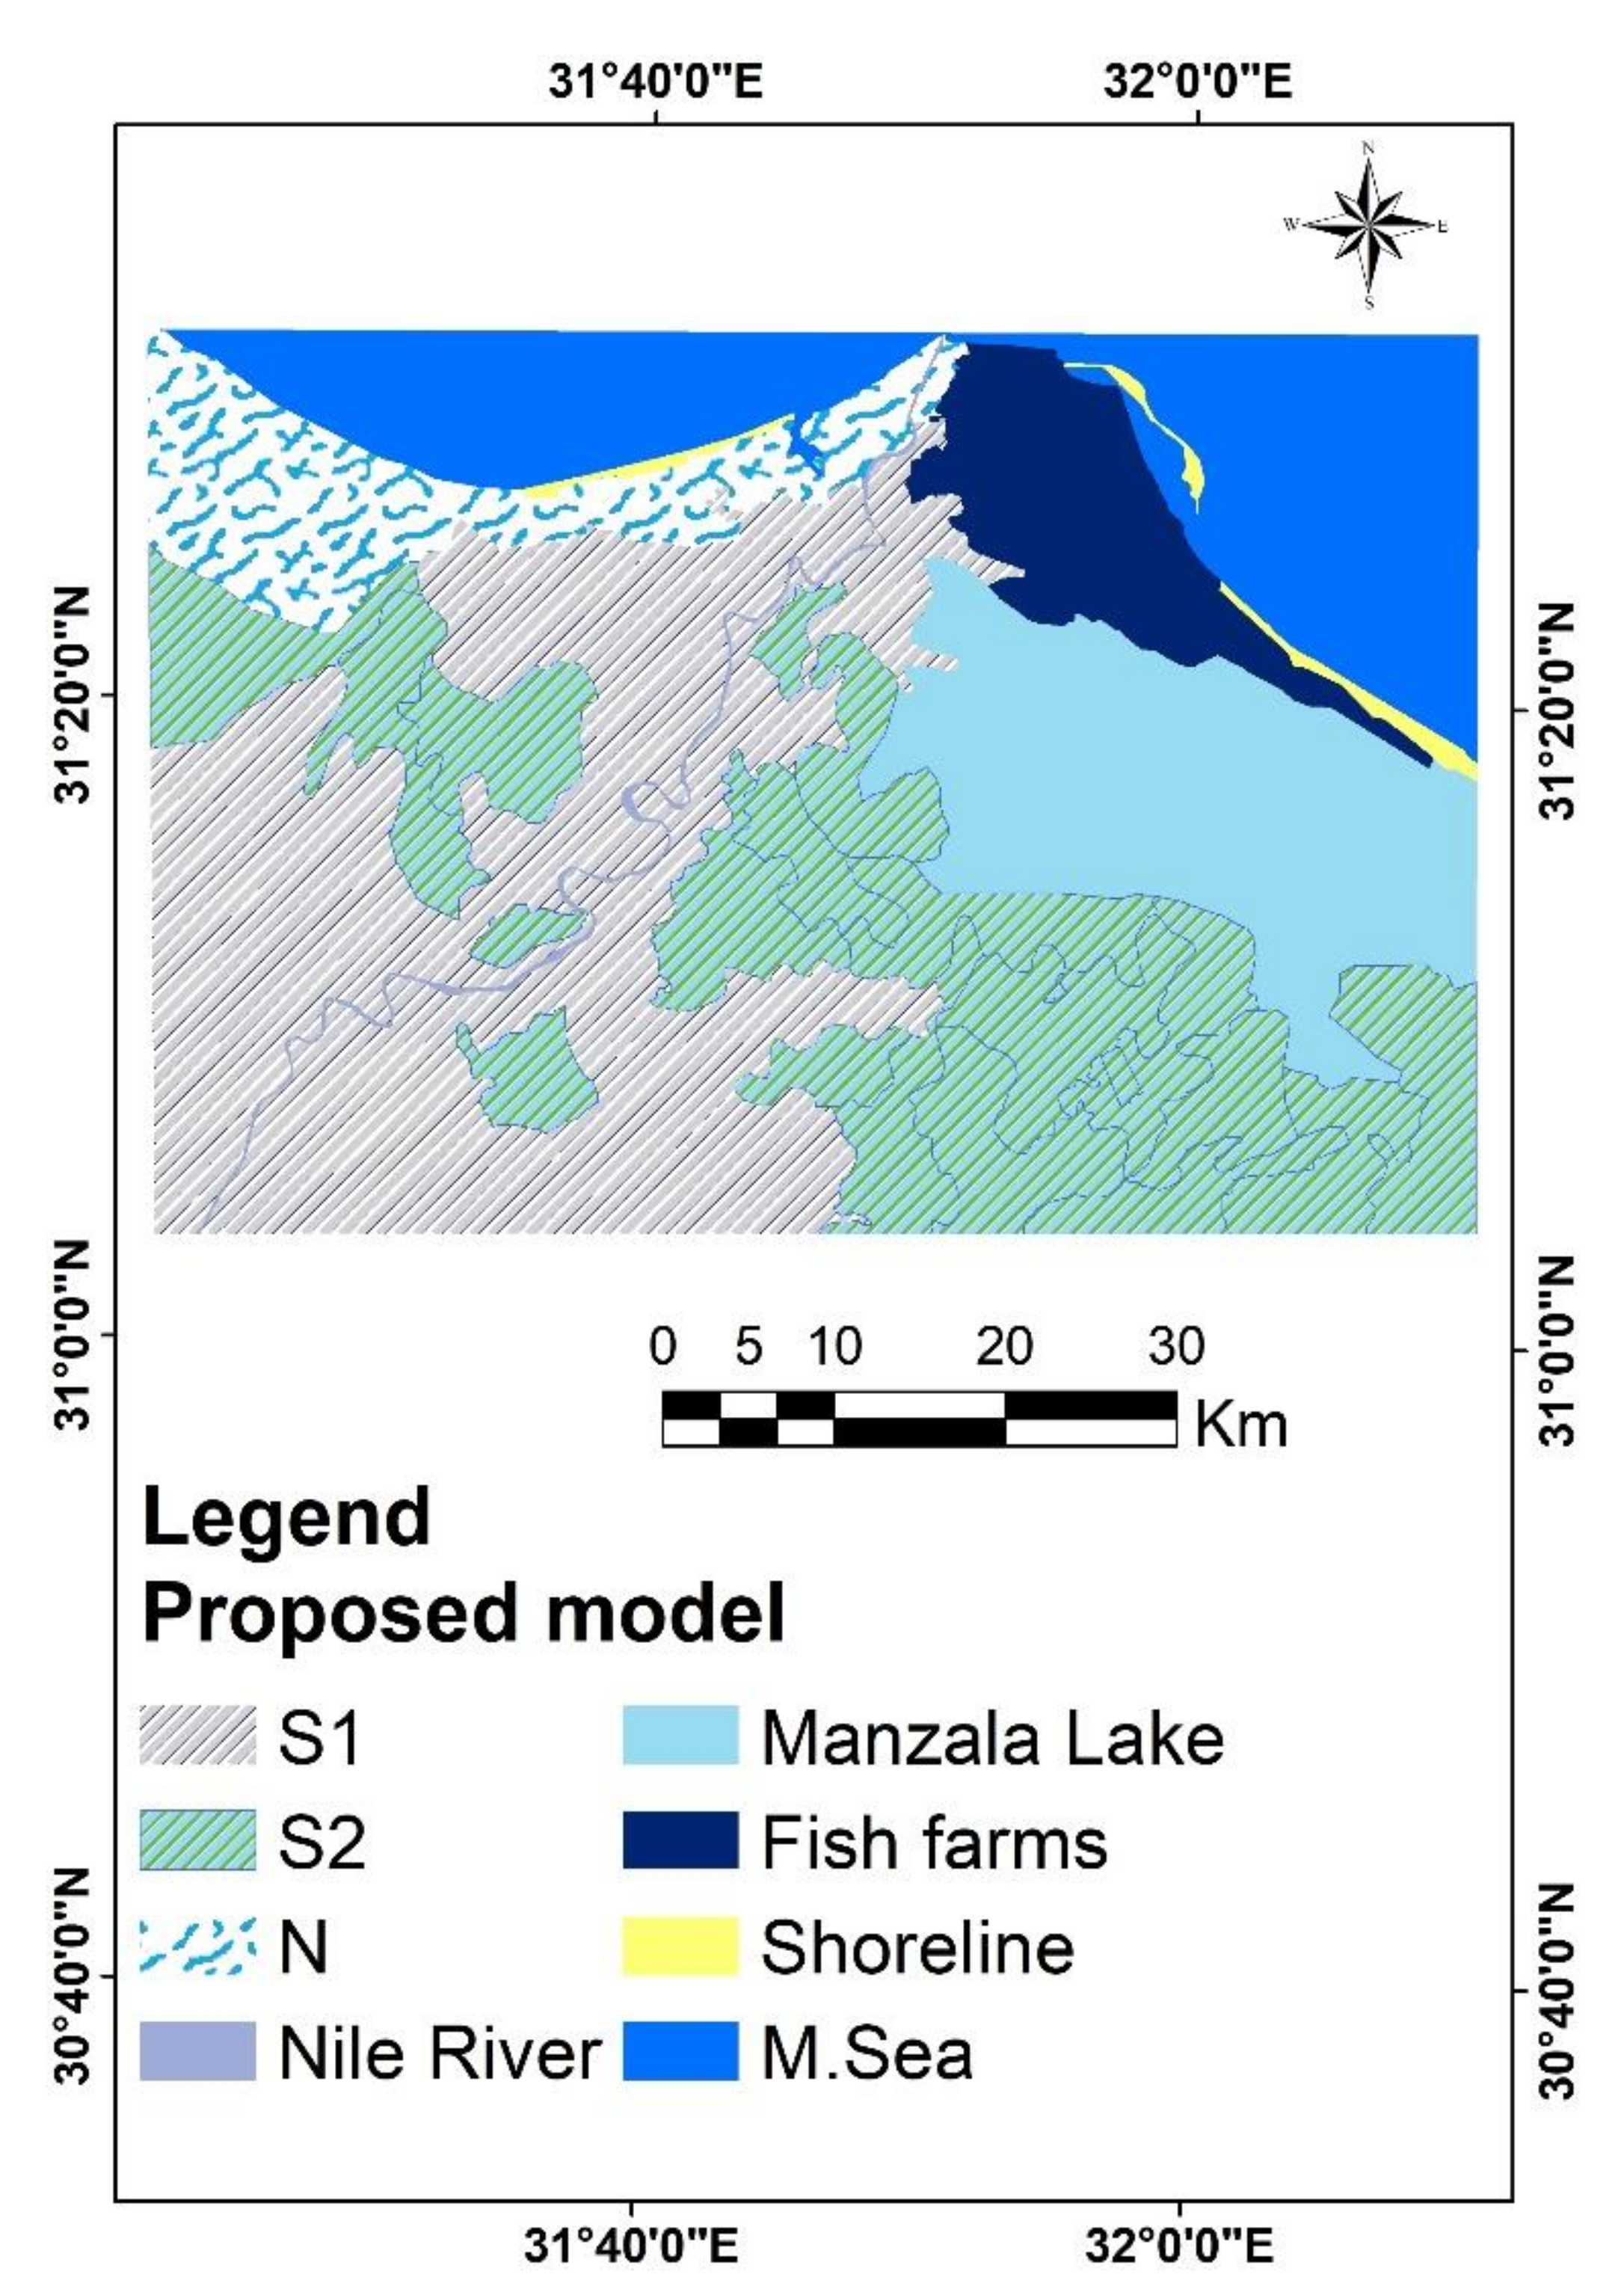
  • Modeling Land suitability for rice crop
Figure 9 and Table 9 represent the spatial distribution of the rice crop suitability. The outputs of the proposed model reveal that the study area is classified into three suitability classes: highly suitable (S1), moderately suitable (S2) and unsuitable (N) classes. The highly suitable class accounts for approximately 1130 km2 (44.44% of the total area) and can be observed in high basin, high river terrace, moderate river terrace, low river terrace and levee areas, dominating the moderate basin, low basin, high clay flat, moderate clay flat and low clay flat landforms. The moderately suitable class accounts for 1119 km2 (44.00% of total study area). Around 11.56% (sand sheet units) of the study area is unsuitable due to poor soil properties. The results obtained that were classified mostly as highly to moderately suitable soil for the rice crop, were consistent with the improvement of the soil fertility in such soil in the Nile delta on one hand, and with the results of other authors on the other [56,57,58].
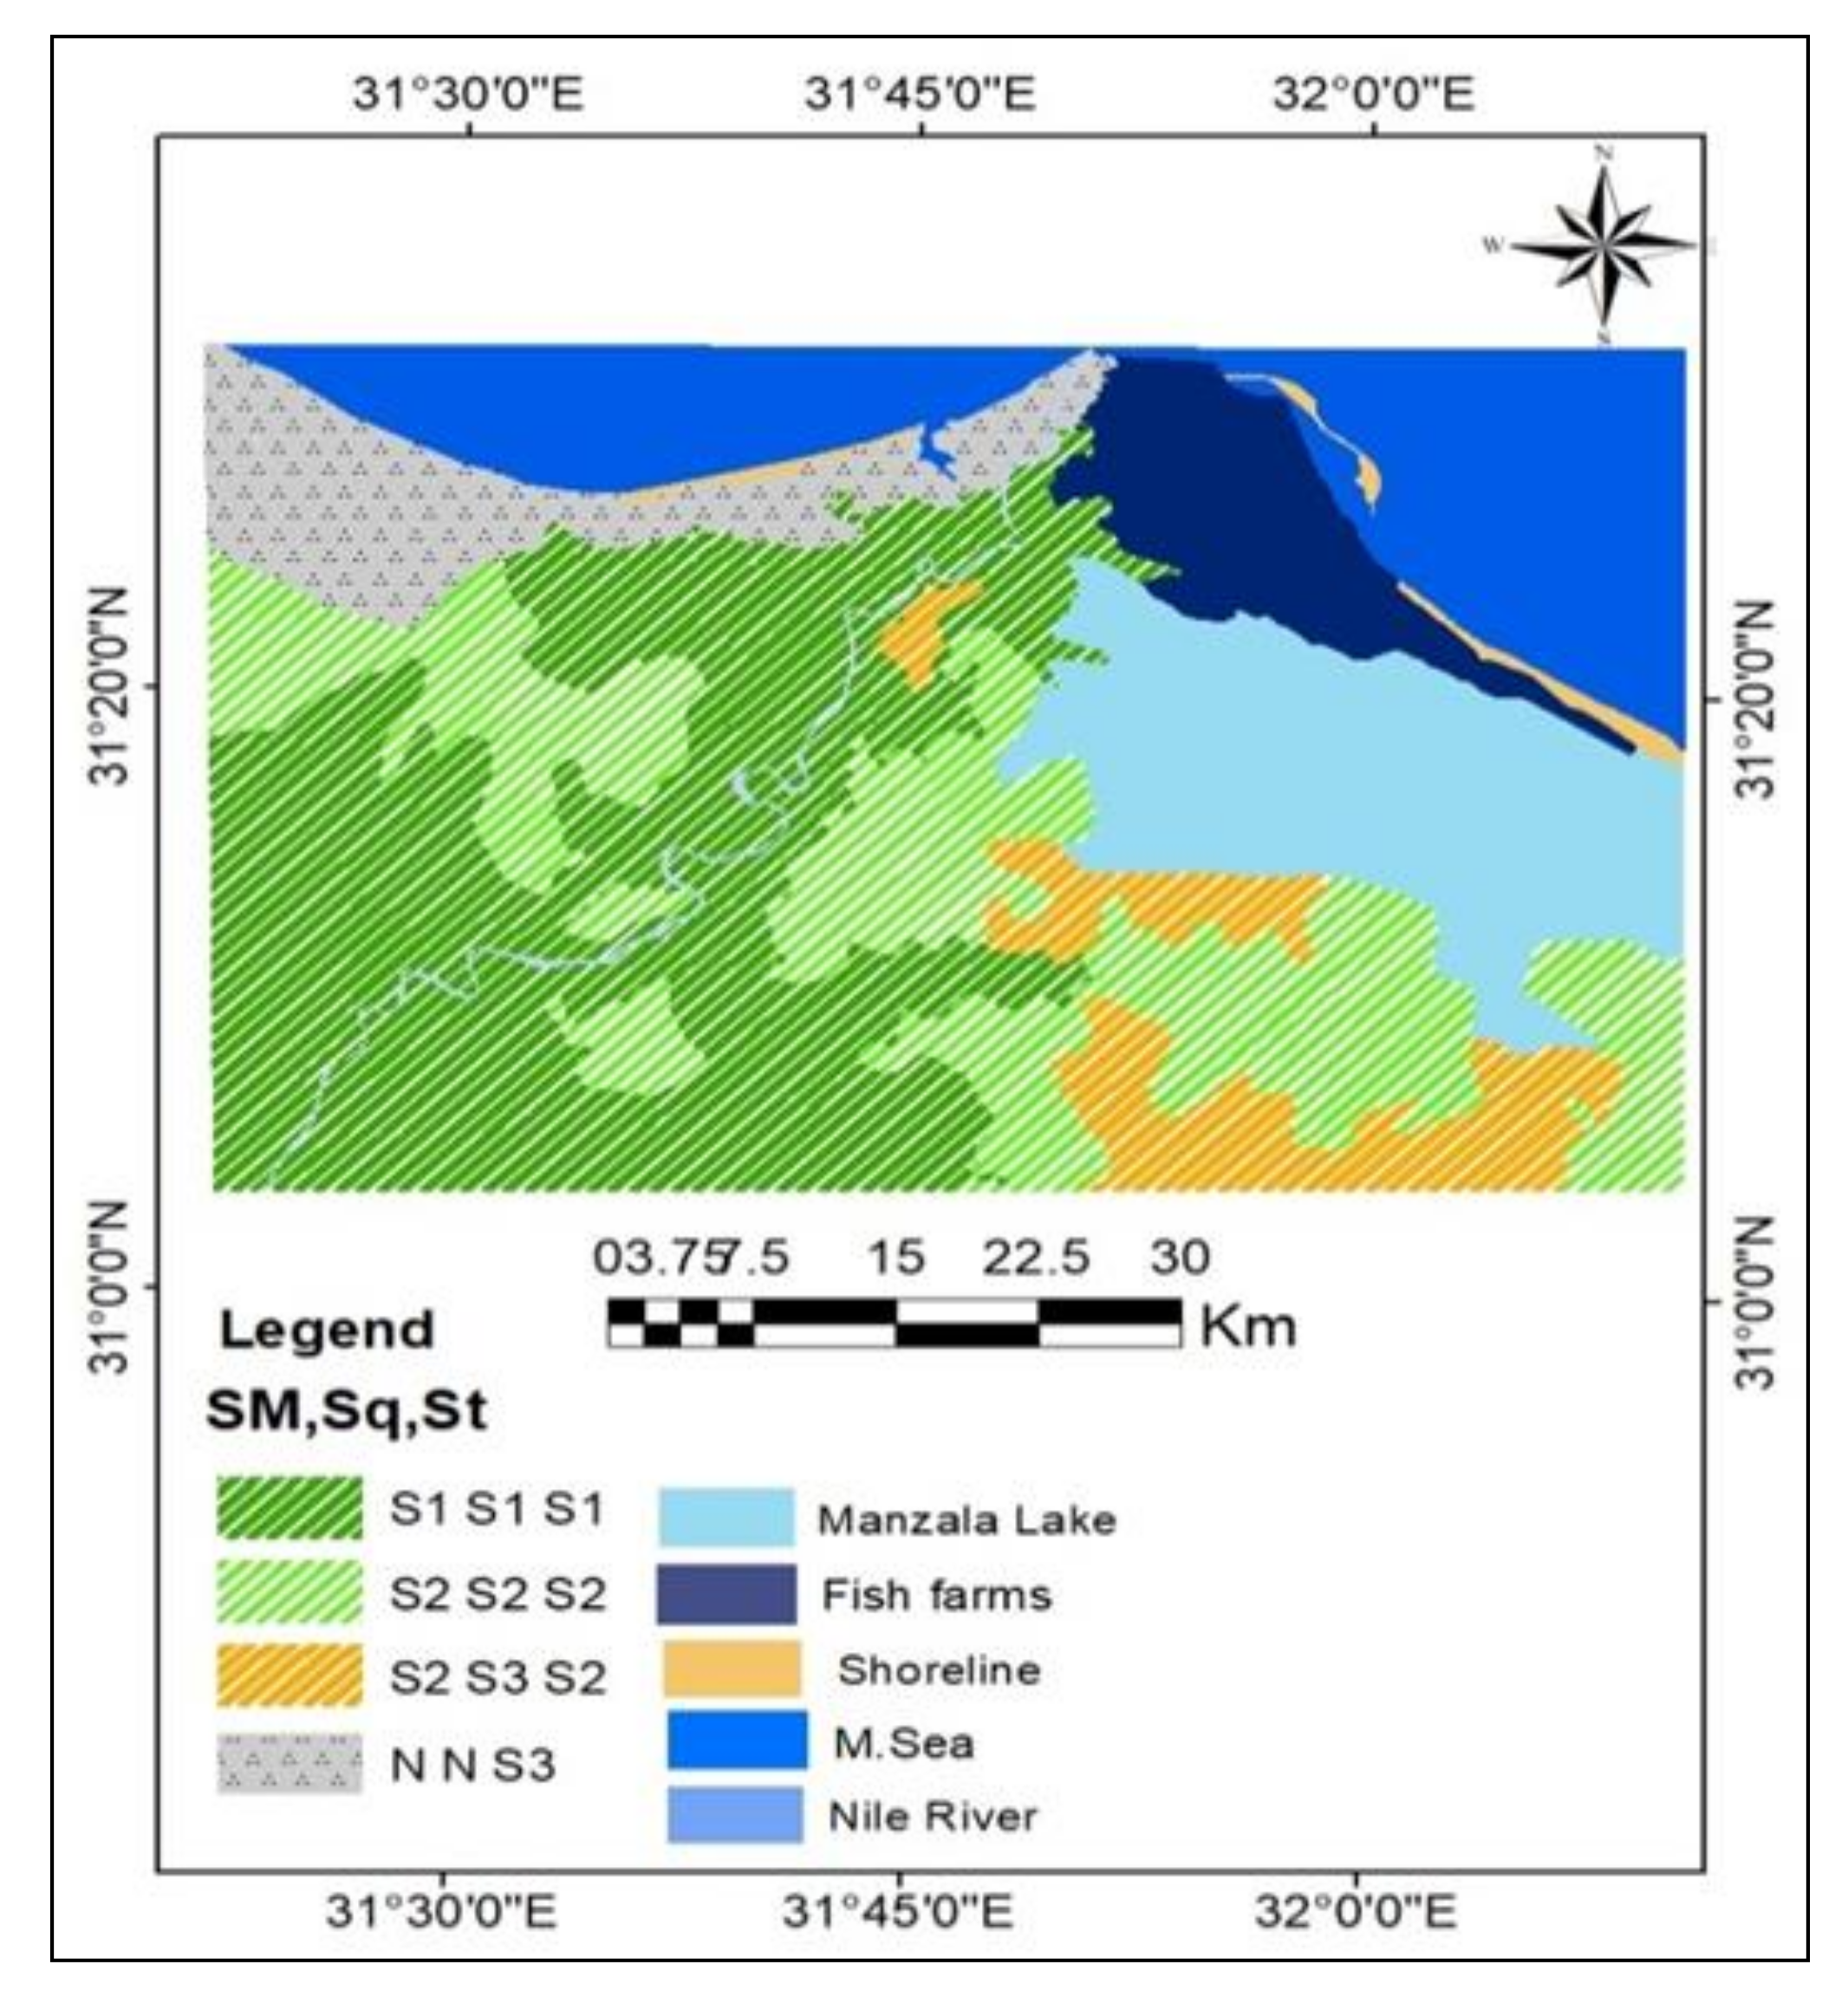
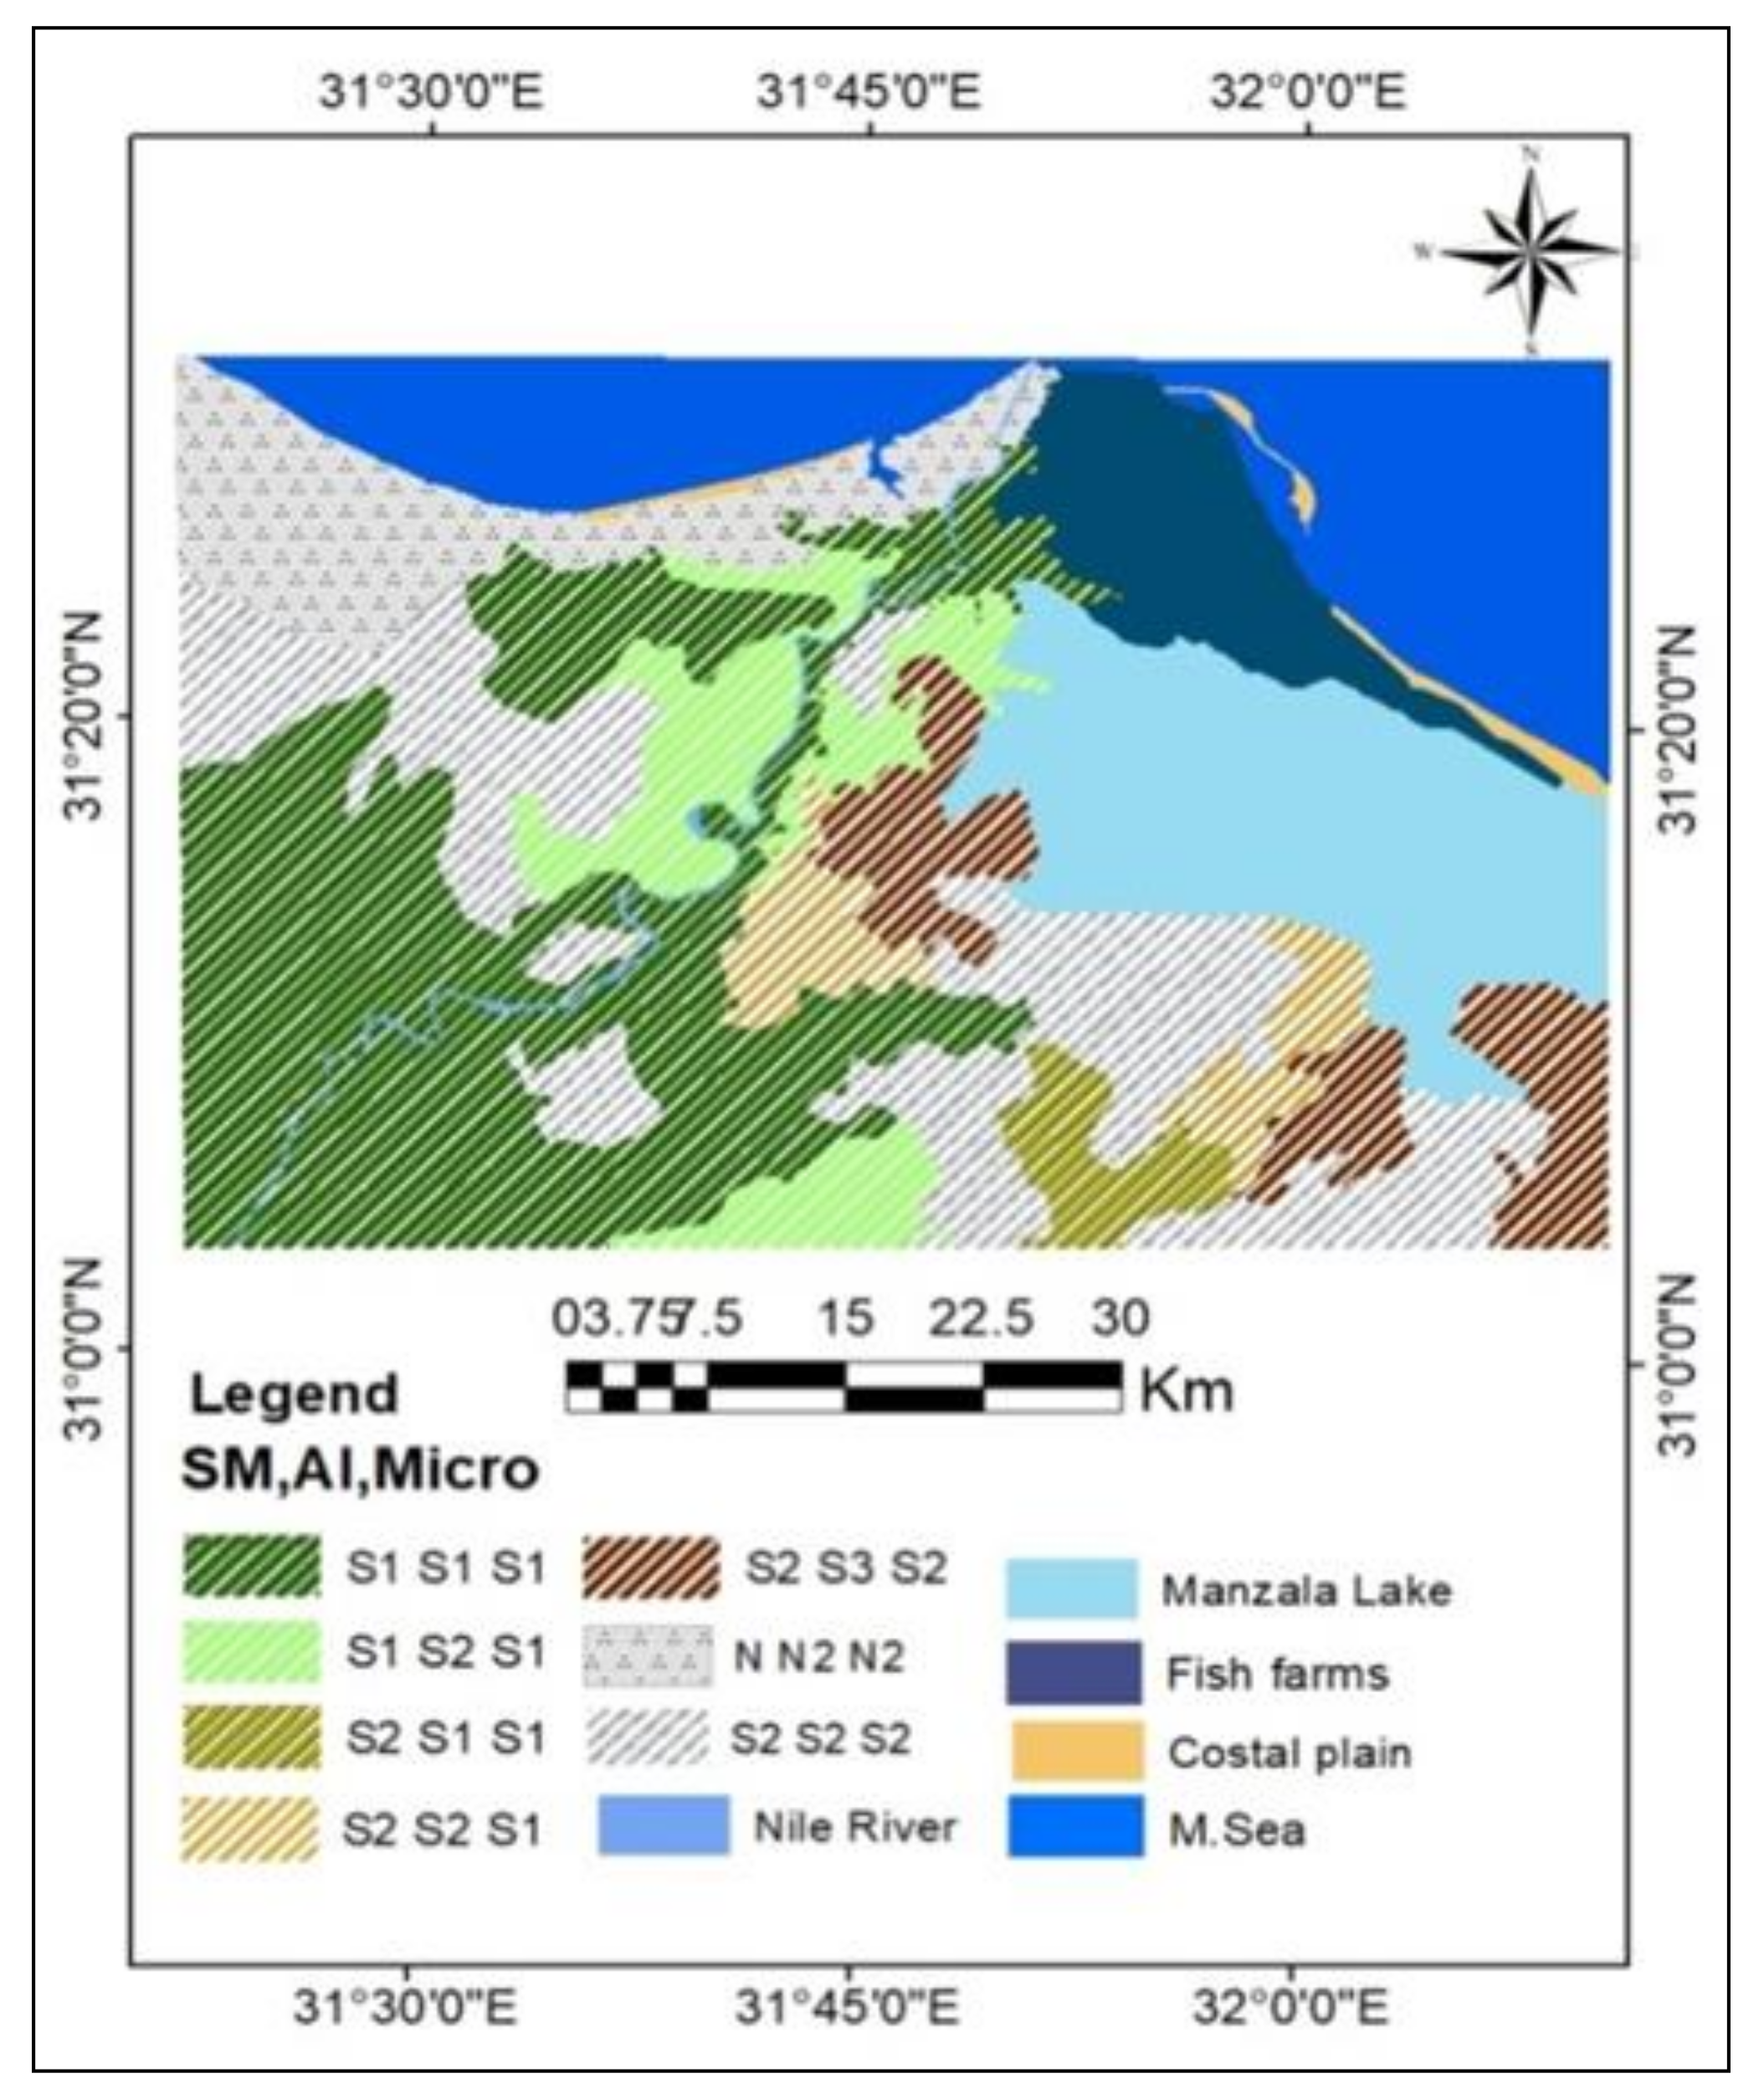
  • Soil suitability for rice using other methods
The soils of the study area were assessed to the suitability for rice crop production based on the soil characteristics using the proposed model, two parametric methods (the square root, Storie method) and two qualitative methods ALES model and MicroLES model. The results of the Storie method showed that about 44.44% of the total area is classified as highly suitable for rice (S1), 34.56% are classified as moderately suitable (S2) and 21.00% are marginally suitable (S3 class). The square root method results indicate that 44.44%, 24.02% and 19.98% of the soils are in the S1, S2, and S3 classes, respectively, 11.56% are unsuitable for rice crop as well. The ALES model results indicate that 40.70% of the soils represent S1 class, 38.30% are under S2 class and 20.00% are unsuitable for rice cultivation. The results of the MicroLEIS model show that an about 52.81% of the study area is classified as S1. In addition, about 35.63% of the area classified as S2 class while about 11.56% classified as N. Figure 10 and Figure 11 showed the degree of suitability of the rice crop between the proposed model and the previous models.
The kappa coefficient showed that the degree of similarity between the real and expected similarity was 0.83 between the MS and both models, the square root and Stories methods, and it was 0.75 between the proposed model and both the ALES and Micro LEIS models. The results indicate that the suitability index values of the ALES and Micro LEIS models are higher than those of the other methods in all the geomorphic units.
  • Normalized difference vegetation index (NDVI) and rice yield
Figure 12 shows the temporal profiles of the NDVI, calculated using Sentinel-2 imagery for rice crop. At the beginning of the season, average NDVI value was 0.1 (low). The values increased, reaching a peak in July and the maximum growing of the crop was recognized in August, then decreased to around 0.25 in September due to crop maturity with decreased biomass. Figure 13 illustrates the spatial distribution of the predicted rice yield linked with the growth stages of crop and considering changes in the NDVI time series during the season. The results illustrate that the yield ranging from 8 to 12 tons/hectare in the southern parts of the study area dominated by yields, and the magnitude of the yield reflects the capability of the soil to produce rice. These results correspond with the high NDVI values during growth stages, ranging between 0.023 and 0.84 (Figure 14). The validation of the current work showed reasonable results where R2 was 0.89 as it describes the correlation coefficient between the actual yield collected by field surveys and the predicted yield accordingly (extracted from produced map) (Figure 15). In addition, SEE was 0.722.

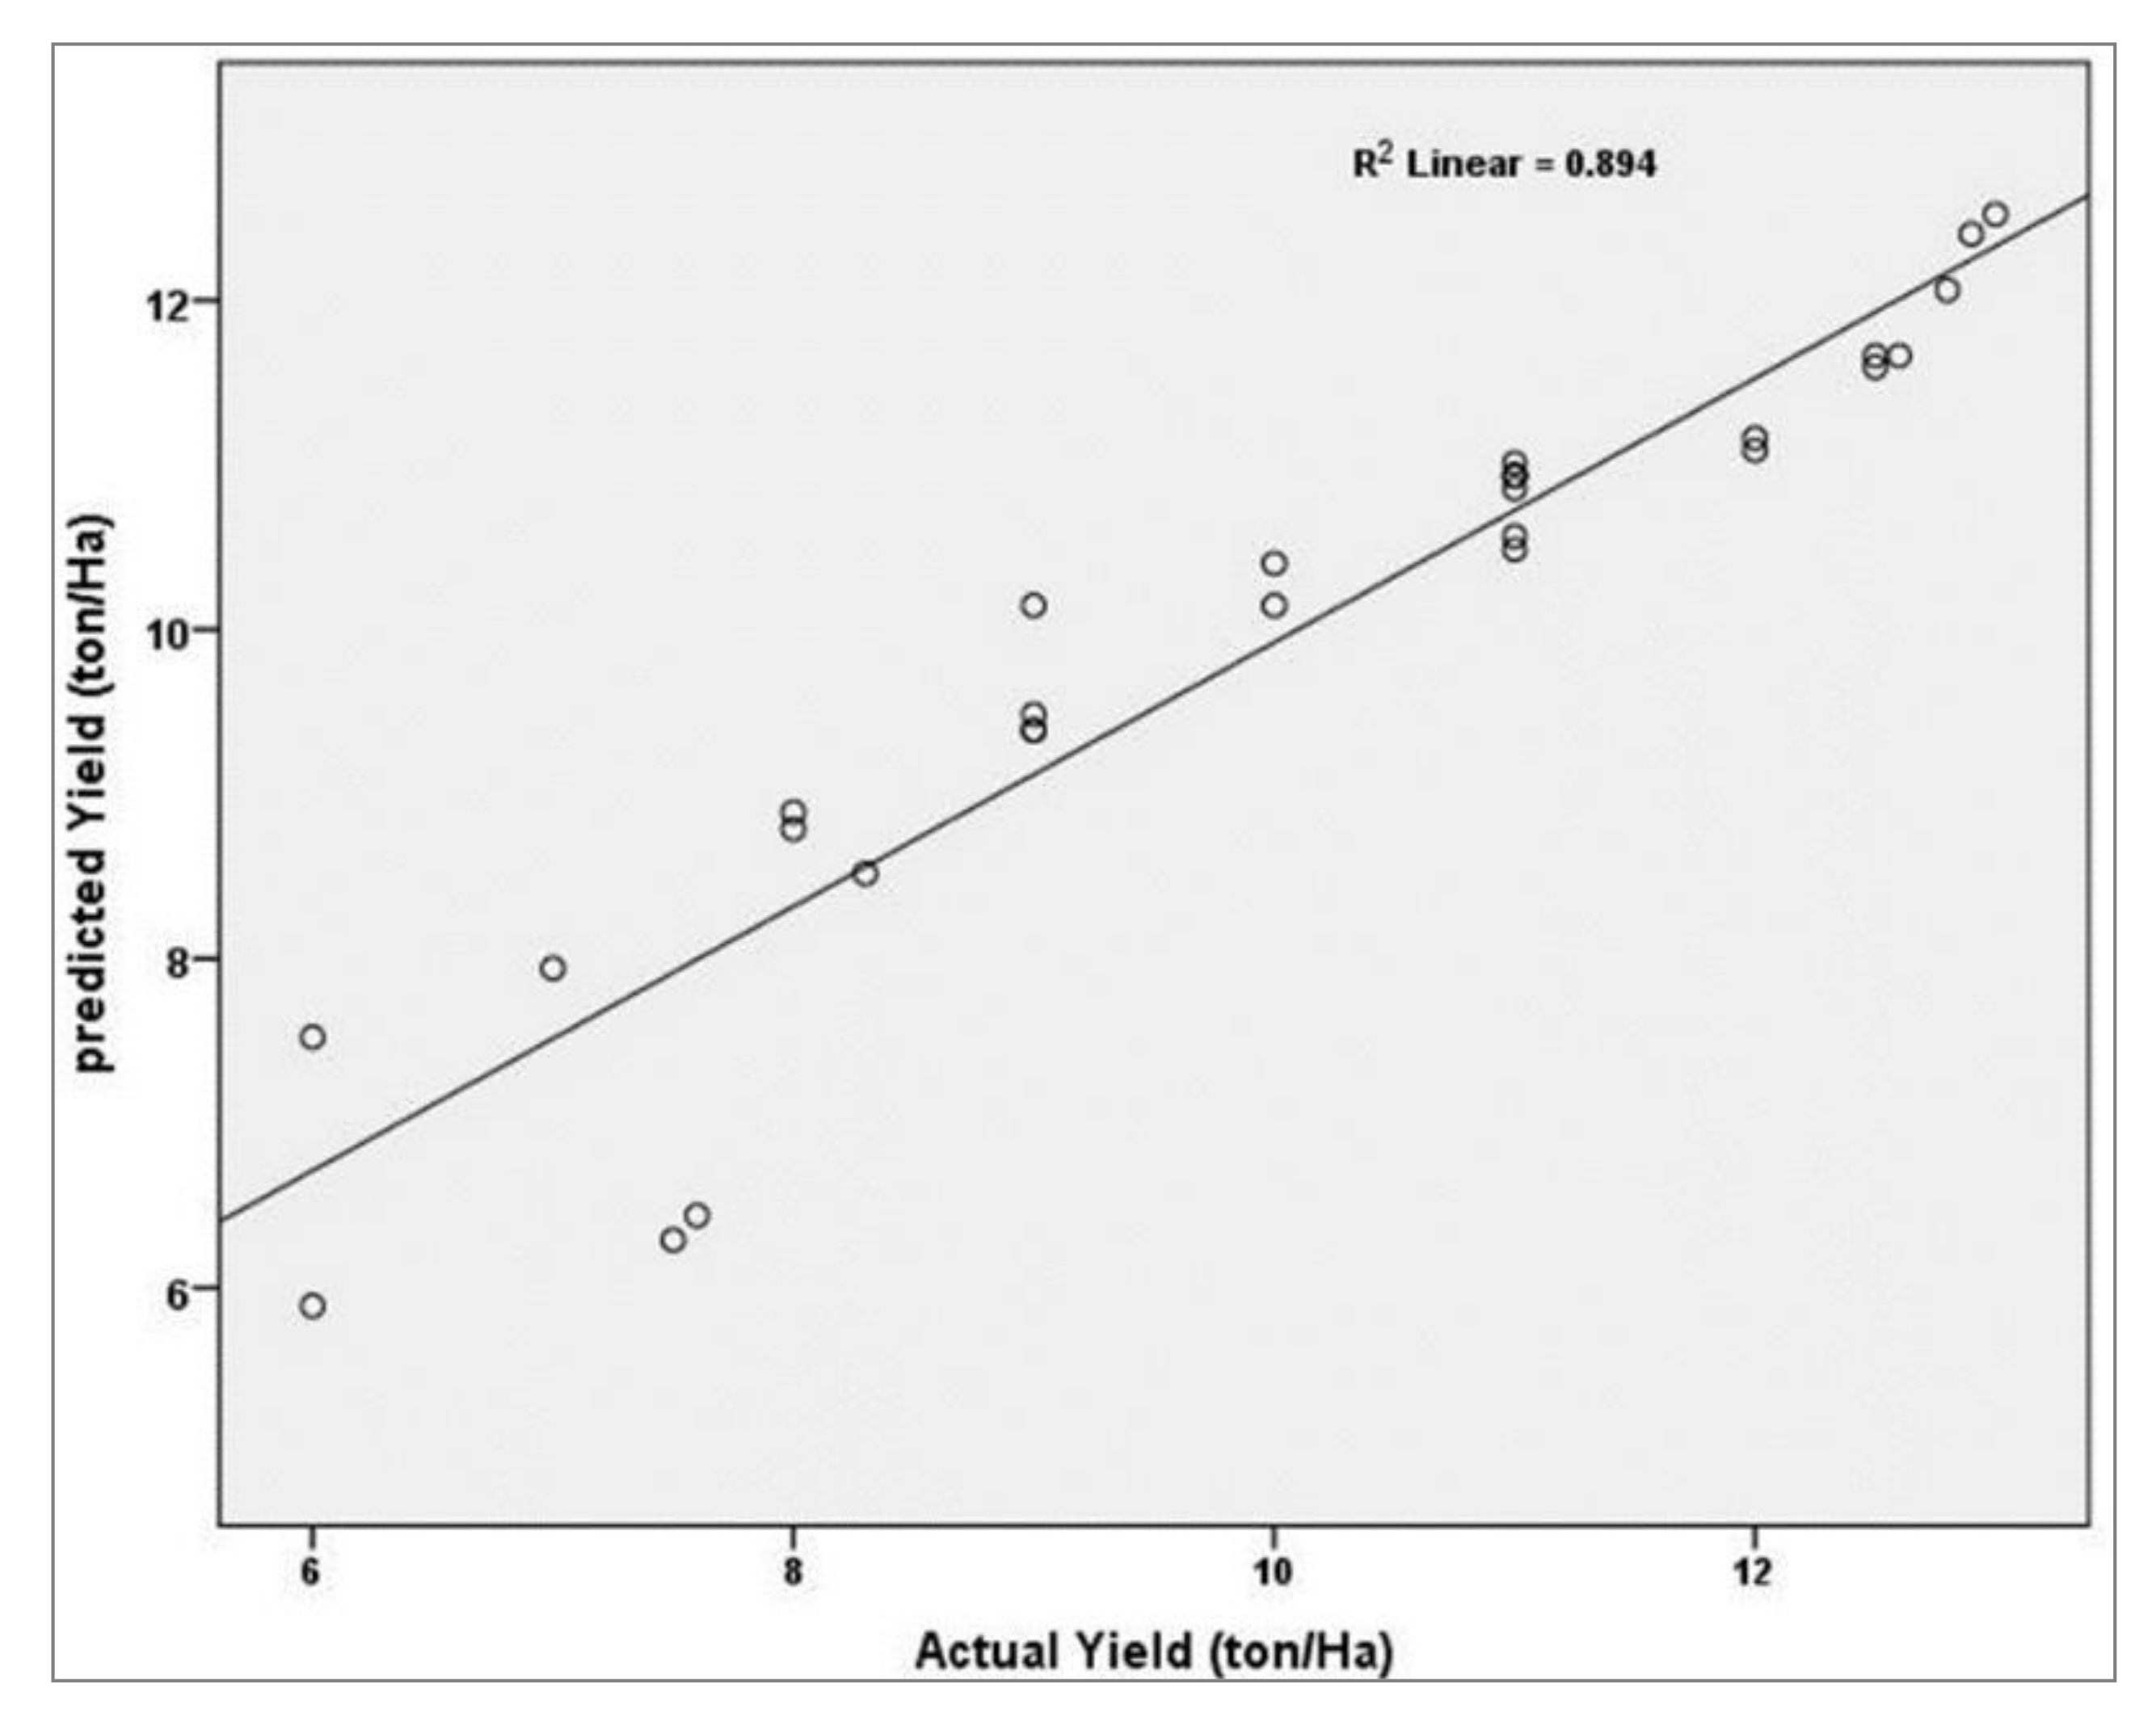
3.3.2. Yield Prediction and Land Suitability

Table 10 lists the correlation values between the suitability models and rice yield production; the proposed model provided the highest performance followed by MicroLES, Storie, ALES and Root with R2 being 0.92, 0.87, 0.86, 0.84 and 0.84, respectively. The results of the proposed model applied for assessing the land suitability of rice production according to its capability, showed the variation of yield prediction from 3.0 to 11.12 tons/hectare, and the suitability values ranged from 0.38 (N) to 0.82 (S1) (Table 11).

4. Discussion

4.1. Geomorphology and Soil of the Study Area

The main landscapes of the study area are alluvial, lacustrine and marine plains. These units are prevalent in the north of the Nile Delta of Egypt, and they are shown in the formation condition of the region. These units occupy the northern parts of Nile delta where located south are the lakes such as El Manzala, El Burolous, Edko and Marriott Lakes [59]. The salinity of soils varies between slight to high saline, where the high values of soil salinity in the study area were noted in sand sheets, which are attributed to the effect of the Mediterranean Sea water; this corresponds to the general pattern of the northern delta, where most of the soil is characterized by high soil salinity [60,61,62,63,64]. The rising of the water table level may be due to bad drainage and to the leakage from neighboring channels [65,66]. SOM content ranges between 0.36% and 1.89%, decreases irregularly with depth and the highest value was obtained in river levees related to the continuous addition of organic manure and plant residues [8].

4.2. Land Suitability

The assessment of the suitability of land for rice crop production depends on the conditions surrounding the agricultural process, ultimately, tracking crop growth and amount of production is the true indicator of soil condition. The current study considered the state of soil fertility and physical and chemical properties as well as the assessment of the state of the plant’s biomass represented by NDVI because these characteristics are the most relevant to the crop production. Rice crop production depends primarily on the fertility condition of the soil, along with water availability and climate factors [5]. The low fertile soils are located in north of the study area as soil texture is sand to loamy sand; in addition, low organic matter is dominant in these areas, and also low concentrations of both macro- and microelements [65]. The reason for the low fertility situation may be due to agricultural practices that have caused many effects that reduce soil fertility, as land degradation factors are activated in some regions, which affects the availability of nutrients on one hand and increases carbon release to the atmosphere on the other [65,66,67,68]. The chemical properties of the soil are related to many surrounding factors such as soil salinity, temperature, evapotranspiration and soil moisture, and other factors that affect the chemical balance in the soil, which is later reflected in the fertile state of the soil [64,65,66,67]. The sand mapping unit is characterized by low quality, which is a result of the coarse soil texture, saturated hydraulic conductivity and poor drainage conditions, where the physical properties of the soil depend on soil tillage conditions, organic additives, land use, fertilization and irrigation, in addition to soil conservation against the potential for degradation; this is in agreement with [68,69,70,71,72]. The growth and density of the crop were high, and this was reflected in the values of RNDVI.

4.3. Modeling of Land Suitability for Rice Crop

The proposed model depends on the integration of the fertility, chemical and physical properties together with the state of the biomass of the crop. The results obtained using the proposed model were logical, where, the study area is classified in to three suitability classes highly (S1), moderately (S2) and unsuitable (N) classes. These results were consistent with other models in the classification of soil suitability in some parts of the study area and differed in others, as shown in Figure 3.

4.4. Quality of Prediction Results

The results of suitability classes in Figure 12 showed the similarity between the proposed model, square root and Storie, where soils suitability degree for rice are highly identical; this classification corresponds to the chemical, physical, biological and moisture properties of the soils of North Delta [48,68,69]. These results confirm that the proposed model provides satisfactory results and can be applied under similar climatic conditions. On the other hand, the results showed an inconsistency in the evaluation of the soils of high clay flats unit, which were classified as marginally suitable (S3) based on the square root method, but was classified as moderately suitable (S2) based on the Storie method and proposed model, of which the findings are consistent with [65,69,70]. The results in Figure 13 highlighted a similarity in the degree of suitability of the soil for cultivation in most units based on the proposed model, ALES and MicroLEIS models, except for low basin units, which were classified as S1 class according to MicroLEIS model and S2 based on other models. Additionally, soils in high clay flat areas are highly suitable (S1) in both the ALES and MicroLEIS models, but in the proposed method, these soils are classified as moderately suitable (S2). These results are consistent with previous studies to classify the degree of suitability of the soil north and east of the Nile Delta to produce various crops, including rice [2,9,71,72,73,74,75]. The kappa coefficient values indicate reasonable results with the parametric methods and a good level of agreement with qualitative methods. The results reflect that the NDVI values decrease towards the north. Lower NDVI values were consistent with the decrease of yield production ranging from 3 to 8 tons/hectare. These results are compatible with [49,50,51,52], except in some patches with NDVI values and yields that may be due to good management practices in those areas. Hence, appropriate management is considered the main key to soil fertility and crop production, especially in areas that suffer from active degradation processes, such the area north of the Nile Delta [65,76,77,78].

4.5. The Suitability of the Soil is Reflects in the Productivity of the Crop

The results indicate that there was a correlation of crop production with the degree of soil suitability, where the soils located at south of the study area were characterized by a high degree of suitability for rice, and this was associated with soil fertility condition in those areas, on one hand, and improvement of physical and chemical properties on the other hand. These outputs are consistent with [46,47,48,49,50,51,52,53,54,55,56,57,58,59,60,61,62,63]. Meanwhile, for the soils that were classified by low suitability for the rice crop, located at north of the study area, where land degradation factors are active such as salinity, alkalinity and high water table, among others, this was reflected by the NDVI values during the crop growth season, which is consistent with [63,64,79,80,81]. Moreover, the results suggest that the soils that characterized by high suitability tend to have high rice yields. This relation can be used to determine soil characteristics that will be used in computerizing and calculation of crop yields more easily and more accurately than before.

5. Conclusions

Improvements in food security can benefit from modern information and sustainable agricultural technologies recognized as essential for countries to meet the SDGs, in other words to improve food production limiting environmental impact. In order to fully comprehend the deficiencies in our food system, the assessment of the appropriateness of the soil for crop production play an important role; thus, the proposed model includes the characterization and categorization of soil properties, soil fertility, physical, chemical and biological factors that affect the quality of the land and in turn crop yields. The use of Remote Sensing and GIS technologies can facilitate land suitability analysis and support sustainable land management, thus helping decision makers and regional governments to support the implementation of precision farming. This is a global critical issue, particularly relevant in developing countries, and the use of remote sensing can provide reliable low-cost tools promptly applicable in operational conditions.
The present study was undertaken to design a new method for land evaluation based on soil quality indicators and remote sensing data to assess and map soil suitability for rice crop. Results from the investigations, performed in some areas in the northern part of the Nile Delta, were compared with the most common approaches, two parametric (the square root, Storie method) and two qualitative (ALES and MicrioLES) methods. The devised model provided the highest performance with R2 equal to 0.92, followed by MicroLES, Storie, ALES and Root as R2 with value equal to 0.87, 0.86, 0.84 and 0.84, respectively, and significant increasing in the percentage rates of the R2 values equal to 5%, 6% and 8%. In addition, soil suitability models were consistent with NDVI during the crop growth, on one hand, and the overall the yield production on the other hand. From the quantitative point of view, results from the proposed model indicate that around 44.44% of the soils of the investigated area are classified as highly suitable for rice crop, 44% are moderately suitable, and approximately 11.56% are unsuitable for rice growth, and these areas have diverse physical and chemical properties. The validity of the model has been confirmed where the kappa coefficient reflected reasonable results 0.75 between the proposed model and both the ALES and Micro LEIS models, and 0.83 between the proposed model the square root and Storie methods. The obtained results indicate that the density of vegetation rice vegetation was consistent with the improvement of the natural and chemical soil condition south of the study area.
Thus, compared to the most traditional approaches, the proposed model provides significant improvements in land evaluations with very good outputs in arid regions. The soil evaluation map produced in this research can promptly aid decision makers and regional governments, and the approach herein proposed can be easily re-applied for wide areas to assess land suitability and predict the crop yield. The model herein proposed can be promptly implemented in other arid regions (different from those the model was developed) to support the development and implementation of sustainable agricultural activities and to achieve the SDGs of Agenda 2030.

Author Contributions

Data curation, A.M.A., F.S.M., and M.S.S.; formal analysis, A.M.A., A.A.E.B., E.S.M., F.S.M., I.S., A.M.S.K., and A.A.A.; funding acquisition, A.A.A. and P.D.; investigation, M.S.S., A.P., A.E., A.M.S.K., and P.D.; methodology, A.M.A., A.A.E.B., I.S., and Z.D.; project administration, E.S.M., F.S.M., and A.M.S.K.; resources, M.S.S., I.S., A.P., and P.D.; software, R.L. and A.P.; supervision, A.A.E.B., M.S.S., and R.L.; validation, E.S.M., F.S.M., A.P., and Z.D.; visualization, E.S.M., I.S., and Z.D.; writing the original draft, A.A.E.B., E.S.M., and I.S.; revising the last version A.E., A.M.A., and R.L. All authors have read and agreed to the published version of the manuscript.

Funding

The authors would like to declare that this research received no external funding.

Acknowledgments

The authors would like to thank the National Authority for Remote Sensing and Space Science (NARSS) for funding the field survey and remote sensing work. The authors would like thank the Soils and Water Department, Italian National Research Council, Faculty of Agricultural, Tanta University, Egypt I and would like to thank ESA for Sentinel-2 data availability. This research has been funded by 5-100 Project; it was among the competition winners to receive the state support within the RUDN University framework. The authors would like to extend their sincere appreciation to the Deanship of Scientific Research at King Saud University for its funding of this research through the Research Group Project no. RGP-VPP-275 for support.

Conflicts of Interest

The authors would like to declare that there is no conflict of interest in the data collection, analyses or interpretation of data; in the writing of the manuscript, or in the decision to publish the results.

References

  1. Mahmood, N.N.; Ahmad, D. Use of Remote Sensing and GIS Technologies in Precision Farming for Rice Crop in Malaysia Newsletter of the Malaysian Centre for Remote Sensing. Remote Sens. News 2001. [Google Scholar]
  2. Ashraf, S. Qualitative Evaluation of Land Suitability for Wheat in Northeast-Iran Using FAO Methods. Indian J. Sci. Technol. 2011, 4, 703–707. [Google Scholar] [CrossRef]
  3. Bodaghabadi, M.B.; Casasnovas, J.A.M.; Khakili, P.; Masihabadi, M.H.; Gandomkar, A. Assessment of the FAO Traditional Land Evaluation Methods, A Case Study: Iranian Land Classification Method. Soil Use Manag. 2015, 31, 384–396. [Google Scholar] [CrossRef] [Green Version]
  4. Saleh, A.; Belal, A.; Mohamed, E. Land Resources Assessment of El-Galaba Basin, South Egypt for the Potentiality of Agriculture Expansion Using Remote Sensing and GIS Techniques. Egypt. J. Remote Sens. Space Sci. 2015, 18, S19–S30. [Google Scholar] [CrossRef] [Green Version]
  5. El Baroudy, A. Mapping and Evaluating Land Suitability Using a GIS-Based Model. Catena 2016, 140, 96–104. [Google Scholar] [CrossRef]
  6. Prudat, B.; Bloemertz, L.; Kuhn, N.J. Local Soil Quality Assessment of North-Central Namibia: Integrating farmers’ and Technical Knowledge. Soil 2018, 4, 47–62. [Google Scholar] [CrossRef] [Green Version]
  7. Halder, J.C. Land Suitability Assessment for Crop Cultivation by Using Remote Sensing and GIS. J. Geogr. Geol. 2013, 5, 65. [Google Scholar] [CrossRef]
  8. El Baroudy, A.; El Baroudy, A. Monitoring Land Degradation Using Remote Sensing and GIS Techniques in an Area of the Middle Nile Delta, Egypt. Catena 2011, 87, 201–208. [Google Scholar] [CrossRef]
  9. Zhang, X.Y.; Gong, S.L.; Zhao, T.L.; Arimoto, R.; Wang, Y.Q.; Zhou, Z.J. Sources of Asian Dust and Role of Climate Change Versus Desertification in Asian Dust Emission. Geophys. Res. Lett. 2003, 30. [Google Scholar] [CrossRef] [Green Version]
  10. Mohamed, E.S. Spatial Assessment of Desertification in North Sinai Using Modified MEDLAUS Model. Arab. J. Geosci. 2013, 6, 4647–4659. [Google Scholar] [CrossRef]
  11. Chauhan, B.S.; Jabran, K.; Mahajan, G. Rice Production Worldwide; Springer International Publishing AG: Cham, Switzerland, 2017. [Google Scholar]
  12. Juliano, B.O. Comprehensive Review of All Aspects of Rice Grain chemistry. In Rice: Chemistry and Technology; The American Association of Cereal Chemists, Inc.: St. Paul, MN, USA, 1994. [Google Scholar]
  13. El Baroudy, A.; Ibrahim, M.M.; Mahmoud, M.A. Effects of Deficit Irrigation and Transplanting Methods of Irrigated Rice on Soil Physical Properties and Rice Yield. Soil Use Manag. 2013, 30, 88–98. [Google Scholar] [CrossRef]
  14. FAO; Sundberg, U. Harvesting Man-Made Forests in Developing Countries: A Manual on Techniques, Roads, Production and Costs; FAO: Rome, Italy, 1976. [Google Scholar]
  15. De La Rosa, D.; Mayol, F.; Diaz-Pereira, E.; Fernandez, M. A Land Evaluation Decision Support System (MicroLEIS DSS) for Agricultural Soil Protection. Environ. Model. Softw. 2004, 19, 929–942. [Google Scholar] [CrossRef]
  16. Sys, C.; Van Ranst, E.; Debaveye, J. Land Evaluation. Part I: Principles in Land Evaluation and Crop Production Calculations; Agricultural Publications: Brussels, Belgium, 1991. [Google Scholar]
  17. Salah, A.; Van Ranst, E.; Hisham, E. Land Suitability Assessment for Date Palm Cultivation in the Eastern Nile Delta, Egypt Using an Automated Land Evaluation System and GIS. In Proceedings of the Second International Conference on Date Palms, Al-Ain, UAE, 25–27 March 2001; pp. 800–820. [Google Scholar]
  18. Recatalá, L.; Zinck, J.A. Land-Use Planning in the Chaco Plain (Burruyacú, Argentina): Part 2: Generating a Consensus Plan to Mitigate Land-Use Conflicts and Minimize Land Degradation. Environ. Manag. 2008, 42, 200–209. [Google Scholar] [CrossRef] [PubMed]
  19. Fontes, M.P.; Fontes, R.M.; Carneiro, P.A. Land Suitability, Water Balance and Agricultural Technology as a Geographic-Technological Index to Support Regional Planning and Economic Studies. Land Use Policy 2009, 26, 589–598. [Google Scholar] [CrossRef]
  20. Abdelrahman, M.A.E.; Shalaby, A.; Essa, E.F. Quantitative Land Evaluation Based on Fuzzy-Multi-Criteria Spatial Model for Sustainable Land-Use Planning. Model. Earth Syst. Environ. 2018, 4, 1341–1353. [Google Scholar] [CrossRef]
  21. Mohamed, E.; Saleh, A.; Belal, A.; Gad, A. Application of Near-Infrared Reflectance for Quantitative Assessment of Soil Properties. Egypt. J. Remote Sens. Space Sci. 2018, 21, 1–14. [Google Scholar] [CrossRef]
  22. FAO. Management and Conservation Service Soil Resources. In Guidelines: Land Evaluation for Irrigated Agriculture; FAO: Rome, Italy, 1985. [Google Scholar]
  23. Rabati, A.P.; Jafarzadeh, A.A.; Shahbazi, F.; Rezapour, S.; Momtaz, H.R. Qualitative and Quantitative Land-Suitability Evaluation for Sunflower and Maize in the North-West of Iran. Arch. Agron. Soil Sci. 2012, 58, 1229–1242. [Google Scholar] [CrossRef]
  24. Hamzeh, S.; Mokarram, M.; Alavipanah, S.K. Combination of Fuzzy and AHP Methods to Assess Land Suitability for Barley: Case Study of Semi Arid Lands in the Southwest of Iran. Desert 2014, 19, 173–181. [Google Scholar]
  25. El-Zeiny, A.M.; Effat, H.A. Environmental Analysis of Soil Characteristics in El-Fayoum Governorate Using Geomatics Approach. Environ. Monit. Assess. 2019, 191, 463. [Google Scholar] [CrossRef]
  26. El Baroudy, A.A.; Moghanm, F.S. Combined Use of Remote Sensing and GIS for Degradation Risk Assessment in Some Soils of the Northern Nile Delta, Egypt. Egypt. J. Remote Sens. Space Sci. 2014, 17, 77–85. [Google Scholar] [CrossRef]
  27. Cochran, C.C. Soil Moisturetemperature Correlation and Classification Model. In Proceedings of the 19th World Congress of Soil Science, Soil Solutions for a Changing World, Brisbane, Australia, 1–6 August 2010; pp. 1–6. [Google Scholar]
  28. Climatological Normal for Egypt. The Normal for KafrElSheikh Governorate from 1960 to 2011; Ministry of Civil Aviation, Meteorological Authority: Cairo, Egypt, 2011. [Google Scholar]
  29. Staff, S.S. Natural Resources Conservation Service. In Keys to Soil Taxonomy; United States Department of Agriculture: Washington, DC, USA, 1996; p. 644. [Google Scholar]
  30. Belal, A.A. Monitoring and Evaluation of Soil Productivity of Some Areas in NorthNile Delta, Egypt. Master’s Thesis, Soil Science Department, Faculty of Agriculture, Cairo University, Cairo, Egypt, 2001. [Google Scholar]
  31. Kaufman, Y.J.; Tanré, D.; Gordon, H.R.; Nakajima, T.; Lenoble, J.; Frouin, R.; Grassl, H.; Herman, B.M.; King, M.D.; Teillet, P.M. Passive Remote Sensing of Tropospheric Aerosol and Atmospheric Correction for the Aerosol Effect. J. Geophys. Res. Space Phys. 1997, 102, 16815–16830. [Google Scholar] [CrossRef] [Green Version]
  32. Dobos, E.; Norman, B.; Worstell, B.; Al, E. The Use of DEM and Satellite Data for Regional Scale Soil Databases. Agrokémia Talajt. 2002, 51, 263–272. [Google Scholar] [CrossRef]
  33. FAO. Guidelines for Soil Description, 4th ed.; FAO: Rome, Italy, 2006. [Google Scholar]
  34. Gee, G.W.; Bauder, J.W. Particle-size Analysis. In Methods of Soil Analysis: Part 1 Physical and Mineralogical Methods; Wiley: Hoboken, NJ, USA, 1986; pp. 383–411. [Google Scholar]
  35. Page, A.L. Methods of Soil Analysis Part 2: Chemical and Microbiological Properties; American Society of Agronomy: Madison, WI, USA, 1965. [Google Scholar]
  36. Jackson, M.L. Soil Chemical Analysis; Pentice Hall of India Pvt. Ltd.: New Delhi, India, 1973. [Google Scholar]
  37. Lindsay, W.L.; Norvell, W.A. Development of a DTPA Soil Test for Zinc, Iron, Manganese, and Copper. Soil Sci. Soc. Am. J. 1978, 42, 421–428. [Google Scholar] [CrossRef]
  38. Loeppert, R.H.; Suarez, D.L. Carbonate and Gypsum. In Methods of Soil Analysis: Part 3 Chemical Methods; American Society of Agronomy: Madison, WI, USA, 1996; pp. 437–474. [Google Scholar]
  39. Kulich, J. Training for Adult Educators and Research in Adult Education at the University of British Columbia, Canada. Int. Jahrb. Erwachs. 1971, 2. [Google Scholar] [CrossRef]
  40. He, M.; Kimball, J.S.; Maneta, M.P.; Maxwell, B.D.; Moreno-Martínez, Á.; Beguería, S.; Wu, X. Regional Crop Gross Primary Productivity and Yield Estimation Using Fused Landsat-MODIS Data. Remote Sens. 2018, 10, 372. [Google Scholar] [CrossRef] [Green Version]
  41. Sys, C.; Van Ranst, E.; Debaveye, J.; Beernaert, F. Land Evaluation Part III: Crop Requirements; Agricultural Publications N° 7; GADC: Brussels, Belgium, 1993. [Google Scholar]
  42. FAO. A Framework for Land Evaluation. Soils Bulletin; FAO: Rome, Italy, 1976; p. 32. [Google Scholar]
  43. FAO. Guidelines: Land Evaluation for Irrigated Agriculture; Soils Bulletin 55; FAO: Rome, Italy, 1985. [Google Scholar]
  44. FAO. Guidelines for Land-Use Planning, FAO Development Series 1; FAO: Rome, Italy, 1993; p. 96. [Google Scholar]
  45. Khiddir, S.M. A Statistical Approach in the Use of Parametric Systems Applied to the FAO Framework for Land Evaluation. Ph.D. Thesis, Ghent University, Ghent, Belgium, 1986. [Google Scholar]
  46. Ahamed, T.; Noguchi, R.; Takigawa, T.; Tian, L. Bioproduction Engineering: Automation and Precision Agronomics for Sustainable Agricultural Systems, 2nd ed.; Nova Science Publishers, Inc.: New York, NY, USA, 2016. [Google Scholar]
  47. Storie, R. Storie Index Rating; University of California Division of Agricultural Sciences Special Publication 3203: Oakland, CA, USA, 1978. [Google Scholar]
  48. Rossiter, D.G. ALES: A Microcomputer Program to Assist in Land Evaluation. In Proceedings of the International Workshop on Land Qualities in Space and Time, Wageningen, The Netherlands, 22–26 August 1988. [Google Scholar]
  49. Cohen, J. A Coefficient of Agreement for Nominal Scales. Educ. Psychol. Meas. 1960, 20, 37–46. [Google Scholar] [CrossRef]
  50. Gumma, M.K.; Nelson, A.; Thenkabail, P.S.; Singh, A.N. Mapping Rice Areas of South Asia Using MODIS Multitemporal Data. J. Appl. Remote Sens. 2011, 5, 053547. [Google Scholar] [CrossRef] [Green Version]
  51. Gumma, M.K.; Thenkabail, P.S.; Hideto, F.; Nelson, A.; Dheeravath, V.; Busia, D.; Rala, A. Mapping Irrigated Areas of Ghana Using Fusion of 30 M and 250 M Resolution Remote-Sensing Data. Remote Sens. 2011, 3, 816–835. [Google Scholar] [CrossRef] [Green Version]
  52. Mosleh, M.K.; Hassan, Q.K.; Chowdhury, E.H. Application of Remote Sensors in Mapping Rice Area and Forecasting Its Production: A Review. Sensors 2015, 15, 769–791. [Google Scholar] [CrossRef] [Green Version]
  53. Ali, A.M.; Aboelghar, M.A.; El-Shirbeny, M.A.; Salem, N.H. Comparative Analysis of Some Winter Crops Area Estimation Using Landsat-8 and Sentinal-2 Satellite. AJAB 2018, 6, 189–197. [Google Scholar]
  54. Rahman, R.; Saha, S.K. Multi-Resolution Segmentation for Object-Based Classification and Accuracy Assessment of Land use/Land Cover Classification Using Remotely Sensed Data. J. Indian Soc. Remote Sens. 2008, 36, 189–201. [Google Scholar] [CrossRef]
  55. Noureldin, N.; Aboelghar, M.; Saudy, H.; Ali, A. Rice Yield Forecasting Models Using Satellite Imagery in Egypt. Egypt. J. Remote Sens. Space Sci. 2013, 16, 125–131. [Google Scholar] [CrossRef] [Green Version]
  56. El-Seedy, M.E.; Saeed, M.A. Tracking Changes in Soil Fertility at North Nile Delta, Egypt Using GIS Techniques. J. Soil Sci. Agric. Eng. 2019, 10, 627–635. [Google Scholar] [CrossRef]
  57. Mohamed, E.S.; Belal, A.A.B.; Saleh, A.S. Assessment of Land Degradation East of the Nile Delta, Egypt Using Remote Sensing and GIS Techniques. Arab. J. Geosci. 2013, 6, 2843–2853. [Google Scholar] [CrossRef]
  58. Mohamed, E.S.; Morgun, E.G.; Kovda, I.V. Assessment of Soil Degradation in the Eastern Part of the Nile Delta. Mosc. Univ. Soil Sci. Bull. 2011, 66, 86–92. [Google Scholar] [CrossRef]
  59. El Basiouny, H.; Abowaly, M.; Abu Alkheir, A.; Gad, A.A. Spatial Variation of Soil Carbon and Nitrogen Pools by Using Ordinary Kriging Method in an Area of North Nile Delta, Egypt. Catena 2014, 113, 70–78. [Google Scholar] [CrossRef]
  60. Mohamed, E.S.; Ali, A.M.; Borin, M.; Abd-Elmabod, S.K.; Aldosari, A.A.; Khalil, M.M.N.; Abdel-Fattah, M.K. On the Use of Multivariate Analysis and Land Evaluation for Potential Agricultural Development of the Northwestern Coast of Egypt. Agronomy 2020, 10, 1318. [Google Scholar]
  61. Abdel-Fattah, M.K.; Abd-Elmabod, S.K.; Aldosari, A.A.; Elrys, A.S.; Mohamed, E.S. Multivariate Analysis for Assessing Irrigation Water Quality: A Case Study of the Bahr Mouise Canal, Eastern Nile Delta. Water 2020, 12, 2537. [Google Scholar] [CrossRef]
  62. Mohamed, E.S.; Schütt, B.; Belal, A. Assessment of Environmental Hazards in the North Western Coast—Egypt Using RS and GIS. Egypt. J. Remote Sens. Space Sci. 2013, 16, 219–229. [Google Scholar] [CrossRef] [Green Version]
  63. Yanni, Y.G.; Abd El-Fatiah, F.K. Towards Integrated Biofertilization Management with Free Living and Associative Dinitrogen Fixers for Enhancing Rice Performance in the Nile Delta. Symbiosis 1999, 27, 319–331. [Google Scholar]
  64. Hammam, A.; Mohamed, E. Mapping Soil Salinity in the East Nile Delta Using Several Methodological Approaches of Salinity Assessment. Egypt. J. Remote Sens. Space Sci. 2020, 23, 125–131. [Google Scholar] [CrossRef]
  65. Mohamed, E.; Ali, A.; El-Shirbeny, M.; Mohamed, E.; Shaddad, S.M. Mapping Soil Moisture and Their Correlation with Crop Pattern Using Remotely Sensed Data in Arid Region. Egypt. J. Remote Sens. Space Sci. 2019. [Google Scholar] [CrossRef]
  66. Hassan, A.; Belal, A.; Hassan, M.; Farag, F.; Mohamed, E. Potential of Thermal Remote Sensing Techniques in Monitoring Waterlogged Area Based on Surface Soil Moisture Retrieval. J. Afr. Earth Sci. 2019, 155, 64–74. [Google Scholar] [CrossRef]
  67. Abd-Elmabod, S.K.; Mansour, H.; Hussein, A.A.E.F.; Mohamed, E.S.; Zhang, Z.; Anaya-Romero, M.; Jordán, A. Influence of Irrigation Water Quantity on the Land Capability Classification. Plant Arch. 2019, 2, 2253–2561. [Google Scholar]
  68. Mohamed, E.S.; Ali, A.M.; El Shirbeny, M.A.; Abd El Razek, A.A.; Savin, I.Y. Near infrared spectroscopy techniques for soil contamination assessment in the Nile Delta. Eurasian Soil Sci. 2016, 49, 632–639. [Google Scholar] [CrossRef]
  69. Filho, J.D.S.O.; Vieira, J.N.; Da Silva, E.M.R.; De Oliveira, J.G.B.; Pereira, M.G.; Brasileiro, F.G. Assessing the Effects of 17 Years of Grazing Exclusion in Degraded Semi-Arid Soils: Evaluation of Soil Fertility, Nutrients Pools and Stoichiometry. J. Arid. Environ. 2019, 166, 1–10. [Google Scholar] [CrossRef]
  70. El Nahry, A.H.; Mohamed, E.S. Potentiality of land and water resources in African Sahara: A case study of south Egypt. Environ. Earth Sci. 2011, 63, 1263–1275. [Google Scholar] [CrossRef]
  71. Gu, Z.; Xie, Y.; Gao, Y.; Ren, X.; Cheng, C.; Wang, S. Quantitative Assessment of Soil Productivity and Predicted Impacts of Water Erosion in the Black Soil Region of Northeastern China. Sci. Total Environ. 2018, 637, 706–716. [Google Scholar] [CrossRef]
  72. Mohamed, E.; Abu-Hashim, M.; Abdelrahman, M.A.E.; Schütt, B.; Lasaponara, R. Evaluating the Effects of Human Activity over the Last Decades on the Soil Organic Carbon Pool Using Satellite Imagery and GIS Techniques in the Nile Delta Area, Egypt. Sustainability 2019, 11, 2644. [Google Scholar] [CrossRef] [Green Version]
  73. Hendawy, E.; Belal, A.A.; Mohamed, E.S.; Elfadaly, A.; Murgante, B.; Aldosari, A.A.; Lasaponara, R. The Prediction and Assessment of the Impacts of Soil Sealing on Agricultural Land in the North Nile Delta (Egypt) Using Satellite Data and GIS Modeling. Sustainability 2019, 11, 4662. [Google Scholar] [CrossRef] [Green Version]
  74. Elnahry, A.H.; Mohamed, E.S.; Nasar, N. Using Remote Sensing and Spatial Analyses Techniques for Optimum Land Use Planning, West of Suez Canal, Egypt. Egypt. J. Remote Sens. Space Sci. 2008, 11, 27–42. [Google Scholar]
  75. Mohamed, E.S.; Belal, A.; Shalaby, A. Impacts of Soil Sealing on Potential Agriculture in Egypt Using Remote Sensing and GIS Techniques. Eurasian Soil Sci. 2015, 48, 1159–1169. [Google Scholar] [CrossRef]
  76. Vargahan, B.; Shahbazi, F.; Hajrasouli, M. Quantitative and Qualitative Land Suitability Evaluation for Maize Cultivation in Ghobadlou Region, Iran. Ozean J. Appl. Sci. 2011, 4, 91–104. [Google Scholar]
  77. Bakr, N.; Afifi, A.A. Quantifying Land use/Land Cover Change and Its Potential Impact on Rice Production in the Northern Nile Delta, Egypt. Remote Sens. Appl. Soc. Environ. 2019, 13, 348–360. [Google Scholar] [CrossRef]
  78. Abdelrahman, M.A.; Shalaby, A.; Mohamed, E. Comparison of Two Soil Quality Indices Using Two Methods Based on Geographic Information System. Egypt. J. Remote Sens. Space Sci. 2019, 22, 127–136. [Google Scholar] [CrossRef]
  79. Ali, A.M.; Savin, I.; Poddubskiy, A.; Abouelghar, M.; Saleh, N.; Abutaleb, K.; El-Shirbeny, M.; Dokukin, P. Integrated Method for Rice Cultivation Monitoring Using Sentinel-2 Data and Leaf Area Index. Egypt. J. Remote Sens. Space Sci. 2020. [Google Scholar] [CrossRef]
  80. Mansour, H.A.; Abd-Elmabod, S.K.; AbdelGawad, S. The impact of sub-surface drip irrigation and different water deficit treatments on the spatial distribution of soil moisture and salinity. Plant Arch. 2019, 2, 384–392. [Google Scholar]
  81. Mohamed, E.S.; Baroudy, A.A.E.; El-beshbeshy, T.; Emam, M.; Belal, A.A.; Elfadaly, A.; Aldosari, A.A.; Ali, A.M.; Lasaponara, R. Vis-NIR Spectroscopy and Satellite Landsat-8 OLI Data to Map Soil Nutrients in Arid Conditions: A Case Study of the Northwest Coast of Egypt. Remote Sens. 2020, 12, 3716. [Google Scholar] [CrossRef]
Figure 1. Flowchart of the methodological approach devised in the study.
Sustainability 12 09653 g001
Figure 2. Location of the study area in Egypt (on the left) from Landsat 7 (RGB 5, 4, 3) and (on the right) from Sentinel-2 (RGB 4, 3, 2).
Sustainability 12 09653 g002
Figure 3. Flowchart of the proposed model created in the GIS model builder.
Sustainability 12 09653 g003
Figure 4. Schematic diagram devised to estimate the suitability for rice cultivation.
Sustainability 12 09653 g004
Figure 5. Geomorphologic map of the study area.
Sustainability 12 09653 g005
Figure 6. Soil fertility quality index in the study area.
Sustainability 12 09653 g006
Figure 7. Soil chemical quality index in the study area.
Sustainability 12 09653 g007
Figure 8. Soil physical quality index in the study area.
Sustainability 12 09653 g008
Figure 9. Land suitability in the study area according to the proposed model.
Sustainability 12 09653 g009
Figure 10. Land suitability classes in the study area based on the proposed model (SM) and square root (Sq) and Storie index (St) methods.
Sustainability 12 09653 g010
Figure 11. Land suitability classes in study area based on the SM model and ALES (Al) and MicroLEIS (Micro) methods.
Sustainability 12 09653 g011
Figure 12. Relation of the NDVI to crop phenology.
Sustainability 12 09653 g012
Figure 13. Spatial distribution of the rice yield in each pixel based on the NDVI value.
Sustainability 12 09653 g013
Figure 14. NDVI values during growth stages.
Sustainability 12 09653 g014
Figure 15. Correlation between the actual and predicted rice crop yields.
Sustainability 12 09653 g015
Table 1. Sentinel-2 data acquired for the study area in the 2017 rice season.
SensorAcquisition DateSpecial Resolution after ResamplingSource
Sentinel 2A14 May 201710 m
Sentinel 2A24 May 201710 m
Sentinel 2A13 June 201710 m
Sentinel 2A23 June 201710 m
Sentinel 2A3 July 201710 mESA
Sentinel 2A13 July 201710 m
Sentinel 2A2 August 201710 m
Sentinel 2A22 August 201710 m
Sentinel 2A11 September 201710 m
Table 2. Soil fertility parameters for rice.
Analytical FactorUnitsFactor Score
1.00.80.50.2
Nppm>20001000–2000<1000-
Pppm>2510–25<10-
Kppm>6030–60<30-
Organic matterg/100 g>21–20.5–1<0.5
Znmg/kg>0.70.5–0.7<0.5
Table 3. Physical properties parameters for rice.
TypeAnalytical FactorUnitsFactor Score
1.00.80.50.2
Drainage (R) PoorModerately poorGoodVery Poor
Texture (T) CL, SiCL, SiL, C, SCL, SCL, SICSi, SL, FSLC, S, LS
Depth (D) cm>5025–5015–25<15
Topography (F)SlopeSlope0–2%2–4%4–6%>6%
Surface stoniess (Y)>2 mm>2 mm<2020–3535–55>55
Hard pan (P) cm>9090–5050–20<20
Hydraulic conductivity (G) cm h−1<0.50.5–22–6.25>6.25
CL = Clay loam, SiCL = Silty clay loam, SiL = Silty loam, C = Clay, SC = Sandy clay, L = Loam, SCL = Sandy clay loam, SIC = Silty clay, Si = Silty, SL = Sandy loam, FSL = Fine sand loam, C = Clay, S = Sand and LS = Loamy sand.
Table 4. Chemical properties parameters for rice.
TypeAnalytical FactorUnitsFactor Score
1 0.8 0.5 0.2
Salinity hazard (S) dS/m0–3.13.2–44.1–5>5.1
ESP %1010–2020–30>30
CaCO3 (K) %0–55–1515–20>20
Soil reaction (H)pH-5.5–7.37.4–7.87.9–8.4>8.4
Table 5. The Soil fertility quality classes in the study area.
FQIScoreArea (km2)Area (%)
High quality>0.900
Moderate quality0.9–0.7183872.28
Low quality0.7–0.541116.16
Very low quality<0.529411.56
Table 6. Soil chemical quality index in the study area.
CQIScoreArea (km2)Area (%)
High quality>0.995937.71
Moderate quality0.9–0.7762.99
Low quality0.7–0.560323.71
Very low quality<0.590535.59
Table 7. Soil physical quality (PQI) classes in the study area.
PQIScoreArea (km2)Area (%)
High quality>0.75102240.19
Moderate quality0.75–0.50122748.25
Low quality0.50–0.2529411.56
Very low quality<0.2500
Table 8. RNDVI classes in the study area.
RNDVIArea (km2)Area (%)
High95937.71
Moderate26810.54
Low102240.19
Very low29411.56
Table 9. Land suitability evaluation of rice crops in the study area.
SuitabilitySuitability ClassIndex ValueArea (km2)Area (%)
High S11–0.8113044.44
Moderately S20.8–0.6111944.00
Marginally S30.6–0.400.00
UnsuitableN<0.429411.56
Table 10. Correlation coefficient (R2) between the suitability models and Yield production.
Model TypeR2
Proposed 0.92
MicroLES0.87
Storie0.86
ALES0.84
Root0.84
Table 11. Land suitability classes, values according to the proposed model and rice yield prediction.
Physiographic UnitsClassSuitability ValueYield (tons/hectare)
High sand sheetsN0.393.96
Low sand sheetsN0.394.36
Low clay flatS20.605.98
Moderate clay flatS20.687.34
High clay flatsS20.707.62
Moderate basinsS20.707.87
Low basinsS20.728.19
Low recent river terracesS20.798.75
High recent river terracesS10.829.68
High basinsS10.8210.65
Moderate recent river terracesS10.8310.98
River leveesS10.8311.12
Publisher’s Note: MDPI stays neutral with regard to jurisdictional claims in published maps and institutional affiliations.

