Article

Analyzing Waste Management System Alternatives for Kabul City, Afghanistan: Considering Social, Environmental, and Economic Aspects

by
Ahmad Nadim Azimi
*,
Sébastien M. R. Dente
and
Seiji Hashimoto
Graduate School of Science and Engineering, Ritsumeikan University, Kusatsu 525-8577, Japan
*
Author to whom correspondence should be addressed.
Sustainability 2020, 12(23), 9872; https://0-doi-org.brum.beds.ac.uk/10.3390/su12239872
Submission received: 11 October 2020 / Revised: 13 November 2020 / Accepted: 18 November 2020 / Published: 25 November 2020

Abstract

:
Our earlier work identified social issues of stakeholders who are highly exposed to poor social performance in the current waste management system (WMS) of Kabul city, Afghanistan. The present work builds on earlier findings to elaborate four alternative scenarios with better social outcomes. For each scenario of the current system, greenhouse gas (GHG) and economic assessments were conducted. Results show that Scenario 2, considering increase waste collection coverage, recycling, unsanitary landfilling, and integration of informal workers, was found as the best alternative. Scenario 3, which added a source-separated system to Scenario 2, was the second-best alternative. These two scenarios address social issues and can reduce GHG emissions, save costs, and provide more jobs than the current system. In contrast, the absence of recycling in Scenario 1, and the conversion of unsanitary landfill into sanitary landfill in scenario 4 result in higher costs and GHG emissions, even though they deal with social issues and generate higher jobs to the existing waste management practice.

1. Introduction

Waste management system (WMS) is a crucially important subject that presents challenges for small and large cities in developing countries [1]. The most common practices of a WMS in such countries include open dumping, open burning [2], and unsanitary landfilling as practiced in India, Indonesia, and Pakistan [3]. Although waste management officials in low-income and middle-income countries have sought to collect all waste from cities and treat it appropriately to provide a clean and healthy environment to local residents, they have failed to meet this goal. A possible reason is that they emphasize economic solutions, with some attention to the environment, while ignoring social dimensions [4]. WMS is a multidisciplinary function [5], and it requires social considerations. If such considerations are lacking, there is little possibility of establishing successful waste handling methods [6]. For example, the implementation of 3R (reduce, reuse, and recycle) programs for waste management is quite difficult without public awareness and participation. World Bank reported that, although developing countries allocate 20–80% of their municipal budgets for WMS, and although the greater portion of that (80–90%) has been spent on waste collection, such systems are only able to collect 30–60% of waste. By contrast, through public participation, developed countries can provide this service to all local residents using less than 10% of the public budget [2], and this represents the utmost importance of a social pillar in the waste sector. Marshall and Farahbakhsh [7] reported six elements as influential factors for improving a WMS. These include public health, public awareness, and environmental movements on public and political agendas, in addition to resource scarcity, waste value, and climate change. The first two concern social issues. Social acceptability by local residents and relevant organizations is a key factor affecting waste management [8]. Together with tackling the social issues described earlier—which are mainly related to the stakeholders, such as households (which receive waste management services) and the ones not using but being affected (e.g., the local community)—it is also paramount to address the themes for those engaging in waste management activities and/or providing waste services. In other words, unsafe working conditions, child labor, discrimination, social stigma, long working hours, exploitation, school absence, and health and safety are prevalent topics that have been observed in these groups, especially for informal workers. Informal workers include scavengers, waste pickers, itinerant buyers, and small-scale and large-scale waste dealers [9]. As seen in some Arab and Latin American countries, local residents treat waste workers as hierarchically lower social groups because waste management activities are regarded as dirty jobs and as social taboo [10]. Therefore, to address social issues affecting the waste sector, some countries such as the UK and Canada have solicited local residents’ opinions on how to manage waste. The results were then incorporated into waste management schemes [11]. For Thailand, social issues have been resolved through public consultation and interactions with local experts [12]. Regarding increasing social acceptability and the mitigation of social obstacles for the development of waste management facilities, Rahardyan et al. [13] emphasized the importance of dialogue with the local community and inclusion of their perspectives in the planning stage. Moreover, raising public awareness was emphasized to reduce the issue of public opposition against the implementation of waste management plans and to encourage 3R policy, boost willingness to pay, and avoid open dumps [14,15]. Low awareness might affect the best waste management schemes [16]. Raising awareness improves social issues associated with the working conditions of waste workers [17]. It is mainly informal workers that are the most vulnerable groups in this domain. Some countries such as India, Peru, Brazil, and Colombia have integrated informal workers into formalized systems for improving their social issues [18]. Meanwhile, several reports have also described that organizing and training informal workers can boost their task productivity [19] and ensure better socioeconomic conditions [20].
Similarly to other cities in developing countries, Kabul, the capital and largest city of Afghanistan, is unable to provide an effective waste collection service, as waste services can only be delivered to 52.5% of residents. That outcome is largely attributable to the ignorance of social issues [4]. The government spends more than 90% of the waste management budget, which makes up a greater portion of the municipal budget. In fact, out of 2527 tons of waste generated during each day, they are able to collect 1314 tons of waste. For an earlier study, the authors conducted research to identify and assess the social issues of waste management on involved stakeholders using the social life cycle assessment (S-LCA) methodology [4]. Results revealed 8 stakeholders, 20 social impact categories, and 90 inventory indicators. Stakeholders comprise consumers (or household waste generators), scavengers, recycling shops, managers and workers of public organizations and formal private recycling facilities, in addition to the local community (people living near waste recycling facilities). Regarding social impacts, the waste management quality in consumer groups, waste management planning, and local employment in the local community, coupled with feedback mechanisms and education and training, which are common in both, were discovered to have poor social performance. The following were indicated as being social issues with low performance: education and training; job satisfaction among scavengers; child labor, both for scavengers and recycling shops; and the health and safety related to scavengers, recycling shops, and public and private recycling facility workers. Finally, working hours, end of life responsibility, and stakeholder relationships among scavengers, recycling shops, and managers and workers of public and private sectors were rated as bad in terms of social performance. Thus, the objectives of the present work are to address the main social issues that are associated with stakeholders being poor in terms of social performance and that are significant to the waste management sector, and to improve the overall WMS in Kabul city. Four main social issues are selected: waste management quality in consumer and local community groups, child labor, working hours, and stakeholder relationships at scavenger and recycling shops. Consequently, to address these issues and to enhance WMS, four alternative scenarios to the existing system are modeled and analyzed. Environmental and economic assessments of these scenarios are conducted using a life cycle assessment of greenhouse gas emissions and life cycle costing techniques, respectively, to identify and select scenarios that can be environmentally, socially, and economically acceptable.

2. Materials and Methods

2.1. Descriptions of Scenarios

The following are descriptions of four potential alternative scenarios and the current WMS in Kabul city (Table 1).
Baseline scenario (S-0): This scenario corresponds to the existing WMS. In this scenario, waste collection, transport, and unsanitary landfilling are the primary processes of the system, along with minor adjunct activities related to waste recycling. Approximately 52.5% of household wastes (HWs) are collected and landfilled in a mixed way at the unsanitary disposal site [21]. In addition, 4.6% are recovered mainly by the informal sector (scavengers and recycling shops); the remainder (42.9%) is left uncollected. Recycled materials comprise organic waste (3.7%) and dry recyclable materials (0.9%) (i.e., plastic, paper, glass, and metal). Organic waste is used for animal feed, whereas dry recyclables are sent to material recovery facilities (MRFs), and in turn to recycling processes. Efficiencies of 95% and 80% are assumed, respectively, for MRFs and recycling facilities. High efficiency at MRFs is attributable to the dry recyclable separation by scavengers and then by recycling shops before being sent for recycling treatment. Residues from recycling treatment (0.21%) assumed as inert materials are sent to the unsanitary landfill site. Uncollected waste (42.9%) was assumed to be openly dumped.
Regarding the social issue of waste management quality, consumers reported that they are affected by inadequate waste collection services, whereas local communities have suffered from the awful activities of recycling facilities. Work performed by children, as observed in scavengers and recycling shops, originates in informal working conditions, where no policy enforcement exists against child labor. Children mainly collect recyclables from households and collection points or are engaged in sorting and handling the recyclable materials at recycling shops. Waste-related activities have affected child school attendance. Moreover, the length of working hours for informal workers has become a very serious issue because they work from early morning through the evening, 12 h per day, or sometimes more, which is illegal. Working hours should be limited to 8 h per day, in accord with national regulations. Furthermore, they operate sometimes on national holidays and during religious festivals. Their living and working conditions are similar. Relationships of informal workers (recyclers) with public entities and residents have been reported as very bad. Informal recyclers complain about being verbally harassed, and less often physically harassed, by government officers. They also assert that households are not so cooperative in terms of yielding their recyclable materials. They have been accused by local officials of leaving litter and waste in streets and drains. Moreover, they have been accused of criminal activities by local residents and public officials.
Scenario 1 (S-1): S-1 assumes a 100% mixed HW collection coverage, which improves the issue of waste management quality for consumers. Furthermore, our previous research revealed the recycling facilities currently located within the city presented poor social performance in term of waste management quality and caused nuisance to the local community. Scenario 1 does not consider recycling activities. All waste is deposited in the current unsanitary landfill, where it is far from residential areas and where it creates no social impacts. In relation to child labor, working hours, and stakeholder relationships, the integration of the informal sector into formalized and legalized systems is assumed. This scenario integrates informal workers in mixed HW collection and landfilling processes.
Scenario 2 (S-2): Compared with S-1, this scenario assumes the addition of the recycling treatment of dry recyclables at the MRF/recycling facility. For the improvement of the quality of life of the local community, a nearby landfill site was selected as the facility location. For this scenario, it was assumed that waste is collected as a mixed way and sent to an MRF, where dry recyclables are separated with an efficiency of 70%. Then, waste is sent for recycling at an efficiency of 70%. Since the share of recyclable materials is 18% as shown in Figure 1, the recyclables amount to 8.82% (18% × 70% × 70%).The amount of waste deposited at the unsanitary landfill is 91.18% and corresponds to the sum of non-recyclable materials (82%), unsorted recyclables (5.4%) and recycling process residues (3.78%), the latter being treated as inert materials. In S-2, the integration of informal workers, other than those of S-1, is also considered to occur at the MRF.
Scenario 3 (S-3): Compared with S-2, this scenario was assumed as a source-separated system of HW of dry recyclable materials with an efficiency of 50%. After collection, these materials are sent for recycling treatment, where efficiencies of the MRF and the recycling process are considered respectively as 84% and 92%. Furthermore, the rest waste (91%) and residues (2%) are landfilled. In S-2, the integration of informal workers other than those described in S-2 is also considered for the collection and transport of source-separated wastes from the households to the MRF.
Scenario 4 (S-4): The only difference between S-3 and this scenario is conversion of the unsanitary landfill into a sanitary one.

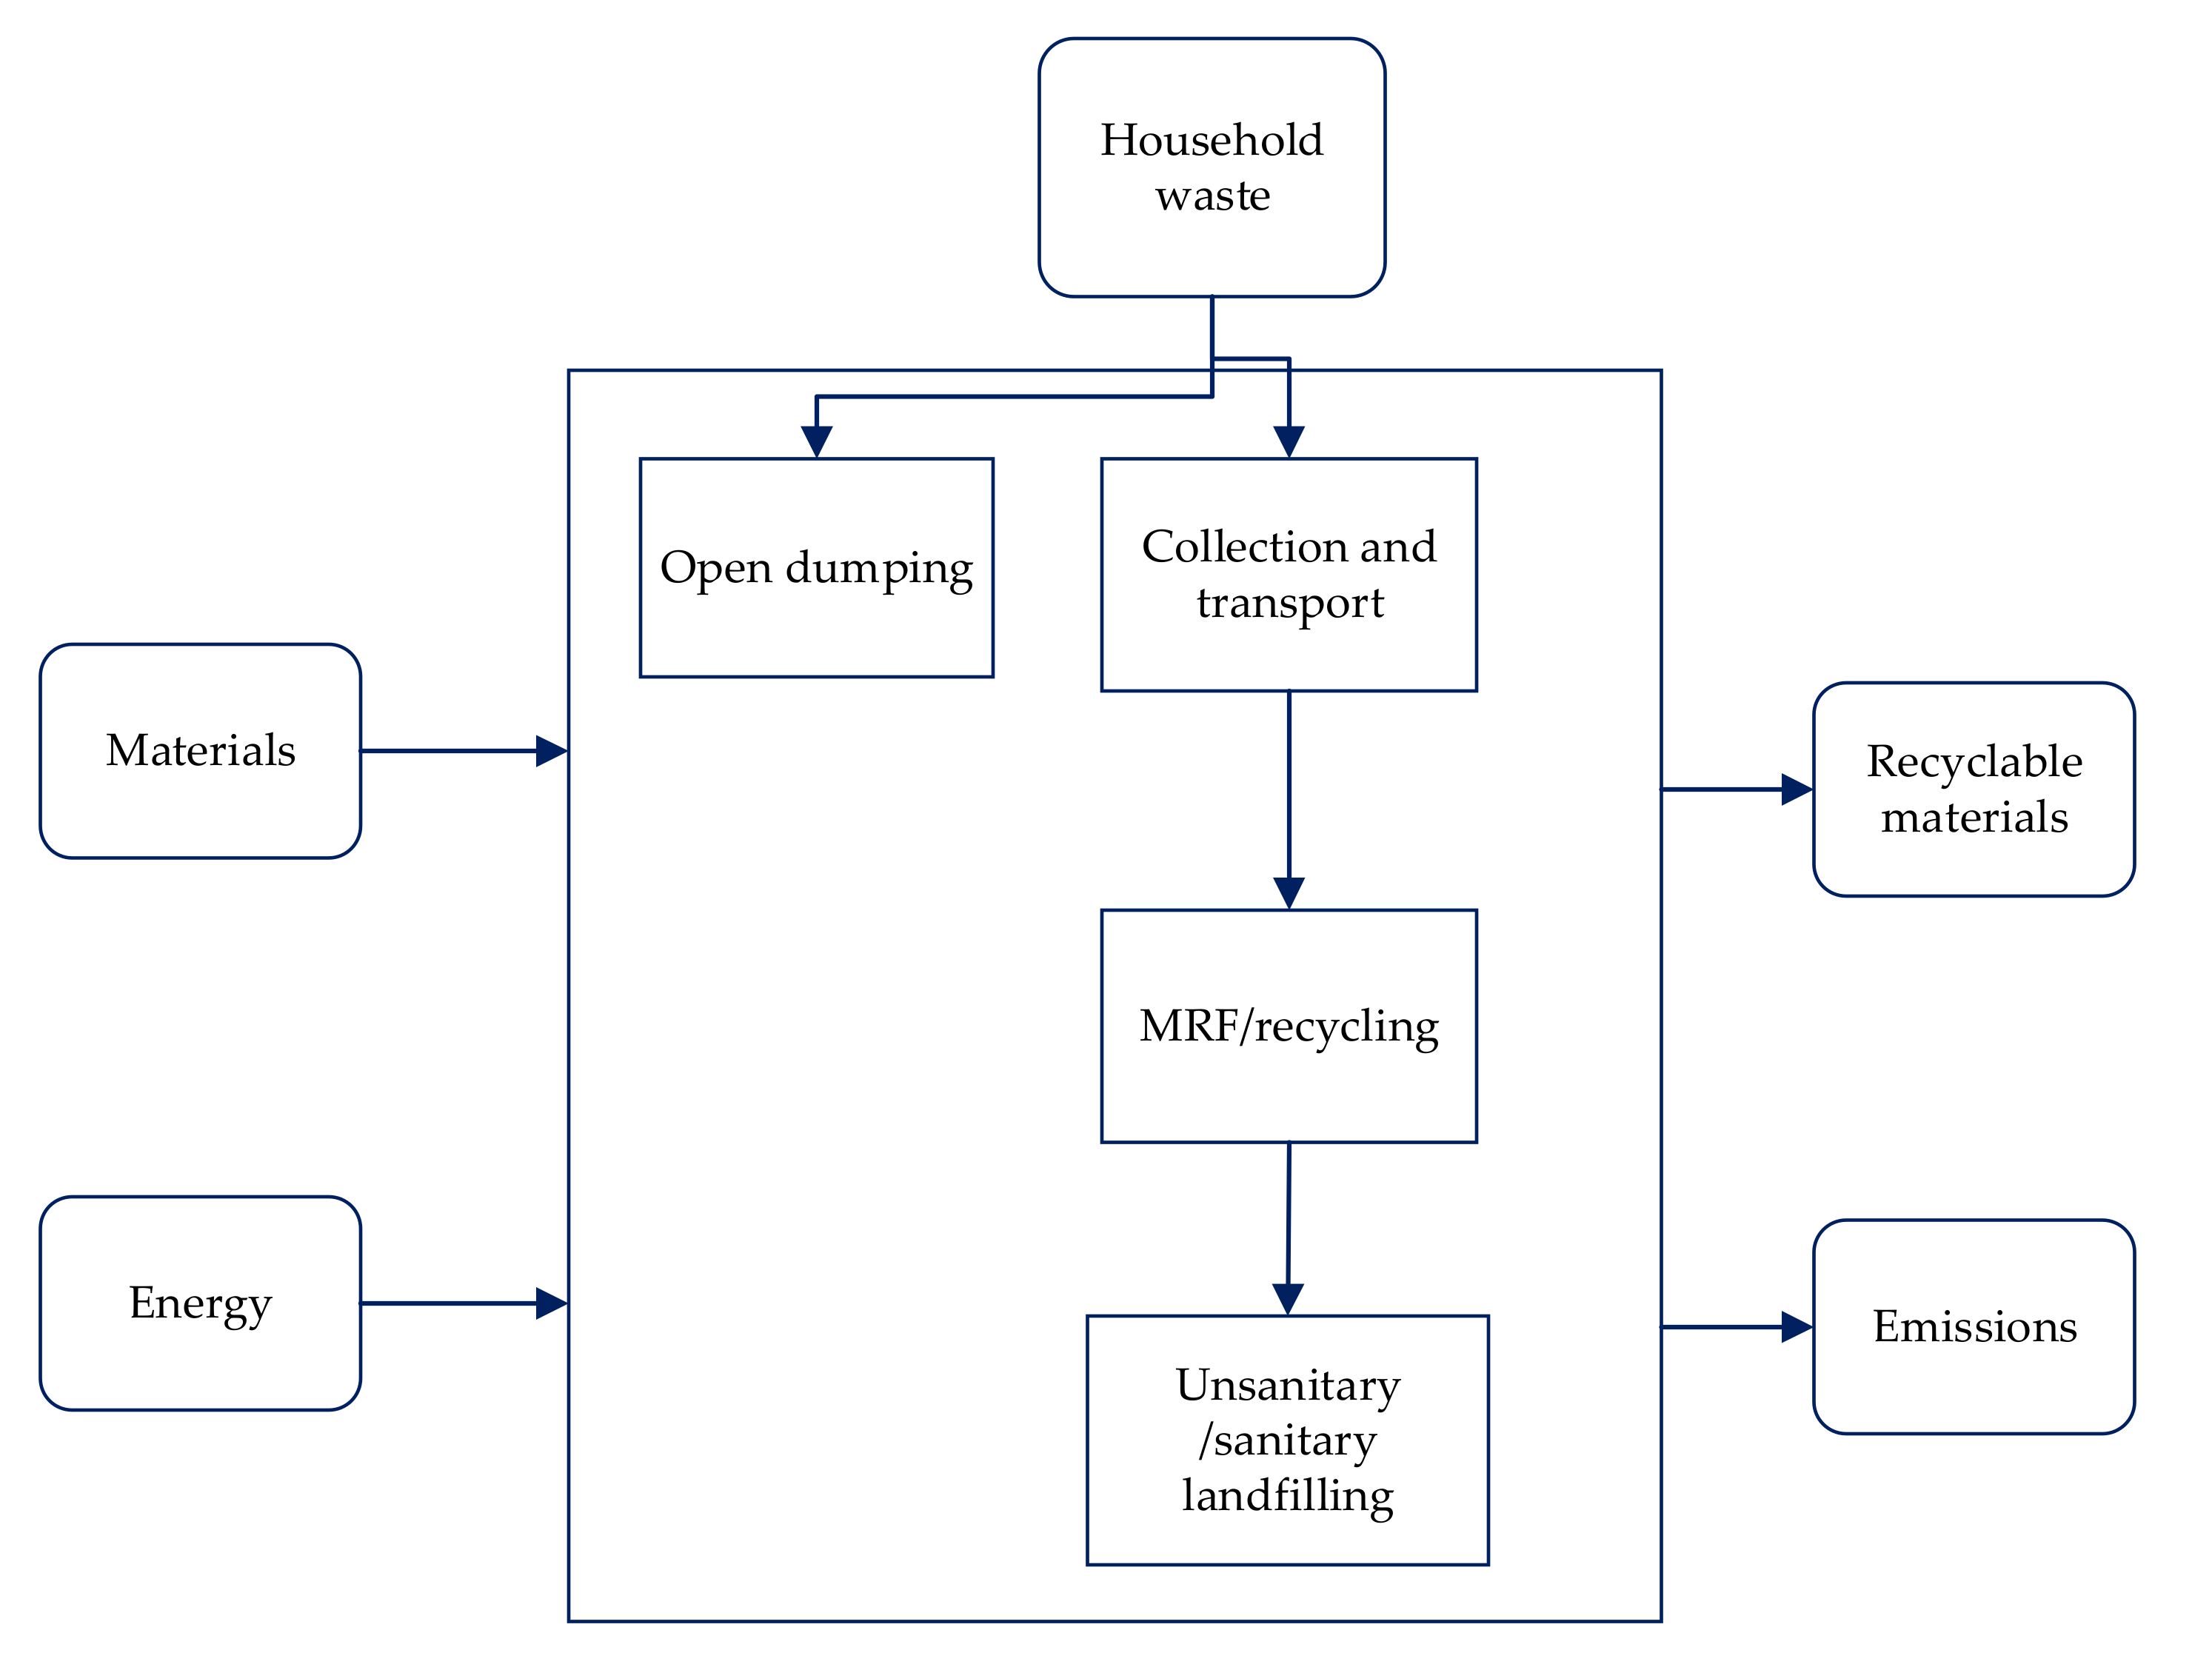
2.2. System Boundary and Functional Unit (FU)

The system boundary of the study comprises the collection and transport of HW through MRFs/recycling to its final disposal, as shown in Figure 2. The HW, energy, and materials are inputs, whereas emissions to air and residues from recycling and the avoided and secondary materials are outputs. This study took both direct and indirect emissions into account. Direct emissions are associated with different waste management stages such as collection and transport, recycling, and landfilling. Indirect emissions are related to the production of fuel and electricity allocated for these processes. The avoided emissions from the recycling of materials were also incorporated in the calculation of GHG by application of the principle of system expansion. Releases from capital equipment and infrastructure were excluded. The reason for this is, on one hand, their emissions are smaller than the emissions produced during operations and the waste itself. On the other hand, they can be recycled when considered out of use [23]. Biogenic CO2 release was assumed as carbon neutral. Therefore, it was not incorporated into inventory analyses. Regarding cost analysis, costs are borne because of the purchase of waste collection trucks and their maintenance, as well as the consumption of electricity and diesel fuel. Labor costs correspond to the formalization of informal workers and include costs related to salary, training, equipment, and protective clothing. Furthermore, revenues from secondary materials were covered. The functional unit of the study is the total HW generated per day in Kabul city.

2.3. Greenhouse Gas Emissions and Cost Analysis

Inventory data for this study were obtained from survey observations, interviews with officials, the relevant literature, IDEA database [24], and calculations.

2.3.1. Collection

Waste collection and transport is the greatest challenge for the local government of Kabul city. The Department of Sanitation (DoS) is the only office in the Kabul municipality providing waste collection services. This service, in fact, has been conducted for community waste collection points, where households dispose of their wastes in a mixed way. According to local bodies, most of the 6000 waste collection points [21] have bins of 1 and 7 m3, although some have no waste containers. The total number of waste collection trucks is 374 [21], with capacities of 4, 5, 7, and 26 m3. The system for loading waste onto trucks is manual, i.e., assigned to 4–6 workers on each truck for this process, depending on the truck size [21]. Of the 3752 DoS staff members [21], 2415 provide waste collection services; around 1301 have been assigned to sweeping the streets, according to officials.
On average, diesel consumption on waste collection is 8048 L/day (or 6.12 L/ton); this amount was estimated as 15,477 L/day in S-1 and S-2, whereas in S-3 and S-4 a total of 14,848 L/day was obtained. It is necessary to add 101 trucks with a capacity of 12 ton each to the existing waste collection fleet for S-1 and S-2; the numbers for S-3 and S-4 should be 102, including one 4-ton capacity truck. Because the collection trucks (also the added ones) are regarded as a secondhand type fleet, the Euro 2 standard in assuming a lifetime of 100-year global warming potential (GWP) was adopted for calculating GHG emissions (Tables S1–S5). The estimation of the numbers of informal workers to be formalized in waste collection in S-1 and S-2 is 2206, although this number reaches 2919 in S-3 and S-4.
It is noteworthy that all cost calculations made of increasing levels of waste collection coverage including integration of the informal sector have been conducted, in the subsection of Section 2 in Supplementary Materials.

2.3.2. Recycling/MRFs

As described earlier, both mixed and source-separated dry recyclables of HW are collected and transported to an MRF. For S-0, when dry recyclables are collected and transported to recycling facilities, all recycling processes are done by private recycling facilities. In contrast, for alternative scenarios, the integration of informal workers into MRFs for these processes is assumed. Calculations show that the numbers of informal workers to be integrated at an MRF in S-2 is 494, and 47 for S-3 and S-4. The unit values of electricity and diesel used for recycling operations are 3.2 kWh and 3.3 L per ton of waste [25]. Four waste streams were considered as recycling streams at MRF: paper, plastic, glass, and metals. Calculations of the indirect environmental burdens concerning the use of electricity and diesel during the recycling treatment and the avoided emissions from recycled materials were based on the Inventory Database for Environmental Analysis (IDEA) database of the MiLCA software. MiLCA is an LCA software package able to conduct an inventory analysis and impact assessment of a product or process from cradle to grave. The Inventory Database for Environmental Analysis, or IDEA, is an inventory database for the software. The database was developed by the National Institute of Advanced Industrial Science and Technology (AIST) and the Japan Environmental Management Association for Industry (JEMAI). It incorporates 3000 datasets [26]. Characterization factors are calculated according to the Intergovernmental Panel on Climate Change (IPCC) model 2007 for a 100-year time horizon.
Cost calculations for recycling treatments on alternatives, including the integration of informal workers and the cost of revenues from the sales of avoided materials, were conducted and are given in the supplementary materials.
Table 2 Shows the efficiencies of the separation, sorting, and recycling of waste in mixed and source-separated systems.

2.3.3. Landfilling

Waste treatment through landfilling can produce considerable amounts of greenhouse gas emissions. Major components of GHG from dumping and landfilling of waste are CH4 and CO2 [29]. Because CO2 is of biogenic origin, only CH4 emissions were considered and estimated. To estimate CH4 emissions, we used the default method (tier 1) of the IPPC model for a 100-year time horizon. The selection of this model is attributable to lack of data. This model is based on a mass balance approach for which waste generation and compositions are assumed as constant. The equation for calculating CH4 emissions is as follows:
CH4 = (HWDS × MCF × DOC × DOCF × F × 16/12 − R) (1 − OX)
where HWDS represents the fraction of household waste at disposal sites; MCF stands for the methane correction factor; DOC denotes the degradable organic carbon fraction; DOCF expresses the fraction of degradable organic carbon that is ultimately degraded and released. F signifies the fraction of CH4 in landfill gas by volume. R denotes the recovered CH4. In addition, 16/12 is the molecular weight ratio of CH4/C. Finally, OX is the oxidation factor. Default values for these parameters with respect to the calculation of CH4 released from open dumps are 0.4, 0.77, 0, and 50%, respectively, for MCF, DOCF, OX, and F.
In addition, considering the default methodology for unsanitary and sanitary landfills, their MCFs were selected respectively as 0.6 and 1. The current unsanitary landfill system of Kabul city is similar to the uncategorized management approach, which is neither a managed nor unmanaged disposal method based on IPCC report standards. At the landfill site, no gas recovery of CH4 emissions is assumed.
The unit value of diesel consumption during unsanitary landfill processes is 0.35 L/ton according to officials, whereas that for the sanitary landfill is regarded as 3 L/ton [30]. The number of workers at the landfill site in Kabul city is 36. They treat 1332 tons of waste per day, meaning that one worker can manage 37 tons of waste per day using unsanitary landfilling processes. Based on this quantity, the total number of workers at unsanitary landfill alternatives was calculated. Sanitary landfill is considered to have less than 10 times than the numbers integrated at the MRF [31]. The number of workers to be integrated at the MRF was calculated as 494 (Table S24). Therefore, 33, 26, 27, and 13 of the informal workers are expected to formalize, respectively, in S-1, S-2, S-3, and S-4 to landfill wastes. The unit cost of unsanitary landfilling is $1.6/ton according to officials, although it is augmented to $10/ton for sanitary landfilling processes [32].

3. Results and Discussion

3.1. GHG Emissions

Figure 3 presents results of the scenarios and processes contributing to total GHG emissions. For S-0, the baseline scenario, the release of 2.06 × 10⁶ kg CO2eq per day to the atmosphere was found, which can contribute to the environmental burden of global warming potential (GWP). Release of CH4 gas is the main factor underlying high GHG emissions. Gas generation is attributable to the degradation of organic waste (74% of Kabul city waste is organic) at disposal sites, unsanitary landfills, and open dumps. The current landfill site, which can be categorized as an unsanitary disposal site, has no landfill gas recovery (LFG) system. The generated CH4 gas might be useful as an energy source while dramatically reducing emissions that engender global warming. No such system has been installed or applied, mainly because of a lack of technical expertise of the DoS. Local and foreign companies have shown no interest in investing in this domain. Results from S-0 also indicate that the emissions associated with waste collection (2.17 × 10⁴ kg/day) and recycling treatment (2.33 × 10² kg CO2eq per day) compared with disposal (2.07 × 10⁶ kg CO2eq/day) are very small. Because waste recycling is done on such a small scale, it avoids −3.64 × 10⁴ kg CO2eq/day of emissions. Therefore, it does not contribute so much to the enhancement of global warming effects for the current WMS.
For S-1, the release of a greater amount (26%) of GHG than S-0 was indicated. The disposal of waste in an unsanitary landfill, which emits more CH4 than open dumps and which excludes recycling activities, constitutes two reasons for this scenario having emissions of 2.59 × 10⁶ kg CO2eq/day. Disposal might not be used as an alternative based on the global warming effect. Additionally, waste collection contributes only a small fraction (4.12 × 10⁴ kg CO2eq/day) to the total release.
For S-2, the findings demonstrated it as the best alternative (1.49 × 10⁶ kg CO2eq/day). It can mitigate 28% of GHG associated with S-0. Recycling a larger portion of recyclable materials than other alternatives, which results in the avoidance of waste to be landfilled, is the main reason it represents the most favorable case, even though it uses greater amounts of diesel and electricity. The emissions from diesel and electricity consumption (2.73 × 10⁴ kg CO2eq/day) are miniscule compared to the emissions (−4.70 × 10⁵ kg CO2eq/day) avoided in the scenario.
Regarding S-3, it yielded the second-best choice (1.78 × 10⁶ kg CO2eq/day) after S-2 based on global warming indicator. This scenario can mitigate 13% of GHG emissions of the existing WMS. Furthermore, the source-separation system in S-3 led to lower emissions on collection (3.95 × 10⁴ kg CO2/day) and recycling (2.45 × 10³ kg CO2eq/day), using less diesel and electricity. Nevertheless, because the level of source separation is insufficient and because more materials are landfilled than S-2, it cannot diminish more GHG (−3.71 × 10⁵ kg CO2eq/day) than the current system, as S-2 can. Although increasing the scale of source separation will assist directly in GHG reduction, such practices are difficult to implement in the short term because the environmental awareness of people is insufficient. Furthermore, public opposition against this program in some places as a result of cultural conflicts and low active participation in waste source separation are other high probable obstacles to be expected. Similarly, security problems exist in some areas, where it might be impossible to launch this initiative.
Actually, S-4, which is the same as S-3 in terms of collection and recycling, and which emits similar GHG emissions, uses a sanitary landfill (3.58 × 10⁶ kg CO2eq/day), which has come to be the largest GHG emitter of 3.26 × 10⁶ kg CO2eq/day, in that the value is 58% higher than that in S-0. Consequently, it is inappropriate that S-4 be recommended in favor of the current system, similarly to S-1. In a sanitary landfill, waste undergoes anaerobic degradation, which releases great amounts of landfill gases to the atmosphere. In open dumps and unsanitary landfills, aerobic decomposition occurs. This type of decomposition decreases the effects of global warming to some degree. If there were an LFG recovery system, then S-4 could be presented as the best alternative according to the global warming indicator.
The overall results imply that open dumping as well as unsanitary and sanitary landfilling have the greatest effects on global warming by generating 677, 1009.7, and 1558.97 kg CO2eq emissions per ton of waste, respectively, whereas recycling (10.79 kg CO2eq/ton) and collection (16 kg CO2eq/ton) are poor emitters. Similar findings obtained for open dumps of Lahore, Pakistan, show a result of 625 kg CO2eq/ton [33]. A case in Dhanbad, India, shows lower emissions of 361.7 kg CO2eq/ton [3], which is attributable to the smaller organic fraction in waste compositions and some incineration activities. Additionally, a study conducted of Bangalore, India showed that sanitary landfill generates 1491.7 kg CO2eq emissions [30], something which is close to the present study results. By recycling waste, large emissions (2108 CO2eq/ton) to the atmosphere can be avoided, which can enable humans to mitigate global warming effects considerably.

3.2. WMS Cost

Figure 4 presents results of economic assessments of existing and alternative scenarios. Results indicate that the DoS spends 91.4% ($2.27 × 10⁴/day) of its funds on waste collection. The remainder is used for disposal ($2.24 × 10³/day), although no budget allocation exists with respect to recycling or other types of technological waste treatments. Furthermore, waste management officials, instead of supporting and encouraging informal recyclers, have reported difficulties for recycling activities, which somehow affects the productivity of their operations, according to informal workers. Economic incentives are the primary argument for informal workers to be engaged in waste recycling.
Results of S-1 indicate that an increase of 38% in the costs of the current WMS is necessary to boost the level of coverage to all local residents. Salary was selected as a crucially important parameter influencing total costs, in the integration of informal as formalized workers. Furthermore because it was designed in accordance with the market price of daily workers in Kabul: $3.4/day, which is lower than a formal public worker, who would receive $4.7/day. Therefore, a smaller percentage of the increase in costs was obtained from the time when the level of coverage was boosted to 100%. Results show that a major portion ($3.04 × 10⁴/day) of these funds will be used for collection. In fact, only a minor portion ($4.04 × 10³/day) is expected to be used for landfill disposal. Because the cost of landfilling in Kabul is low ($1.6/ton), it does not contribute much to total costs.
Regarding S-2, the findings reveal it to be the most cost-effective scenario ($7.79 × 10³/day) among all alternatives, including the current system. Along with delivering waste services to all local residents, this scenario shows reduced costs of 68.7% compared to the current waste management system. Higher revenues from recycled products than other alternatives are the main factor in this respect. Those revenues ($3.33 × 10⁴/day) make up 44.8% of the total expenditures in S-2. Costs related to collection ($3.04 × 10⁴/day) constitute the second greatest contributor to this scenario (40.8%). It is noteworthy that S-2 necessitates a larger amount of energy in recycling operations than the other alternatives, S-3 and S-4, which in fact led to a cost of $7.03 × 10³/day. Disposal gives the lowest contribution to the total costs.
S-3 after S-2 was found as the most favorable option with respect to economic assessment ($1.08 × 10⁴/day). This scenario can diminish 56.72% of the expenditures in S-0. Regarding revenues ($2.63 × 10⁴/day) from recycled products, they constitute 41.49% of the costs of this scenario, whereas collection ($3.27 × 10⁴/day), which includes the largest portion, is 51.55%. Because of source separation, little fuel and electricity consumption occurs at the recycling facility, which renders costs ($6.43 × 10²/day) lower than recycling in S-2. However, the cost of a source-separated system must be lower than the mixed collection system according to expectations, assuming 50% of source separation, which makes it less effective and efficient, as well as hiring more workers for the collection of recyclables at household levels, are the primary justifications for higher cost increases in collection.
Actually, S-4 is the same as S-3 in terms of collection and recycling costs. It also generates similar revenues, but considering there is sanitary landfill ($2.35 × 10⁴/day), S-4 is in fact a less favorable alternative, with enhanced costs of 22.6% compared with S-0.
The results presented above demonstrate that costs for waste collection, which are $12/ton, are in line with those presented in a World Bank report revealing that low-income countries spend $10–30/ton in waste collection [34]. Furthermore, the integration of informal workers dramatically reduces the costs borne for waste collection; in fact, corruption, labor-intensive, low efficiency, and high fuel consumption are the institutional challenges that should be addressed to avoid further costs. Results also show that costs of mixed waste recycling ($31.5/ton) are lower than those of Lahore, Pakistan, ($34/ton), whereas Kathmandu, Nepal are $28/ton [33]. Results show that source-separated systems can reduce recycling costs (to $3/ton). These lower costs are associated with the use of less energy and labor and with high-efficiency operations. Furthermore, revenues from sales of recycling materials were obtained as $150/ton; they were reported as $180 for Lahore, $106 for Conakry, and $66 for the case of Kathmandu per ton of recycled products [33].

3.3. Job Creation

In total, 2439 workers are involved in waste management office of Kabul multiplicity. They only collect and landfill the waste, giving no contribution to waste recycling. Waste recycling is practiced fundamentally by informal workers on a small scale, accounting for a number of jobs. Those who are poor, unemployed, low-skilled, and marginalized have been operating in this sector. According to the results, 1992 people of these groups are currently engaged in waste recycling informally, comprising 187 people who are engaged in the collection of organic waste, 1748 engaged in the collection of dry recyclables, and 57 for sorting, storing, and dealing with scavengers and MRFs in the recycling shops. Their efficiency is extremely low. Sometimes they cannot even collect waste materials during a scheduled day, especially those collecting dry recyclables. On average, 1 ton of organic waste is collected by two informal workers every day. In the case of dry recyclables, 77 employees are allocated for collection; about 2.5 are involved in recycling shop activities.
Results of the formalization of informal workers in S-1 indicate the creation of 2240 jobs, covering collection (2206) and disposal (33) processes. This result conveys the integration not only of all the informal waste workers; it also creates additional jobs in society. This scenario, compared with the alternatives, yields the lowest number of jobs to S-0. Regarding S-2, the result reached 2726, which is higher than S-1 because of MRF consideration, but the amount is lower than that of either S-3 or S-4. This scenario, which is similar to S-1, is based on collection. Therefore, the same number of people should be integrated into that, while those engaged in recycling and landfilling are 494 and 26, respectively. The S-3 option can provide the highest number (2993) of jobs among all scenarios. The reason is related to the incorporation of a source separation system. Source separation reduces the use of diesel during collection as well as the diesel and electricity at MRFs, while also boosting the efficiency of recycling with few workers, whereas mixed waste recycling calls for numerous workers. S-3 integrates 2919, 47, and 27 individuals respectively involved in the collection, recycling, and landfilling of wastes. S-4 is similar to S-3 in terms of collection and recycling but with different landfilling practices, consequently generating 2979 jobs, which is the second greatest number of jobs. In this scenario, selecting sanitary landfill puts S-4 in a ranking after S-3. The numbers of workers integrated in these scenarios are the same as S-3 in collection and recycling, whereas workers for landfilling are 13, which is lower than those for S-3.
Results reveal that waste collection activities yield the greatest number of jobs. Recycling and landfilling can be categorized respectively as second and third place in terms of job creation.
Figure 5 shows the number of jobs of informal workers in existing and alternative waste management scenarios.

3.4. Study Implications

In Kabul city, activities for enhancement of WMS remain forthcoming. In general, the primary task of WMS should be to address waste issues and to provide a healthy environment through appropriate services, but the Kabul city WMS has not only been unable to address them; it has created several more issues for local residents. Current practices of recycling facilities are a clear description for such a case.
Results of the present study can be a great tool to guide both local and national governments. They can be useful for regional countries and beyond, particularly in places whose socioeconomic conditions are similar. Results of this study suggest sustainable and practical approaches that Kabul municipality might apply to ensure a MWS, which is socially, environmentally, and economically plausible. While national government and decision-makers use for the development of sustainable waste management policies, including policy for integration of informal sector and waste recycling.
The present study addressed the main social issues with application of proper solutions. Improvement of issues of waste management quality, other than merely ensuring cleanliness and reducing health risks, can recover and establish good relationships between the public and the government, raise public awareness, boost cooperation and participation of people in the implementation of waste management policies, and develop a culture and behavior to produce responsible citizens who cooperate in keeping their environment clean and safe, which is highly necessary, helpful, and important in a WMS. Healthy and well-kept neighborhoods diminish negative health impacts and provide opportunities and environments amenable to companionship, recreation, and social learning [35,36]. Furthermore, a study undertaken in Accra, Ghana, showed that a poor WMS affected people’s attitude and behavior, causing people to dump their waste indiscriminately in open and unauthorized spots [37]. Results of the study revealed that the integration of informal workers into a formalized system, in addition to improving their current situations, brings further job opportunities for society overall. Some studies have indicated that formalization can lead to job losses [38,39]. A case study of Bangalore revealed that formalization can alleviate vulnerability to bribe-seeking officials, guarantee safe working conditions, boost productivity, and enhance socioeconomic conditions of informal workers by delivering waste services with an extremely low cost [40]. The city of Pune in India demonstrated that the formalization of informal sector led to the avoidance of 118,000 tons of waste sent to landfills in 2006. This diversion reduced transport costs by up to $316,455 [41].
Because this study rendered solid and grounded results of GHG emissions for the respective processes for current and alternative scenarios, these results can be expected to help officials to act accordingly. In other words, estimating the amount of CH4 can encourage the government and private enterprises to invest in the utilization of CH4 as an energy source. This will reduce environmental burdens. In fact, LFG recovery is a widely adopted and suitable method that has been considered by several developing countries in the region [3,30,42]. Another implication of the study is that it will make the Kabul multiplicity recognize the importance of recycling approaches from results obtained based on environmental and economic assessments, which has dramatically diminished GHG emissions and costs through recycling materials. Recycling of waste materials can make an important contribution by reducing environmental impacts and generating revenues in some developing countries [33,43]. Similarly, findings obtained for source-separated systems can be expected to encourage officials to launch this program and develop effective policies. Results show the degree to which effective policies can save energy and costs while producing higher job opportunities.

4. Conclusions

The study was conducted to eliminate the main social issues of current waste management in Kabul city and to improve the overall of the WMS. Therefore, four alternative scenarios to the current system were explored. They had the same combination of increased waste collection coverage but differ in the source-separated system, the integration of informal workers into a formal framework, boosting of waste recycling, and the sanitary and unsanitary landfilling processes. The increased levels of waste collection, the formalization of informal activities, and the selection of an appropriate location for recycling were the particular approaches used, which can be considered for addressing social themes. Material recycling avoids 2108 kg CO2eq environmental effects of GHGs and as also the cost of $150 per ton of waste. Source-separated waste, instead of processing mixed materials, can decrease emissions and costs, respectively, from 10.97 to 0.9 kgCO2 eq/ton and 31.5 to 3 ton/dollar. Results show that open dumping, unsanitary, and sanitary landfilling have greater effects on global warming by generating 677, 1009.7, and 1558.97 kg CO2eq emissions per ton of waste, respectively. Collection and the source-separated system provide the greatest number of jobs. Evaluations of the developed scenarios indicate that all the alternatives can address the considered social issues and provide a higher number of jobs than the current system, but for the reduction of GHG emissions and the costs, S-2 and S-3 were found to be sustainable and as best options, respectively, whereas S-1 and S-4 create further emissions and costs to the current system. Results show that S-2, with an increase in collection coverage, recycling, unsanitary landfilling, and integration of informal workers, can reduce 28% of GHGs, save 68.7% of the costs, and provide 37% more jobs than S-0, emitting 2.06 × 10⁶ kg CO2eq GHGs per day, spending $2.49 × 10⁴/day, and creating 1992 number jobs for informal workers. Recycling an amount of 223 tons of recyclable materials per day in this scenario, which is greater than other alternatives, is the key reason for those superior results. That scenario can avoid −4.70 × 10⁵ kg CO2eq emissions and $3.33 × 10⁴ per day. Results show that S-3, which added a source-separated system to Scenario 2, is the second-best alternative. It reduces 13% of GHGs, 56.72% of costs, and creates 50% more jobs than the baseline scenario. Although the source-separated system in S-3 leads to lower GHGs and costs in recycling processes, it was positioned as the second-best alternative because the level of effectiveness of the system is limited to 50%, which results in less materials (177 tons/day) to be recycled than in S-2. If the current challenges of source separation can be solved, which demands long-term planning, S-3 can then become the most favorable choice. For Scenarios 1 and 4, because each emits more GHGs and entails greater costs than the current system, they cannot compete as sustainable alternative options: S-1 generates 26% more GHGs and entails increased costs by 36%; S-4 generates 22.6% more GHGs, with 58% higher costs. It might be concluded that they are unfavorable options because S-1 does not include recycling processes and S-4 emphasizes sanitary landfill. Study results are expected to encourage the DoS to allocate some funds for improving social aspects, particularly public awareness, and for initiating interactions with residents while involving them in waste management planning and decision-making processes. Furthermore, future studies should better target environmental impact categories related to the WMS. It is also recommended to assess other waste treatment technologies based on a sustainability approach.

Supplementary Materials

The following are available online at https://0-www-mdpi-com.brum.beds.ac.uk/2071-1050/12/23/9872/s1, Table S1. Diesel consumption for collection of recyclables in S-0; Table S2: Diesel consumption for collection of residues in S-0; Table S3. Calculated fuel diesel consumption for collection and transport of source-separated waste recyclables from the center of city districts to recycling facilities in S-3; Figure S1: Locations of current recycling facilities and landfill sites in Kabul city; Figure S2: Routing map of collection and transport on source-separated waste from collection points/center of a district to landfill site; Table S4: Network analysis showing route distances generated from collection points/center of city districts of source-separated waste to landfill site; Table S7: Cost calculations of added trucks for mixed waste collection in S-1 and S-2; Table S8: Cost calculation of added trucks for mixed waste collection in S-3, Table S9: Cost calculation of added trucks for recyclables collection in S-3; Table S10: Salary costs for integrating informal workers in mixed waste collection in S-1 and S-2; Table S11. Salary cost for the integration of informal workers in mixed waste collection in S3 and S4; Table S12: Total number of households covered by a formalized workers for collection of source-separated waste; Table S13:Total number informal workers to be integrated in collection of sources separated waste from house to house; Table S14: Number of informal workers to be integrated in collection and transport of recyclables from district centers to MRF/ landfill site; Table S15: Total number of informal workers integrated as office workers in source-separated waste collection and transport; Table S16: Cost calculation of waste collection of S-1 and S-2 in WMS ($/year); Table S17: Cost calculation of waste collection of S-3 and S-4 WMS ($/year); Table S18: Percentage compositions of waste recyclables among the total amount (%) of recyclables; Table S19: Model designed for calculating parameters of recycling of waste in S0; Table S20. Model designed for calculating the parameters for recycling of waste in S2; Table S22: Averaging manual sorting efficiency at MRF for source-separated waste; Table S23: Estimation the GHG emissions of recycling waste treatment of different scenarios; Table S24: Salary cost for the integration of informal workers for recycling process at MRF in S-2; Table S25: Average amounts of sorting of source-separated materials at MRF (ton/day/person), Table S26: Total number of workers to be integrated for processes on source-separated waste at MRF; Table S27. Cost calculation of waste recycling treatment in S-2 of WMS ($/year); Table S28: Cost calculation of waste recycling treatment in S-3 and S-4 of WMS ($/year); Table S29: Annual revenue from the sale of recyclables in S-2; Table S30: Annual revenue from the sale of recyclables in S-3 and S-4; Table S31: Model designed for calculation of CH4 for the open dumping baseline scenario (S-0); Table S32.: Model designed for calculation of CH4 for unsanitary landfill of baseline scenario (S-0); Table S33. Model designed for calculation of CH4 emissions for unsanitary landfill of S-1; Table S34: Model designed for calculating CH4 emissions for unsanitary landfill of S-2; Table S35: Model designed for calculating CH4 emissions for unsanitary landfill of S-3; Table S36: Model designed for calculating CH4 emissions for unsanitary landfill of S-4; Table S37: Estimating GHG emissions at a landfill site under different scenarios; Table S38: Number of informal workers to be integrated at landfill site in different alternative scenarios (ton/day); Table S39. Cost calculation of waste landfilling in different scenarios of WMS ($/year); Table S40: Electricity grid mix of Kabul city.

Author Contributions

Conceptualization, all authors; methodology, all authors; software, S.H; validation, all authors; formal analysis, all authors; investigation, A.N.A.; resources, A.N.A. and S.H.; data curation, all authors; writing—Original draft preparation, A.N.A.; writing—Review and editing, all authors; visualization, all authors; supervision, S.H.; project administration, S.H.; funding acquisition S.H. All authors have read and agreed to the published version of the manuscript.

Funding

This research received no external funding.

Conflicts of Interest

The authors declare no conflict of interest.

References

  1. Abdel-Shafy, H.I.; Mansour, M.S.M. Solid waste issue: Sources, composition, disposal, recycling, and valorization. Egypt. J. Pet. 2018, 27, 1275–1290. [Google Scholar] [CrossRef]
  2. Kumar, S. Municipal Solid Waste Management in Developing Countries; CRC Press: Boca Raton, FL, USA, 2016. [Google Scholar]
  3. Yadav, P.; Samadder, S.R. Environmental impact assessment of municipal solid waste management options using life cycle assessment: A case study. Environ. Sci. Pollut. Res. 2018, 25, 838–854. [Google Scholar] [CrossRef] [PubMed]
  4. Azimi, A.N.; Dente, S.M.R.; Hashimoto, S. Social Life-Cycle Assessment of Household Waste Management System in Kabul City. Sustainability 2020, 12, 3217. [Google Scholar] [CrossRef] [Green Version]
  5. Di Nola, M.F.; Escapa, M.; Ansah, J.P. Modelling solid waste management solutions: The case of Campania, Italy. Waste Manag. 2018, 78, 717–729. [Google Scholar] [CrossRef] [PubMed]
  6. Gorgos, D. Social Impact and Input in Waste Management. 2009, p. 8. Available online: https://www.iswa.org/uploads/tx_iswaknowledgebase/9-363paper_long.pdf (accessed on 1 October 2020).
  7. Marshall, R.E.; Farahbakhsh, K. Systems approaches to integrated solid waste management in developing countries. Waste Manag. 2013, 33, 988–1003. [Google Scholar] [CrossRef]
  8. Finnveden, G.; Ekvall, T.; Arushanyan, Y.; Bisaillon, M.; Henriksson, G.; Gunnarsson Östling, U.; Söderman, M.; Sahlin, J.; Stenmarck, Å.; Sundberg, J.; et al. Policy instruments towards a sustainable waste management. Sustainability 2013, 5, 841–881. [Google Scholar] [CrossRef] [Green Version]
  9. Sasaki, S.; Araki, T. Employer-employee and buyer-seller relationships among waste pickers at final disposal site in informal recycling: The case of Bantar Gebang in Indonesia. Habitat Int. 2013, 40, 51–57. [Google Scholar] [CrossRef]
  10. Wilson, D.C. Development drivers for waste management. Waste Manag. Res. 2007, 25, 198–207. [Google Scholar] [CrossRef]
  11. Asase, M.; Yanful, E.K.; Mensah, M.; Stanford, J.; Amponsah, S. Comparison of municipal solid waste management systems in Canada and Ghana: A case study of the cities of London, Ontario, and Kumasi, Ghana. Waste Manag. 2009, 29, 2779–2786. [Google Scholar] [CrossRef]
  12. Yukalang, N.; Clarke, B.; Ross, K. Solid waste management solutions for a rapidly urbanizing area in Thailand: Recommendations based on stakeholder input. Int. J. Environ. Res. Public Health 2018, 15, 1302. [Google Scholar] [CrossRef] [Green Version]
  13. Rahardyan, B.; Matsuto, T.; Kakuta, Y.; Tanaka, N. Resident’s concerns and attitudes towards Solid Waste Management facilities. Waste Manag. 2004, 24, 437–451. [Google Scholar] [PubMed] [Green Version]
  14. Henry, R.K.; Yongsheng, Z.; Jun, D. Municipal solid waste management challenges in developing countries--Kenyan case study. Waste Manag. 2006, 26, 92–100. [Google Scholar]
  15. Yousif, D.F.; Scott, S. Governing solid waste management in Mazatenango, Guatemala. Int. Dev. Plan. Rev. 2007, 29, 433–451. [Google Scholar]
  16. Zafar, S. Waste Management Challenges in Developing Nations. Available online: https://www.bioenergyconsult.com/waste-management-challenges-in-developing-nations/ (accessed on 1 October 2020).
  17. Shalini, K.; Bhavna, B.; Lipi, D.; Neeraj, A. Promoting Socio-Economic Development through Business Integration, 1st ed.; Business Science Reference: Ghaziabad, India, 2015. [Google Scholar]
  18. Aparcana, S.; Salhofer, S. Application of a methodology for the social life cycle assessment of recycling systems in low income countries: Three Peruvian case studies. Int. J. Life Cycle Assess. 2013, 18, 1116–1128. [Google Scholar]
  19. Haan, H.C.; Coad, A.; Lardinois, I. Municipal Solid Waste Management: Involving Micro-and Small Enterprises; Guidelines for Municipal Managers; International Training Centre of the ILO: Turin, Italy, 1998. [Google Scholar]
  20. Wilson, D.C.; Velis, C.; Cheeseman, C. Role of informal sector recycling in waste management in developing countries. Habitat Int. 2006, 30, 797–808. [Google Scholar]
  21. No, R. Islamic Republic of Afghanistan Rapid Assessment of Kabul Municipality’ s Solid Waste Management System; World BanK: Washington, DC, USA, 2011; ISBN 9781405175173. [Google Scholar]
  22. Azimi, A.N.; Matsumoto, T. A Discussion of Possibilities for Improving Household Waste Management Based on an Actual Conditions Survey in Kabul City. J. Hum. Environ. symbiosis 2017, 30, 84–92. [Google Scholar]
  23. Technology S.W. & Management; John Wiley and Sons Ltd: Chichester, UK, 2011; ISBN 9781405175173.
  24. IDEA. Available online: http://www.idea-lca.jp/40_contact.html (accessed on 11 April 2020).
  25. Rajaeifar, M.A.; Tabatabaei, M.; Ghanavati, H.; Khoshnevisan, B.; Rafiee, S. Comparative life cycle assessment of different municipal solid waste management scenarios in Iran. Renew. Sustain. Energy Rev. 2015, 51, 886–898. [Google Scholar]
  26. MiLCA Guidebook (Tentative). 2014. Available online: https://milca-milca.net/download-files/MiLCAguidebook_En.pdf (accessed on 1 October 2020).
  27. Banar, M.; Cokaygil, Z.; Ozkan, A. Life cycle assessment of solid waste management options for Eskisehir, Turkey. Waste Manag. 2009, 29, 54–62. [Google Scholar] [PubMed]
  28. Dubanowitz, A.J. Design of a Materials Recovery Facility (MRF) For Processing the Recyclable Materials of New York City’ s Municipal Solid Waste by Master of Science in Earth Resources Engineering; Columbia University: New York, NY, USA, 2000. [Google Scholar]
  29. Singh, S.K.; Gour, A. Greenhouse Gas Emissions from Landfills: A Case of NCT of Delhi, India. J. Climatol. Weather Forecast. 2016, 4, 1–6. [Google Scholar]
  30. Babu, G.L.S. Life Cycle Analysis of Municipal Solid Waste (MSW) Land Disposal options in Bangalore city. Environ. Sci. 2014, 795–806. [Google Scholar] [CrossRef]
  31. eco.cycle Jobs and Economic Impact. Available online: https://www.ecocyclesolutionshub.org/about-zero-waste/jobs-eco-impact/ (accessed on 10 October 2020).
  32. Hoornweg, D.; Bhada-Tata, P. What a Waste: A Global Review of Solid Waste Management; World Bank: Washington, DC, USA, 2012. [Google Scholar]
  33. Bank, T.W. Global Study for Purpose of Global World Bank Guidance Development Solid Waste Management Holistic. Decision Modeling; Final Report; World Bank: Washington, DC, USA, 2008; Volume 69874, pp. 1–263. [Google Scholar]
  34. Cointreau, S. Occupational and Environmental Health Issues of Solid Waste Management: Special Emphasis on Middle and Lower-Income Countries; World Bank: Washington, DC, USA, 2006. [Google Scholar]
  35. Lahariya, C. The State of the World Population 2007: Unleashing the potential of urban growth. Indian Pediatr. 2008, 45, 481–482. [Google Scholar] [PubMed]
  36. Ezeh, A.C.; Kodzi, I.; Emina, J. Reaching the urban poor with family planning services. Stud. Fam. Plann. 2010, 41, 109–116. [Google Scholar]
  37. Owusu, G. Social effects of poor sanitation and waste management on poor urban communities: A neighborhood-specific study of Sabon Zongo, Accra. J. Urban. 2010, 3, 145–160. [Google Scholar] [CrossRef]
  38. Yıldız-Geyhan, E.; Yılan, G.; Altun-Çiftçioğlu, G.A.; Kadırgan, M.A.N. Environmental and social life cycle sustainability assessment of different packaging waste collection systems. Resour. Conserv. Recycl. 2019, 143, 119–132. [Google Scholar]
  39. Linzner, R.; Lange, U. Role and size of informal sector in waste management—A review. Proc. Inst. Civ. Eng. Waste Resour. Manag. 2013, 166, 69–83. [Google Scholar] [CrossRef]
  40. Ritter, W.F.; Dsouza, C. Social and Environmental Impacts of Waste Management Alternatives in India: A Critical Analysis. In Proceedings of the World Environmental and Water Resources Congress 2014, Portland, OR, USA, 1–5 June 2014; Albert Einstein College of Medicine: New York, NY, USA, 2014; pp. 1588–1597. [Google Scholar]
  41. Mane, T.T.; Hingane Hemalata, N. Existing situation of Solid waste management in pune city, India. Res. J. Recent Sci. 2012, 2277, 2502. [Google Scholar]
  42. Chiemchaisri, C.; Visvanathan, C. Greenhouse gas emission potential of the municipal solid waste disposal sites in Thailand. J. Air Waste Manag. Assoc. 2008, 58, 629–635. [Google Scholar]
  43. Rana, R.; Ganguly, R.; Gupta, A.K. Life-cycle assessment of municipal solid-waste management strategies in Tricity region of India. J. Mater. Cycles Waste Manag. 2019, 21, 606–623. [Google Scholar]
Figure 1. Average Household Waste Composition in Kabul city (Azimi and Matsumoto, [22])
Sustainability 12 09872 g001
Figure 2. System Boundary of Study.
Sustainability 12 09872 g002
Figure 3. Greenhouse Gas (GHG) Emissions of the Waste Management System (WMS) Under Existing and Alternative Scenarios (kg CO2eq/day).
Sustainability 12 09872 g003
Figure 4. Costs of the WMS For Existing and Alternative Scenarios ($/day).
Sustainability 12 09872 g004
Figure 5. Informal worker jobs in the respective scenarios.
Sustainability 12 09872 g005
Table 1. Existing and Alternative Waste Management Scenarios in Kabul.
ScenarioCollectionRecyclingLandfilling
Type of WasteAmount (%)Type of WasteAmount (%)Type of WasteAmount (%)
S-0: Current systemMixed waste (formal) 152.5--Unsanitary landfill waste 1 + 252.71
Recyclables (informal)4.60Recyclables4.39
other 20.21
Uncollected waste42.9----
S-1: Improved collection coverage with employment of informalMixed waste 3100--Unsanitary landfill waste 3100
S-2: S-1 + recycling with change in facility locationMixed waste100Recyclables8.82Unsanitary landfill waste 491.18
other 491.18
S-3: S-2 + source separationRecyclables9Recyclables6.93Unsanitary landfill waste 5 + 693.07
other 62.07
Other 591--
S-4: S-3 + sanitary landfillingRecyclables9Recyclables6.93Sanitary landfill waste 7 + 893.07
other 82.07
other 791Recyclables-
Table 2. Separation, Sorting, and Recycling rates of Efficiency for the Study.
ParameterEfficiency (%)
Source separation of recyclables a50
Separation of recyclables from mixed waste a70
Sorting efficiency at the MRF from mixed recyclables after separation by scavengers and recycling shops b95
Sorting efficiency at the MRF from mixed recyclables c84
Recycling of recyclables after source separation a92
Recycling of recyclables collected by scavengers a80
Recycling of recyclables after separation of recyclables from mixed waste a70
a Banar M. et al. (2014) [27]. b Assumed. c Dubanowitz A. J., (2000) [28]. Note: Source separation of recyclables is conducted at its source, i.e., households.
Publisher’s Note: MDPI stays neutral with regard to jurisdictional claims in published maps and institutional affiliations.

