
Risk Prioritization for Failure Modes in Mining Railcars

1
Department of Mining Engineering, Faculty of Engineering, University of Birjand, Birjand 9717434765, Iran
2
Division of Operation and Maintenance Engineering, Lulea University of Technology, 97187 Lulea, Sweden
*
Author to whom correspondence should be addressed.
Sustainability 2021, 13(11), 6195; https://0-doi-org.brum.beds.ac.uk/10.3390/su13116195
Submission received: 23 March 2021
/
Revised: 27 May 2021
/
Accepted: 28 May 2021
/
Published: 31 May 2021
(This article belongs to the Special Issue Sustainable and Trustworthy Operation and Maintenance of Railway Systems)
Abstract
:Railway transportation systems are generally used to transport minerals from large-scale mines. Any failure in the railcar components may cause delays or even catastrophic derailment accidents. Failure mode and effect analysis (FMEA) is an effective tool for the risk assessment of mechanical systems. This method is an appropriate approach to identify the critical failure modes and provide proper control measures to reduce the level of risk. This research aims to propose an approach to identify and prioritize the failure modes based on their importance degree. To achieve this, the analytical hierarchy process (AHP) is used along with the FMEA. To compensate for the scarcities of the conventional FMEA in using the linguistic variables, the proposed approach is developed under the fuzzy environment. The proposed approach was applied in a case study, a rolling stock operated in an iron ore mine located in Sweden. The results of this study are helpful to identify not only the most important failure modes but also the most serious and critical ones.
1. Introduction
Today, transportation is a vital service in which all economic resources such as assets, labor, time, and technology are employed for delivering goods and resources to consumers and revenue to producers. In the mining industry, like all industries, transportation plays a key role in increasing profitability and economic advantages. Material handling is such important that a successful mining operation depends on the shipping condition and needs special equipment and machinery to deliver services and goods. The securing of a load is a primary concern in all trucking, railroads, waterway, port, and airport transportation modes. It is of such important that the incorrectly secured load endangers the safety of road traffic, human health and life, and even the load properties. There are numerous techniques to secure loads against slipping, overturning, rolling, and shifting by load locking and increasing the load restraint or friction [1]. For example, in the railway transportation systems, the bogie and superstructure, inside of the wagons, and stanchions and bolsters of wagon walls need to be secured to reduce the risk of the cargo movements [2]. Transporting oversize cargos is another issue in all transporting modes. Excessive cargo transportation not only needs to obtain a special permit but also requires more attention to be immobilized during the transportation [3].
Regardless the problems, mentioned earlier, mineral transportation includes a major part of the operational cost in mining. There is different equipment to transfer the blasted material in and out of the mine such as trucks, conveyor belts, and rolling stocks. Among them, railcars are in an exceptional place, especially for long and low-slope distances. Rail transportation systems move a high volume of materials, have long-life assets, and require minimum maintenance operation [4]. Moreover, this system is of high priority because of safety, energy consumption, and environmental issues. That is why they are an attractive system for mineral transportation. Safe and efficient transportation and keeping the vehicle performance at an acceptable level is a major concern for not only vehicle operators but also mine managers and contractors. Any unexpected failure in each part of the railcars affects the performance of the system and might cause delays or even catastrophic derailment accidents. In such circumstances, the required transportation capacity might not be fulfilled and consequently, the scheduled services cannot be covered by the operator. Furthermore, having a reliable railcar ensures on-time transportation and keeps it available. To achieve this, identifying the failure modes and their impact is essential to improve the performance of the rolling stocks.
Identification and evaluation of the risks associated with the failure of components are essential to improve the maintenance strategy and management. It obtains more importance in complex engineering systems. To achieve this, several techniques such as failure mode and effects analysis (FMEA), fault tree analysis (FTA), reliability block diagram (RBD), Monte-Carlo simulation (MCS), Markov snalysis (MA), and Bayesian networks (BN) have been developed and applied [4]. Among them, FMEA is an appropriate fault diagnosis technique to identify and record the effect of failures on the system operation and prioritize each failure regards to the performance of the systems. Some conceptual frameworks such as reliability-centred maintenance (RCM) have utilized the FMEA to improve maintenance programs. As an important part of RCM, FMEA is one of the extensively used methods for designing and prioritizing preventive maintenance activities [5,6]. It plays a crucial role in the reliability design and identifying the critical bottlenecks. FMEA is an appropriate fault diagnosis tool to identify and record the effect of failures on the system operation and prioritize each failure regards to the performance of the systems [7]. This is a systematic approach for the reliability and safety analysis that identifies the critical failure modes, causes, and mechanisms of the failure to prevent the failure or reduce its effects [8]. Nowadays, numerous guidelines and standards such as SAE J1739, AIAG FMEA-4, and MIL-STD-1629A have been published with recommendations and requirements to improve the failure mode and their effects analyses [9]. Recently, the Automotive Industry Action Group (AIAG) of the United States of America and Verband der Automobilindustrie (VDA) of Germany published a handbook, named the AIAG-VDA FMEA Handbook, in order to develop FMEA. This handbook provides a guideline for designing a FMEA, processing a FMEA, and monitoring the system response. The handbook addressed products or processes, defect prevention, effects to determine severity score, top three causes, determining occurrence score, and continual improvement prioritization. In this approach, the action priority is calculated based on three elements including the severity of the effect, probability of the hazard occurring and the probability of detection [10]. In the traditional FMEA, the risk priority number (RPN) is calculated by multiplying three factors with crisps values that are the severity, occurrence, and the probability of detection [11]. The risk priority numbers are usually determined by considering the linguistic variable for these parameters. The fuzzy approach is the most common method to reduce uncertainties and ambiguity in such circumstances. Application of the fuzzy method along with the FMEA technique has been widely used to calculate the RPN in the various sectors of industries such as product design, medicine, construction industry, offshore engineering, manufacturing engineering, chemical industry, metro rail project, water supply system, health care industry, aircraft systems, and food industry [12].
To date, numerous attempts have been made to detect and assess the potential failures for the rolling stocks to decrease the severity and occurrence level. Dinmohammadi et al. [13] studied the potential risks for the unexpected failures of rolling stocks. They applied the failure mode, effects, and criticality analysis-based approach to finding the most critical failure modes for a door system of a passenger train in the UK’s railway network. In this research, all possible failure modes were detected, and then, the likelihood of occurrence and the severity of damage caused by the failure is obtained and ranked the risk factor. Rezvanizaniani et al. [14] focused on the failure data of a passenger coach of the rolling stock in an Iranian railway company to analyze the reliability of critical subsystems. They stated that wheelsets shared more than 76% of the total number of rolling stock failures. Therefore, they collected time between failure data for different types of wheelsets and then propose the appropriate reliability-based maintenance interval for each one. Teshome [15] evaluated the availability of a fleet of rolling stocks in the Netherland. They applied the Markov chain approach to developing their model. They showed that, by considering the suitable number of standby trains, the availability of the fleet can reach 100% while, a high number of spare trains may not be economical. Dinmohammadi [16] proposed a stochastic approach to determine the optimal preventive maintenance activities for rolling stocks. A risk-based modeling approach was created by considering the safety-related costs, maintenance costs, penalty charges, and loss of fares costs. The model was applied to estimate the likelihood of failure occurrence for a pantograph system of rolling stock in a Scottish train company. Dinmohammadi stated that the proposed model reduces the corrective maintenance cost and meets higher safety and quality levels.
Conradie et al. [17] studied the reliability of rolling stocks in a case study; passenger rail service of South Africa. They analyzed the failure data of the machine’s subsystems to evaluate the impact of component failures on the reliability of the overall system. The critical subsystems were proposed and it was recommended that to reach the reliability target, preventive maintenance schedules should be proposed instead of time-based maintenance. Len et al. [18] applied the Bayesian approach to analyzing the degradation of locomotive wheels. They evaluated the service lifetime and reliability of a locomotive wheel from a Swedish company. They found that the lifetime of the wheels in the second (or back) bogie is longer than the first (or front) ones. Len et al. stated that this deference might be because of environmental and operational conditions and also the gravity center of the locomotive. In another research, Babeł and Szkoda [19] studied the cost-based efficiency for both modernized and non-modernized diesel locomotive in Poland. Analysis of the failure showed that the deiseal engine encountered more than half of the machine failures. They stated that the maintenance cost sheared about one-fourth of the total overhaul cost. It was also mentioned that the fuel cost was the major share in the life cycle cost of the locomotive. Cai et al. [20] analyzed the reliability, availability, maintainability, and safety of the air brake system of an urban train in China. The failure data analysis showed that the bogies and brake system respectively comprised the highest frequency of failures. They applied the Go-Bayes method for the safety assessment of the braking system. In this approach, they mentioned that the influence of the system’s parts in the system safety analysis had been possible. In another study, Appoh et al. [21] proposed a hybrid dynamic probability-based model for the failure analysis of rolling stock. The model was applied for the door interlock failure analysis of a rolling stock operated in the UK. They concluded that the proposed model improves isolation and notification of failure, rapidly.
Reviewing the above-mentioned papers shows that numerous attempts were made to analyze the failure of the rolling stocks. Most of these studies have focused on the passenger rolling stocks and there are not enough studies for the failure analysis of fright rolling stock like mining railcars. Some scholars have tried to identify the failure modes of rolling stock and then analyze their effects using the traditional FMEA technique. Evaluation of the risk factors in these circumstances is usually difficult and not accurate [22]. However, to remove uncertainties and ambiguities in using the crisp values and also the dependency of RPN on the variation of the risk factors, it is better to use the fuzzy logic approach. Moreover, the failure modes don’t have the same effect not only on each other but also on the system performance. Therefore, prioritizing the failure mode based on these influences is essential. Ghodrati et al. [23] applied the FMEA to identify the potential failure modes of rolling stocks in LKAB Malmtrafik (Sweden). This research was carried out using the analytical hierarchy process (AHP) method under the fuzzy environment (fuzzy AHP, FAHP) to gather with the RPN method. Results of this study showed that the crack and flat spots of wheels and axles is the most hazardous failure mode. The AHP is one of the comprehensive multi-criteria decision-making methods that creates an overall view of the complex relationships for experts to structure the problems systematically and calculating the criteria weights [24]. In Ghodrati et al.’s study, the conventional fuzzy logic was used not only for the multiplication of risk factors but also for the defuzzification of the priority numbers. The current paper is aim to applying the developed fuzzy FMEA method by using the rule-based fuzzy logic approach for mining railcar machines. In this approach, first, the FAHP is used to obtain the importance measure of the critical failure mode. Then, the fuzzy risk priority numbers are obtained for each failure mode by using the rule-based fuzzy logic system. This method processes the inputs nonlinearly based on the “IF-THEN” rules. The rule-based systems, designed by using expert knowledge, make reasonable predictions and exploit the tolerance for uncertainty. Moreover, in the application of the fuzzy rules, the judgment process is interpreted, decision-makers are allowed to understand how the final classification was arrived at and helped to reduce the computational complexity in their comparisons [25]. The proposed approach is applied for the priority ranking of the failure modes at a case study, the Kaunis iron ore mine located in the north of Sweden.
Results of this research are helpful for rolling stock managers and operators to identify the critical failure modes and accordingly plan the efficient maintenance strategy. The proposed approach can be used in other machines, as well.
2. Materials and Methods
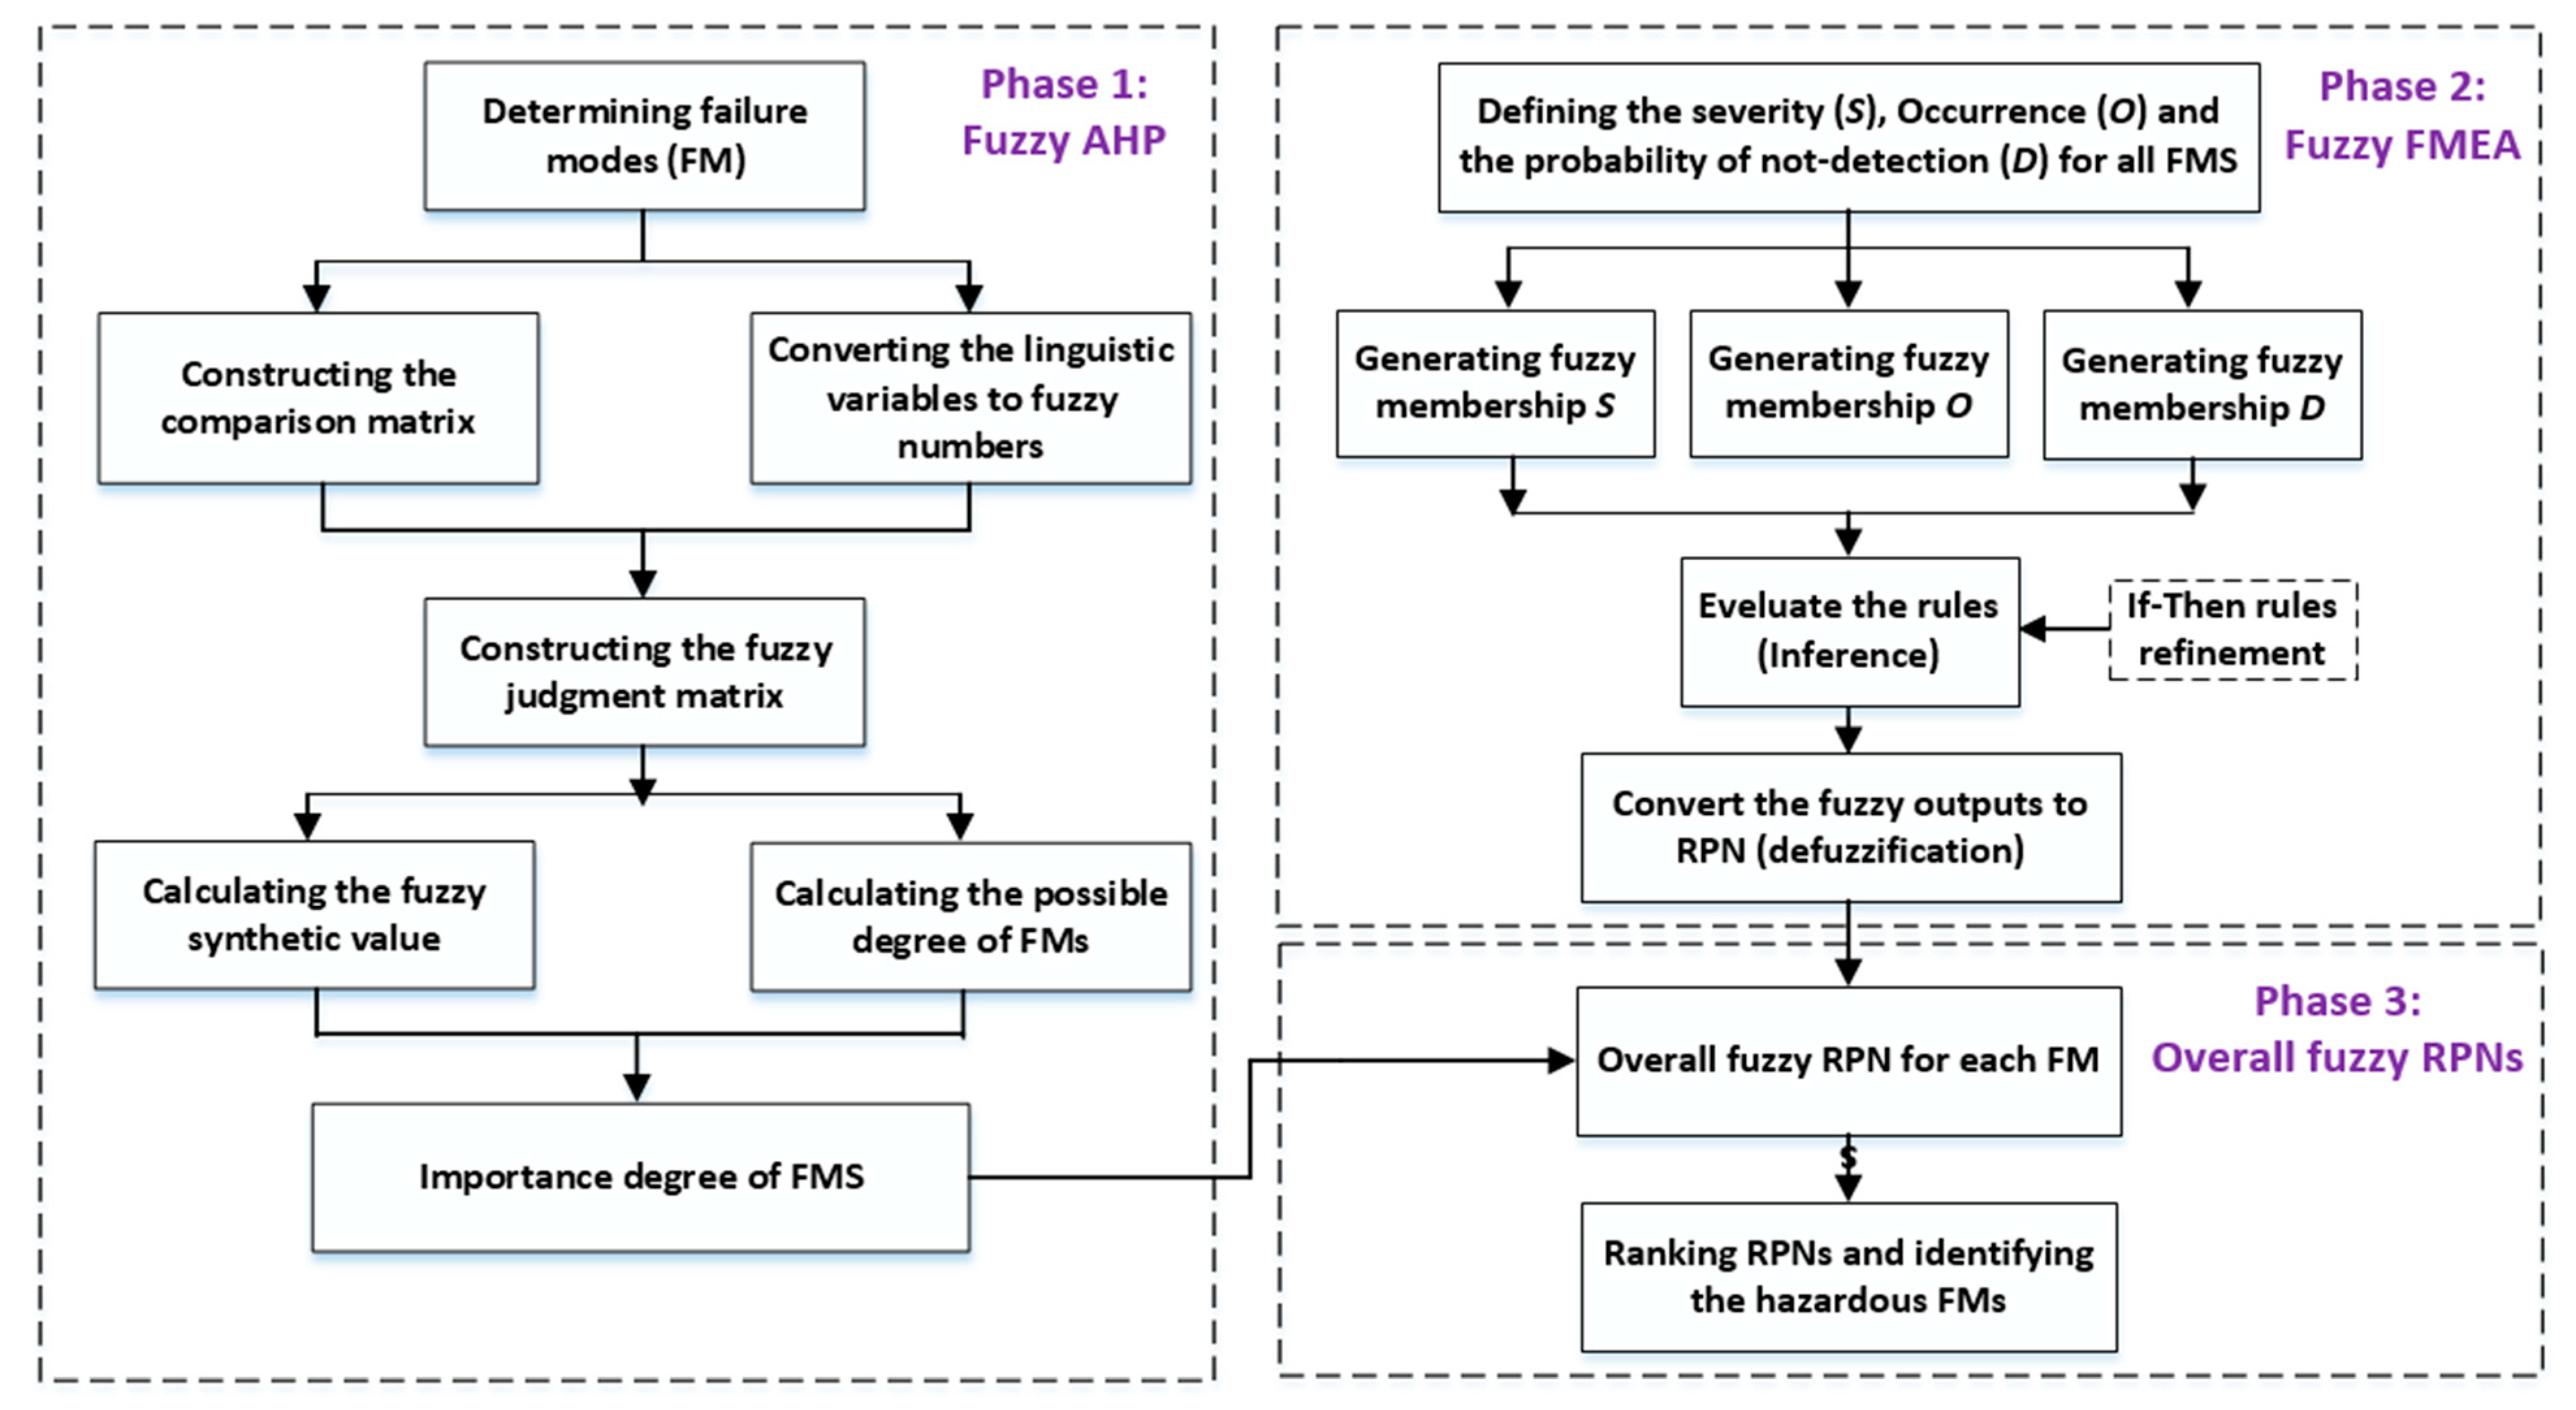
This section is devoted to present the theoretical foundation of the paper. First, the AHP method is presented. Then the FMEA technique is introduced under the fuzzy environment. The conceptual framework for the fuzzy-based FMEA is configured in Figure 1 (phases 1 to 3). In phase 1 (fuzzy AHP), the AHP technique is used to obtain the weight of each failure mode. Then in phase 2, after identifying the potential failure mode, the occurrence, severity, and probability of detection them are defined in the form of fuzzy numbers. Then the fuzzy RPN for each failure mode is obtained. Finally, in phase 3, the overall fuzzy RPN is obtained to rank the failure modes.
2.1. AHP under the Fuzzy Environment (Phase 1)
In the first phase, the AHP method under the fuzzy environment is applied to calculate the importance degree of failure modes. AHP is one the most common multi-attribute decision-making methods, presented by Saaty [26], which has been broadly employed as an appropriate methodology for decision making [27]. This is an appropriate method to weighting the decision factors, which can incorporate inherent inconsistencies of a decision process. It is understandable that structures the problems systematically and calculating the criteria weights. In a decision-making process, it is impossible for the decision-makers to exactly evaluate the conflicting criteria and alternatives. Zadeh [28] presented the fuzzy set theory dealing with uncertainty and vagueness. In this approach, the standard set theory has generalized to the fuzzy sets. A fuzzy set contains a class of objects with a continuum memberships’ grades. Contrary to the crisp set that only allows full- or non- membership, the fuzzy set allows partial membership ranging from 0 to 1. A fuzzy set is a generalization of a crisp set considering the sets of memberships in logical reasoning. In this concept, values 0 and 1 indicate the complete non-membership and membership respectively, and helps to specify the intermediate degree of membership [29]. The fuzzy set is characterized by a membership function, which assigns to each object a grade of membership ranging between 0 and 1. The triangular fuzzy number (TFN) is one of the most used fuzzy numbers and simply shown as = (l, m, u) in which parameters l, m, and u respectively present the smallest, most promising, and largest possible values. In recent years, fuzzy logic theory and AHP were combined to model imprecision and uncertainty. The fuzzy AHP has been extensively used in different areas such as manufacturing, maritime, pharmaceutical, electronic, automobile, logistics, food industry, airline, chemistry, and agriculture [29].
Steps of the fuzzy AHP method, introduced by Chang [30], are summarized as follows:
Step 1. Establishing the fuzzy judgment matrix
In the first step, each member of the expert group individually made the pairwise comparisons to state the relative preference of failure mode i and j. By using TFNs via pairwise comparison, the mathematical form of the fuzzy judgment matrix = (aij) can be expressed as follows:
The judgment matrix is an n × n fuzzy matrix with fuzzy numbers and . Regarding the uncertainties in human ideas about the fuzzy linguistic variables from equally important to extremely importance, the fuzzy numbers correspond with linguistic variables are in Table 1.
Step 2. Calculating the value of fuzzy synthetic extent
Consider F = {f1, f2, …, fn} as the set of the failure modes, where n is the number of failure modes and A = {A1, A2, …, Am} is a set of the expert with m numbers. Moreover, consider as the values of extent analysis of the ith failure mode from m experts. It is noted that all the values are TFNs. Then, the value of fuzzy synthetic extent Si with respect to the ith failure mode is defined as [23,30]:
This equation has two terms. To obtain the fuzzy additional operation values are performed as . Then, inverse of this vector is calculated as follows [23,30]:
Step 3. Calculating of the degree of possibility
The degree of possibility of M1 = (l1, m1, u1) ≥ M2 = (l2, m2, u2) is obtained as follows [23,30]:
where d is the highest intersection point µM1 and µM2. To compare M1 and M2, both values V(M1 ≥ M2) and V(M2 ≥ M1) are needed.
Step 4. Obtaining the weight vectors
To obtain the set of weight values a principle of comparison for fuzzy numbers is considered as mentioned in Equation (3). The degree possibility for a convex fuzzy number to be greater than k convex fuzzy numbers Mi = (i = 1, 2,…, k) can be defined as [23,30]:
V (M ≥ M1, M2, …, Mk) = V [(M ≥ M1) and (M ≥ M2) and (M ≥ M3)… and
(M ≥ Mk)] = min V (M ≥ Mi), I = 1,2, …, k.
Regarding Equation (3), if d′(Ai) = min V (Si ≥ Sk) for k = 1, 2, …, n; k ≠ i, then a weight vector is calculated as [23,30]:
where Ai (I = 1, 2, …, n) are n experts. The weight vector is normalized by using the following equation:
where W is the non-fuzzy weight number.
W′ = (d′(A1), d′(A2), …, d′(An))T
W = (d(A1), d(A2), …, d(An))T
2.2. Fuzzy FMEA (Phase 2)
FMEA is a structural hierarchy method to identify failure modes of a system and their influence. This method is a preventive approach that is based on a team working to identify, evaluate, remove or control the potential failure modes and their impact on a system or process to enhance reliability and safety. Therefore, the selection of team members with enough specialty and knowledge about the system or process is crucial to perform the FMEA. In the first step of the FMEA, all possible failure modes are identified. Then the risk factors including occurrence (O), severity (S), and the probability of detection (D) for each failure mode are obtained. The priority risk of failure is performed through risk priority number (RPN) that is calculated by multiplying O, S, and D:
RPN = O × S × D
In traditional FMEA, a 10-point scale with 1 corresponding to the best and 10 correspondings to the worst-case is used to evaluate each risk factor. Then the failure modes are ranked based on the PRN values. In this approach, the failure modes with higher RPN values are considered more important and the proper actions need to be done for them.
Nevertheless, the traditional FMEA has been widely used in numerous fields including manufacturing [31,32], marine [33,34], aerospace [35,36], healthcare [37,38,39] and electronics [40,41,42]. The application of crisp values in the traditional FMEA has been strongly criticized by researchers [43,44,45]. Because the traditional FMEA assumes the same importance degree for all risk factors and obtains the same RPN values for failure modes even with the different risk factors. Moreover, in most cases of the traditional FMEA, the dependency of RPN on the variation of the risk factors give vague information. Some scholars have been tried to overcome these shortcomings and limitations. The application of fuzzy logic is one of these attempts [46].
To evaluate the FMEA under the fuzzy environment, the Mamdani fuzzy logic systems [47] have been widely used by different researchers [48]. There are three steps to obtain the fuzzy priority number in this system, named fuzzification, rule evaluation, and defuzzification. In the fuzzification step, the occurrence, severity, and probability of detection risk factors are defined according to the expert’s judgment and knowledge for each failure mode in the form of fuzzy numbers. The fuzzy numbers with the verbal description used to interpret the linguistic terms of experts are given in Table 2. In the present paper, triangular fuzzy numbers [49] are applied to describe a fuzzy event.
In the second step or the rule evaluation step, the fuzzy risk priority numbers are created in the fuzzy logic system by matching them against the “If-Then” rules. These rules are evaluated in an inferencing approach, named fuzzy inference to get the final results. The “If-Then” rules are created based on the expert’s knowledge about the interactions between various risk factors that comes from Table 1. As an example, a fuzzy “If-Then” rule for a failure mode assumes in the form of “If the severity is none and occurrence is almost never and the probability of detection is almost certain Then the risk is not important”. To evaluate each rule, the results are combined to calculate the rule consequences based on the system’s input values. This process is called the fuzzy inference process. In this paper, the “min-max” inference technique is used as the widely used method [48]. In this process, the true value of the rule is defined as the minimum rule antecedent and then it is applied to all consequences of the rule. If the output of fuzzy sets is more than one rule, then the output is set to the maximum truth value of all the rules that include it as a consequence. A set of consequences whose true values are greater than zero is considered as the result of the inferencing approach. In the third step, the defuzzification algorithm is applied to creates a crisp RPN value from the fuzzy results set and accordingly define the prioritization level of each failure mode. There are numerous methods for defuzzification. In this work, the center of the area method [50], as the most common method, is used to return the corresponding crisp value.
2.3. Overall Fuzzy RPN (Phase 3)
In this step, the importance measure of each failure mode (from the fuzzy AHP) is integrated into the fuzzy RPN (from the fuzzy inference process) to obtain the overall priority ranking of the failure modes. The overall fuzzy risk priority number for each failure mode is calculated as:
where is the overall fuzzy RPN for ith failure mode, wi is the weight of the failure mode, and FRPN is the fuzzy risk priority number for failure mode i.
3. Results
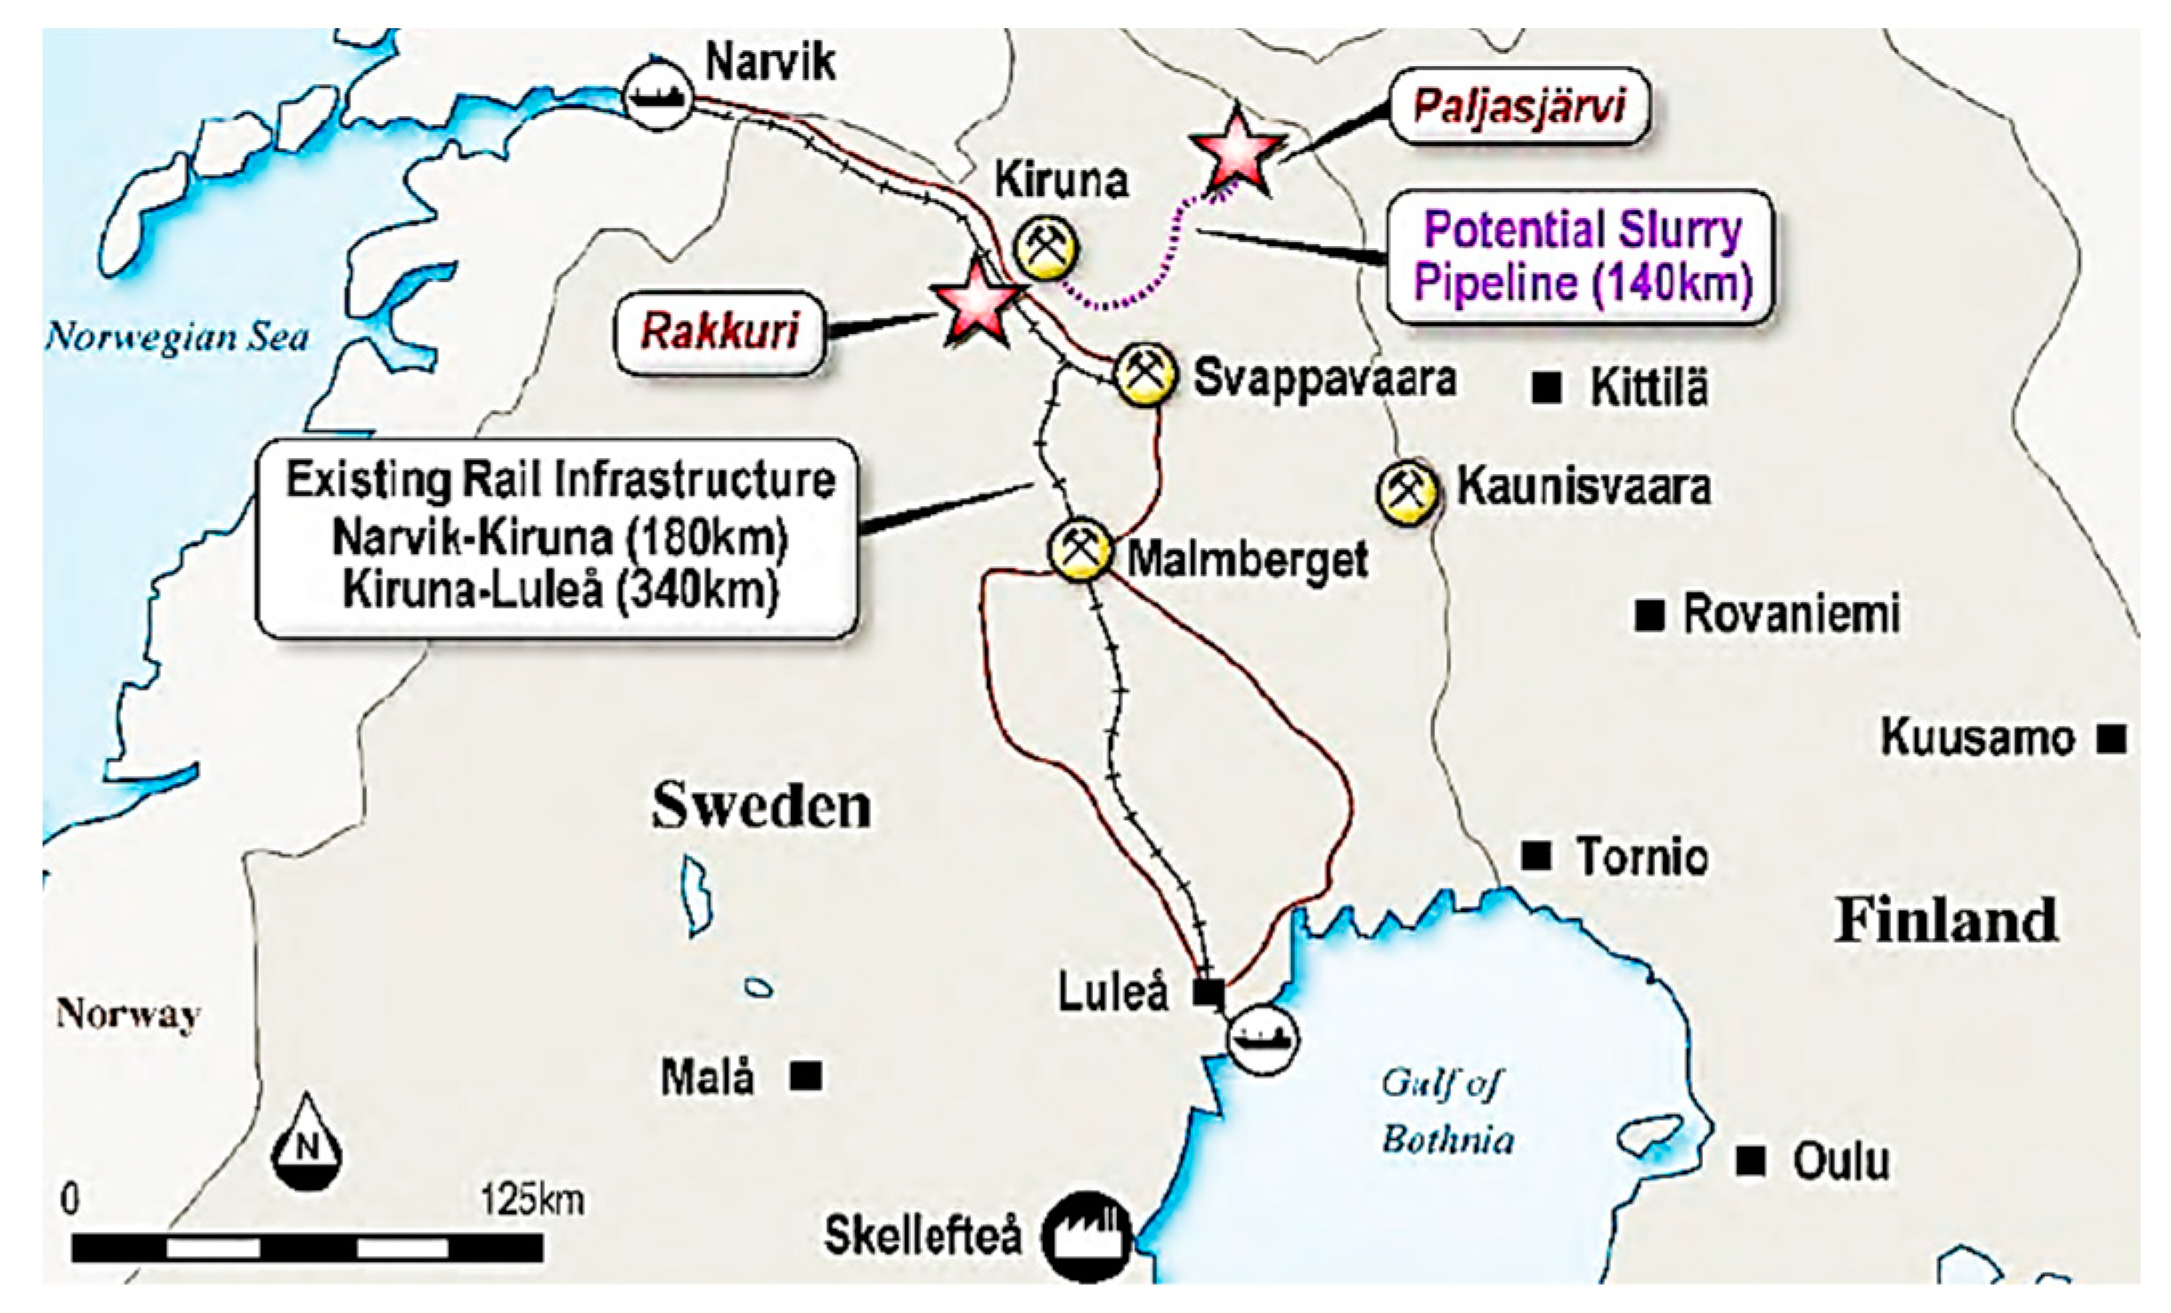
This section is devoted to analyzing the failure mode of a rolling stock operated in Kaunis Iron [46], a Swedish mining company. The Kaunis iron ore mine, located in the north of Sweden, operates two trains to transport iron ore from Svappavaara in Sweden to Narvik in Norway (Figure 2). The iron ore is transported by truck from Kaunisvaara to the reloading station Pitkäjärvi at the Svappavaara railway line and then, transported by rail to the port in Narvik. The Railway Specialist Railcare Group is responsible for planning train production from truck to railway at the terminal in Pitkäjärvi and in the port of Narvik. Railcare runs two train journeys per day, seven days a week with a volume of about 2.3 million tons of iron ore per year [51]. The failures of the Bombardier TRAXX wagons used by Railcare Group are analyzed in this section. The primary failure data analysis shows that the wheelsets share the highest number of failures that consistent with the past studies [14,18,21]. It also shares the highest maintenance cost of rolling stock in comparison to the other subsystems. Wheelsets consist of different parts including wheels, wheel tires or steel hoops, disk brake, roller bearing, axle guide, and oil pipelines in the bogie frame. The recorded failure data in 2020 showed that the flange height over the prescribed limit, rolling contact fatigue, and hollow wear were the main causes of the wheelset failure.
The rest of this section is devoted to analyzing the failure mode of the wheelset system of wagons for Kaunis Iron using the procedure presented in the previous section. The failure modes that correspond to the main component of the wheelset are summarized in Table 3.
3.1. Importance Degree of Failure Modes
As stated earlier, the failure modes don’t have the same effect on the system performance. Therefore, prioritizing the failure mode based on their importance is essential. To reach this, the fuzzy AHP technique is used. In the first step, the importance of each failure mode is obtained using the decision-maker group. In this step, the linguistic variables, given in Table 1, are applied and then the fuzzy judgment matrix was created (Table 4).
After creating the fuzzy judgment matrix, the fuzzy synthetic extent values (Si) were calculated from the Equation (1) for each failure modes as follows:
| SF1 = (0.013,0.023,0.041), SF2 = (0.001,0.003,0.015), SF3 = (0.003,0.009,0.021), |
| SF4 = (0.011,0.024,0.052), SF5 = (0.003,0.008,0.026), SF6 = (0.001,0.004,0.015), |
| SF7 = (0.008,0.018,0.046), SF8 = (0.001,0.005,0.015), SF9 = (0.007,0.014,0.029), |
| SF10 = (0.003,0.008,0.026), SF11 = (0.003,0.008,0.026), SF12 = (0.001,0.007,0.015), |
| SF13 = (0.001,0.004,0.015), SF14 = (0.011,0.023,0.052) |
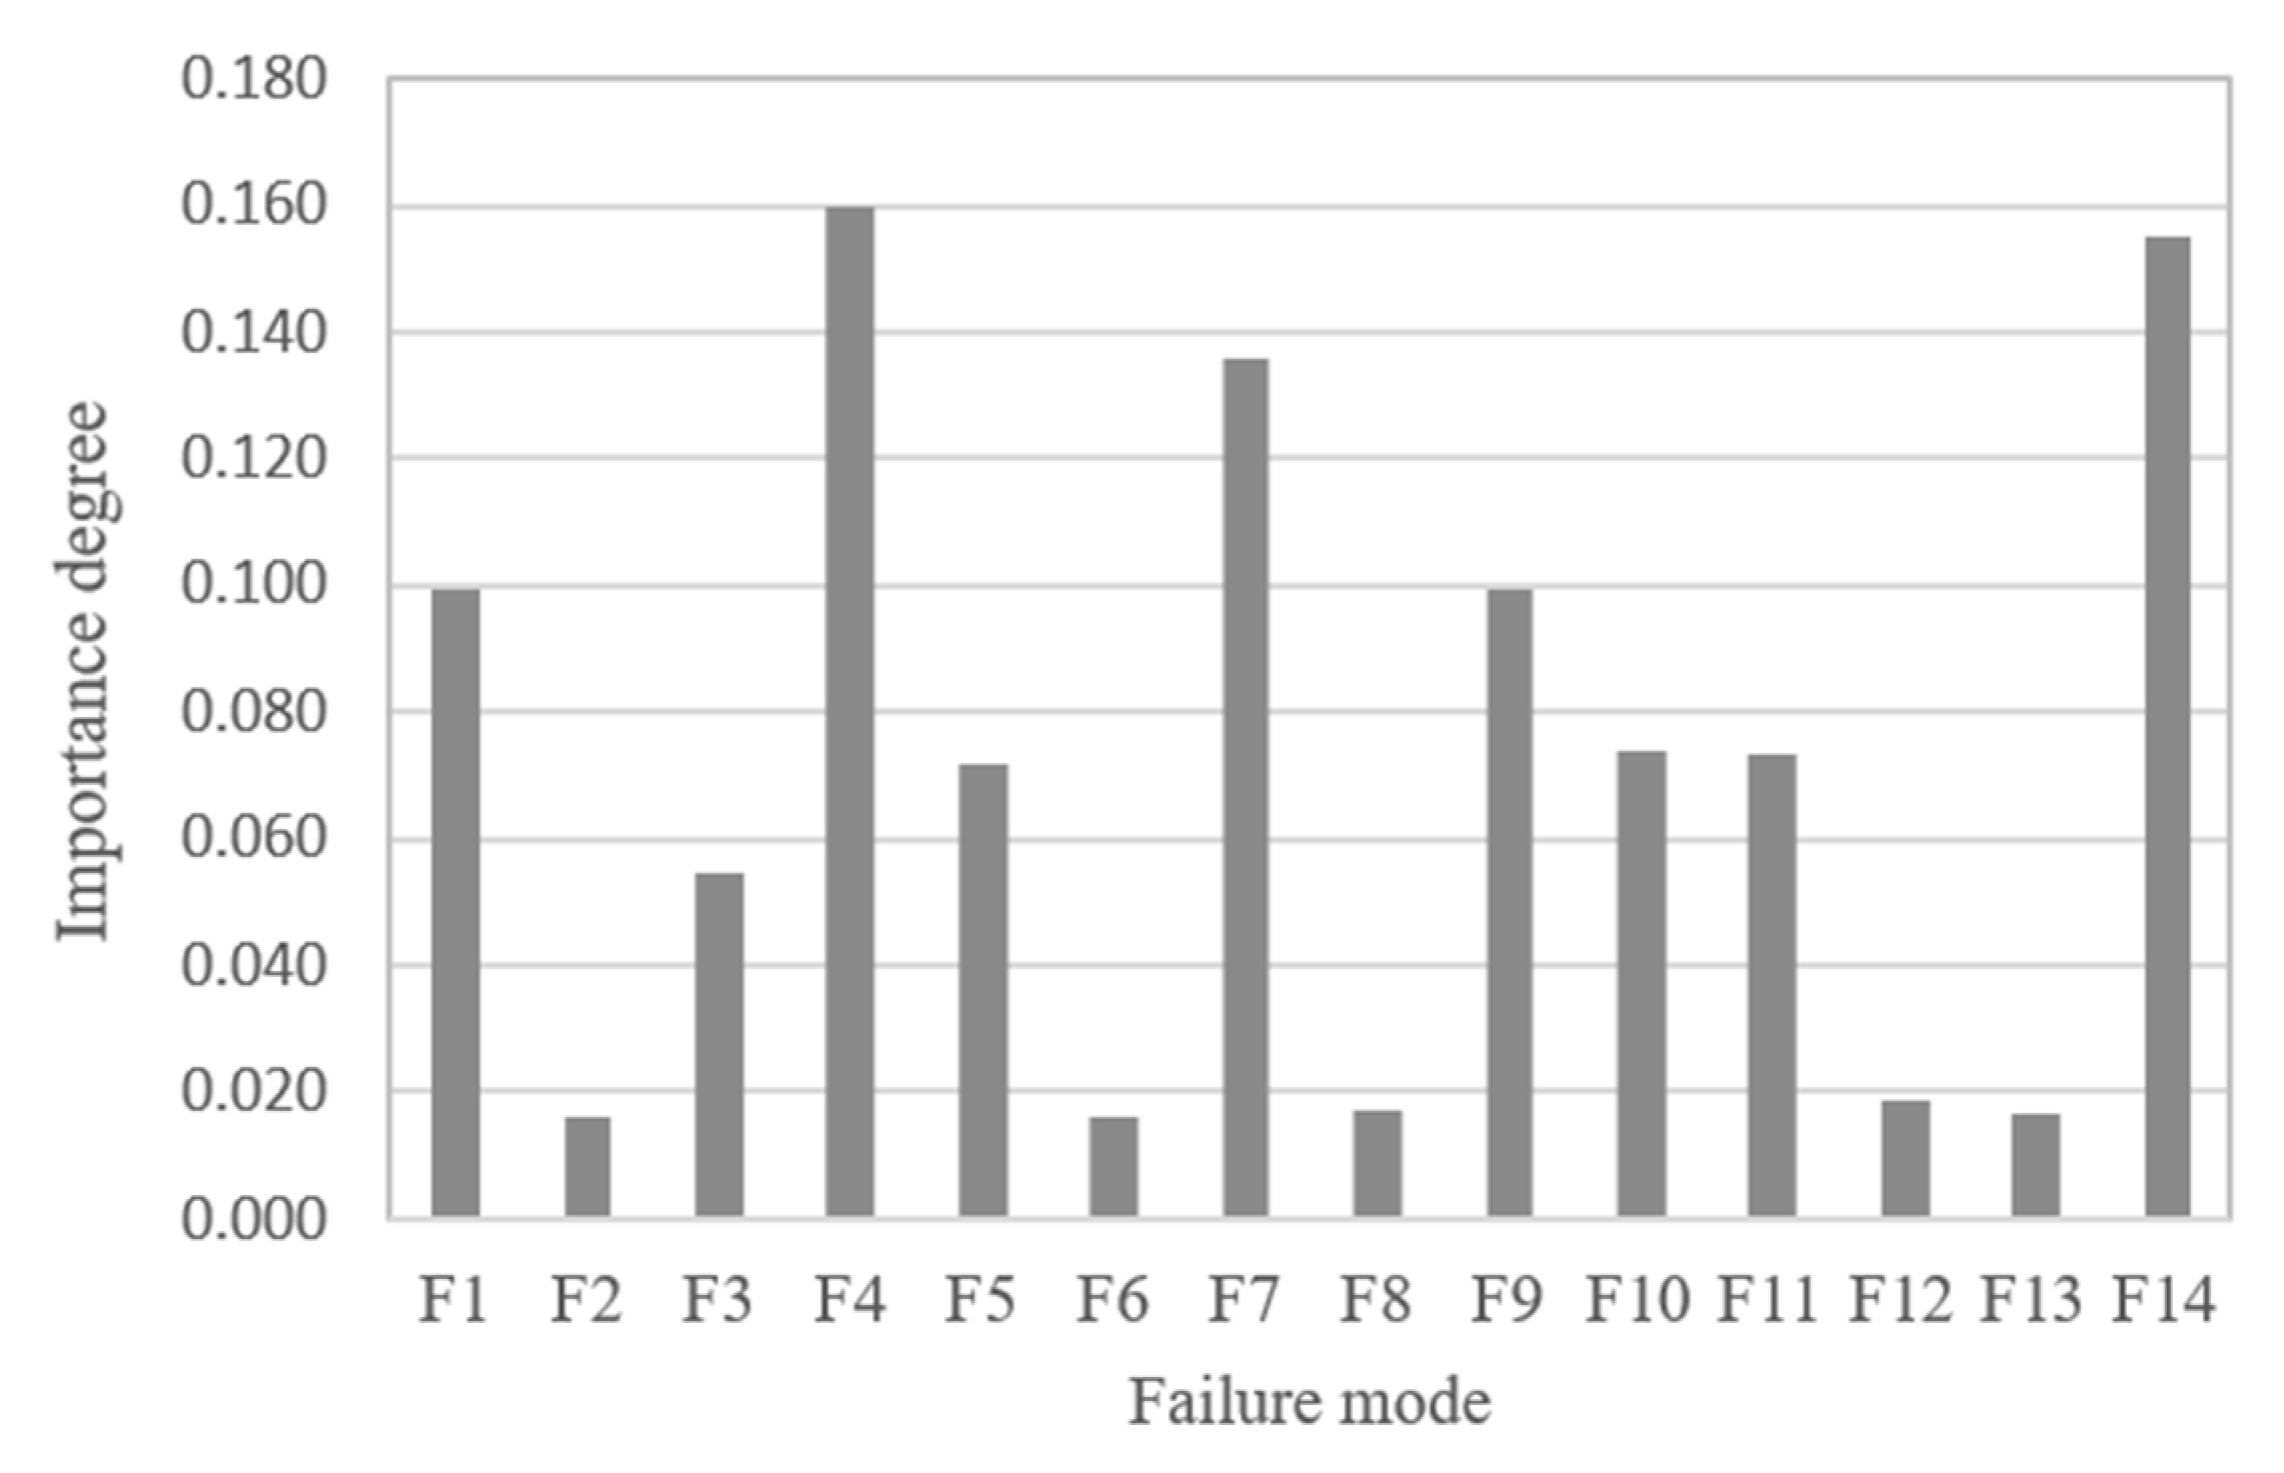
In the next step of the fuzzy AHP, the degree of possibility for all failure modes in comparison to others was calculated. Accordingly, the final importance degree of each failure modes was calculated through the normalization of the weight vector and shown in Figure 3. Regarding Figure 3, failure modes no. 14 (hollow wear), 4 (overheated wheels), 7 (rolling-contact fatigue), and 9 (skidding or spalling of the wheel tread), respectively have the highest weight, while the failure modes F2, F6, F8, F12, and F13 have the lowest one.
3.2. Fuzzy Weighted Risk Priority Number
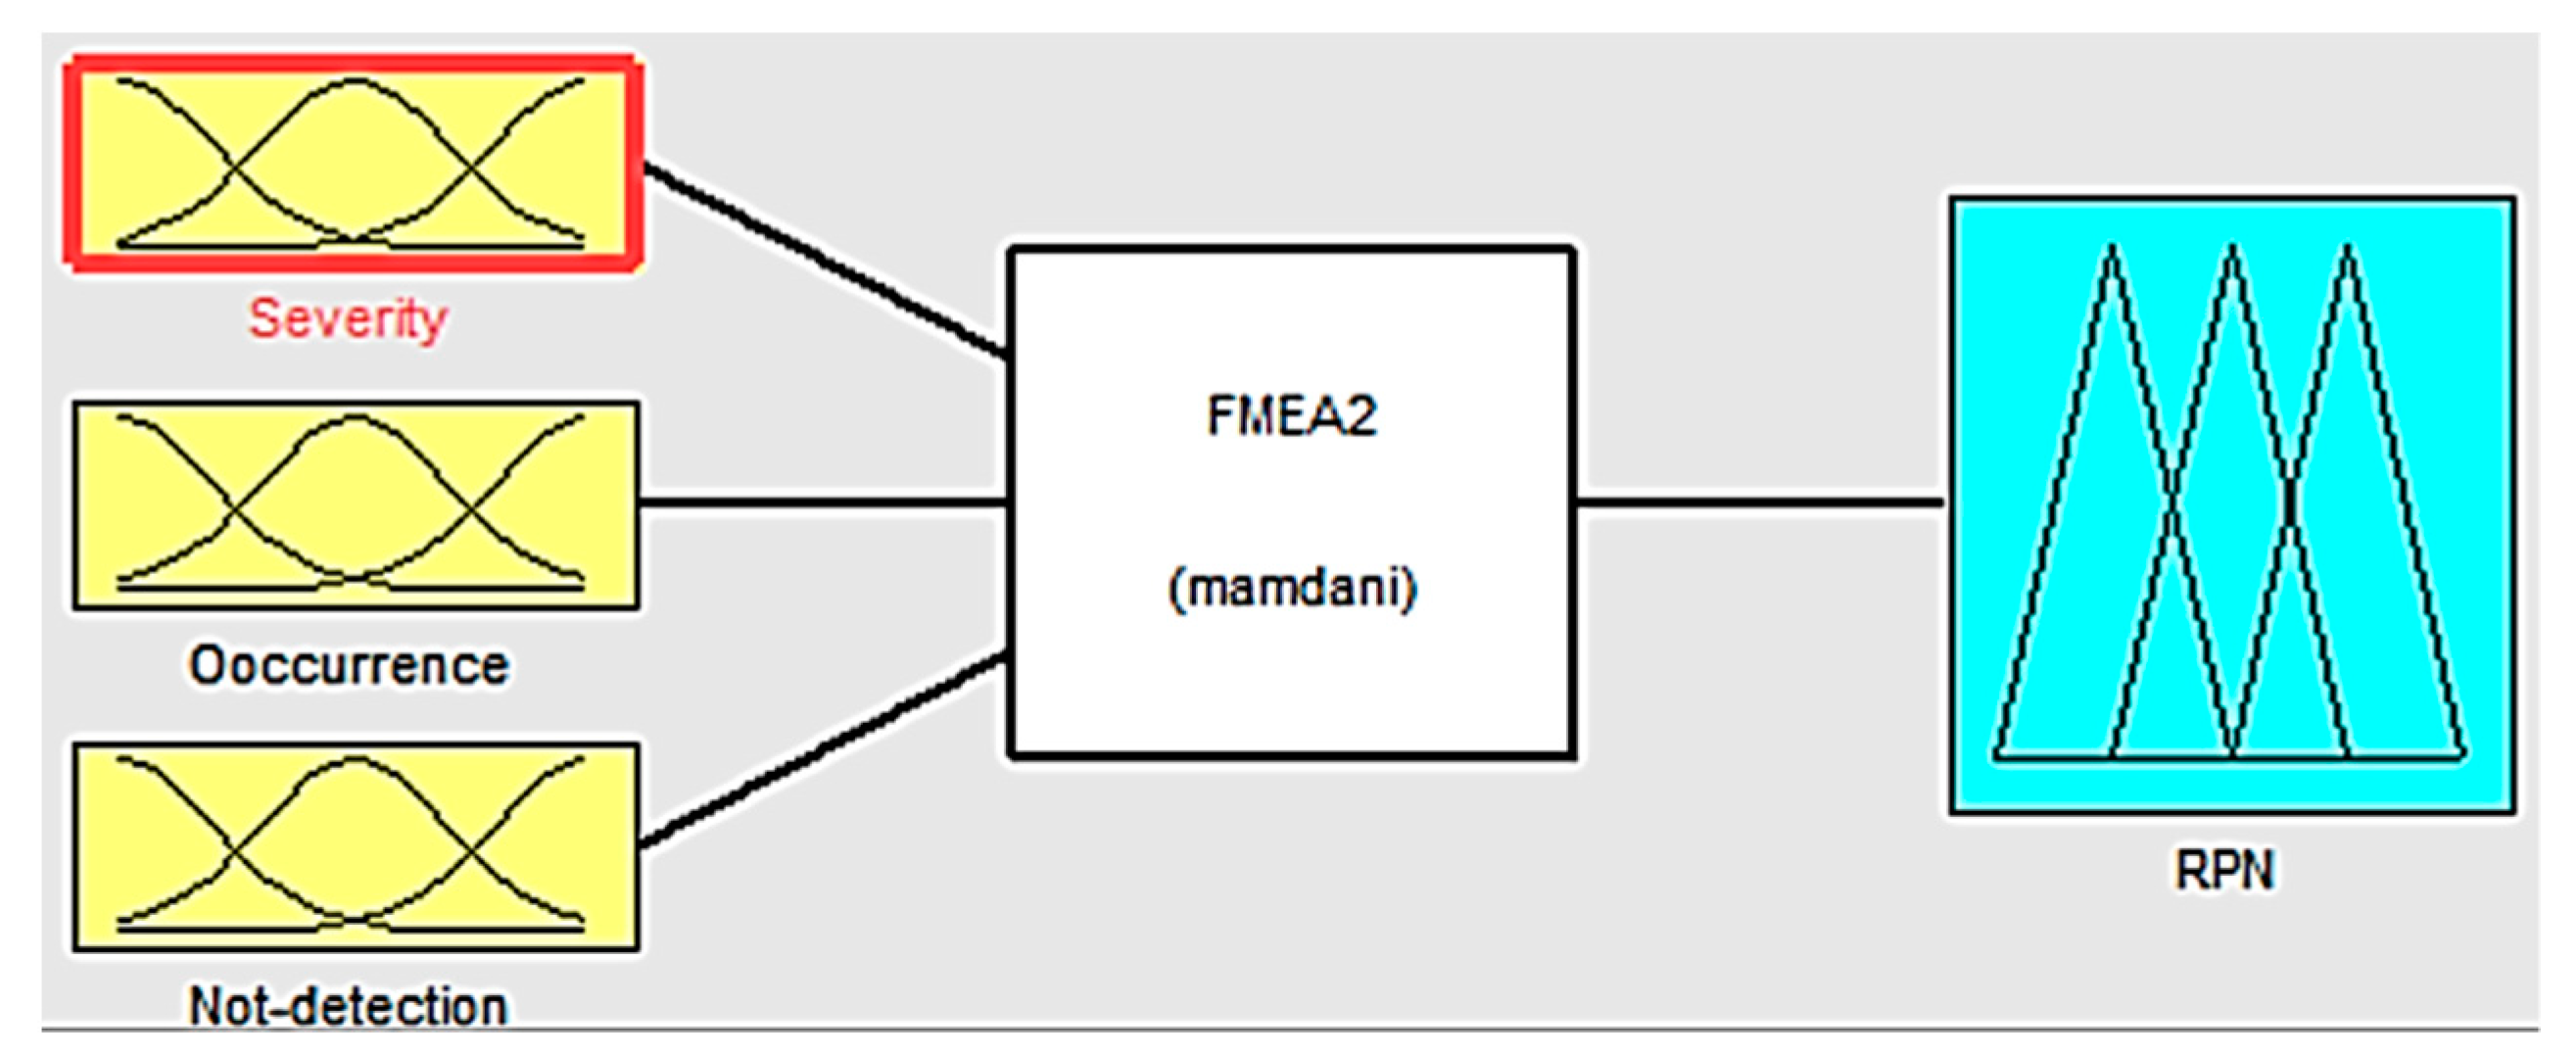
In this subsection, the fuzzy risk priority number for all failure modes is obtained. To achieve this, the numerical scales 1 to 10, as given in Table 2, are considered for all risk factors. The needed information was obtained from the FMEA expert team. These results are used to design the fuzzy logic system. To perform this the Mamdani fuzzy logic systems, as described in Section 2.2, are applied in the MATLAB software [52]. This design is shown in Figure 4.
In the first step, the occurrence, severity, and probability of detection as input variables and the RPN as output variables are defined in the form of fuzzy numbers. In the second, the fuzzy RPNs are created in the fuzzy logic system by matching them against the “If-Then” rules. The experts with enough experience and knowledge of the rolling stock are requested to define the rules. Considering 10 different statuses for the severity, occurrence, and the probability of detection of the risk factors, (10 × 10 × 10 =) 1000 rules are created.
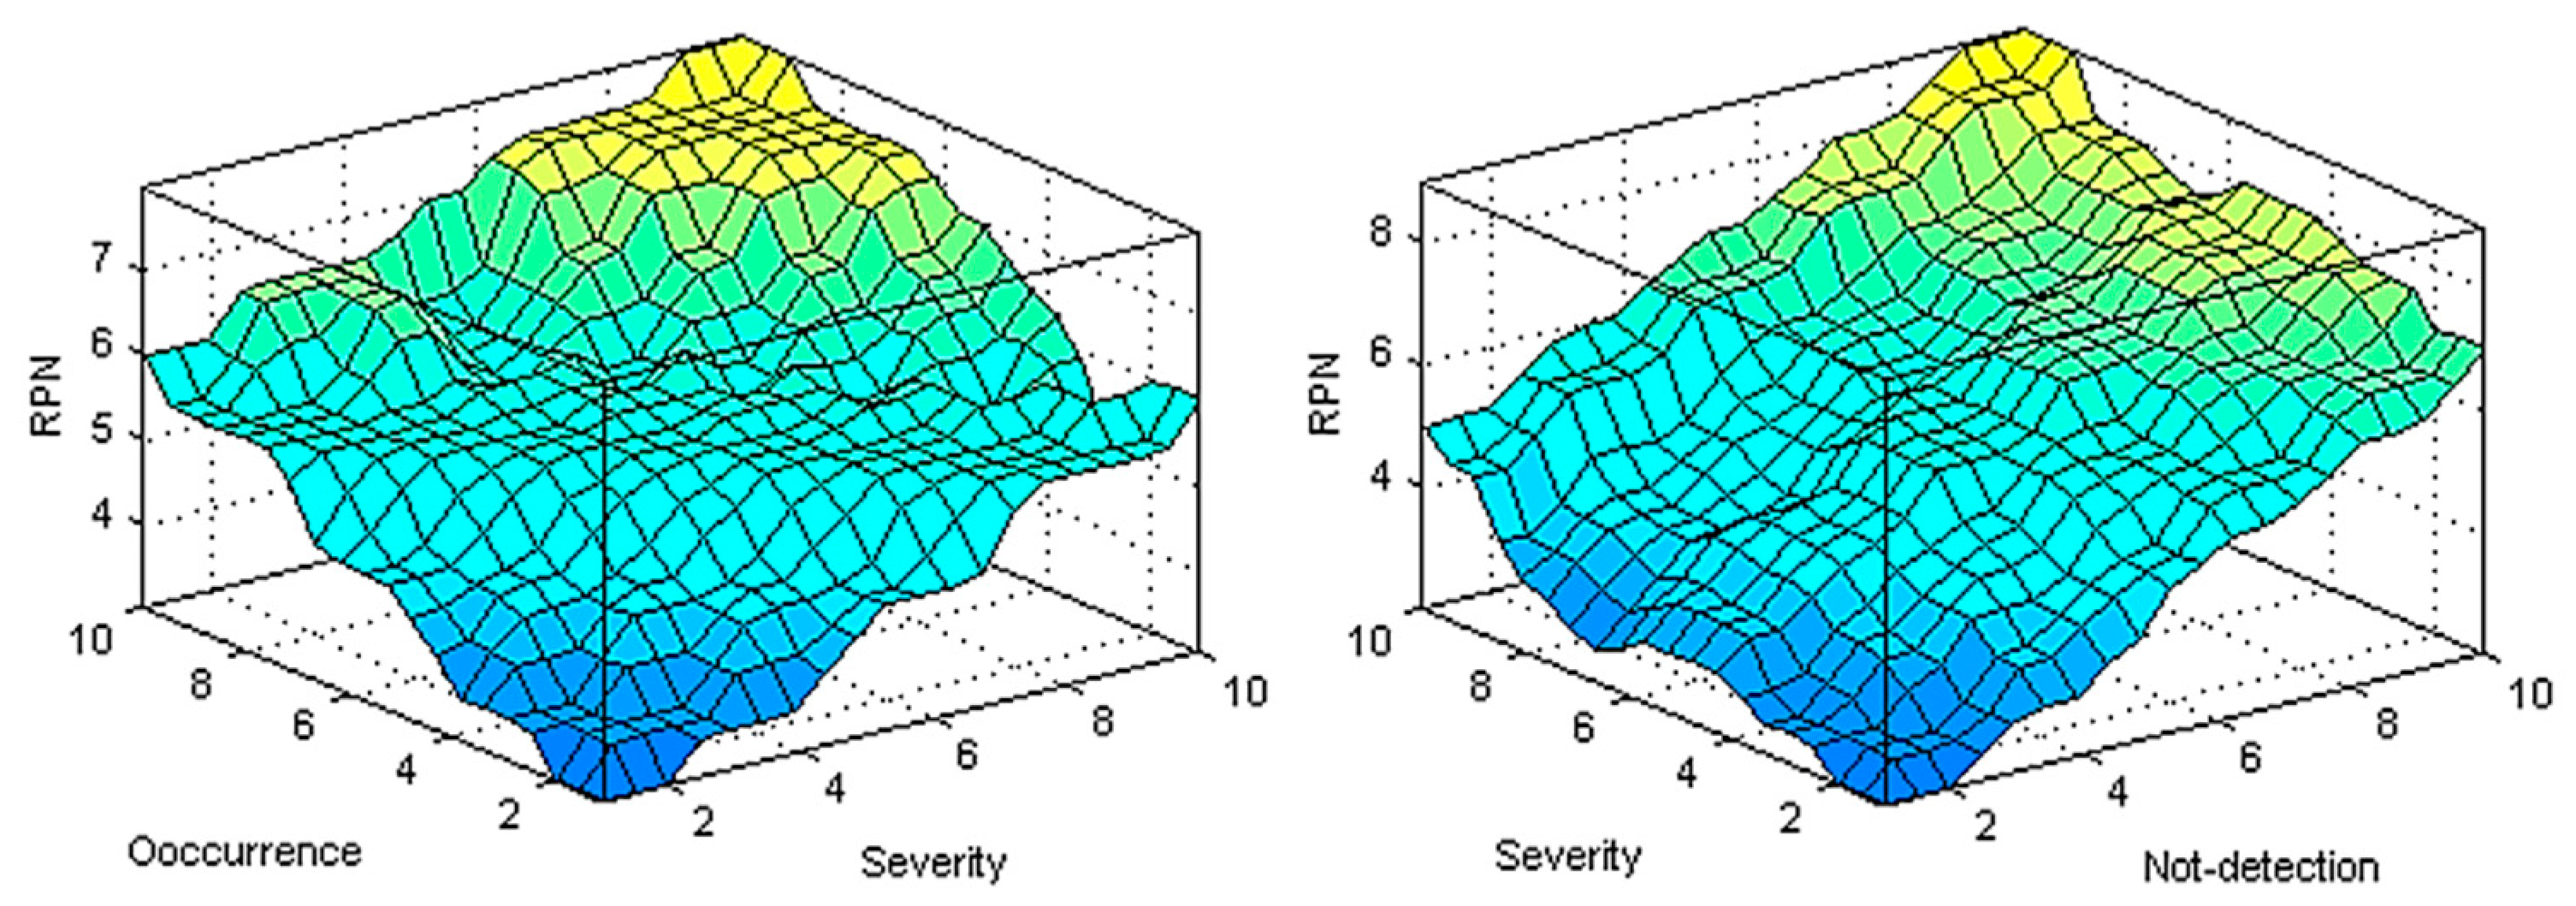
In the last step of the fuzzy logic inference, the center of area defuzzification algorithm was applied to create a crisp RPN value from the fuzzy results set. Considering the importance degree values, the overall risk priority numbers are obtained. Moreover, for a better comparison of the risk factor influence on the risk priority numbers, the results in the form of a 3D plot are given in Figure 5. This figure shows that how the risk factors and their combinations change the RPN values. It is concluded that all risk factors significantly change the risk priority numbers. As is seen, both severity and occurrence risk factors have approximately the same impact on the RPNs. That is because the slope change of the RPN-occurrence area is the same as the RPN-severity area. It can also be seen that the probability of detection of the failure modes in comparison to the severity has a greater impact on the RPNs. These results indicate that the failure risk is significantly affected by fault detectability. Therefore, application of the reliable fault detection tools reduces the probability of failure risks.
After calculating the fuzzy RPN, the overall fuzzy RPN was estimated by multiplying the importance measure of failure modes, obtained from FAHP, in the FRPNs for each failure mode. It is noted that for the defuzzification of the FRPNs, the center of the area was used and the results is given in Table 5.
Regarding Table 5, the hollow wear has the highest RPN value and then rolling-contact fatigue, overheated wheels, and the torsion of the wheelset axle, respectively are in the 2nd to 4th places that need to be maintained, effectively. Hollow wear of the wheel is one of the main damage types of wheels that contact geometry, increase the dynamic response between the wheel and the rail, and consequently result in the deterioration of the wheel rail. The statistical analysis for Kaunis wagons in 2020 shows that the hollow wear of wheels accounts for more than half of the total wheel damage incidents. It can be reduced by optimization of the vehicle suspension and track parameters and matching the wheel-rail profile. The rolling-contact fatigue is another failure mode of the ball and rolling element bearings that cause the surface pitting and spalling. This also can be strongly affected by the track geometry parameters such as the rail longitudinal level and rail alignment. Wear monitoring approaches that are direct or indirect ones can be applied for the wear measurements and finding irregularities characteristic. It is good to mention that the failure modes F6 (wheel diameter below the prescribed limit) and F13 (wheel disc broken) have the lowest risk number. Furthermore, a similar situation can also be found between failure modes F2 (high flange), F8 (wheel profile clearance), and F12 (wheelset axle crack).
4. Conclusions
In this study, FMEA together with the AHP method is used to prioritize the failure modes. The analysis was carried out using the fuzzy linguistic variables for all risk factors to reach fuzzy risk priority numbers. In the first step and after determining the most common failures, fuzzy AHP was used to calculate the importance measure of each failure mode. Then, the fuzzy FMEA based on the Mamdani fuzzy logic systems was applied to obtain risk priority numbers of failure modes. This method was used for the identification of undesired states of a mining rolling stock. The results of this study show that the hollow wear followed by the rolling-contact fatigue, overheated wheels, and the torsion of the wheelset axle is the most hazardous failure mode with the highest overall risk priority number. Since the proposed approach in this study obtains the risk number considering the weights of risk factors; the results are more accurate than the conventional RPN method. The results of this study are useful and help the equipment designer, engineers, operators, and also maintenance managers to have reliable equipment and knowledge about the railcars. This research opens a new window to determine hazardous failure modes according to their importance degree. It can also be extended for other complex and critical mining machinery and equipment such as trucks, shovels, and drilling equipment.
Author Contributions
M.J.R. initialized the idea, completed the methodology, and contributed to the design and implementation of the research. B.G. contributed also in the initialization of idea and methodology, performed the fieldwork, managed the whole process, and validated the results and findings. All authors have read and agreed to the published version of the manuscript.
Funding
This research received no external funding.
Institutional Review Board Statement
Not applicable.
Informed Consent Statement
Not applicable.
Data Availability Statement
Data for this study was obtained from Malmbana, LKAB, Sweden.
Acknowledgments
The authors would like to thank for the support of JVTC (Luleå Railway Research Center) and CAMM (Centre of Advanced Mining & Metallurgy) projects in this research work.
Conflicts of Interest
The authors declare no conflict of interest.
References
- Macioszek, E. Essential techniques for fastening loads in road transport. Sci. J. Sil. Univ. Technol. Ser. Transp. 2021, 110, 97–104. [Google Scholar]
- Andersson, N. Equipment for Rational Securing of Cargo on Railway Wagons (jvgRASLA). Swed. Agency Innov. Syst. Swed. VINNOVA Rep. 2004, 2004, 0–6. [Google Scholar]
- Macioszek, E. Oversize cargo transport in road transport-problems and issues. Sci. J. Sil. Univ. Technol. Ser. Transp. 2020, 108, 133–140. [Google Scholar] [CrossRef]
- Shafiee, M.; Enjema, E.; Kolios, A. An integrated FTA-FMEA model for risk analysis of engineering systems: A case study of subsea blowout preventers. Appl. Sci. 2019, 9, 1192. [Google Scholar] [CrossRef] [Green Version]
- Shaker, F.; Shahin, A.; Jahanyan, S. Developing a two-phase QFD for improving FMEA: An integrative approach. Int. J. Qual. Reliab. Manag. 2019, 8, 1454–1474. [Google Scholar] [CrossRef]
- Braaksma, A.J.; Klingenberg, W.; Veldman, J. Failure mode and effect analysis in asset maintenance: A multiple case study in the process industry. Int. J. Prod. Res. 2013, 51, 1055–1071. [Google Scholar] [CrossRef]
- Renjith, V.R.; Kumar, P.H.; Madhavan, D. Fuzzy FMECA (failure mode effect and criticality analysis) of LNG storage facility. J. Loss Prev. Process Ind. 2018, 56, 537–547. [Google Scholar] [CrossRef]
- Rastayesh, S.; Bahrebar, S.; Blaabjerg, F.; Zhou, D.; Wang, H.; Sørensen, J.D. A System Engineering Approach Using FMEA and Bayesian Network for Risk Analysis—A Case Study. Sustainability 2020, 12, 77. [Google Scholar] [CrossRef] [Green Version]
- Molhanec, M.; Zhuravskaya, O.; Povolotskaya, E.; Tarba, L. The ontology based FMEA of lead free soldering process. In Proceedings of the 2011 34th International Spring Seminar on Electronics Technology (ISSE), Tratanska Lomnica, Slovakia, 11–15 May 2011; pp. 267–273. [Google Scholar]
- Frunza, G.; Rusu, C.G.; Pop, I.M. Study Regarding the application of the FMEA (Failure Mode and Effect analysis) Method to Improve Food Safety in Food Services. Sci. Pap. 2020, 63, 360–369. [Google Scholar]
- Chanamool, N.; Naenna, T. Fuzzy FMEA application to improve decision-making process in an emergency department. Appl. Soft Comput. 2016, 43, 441–453. [Google Scholar] [CrossRef]
- Chin, K.S.; Chan, A.; Yang, J.B. Development of a fuzzy FMEA based product design system. Int. J. Adv. Manuf. Technol. 2008, 36, 633–649. [Google Scholar] [CrossRef]
- Dinmohammadi, F.; Alkali, B.; Shafiee, M.; Bérenguer, C.; Labib, A. Risk evaluation of railway rolling stock failures using FMECA technique: A case study of passenger door system. Urban Rail Transit 2016, 2, 128–145. [Google Scholar] [CrossRef] [Green Version]
- Rezvanizaniani, S.M.; Barabady, J.; Valibeigloo, M.; Asghari, M.; Kumar, U. Reliability Analysis of the Rolling Stock Industry: A Case Study. Int. J. Perform. Eng. 2009, 5, 167–175. [Google Scholar]
- Teshome, M.M. Modelling and Analysis of Reliability and Long Run Availability of a Fleet of Rolling Stock. Master’s Thesis, University of Twente, Enschede, The Netherlands, 2012. [Google Scholar]
- Dinmohammadi, F. A risk-based modelling approach to maintenance optimization of railway rolling stock: A case study of pantograph system. J. Qual. Maint. Eng. 2019, 25, 272–293. [Google Scholar] [CrossRef]
- Conradie, P.D.F.; Fourie, C.J.; Vlok, P.J.; Treurnicht, N.F. Quantifying system reliability in rail transportation in an ageing fleet environment. S. Afr. J. Ind. Eng. 2015, 26, 128–142. [Google Scholar] [CrossRef] [Green Version]
- Lin, J.; Asplund, M.; Parida, A. Reliability analysis for degradation of locomotive wheels using parametric Bayesian approach. Qual. Reliab. Eng. Int. 2014, 30, 657–667. [Google Scholar] [CrossRef] [Green Version]
- Babeł, M.; Szkoda, M. Diesel locomotive efficiency and reliability improvement as a result of power unit load control system modernisation. Eksploat. I Niezawodn. Maint. Reliab. 2016, 18, 38–49. [Google Scholar] [CrossRef]
- Cai, G.; Wang, Y.; Song, Q.; Yang, C. RAMS Analysis of Train Air Braking System Based on GO-Bayes Method and Big Data Platform. Complexity 2018, 2018. [Google Scholar] [CrossRef]
- Appoh, F.; Yunusa-Kaltungo, A.; Sinha, J.K. Hybrid Dynamic Probability-Based Modeling Technique for Rolling Stock Failure Analysis. IEEE Access 2020, 8, 182376–182390. [Google Scholar] [CrossRef]
- Petrović, D.V.; Tanasijević, M.; Stojadinović, S.; Ivaz, J.; Stojković, P. Fuzzy Model for Risk Assessment of Machinery Failures. Symmetry 2020, 12, 525. [Google Scholar] [CrossRef] [Green Version]
- Ghodrati, B.; Rahimdel, M.J.; Vahed, A.T. Fuzzy risk prioritization of the failure modes in rolling stocks. In Proceedings of the 2018 IEEE International Conference on Industrial Engineering and Engineering Management (IEEM), Bangkok, Thailand, 16–19 December 2018; pp. 108–112. [Google Scholar]
- Rahimdel, M.J.; Mirzaei, M. Prioritization of practical solutions for the vibrational health risk reduction of mining trucks using fuzzy decision making. Arch. Environ. Occup. Health 2020, 75, 112–126. [Google Scholar] [CrossRef]
- Liu, H.; Cocea, M. Fuzzy rule based systems for interpretable sentiment analysis. In Proceedings of the 2017 Ninth International Conference on Advanced Computational Intelligence (ICACI), Doha, Qatar, 4–6 February 2017; pp. 129–136. [Google Scholar]
- Saaty, T.L. The analytic hierarchy process: Planning, priority setting. In Resources Allocation; McGraw: New York, NY, USA, 1980. [Google Scholar]
- Wang, Y.; Xu, L.; Solangi, Y.A. Strategic renewable energy resources selection for Pakistan: Based on SWOT-Fuzzy AHP approach. Sustain. Cities Soc. 2020, 52, 101861. [Google Scholar] [CrossRef]
- Zadeh, L.A. Fuzzy logic—A personal perspective. Fuzzy Sets Syst. 2015, 281, 4–20. [Google Scholar] [CrossRef]
- Liu, Y.; Eckert, C.M.; Earl, C. A review of fuzzy AHP methods for decision-making with subjective judgements. Expert Syst. Appl. 2020, 161, 113738. [Google Scholar] [CrossRef]
- Chang, D.Y. Applications of the extent analysis method on fuzzy AHP. Eur. J. Oper. Res. 1996, 95, 649–655. [Google Scholar]
- Bogdanovská, G.; Molnar, V.; Fedorko, G. Failure analysis of condensing units for refrigerators with refrigerant R134a, R404A. Int. J. Refrig. 2019, 100, 208–219. [Google Scholar] [CrossRef]
- Mutlu, N.G.; Altuntas, S. Hazard and risk analysis for ring spinning yarn production process by integrated FTA-FMEA approach. Tekst. Konfeksiyon 2019, 29, 208–218. [Google Scholar] [CrossRef] [Green Version]
- Kang, J.; Sun, L.; Sun, H.; Wu, C. Risk assessment of floating offshore wind turbine based on correlation-FMEA. Ocean Eng. 2017, 129, 382–388. [Google Scholar] [CrossRef]
- Ahn, J.; Noh, Y.; Park, S.H.; Choi, B.I.; Chang, D. Fuzzy-based failure mode and effect analysis (FMEA) of a hybrid molten carbonate fuel cell (MCFC) and gas turbine system for marine propulsion. J. Power Source 2017, 364, 226–233. [Google Scholar] [CrossRef]
- Zhou, X.; Tang, Y. Modeling and fusing the uncertainty of FMEA experts using an entropy-like measure with an application in fault evaluation of aircraft turbine rotor blades. Entropy 2018, 20, 864. [Google Scholar] [CrossRef] [Green Version]
- Yazdi, M.; Daneshvar, S.; Setareh, H. An extension to fuzzy developed failure mode and effects analysis (FDFMEA) application for aircraft landing system. Saf. Sci. 2017, 98, 113–123. [Google Scholar] [CrossRef]
- Jain, K. Use of failure mode effect analysis (FMEA) to improve medication management process. Int. J. Health Care Qual. Assur. 2017, 30, 175–186. [Google Scholar] [CrossRef] [PubMed]
- Liu, H.C. FMEA using cluster analysis and prospect theory and its application to blood transfusion. In Improved FMEA Methods for Proactive Healthcare Risk Analysis; Springer: Singapore, 2019; pp. 73–96. [Google Scholar]
- Xu, A.Y.; Bhatnagar, J.; Bednarz, G.; Flickinger, J.; Arai, Y.; Vacsulka, J.; Feng, W.; Monaco, E.; Niranjan, A.; Lunsford, L.D.; et al. Failure modes and effects analysis (FMEA) for Gamma knife radiosurgery. J. Appl. Clin. Med. Phys. 2017, 18, 152–168. [Google Scholar] [CrossRef]
- Held, M.; Brönnimann, R. Safe cell, safe battery? Battery fire investigation using FMEA, FTA and practical experiments. Microelectron. Reliab. 2016, 64, 705–710. [Google Scholar] [CrossRef]
- Ryan, J.W.; Murray, A.S.; Gilligan, P.J.; Bisset, J.M.; Nolan, C.; Doyle, A.; Emerson, B.; Galvin, J.M.; Murray, J.G. MRI safety management in patients with cardiac implantable electronic devices: Utilizing failure mode and effects analysis for risk optimization. Int. J. Qual. Health Care 2020, 32, 431–437. [Google Scholar] [CrossRef]
- Shi, J.; He, Q.; Wang, Z. Integrated Stateflow-based simulation modelling and testability evaluation for electronic built-in-test (BIT) systems. Reliab. Eng. Syst. Saf. 2020, 202, 107066. [Google Scholar] [CrossRef]
- Sarkar, D.; Singh, M. Risk analysis by integrated fuzzy expected value method and fuzzy failure mode and effect analysis for an elevated metro rail project of Ahmedabad, India. Int. J. Constr. Manag. 2020. [Google Scholar] [CrossRef] [Green Version]
- Kumar, M.B.; Parameshwaran, R. A comprehensive model to prioritise lean tools for manufacturing industries: A fuzzy FMEA, AHP and QFD-based approach. Int. J. Serv. Oper. Manag. 2020, 37, 170–196. [Google Scholar] [CrossRef]
- Rezaee, M.J.; Yousefi, S.; Eshkevari, M.; Valipour, M.; Saberi, M. Risk analysis of health, safety and environment in chemical industry integrating linguistic FMEA, fuzzy inference system and fuzzy DEA. Stoch. Environ. Res. Risk Assess 2020, 34, 201–218. [Google Scholar] [CrossRef]
- Bowles, J.B.; Pelaez, C.E. Fuzzy logic prioritization of failures in a system failure mode, effects and criticality analysis. Reliab. Eng. Syst. Saf. 1995, 50, 203–213. [Google Scholar] [CrossRef]
- Iancu, I. A Mamdani type fuzzy logic controller. In Fuzzy Logic-Controls, Concepts, Theories and Applications; IntechOpen Limited: London, UK, 2012; pp. 325–350. [Google Scholar]
- Dhimish, M.; Holmes, V.; Mehrdadi, B.; Dales, M. Comparing Mamdani Sugeno fuzzy logic and RBF ANN network for PV fault detection. Renew. Energy 2018, 117, 257–274. [Google Scholar] [CrossRef] [Green Version]
- Anes, V.; Henriques, E.; Freitas, M.; Reis, L. A new risk prioritization model for failure mode and effects analysis. Qual. Reliab. Eng. Int. 2018, 34, 516–528. [Google Scholar] [CrossRef]
- Stephan, T.; Sharma, K.; Shankar, A.; Punitha, S.; Varadarajan, V.; Liu, P. Fuzzy-logic-inspired zone-based clustering algorithm for wireless sensor networks. Int. J. Fuzzy Syst. 2020, 23, 506–517. [Google Scholar] [CrossRef]
- Kaunis Iron Mining Webpage. Available online: https://www.kaunisiron.se/ (accessed on 7 March 2021).
- Johanyák, Z.C.; Tikk, D.; Kovács, S.; Wong, K.W. Fuzzy rule interpolation Matlab toolbox-FRI toolbox. In Proceedings of the IEEE International Conference on Fuzzy Systems, Vancouver, BC, Canada, 16–21 July 2006; pp. 351–357. [Google Scholar]
Figure 1.
Process of the proposed FMEA analysis.

Figure 2.
Location of the Kaunis Iron Ore Mine [51].
Figure 2.
Location of the Kaunis Iron Ore Mine [51].

Figure 3.
Importance degree for each failure mode.

Figure 4.
Mamdani fuzzy logic systems for FMEA process in the MATLAB toolbox.

Figure 5.
Surface plot for the risk factor against RPN.


| Linguistic Scale for Importance | Fuzzy Number | Membership Function |
|---|---|---|
| Equally importance | 1 | (1,1,2) |
| Intermediate level between 1 and 3 | 2 | (1,2,3) |
| Moderately importance | 3 | (2,3,4) |
| Intermediate level between 3 and 5 | 4 | (3,4,5) |
| Essential or strong importance | 5 | (4,5,6) |
| Intermediate level between 5 and 7 | 6 | (5,6,7) |
| Very strong importance | 7 | (6,7,8) |
| Intermediate level between 7 and 9 | 8 | (7,8,9) |
| Extremely importance | 9 | (8,9,10) |
Table 2.
Linguistic variable with their corresponding fuzzy number for risk factors.
| Severity (S) | Occurrence (O) | Probability of Detection (D) | RPN | Fuzzy Number | Membership Function |
|---|---|---|---|---|---|
| None (N) | Almost never (AN) | Almost certain (AC) | None (N) | 1 | (1,1,2) |
| Very slight (VS) | Remote (R) | Very high (VH) | Very low (VL) | 2 | (1,2,3) |
| Slight (SLT) | Slight (SLT) | High (H) | Low (L) | 3 | (2,3,4) |
| Very low (VL) | Low (L) | Moderately high (MH) | High low (HL) | 4 | (3,4,5) |
| Low (L) | Moderately low (ML) | Moderate (M) | Low moderate (LM) | 5 | (4,5,6) |
| Moderate (M) | Moderate (M) | Low (L) | Moderate (M) | 6 | (5,6,7) |
| High (H) | Moderately high (MH) | Very low (VL) | High moderate (HM) | 7 | (6,7,8) |
| Very high (VL) | High (H) | Remote (R) | Low high (LH) | 8 | (7,8,9) |
| Serious (SR) | Very high (VH) | Very remote (VR) | High (H) | 9 | (8,9,10) |
| Hazardous (HAZ) | Almost certain (AC) | Almost impossible (AI) | Very high (VH) | 10 | (9,10,10) |
Table 3.
The failure mode for the wheelset component of the studied rolling stocks.
| Component | Failure Mode | Code |
|---|---|---|
| Wheelset axle | Torsion of the wheelset axle | F1 |
| Wheel flange | Flange height over the prescribed limit | F2 |
| Wheel flange | Flange thickness below the prescribed limit | F3 |
| Wheel tire | Overheated wheels | F4 |
| Wheel tire | Wheel flat | F5 |
| Wheel tire | Wheel diameter below the prescribed limit | F6 |
| Roller bearing | Rolling-contact fatigue | F7 |
| Wheel tire | Wheel profile clearance | F8 |
| Wheel tire | Scaled wheel (skidding or spalling of the wheel tread) | F9 |
| Wheelset axle | Overheated axle rolling bearing | F10 |
| Bearing housing | Grease leakage from the roll bearing | F11 |
| Wheelset axle | Wheelset axle crack | F12 |
| Wheel disc | Wheel disc broken | F13 |
| Wheel tire | Wheel hollow wear | F14 |
Table 4.
The triangular fuzzy judgment matrix.
| F1 | F2 | … | F13 | F14 | |
|---|---|---|---|---|---|
| F1 | (1,1,1) | (2.667,7.000,10) | . | (1.600,2.947,5.0) | (2.667,6.222,10) |
| F2 | (0.100,0.143,0.375) | (1,1,1) | . | (0.200,0.421,1.5) | (3.000,0.889,3.0) |
| F3 | (0.250,0.388,0.500) | (0.2,0.388,0.625) | . | (0.400,1.145,2.5) | (5.000,2.417,5.0) |
| F4 | (0.800,1.050,1.250) | (2.667,7.350,10) | . | (1.600,3.095,5.0) | (2.667,6.533,10) |
| . | . | . | . | . | . |
| . | . | . | . | . | . |
| . | . | . | . | . | . |
| F11 | (0.200,0.357,0.625) | (0.667,2.500,5) | . | (0.667,2.000,5) | (0.200,0.357,0.625) |
| F12 | (0.100,0.286,0.375) | (0.333,2.000,3) | . | (0.333,1.600,3) | (0.100,0.286,0.375) |
| F13 | (0.100,0.179,0.375) | (0.333,1.250,3) | . | (1,1,1) | (0.100,0.179,0.375) |
| F14 | (0.800,1.000,1.250) | (2.667,7.000,10) | . | (2.667,5.60,10) | (1,1,1) |
Table 5.
Risk factors and the fuzzy RPN for the failure modes.
| Failure Mode | FRPN | Weight | Overall RPN | Rank |
|---|---|---|---|---|
| F1 | 7.54 | 0.099 | 0.745 | 4 |
| F2 | 5.53 | 0.015 | 0.085 | 12 |
| F3 | 5.53 | 0.054 | 0.299 | 7 |
| F4 | 5.47 | 0.159 | 0.870 | 3 |
| F5 | 2.42 | 0.071 | 0.173 | 9 |
| F6 | 3.5 | 0.016 | 0.055 | 13 |
| F7 | 6.54 | 0.136 | 0.887 | 2 |
| F8 | 5.53 | 0.016 | 0.090 | 10 |
| F9 | 5.53 | 0.099 | 0.547 | 5 |
| F10 | 2.48 | 0.073 | 0.182 | 8 |
| F11 | 4.46 | 0.073 | 0.324 | 6 |
| F12 | 4.9 | 0.018 | 0.089 | 11 |
| F13 | 2.47 | 0.016 | 0.039 | 14 |
| F14 | 8.43 | 0.155 | 1.305 | 1 |
Publisher’s Note: MDPI stays neutral with regard to jurisdictional claims in published maps and institutional affiliations. |
© 2021 by the authors. Licensee MDPI, Basel, Switzerland. This article is an open access article distributed under the terms and conditions of the Creative Commons Attribution (CC BY) license (https://creativecommons.org/licenses/by/4.0/).
Share and Cite
MDPI and ACS Style
Rahimdel, M.J.; Ghodrati, B. Risk Prioritization for Failure Modes in Mining Railcars. Sustainability 2021, 13, 6195. https://0-doi-org.brum.beds.ac.uk/10.3390/su13116195
AMA Style
Rahimdel MJ, Ghodrati B. Risk Prioritization for Failure Modes in Mining Railcars. Sustainability. 2021; 13(11):6195. https://0-doi-org.brum.beds.ac.uk/10.3390/su13116195
Chicago/Turabian StyleRahimdel, Mohammad Javad, and Behzad Ghodrati. 2021. "Risk Prioritization for Failure Modes in Mining Railcars" Sustainability 13, no. 11: 6195. https://0-doi-org.brum.beds.ac.uk/10.3390/su13116195
Note that from the first issue of 2016, this journal uses article numbers instead of page numbers. See further details here.