An Evaluation of MODIS-Retrieved Aerosol Optical Depth over AERONET Sites in Alaska


Civil & Environmental Engineering, University of Alaska Fairbanks, Fairbanks, AK 99701, USA
*
Author to whom correspondence should be addressed.
Remote Sens. 2018, 10(9), 1384; https://0-doi-org.brum.beds.ac.uk/10.3390/rs10091384
Submission received: 15 August 2018
/
Revised: 23 August 2018
/
Accepted: 24 August 2018
/
Published: 31 August 2018
(This article belongs to the Special Issue Remote Sensing of Air Quality)
Abstract
:The air quality monitoring network in Alaska is currently limited to ground-based observations in urban areas and national parks, leaving a large proportion of the state unmonitored. The use of Moderate Resolution Imaging Spectroradiometer MODIS aerosol optical depth (AOD) to estimate ground-level particulate pollution concentrations has been successfully demonstrated around the world and could potentially be used in Alaska. In this work, MODIS AOD measurements at 550 nm were validated against AOD derived from two ground-based Aerosol Robotic Network (AERONET) sunphotometers in Alaska, located at Utqiagvik (previously known as Barrow) and Bonanza Creek, to determine if MODIS AOD from the Terra and Aqua satellites could be used to estimate ground-level particulate pollution concentrations. The MODIS AOD was obtained from MODIS collection 6 using the dark target Land and Ocean algorithms from years 2000 to 2014. MODIS data could only be obtained between the months of April and October; therefore, it was only evaluated for those months. Individual and combined Terra and Aqua MODIS data were considered. The results showed that MODIS collection 6 products at 10-km resolution for Terra and Aqua combined are not valid over land but are valid over the ocean. Note that the individual Terra and Aqua MODIS collection 6 AOD products at 10-km resolution are valid over land individually but not when combined. Results also suggest the MODIS collection 6 AOD products at 3-km resolution are valid over land and ocean and perform better over land than the 10-km product. These findings indicate that MODIS collection 6 AOD products can be used quantitatively in air quality applications in Alaska during the summer months.
1. Introduction
Exposure to fine particulate matter (PM) air pollution adversely affects cardiopulmonary health and is associated with increased morbidity and premature mortality [1,2]. Fine particulate pollution consists of particulates smaller than 2.5 µm (PM2.5) in aerodynamic diameter. A risk analysis of the public health impacts of exposure to ambient PM2.5 estimated that 130,000 PM2.5-related deaths in the continental United States would result from PM2.5 concentration levels in 2005 [3]. Alaska is not immune to the effects of PM pollution. Between the years of 2003 and 2008 in Fairbanks, AK, each 10 µg/m3 increase in the mean 24-h PM2.5 was associated with a 6% to 7% increase in the risk for cerebrovascular disease-coded and respiratory tract-coded hospital visits the following day [4]. Air quality monitoring is essential for monitoring exposure, determining sources of pollutants, and providing air quality alerts to the public [5].
The air quality monitoring (AQM) network in Alaska is currently limited to urban areas (Fairbanks, Palmer, Anchorage, Juneau) and national parks. Figure 1 shows a map of the air quality index and monitoring network used to provide current air quality to the public by AirNow.gov [6].
Moderate Resolution Imaging Spectroradiometer (MODIS) derived aerosol optical depth (AOD) has been used successfully around the world to estimate ground-level PM air pollution [7,8,9,10,11], and it could potentially be used to estimate ground-level particulate pollution in Alaska and thus enhance the spatial coverage to fill the gaps beyond what is covered by the state’s AQM network.
MODIS currently acquires data across 36 spectral bands, and it has been on-board the Terra and Aqua satellites since 1999 and 2002, respectively. The MODIS Collection 6 (C6) aerosol algorithm consists of three separate algorithms that are used to retrieve AOD from MODIS-observed spectral reflectance: the dark target (DT) ocean algorithm, the DT land algorithm, and the Deep Blue (DB) algorithm [12,13,14,15,16]. The DT ocean algorithm retrieves AOD over the ocean across seven wavelengths (470, 550, 660, 870, 1200, and 2100 nm) [12,17]. The DT land algorithm retrieves AOD over vegetated and dark-soiled land in three visible wavelengths (470 nm, 550 nm, and 660 nm) [12,17]. Both the DT algorithm products are available at 10-km and 3-km resolution.
MODIS collection 6 AOD has been validated at 550 nm globally for Aqua at 10-km resolution, but not for Terra at 3-km resolution; moreover, none of the studies have considered Alaska specifically [12,13,18,19]. Therefore, to determine whether MODIS AOD can be used to estimate ground-level particulate pollution in Alaska, the 10-km and 3-km resolution products must first be validated against ground-based sunphotometers to determine if there is an agreement between MODIS AOD and AERONET AOD in Alaska. Thus, the overarching goal of this study is to determine if MODIS measurements of aerosol optical depth reflect the actual conditions based on ground-based measurements of aerosol optical depth. If at least 67% of the collocated ground-based and satellite-based measurements are highly correlated (Pearson correlation coefficient greater than 0.7) and within the estimated uncertainty determined from global validation studies (Table 1) [12], then it is indicative that MODIS AOD measurements reflect actual ground conditions. If the relationship is weak to non-existent, MODIS AOD does not reflect surface AOD [7,20,21,22].
2. Validation Methods
2.1. AERONET AOD (τA)
The Aerosol Robotic Network (AERONET) (http://aeronet.gsfc.nasa.gov) is a ground-based global network of sunphotometers that measure aerosol properties using measurements of solar direct and diffuse radiances [23,24]. Measurements are obtained and recorded by AERONET sunphotometers at intervals of approximately 3 min. AOD is determined from direct measurements of solar radiance using the Beer-Lambert-Bouguer equation [19,24]. Due to the low level of uncertainty of AERONET AOD measurements (0.01 to 0.02), AERONET data is commonly used for the validation of satellite-derived MODIS AOD products [19,24,25,26,27].
The Alaska AERONET sites of Bonanza Creek and Utqiagvik (previously known as Barrow) were used for the validation of the MODIS AOD product over Alaska. Table 2 lists the locations of the two sites. The sunphotometers in Utqiagvik (Barrow) and Bonanza Creek measure direct solar radiance. The AERONET measurements are then used to determine AOD at the following wavelengths: 340, 380, 440, 500, 675, 870, and 1020 nm. The AERONET level 2.0 version 2.0 (cloud-screened and quality-assured) dataset was used to interpolate the AOD at 550 nm in the Multi-sensor Aerosol Products Sampling System (MAPSS) [23]. MAPSS is a framework that collects samples and generates the spatial statistics of various satellites (e.g., MODIS) over AERONET sites and other locations of interest and integrates them with ground-based measurements to facilitate validation [23]. Interpolated AOD at 550 nm, available via the MAPSS between the years 2000 and 2014, was used in this study. The AOD is interpolated using a quadratic fit on a log-log scale [23,28].
2.2. MODIS AOD (τM)
The MODIS C6 DT products for land and ocean provide AOD with 10-km and 3-km spatial resolutions at nadir at a wavelength of 550 nm at both the Bonanza Creek and Utqiagvik AERONET sites [12,23]. The MODIS dark target land algorithm was used to determine AOD over the Bonanza Creek site, and the MODIS dark target ocean algorithm was used to determine AOD over the Utqiagvik site as little to no data existed over land for the Utqiagvik site. Terra AOD with mode quality assurance (QA) values of 3 (highest quality) of pixels within the collocation area and Aqua AOD with QA values of 3 were used for the validation of the DT land algorithm-derived MODIS AOD. Terra AOD with mode QA values greater than 0 within the collocation area and for Aqua AOD with QA values greater than 0 were used for the validation of the DT ocean algorithm-derived MODIS AOD. Previous validation studies have also used MODIS AOD with QA of 3 over land and QA greater than 0 over the ocean [12,19,25,26,28]. AOD data was obtained from Terra between the years 2000 and 2014 and from Aqua between the years 2002 and 2014. Table 1 lists the error envelope (EE) for each satellite and the dark target land and ocean algorithms derived from global validation studies for collection 6 [12,18,26,29]. The EE was computed relative to AERONET 550 nm AOD (τA).
2.3. Collocation
Spatially and temporally collocated MODIS and AERONET AOD measurements were obtained from the MAPSS. In MAPSS, AERONET AOD measurements taken within 30 min before or after the satellite overpass time were considered temporally collocated with the MODIS measurements. This was consistent with the previously described methods of temporal collocation [19,23,25]. MODIS pixels in MAPSS were sampled if the distance between the AERONET site and the MODIS pixels did not exceed 27.5 km [23]. Terra AOD was used only if the mode QA of the collocated product was 3, and Aqua AOD was used only for products with QA of 3. In MAPPS, the QA of 3 could only be specified for Aqua and not Terra at the time of the analysis; thus, Terra AOD was selected based on a mode of QA 3. The minimum number of collocated AERONET and MODIS pixels was set as one to increase the number of coincidences as described in the validation study by Sherman et al. [19].
2.4. Analysis
The validation study was performed using spatially and temporally collocated AOD from AERONET and MODIS (Terra and Aqua) obtained from MAPSS. AERONET and MODIS AOD were plotted against each other with MODIS AOD on the y-axis and AERONET AOD on the x-axis. Linear regressions (MODIS_AOD = AERONET_AOD*m + b) were calculated using ordinary least squares (OLS) for all AOD, for AERONET AOD less than 0.15, and for AERONET AOD greater than 0.15. The value of 0.15 was selected, because lower values of AOD are more susceptible to sensor uncertainties [25,26]. Previous studies found that ordinary least squares could be used to calculate statistically significant coefficients but could not be used to calculate standard errors when the residuals were heteroscedastic; therefore, heteroscedasticity consistent errors were used to avoid incorrect interpretation of the data when heteroscedasticity (non-constant variance of errors) was present [30]. The residuals were tested for heteroscedasticity (non-constant variance) using White’s test for heteroscedasticity. If the residuals were heteroscedastic, standard errors, significance tests, and confidence intervals were corrected using a heteroscedasticity consistent covariance matrix (HCCM) referred to as type 3 heteroscedasticity consistent (HC3) at a significance level of 0.05 [30]. If the residuals were not heteroscedastic, the standard errors calculated using OLS regression were used in the analysis.
The error envelopes (EE) for the Terra 10-km land, 3-km land, and 3-km ocean products were assumed to be equal to those of Aqua [12,18]. Root mean square error (RMSE) was calculated using Equation (1), in which τM is the MODIS AOD, τA is the AERONET AOD, and N was the number of collocations.
The median and mean bias were also calculated based on the difference between MODIS AOD and the AERONET AOD. The fraction of data within EE was also calculated as done in similar studies [19,26]. The data validity was evaluated based on the following three criteria.
- Criterion 1: The slopes of the linear regressions of MODIS AOD versus AERONET AOD for AOD less than 0.15 and for AERONET AOD greater than 0.15 cannot be statistically different.
- Criterion 2: MODIS AOD and AERONET AOD (all and AERONOT AOD greater than 0.15) must be highly correlated (Pearson correlation coefficient greater than 0.7). MODIS AOD and AERONET AOD for AERONET AOD less than 0.15 must be moderately correlated (Pearson correlation coefficient between 0.5 and 0.7), because lower values of AOD have a greater level of uncertainty [25,31,32].
- Criterion 3: At least 67% of the MODIS AOD versus AERONET AOD datasets must lie within the EE. The value of 67% was selected based on the findings of Remer et al., in which 68% of the retrievals at 550 nm fit within the EE, and the fact that the prelaunch expectation was 66% [31]. It was also used in the validation study by Sherman et al. [19].
3. Results and Discussion
3.1. Bonanza Creek
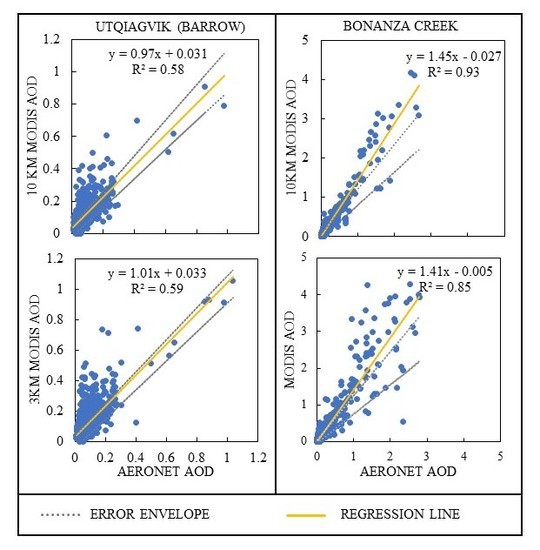
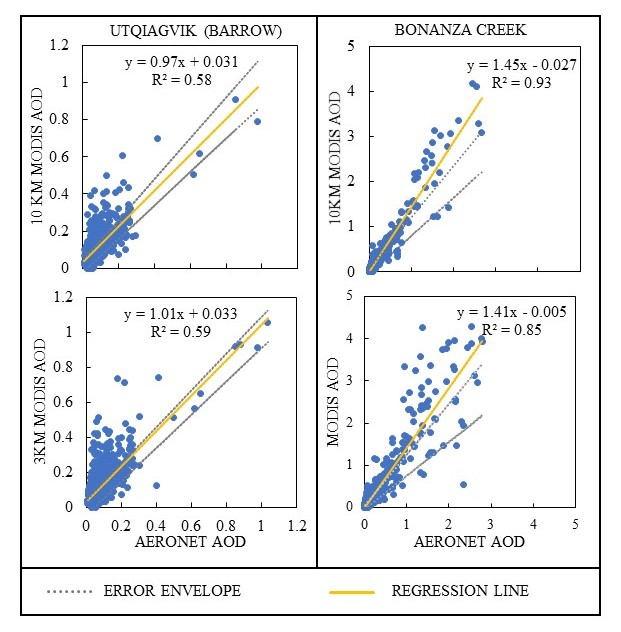
MODIS AOD cannot be obtained in the presence of snow or clouds due to the high reflectivity of snow and clouds. Due to the presence of snow in Alaska during winter months, MODIS AOD data could only be obtained between the months of April and October; therefore, the validation is only effective for the end of April through early October. Table 3 lists the slopes of the linear regressions of MODIS AOD versus AERONET AOD at the Bonanza Creek site at 10-km and 3-km resolutions. The errors were heteroscedastic based on White’s test for heteroscedasticity; therefore, HC3 was used to calculate the standard errors used in the t-tests. Chu et al. (2002) established that the departure of the slope from unity was representative of systematic bias, and that the y-intercept represented the error in the estimate of the surface reflectance [26]. The systematic errors could also be due to aerosol model assumptions, instrument calibration, or measurement selection [26]. While the slopes of the linear regressions for the 10-km datasets were lower than those of the 3-km datasets, the relative difference between the slopes of the regressions for the 10-km data were greater than those of the 3-km data. For example, the slopes of the linear regressions of the 10-km Terra, Aqua, and combined Aqua and Terra datasets ranged from 1.40 to 1.49, while those of the 3-km resolution MODIS AOD datasets ranged from 1.41 to 1.42 (Figure 2). Also, in Figure 2, the 3-km (Figure 2d–f) data appeared to be more scattered than the 10-km data (Figure 2a–c), which was presumably due to the higher resolution of the 3-km data. The higher resolution appears to enable the capture of more data, as evidenced by the number of collocated samples (Table 3). As such, it is possible that more data at higher AOD was able to be retrieved at 3-km resolution than 10-km resolution.
3.1.1. Criterion 1: Linear Regression
As listed in Table 3, all the 3-km resolution MODIS AOD data satisfied criterion 1. The slopes of the stratified (divided into two datasets with 0.15 as the breaking point) combined Aqua and Terra MODIS AOD at 10-km resolution were significantly different (p < 0.05; t-test), which indicated that combined Aqua and Terra AOD at 10 km resolution should not be used over Alaska. Similarly, the p-value for the stratified individual Terra MODIS AOD at 10-km resolution was relatively low at 0.06, indicating difference. For stratified individual Aqua MODIS AOD at 10-km resolution, slopes were not significantly different (p = 0.35). Based on these, individual Aqua MODIS AOD at 10-km resolution could be used. For all the 3-km data stratified by AERONET AOD (Terra and Aqua combined or individual), slopes were not significantly different (p > 0.8; Table 3), indicating that the 3-km datasets could be used in Alaska. Overall, the 3-km dataset appeared to perform better than the 10-km dataset, because the difference in slope when the data were stratified by AERONET AOD was not significant. The lower relative difference between slopes in the 3-km datasets could be due to the higher spatial resolution of the data. Combined Terra and Aqua MODIS AOD can be used to estimate ground-level air quality at a resolution of 3-km.
3.1.2. Criterion 2: Correlation
Overall, the full MODIS and AERONET AOD datasets were highly correlated with Pearson correlation coefficients (Figure 3) and thereby satisfied criterion 2. In Figure 2, the MODIS AOD and AERONET AOD do appear to be highly correlated, which is consistent with the calculated correlations shown in Figure 3. The Pearson correlation coefficients at 10-km resolution ranged from 0.95 to 0.97 for all AERONET AOD and AERONET AOD greater than or equal to 0.15, indicating high correlation. The Pearson correlation coefficient at 10-km resolution for AERONET AOD less than 0.15 ranged from 0.71 to 0.76 (highly correlated). The Pearson correlation coefficients of the 3-km data for all AERONET AOD and AERONET AOD greater than or equal to 0.15 ranged from 0.89 to 0.93 (highly correlated). The Pearson correlation coefficients for AERONET AOD less than 0.15 at 3-km resolution ranged from 0.64 to 0.66 (moderately correlated). The lower correlation coefficients for AERONET AOD less than 0.15 were most likely due to the greater uncertainty associated with lower AOD [31,32].
3.1.3. Criterion 3: Error Envelope (EE)
More than 67% of the data from both AQUA and TERRA were within the error envelope (Figure 4). The total percentage of the 10-km resolution and 3-km resolution combined Aqua and Terra data within the EE were 83.3% and 78.7%, respectively. The amount of data within the EE satisfied the validation requirements for a fraction of data within the EE used in various validation studies [12,19,25,26].
3.1.4. Error and Bias
The Aqua and Terra MODIS AOD datasets appeared to have a negative bias (y-intercept) at both the 10-km (−0.035 to −0.020) and 3-km resolutions (−0.018 to 0.006). The negative bias, indicated by the y-intercept, of MODIS AOD is consistent with the findings of Sherman et al., Levy et al., and Sioris et al. [12,19,33]. Also, the RMSE of the Bonanza Creek 10-km data was slightly lower than that of the 3-km data. The difference in RMSE is likely due to the larger number of retrievals at higher concentrations of AOD, because the variance appears to increase with AOD. The RMSE is also more affected by larger values than smaller values of AOD. A validation study over Asia found that Aqua 3-km data was less reliable than the 10-km data, as only 55% of retrievals were within the estimated error [18]; however, global studies show that MODIS AOD performance varies by region and terrain [12]. Due to the high correlation between MODIS AOD and AERONET AOD, the high proportion of data points within the EE, and the consistency of the results of the linear regression and the MODIS AOD 10-km and 3-km resolution data can be used in when employing the dark target land and ocean algorithm in Alaska. Based on the overall performance of the 10-km and 3-km resolution data, it is recommended that only the Aqua 10-km data be used of the 10-km datasets. All of the 3-km MODIS AOD data are valid for use in Alaska between the months of April and October.
Overall, the following collection 6 Dark Target land products was determined to be valid: 10-km Aqua MODIS AOD, 3-km combined Aqua and Terra MODIS AOD, 3-km Aqua MODIS AOD, and 3-km Terra MODIS AOD. Potential sources of error include the incorrect identification of clouds in the masking process of the dark target land algorithm [31]. Another source of error could be the incorrect assumption of the surface brightness by the dark target algorithm [12]. The use of the mode of quality assurance value from the pixels used to calculate each AOD could also be another source of error; however, the error between MODIS Aqua AOD with QA 3 and mode QA 3 when collocated with the Bonanza Creek site was approximately 0.
3.2. Utqiagvik (Barrow)
MODIS AOD was derived for Utqiagvik, previously known as Barrow, over the ocean using the Dark Target Ocean Algorithm. As with the Bonanza Creek site, data was only available between the months of April and October; therefore, this validation study only applies between those months. Table 4 lists the results of the linear regression analysis of the relationship between MODIS AOD and AERONET AOD. White’s test for heteroscedasticity revealed that the errors were heteroscedastic; therefore, HC3 was used to calculate the heteroscedasticity robust standard errors.
3.2.1. Criterion 1: Linear Regression
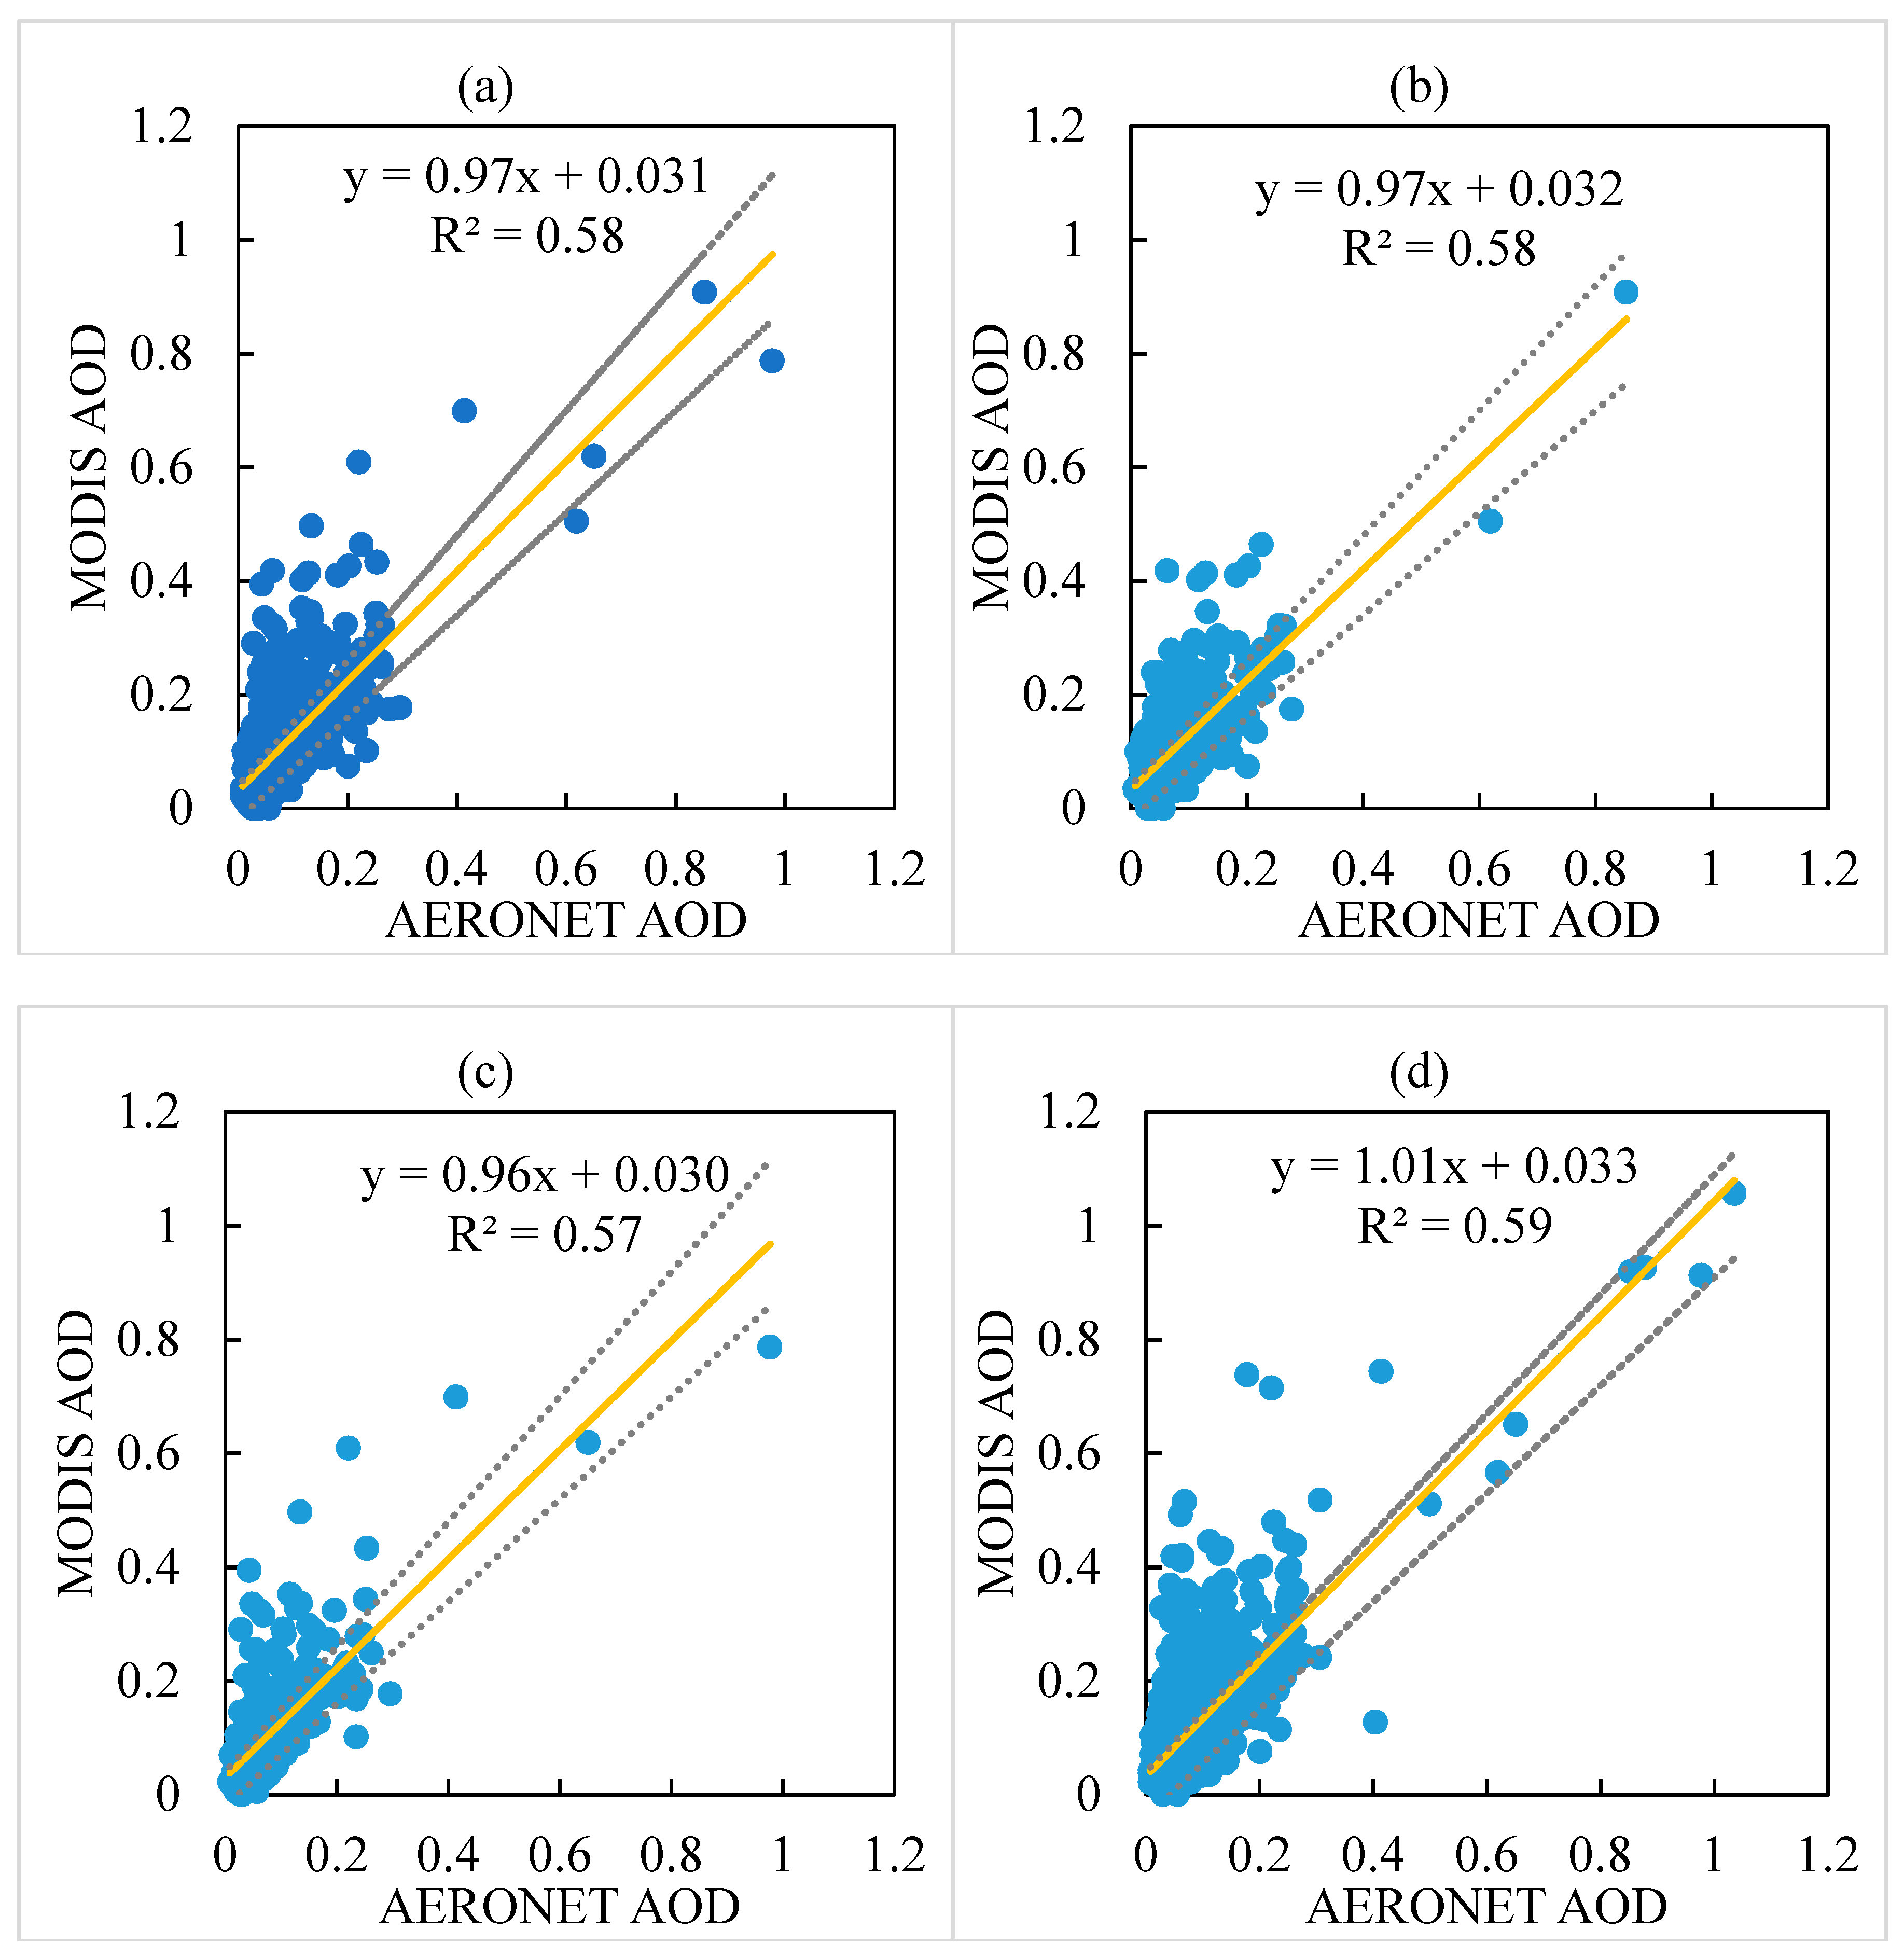
All of the AOD data for the Utqiagvik AERONET site satisfied the criterion that the slopes of the linear regressions of MODIS AOD versus AERONET AOD greater than or equal to 0.15 and AERONET AOD less than 0.15 could not be significantly different. The slopes of the least squares regressions of the 10-km resolution MODIS AOD datasets versus AERONET AOD ranged from 0.96 to 0.97 (Table 4, Figure 5a–c), indicating low systematic bias (slopes of 1 would indicate no systematic bias). The slopes from the least squares regression of the 3-km MODIS AOD data versus AERONET AOD ranged from 1.00 to 1.02 for the full datasets (Table 4, Figure 5d–f). The greatest relative difference between slopes of the 10-km and 3-km data stratified by AERONET AOD were 0.21 (Terra) and 0.03 (Aqua), respectively (Table 4). Based on t-tests with a significance level of 0.05, the slopes of the all of the 10-km and 3-km data stratified by AERONET AOD were not significantly different (p > 0.08; Table 4). The proximity of the slopes to one indicated low systematic bias [29]. The MODIS AOD datasets at 10-km and 3-km were positively biased with values ranging from 0.030 to 0.032 and 0.031 to 0.035, respectively, for the full datasets based on the y-intercepts of the linear regressions [29].
3.2.2. Criterion 2: Correlation
Another requirement for validation is that MODIS AOD and AERONET AOD are highly correlated [19]. For the Utqiagvik site, MODIS AOD and AERONET AOD appeared to be moderately to highly correlated with most points with an AERONET AOD of less than 0.2 (Figure 5). The correlation coefficients for the full MODIS AOD datasets were greater than 0.7, indicating that MODIS AOD and AERONET AOD were strongly correlated. For AERONET AOD less than 0.15, MODIS AOD and AERONET AOD were moderately correlated with correlation coefficients ranging from 0.51 to 0.58 (Figure 6). For AERONET AOD greater than or equal to 0.15, correlation coefficients greater than 0.75 indicated a strong correlation between MODIS AOD and AERONET AOD (Figure 6). The large difference in Pearson correlation coefficients indicates that the strength of correlation is impacted by the few larger values. A moderate to strong relationship was evident in the correlation coefficients and Figure 6, therefore, the recommended requirement of correlation to determine validity was satisfied.
3.2.3. Criterion 3: Error Envelope (EE)
The final requirement for validity is that more than 67% of the collocated data be within the error envelope (Figure 7). The error envelope for Terra was assumed to be equal to that of Aqua, which was expected to be the same [12]. The lowest percentage within the error envelope was 67.3% for Terra MODIS AOD at 3-km resolution, and the greatest percentage was 74.5% for Aqua MODIS AOD at 3-km resolution (Figure 7). When stratified by AERONET AOD, a larger percentage of the collocated data was within the error envelope for AERONET AOD less than 0.15 (67.8–74.9%) than that for AERONET AOD greater than or equal to 0.15 (58.7–67.3%) (Figure 6). As the requirement of a minimum of 67% was for the full dataset, the requirement was satisfied.
3.2.4. Error and Bias
Overall, all of the MODIS AOD collection 6 Dark Target Ocean products satisfied the requirements for validity and are thus considered valid for use in Alaska between the months of April and October over the ocean. Based on the linear regression over the Utqiagvik and Bonanza Creek sites, the Utqiagvik data appeared to have less systematic bias than the Bonanza Creek site (Table 3 and Table 4). Potential sources of error could include incorrect assumptions in the Dark Target algorithm, such as incorrect identification of clouds or surface brightness [12]. The error between MODIS Aqua AOD with QA 1, 2, 3 and mode QA 1, 2, 3 when collocated with the Bonanza Creek site was approximately 0. Future analysis could use weighted least squares regression and compare the results to the findings in this study. The use of weighted least squares may result in a different estimation of bias and systematic error based on the regression.
4. Conclusions
The Aqua MODIS AOD 10-km and all of the 3-km MODIS AOD products are valid between the months of April and October over the Bonanza Creek and Utqiagvik (Barrow) sites. All of the collection 6 dark target ocean MODIS AOD products are valid over the ocean in Alaska. The successful validation of the MODIS AOD at Bonanza Creek and Utqiagvik indicates that the collection 6 dark target MODIS AOD reflects actual conditions based on ground-based measurements of aerosol optical depth over the two sites in Alaska [7,19]. Further research in Alaska should be done to model the relationship between summertime particulate pollution and MODIS AOD to determine if MODIS AOD can be used to estimate ground-level PM2.5 concentrations. Care should be taken when modeling the relationship between particulate pollution and MODIS AOD in Alaska, because the validity of MODIS AOD may not be accurate at other locations in Alaska [12,19]. Therefore, a clear relationship between MODIS AOD and particulate pollution should be evident prior to use outside of the regions of the AERONET sites in Alaska, and models should undergo significant testing and evaluation for robustness. Other validation studies could be done using other satellite platforms to determine which platform will work best in Alaska. Finally, if modeling of the relationship between particulate pollution and MODIS AOD is successful, MODIS AOD could be used to monitor air quality in the areas of Alaska that do not have ground-level air quality monitors, such as much of rural Alaska.
Author Contributions
The research was conceptualized and written by A.M. and S.A. The study design and data analyses were undertaken by A.M. under the supervision of S.A. Additionally, S.A. provided project oversight, supervision, and funding resources.
Funding
This material is based in part upon work supported by the Alaska National Aeronautics and Space Administration (NASA) Established Program to Stimulate Competitive Research (EPSCoR) Program (N NNX15AK31A).
Acknowledgments
Authors would like to acknowledge assistance from Pawan Gupta at NASA Goddard Centre and support from department of Civil and Environmental Engineering at University of Alaska Fairbanks.
Conflicts of Interest
The authors declare no conflict of interest. The funding sponsors had no role in the design of the study; in the collection, analyses, or interpretation of data; in the writing of the manuscript; or in the decision to publish the results.
References
- Pope, C.A.; Dockery, D.W. Health Effects of Fine Particulate Air Pollution: Lines that Connect. J. Air Waste Manag. Assoc. 2006, 56, 709–742. [Google Scholar] [CrossRef] [PubMed] [Green Version]
- Lelieveld, J.; Evans, J.S.; Fnais, M.; Giannadaki, D.; Pozzer, A. The contribution of outdoor air pollution sources to premature mortality on a global scale. Nature 2015, 525, 367–371. [Google Scholar] [CrossRef] [PubMed]
- Fann, N.; Lamson, A.D.; Anenberg, S.C.; Wesson, K.; Risley, D.; Hubbell, B.J. Estimating the National Public Health Burden Associated with Exposure to Ambient PM2.5 and Ozone. Risk Anal. 2012, 32, 81–95. [Google Scholar] [CrossRef] [PubMed]
- McLaughlin, J.; Castrodale, L. Association between Air Quality and Hospital Visits—Fairbanks, 2003–2008. State Alaska Epidemiol. Bull. 2010, 26, 1. [Google Scholar]
- Ware, D.; Lewis, J.; Hopkins, S.; Boyer, B.; Noonan, C.; Ward, T. Sources and perceptions of indoor and ambient air pollution in rural Alaska. J. Community Health 2013, 38, 773–780. [Google Scholar] [CrossRef] [PubMed]
- US EPA. AirNow—Alaska Air Quality. Environmental Protection Agency. Available online: https://www.airnow.gov/index.cfm?action=airnow.local_state&stateid=2&mapcenter=1&tabs=1 (accessed on 7 August 2018).
- Gupta, P.; Christopher, S.A.; Box, M.A.; Box, G.P. Multi year satellite remote sensing of particulate matter air quality over Sydney, Australia. Int. J. Remote Sens. 2007, 28, 4483–4498. [Google Scholar] [CrossRef]
- Dey, S.; Di Girolamo, L. A decade of change in aerosol properties over the Indian subcontinent. Geophys. Res. Lett. 2011, 38, 1–5. [Google Scholar] [CrossRef]
- Xie, Y.; Wang, Y.; Zhang, K.; Dong, W.; Lv, B.; Bai, Y. Daily Estimation of Ground-Level PM2.5 Concentrations over Beijing Using 3 km Resolution MODIS AOD. Environ. Sci. Technol. 2015, 49, 12280–12288. [Google Scholar] [CrossRef] [PubMed]
- Ma, Z.; Hu, X.; Sayer, A.M.; Levy, R.; Zhang, Q.; Xue, Y.; Tong, S.; Bi, J.; Huang, L.; Liu, Y. Satellite-Based Spatiotemporal Trends in PM2.5 Concentrations: China, 2004–2013. Environ. Health Perspect. 2015, 124, 184–192. [Google Scholar] [CrossRef] [PubMed]
- Van Donkelaar, A.; Martin, R.V.; Brauer, M.; Kahn, R.; Levy, R.; Verduzco, C.; Villeneuve, P.J. Global estimates of ambient fine particulate matter concentrations from satellite-based aerosol optical depth: Development and application. Environ. Health Perspect. 2010, 118, 847–855. [Google Scholar] [CrossRef] [PubMed]
- Levy, R.C.; Mattoo, S.; Munchak, L.A.; Remer, L.A.; Sayer, A.M.; Patadia, F.; Hsu, N.C. The Collection 6 MODIS aerosol products over land and ocean. Atmos. Meas. Tech. 2013, 6, 2989–3034. [Google Scholar] [CrossRef] [Green Version]
- Sayer, A.M.; Hsu, N.C.; Bettenhausen, C.; Jeong, M.J. Validation and uncertainty estimates for MODIS Collection 6 “deep Blue” aerosol data. J. Geophys. Res. Atmos. 2013, 118, 7864–7872. [Google Scholar] [CrossRef]
- Hsu, N.C.; Jeong, M.J.; Bettenhausen, C.; Sayer, A.M.; Hansell, R.; Seftor, C.S.; Huang, J.; Tsay, S.C. Enhanced Deep Blue aerosol retrieval algorithm: The second generation. J. Geophys. Res. Atmos. 2013, 118, 9296–9315. [Google Scholar] [CrossRef] [Green Version]
- Sayer, A.M.; Munchak, L.A.; Hsu, N.C.; Levy, R.C.; Bettenhausen, C.; Jeong, M.-J. MODIS Collection 6 aerosol products: Comparison between Aqua’s e-Deep Blue, Dark Target, and “merged” data sets, and usage recommendations. J. GeoPhys. Res. Atmos. 2014, 119, 965–978. [Google Scholar] [CrossRef]
- Sayer, A.M.; Hsu, N.C.; Bettenhausen, C.; Jeong, M.J.; Meister, G. Effect of MODIS terra radiometric calibration improvements on Collection 6 Deep blue aerosol products: Validation and terra/aqua consistency. J. Geophys. Res. 2015, 120, 12157–12174. [Google Scholar] [CrossRef]
- Levy, R. Dark Target Aerosol Retrieval Algorithm. NASA; 2018. Available online: https://darktarget.gsfc.nasa.gov/ (accessed on 7 August 2018).
- Nichol, J.E.; Bilal, M. Validation of MODIS 3 km resolution aerosol optical depth retrievals over Asia. Remote Sens. 2016, 8, 328. [Google Scholar] [CrossRef]
- Sherman, J.P.; Gupta, P.; Levy, R.C.; Sherman, P.J. An Evaluation of MODIS-Retrieved Aerosol Optical Depth over a Mountainous AERONET Site in the Southeastern US. Aerosol Air Qual. Res. 2016, 16, 3243–3255. [Google Scholar] [CrossRef]
- Kloog, I.; Sorek-Hamer, M.; Lyapustin, A.; Coull, B.; Wang, Y.; Just, A.C.; Schwartz, J.; Broday, D.M. Estimating daily PM2.5 and PM10 across the complex geo-climate region of Israel using MAIAC satellite-based AOD data. Atmos. Environ. 2015, 122, 409–416. [Google Scholar] [CrossRef] [PubMed]
- Guo, Y.; Feng an, N.; Christopher, S.A.; Kang, P.; Zhan, F.B.; Hong, S. Satellite remote sensing of fine particulate matter (PM2.5) air quality over Beijing using MODIS. Int. J. Remote Sens. 2014, 35, 6522–6544. [Google Scholar] [CrossRef]
- Christopher, S.A.; Gupta, P. Satellite remote sensing of particulate matter air quality: The cloud-cover problem. J. Air Waste Manag. Assoc. 2010, 60, 596–602. [Google Scholar] [CrossRef] [PubMed]
- Petrenko, M.; Ichoku, C.; Leptoukh, G. Multi-sensor Aerosol Products Sampling System (MAPSS). Atmos. Meas. Tech. 2012, 5, 913–926. [Google Scholar] [CrossRef] [Green Version]
- Holben, B.N.; Eck, T.F.; Slutsker, I.; Tanré, D.; Buis, J.P.; Setzer, A.; Vermote, E.; Reagan, J.A.; Kaufman, Y.J.; Nakajima, T.; et al. AERONET—A federated instrument network and data archive for aerosol characterization. Remote Sens. Environ. 1998, 66, 1–16. [Google Scholar] [CrossRef]
- Ichoku, C.; Chu, D.A.; Mattoo, S.; Kaufman, Y.J.; Remer, L.A.; Tanre, D.; Slutsker, I.; Holben, B.N. A spatio-temporal approach for global validation and analysis of MODIS aerosol products. Geophys. Res. Lett. 2002, 29, 1–4. [Google Scholar] [CrossRef]
- Remer, L.A.; Tanré, D.; Kaufman, Y.J.; Ichoku, C.; Mattoo, S.; Levy, R.; Chu, D.A.; Holben, B.; Dubovik, O.; Smirnov, A.; et al. Validation of MODIS aerosol retrieval over ocean. Geophys. Res. Lett. 2002, 29, 8008. [Google Scholar] [CrossRef]
- Eck, T.F.; Holben, B.N.; Reid, J.S.; Dubovik, O.; Smirnov, A.; O’Neill, N.T.; Slutsker, I.; Kinne, S. Wavelength dependence of the optical depth of biomass burning, urban, and desert dust aerosols. J. Geophys. Res. 1999, 104, 31333–31349. [Google Scholar] [CrossRef] [Green Version]
- Georgoulias, A.K.; Alexandri, G.; Kourtidis, K.A.; Lelieveld, J.; Zanis, P.; Pöschl, U.; Levy, R.; Amiridis, V.; Marinou, E.; Tsikerdekis, A. Spatiotemporal variability and contribution of different aerosol types to the aerosol optical depth over the Eastern Mediterranean. Atmos. Chem. Phys. 2016, 16, 13853–13884. [Google Scholar] [CrossRef] [PubMed]
- Chu, D.A.; Kaufman, Y.J.; Ichoku, C.; Remer, L.A.; Tanré, D.; Holben, B.N. Validation of MODIS aerosol optical depth retrieval over land. Geophys. Res. Lett. 2002, 29, MOD2-1–MOD2-4. [Google Scholar] [CrossRef]
- Long, J.S.; Ervin, L.H. Using heteroscedasticity consistent standard errors in the linear regression model. Am. Stat. 2000, 54, 217–224. [Google Scholar] [CrossRef]
- Remer, L.A.; Kaufman, Y.J.; Tanré, D.; Mattoo, S.; Chu, D.A.; Martins, J.V.; Li, R.-R.; Ichoku, C.; Levy, R.C.; Kleidman, R.G.; et al. The MODIS Aerosol Algorithm, Products, and Validation. J. Atmos. Sci. 2005, 62. [Google Scholar] [CrossRef]
- Gupta, P.; Christopher, S.A. Particulate matter air quality assessment using integrated surface, satellite, and meteorological products: Multiple regression approach. J. Geophys. Res. Atmos. 2009, 114, 1–13. [Google Scholar] [CrossRef]
- Sioris, C.E.; Mclinden, C.A.; Shephard, M.W.; Fioletov, V.E.; Abboud, I. Assessment of the aerosol optical depths measured by satellite-based passive remote sensors in the Alberta oil sands region. Atmos. Chem. Phys. 1931, 17, 1931–1943. [Google Scholar] [CrossRef]
Figure 1.
Alaska’s air quality monitoring (AQM) network used by AirNow.gov to provide current air quality index to the public on 22 August 2018 [6]. Green dots signify locations with good air quality. The following AQM locations are shown: (1) Bethel, (2) North Pole, (3) Fairbanks, (4) Anchorage, (5) Butte, (6) Eagle River, (7) Palmer, and (8) Juneau. The blue squares signify locations of the two AERONET stations, (9) Utqiagvik (Barrow), and (10) Bonanza Creek. Yellow line highlights the border between USA and Canada.

Figure 2.
MODIS AOD versus AERONET AOD at the Bonanza Creek AERONET site with linear regression as solid yellow line and the dashed gray line as the error envelope where the following figures are for (a) Terra and Aqua 10-km combined, (b) Terra 10-km, (c) Aqua 10-km, (d) Terra and Aqua 3-km combined, (e) Terra 3-km, and (f) Aqua 3-km.


Figure 3.
A comparison of the correlation coefficients for MODIS AOD versus AERONET AOD over the Bonanza Creek AERONET site. Criterion 2 is satisfied if the correlation coefficient is greater than 0.5 for AERONET AOD less than 0.15; and correlation coefficient is greater than 0.7 for all AERONET AOD as well as for AERONET AOD greater than or equal to 0.15.

Figure 4.
A comparison of the percentage of MODIS land retrievals over the Bonanza Creek AERONET site from Aqua and Terra with 3-km and 10-km resolutions below, within, and above the error envelope (EE). The MODIS Collection 6 error envelopes for land are listed in Table 1. Criterion 3 for validation is satisfied if 67% of MODIS retrievals are within the error envelope.

Figure 5.
MODIS AOD versus AERONET AOD at the Utqiagvik (Barrow) AERONET site with linear regression as solid yellow line and the dashed gray line as the error envelope where the following figures are for (a) Terra and Aqua 10-km combined, (b) Terra 10-km, (c) Aqua 10-km, (d) Terra and Aqua 3-km combined, (e) Terra 3-km, and (f) Aqua 3-km.


Figure 6.
A comparison of the correlation coefficients for MODIS AOD versus AERONET AOD over the Utqiagvik (Barrow) AERONET site. Criterion 2 was satisfied if the correlation coefficient was greater than 0.5 for AERONET AOD less than 0.15 and greater than 0.7 for all AERONET AOD and AERONET AOD greater than 0.15.

Figure 7.
A comparison of the percentage of MODIS land retrievals over the Utqiagvik (Barrow) AERONET site from Aqua and Terra with 3-km and 10-km resolutions below, within, and above the error envelope (EE). The MODIS Collection 6 error envelopes for land are listed in Table 1. Criterion 3 for validation was satisfied if 67% of MODIS retrievals were within the error envelope.


Table 1.
Estimated error for MODIS collection 6 dark target algorithm [12].
Table 1.
Estimated error for MODIS collection 6 dark target algorithm [12].
| Resolution | 10-km | 3-km | ||
|---|---|---|---|---|
| Satellite | AQUA | TERRA | AQUA | TERRA |
| Land | ±(0.05 + 0.15τA) | ±(0.05 + 0.15 τA) | ±(0.05 + 0.2τA) | NA |
| Ocean | −0.02 − 0.1 τA | NA | ±(0.04 + 0.05τ τA) | NA |
| +0.04 + 0.1 τA | ||||
Table 2.
Locations of AERONET stations.
| Station | Location | Latitude (North) | Longitude (West) | Elevation (m) | Dates Operational |
|---|---|---|---|---|---|
| Utqiagvik (Barrow) | Utqiagvik, AK | 71.31220° | 156.66500° | 0.0 | 30 July 1994–present |
| Bonanza Creek | Bonanza Creek, AK | 64.74281° | 148.31627° | 150.0 | 31 May 1994–present |
Table 3.
Results of linear regression (τM = τA*m + b) and t-tests at a significance level of 0.05 for the Bonanza Creek AERONET site. The 95% confidence intervals are listed in parentheses, and se and N are the standard error of the slope and the number of samples, respectively. A p-value less than 0.05 indicates that the slopes are significantly different.
| Satellite | τA | Count | m | se | b | p-Value |
|---|---|---|---|---|---|---|
| 10-km Resolution | ||||||
| TERRA & AQUA | all | 1490 | 1.45 (1.34, 1.57) | 0.06 | −0.027 (−0.038, −0.015) | NA |
| <0.15 | 1232 | 1.29 (1.23, 1.36) | 0.03 | −0.013 (−0.018, −0.009) | 0.03 | |
| ≥0.15 | 258 | 1.48 (1.33, 1.63) | 0.08 | −0.052 (−0.101, −0.002) | ||
| TERRA | all | 853 | 1.49 (1.33, 1.65) | 0.08 | −0.020 (−0.036, −0.005) | NA |
| <0.15 | 713 | 1.32 (1.23, 1.40) | 0.04 | −0.005 (−0.010, 0.001) | 0.06 | |
| ≥0.15 | 140 | 1.53 (1.32, 1.73) | 0.10 | −0.058 (−0.121, 0.005) | ||
| AQUA | all | 637 | 1.40 (1.26, 1.54) | 0.07 | −0.035 (−0.050, −0.020) | NA |
| <0.15 | 519 | 1.31 (1.21, 1.40) | 0.05 | −0.028 (−0.035, −0.021) | 0.35 | |
| ≥0.15 | 118 | 1.41 (1.21, 1.61) | 0.10 | −0.040 (−0.110, 0.030) | ||
| 3-km Resolution | ||||||
| TERRA & AQUA | all | 2494 | 1.41 (1.29, 1.53) | 0.06 | −0.005 (−0.017, 0.007) | NA |
| <0.15 | 2091 | 1.38 (1.31, 1.46) | 0.04 | −0.004 (−0.009, 0.001) | 0.84 | |
| ≥0.15 | 403 | 1.40 (1.25, 1.55) | 0.08 | 0.009 (−0.043, 0.062) | ||
| TERRA | all | 1352 | 1.41 (1.22, 1.59) | 0.09 | 0.006 (−0.012, 0.024) | NA |
| <0.15 | 1146 | 1.38 (1.28, 1.48) | 0.05 | 0.007 (0.000, 0.014) | 0.87 | |
| ≥0.15 | 206 | 1.40 (1.16, 1.63) | 0.12 | 0.015 (−0.067, 0.096) | ||
| AQUA | all | 1142 | 1.42 (1.26, 1.58) | 0.08 | −0.018 (−0.034, −0.001) | NA |
| <0.15 | 945 | 1.43 (1.32, 1.54) | 0.06 | −0.021 (−0.028, −0.013) | 0.83 | |
| ≥0.15 | 197 | 1.40 (1.20, 1.60) | 0.10 | 0.004 (−0.065, 0.073) | ||
Table 4.
Results of linear regression (τM = τA*m + b) and t-tests at a significance level of 0.05 for the Utqiagvik (Barrow) AERONET site. The 95% confidence intervals are listed in parenthesis, and se is the standard error of the slope. A p-value less than 0.05 indicates that the slopes are significantly different.
| Satellite | τA | N | m | se | b | p-Value |
|---|---|---|---|---|---|---|
| 10-km Resolution | ||||||
| TERRA & AQUA | all | 1490 | 1.45 (1.34, 1.57) | 0.06 | −0.027 (−0.038, −0.015) | NA |
| <0.15 | 1232 | 1.29 (1.23, 1.36) | 0.03 | −0.013 (−0.018, −0.009) | 0.03 | |
| ≥0.15 | 258 | 1.48 (1.33, 1.63) | 0.08 | −0.052 (−0.101, −0.002) | ||
| TERRA | all | 853 | 1.49 (1.33, 1.65) | 0.08 | −0.020 (−0.036, −0.005) | NA |
| <0.15 | 713 | 1.32 (1.23, 1.40) | 0.04 | −0.005 (−0.010, 0.001) | 0.06 | |
| ≥0.15 | 140 | 1.53 (1.32, 1.73) | 0.10 | −0.058 (−0.121, 0.005) | ||
| AQUA | all | 637 | 1.40 (1.26, 1.54) | 0.07 | −0.035 (−0.050, −0.020) | NA |
| <0.15 | 519 | 1.31 (1.21, 1.40) | 0.05 | −0.028 (−0.035, −0.021) | 0.35 | |
| ≥0.15 | 118 | 1.41 (1.21, 1.61) | 0.10 | −0.040 (−0.110, 0.030) | ||
| 3-km Resolution | ||||||
| TERRA & AQUA | all | 2494 | 1.41 (1.29, 1.53) | 0.06 | −0.005 (−0.017, 0.007) | NA |
| <0.15 | 2091 | 1.38 (1.31, 1.46) | 0.04 | −0.004 (−0.009, 0.001) | 0.84 | |
| ≥0.15 | 403 | 1.40 (1.25, 1.55) | 0.08 | 0.009 (−0.043, 0.062) | ||
| TERRA | all | 1352 | 1.41 (1.22, 1.59) | 0.09 | 0.006 (−0.012, 0.024) | NA |
| <0.15 | 1146 | 1.38 (1.28, 1.48) | 0.05 | 0.007 (0.000, 0.014) | 0.87 | |
| ≥0.15 | 206 | 1.40 (1.16, 1.63) | 0.12 | 0.015 (−0.067, 0.096) | ||
| AQUA | all | 1142 | 1.42 (1.26, 1.58) | 0.08 | −0.018 (−0.034, −0.001) | NA |
| <0.15 | 945 | 1.43 (1.32, 1.54) | 0.06 | −0.021 (−0.028, −0.013) | 0.83 | |
| ≥0.15 | 197 | 1.40 (1.20, 1.60) | 0.10 | 0.004 (−0.065, 0.073) | ||
© 2018 by the authors. Licensee MDPI, Basel, Switzerland. This article is an open access article distributed under the terms and conditions of the Creative Commons Attribution (CC BY) license (http://creativecommons.org/licenses/by/4.0/).
Share and Cite
MDPI and ACS Style
McPhetres, A.; Aggarwal, S. An Evaluation of MODIS-Retrieved Aerosol Optical Depth over AERONET Sites in Alaska. Remote Sens. 2018, 10, 1384. https://0-doi-org.brum.beds.ac.uk/10.3390/rs10091384
AMA Style
McPhetres A, Aggarwal S. An Evaluation of MODIS-Retrieved Aerosol Optical Depth over AERONET Sites in Alaska. Remote Sensing. 2018; 10(9):1384. https://0-doi-org.brum.beds.ac.uk/10.3390/rs10091384
Chicago/Turabian StyleMcPhetres, Alyson, and Srijan Aggarwal. 2018. "An Evaluation of MODIS-Retrieved Aerosol Optical Depth over AERONET Sites in Alaska" Remote Sensing 10, no. 9: 1384. https://0-doi-org.brum.beds.ac.uk/10.3390/rs10091384
Note that from the first issue of 2016, this journal uses article numbers instead of page numbers. See further details here.