Validation of Aerosol Products from AATSR and MERIS/AATSR Synergy Algorithms—Part 1: Global Evaluation

Abstract
:
1. Introduction
2. Materials
2.1. AATSR
2.2. MERIS
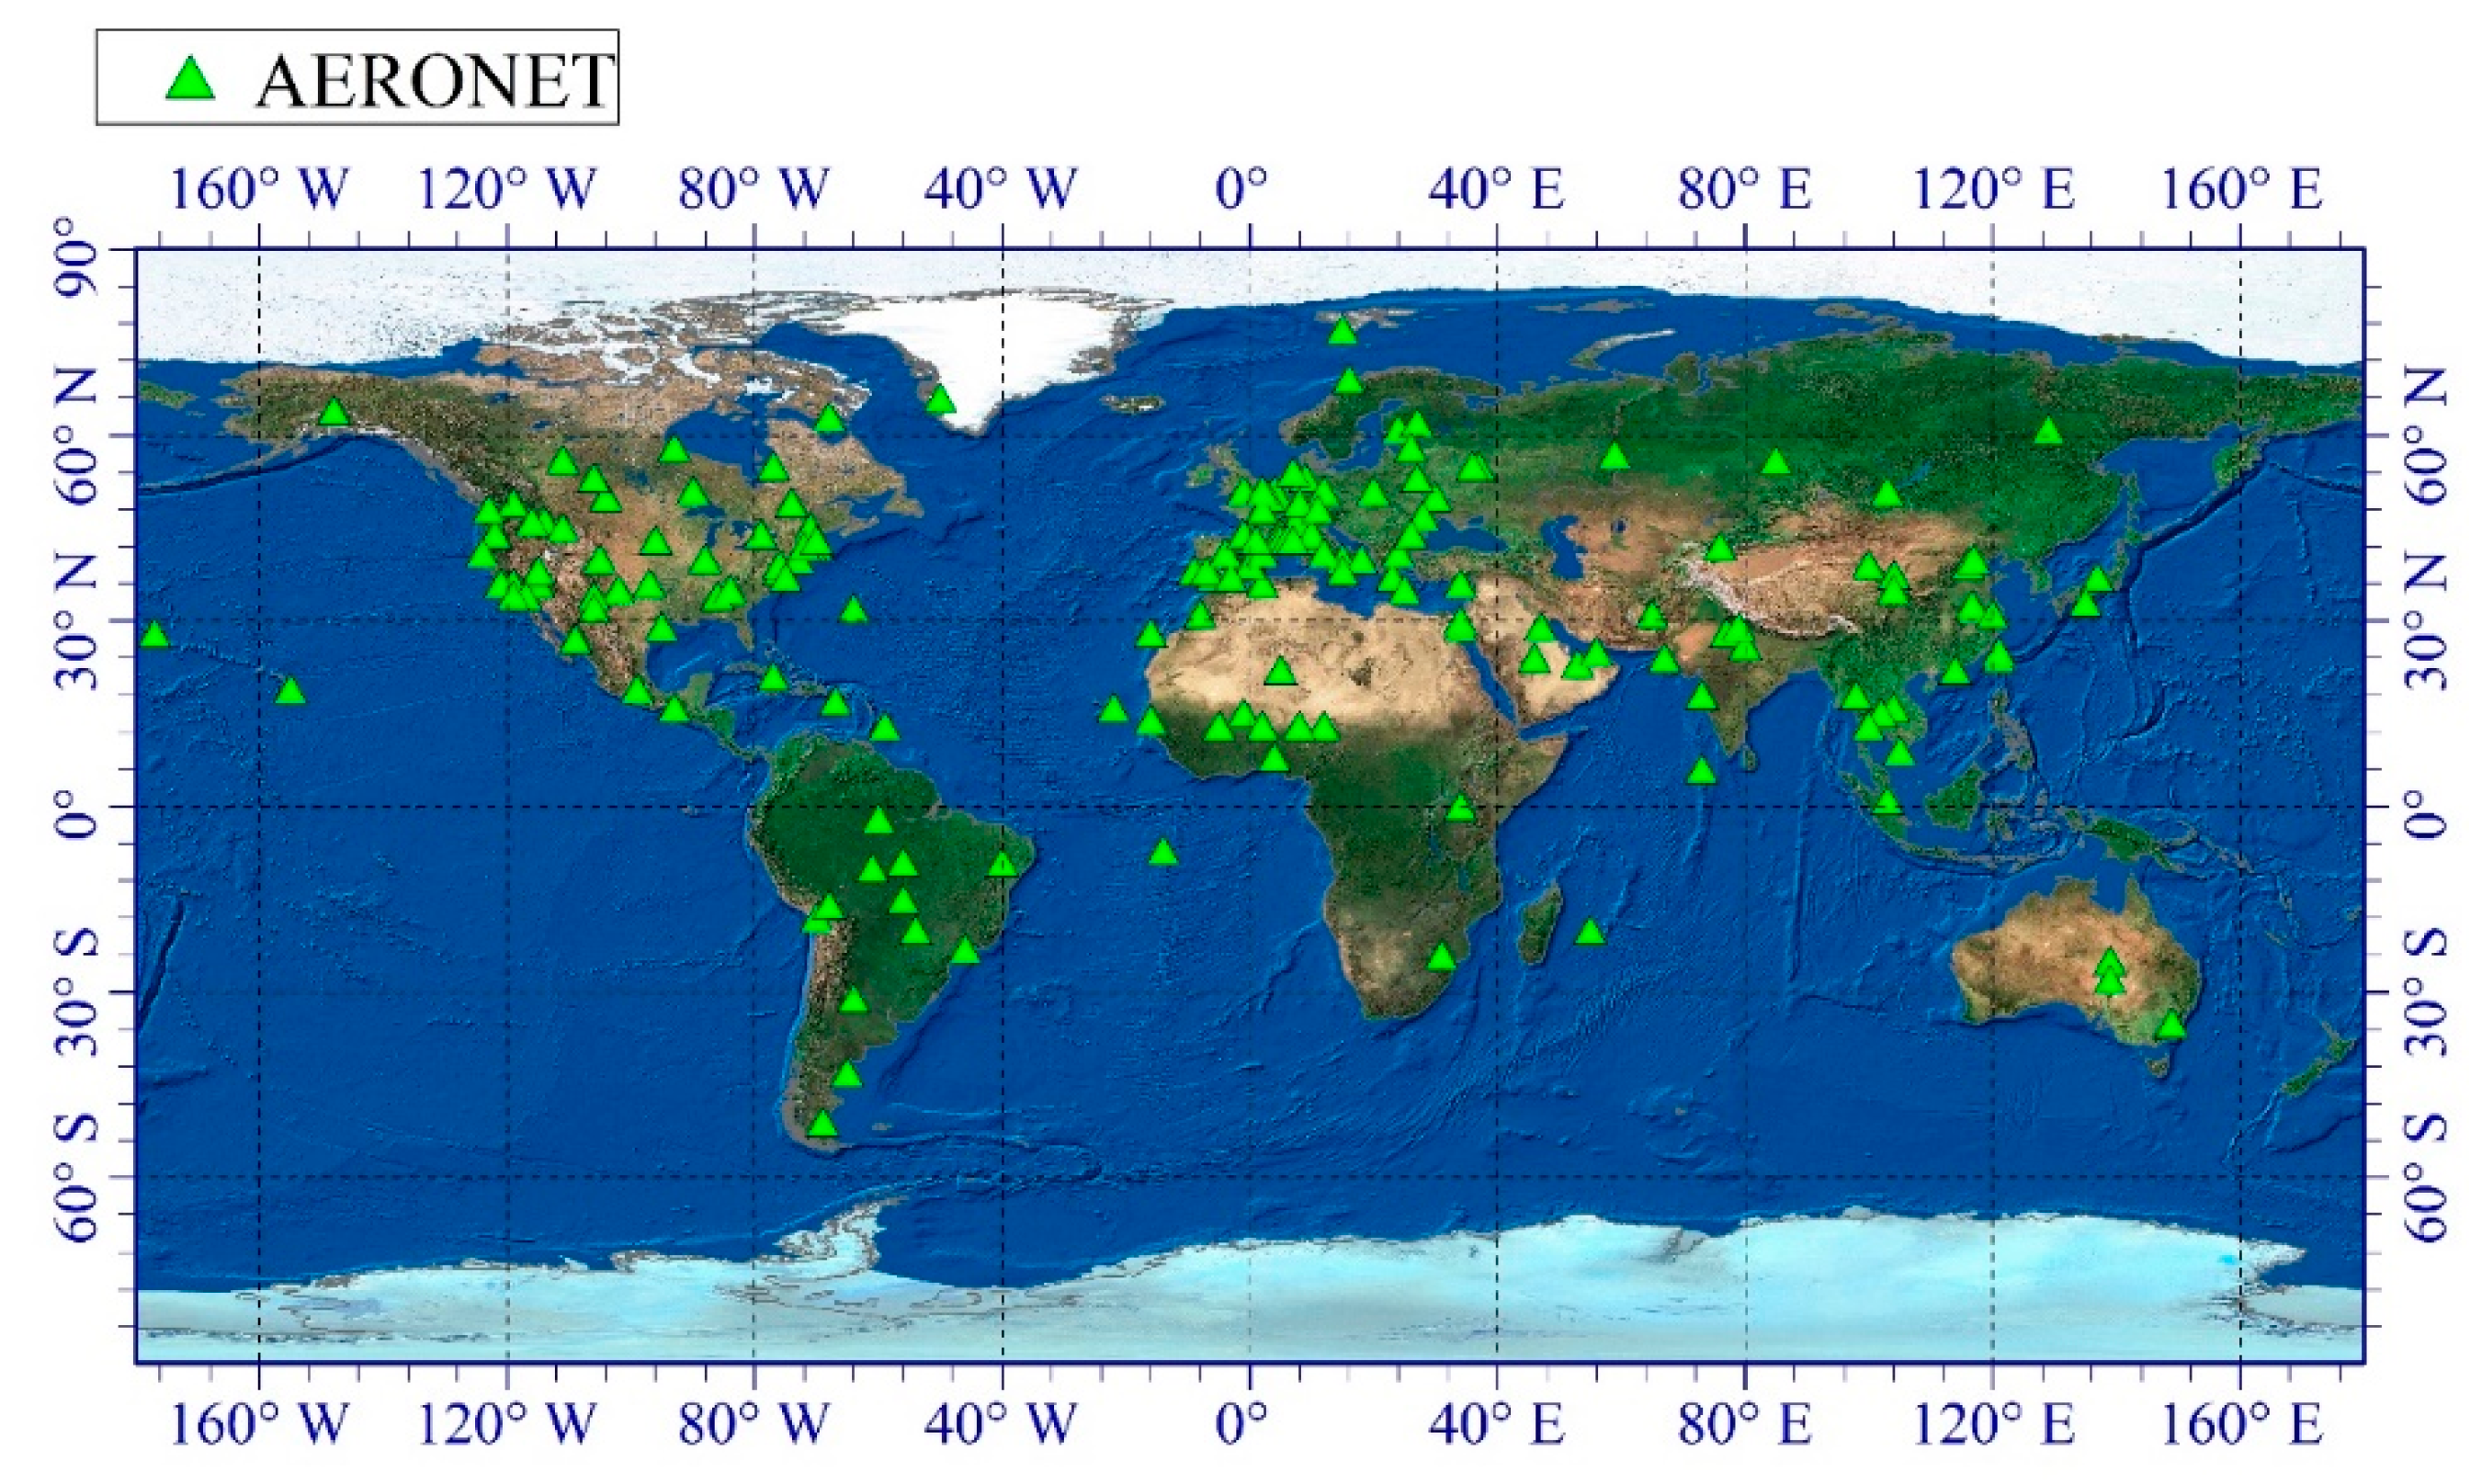
2.3. AERONET
3. Methods
3.1. AATSR Algorithm
3.2. Synergy Algorithm
3.3. Major Differences between AATSR and AATSR/MERIS Synergy Algorithms
3.4. Matchup Methodology
3.5. Statistical Metrics
4. Results
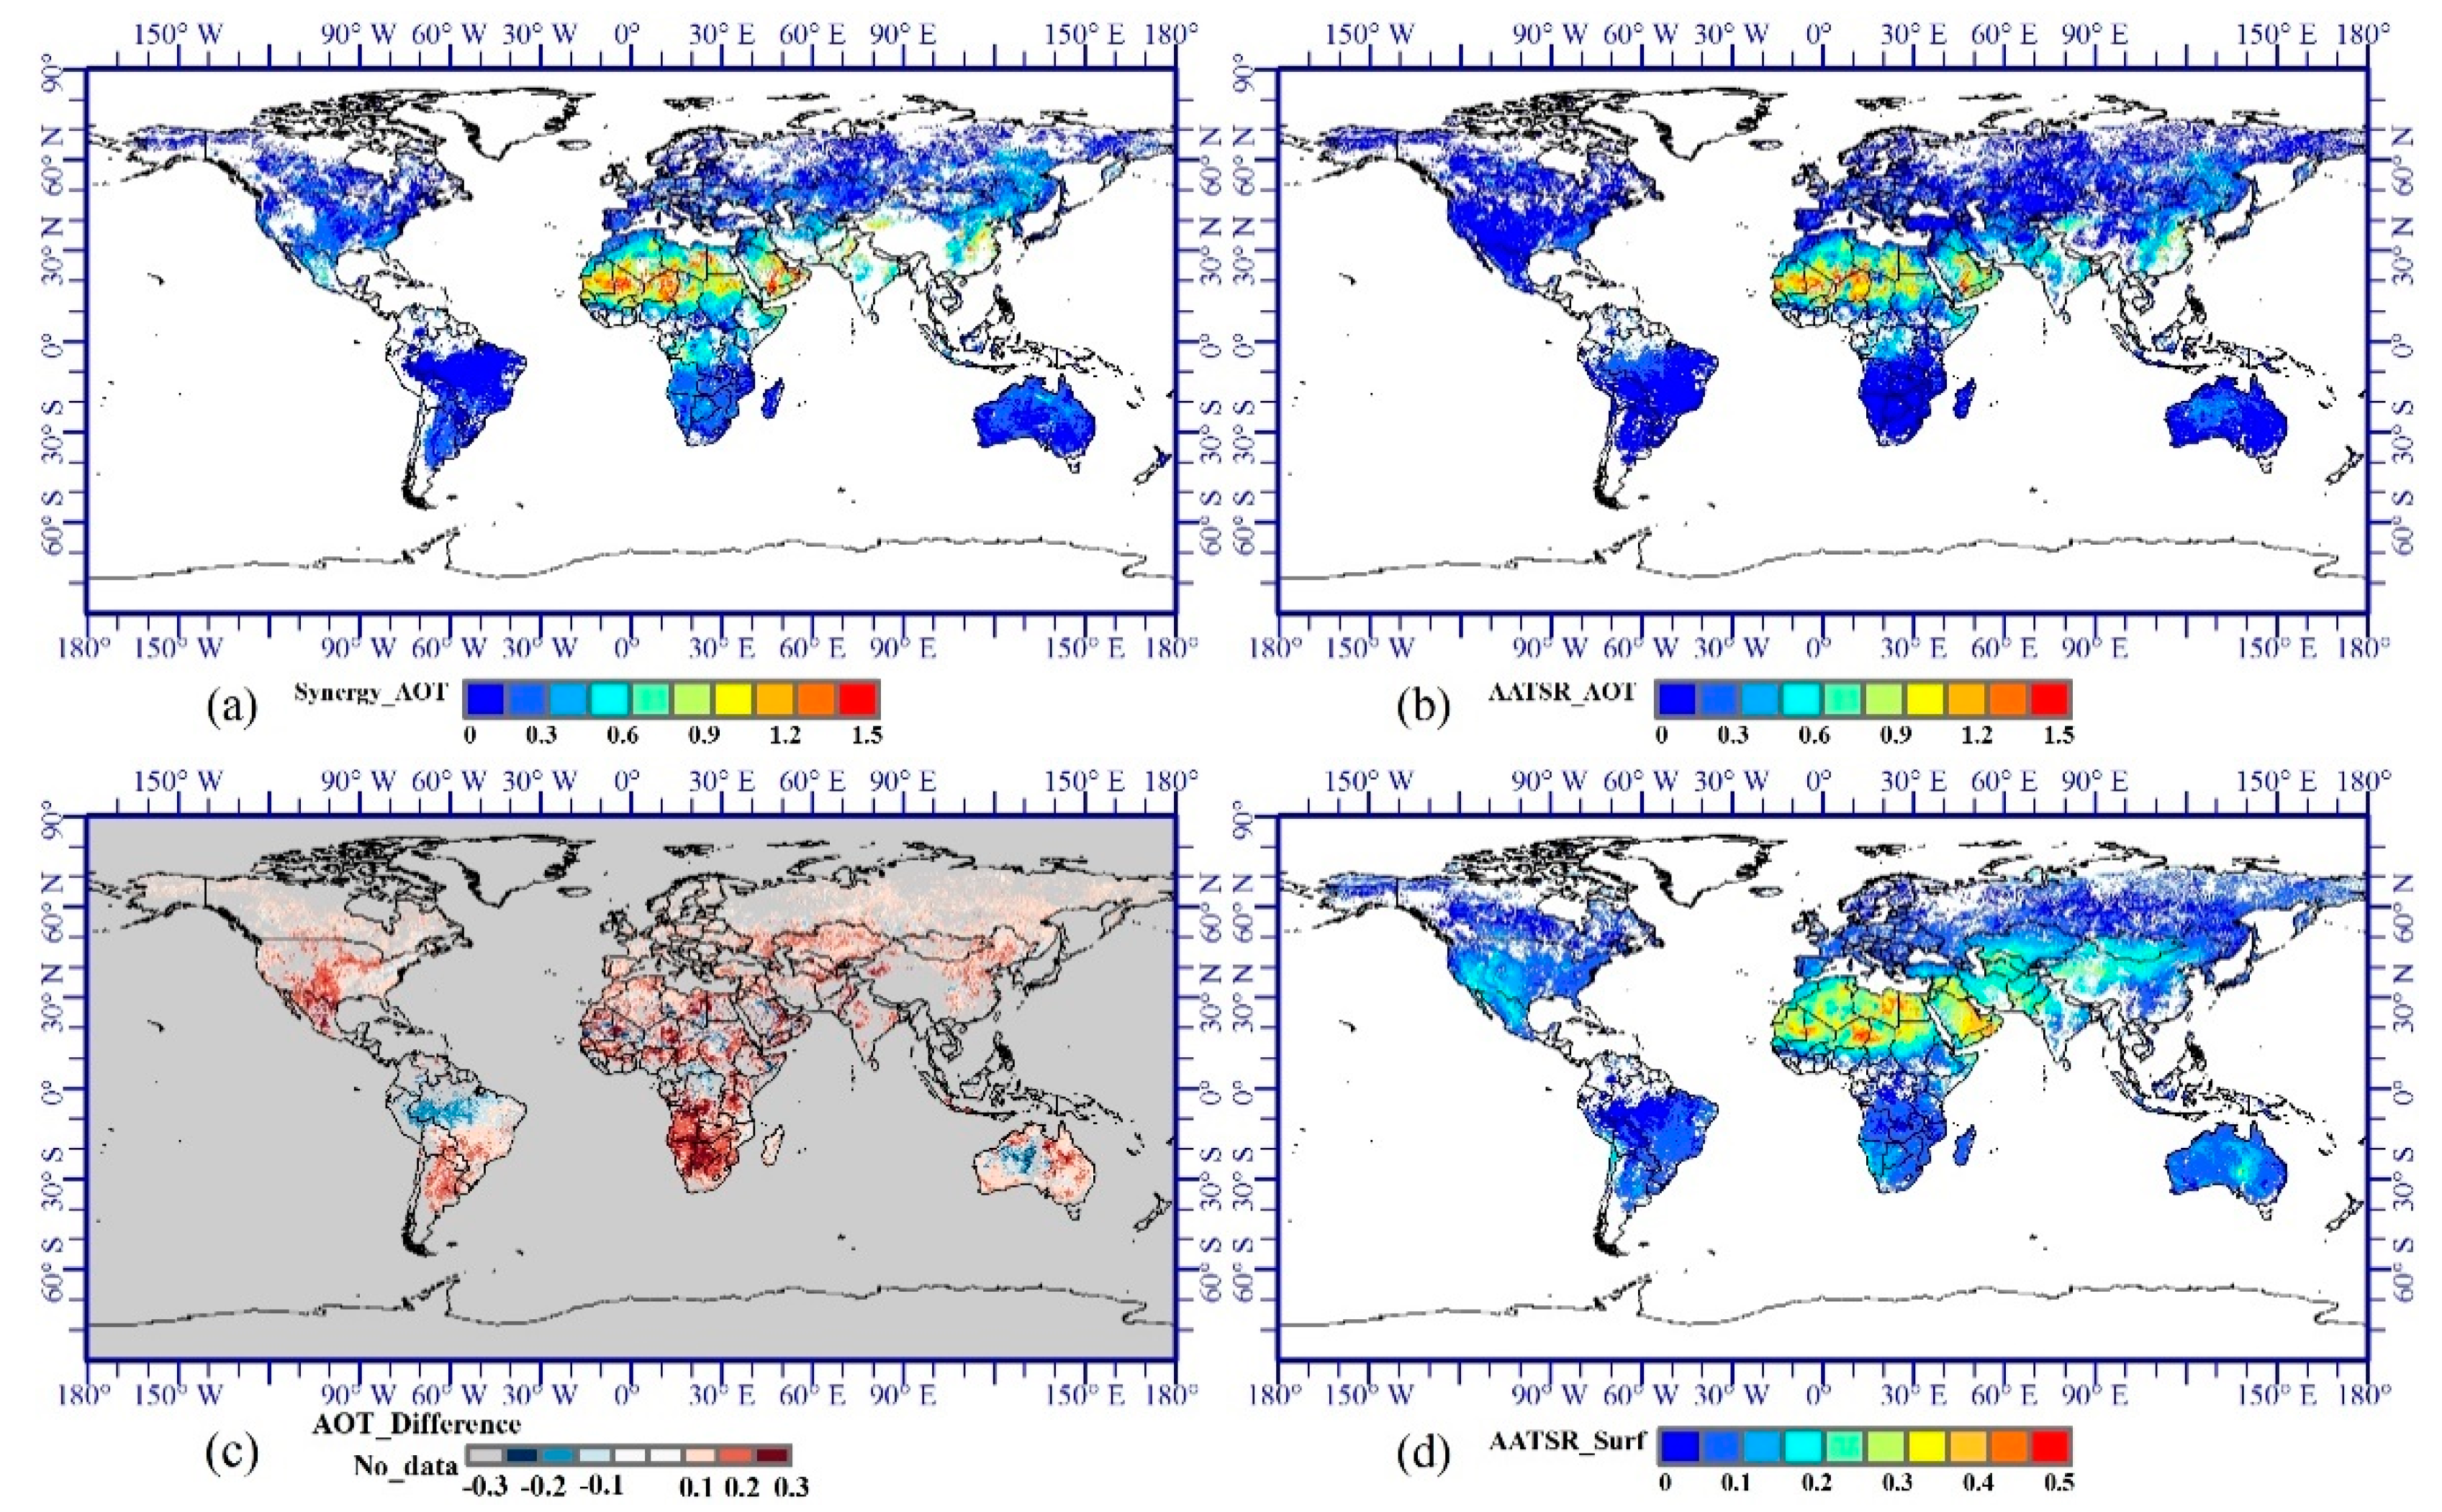
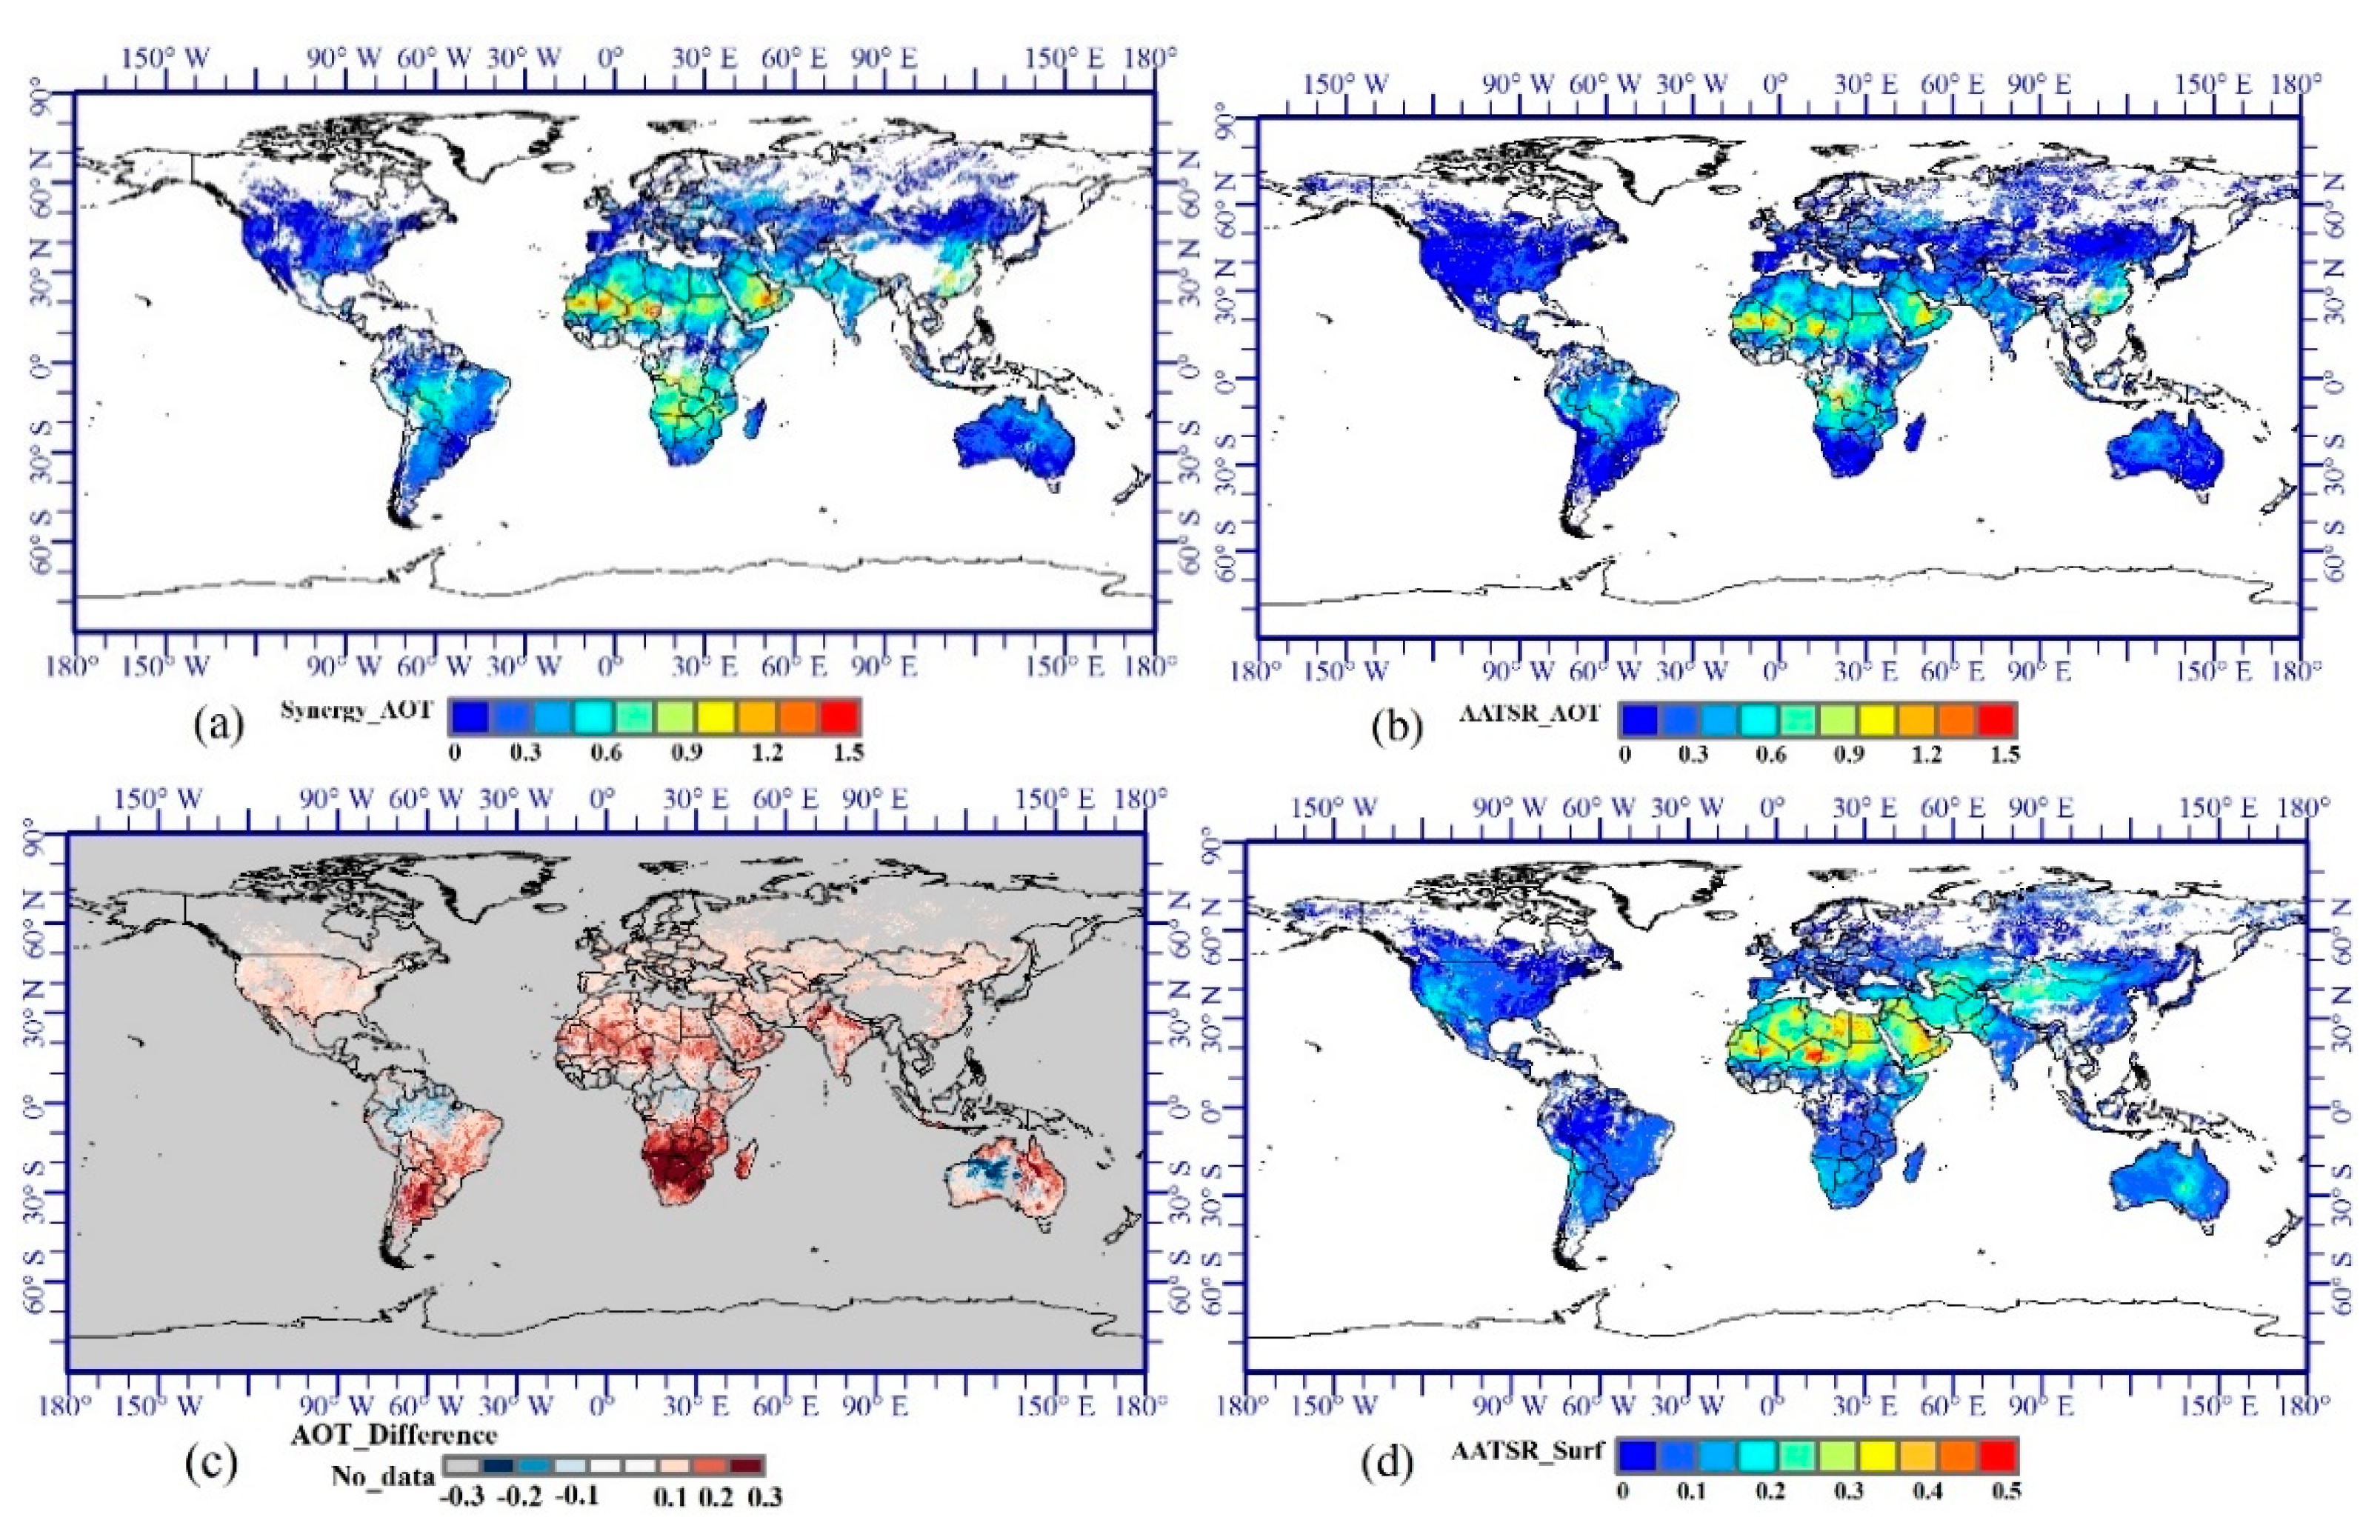
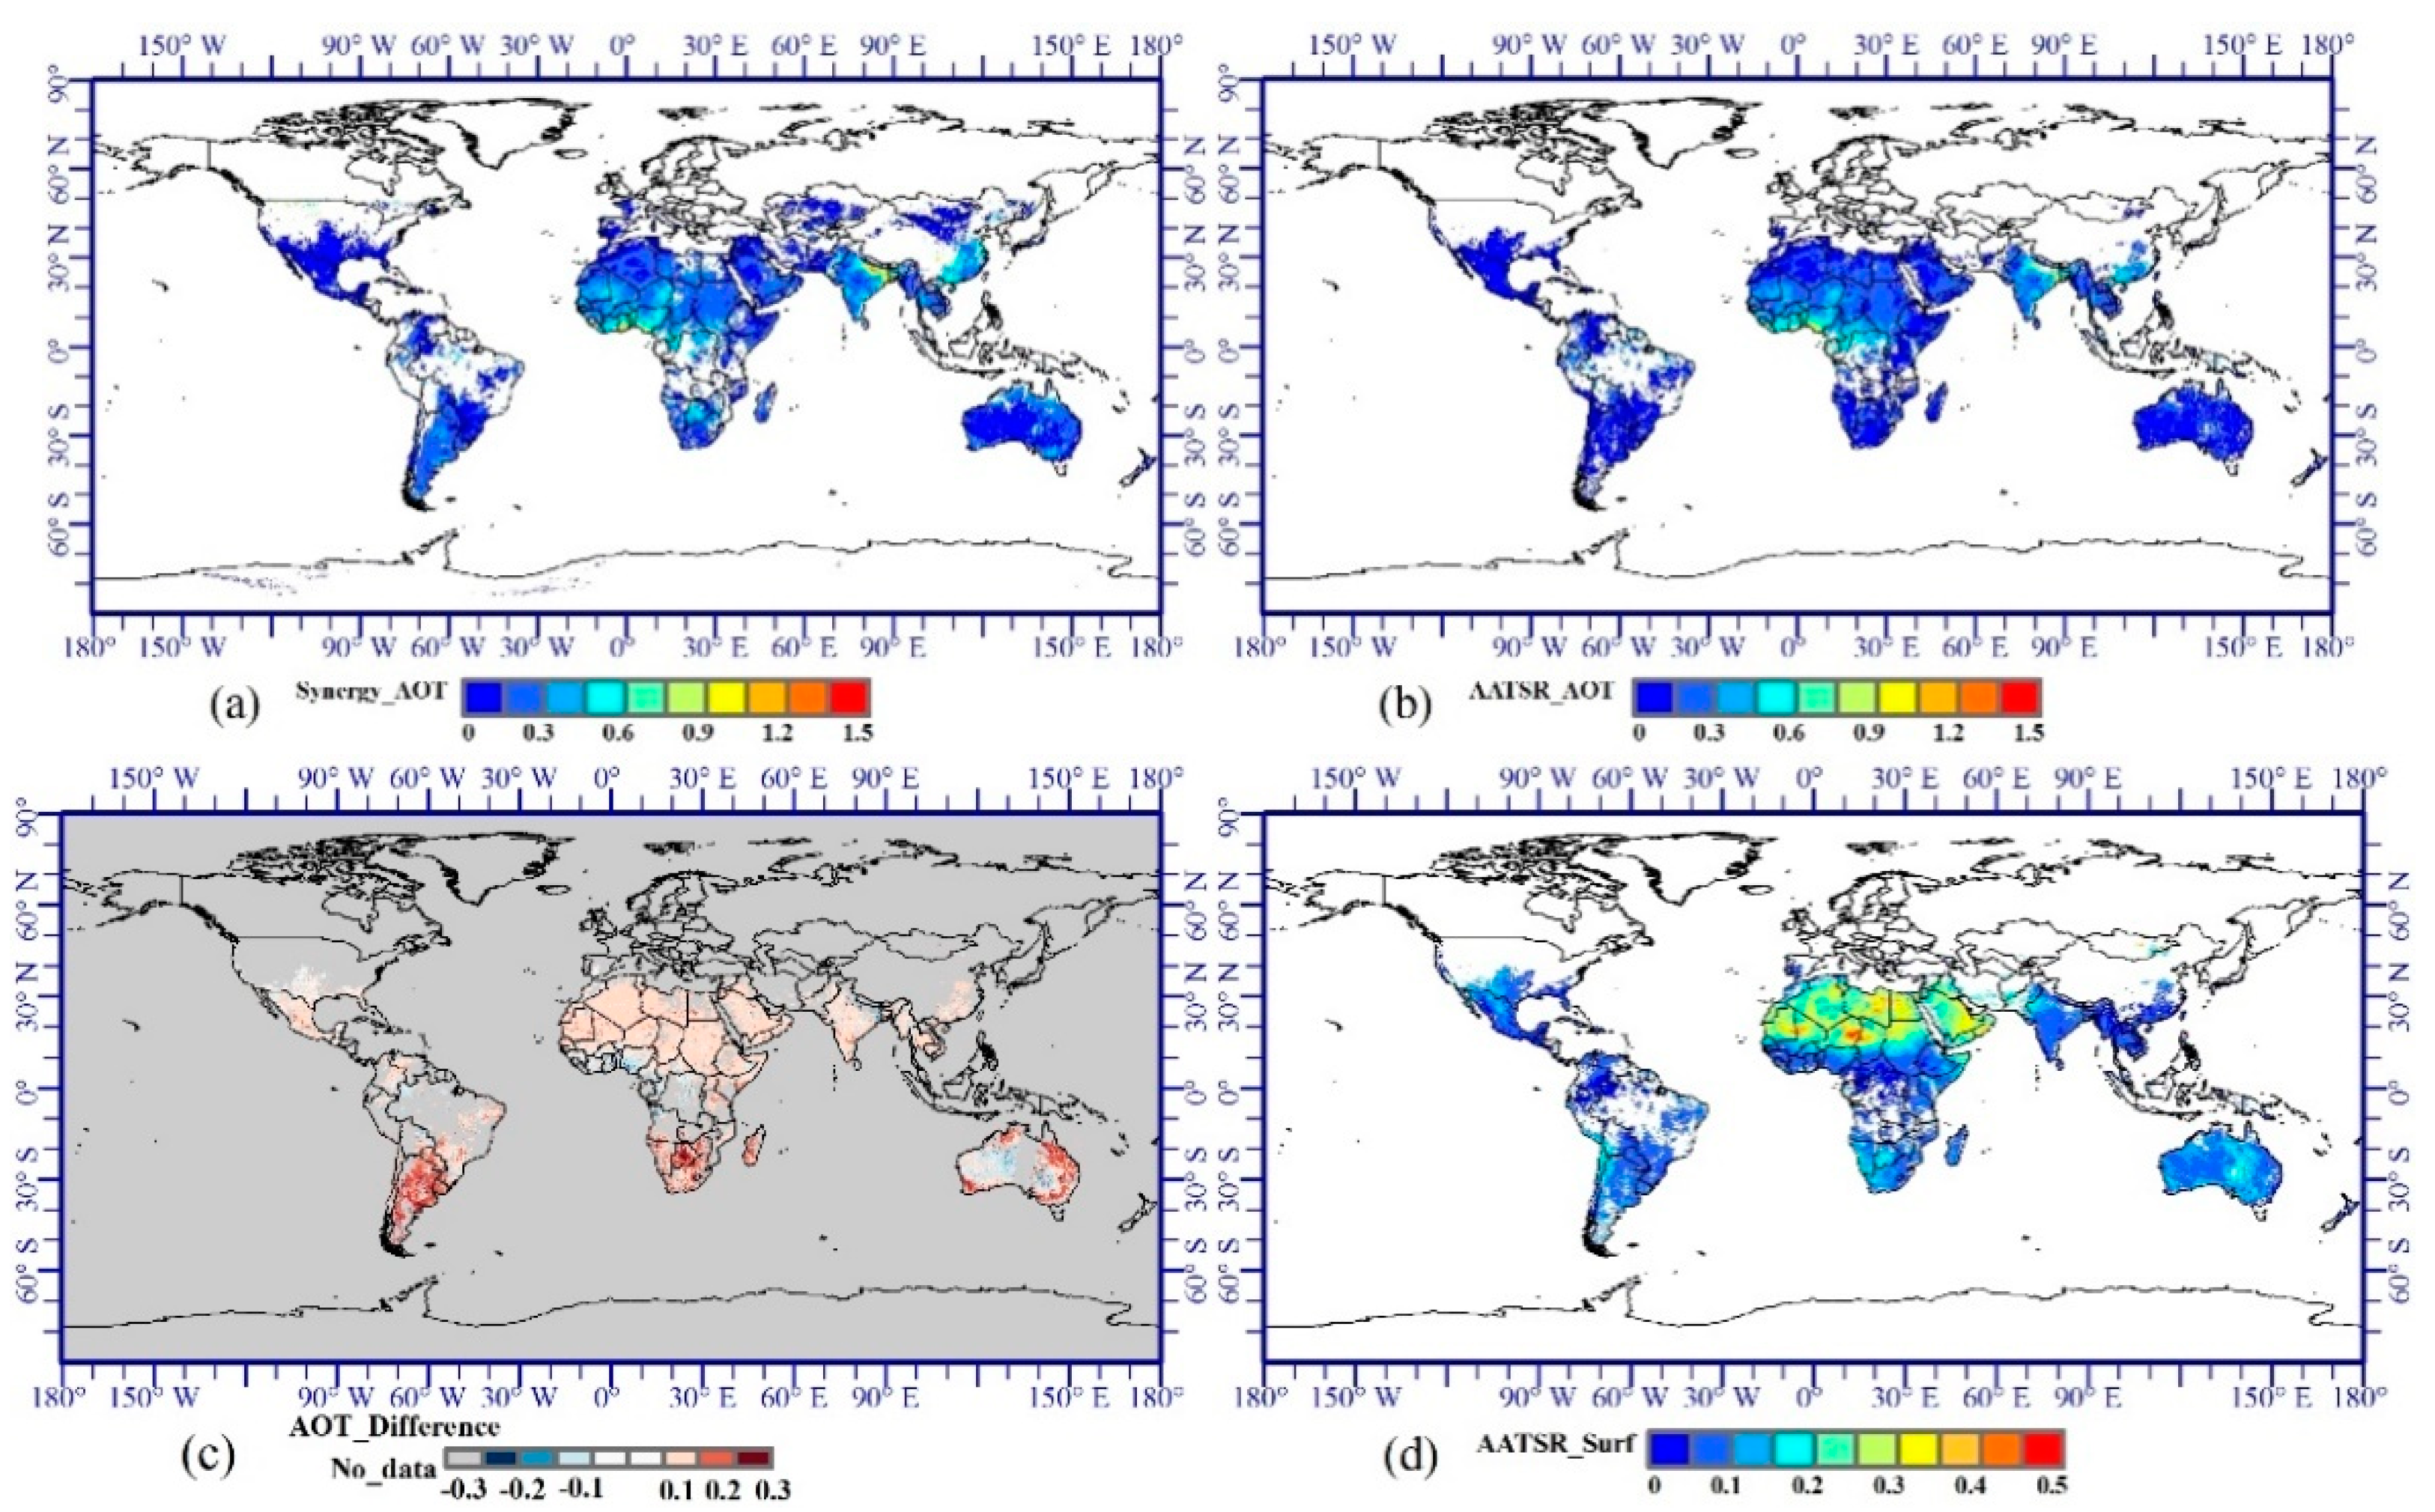
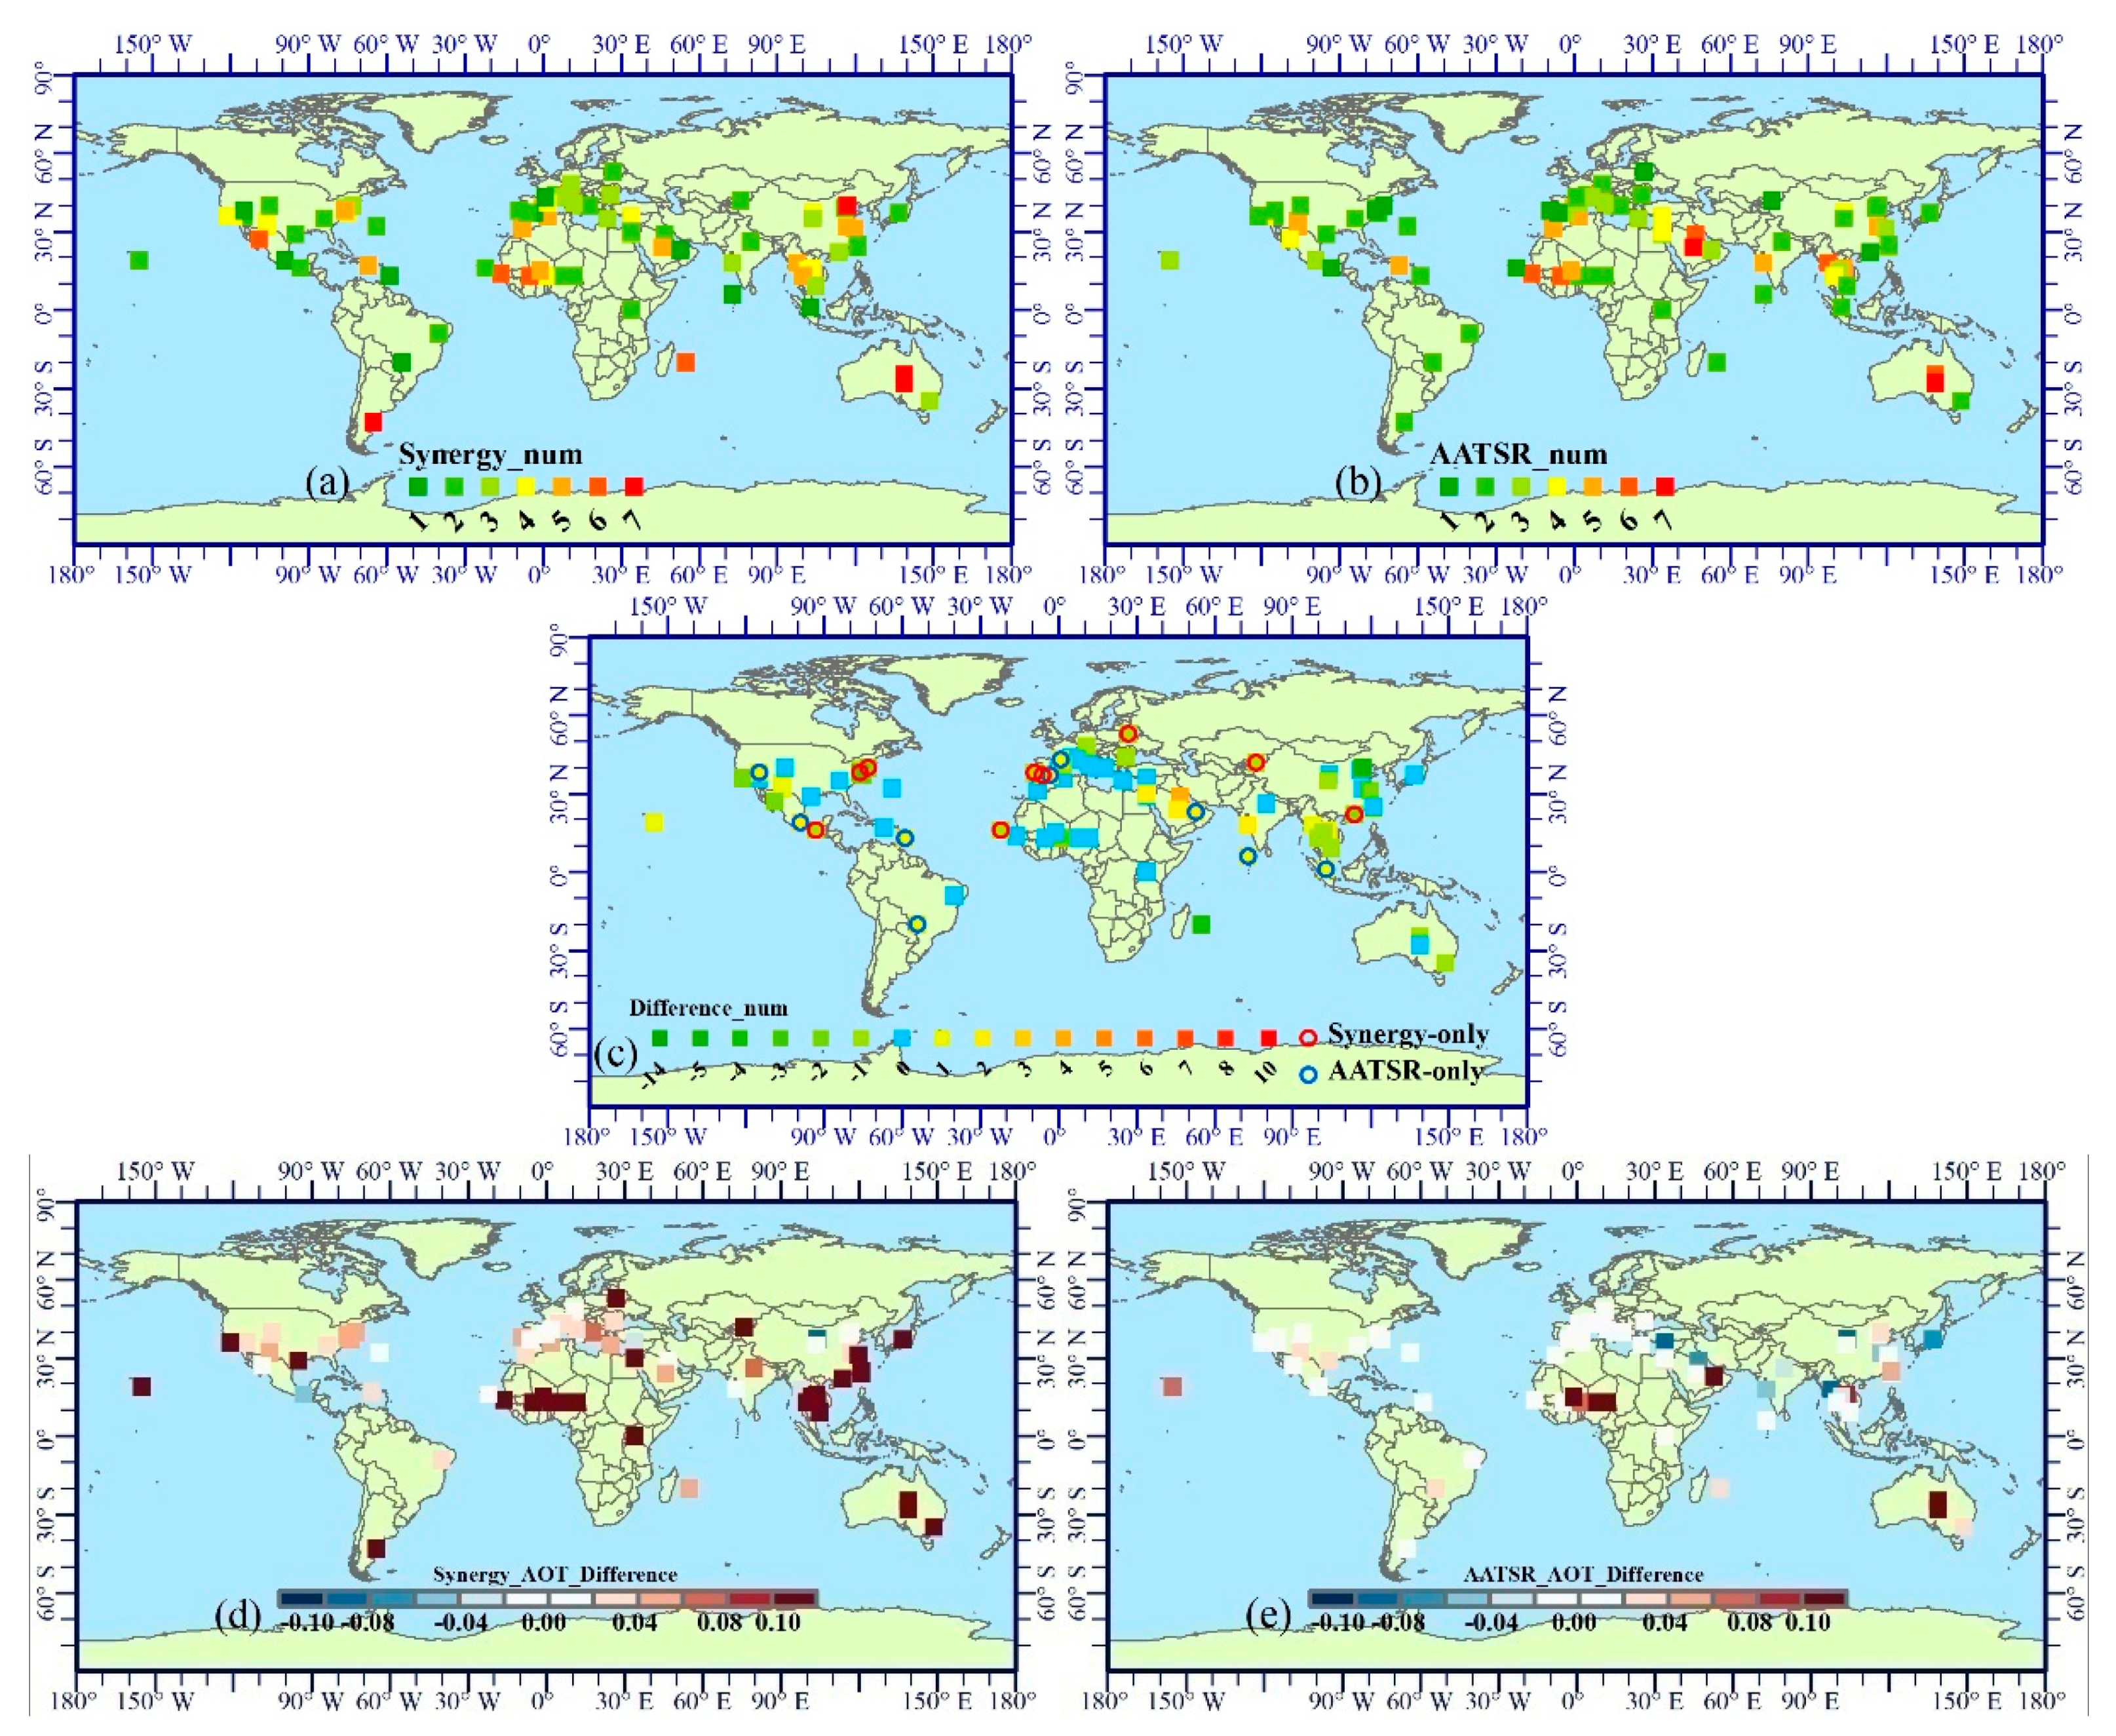
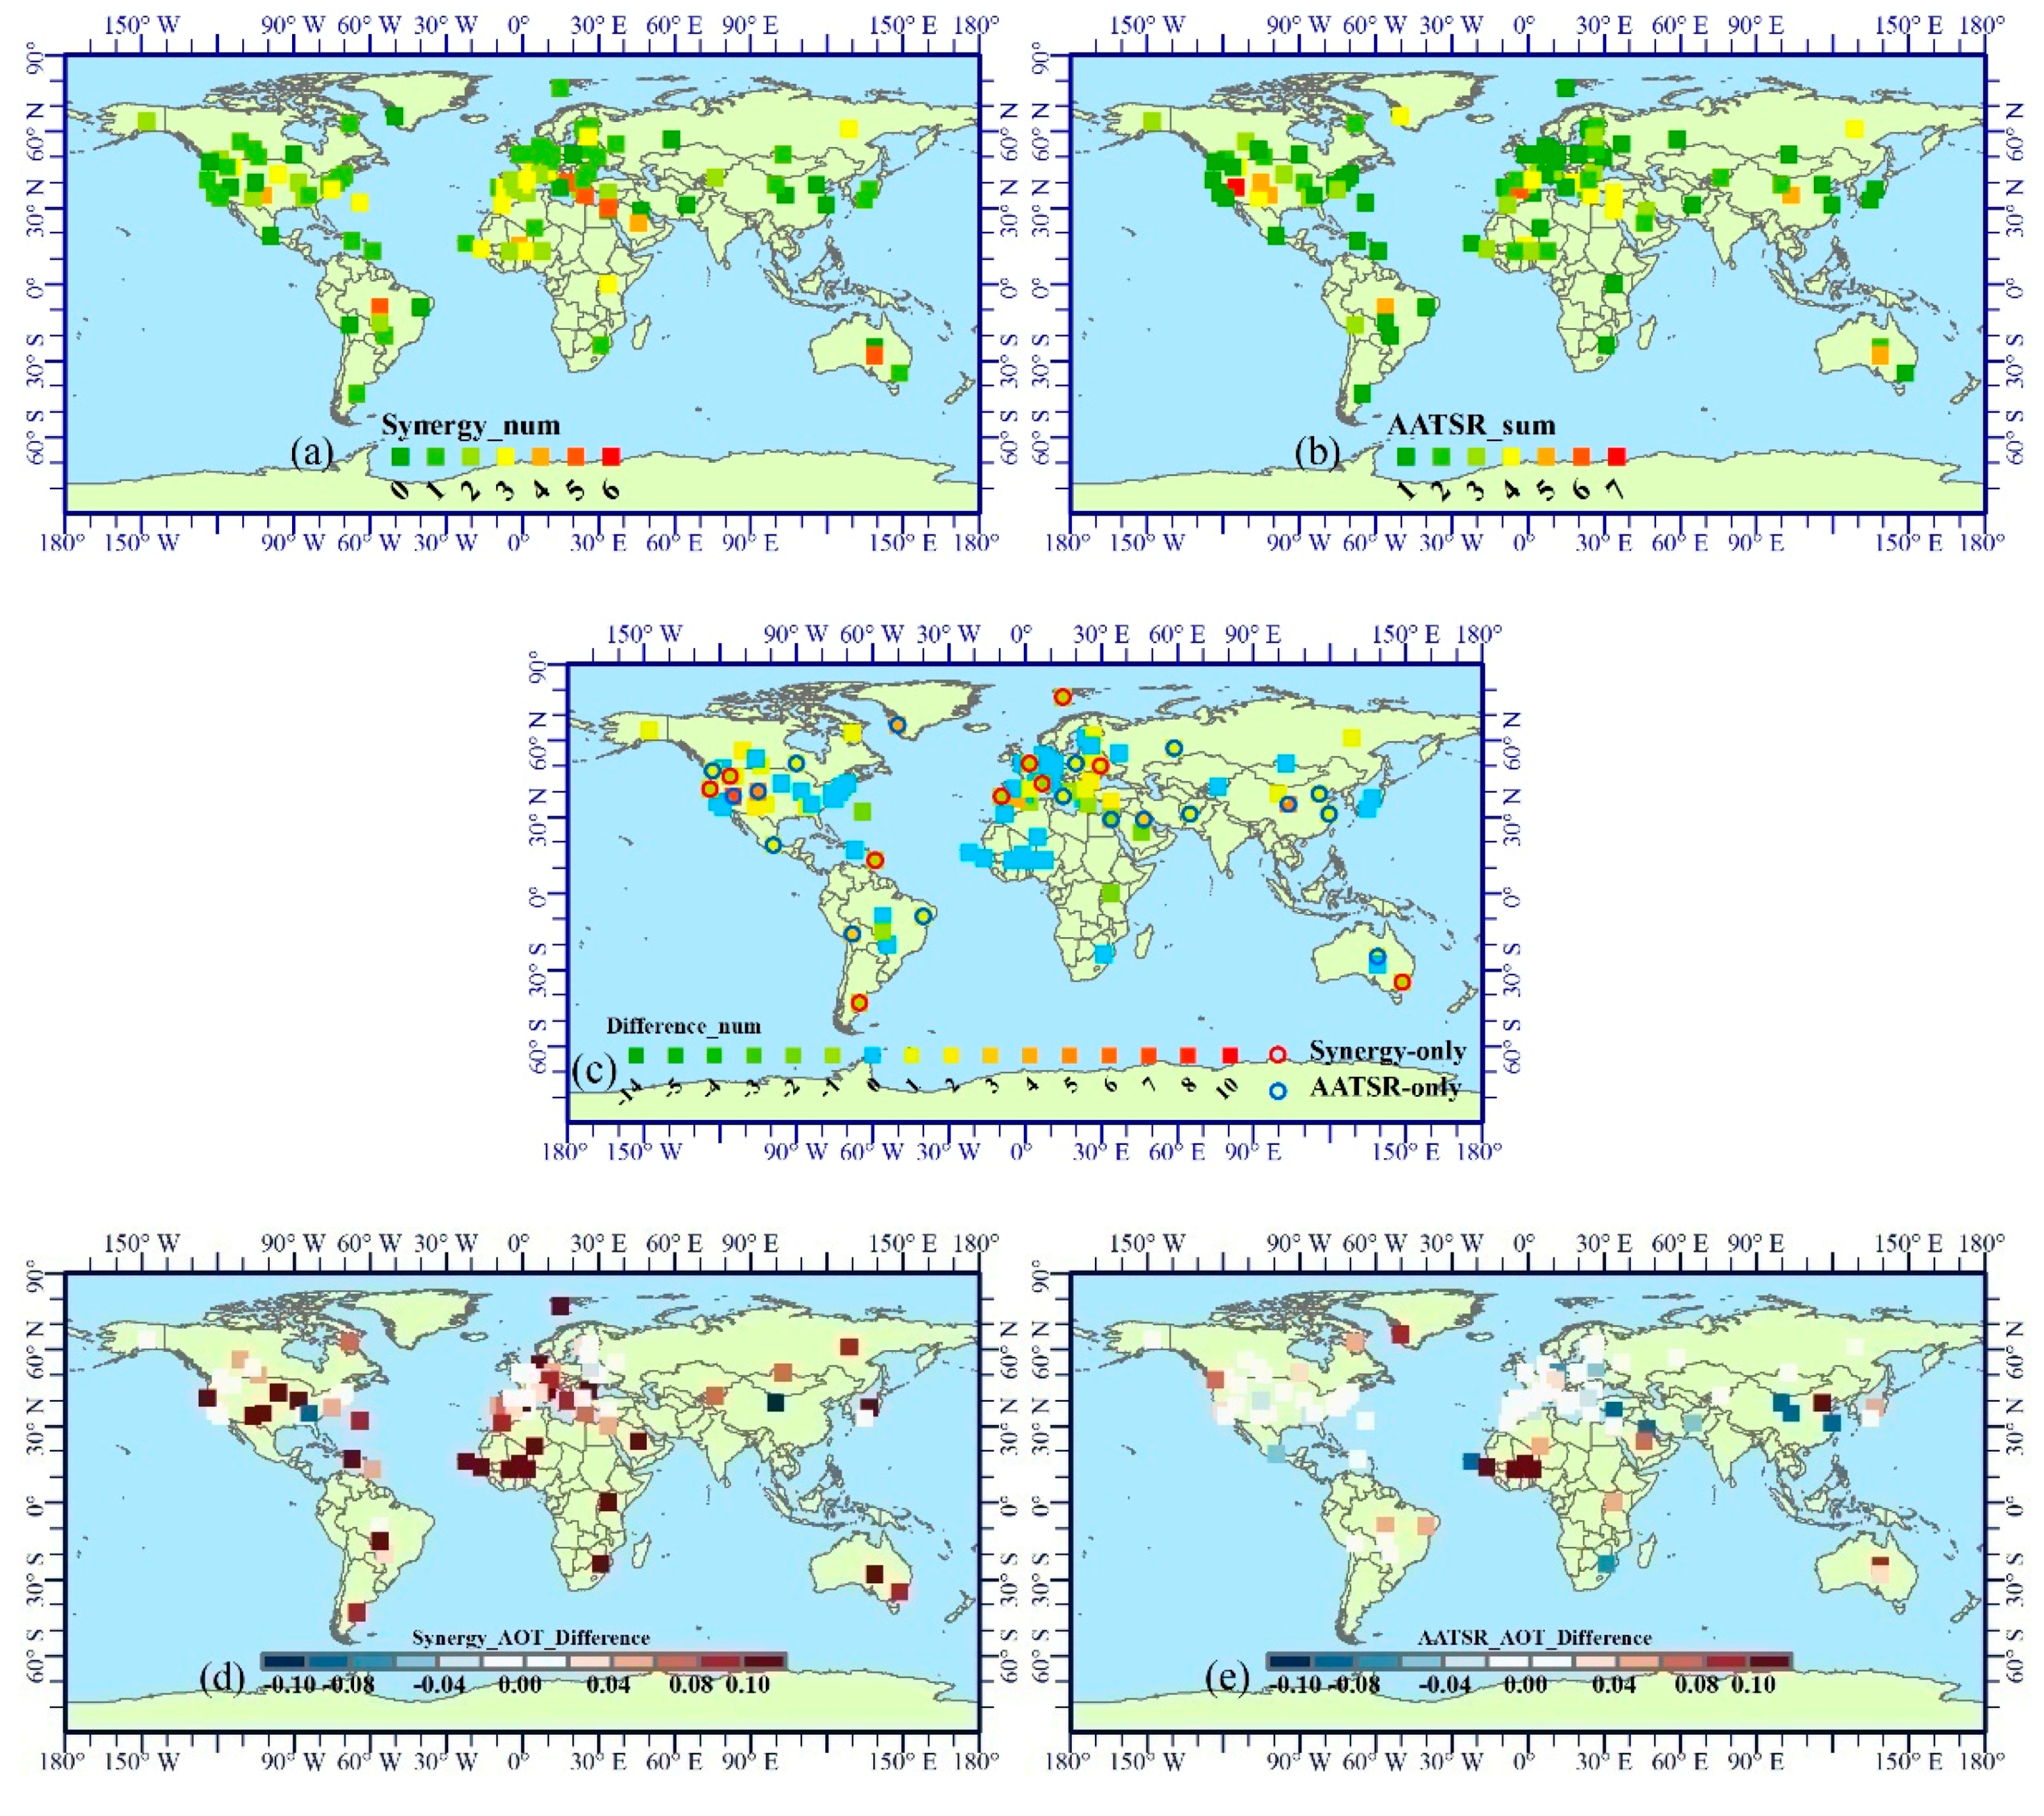
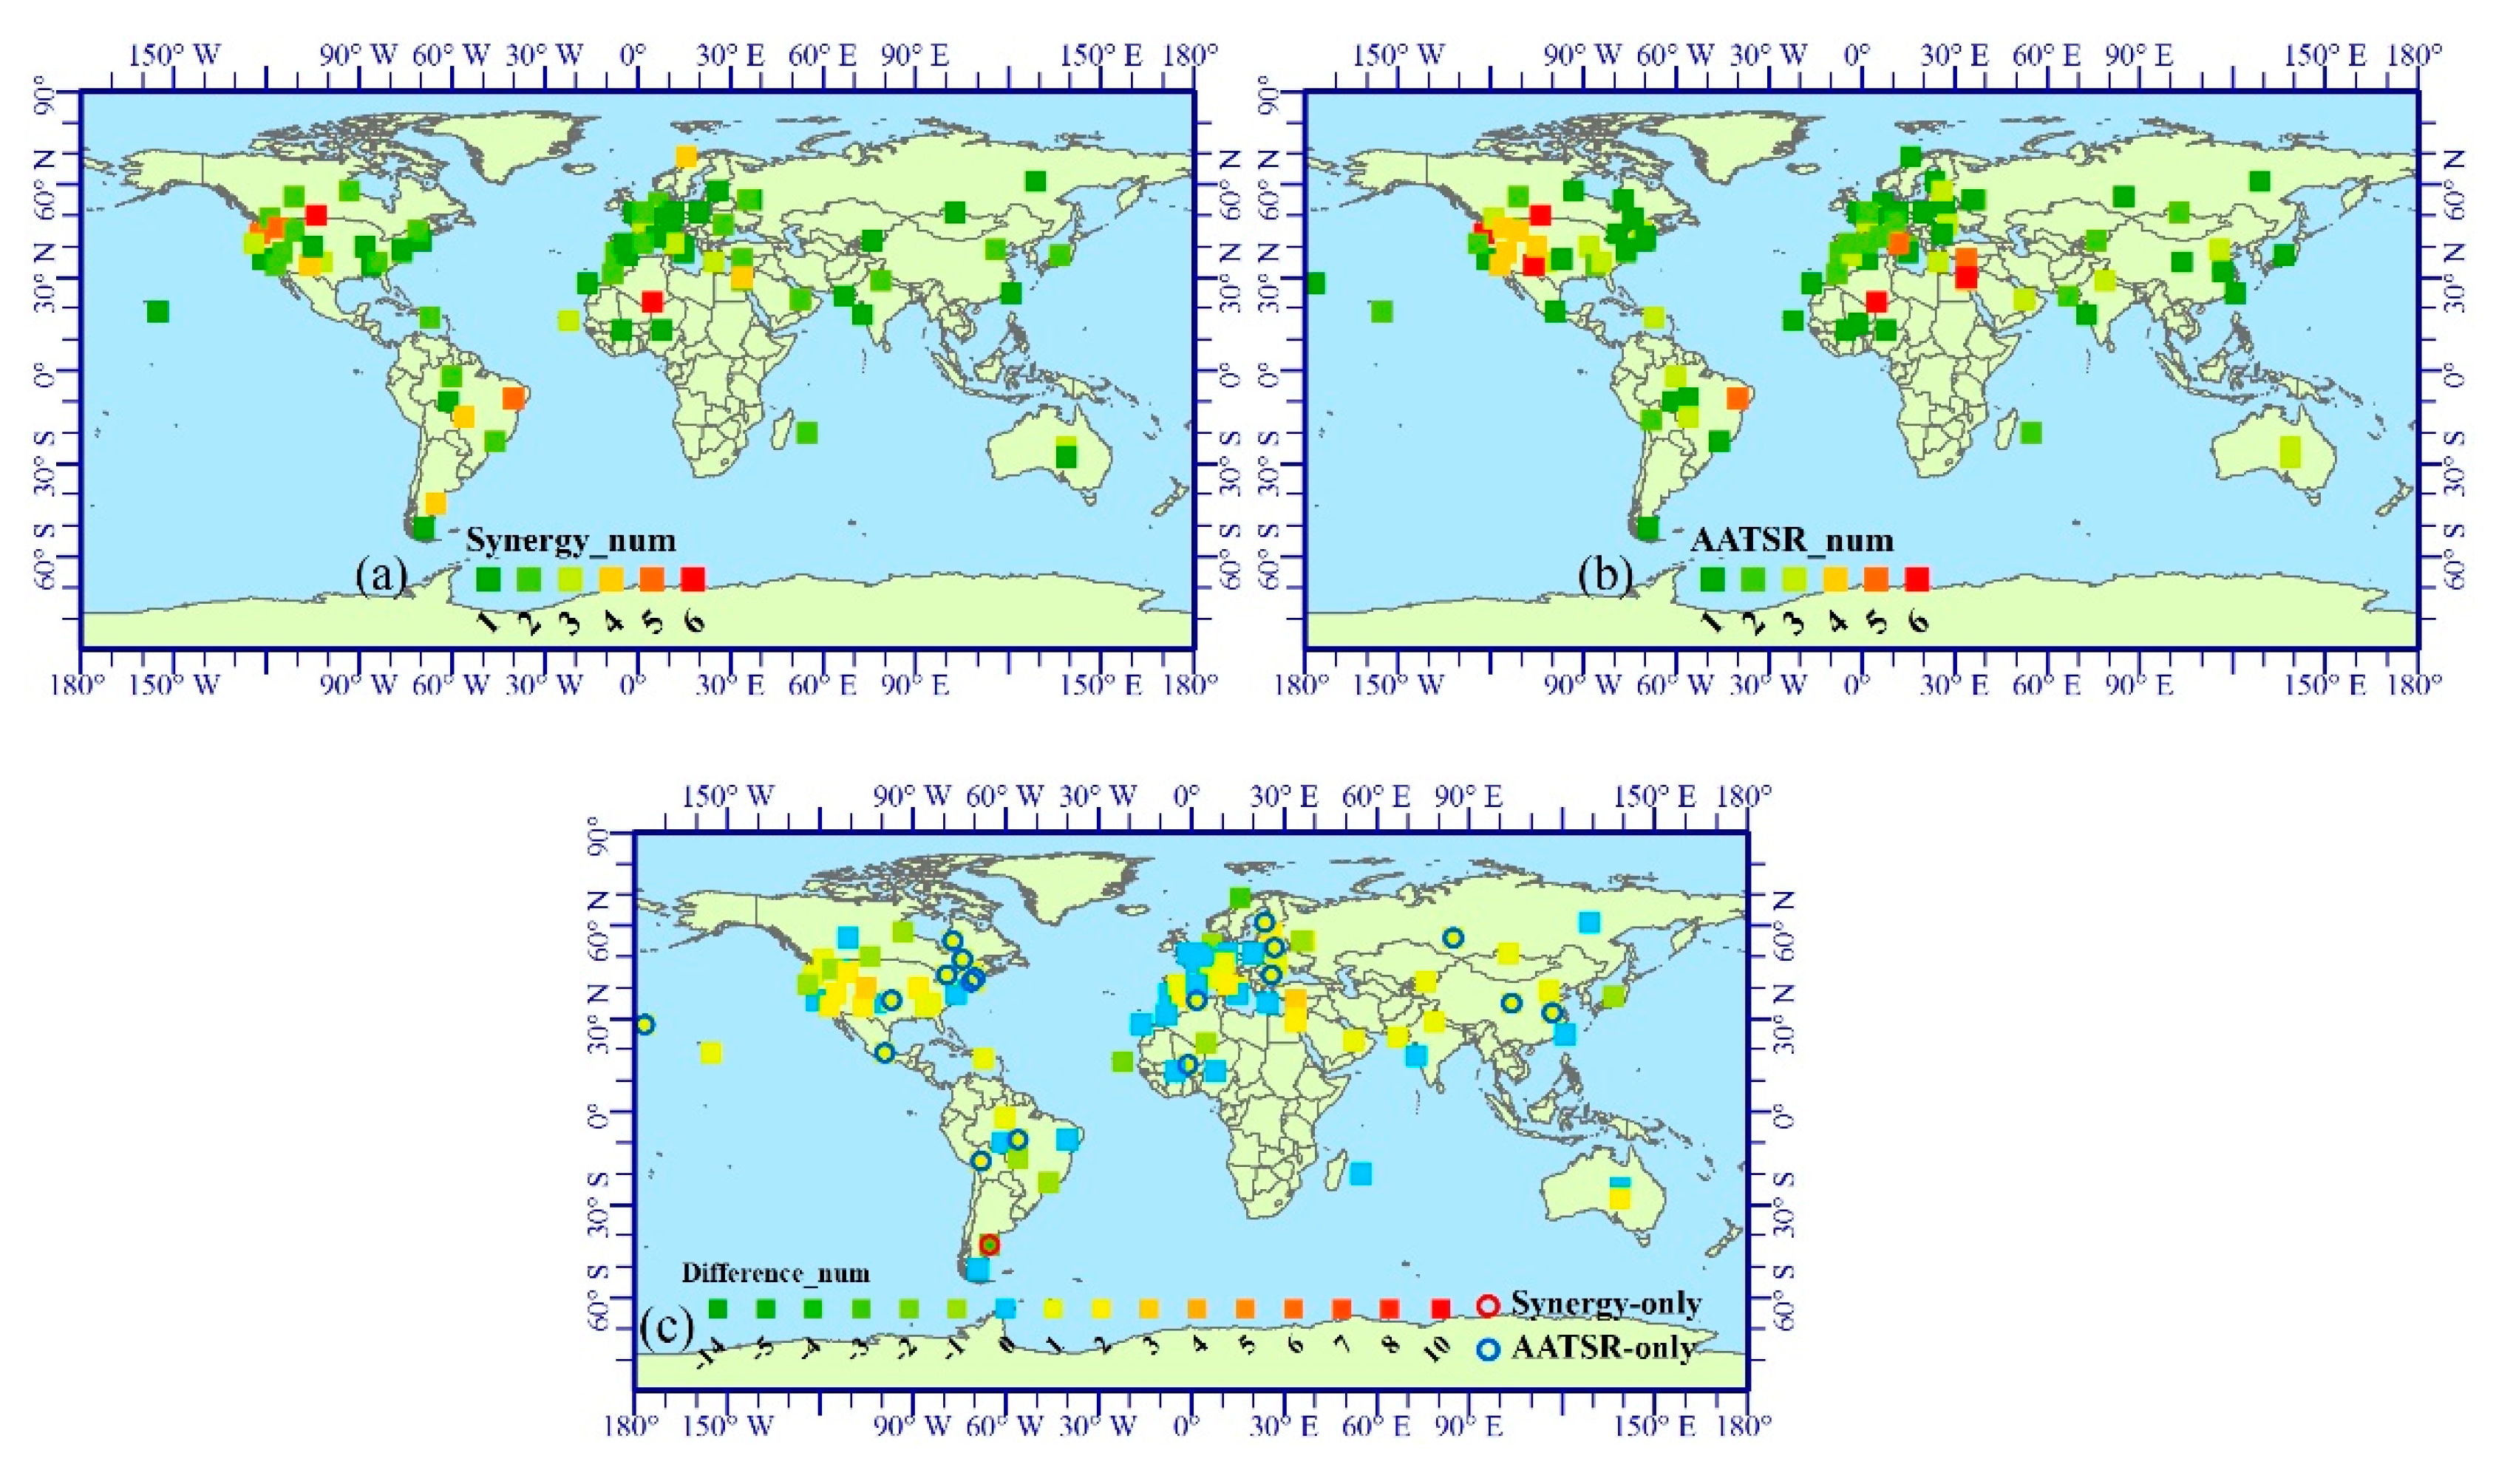
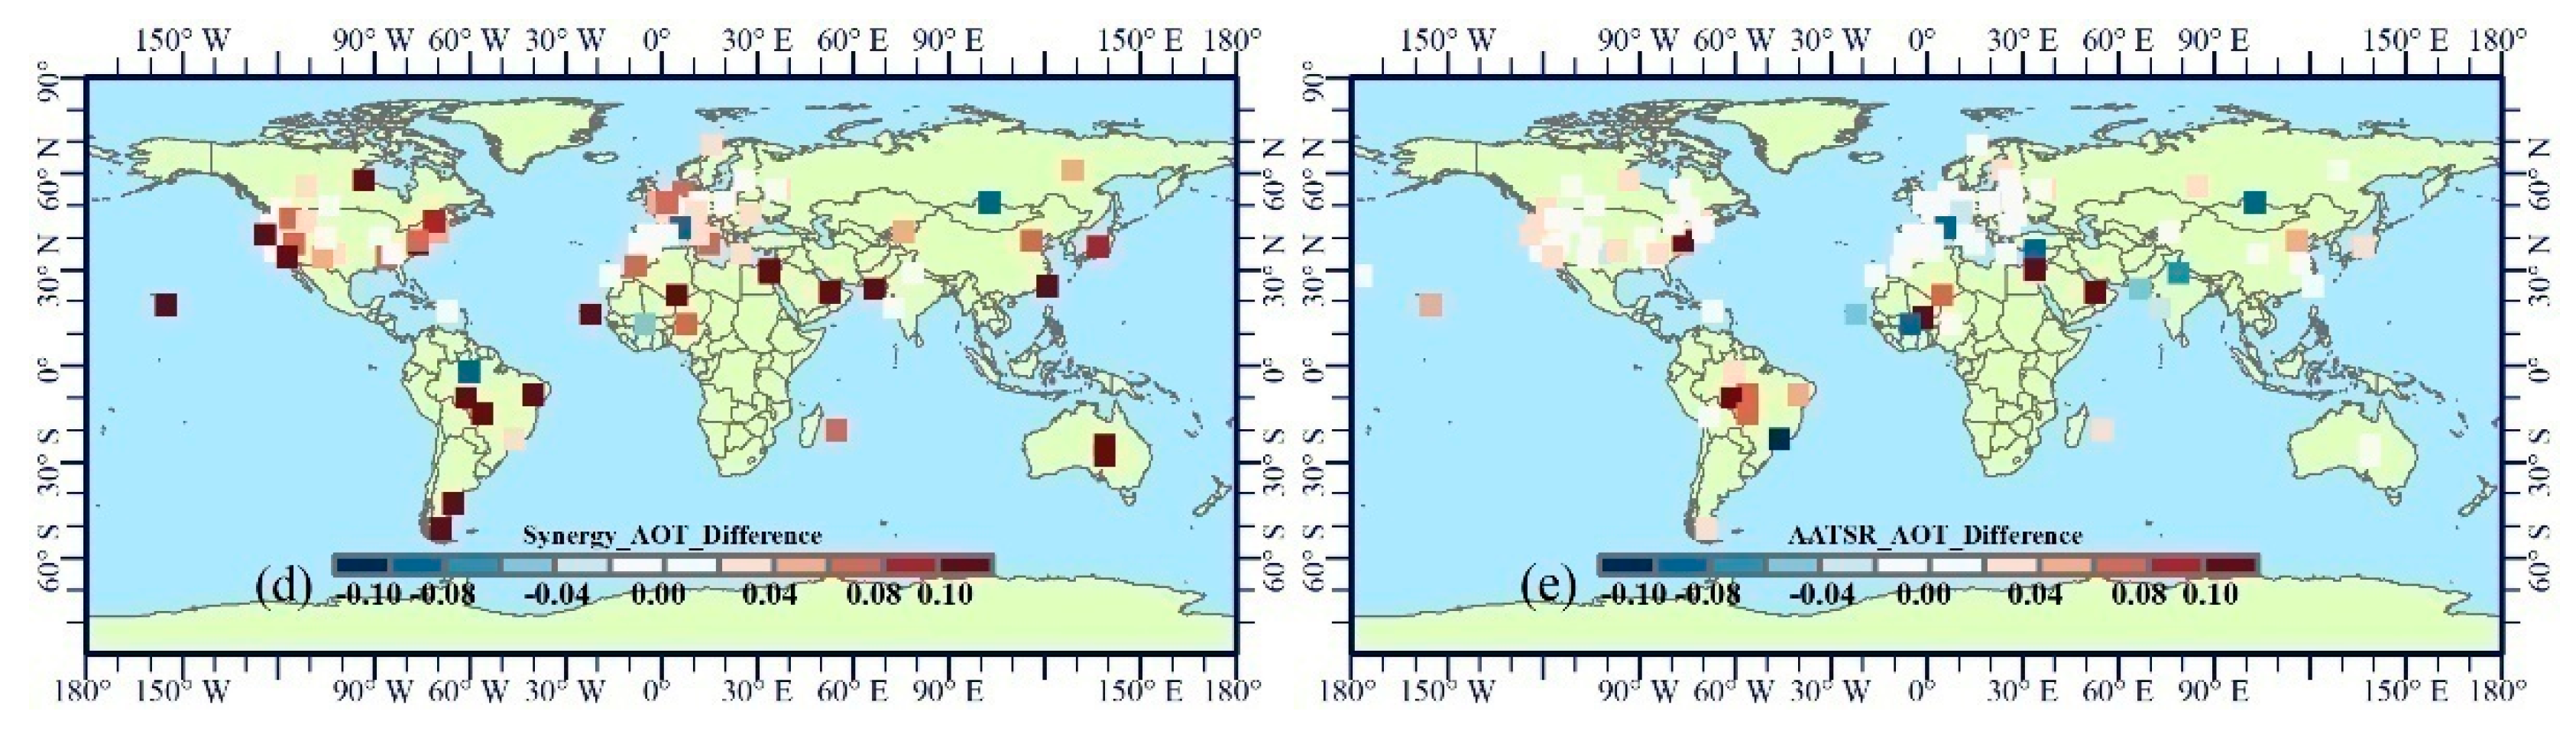
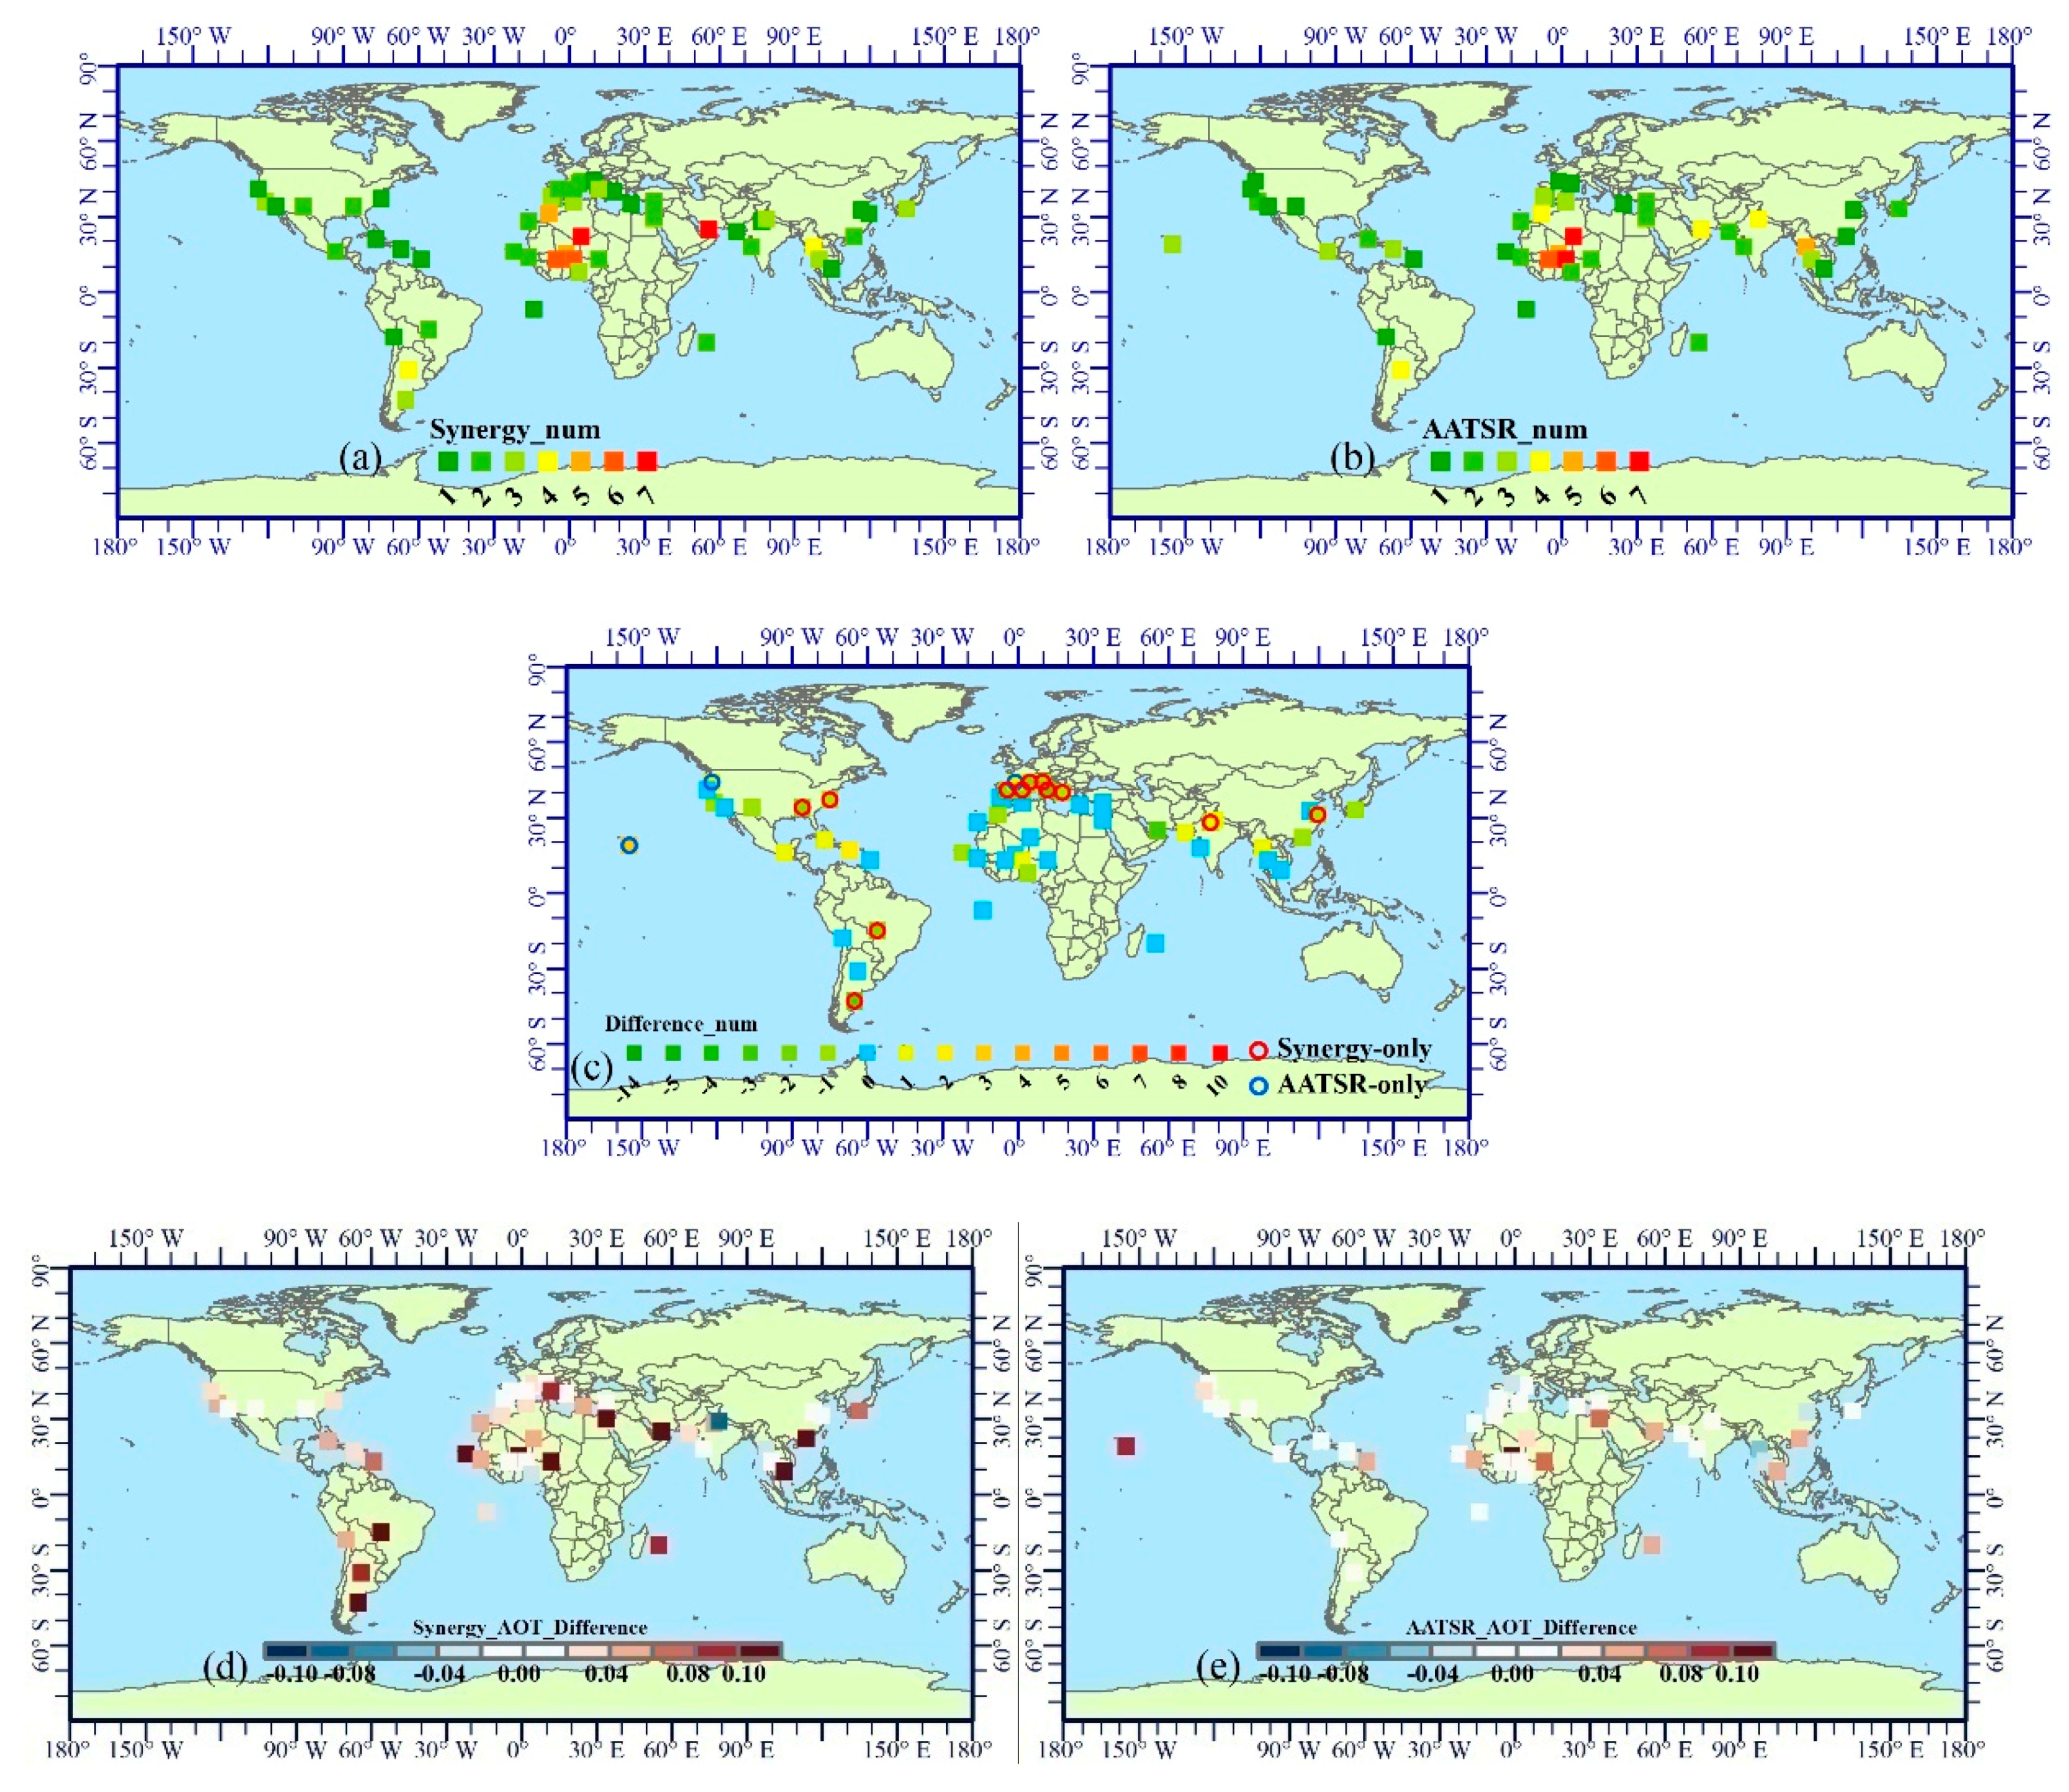
4.1. Global AOT Pattern Comparison
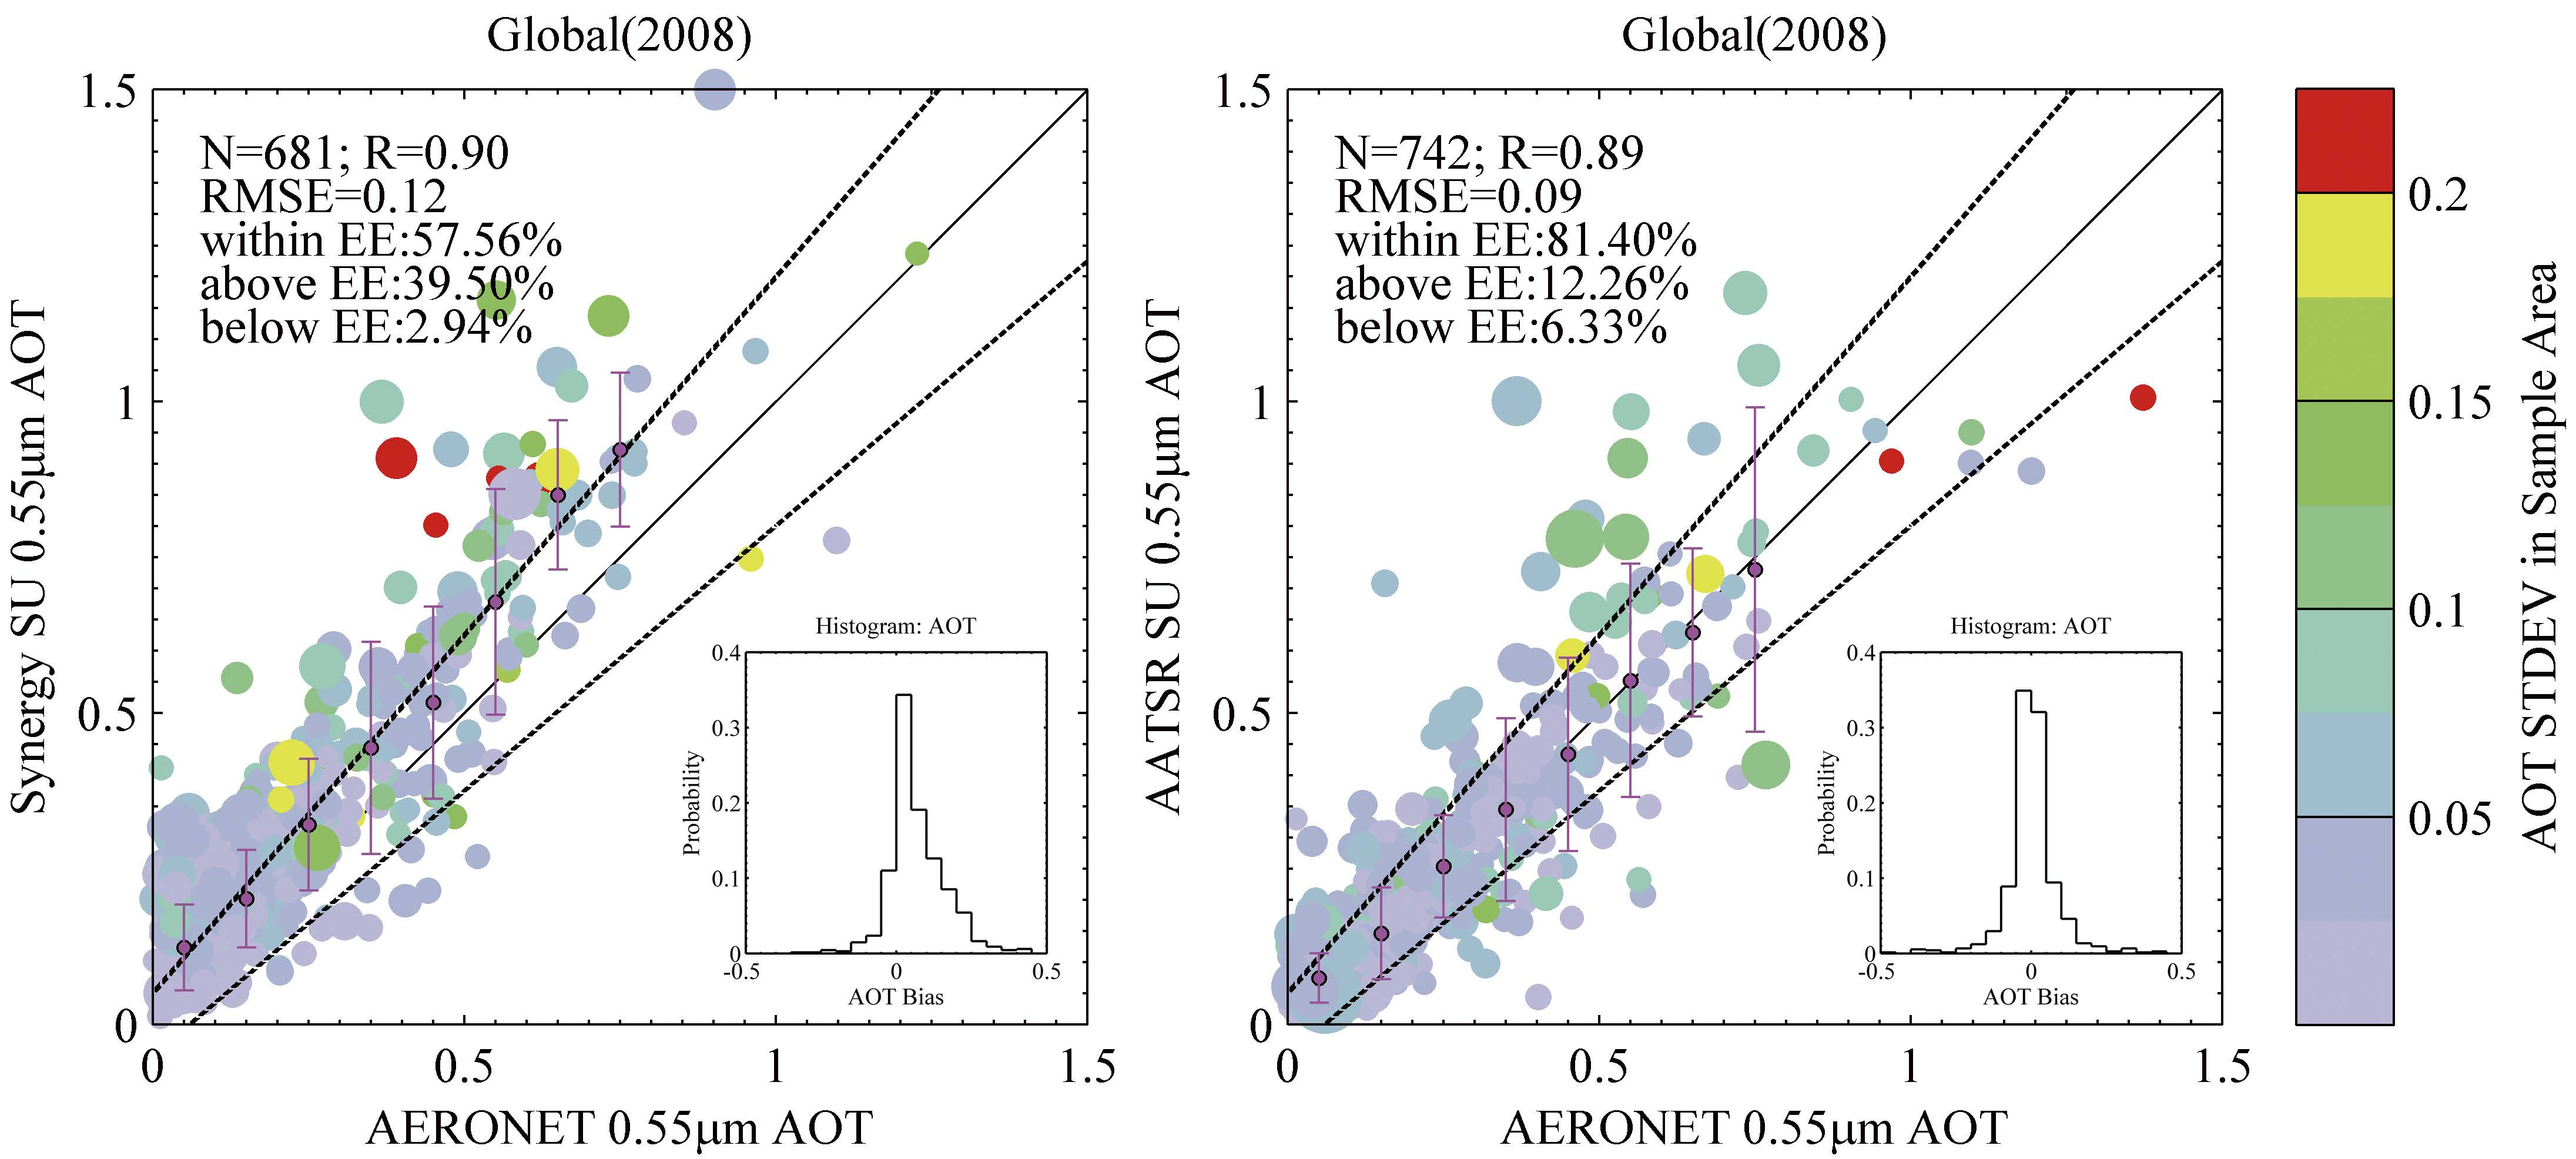
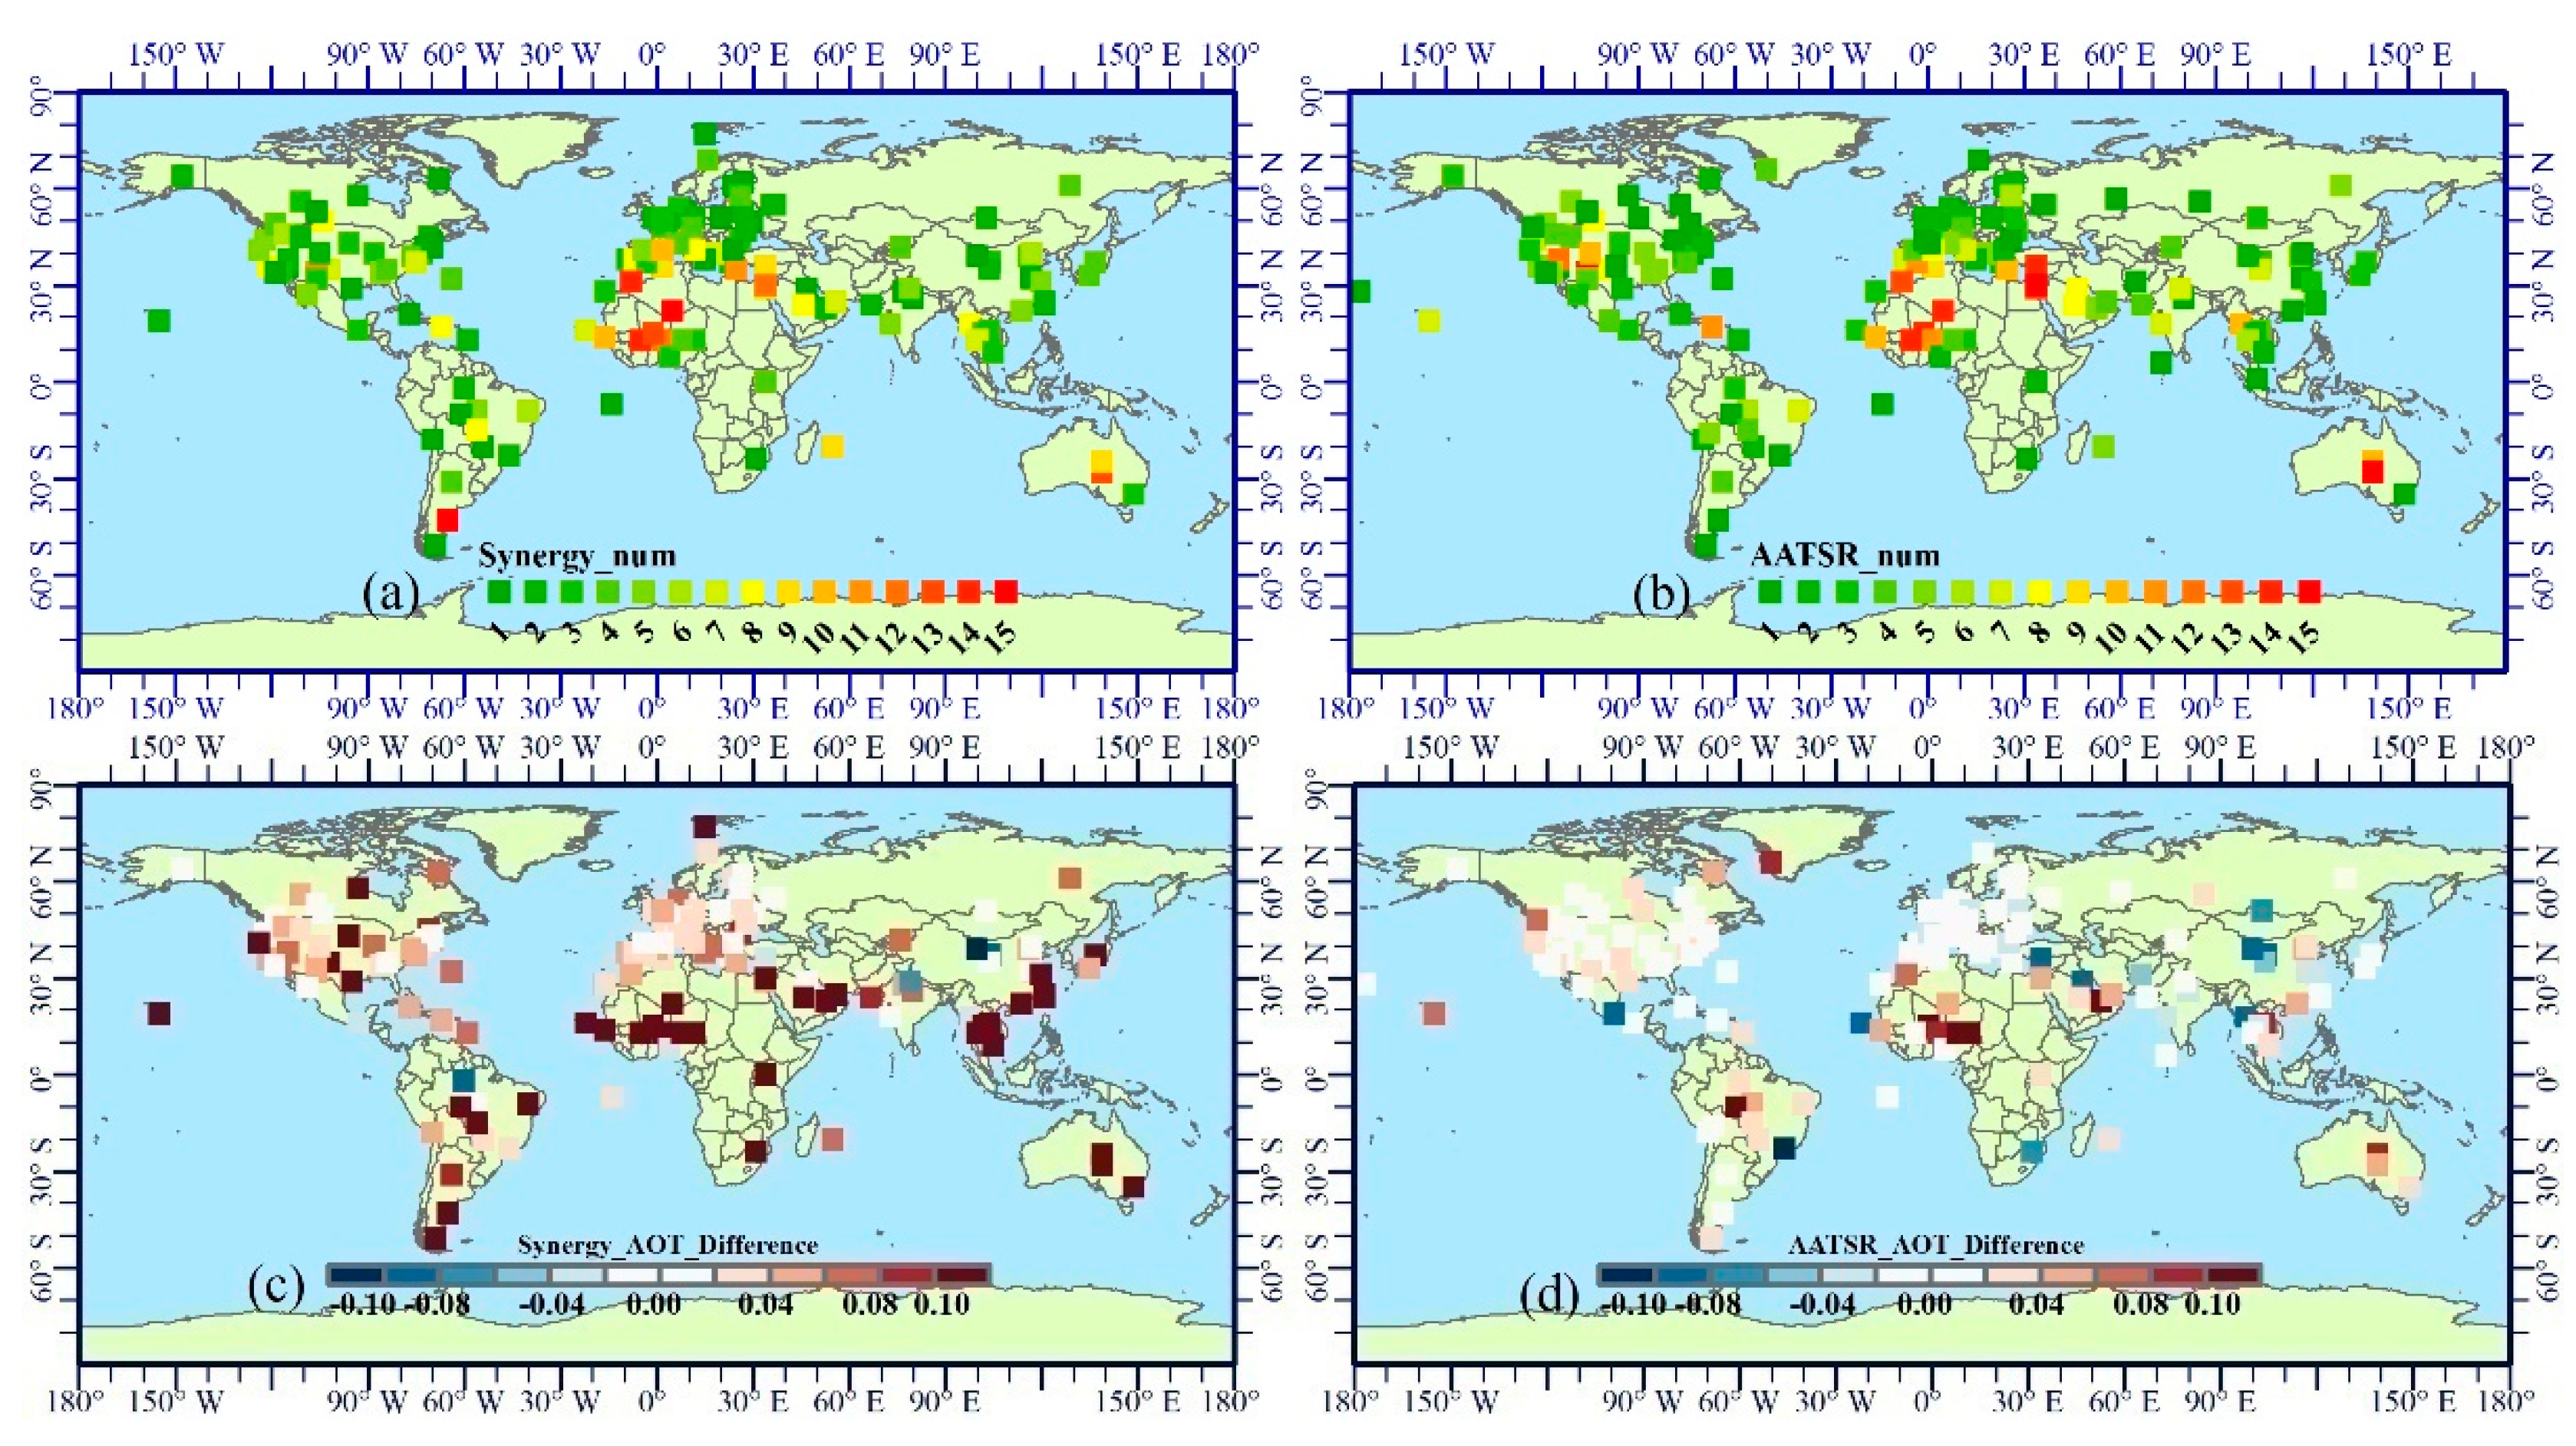
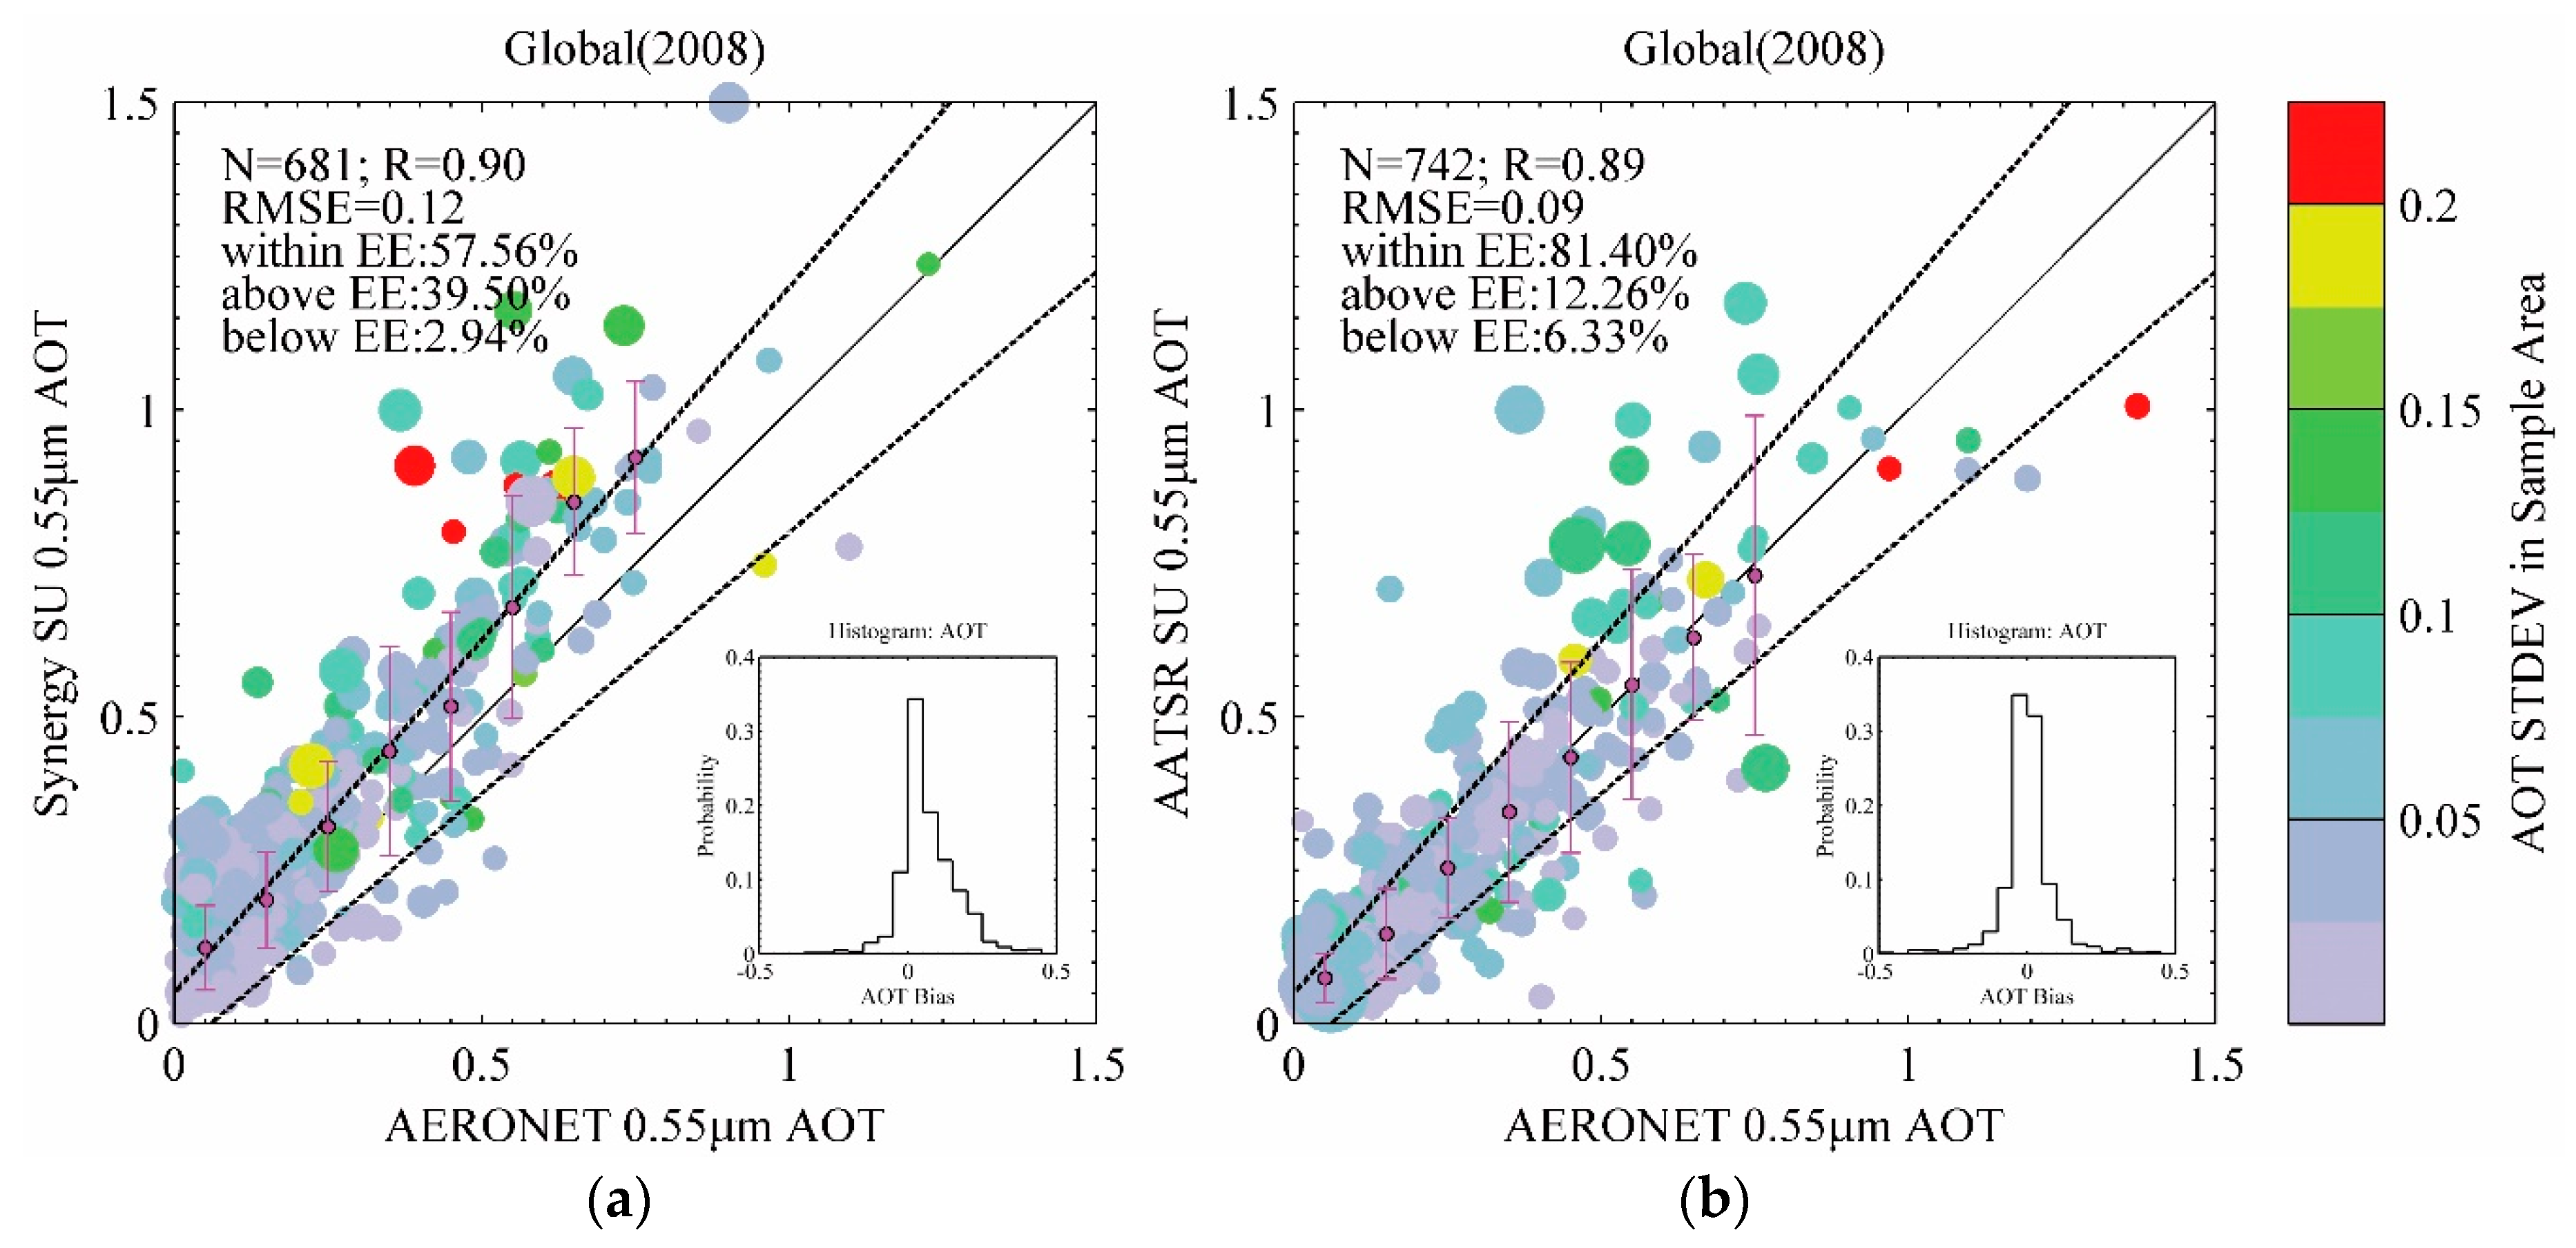
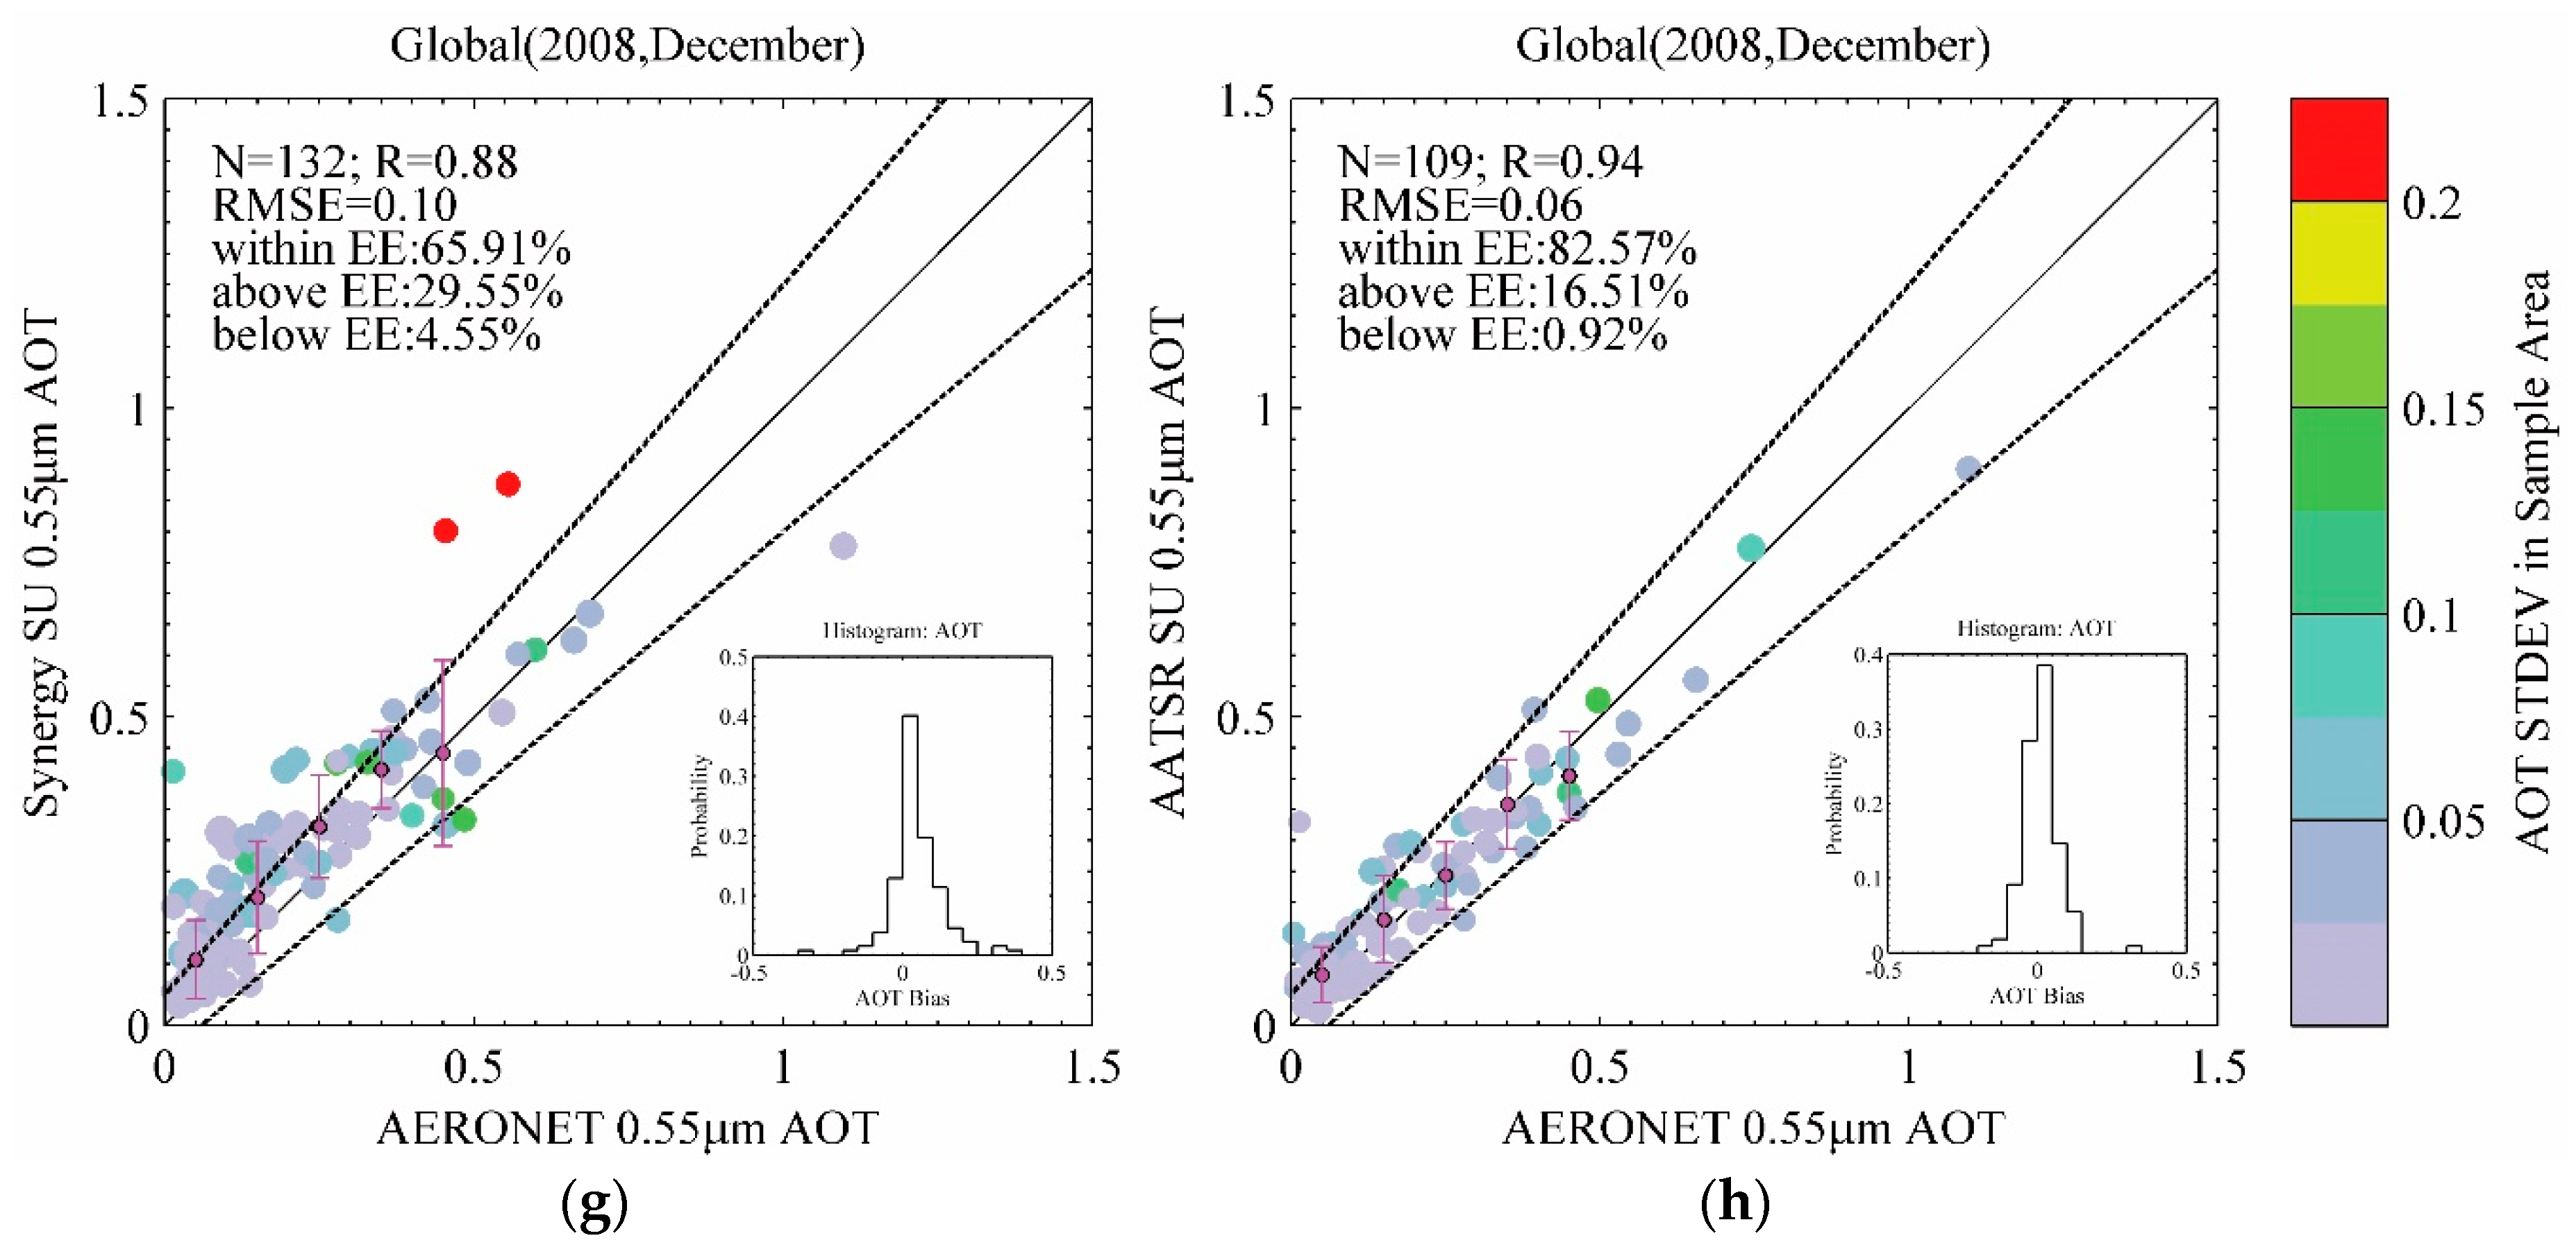
4.2. Global Validation Using AERONET
4.3. Factor Analysis
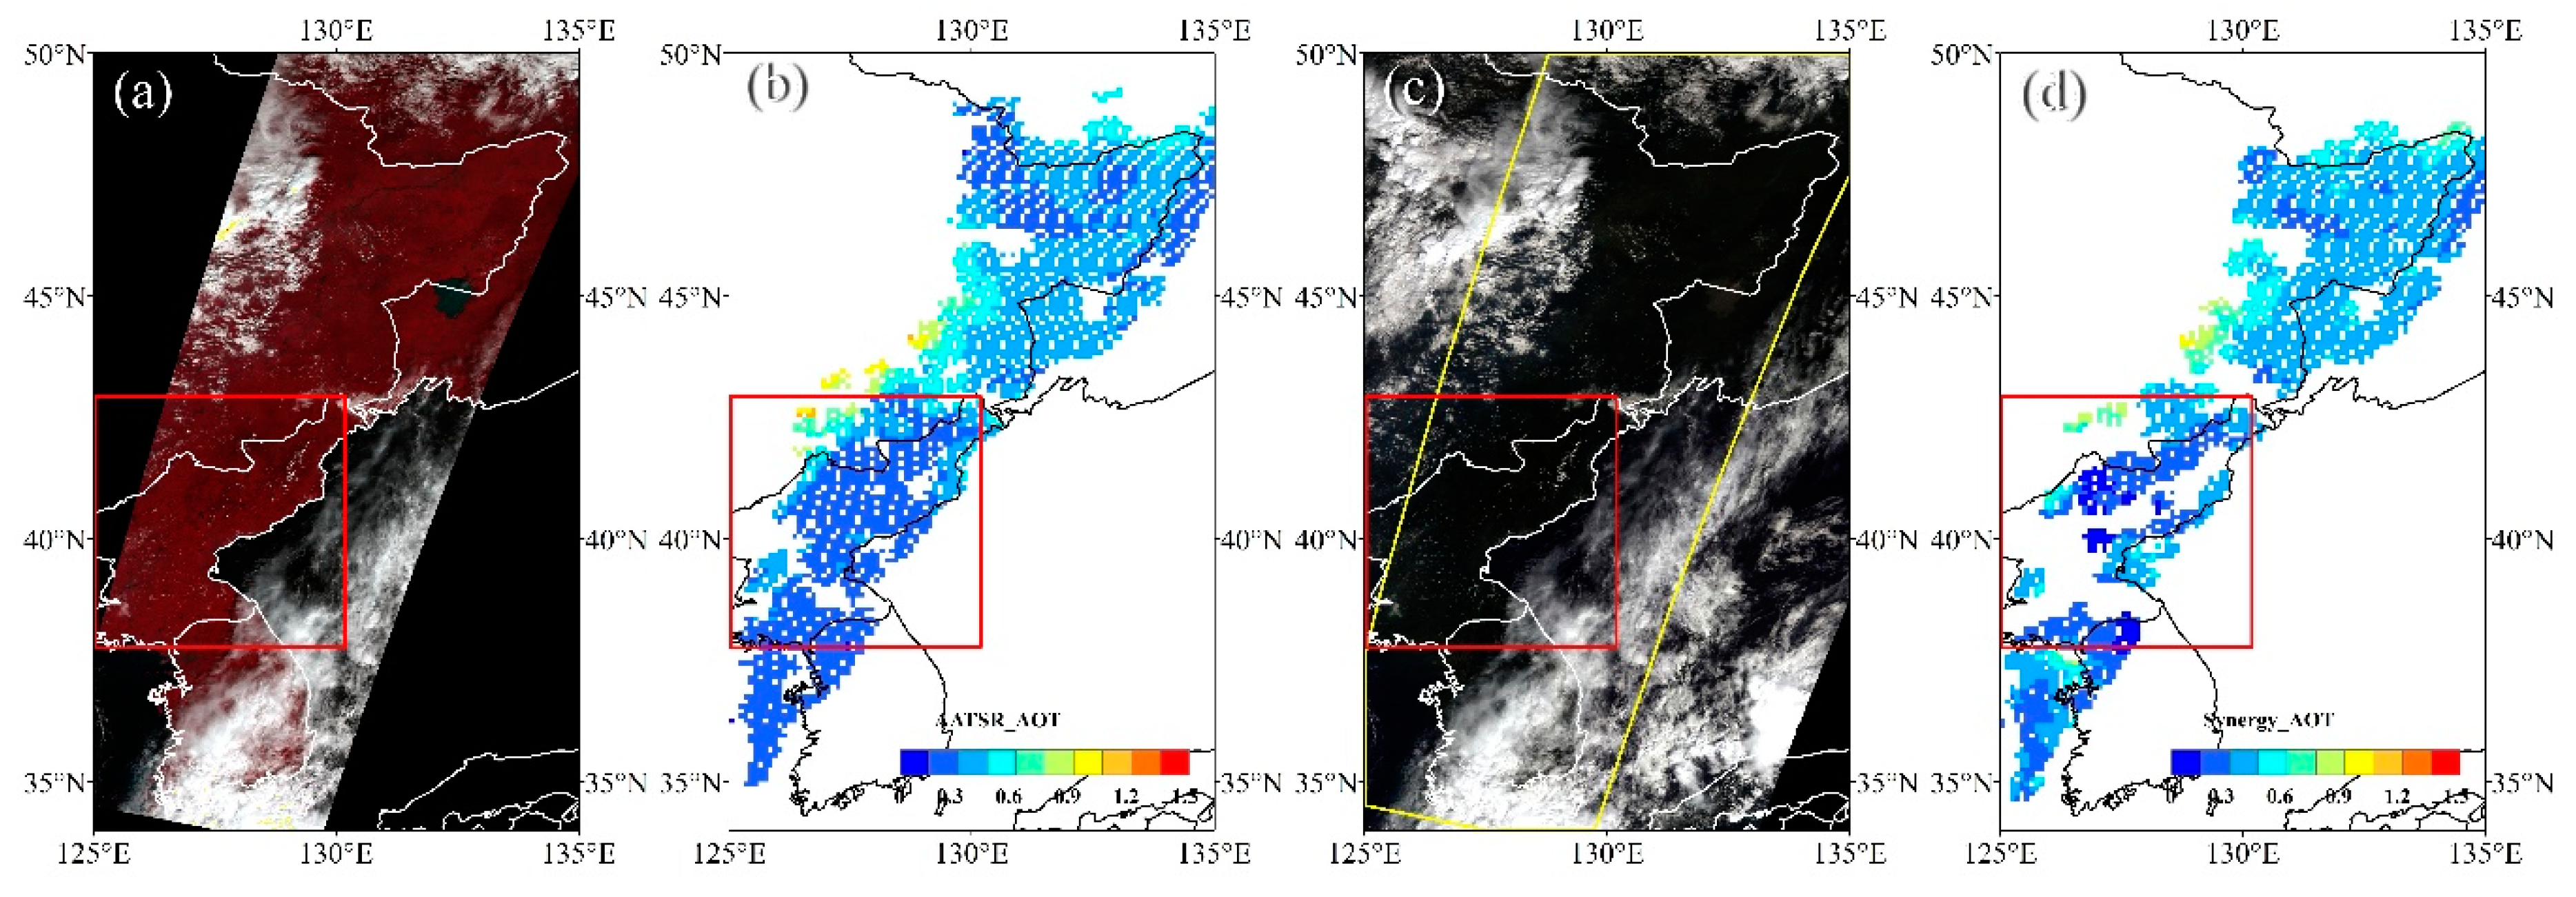
4.3.1. Cloud Screening
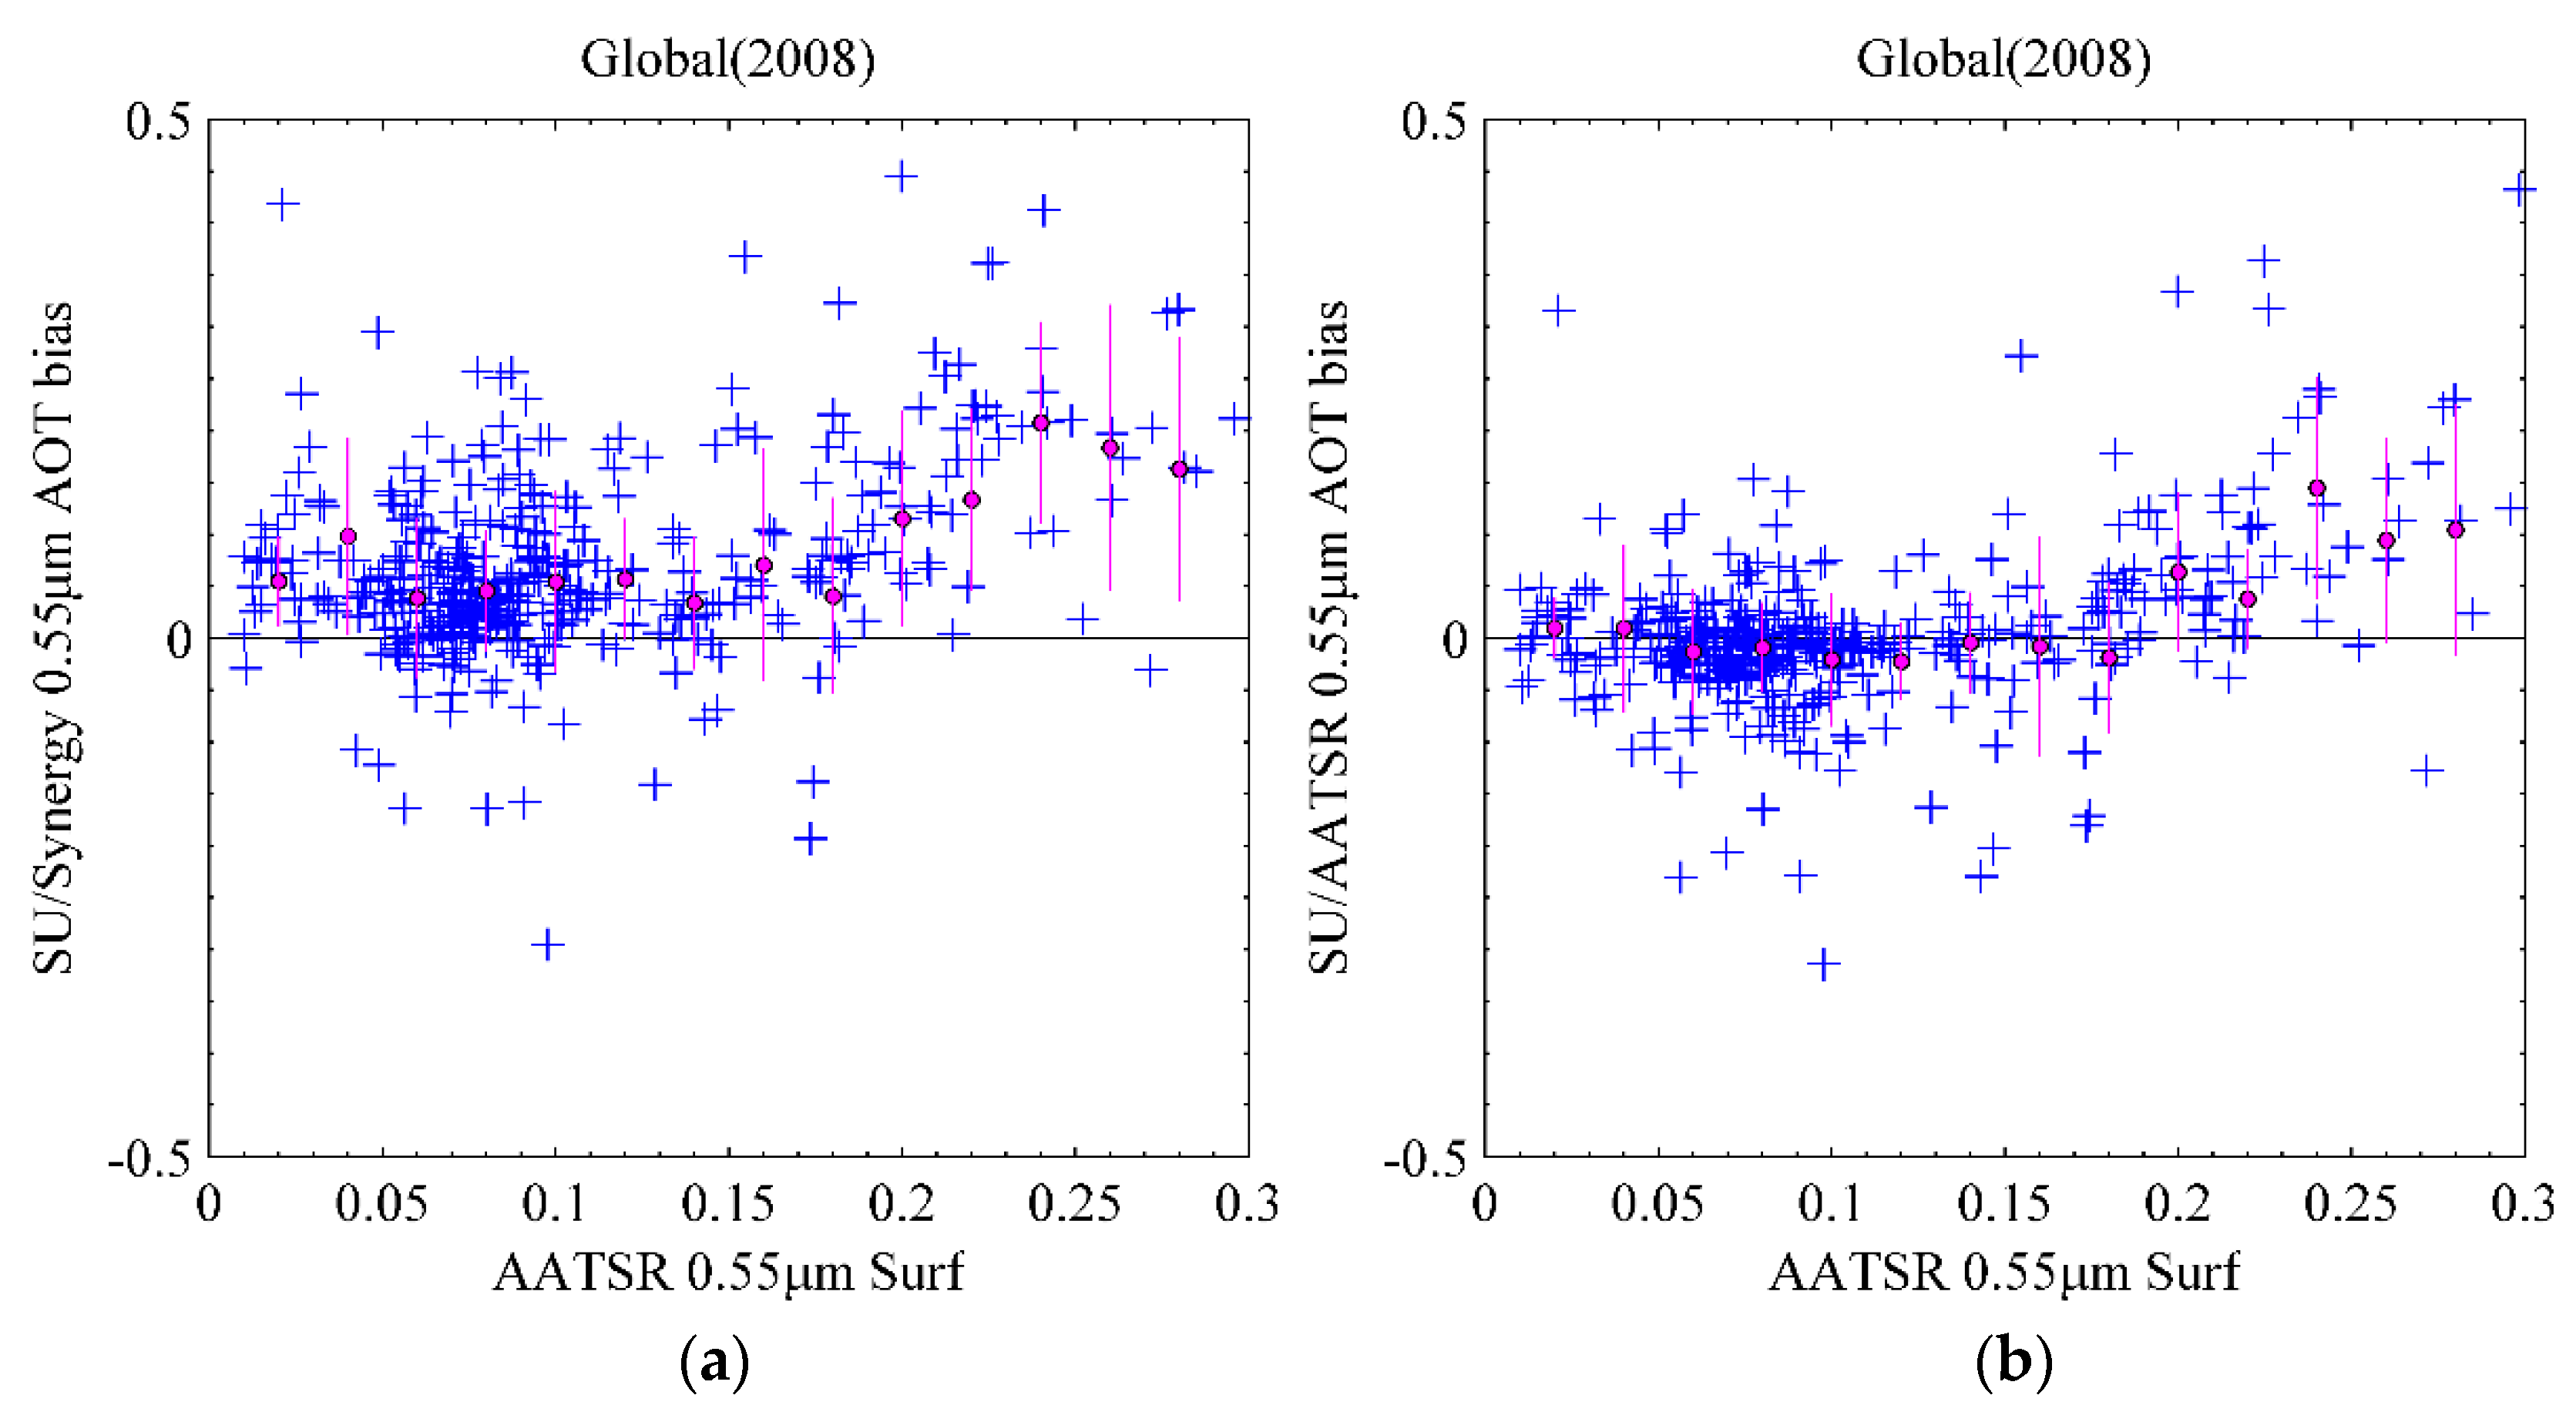
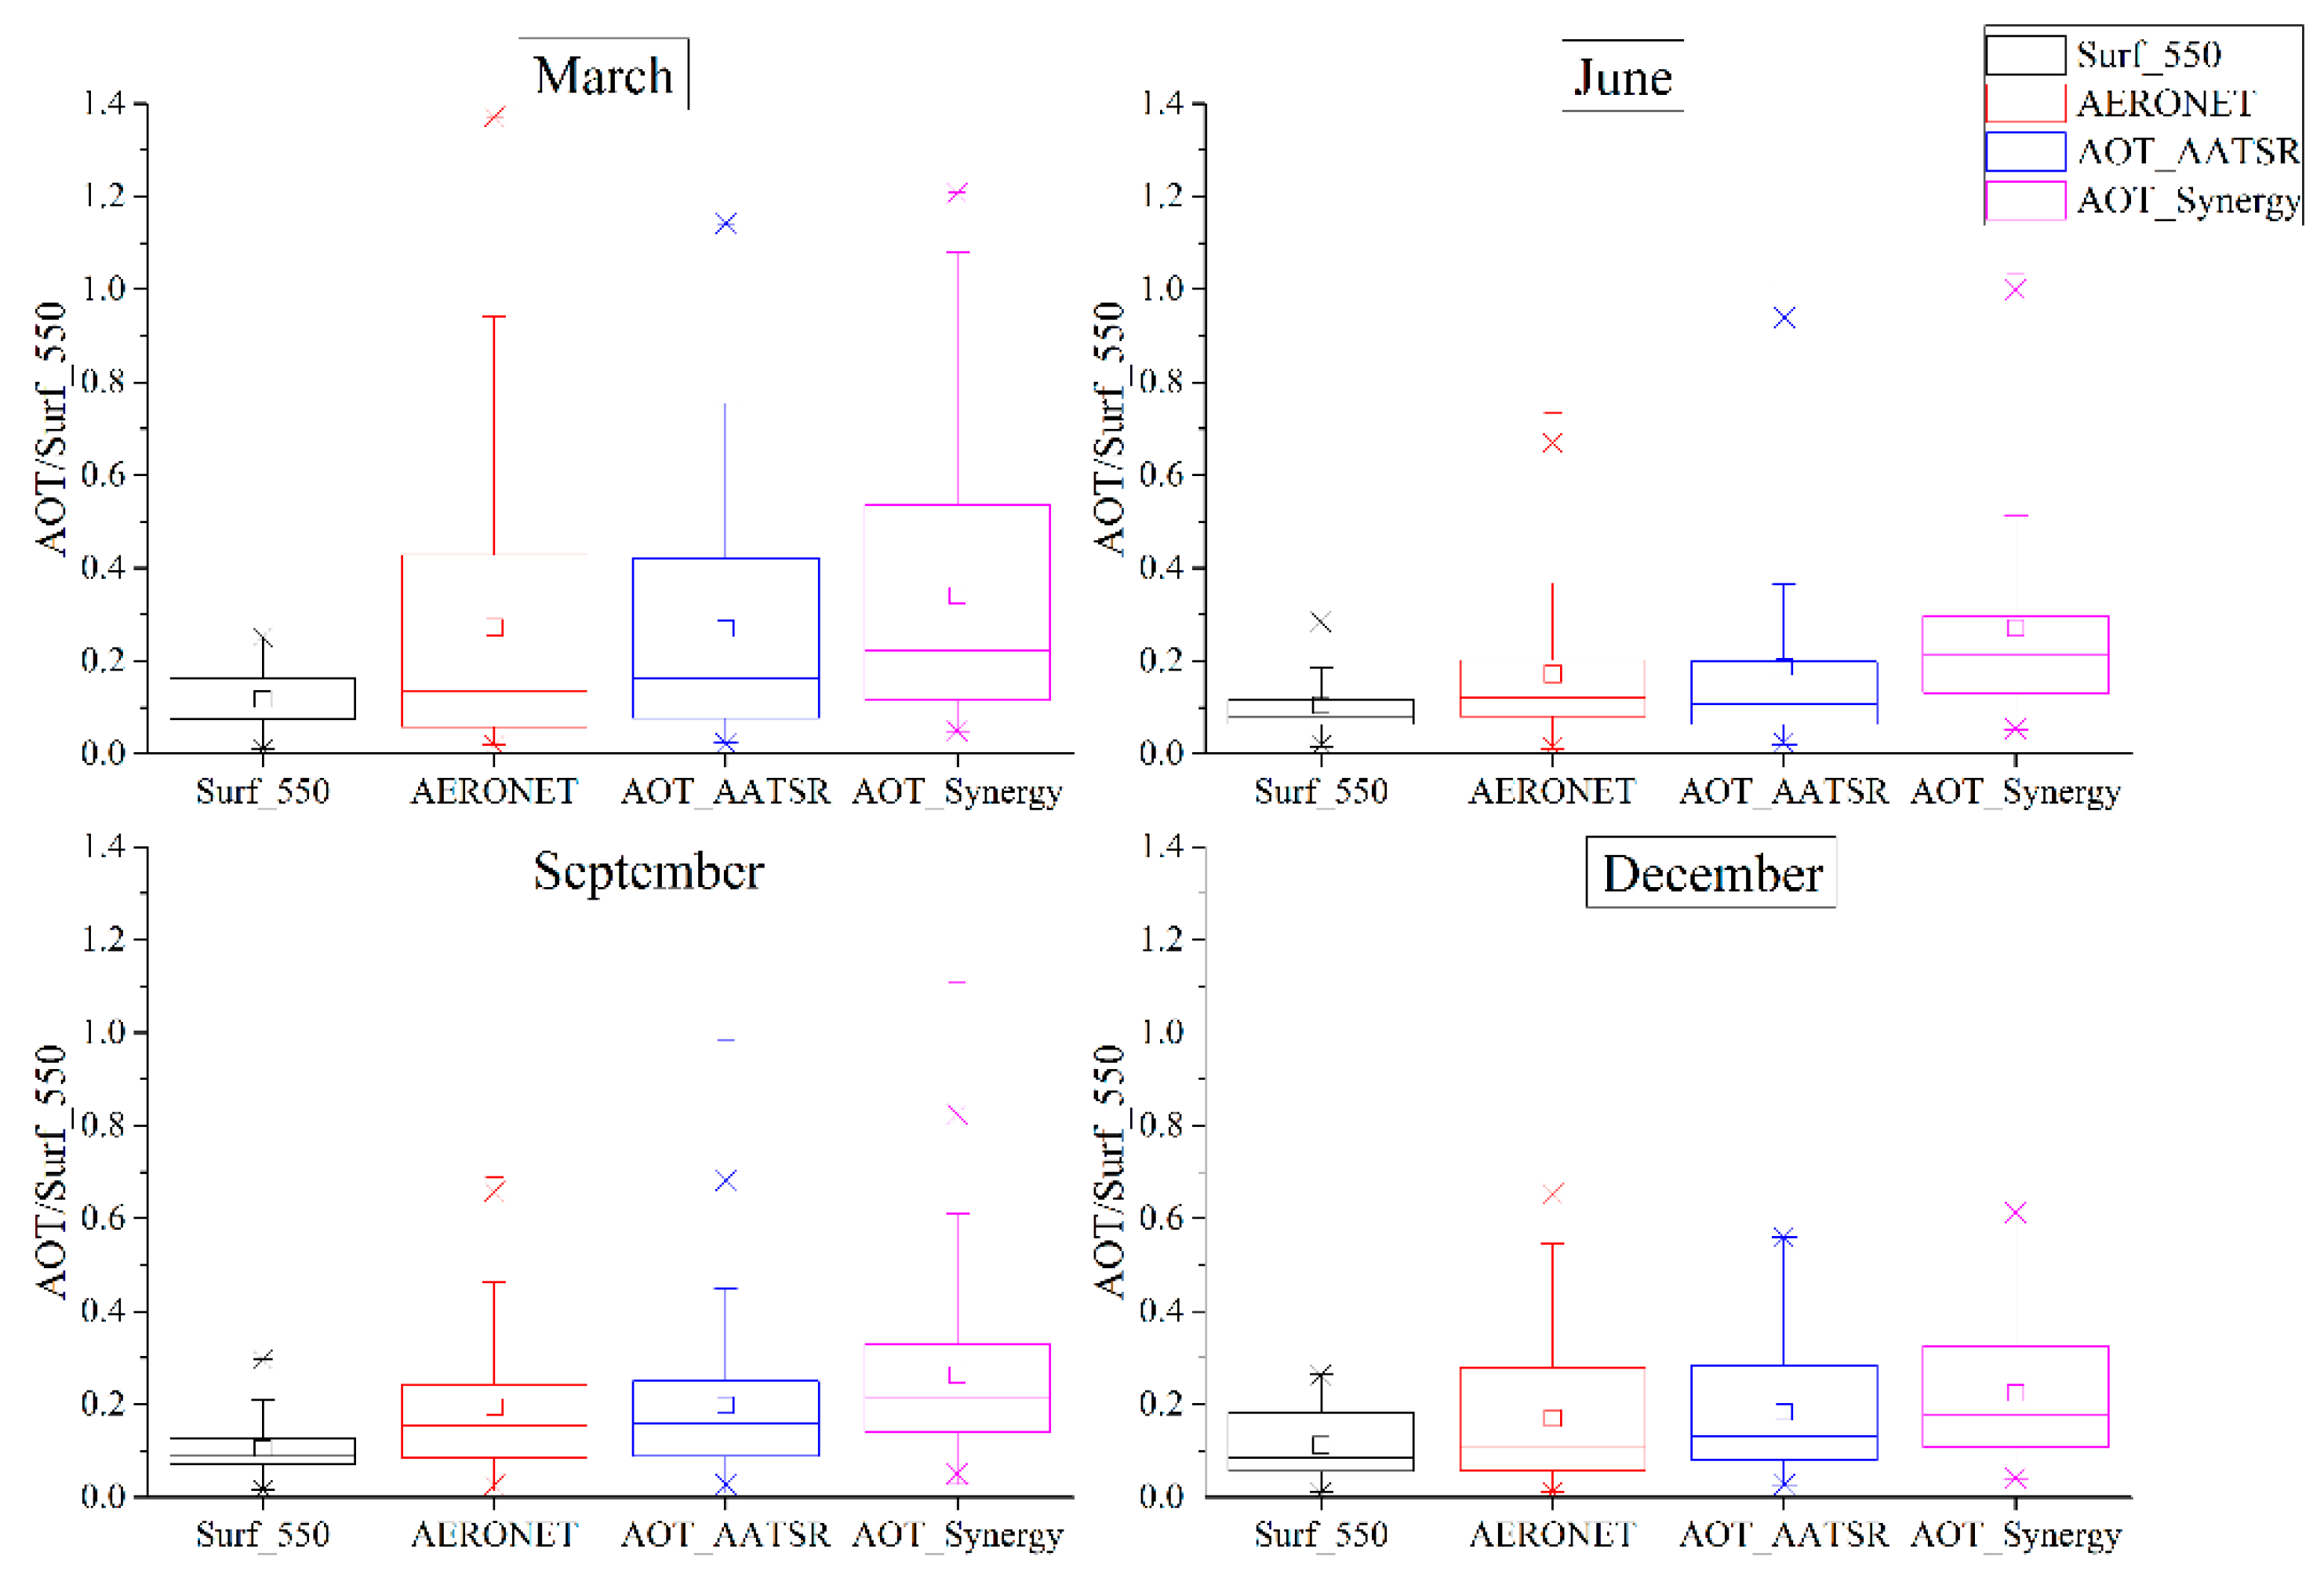
4.3.2. Surface Reflectance
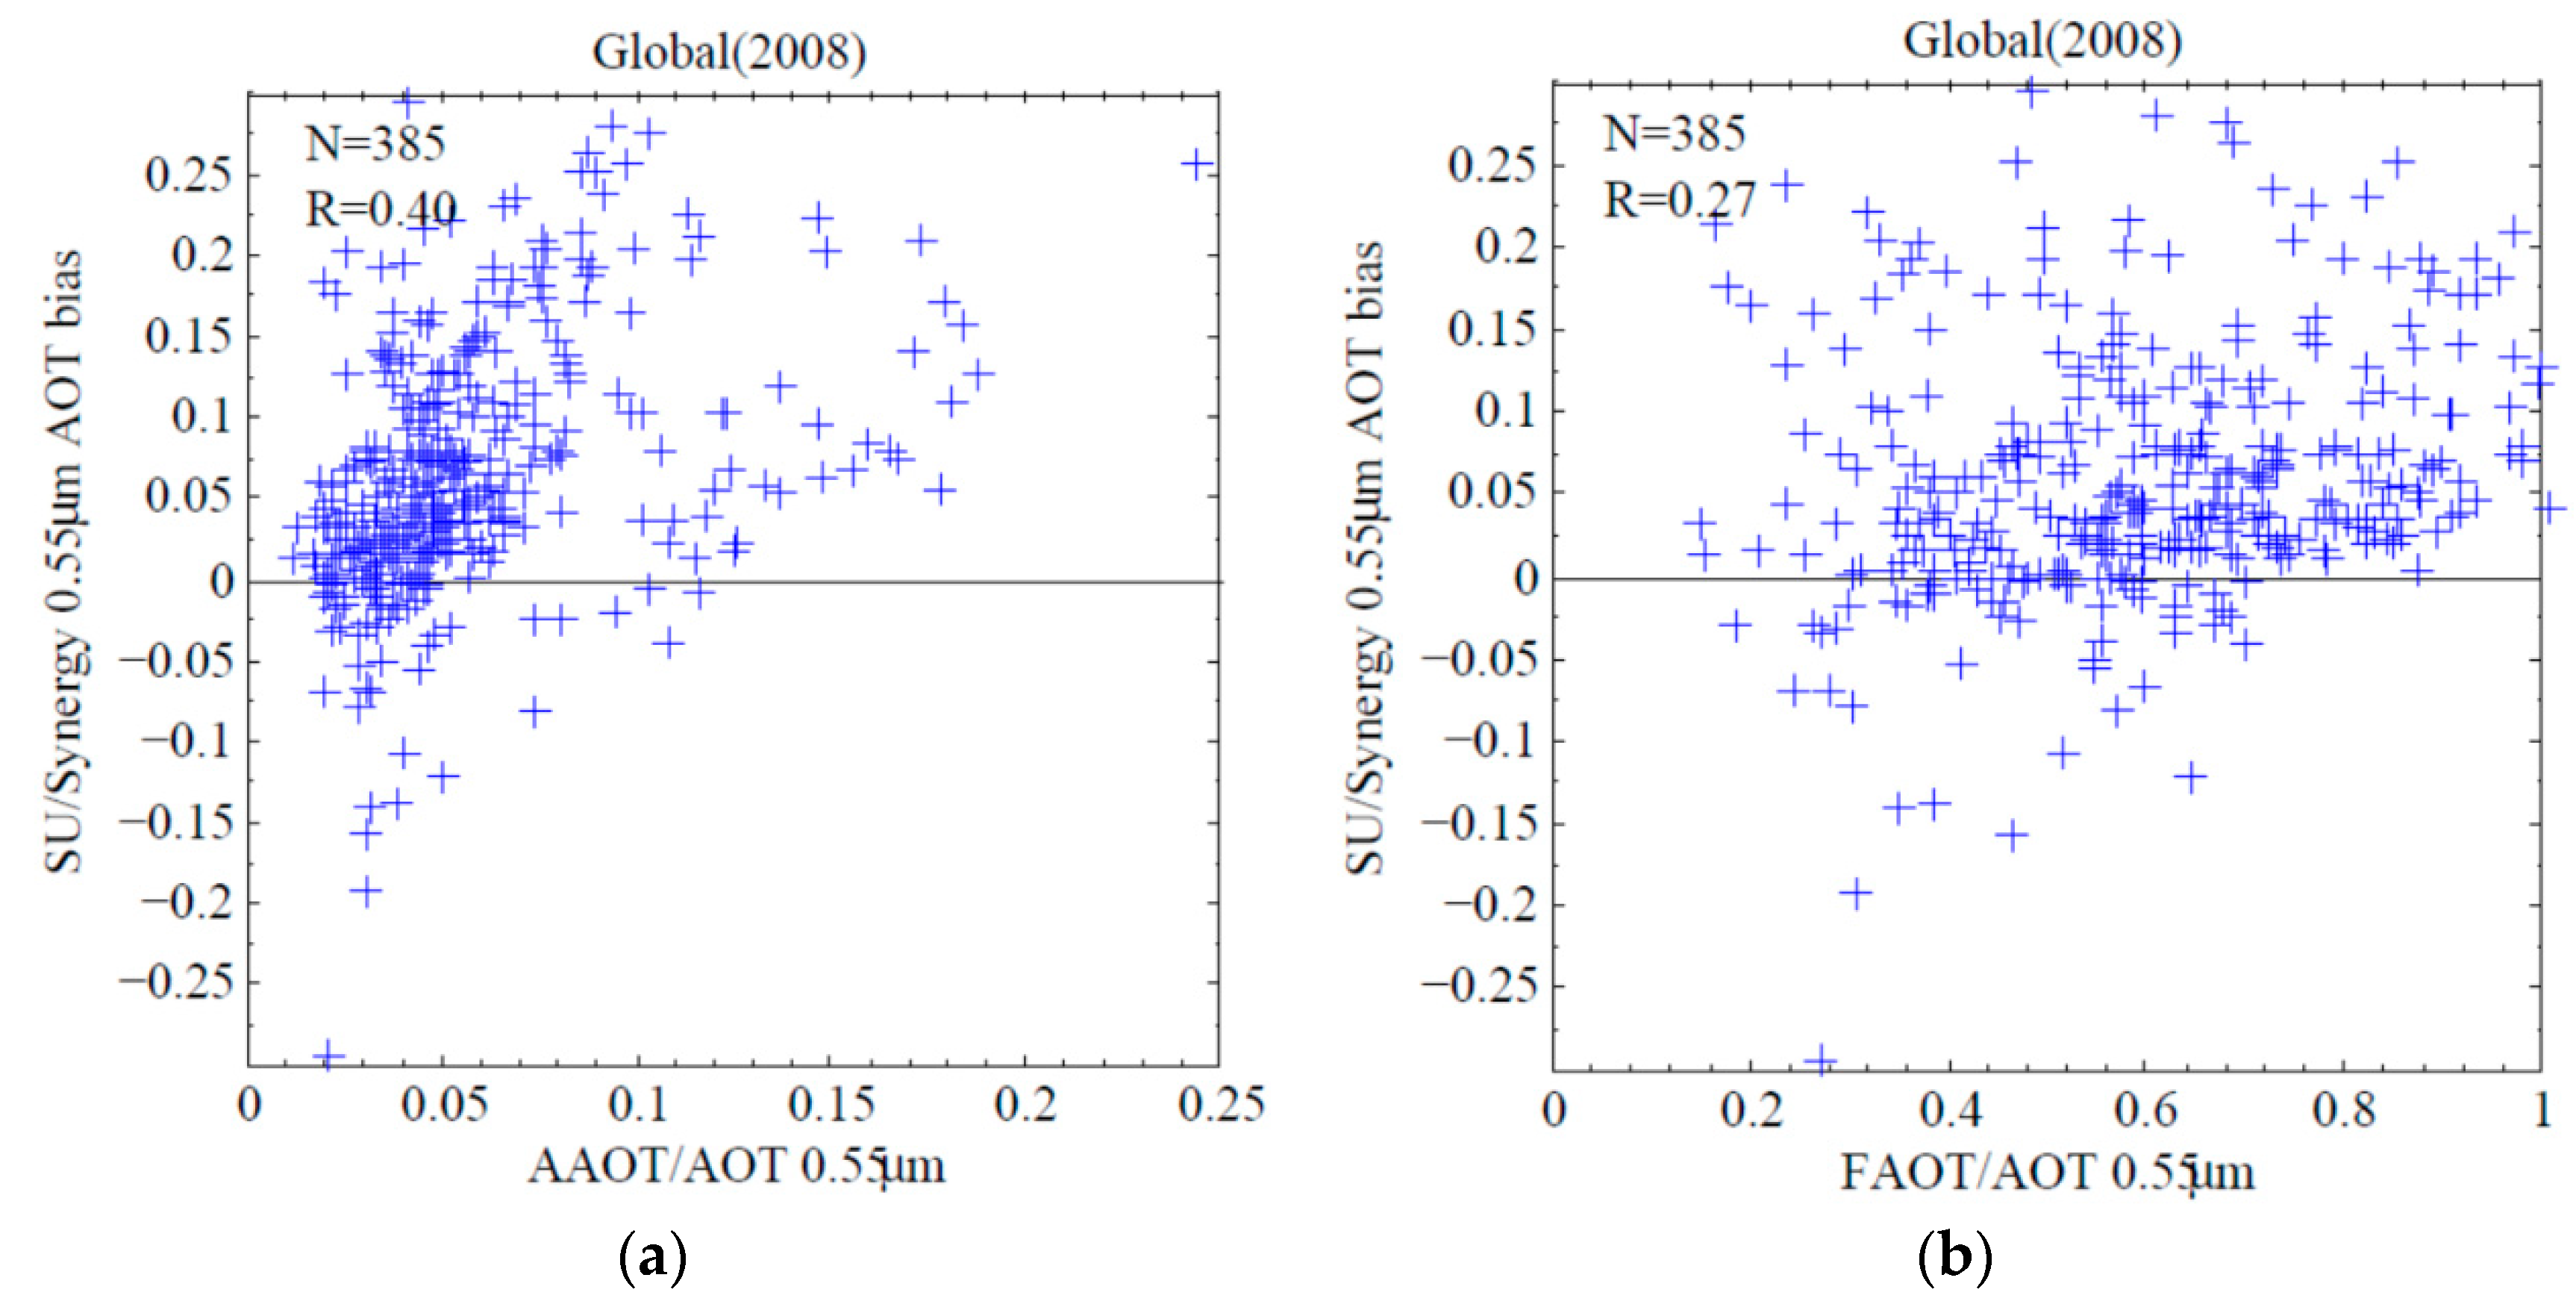
4.3.3. Aerosol Typing
5. Conclusions
Author Contributions
Funding
Acknowledgments
Conflicts of Interest
Appendix A


| N | MSA | MAA | MBE | MAE | RMSE | RMB | EE_w | EE_a | EE_b | R | ||
|---|---|---|---|---|---|---|---|---|---|---|---|---|
| SU/AATSR | March | 166 | 0.24 | 0.23 | 0.01 | 0.06 | 0.09 | 1.03 | 80.72% | 14.46% | 4.82% | 0.93 |
| June | 224 | 0.18 | 0.27 | 0.01 | 0.06 | 0.12 | 1.05 | 76.79% | 13.39% | 9.82% | 0.86 | |
| September | 243 | 0.19 | 0.19 | 0.00 | 0.05 | 0.08 | 1.01 | 85.60% | 7.82% | 6.58% | 0.89 | |
| December | 109 | 0.19 | 0.17 | 0.01 | 0.04 | 0.06 | 1.07 | 82.57% | 16.51% | 0.92% | 0.94 | |
| All | 742 | 0.20 | 0.19 | 0.01 | 0.05 | 0.10 | 1.03 | 81.40% | 12.26% | 6.33% | 0.89 | |
| SU/synergy | March | 185 | 0.29 | 0.21 | 0.08 | 0.09 | 0.12 | 1.37 | 57.76% | 40.54% | 2.70% | 0.94 |
| June | 176 | 0.26 | 0.18 | 0.09 | 0.10 | 0.15 | 1.50 | 49.43% | 48.30% | 2.27% | 0.90 | |
| September | 188 | 0.25 | 0.18 | 0.07 | 0.08 | 0.11 | 1.37 | 60.11% | 37.23% | 2.66% | 0.87 | |
| December | 132 | 0.22 | 0.17 | 0.05 | 0.07 | 0.10 | 1.28 | 65.91% | 29.55% | 4.55% | 0.88 | |
| All | 681 | 0.26 | 0.19 | 0.07 | 0.09 | 0.12 | 1.39 | 57.56% | 39.50% | 2.94% | 0.90 |
References
- Yang, W.; John, V.; Zhao, X.; Lu, H.; Knapp, K. Satellite climate data records: Development, applications and social benefits. Remote Sens. 2016, 8, 331. [Google Scholar] [CrossRef]
- Peterson, T.C.; Baddour, O. Towards an enhanced climate system monitoring: Challenges and perspectives. Clim. Res. 2011, 47, 21–28. [Google Scholar] [CrossRef]
- Global Climate Observing System (GCOS). Systematic Observation Requirements for Satellite-Based Products for Climate—Supplemental Details to the Satellite-Based Component of the GCOS Implementation Plan; Technical Report GCOS-107; WMO/TD No. 1338; GCOS: Springer: Berlin/Heidelberg, Germany, 2006. [Google Scholar]
- Kaufman, Y.J.; Tanré, D.; Boucher, O. A satellite view of aerosols in the climate system. Nature 2002, 419, 215–223. [Google Scholar] [CrossRef] [PubMed]
- Levy, R.C.; Mattoo, S.; Munchak, L.A.; Remer, L.A.; Sayer, A.M.; Patadia, F.; Hsu, N.C. The Collection 6 MODIS aerosol products over land and ocean. Atmos. Meas. Tech. 2013, 6, 2989–3034. [Google Scholar] [CrossRef] [Green Version]
- Remer, L.A.; Mattoo, S.; Levy, R.C.; Munchak, L.A. MODIS 3 km aerosol product: Algorithm and global perspective. Atmos. Meas. Tech. 2013, 6, 1829–1844. [Google Scholar] [CrossRef]
- Hsu, N.C.; Jeong, M.-J.; Bettenhausen, C.; Sayer, A.M.; Hansell, R.; Seftor, C.S.; Huang, J.; Tsay, S.-C. Enhanced Deep Blue aerosol retrieval algorithm: The second generation. J. Geophys. Res. Atmos. 2013, 118, 9296–9315. [Google Scholar] [CrossRef] [Green Version]
- Lyapustin, A.; Wang, Y.; Laszlo, I.; Kahn, R.; Korkin, S.; Remer, L.; Levy, R.; Reid, J.S. Multiangle implementation of atmospheric correction (MAIAC): 2. Aerosol algorithm. J. Geophys. Res. Atmos. 2011, 116, D03211. [Google Scholar] [CrossRef]
- Jackson, J.M.; Liu, H.; Laszlo, I.; Kondragunta, S.; Remer, L.A.; Huang, J.; Huang, H. Suomi-NPP VIIRS aerosol algorithms and data products. J. Geophys. Res. Atmos. 2013, 118, 12673–12689. [Google Scholar] [CrossRef]
- Diner, D.J.; Martonchik, J.V.; Kahn, R.A.; Pinty, B.; Gobron, N.; Nelson, D.L.; Holben, B.N. Using angular and spectral shape similarity constraints to improve MISR aerosol and surface retrievals over land. Remote Sens. Environ. 2005, 94, 155–171. [Google Scholar] [CrossRef]
- De Leeuw, G.; Holzer-Popp, T.; Bevan, S.; Davies, W.H.; Descloitres, J.; Grainger, R.G.; Griesfeller, J.; Heckel, A.; Kinne, S.; Klüser, L.; et al. Evaluation of seven European aerosol optical depth retrieval algorithms for climate analysis. Remote Sens. Environ. 2015, 162, 295–315. [Google Scholar] [CrossRef]
- Holzer-Popp, T.; de Leeuw, G.; Griesfeller, J.; Martynenko, D.; Kluser, L.; Bevan, S.; Davies, W.; Ducos, F.; Deuze, J.L.; Graigner, R.G.; et al. Aerosol retrieval experiments in the ESA Aerosol_cci project. Atmos. Meas. Tech. 2013, 6, 1919–1957. [Google Scholar] [CrossRef] [Green Version]
- Popp, T.; de Leeuw, G.; Bingen, C.; Bruehl, C.; Capelle, V.; Chedin, A.; Clarisse, L.; Dubovik, O.; Grainger, R.; Griesfeller, J.; et al. Development, Production and Evaluation of Aerosol Climate Data Records from European Satellite Observations (Aerosol_cci). Remote Sens. 2016, 8, 421. [Google Scholar] [CrossRef]
- Sogacheva, L.; Kolmonen, P.; Virtanen, T.H.; Rodriguez, E.; Sundström, A.-M.; de Leeuw, G. Determination of land surface reflectance using the AATSR dual-view capability. Atmos. Meas. Tech. 2015, 8, 891–906. [Google Scholar] [CrossRef] [Green Version]
- Kolmonen, P.; Sogacheva, L.; Timo, H.; Virtanen, T.H.; de Leeuw, G.; Kulmala, M. The ADV/ASV AATSR aerosol retrieval algorithm: Current status and presentation of a full-mission AOD dataset. Int. J. Digit. Earth 2016, 9, 545–561. [Google Scholar] [CrossRef]
- Thomas, G.E.; Carboni, E.; Sayer, A.M.; Poulsen, C.A.; Siddans, R.; Grainger, R.G. Oxford-RAL Aerosol and Cloud (ORAC): Aerosol retrievals from satellite radiometers. In Aerosol Remote Sensing over Land; Kokhanovsky, A., de Leeuw, G., Eds.; Springer: Berlin/Heidelberg, Germany, 2009; pp. 193–225. [Google Scholar]
- North, P.R.J. Estimation of aerosol opacity and land surface bidirectional reflectance from ATSR-2 dual-angle imagery: Operational method and validation. J. Geophys. Res. Atmos. 2002, 107, ACC4-1–ACC4-10. [Google Scholar] [CrossRef]
- Torres, O.; Decae, R.; Veefkind, J.P.; de Leeuw, G. OMI Algorithm Theoretical Basis Document Volume III Clouds, Aerosols, and Surface UV Irradiance; NASA GSFC/University of Maryland: Baltimore, MD, USA, 2002; pp. 47–71. [Google Scholar]
- Deuzé, J.; Bréon, F.; Devaux, C.; Goloub, P.; Herman, M.; Lafrance, B.; Maignan, F.; Marchand, A.; Nadal, F.; Perry, G.; et al. Remote sensing of aerosols over land surfaces from POLDER-ADEOS-1 polarized measurements. J. Geophys. Res. Atmos. 2001, 106, 4913–4926. [Google Scholar] [CrossRef] [Green Version]
- Mei, L.L.; Rozanov, V.; Vountas, M.; Burrows, J.; Levy, R.; Lotz, W. Retrieval of aerosol optical properties using MERIS observations: Algorithm and some first results. Remote Sens. Environ. 2017, 197, 125–140. [Google Scholar] [CrossRef] [PubMed]
- Mei, L.L.; Rozanov, V.; Vountas, M.; Burrows, J.; Levy, R.; Lotz, W. A Cloud masking algorithm for the XBAER aerosol retrieval using MERIS data. Remote Sens. Environ. 2017, 197, 141–160. [Google Scholar] [CrossRef]
- Santer, R.; Carrere, V.; Dubuisson, P.; Roger, J.C. Atmospheric correction over land for MERIS. Int. J. Remote Sens. 1999, 20, 1819–1840. [Google Scholar] [CrossRef]
- Ichoku, C.; Chu, D.A.; Mattoo, S.; Kaufman, Y.J.; Remer, L.A.; Tanré, D.; Slutsker, I.; Holben, B.N. A spatio-temporal approach for global validation and analysis of MODIS aerosol products. Geophys. Res. Lett. 2002, 29, MOD1-1–MOD1-4. [Google Scholar] [CrossRef]
- Remer, L.A.; Kaufman, Y.J.; Tanre, D.; Mattoo, S.; Chu, D.A.; Martins, J.V.; Li, R.R.; Ichoku, C.; Levy, R.C.; Kleidman, R.G.; et al. The MODIS aerosol algorithm, products and validation. J. Atmos. Sci. 2005, 62, 947–973. [Google Scholar] [CrossRef]
- Chu, D.; Kaufman, Y.; Ichoku, C.; Remer, L.; Tanré, D.; Holben, B. Validation of MODIS aerosol optical depth retrieval over land. Geophys. Res. Lett. 2002, 29, MOD2-1–MOD2-4. [Google Scholar] [CrossRef]
- Li, Z.; Niu, F.; Lee, K.-H.; Xin, J.; Hao, W.; Nordgren, B.; Wang, Y.; Wang, P. Validation and understanding of Moderate Resolution Imaging Spectroradiometer aerosol products (C5) using ground-based measurements from the handheld Sun photometer network in China. J. Geophys. Res. Atmos. 2007, 112, D22S07. [Google Scholar] [CrossRef]
- Levy, R.C.; Remer, L.A.; Kleidman, R.G.; Mattoo, S.; Ichoku, C.; Kahn, R.; Eck, T.F. Global evaluation of the Collection 5 MODIS dark-target aerosol products over land. Atmos. Chem. Phys. 2010, 10, 10399–10420. [Google Scholar] [CrossRef] [Green Version]
- Sayer, A.M.; Hsu, N.C.; Bettenhausen, C.; Jeong, M.-J. Validation and uncertainty estimates for MODIS Collection 6 “Deep Blue” aerosol data. J. Geophys. Res. Atmos. 2013, 118, 7864–7872. [Google Scholar] [CrossRef] [Green Version]
- Kahn, R.A.; Gaitley, B.J.; Martonchik, J.V.; Diner, D.J.; Crean, K.A. Multiangle Imaging Spectroradiometer (MISR) global aerosol optical depth validation based on 2 years of coincident Aerosol Robotic Network (AERONET) observations. J. Geophys. Res. Atmos. 2005, 110, D10S04. [Google Scholar] [CrossRef]
- Kahn, R.A.; Li, W.H.; Moroney, C.; Diner, D.J.; Martonchik, J.V.; Fishbei, E. Aerosol source plume physical characteristics from Space-based multiangle imaging. J. Geophys. Res. Atmos. 2007, 112, D11205. [Google Scholar] [CrossRef]
- Kahn, R.A.; Nelson, D.L.; Garay, M.J.; Levy, R.C.; Bull, M.A.; Diner, D.J.; Martonchik, J.V.; Paradise, S.R.; Hansen, E.G.; Remer, L.A. MISR aerosol product attributes and statistical comparisons with MODIS. IEEE Trans. Geosci. Remote Sens. 2009, 47, 4095–4114. [Google Scholar] [CrossRef]
- Sayer, A.M.; Hsu, N.C.; Bettenhausen, C.; Ahmad, Z.; Holben, B.N.; Smirnov, A.; Thomas, G.E.; Zhang, J. SeaWiFS Ocean Aerosol Retrieval (SOAR): Algorithm, validation, and comparison with other data sets. J. Geophys. Res. Atmos. 2012, 117, 812–819. [Google Scholar] [CrossRef]
- Sayer, A.M.; Hsu, N.C.; Bettenhausen, C.; Jeong, M.J.; Holben, B.N.; Zhang, J. Global and regional evaluation of over-land spectral aerosol optical depth retrievals from SeaWiFS. Atmos. Meas. Tech. 2012, 5, 1761–1778. [Google Scholar] [CrossRef] [Green Version]
- Goloub, P.; Tanre, D.; Deuze, J.L.; Herman, M.; Marchand, A.; Breon, F.-M. Validation of the first algorithm applied for deriving the aerosol properties over the ocean using the POLDER/ADEOS measurements. IEEE Trans. Geosci. Remote Sens. 2002, 37, 1586–1596. [Google Scholar] [CrossRef]
- Tanré, D.; Bréon, F.M.; Deuzé, J.L.; Dubovik, O.; Ducos, F.; François, P.; Goloub, P.; Herman, M.; Lifermann, A.; Waquet, F. Remote sensing of aerosols by using polarized, directional and spectral measurements within the A-Train: The PARASOL mission. Atmos. Meas. Tech. 2011, 4, 1383–1395. [Google Scholar] [CrossRef] [Green Version]
- Bevan, S.; North, P.; Los, S.; Grey, W. A global dataset of atmospheric aerosol optical depth and surface reflectance from AATSR. Remote Sens. Environ. 2012, 116, 199–210. [Google Scholar] [CrossRef]
- Che, Y.; Xue, Y.; Mei, L.; Guang, J.; Xu, H.; She, L.; Guo, J.; He, X.; Di, A.; Fan, C. Inter-comparison of three AATSR Level 2 (L2) AOD products over China. Atmos. Chem. Phys. 2016, 16, 9655–9674. [Google Scholar] [CrossRef] [Green Version]
- Holben, B.N.; Eck, T.F.; Slutsker, I.; Tanré, D.; Buis, J.P.; Setzer, K.A.; Vermote, E.; Reagan, J.A.; Kaufman, Y.J.; Nakajima, T.; et al. AERONET—A Federated Instrument Network and Data Archive for Aerosol Characterization. Remote Sens. Environ. 1998, 66, 1–16. [Google Scholar] [CrossRef] [Green Version]
- Holben, B.N.; Tanré, D.; Smirnov, A.; Eck, T.F.; Slutsker, I.; Abuhassan, N.; Newcomb, W.W.; Schafer, J.S.; Chatenet, B.; Lavenu, F.; et al. An emerging ground-based aerosol climatology: Aerosol optical depth from AERONET. J. Geophys. Res. Atmos. 2001, 106, 12067–12097. [Google Scholar] [CrossRef]
- Ångström, A. Solar and terrestrial radiation. Report to the international commission for solar research on actinometric investigations of solar and atmospheric radiation. Q. J. R. Meteorol. Soc. 1924, 50, 121–126. [Google Scholar] [CrossRef] [Green Version]
- Veefkind, J.P.; de Leeuw, G.; Durkee, P.A. Retrieval of aerosol optical depth over land using two-angle view satellite radiometry during TARFOX. Geophys. Res. Lett. 1998, 25, 3135–3138. [Google Scholar] [CrossRef]
- North, P.R.J.; Briggs, S.A.; Plummer, S.E.; Settle, J.J. Retrieval of land surface bidirectional reflectance and aerosol opacity from ATSR-2 multiangle imagery. IEEE Trans. Geosci. Remote Sens. 1999, 37, 526–537. [Google Scholar] [CrossRef]
- Kinne, S.; Schulz, M.; Textor, C.; Guibert, S.; Balkanski, Y.; Bauer, S.; Berntsen, T.; Berglen, T.; Boucher, O.; Chin, M.; et al. An AeroCom initial assessment optical properties in aerosol component modules of global models. Atmos. Chem. Phys. 2006, 6, 1815–1834. [Google Scholar] [CrossRef]
- North, P.; Grey, W.; Heckel, A.; Fischer, J.; Preusker, R.; Brockmann, C. MERIS/AATSR Synergy Algorithms for Cloud Screening, Aerosol Retrieval, and Atmospheric Correction; ESRIN Contract No. 21090/07/I-LG; Algorithm Theoretical Basis Document Land Aerosol and Surface Reflectance ATBD; Swansea University: Swansea, UK, 2010. [Google Scholar] [Green Version]
- Von Hoyningen-Huene, W.; Joon, Y.; Vountas, M.; Istomina, G.; Rohen, G.; Dinter, T.; Kokhanovsky, A.; Burrows, J. Retrieval of spectral aerosol optical thickness over land using ocean colour sensors MERIS and SeaWiFS. Atmos. Meas. Tech. 2011, 4, 151–171. [Google Scholar] [CrossRef]
- Gomez-Chova, L.; Camps-Valls, G.; Calpe, J.; Munoz, J.; Moreno, J. MERIS/AATSR Synergy Algorithms for Cloud Screening, Aerosol Retrieval, and Atmospheric Correction: Cloud Screening ATBD, version 1.0; University of Valencia: Valencia, Spain, 2010. [Google Scholar]
- Koren, I.; Remer, L.A.; Kaufman, Y.J.; Rudich, Y.; Martins, J.V. On the twilight zone between clouds and aerosols. Geophys. Res. Lett. 2007, 34, 162–179. [Google Scholar] [CrossRef]
- Keleş, T. Comparison of Classical Least Squares and Orthogonal Regression in Measurement Error Models. Int. Online J. Educ. Sci. 2018, 10, 200–214. [Google Scholar]
- Mei, L.L.; Rozanov, V.; Vountas, M.; Burrows, J.P. The retrieval of ice cloud parameters from multi-spectral satellite observations of reflectance using a modified XBAER algorithm. Remote Sens. Environ. 2018, 215, 128–144. [Google Scholar] [CrossRef] [Green Version]
- Mei, L.L.; Rozanov, V.; Vountas, M.; Burrows, J.P.; Richter, A. XBAER-derived aerosol optical thickness from OLCI/Sentinel-3 observation. Atmos. Chem. Phys. 2018, 18, 2511–2523. [Google Scholar] [CrossRef]
- Fraser, R.S.; Kaufman, Y.J. The Relative Importance of Aerosol Scattering and Absorption in Remote Sensing. IEEE Trans. Geosci. Remote Sens. 2007, 23, 625–633. [Google Scholar] [CrossRef]
- Knippertz, P.; Todd, M.C. Mineral dust aerosols over the Sahara: Meteorological controls on emission and transport and implications for modeling. Rev. Geophys. 2012, 50, RG1007. [Google Scholar] [CrossRef]
- Tesfaye, M.; Sivakumar, V.; Botai, J.; Tsidu, G.M. Aerosol climatology over South Africa based on 10 years of Multiangle Imaging Spectroradiometer (MISR) data. J. Geophys. Res. Atmos. 2011, 116, D20216. [Google Scholar] [CrossRef]
- Wang, Y.; Wang, J.; Levy, R.C.; Xu, X.; Reid, J.S. MODIS Retrieval of Aerosol Optical Depth over Turbid Coastal Water. Remote Sens. 2017, 9, 595. [Google Scholar] [CrossRef] [PubMed]
- Mei, L.; Xue, Y.; Xu, H.; Guang, J.; Li, Y.; Wang, Y.; Ai, J.; Jiang, S.; He, X. Validation and analysis of aerosol optical thickness retrieval over land. Int. J. Remote Sens. 2012, 33, 781–803. [Google Scholar] [CrossRef]
- Martins, J.V.; Tanré, D.; Remer, L.; Kaufman, Y.; Mattoo, S.; Levy, R. MODIS Cloud screening for remote sensing of aerosols over oceans using spatial variability. Geophys. Res. Lett. 2002, 29, MOD4-1–MOD4-4. [Google Scholar] [CrossRef]


| AATSR | AATSR/MERIS | |
|---|---|---|
| Input | AATSR RTOA (0.55, 0.67, 0.87, and 1.6 µm) at both views | AATSR RTOA (0.55, 0.67, 0.87, and 1.6 µm) at both views + all MERIS RTOA (except 0.763 and 0.9 µm) |
| Cloud screening | Improved ESA standard cloud screening | Gomez-Chova [46] nadir only, + 3 pixels around excluded |
| Aerosol model | Aerosol-CCI defined [11] | Aerosol-CCI defined [11] |
| Surface model | North et al., 1999 | North et al., 1999 + soil/vegetation mix |
| Limitations | Potentially operates at 2 km resolution, but usually degraded due to registration uncertainty Uses fixed set of aerosol models Not tested over snow/ice | Potentially operates at 2 km resolution, but usually degraded due to registration uncertainty uncertainty Not tested over snow/ice |
| Classes | Range | March | June | September | December |
|---|---|---|---|---|---|
| Class 1 | 4.38% | 9.69% | 9.64% | 2.86% | |
| Class 2 | 17.19% | 20.05% | 17.39% | 10.16% | |
| Class 3 | 61.53% | 48.90% | 57.63% | 64.86% | |
| Class 4 | 13.82% | 15.32% | 12.27% | 20.89% | |
| Class 5 | 2.63% | 4.62% | 2.27% | 1.13% | |
| Class 6 | 0.45% | 1.43% | 0.79% | 0.14% |
| Algorithm | N | R | RMSE | R_R | EE_w | EE_a | EE_b | |
|---|---|---|---|---|---|---|---|---|
| SU/synergy | 330 | 0.894 | 0.096 | 0.990 | 69.39% | 28.18% | 2.42% | |
| SU/AATSR | 0.893 | 0.079 | 85.15% | 11.52% | 3.33% | |||
| SU/synergy | 97 | 0.911 | 0.192 | 0.979 | 15.46% | 84.54% | 0 | |
| SU/AATSR | 0.909 | 0.098 | 77.32% | 15.46% | 7.22% |
© 2018 by the authors. Licensee MDPI, Basel, Switzerland. This article is an open access article distributed under the terms and conditions of the Creative Commons Attribution (CC BY) license (http://creativecommons.org/licenses/by/4.0/).
Share and Cite
Che, Y.; Mei, L.; Xue, Y.; Guang, J.; She, L.; Li, Y.; Heckel, A.; North, P. Validation of Aerosol Products from AATSR and MERIS/AATSR Synergy Algorithms—Part 1: Global Evaluation. Remote Sens. 2018, 10, 1414. https://0-doi-org.brum.beds.ac.uk/10.3390/rs10091414
Che Y, Mei L, Xue Y, Guang J, She L, Li Y, Heckel A, North P. Validation of Aerosol Products from AATSR and MERIS/AATSR Synergy Algorithms—Part 1: Global Evaluation. Remote Sensing. 2018; 10(9):1414. https://0-doi-org.brum.beds.ac.uk/10.3390/rs10091414
Chicago/Turabian StyleChe, Yahui, Linlu Mei, Yong Xue, Jie Guang, Lu She, Ying Li, Andreas Heckel, and Peter North. 2018. "Validation of Aerosol Products from AATSR and MERIS/AATSR Synergy Algorithms—Part 1: Global Evaluation" Remote Sensing 10, no. 9: 1414. https://0-doi-org.brum.beds.ac.uk/10.3390/rs10091414