Article

Underground Object Classification for Urban Roads Using Instantaneous Phase Analysis of Ground-Penetrating Radar (GPR) Data

1
Composite Research Division, Korea Institute of Materials Science (KIMS), 797 Changwondaero, Seongsan-gu, Changwon, Gyeongnam 51508, Korea
2
Advanced Railroad Vehicle Division, Korea Railroad Research Institute (KRRI), 176 Chelodo Bangmulgwan-ro, Uiwang, Gyeonggi 16105, Korea
3
School of Mechanical Engineering, Changwon National University, Changwon 641-773, Korea
4
Department of Architectural Engineering, Sejong University, 209, Neungdong-ro, Gwangjin-gu, Seoul 05006, Korea
*
Author to whom correspondence should be addressed.
Submission received: 6 August 2018 / Revised: 31 August 2018 / Accepted: 4 September 2018 / Published: 6 September 2018
(This article belongs to the Special Issue Recent Progress in Ground Penetrating Radar Remote Sensing)

Abstract

:
Ground-penetrating radar (GPR) has been widely used to detect subsurface objects, such as hidden cavities, buried pipes, and manholes, owing to its noncontact sensing, rapid scanning, and deeply penetrating remote-sensing capabilities. Currently, GPR data interpretation depends heavily on the experience of well-trained experts because different types of underground objects often generate similar GPR reflection features. Moreover, reflection visualizations that were obtained from field GPR data for urban roads are often weak and noisy. This study proposes a novel instantaneous phase analysis technique to address these issues. The proposed technique aims to enhance the visibility of underground objects and provide objective criteria for GPR data interpretation so that the objects can be automatically classified without expert intervention. The feasibility of the proposed technique is validated both numerically and experimentally. The field test utilizes rarely available GPR data for urban roads in Seoul, South Korea and demonstrates that the technique allows for successful visualization and classification of three different types of underground objects.

Graphical Abstract

1. Introduction

Sinkholes are one of the most severe threats to urban roads. Sudden ground collapse can lead to road closure, economic loss, and human fatalities and injuries. Several major sinkhole incidents, including in urban roads, have been reported in recent years, e.g., in Hangzhou, China (April 2016) [1], Fukuoka, Japan (November 2016) [2], and Cheltenham township, PA, USA (January 2017) [3]. Extraction of groundwater, changes in water drainage patterns, and water main breakages are considered to be the main causes of the underground cavities that can potentially develop into urban sinkholes [4,5]. As sinkholes often appear without any forewarning, the demand for their early detection in urban areas is increasing.
Nondestructive sensing via ground-penetrating radar (GPR) is gaining popularity for underground visualization, because it offers noncontact testing, fast scanning speeds, and deep penetration [6]. GPR emits high-frequency electromagnetic waves into the subsurface and analyzes the reflected electromagnetic waves. As reflection only occurs if there is an abrupt change in the electromagnetic characteristics of the medium, underground structures and their boundaries can be identified by analyzing the received signal. The main applications of GPR have been in the archeological and geological fields, where it is used for mapping subsurface features [7,8,9]. It has been also applied for other fields [10], including demining [11], identifying veins of the mineral [12], monitoring of mines and tunnels [13], and forensic applications [14]. Its use has recently been extended to detecting underground cavities and potential sinkholes [15,16,17].
Currently, the identification and classification of underground objects with GPR data heavily rely on the time-consuming and labor-intensive work of well-trained experts. In urban areas, an expert may be able to analyze no more than a few kilometers of three-dimensional GPR (3D GPR) data in a week. Moreover, the interpretation of these data depends on the subjective judgment of the expert, meaning that the results may be unreliable at times. GPR signals reflected from the pavement layer of urban roads typically dominate the reflection profile because of the large permittivity difference between the pavement interface and air. Underground objects cause relatively weak and noisy reflected signals, making data interpretation more challenging. Although the dominant signals can be partially eliminated by subtracting a reference signal from the GPR signal (known as the subtraction or background removal method [18,19]), this method is highly susceptible to noise and small signal disturbances in the time domain, e.g., variations in pavement thickness or unexpected arbitrary boundary conditions in the pavement. Time-varying gains have been used to enhance weak reflection signals [6,20], but this requires the careful selection of the gain values on the part of the user. A further technical challenge in GPR data interpretation is that similar GPR features are often generated by different underground objects. Even if an underground object is identified, it is challenging to classify it. In particular, the reflected signal from an underground cavity is often indistinguishable from the signals from other underground objects, such as pipes, manholes, or gravel. Without cumbersome underground boreholing, it can be difficult to confirm the presence of a cavity.
This study addresses these issues by proposing an instantaneous phase analysis technique for underground object classification. This technique aims to enhance the visibility of underground objects and provide objective criteria for GPR data interpretation, so that the objects can be automatically classified without expert intervention. Background filtering is first applied to 3D GPR data to enhance the visibility of objects beneath urban roads and hence reduce the need for human intervention in data analysis. The background signals, including dominant reflections from the pavements, are filtered out using a basis pursuit approach, and the underground objects are visualized by reconstructing the filtered 3D GPR data. An instantaneous phase analysis technique is then applied to classify the visualized underground objects. Reflections from cavities are in-phase with the direct GPR waves, whereas reflections from other underground objects are out-of-phase, meaning that underground objects can be classified while using phase analysis. Although the proposed technique uses a simple electromagnetic wave propagation model, numerical modeling and experimental validation with rare field-test data from urban roads in Seoul, South Korea confirm that it is effective for underground object identification.
This paper is organized, as follows. Section 2 details the working principles of GPR and explains the proposed instantaneous phase analysis technique. In Section 3, the technique is numerically validated using models of various types of underground objects, such as an underground cavity and a buried pipe. Section 4 then examines the feasibility of the proposed technique with experimental field data obtained from urban roads in Seoul, South Korea. The paper concludes with a brief summary and discussion of its application in Section 5.

2. Underground Object Classification Using GPR Data

This section sets out the proposed instantaneous phase analysis method for underground object classification. The working principles of GPR and the technical limitations of conventional GPR data analysis techniques are first briefly introduced. A novel underground object classification technique to automatically classify the underground objects is then proposed. This involves enhancing the visibility of underground GPR signals through the application of a basis pursuit filter and then using instantaneous phase analysis to classify the visualized object.

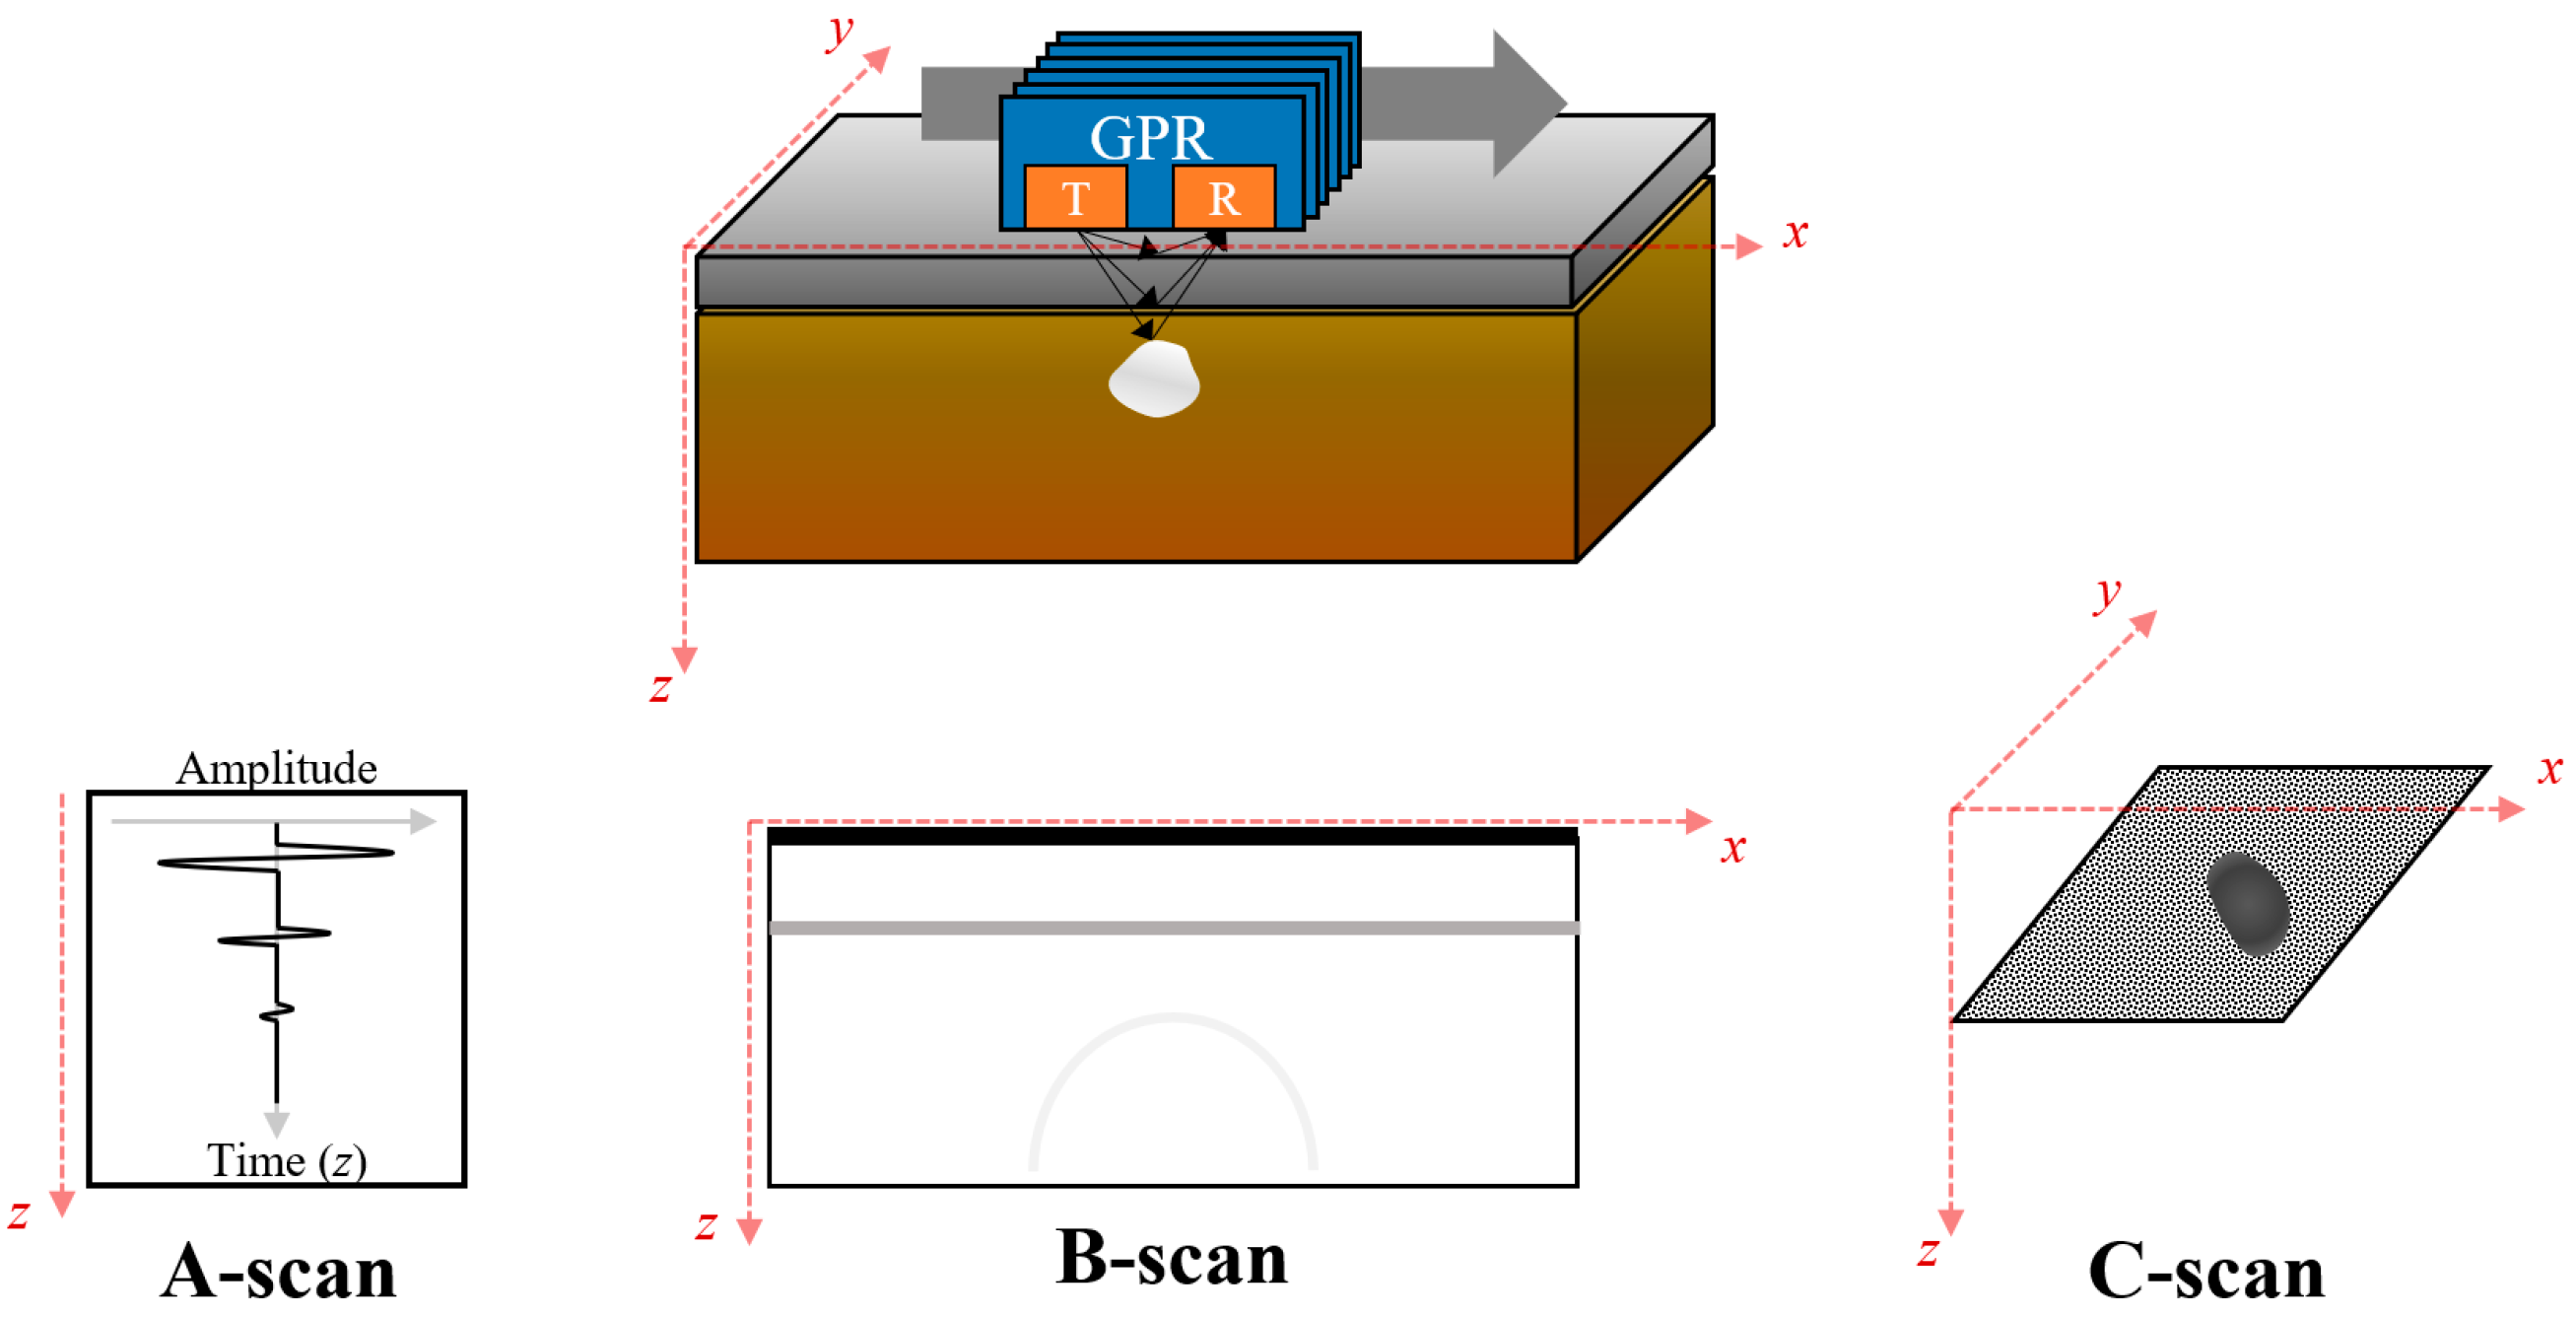
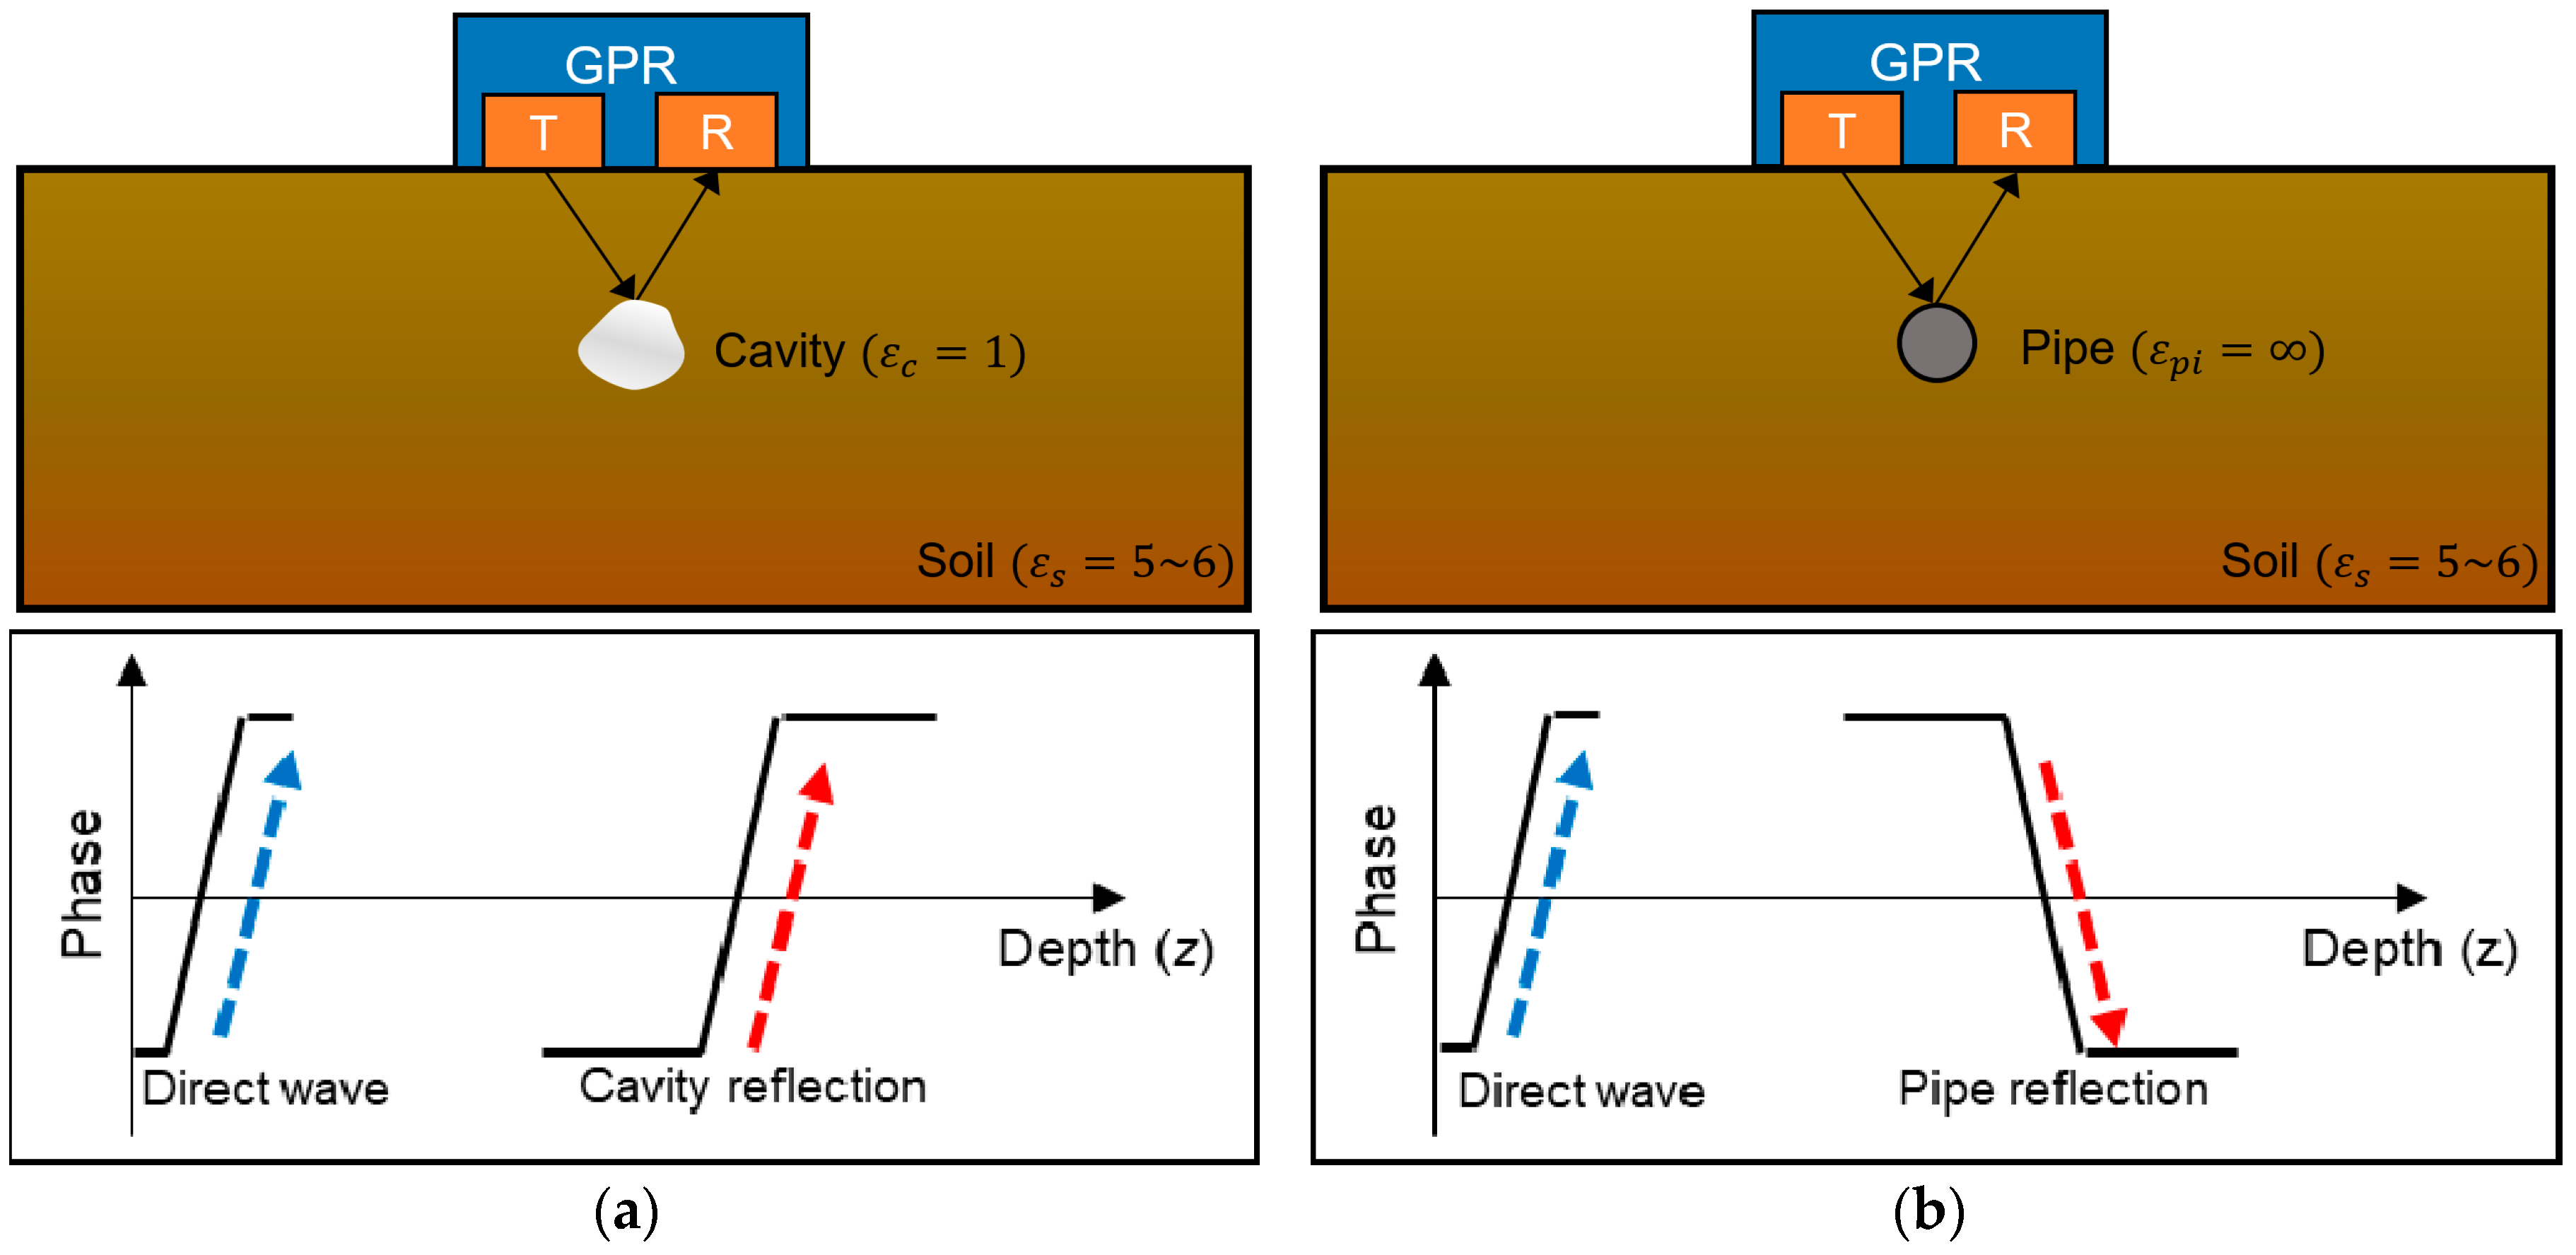
2.1. Working Principles of GPR

Figure 1 schematically illustrates a typical GPR setup for underground object visualization. The GPR system consists of an antenna and a data acquisition system (upper part of Figure 1). In the antenna system, a transmitter (T) emits high frequency electromagnetic wave pulses and a receiver (R) detects the reflected electromagnetic waves. Electromagnetic wave pulse excitation is commonly achieved while using stepped-frequency technology by sweeping the desired frequency band [21]. Any change in the electromagnetic characteristics of the medium, such as its permittivity and permeability, causes the electromagnetic waves to be reflected [22]. The incident electromagnetic field of the waves at the reflection location can be represented by
  E i ( z , t ) = E i e j ( k 1 z ω t ) x ^ ,  
  B i ( z , t ) = E i v 1 e j ( k 1 z ω t ) y ^ ,  
where E i ( z , t ) and B i ( z , t ) indicate the incident electric and magnetic fields at a specific depth z and point in time t , and E i is the amplitude of the incident electric field. k 1 , ω , and v 1 refer to the wavenumber, frequency, and velocity of the electromagnetic waves in the corresponding medium, respectively. The reflected electromagnetic field can be expressed as
  E r ( z , t ) = E r e j ( k 1 z ω t ) x ^ ,  
  B r ( z , t ) = E r v 1 e j ( k 1 z ω t ) y ^ .  
here, E r represents the amplitude of the reflected electric field:
  E r = ( n 1 n 2 n 1 + n 2 ) E i = ε 1 μ 1 ε 2 μ 2 ε 1 μ 1 + ε 2 μ 2 E i ,  
where n 1 and n 2 are the refractive indices of each medium. ε 1 and μ 1 , and ε 2 and μ 2 refer to the relative permittivity and relative permeability of the initial medium (1) and the new medium (2), respectively. These reflected electromagnetic waves are then collected by the data acquisition system. The collected signal contains multiple pulses corresponding to each reflection. The amplitude of the reflected electromagnetic field is larger where there is a greater difference in electromagnetic properties. Note that the above explained electromagnetic wave propagation is a simplified model and it does not perfectly match with the actual wave propagation on the soil. However, even though the proposed technique uses a simple electromagnetic wave propagation model, its superiority for underground object classification will be verified while using numerical and experimental methods in the following sections.
The reflection data are next analyzed for underground object detection. When GPR scans along the region of interest, three different data representations, A-, B-, and C-scans, are typically obtained. These are illustrated in the lower part of Figure 1. The A-scan provides punctual time domain information (the z-axis in Figure 1) at a certain spatial point. The B-scan image, representing the xz plane, is constructed by stacking multiple A-scan data along the scanning direction (the x-axis in Figure 1). If there is an abrupt change in permittivity due to an underground object in a specific area, a parabola typically appears in the B-scan image. This phenomenon occurs because the transmitter and receiver are not located at the exact same spatial location. This parabola feature is often used to detect underground objects. The C-scan image is obtained in the xy domain by stacking B-scan images that were measured by multiple antennae. C-scan images can be obtained along the z-axis to physically represent a certain depth. C-scan images revealing cross-sectional images of objects are also useful for detection purposes.

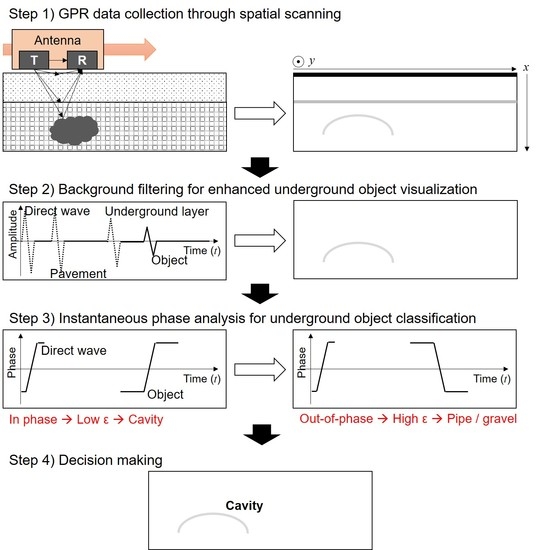
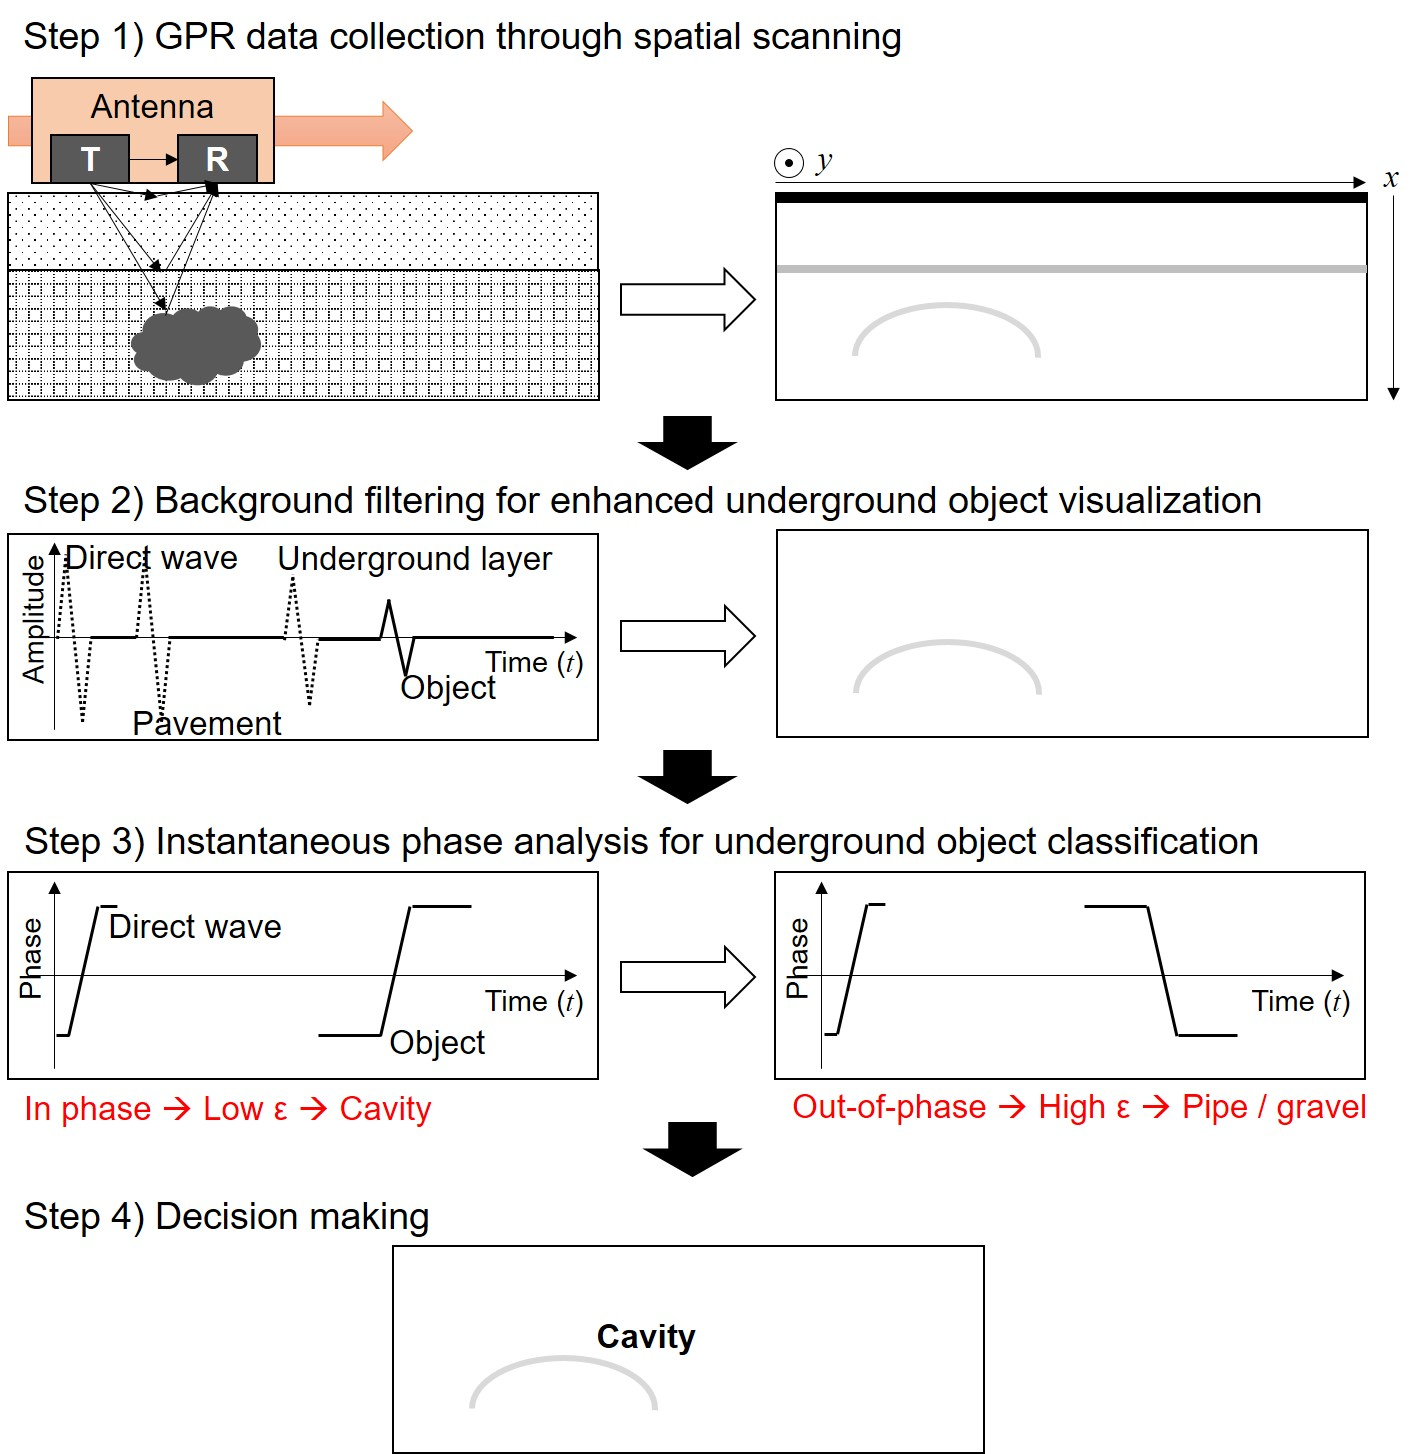
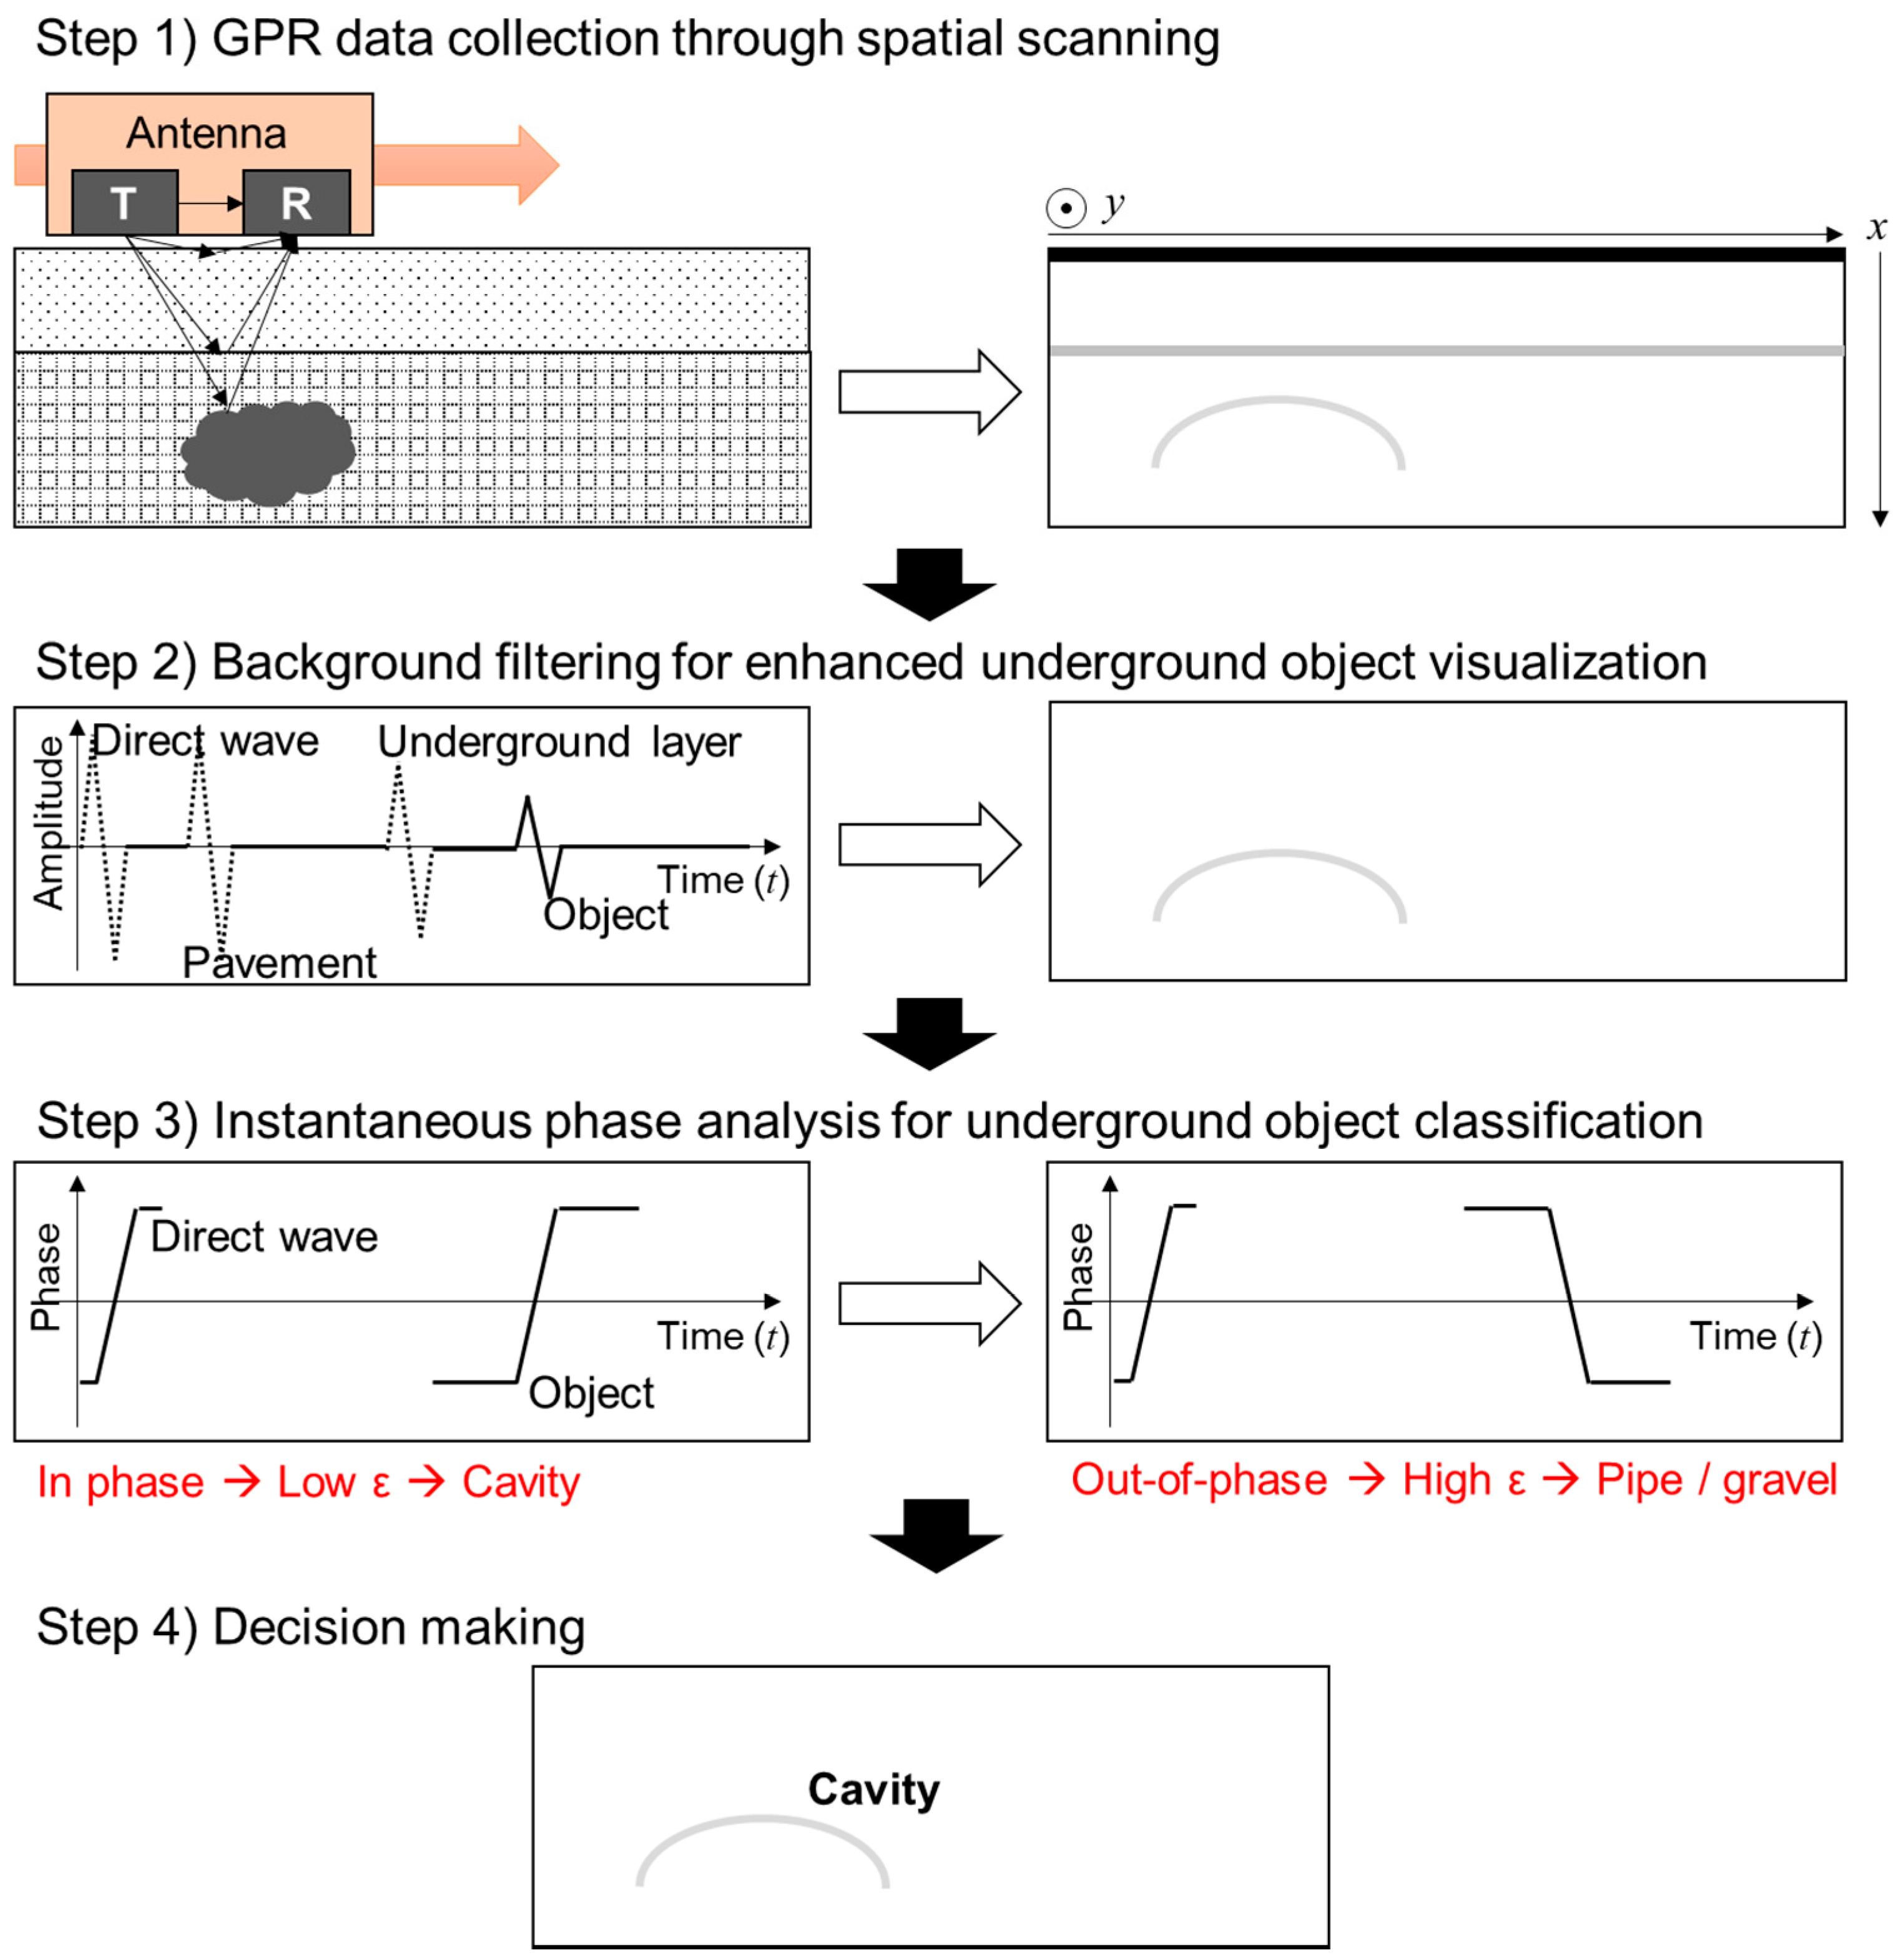
2.2. GPR Signal Analysis for Underground Object Classification

Figure 2 provides an overview of the proposed technique for underground object classification, which proceeds according to four steps: (1) GPR data collection, (2) background filtering to enhance underground object visualization, (3) instantaneous phase analysis for underground object classification, and (4) decision making.

2.2.1. GPR Data Collection

Time domain GPR signals are collected from each spatial scanning location along the region of interest. A two-dimensional GPR (2D GPR) image (B-scan image) is obtained by representing the collected data in the time and spatial domains. Electromagnetic wave attenuation along the depth direction is compensated by applying gain factors. Electromagnetic waves are typically attenuated as they propagate through a medium [23]. This phenomenon can be represented as [24]
  E r , measured = E r e α l ,  
where E r , measured is the measured amplitude of the reflected electric field, l is the distance propagated by the electromagnetic waves, and α is the attenuation constant given by
  α = ω μ ε 2 [ 1 + ( σ ω ε ) 2 1 ] .  
here, σ refers to the charge density of the medium. The attenuation is compensated by applying the following gain factor to the measured signal E 0 :
  E ( t ) = e α v 1 t E 0 ( t ) = e α l E 0 ( l v 1 ) .  

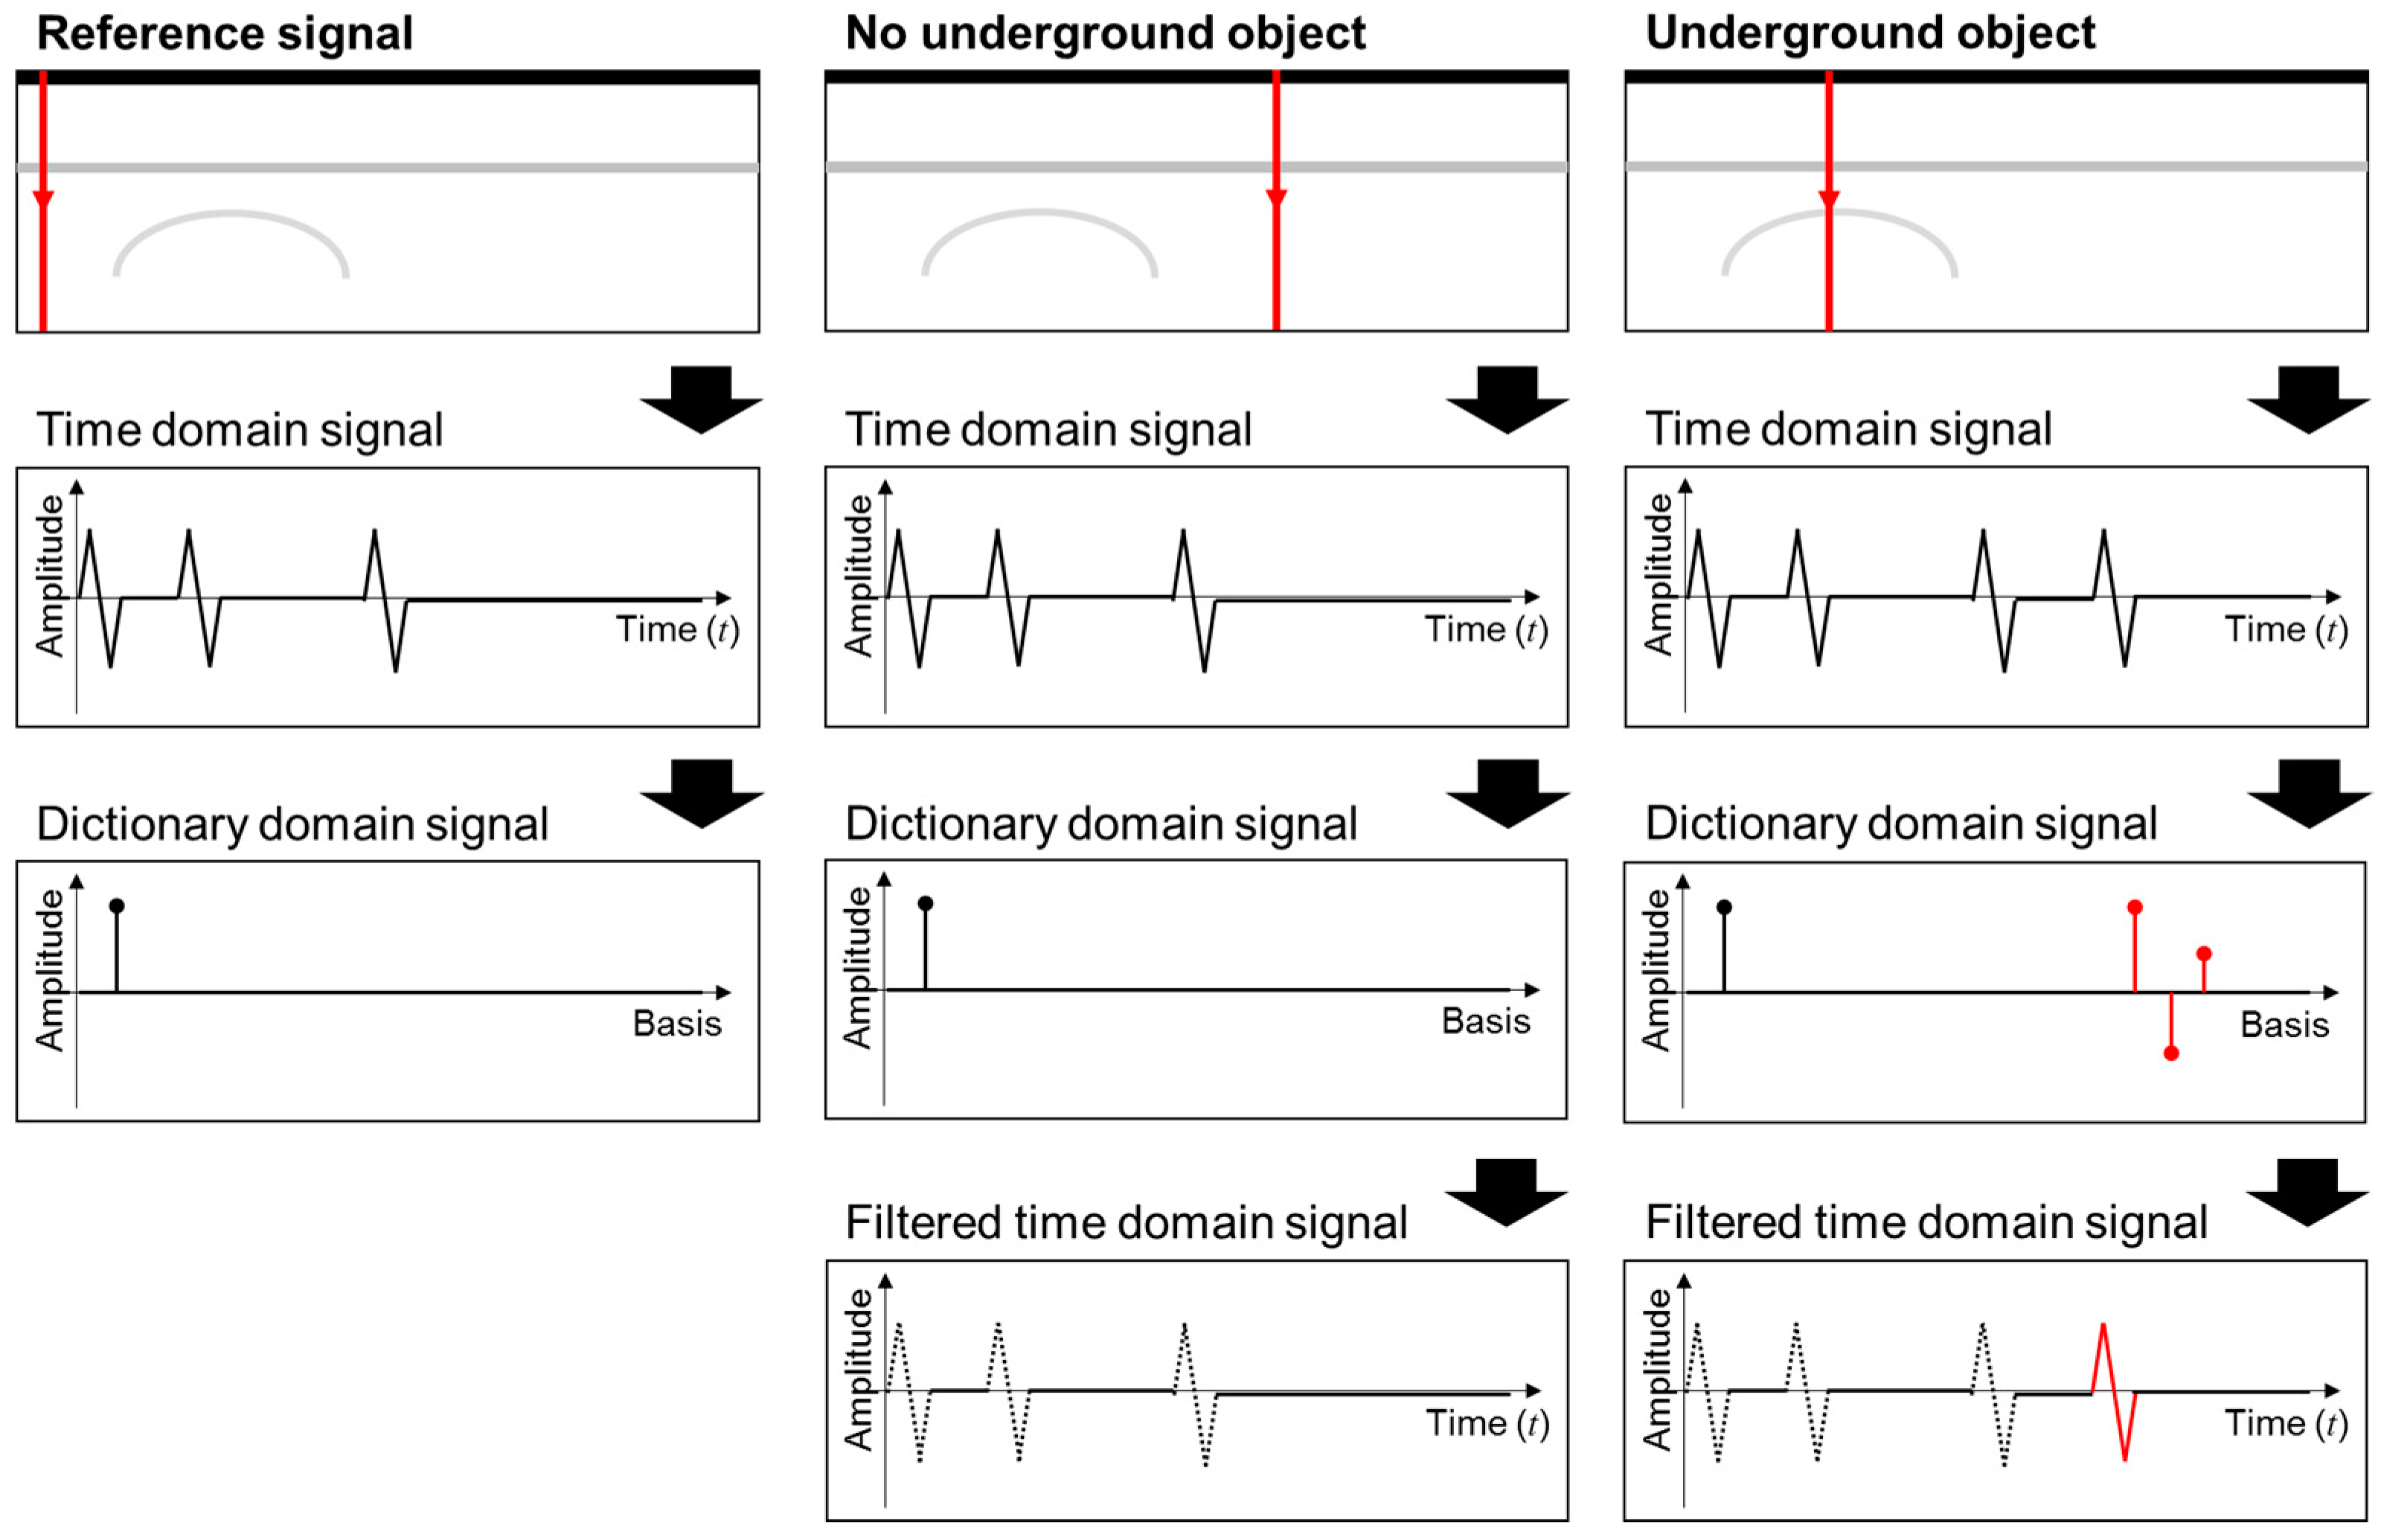
2.2.2. Background Filtering to Enhance Underground Object Visualization

To extract the reflected signals from underground objects from the GPR data, it is necessary to remove the undesired background signals, including (1) pavement surface reflections, (2) reflections from underground layers, and (3) background noise. Interactions between the electromagnetic waves and underground objects can be identified more easily by representing the measured time domain signal s   ( T × 1   vector ) as a weighted linear combination of bases via the following transformation [25,26]:
  s = D α ,   D = { d 1 ,   d 2 ,   ,   d L } ,  
where α is a representation of s in the transformed domain with the dimension L × 1 . D is a T × L dictionary matrix and consists of d i bases (i = 1, …, L). Each basis d i is a time domain signal with the same dimensions as s .
We define a reference point as a pristine scanning location without underground objects in the inspection area. The reference signal E ref measured from the reference point is expressed, as follows:
  E ref ( t ) = E e j ω t ,  
where ω refers to the electromagnetic wave frequency. In the dictionary used in this study, each basis represents a reference signal with a specific time delay. For example, d i denotes the reference signal with a time delay of ( L / 2 i ) Δ t :
  d i = E ( t + ( L / 2 i ) Δ t ) = E ( t + ( L i ) Δ t ) = E e j ω ( t + ( L i ) Δ t ) .  
in other words, the measured GPR data s is represented as a sum of reference signals with different time delay. Any change in s from the reference signal E ref , such as underground object reflections, is compensated by adding weighted d i with proper time delay. This is as a time-domain function is represented by a sum of multiple sinusoidal signals with different amplitude and frequency in Fourier transform.
A large L value is preferable for achieving a high resolution in the transformed domain, or a shorter time delay difference Δ t in this case. Then, Equation (9) typically represents an underdetermined system of equations (L > T), creating nonunique solutions for α. Additional information is required to select single α from the nonunique multiple possibilities. A unique solution for α can be obtained via the assumption that the actual solution has the sparsest representation, minimizing the number of nonzero entities in α [27]. On the basis of this assumption, Chen and Donoho proposed the basis pursuit approach to solve the underdetermined system in Equation (9) [28]. The sparsest representation is obtained by solving the following with a given dictionary D:
  min || α || 1   s . t .   s = D α ,  
where || α || 1 denotes the 1 norm of α. Candes provides an open-source implementation solving Equation (12) coded with MATLAB [29], and the proposed technique has been realized based on the code. Then, time domain GPR signals can be sparsely represented while using the dictionary.
Figure 3 presents how to filter background signals using the transformation in Equation (9). s is the measured signal, D is defined in Equation (10), and α is solved using Equation (12) so that there is no unknown left. If the current scanning location does not include an underground object (as is the case in the center of Figure 3, the measured GPR signal, s , can be represented by only a single basis corresponding to the reference signal (left of Figure 3). This is the only nonzero element in α , and a sparse representation of the time domain signal is possible in the dictionary domain. s can then be represented as
s = E ( t ) = d L = d L α L .
The GPR signal measured from a scanning location where there is an underground object in the dictionary domain (right of Figure 3) is represented by Equation (14). The underground object reflection now exists in the GPR signal. The measured signal s can be represented as the superposition of the reference signal and the reflected signal from the underground object:
  s = E ( t ) + E ( t + m Δ t ) = d L α L + d L m α L m ,  
where m Δ t indicates the depth of the underground object.
As shown in Equations (13) and (14), a new basis d L m appears only if an underground object is present. Thus, the background signals can be filtered out by removing the basis corresponding to the reference signal d L . The resultant dictionary domain data are then inversely transformed into the time domain. Finally, an image of the subsurface region is constructed from the filtered time domain data. Only the reflection signals from underground objects are highlighted in this image, and the other background signals are eliminated.

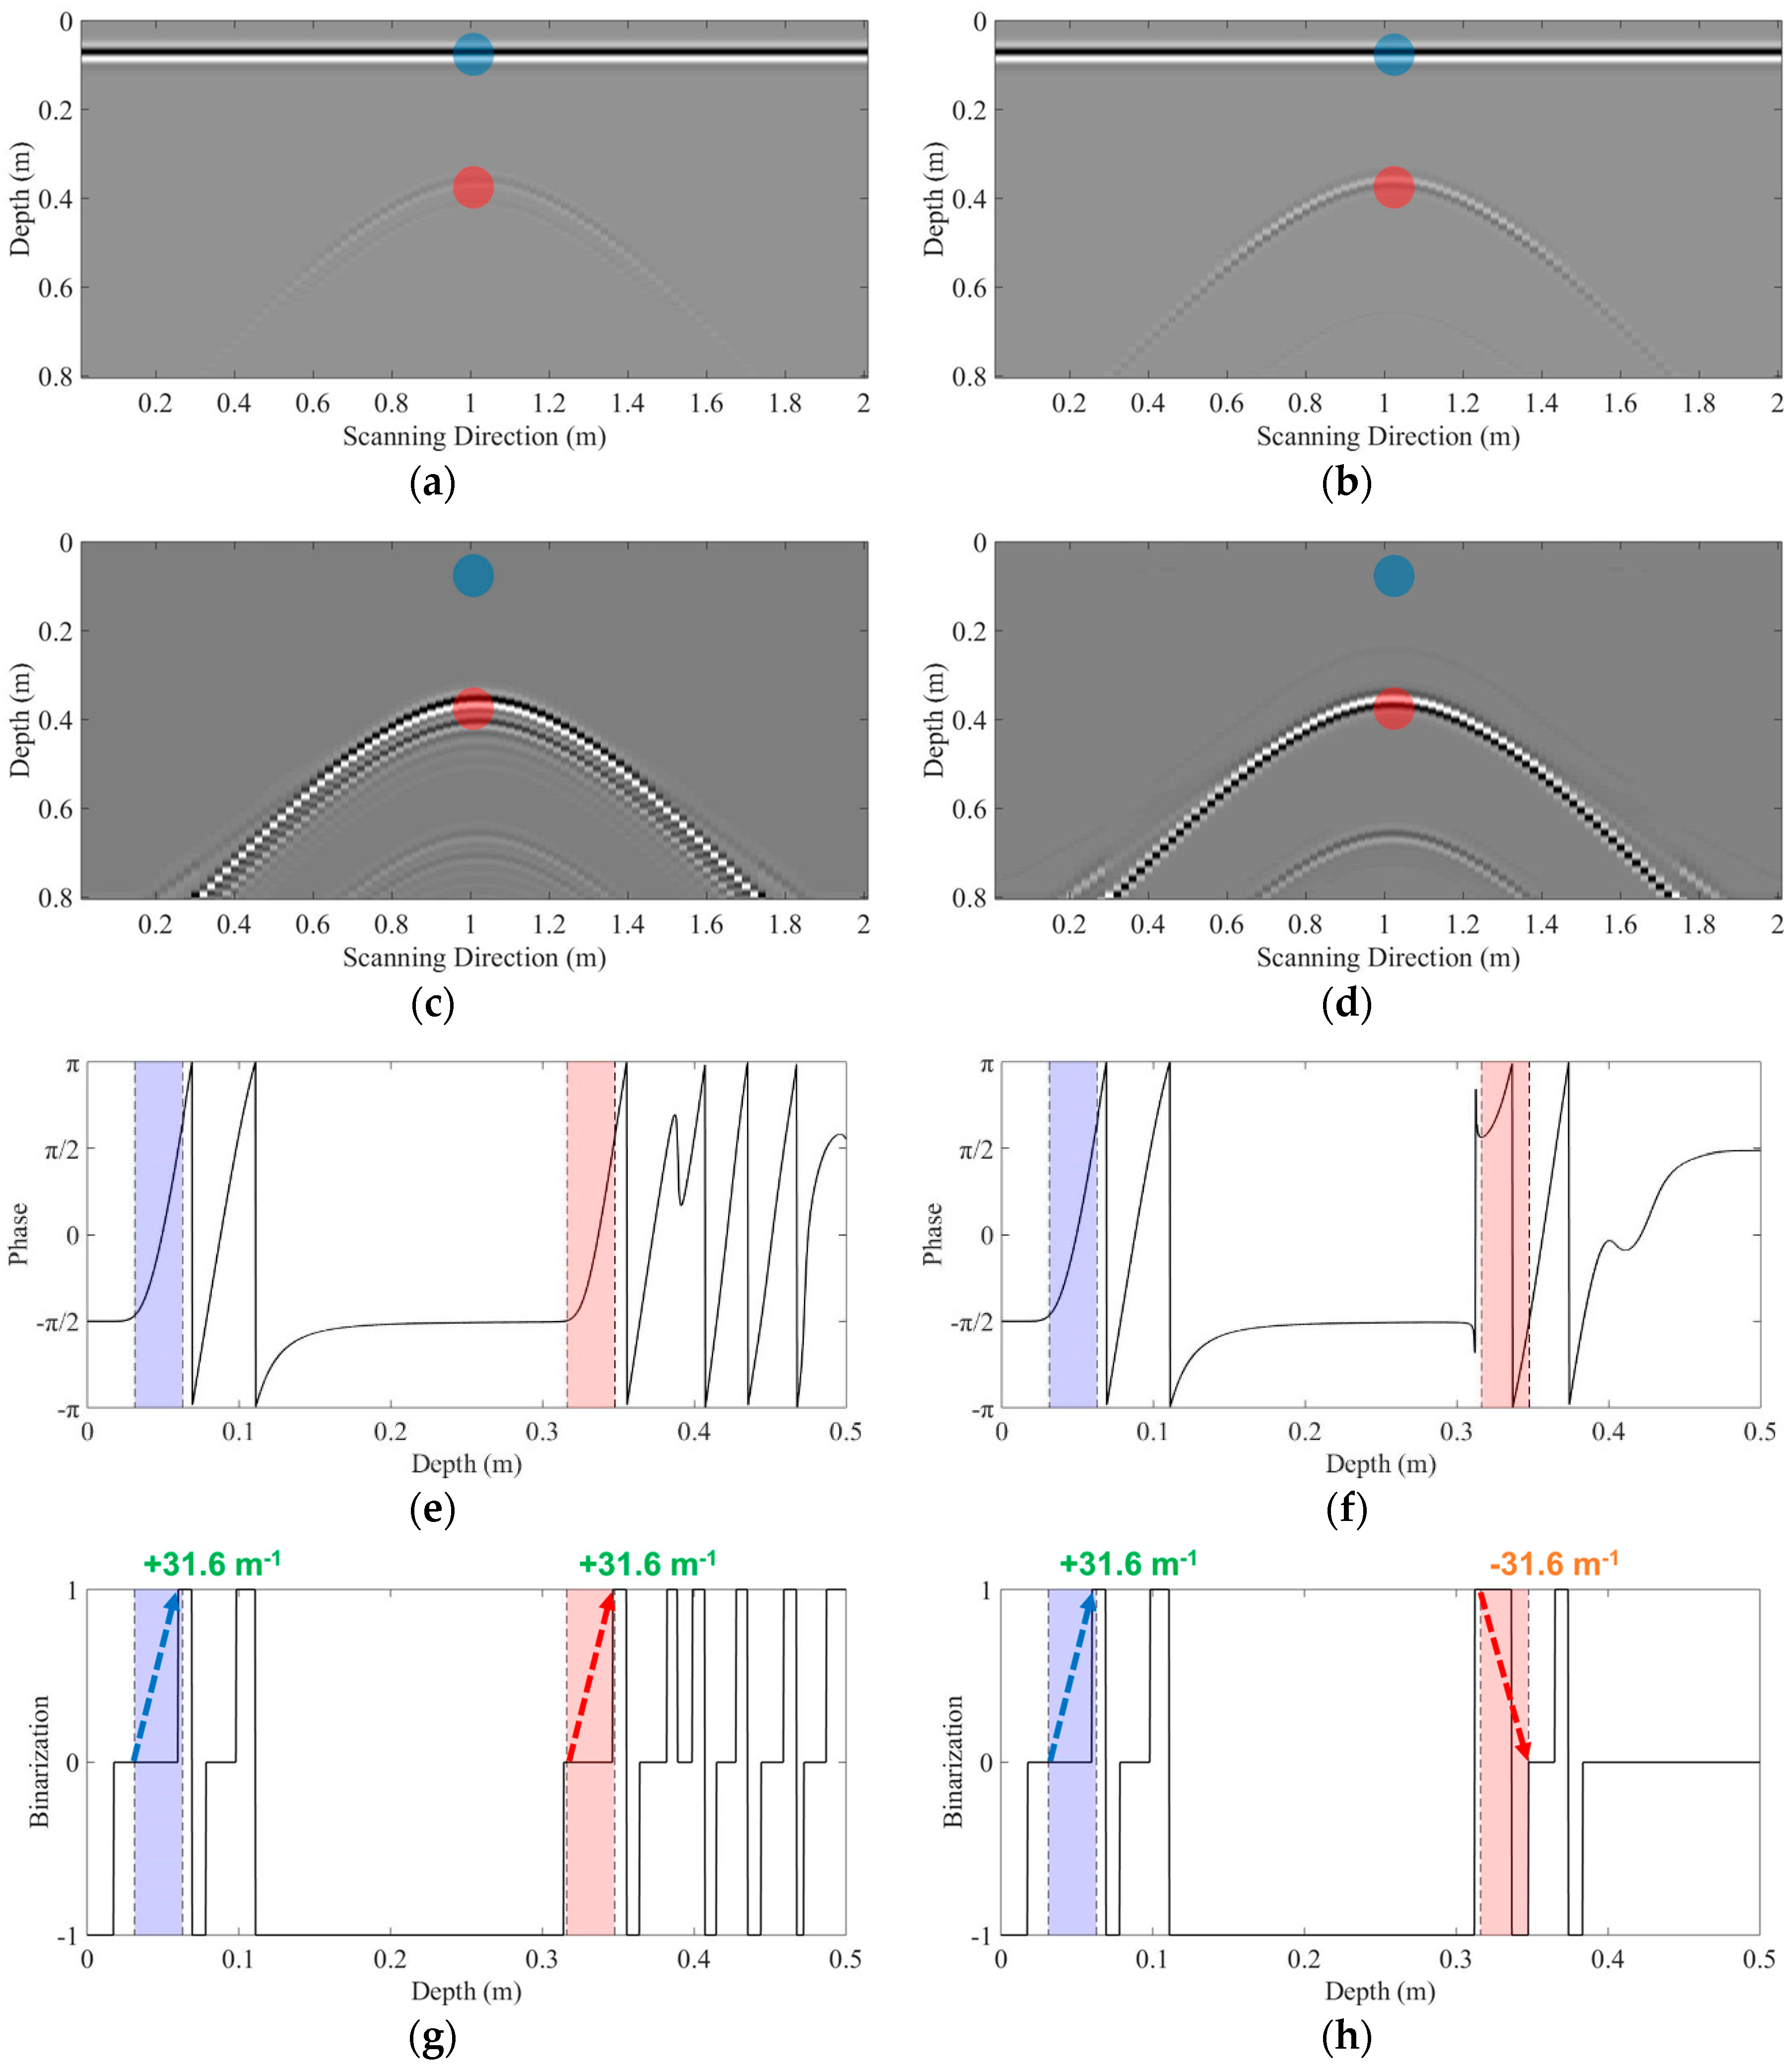
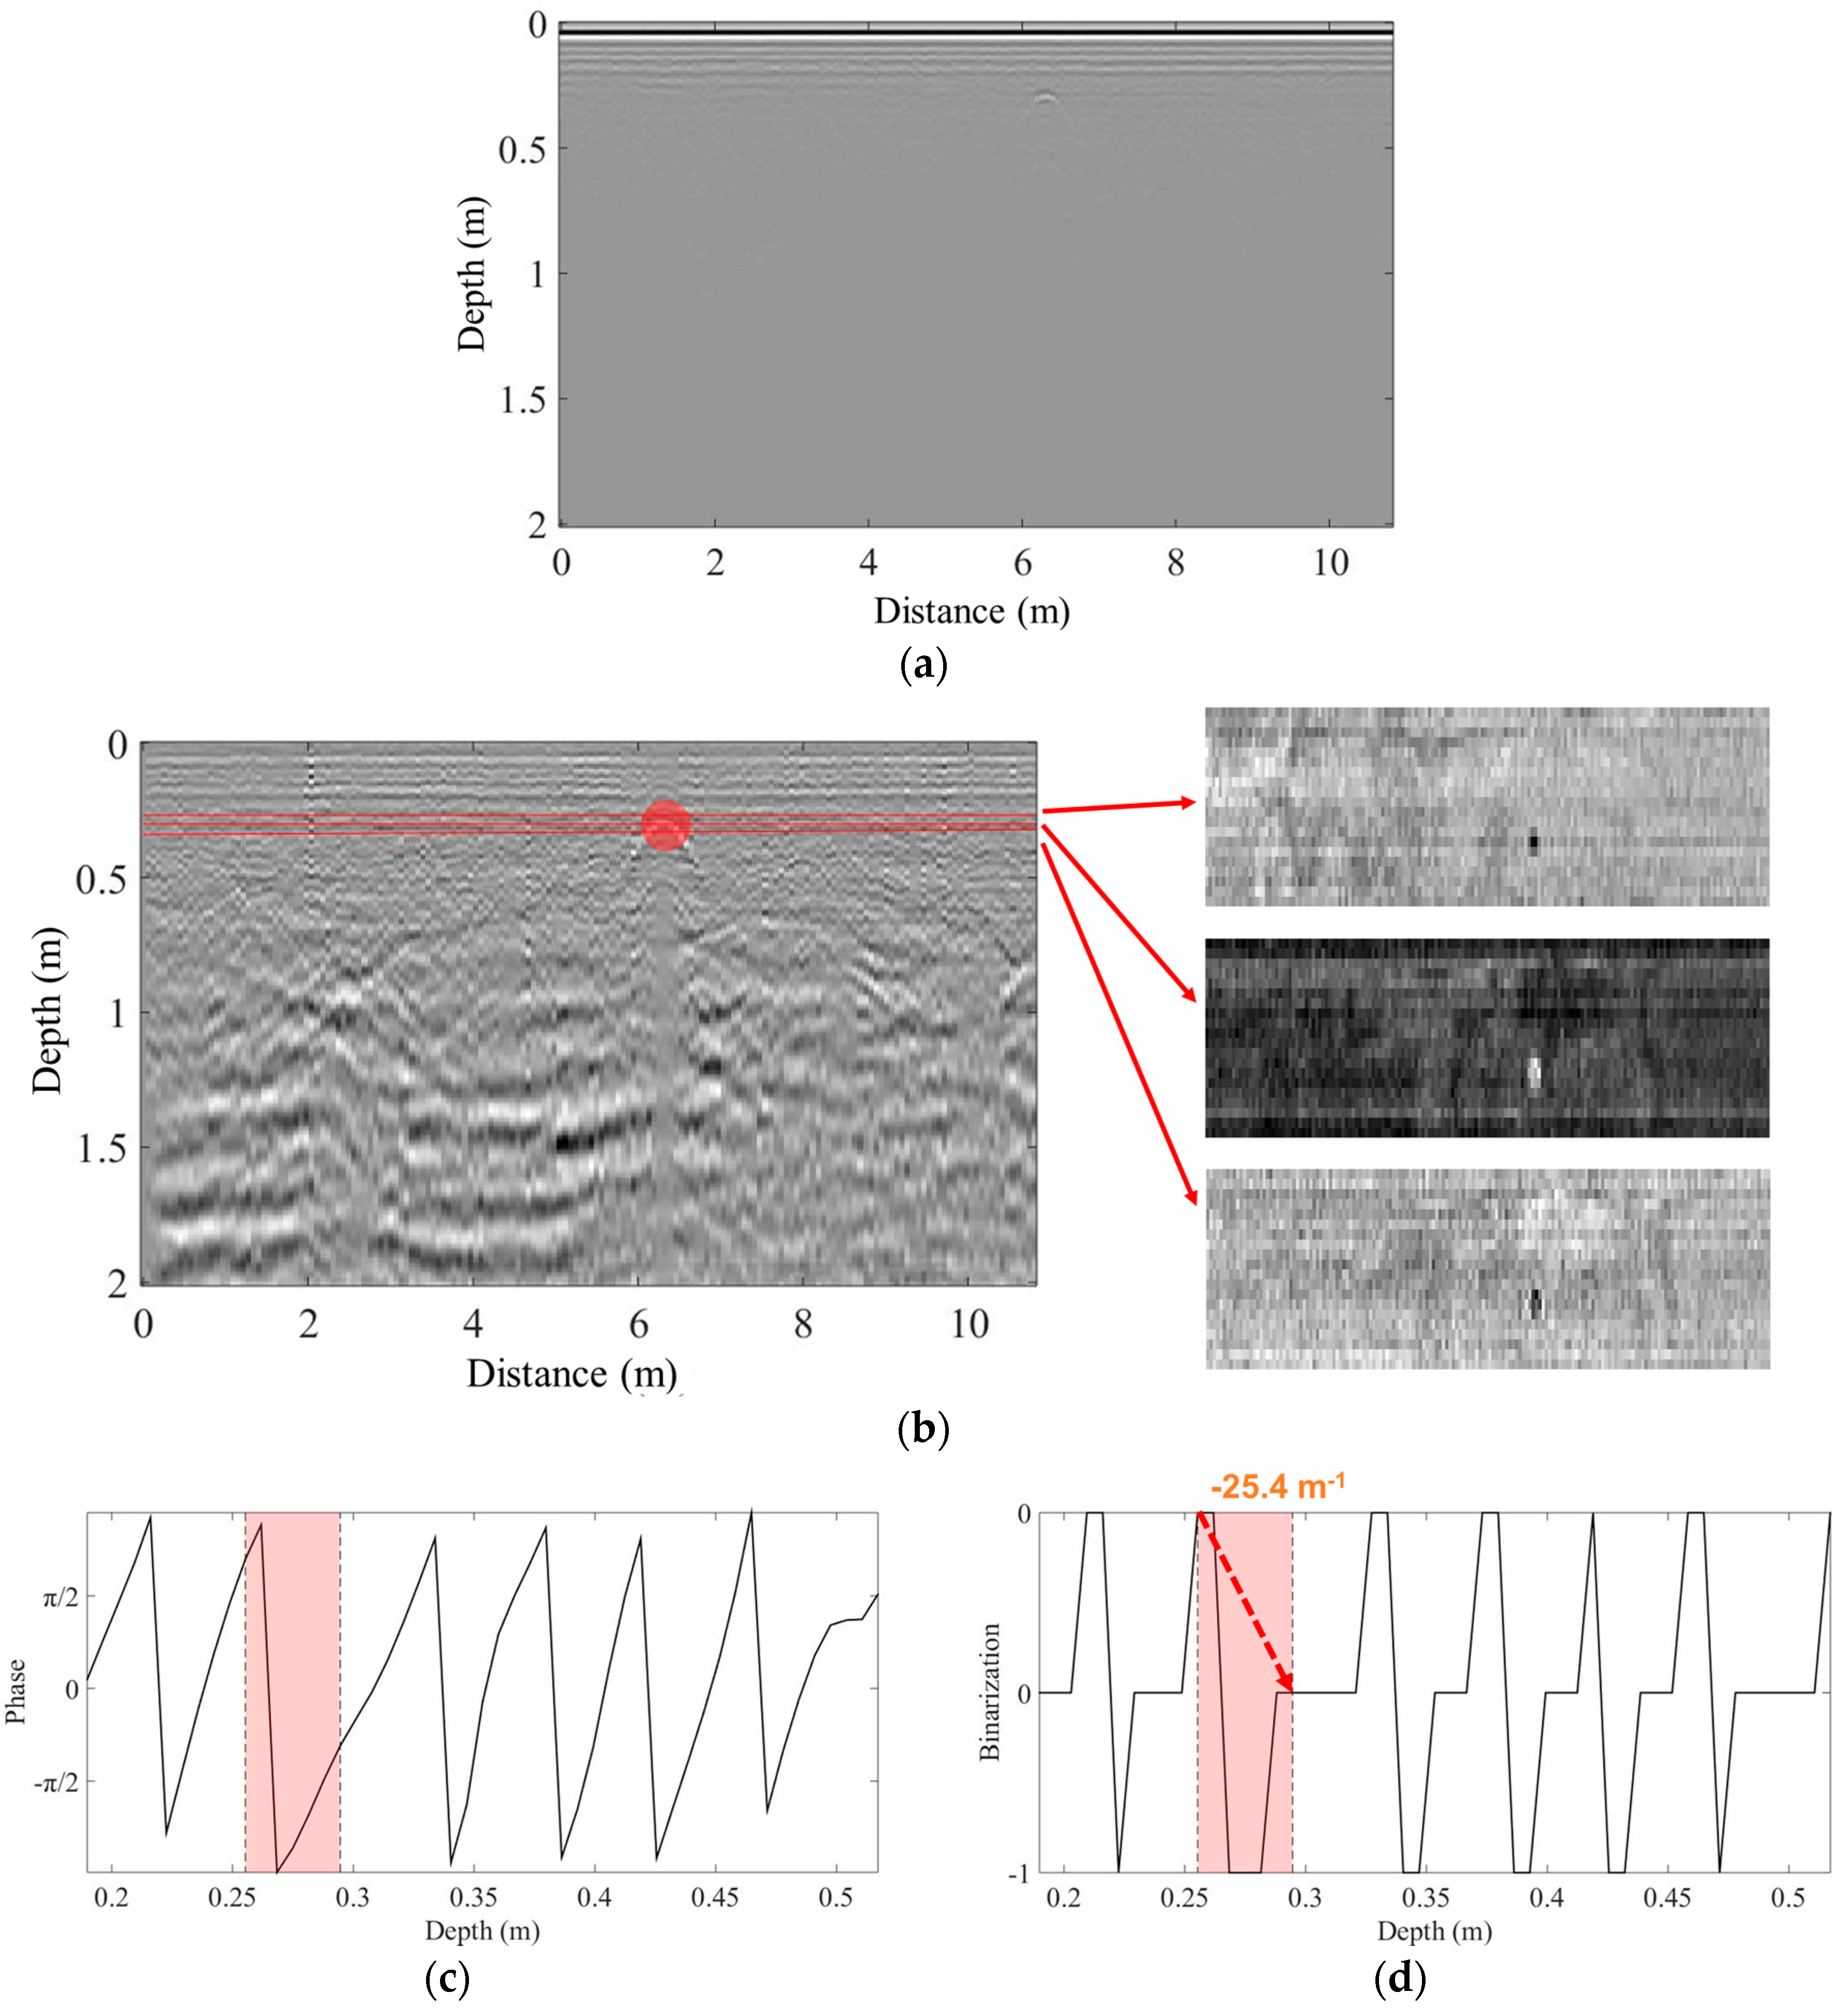
2.2.3. Instantaneous Phase Analysis for Underground Object Classification

Although the filtered images contain only reflections from underground objects, the nature of these objects is still unknown. Phase information provides a useful means of classifying them, because the phase depends on the permittivity of the corresponding underground object.
Because the permeability of most of the underground objects is similar, Equation (5), which expresses the reflected electromagnetic waves from an underground object, can be rewritten as
  E r = ( n 1 n 2 n 1 + n 2 ) E i = ε 1 ε 2 ε 1 + ε 2 E i .  
If the permittivity of the underground object ε 2 is lower than that of the surroundings ε 1 , ε 1 ε 2 ε 1 + ε 2 > 0 and the reflected electromagnetic waves are in phase with the incident waves. However, a higher ε 2 will lead to out-of-phase reflected electromagnetic waves. As cavities have low permittivity relative to other underground objects, they can be detected on the basis of the relationship of the phase of the underground reflections to that of the direct waves (Figure 4).
To this end, it is necessary to analyze the phase information at the location of the underground object, but this location is usually unknown. Here, the location of the underground object is estimated as the location of the maximum amplitude of the A-scan signal that passes through the corresponding parabola. A specific number of points are then selected above and below the estimated location of the object. This number of points is determined on the basis of the data collection resolution of the GPR device in the depth direction. The corresponding GPR signal I ( x , z ) is then converted to the complex domain while using the Hilbert transform,
  H ( x , z ) = 1 π P I ( x , z ) z τ d τ ,  
where P denotes the Cauchy principal value and x and z are the spatial coordinates in the scanning direction and the depth direction, respectively. The instantaneous phase value at each spatial point can then be calculated, as follows:
  θ ( x , z ) = tan 1 ( Im [ H ( x , z ) ] Re [ H ( x , z ) ] ) ,  
where Re and Im represent the real and imaginary components of a complex value, respectively.

2.2.4. Decision Making

In the final step, the phase information of the underground reflection is compared with the phase of the direct GPR wave on the basis of the ratio of instantaneous phase change, Δ θ / Δ z . This ratio is calculated along the region where Equation (16) is applied. The underground object is considered to be in-phase with the direct GPR wave if both of the phase change ratios have the same sign (Figure 4a). Conversely, if their signs are different, they are considered to be out-of-phase, and it may be a high-permittivity object, e.g., a pipe (Figure 4b).

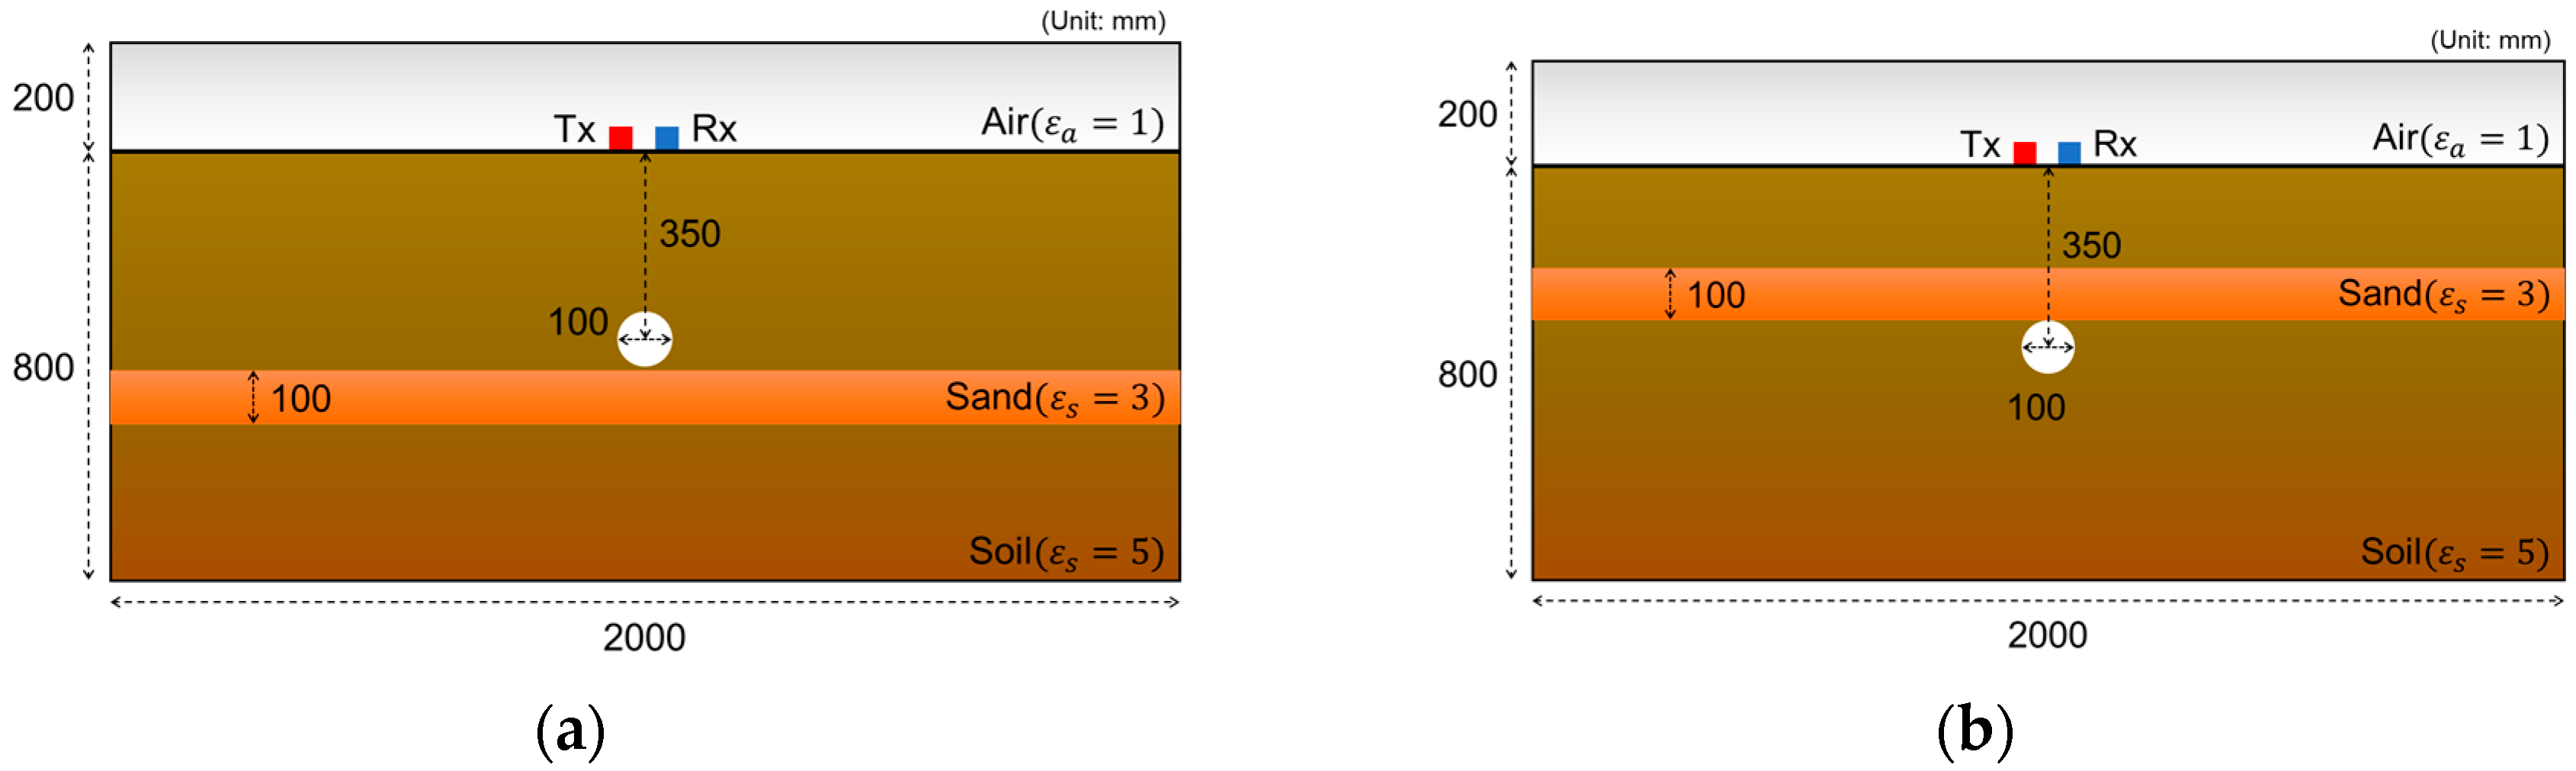
3. Simulation Result: Numerical Validation Using GPR Simulation Data

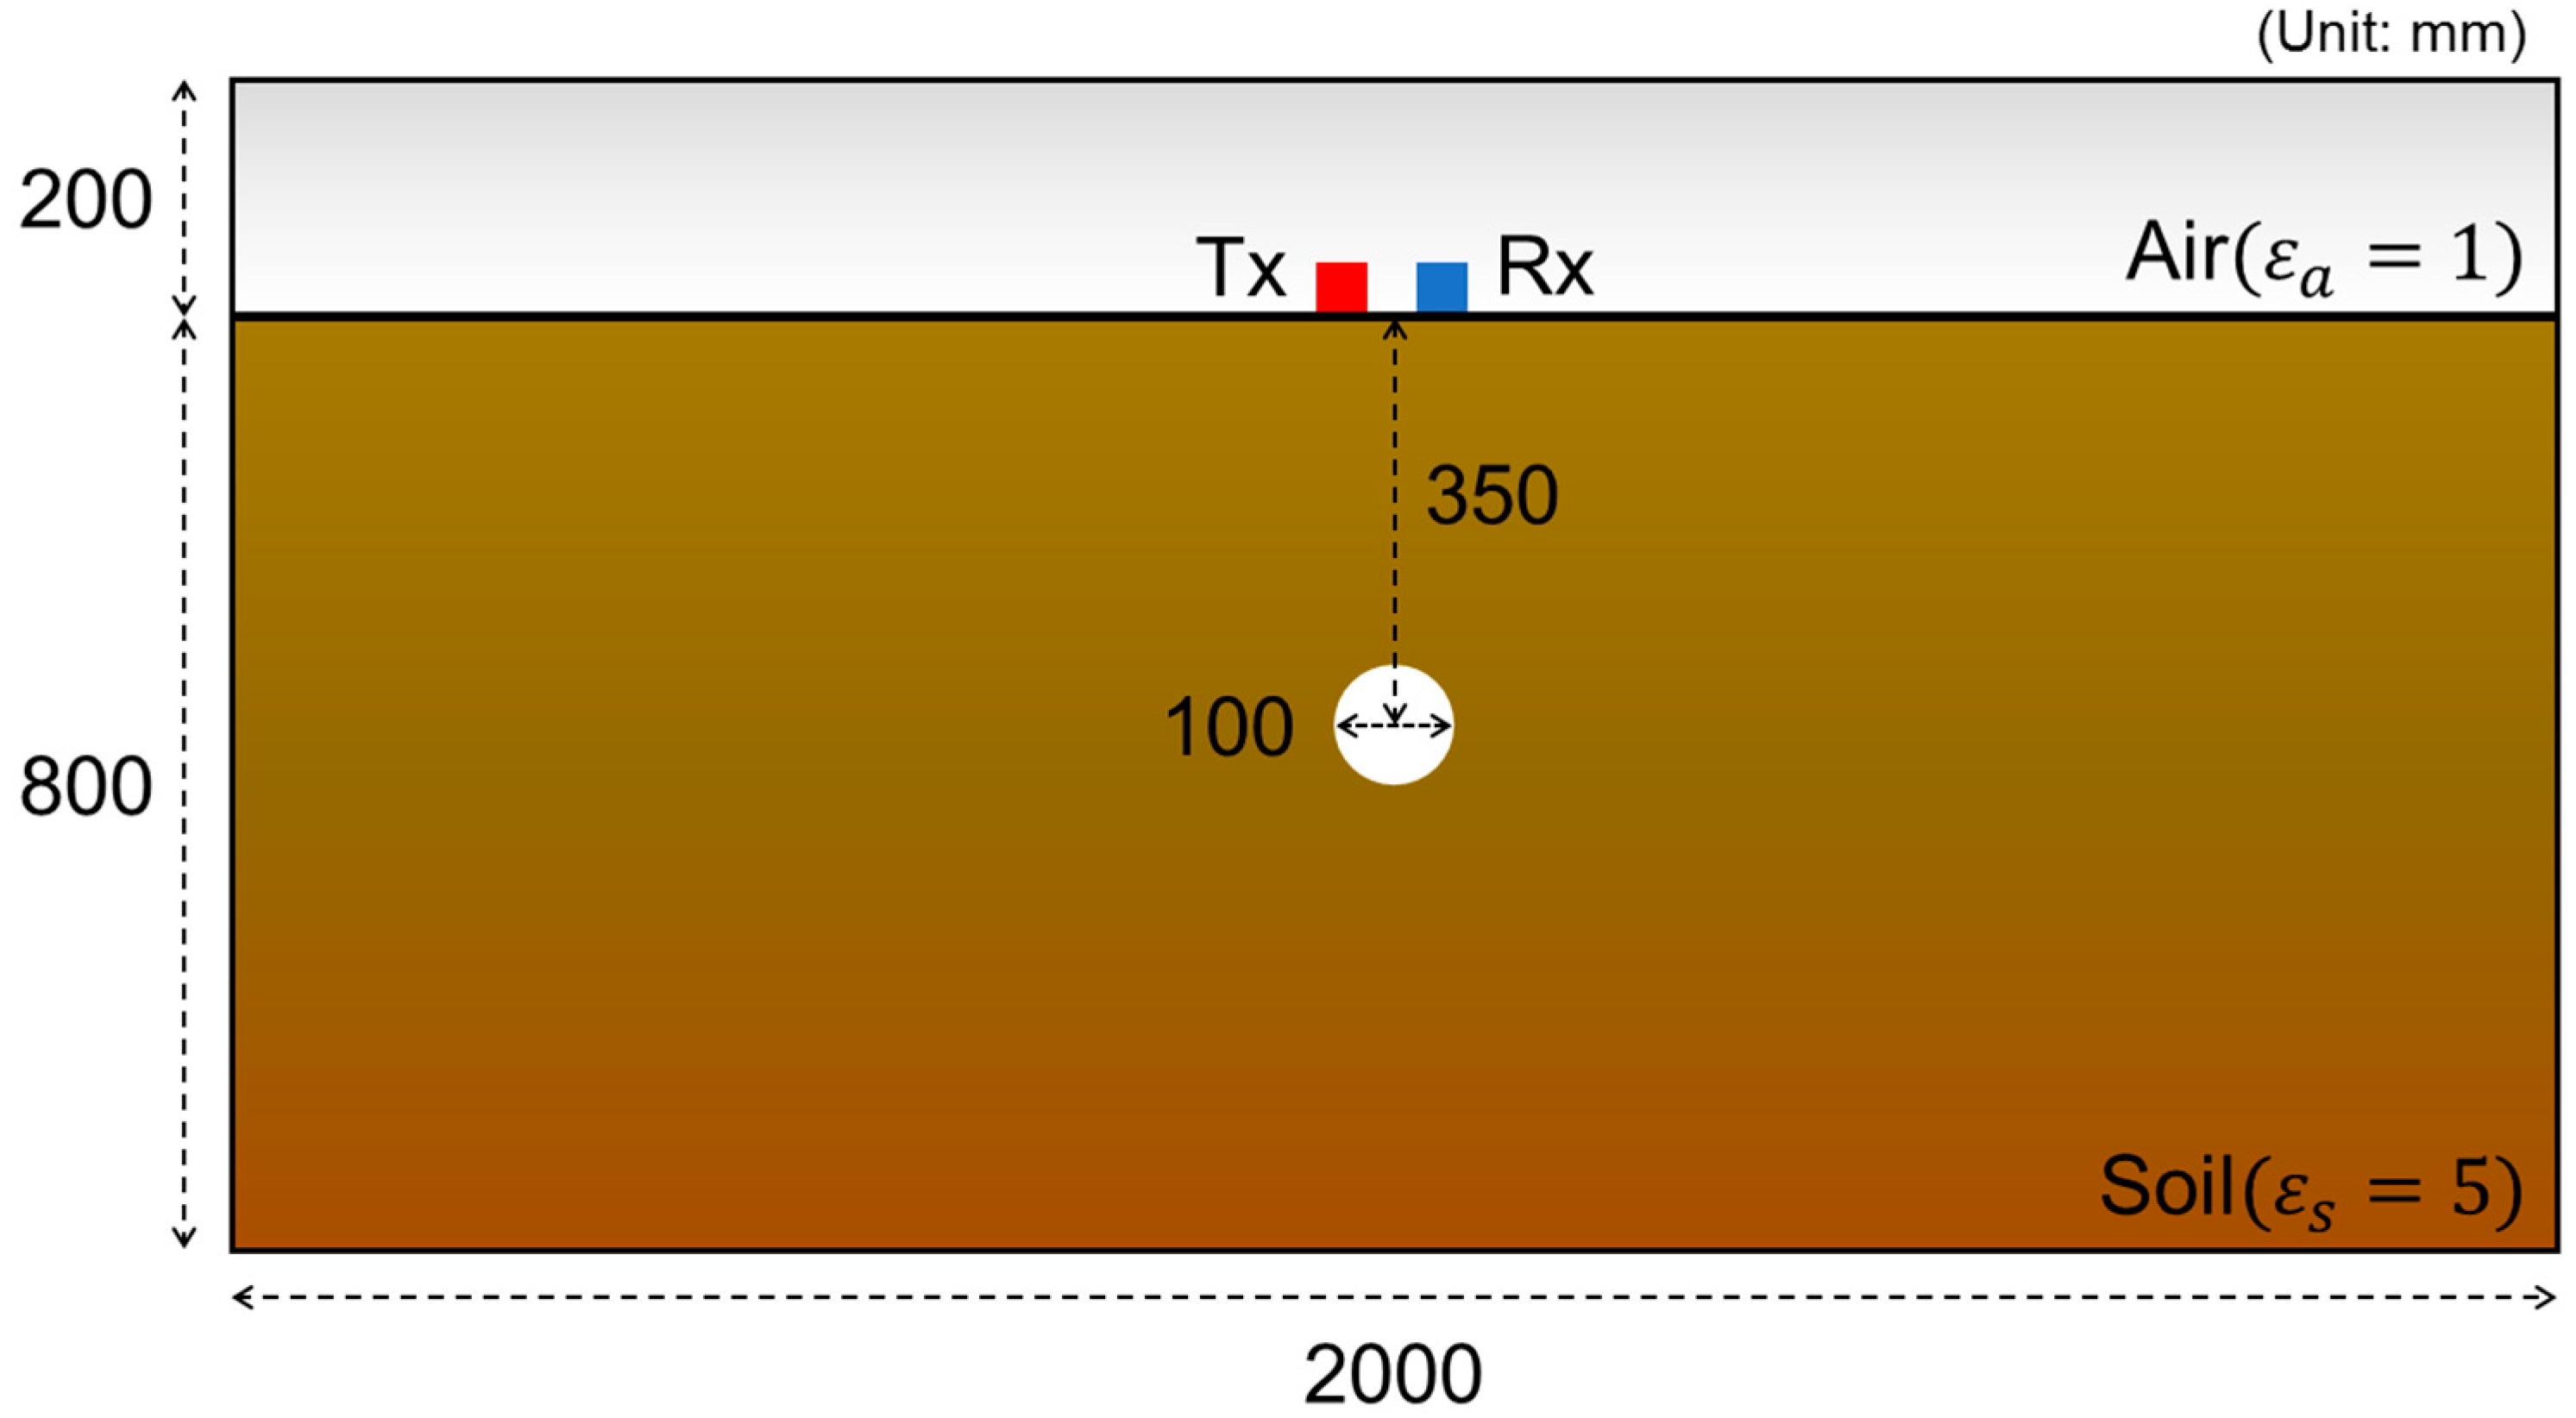
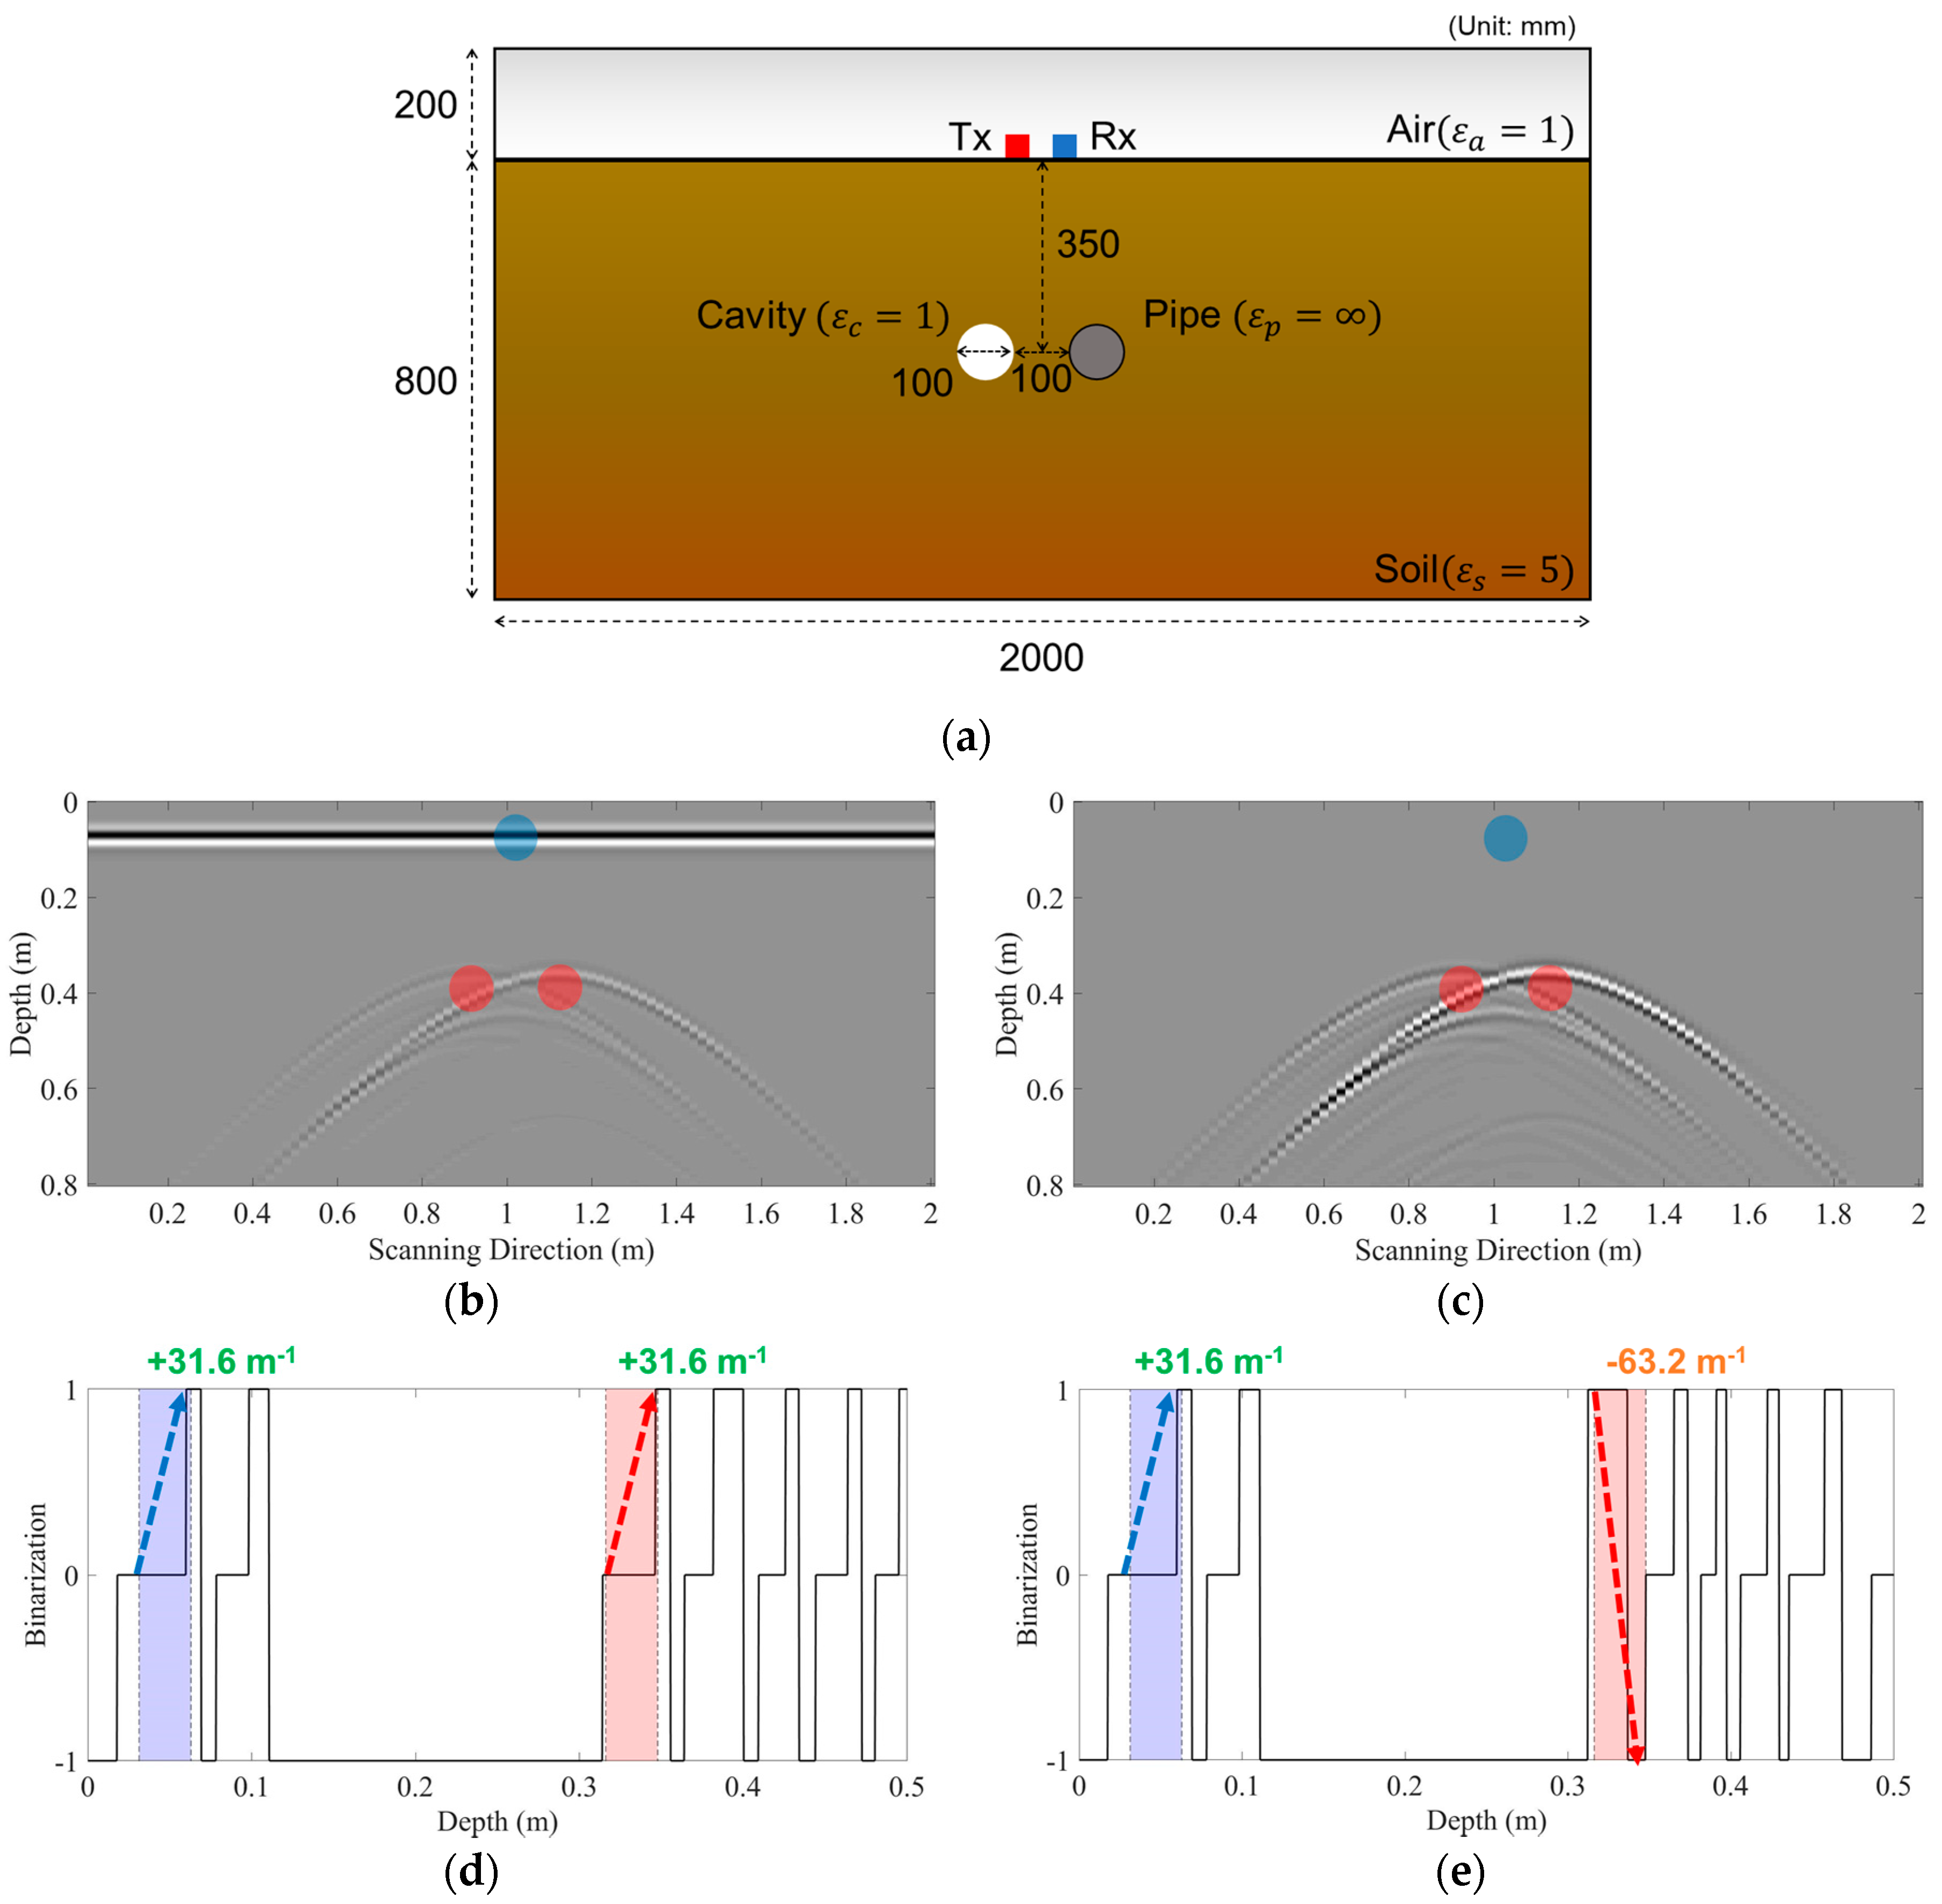
3.1. Simulation Setup

The proposed underground object classification technique was numerically validated using simulated 2D GPR data for various underground models. The proposed technique was applied to a pristine model, a model with an underground cavity, and a model with an underground pipe. The visibility of the underground object was enhanced by removing background signals, and the cavity and pipe were distinguished from each other on the basis of phase information.
Open-source software, gprMax [30], was used to simulate electromagnetic wave propagation while using the finite-difference time domain method. Figure 5 depicts the composition of the simulated underground model. The model has a depth of 0.8 m and a width of 2.0 m, with a 0.2-m-thick upper air layer. The spatial resolution of the model is 2 mm. To simulate the process of GPR data collection, a virtual GPR device scans the model surface from left to right at intervals of 20 mm, resulting in 100 GPR signals. The virtual GPR device consists of a single channel transmitter and a single channel receiver, 40 mm apart. The electromagnetic wave is a normalized first derivative of a Gaussian curve with a center frequency of 1.6 GHz.
The white circle at 0.35 m depth in Figure 5 represents an underground object. For a pristine model, this region is filled with soil ( ε s = 5 ) . For models with an underground cavity and pipe, the region is filled with air ( ε a = 1 ) and a perfect conductor ( ε p = ) , respectively, to simulate the corresponding underground object.

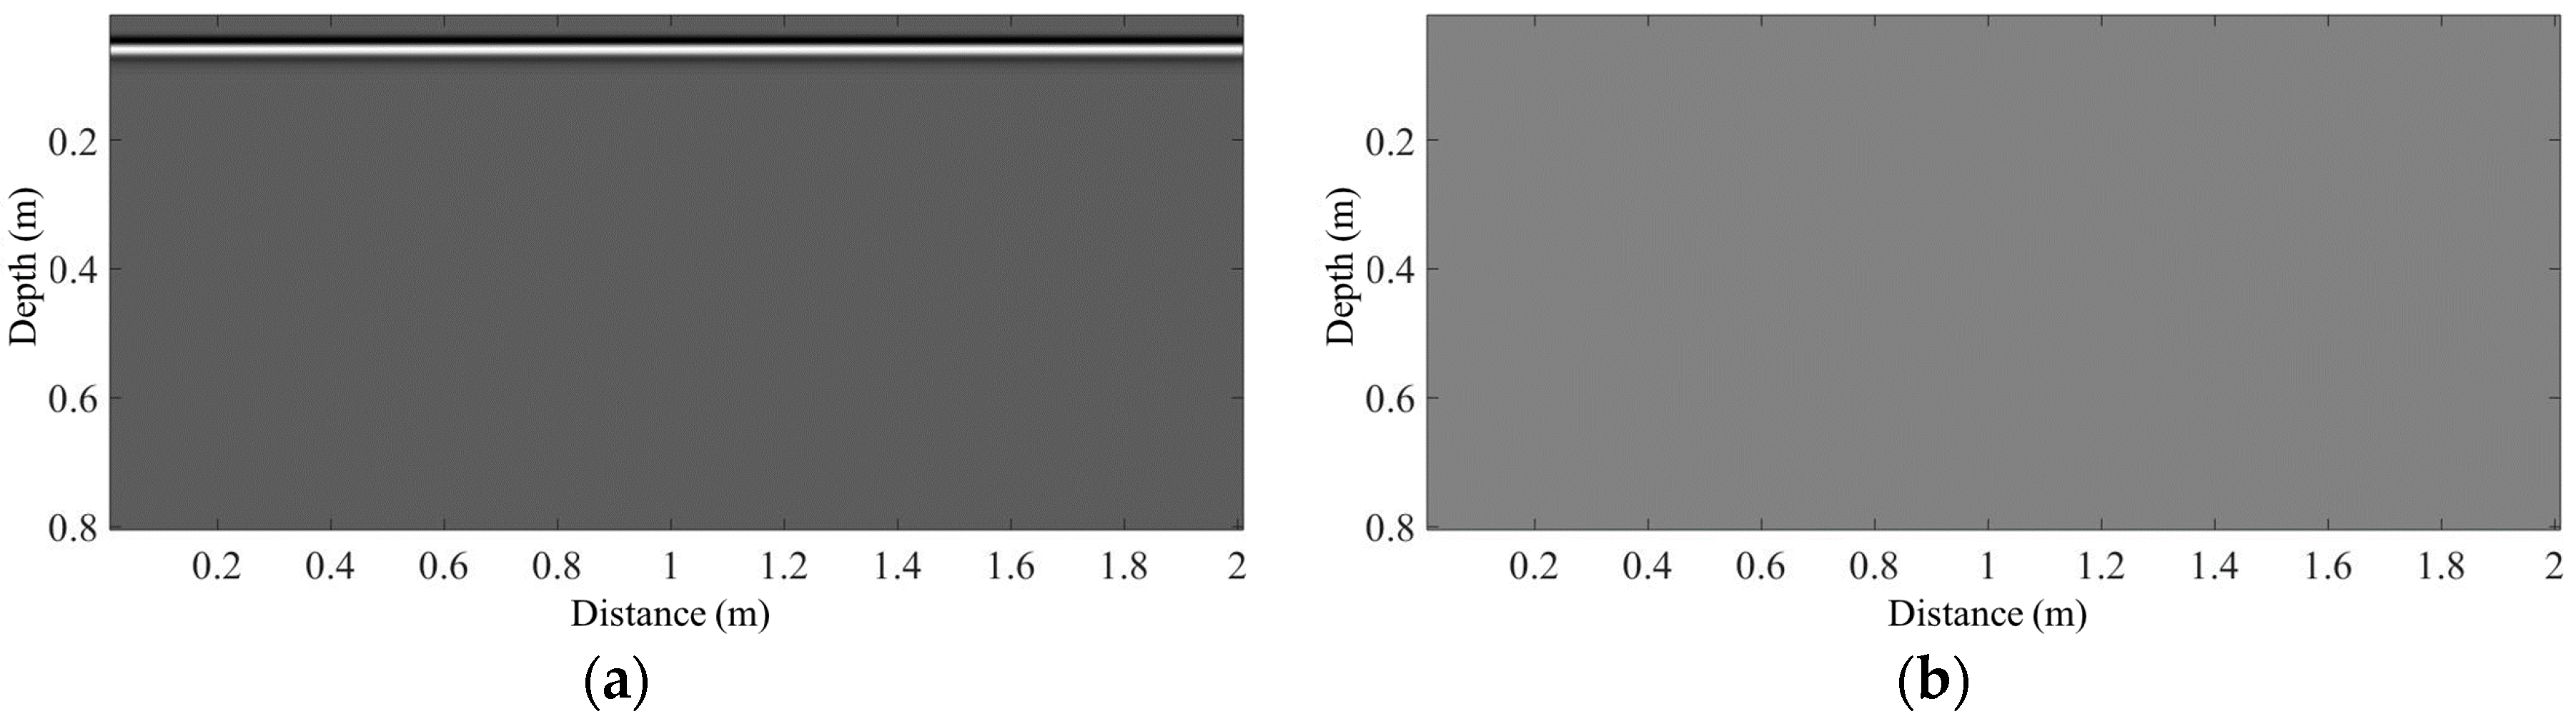
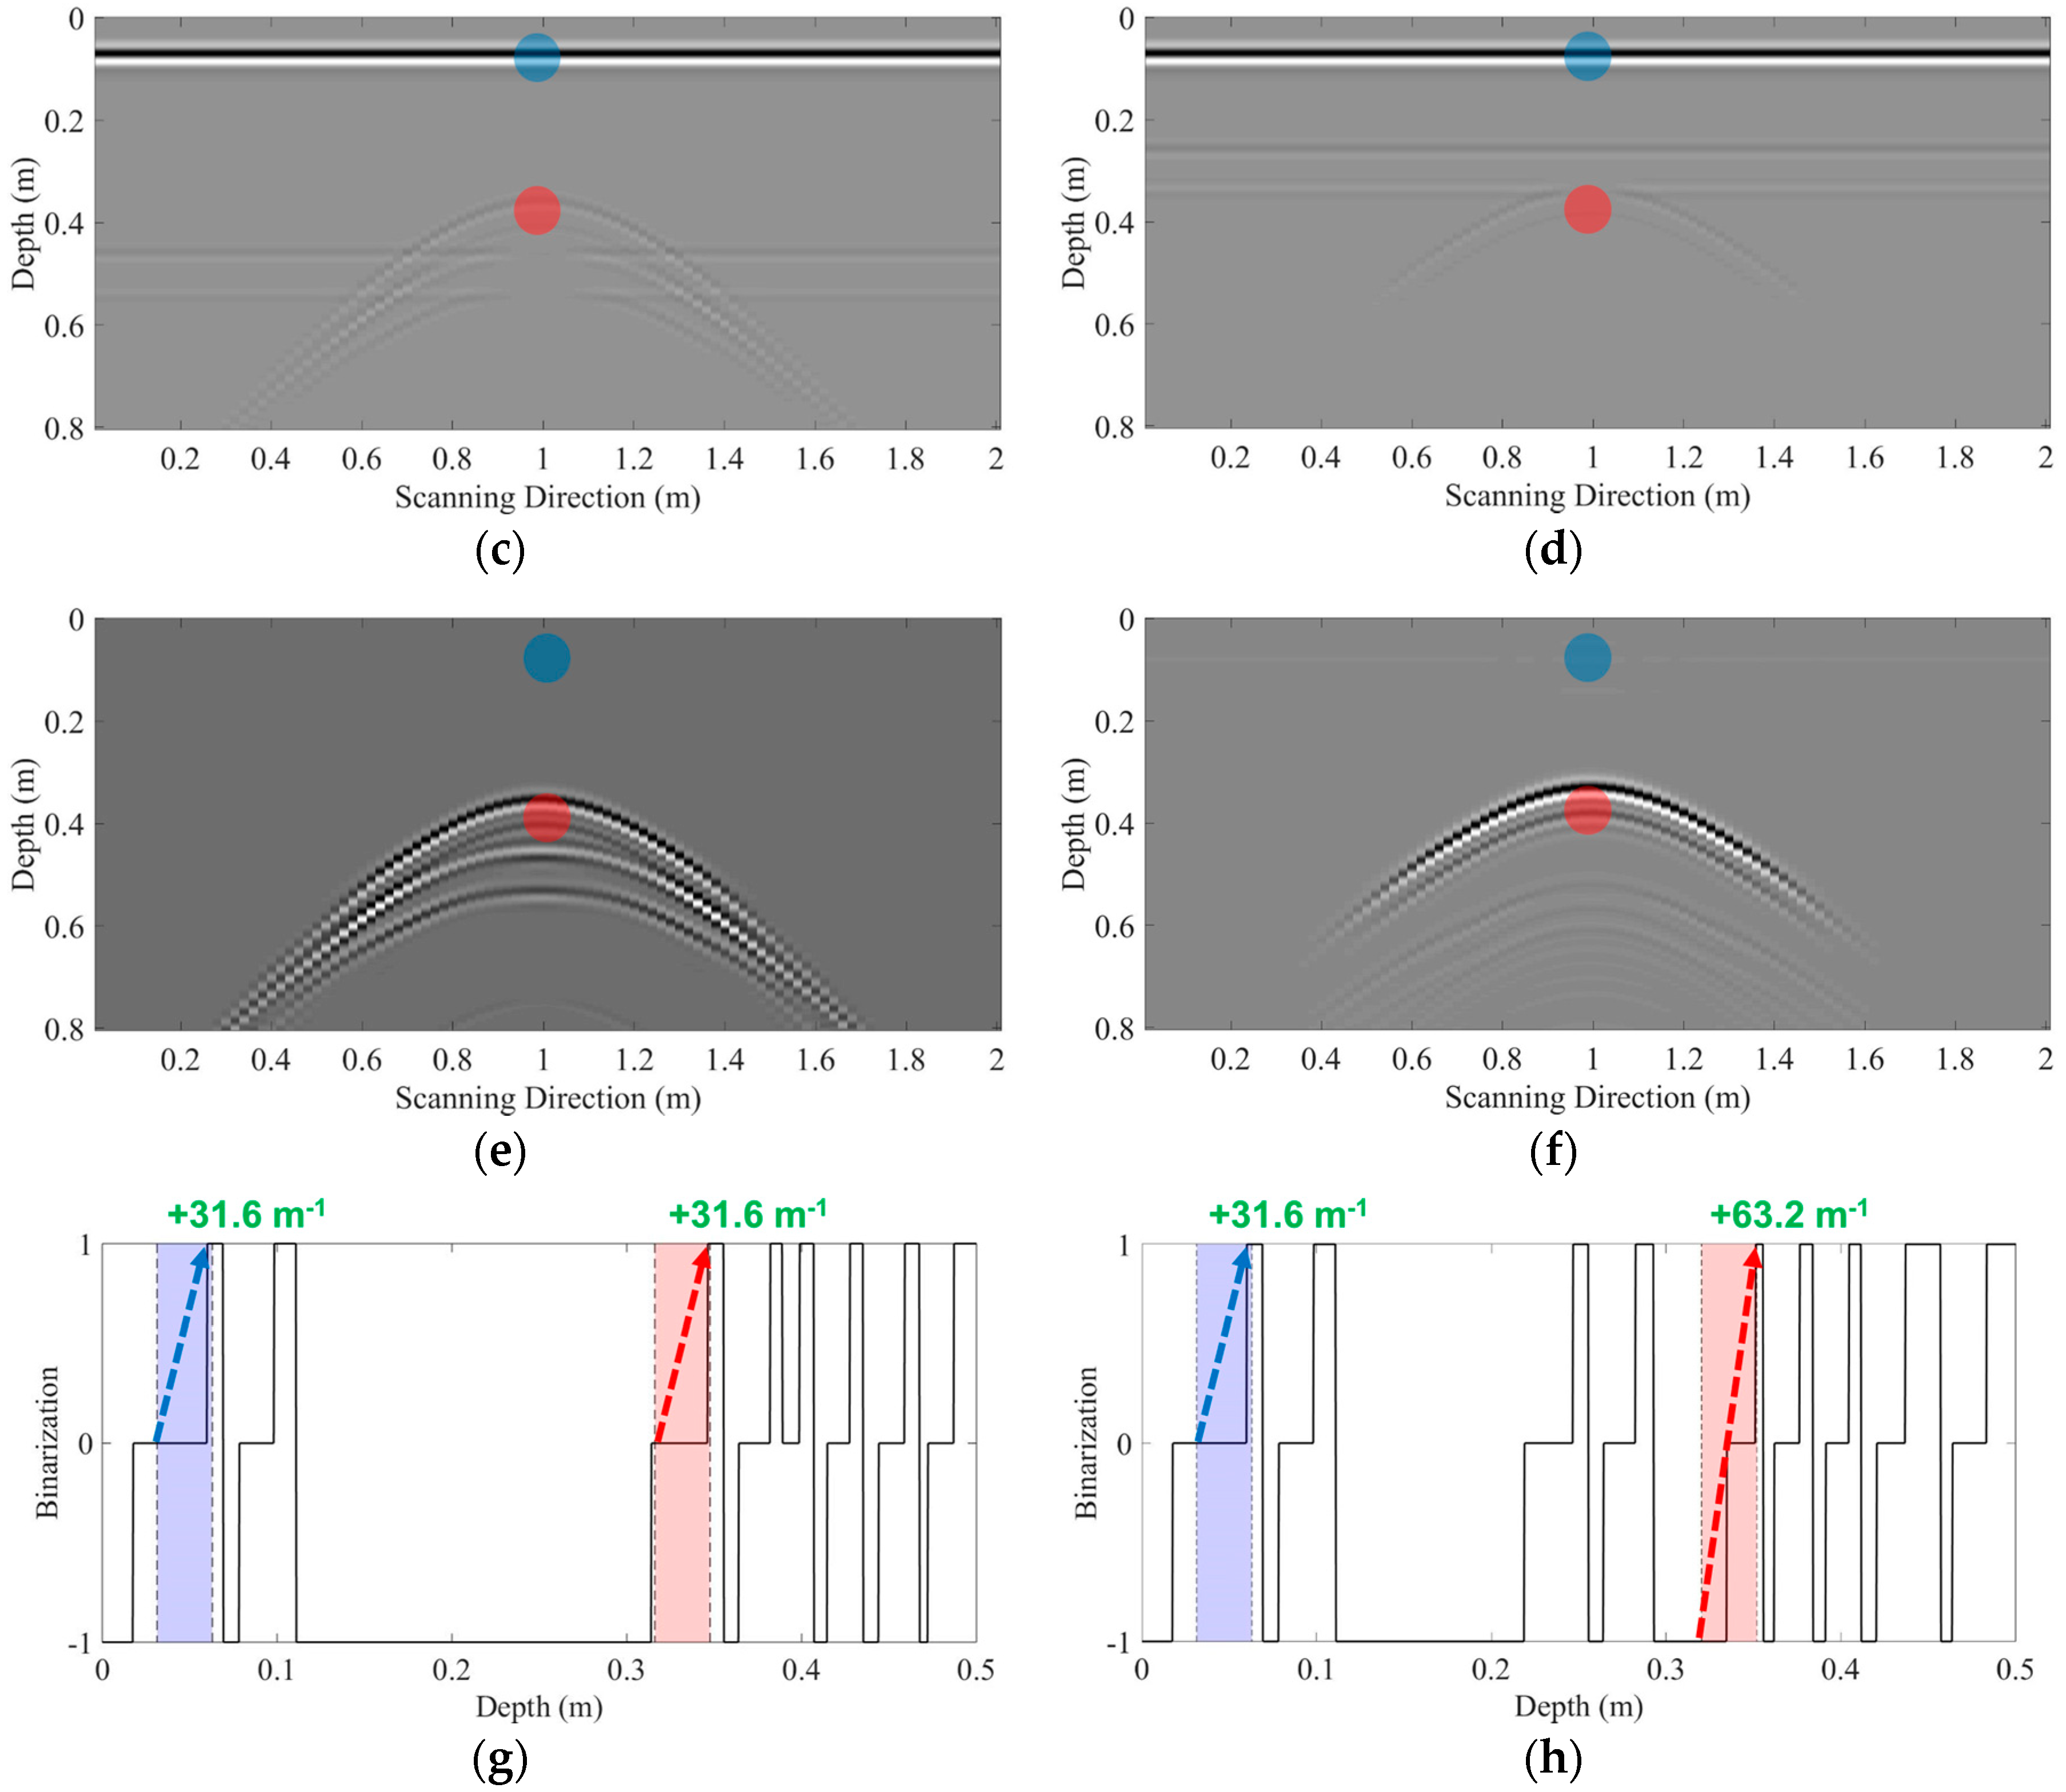
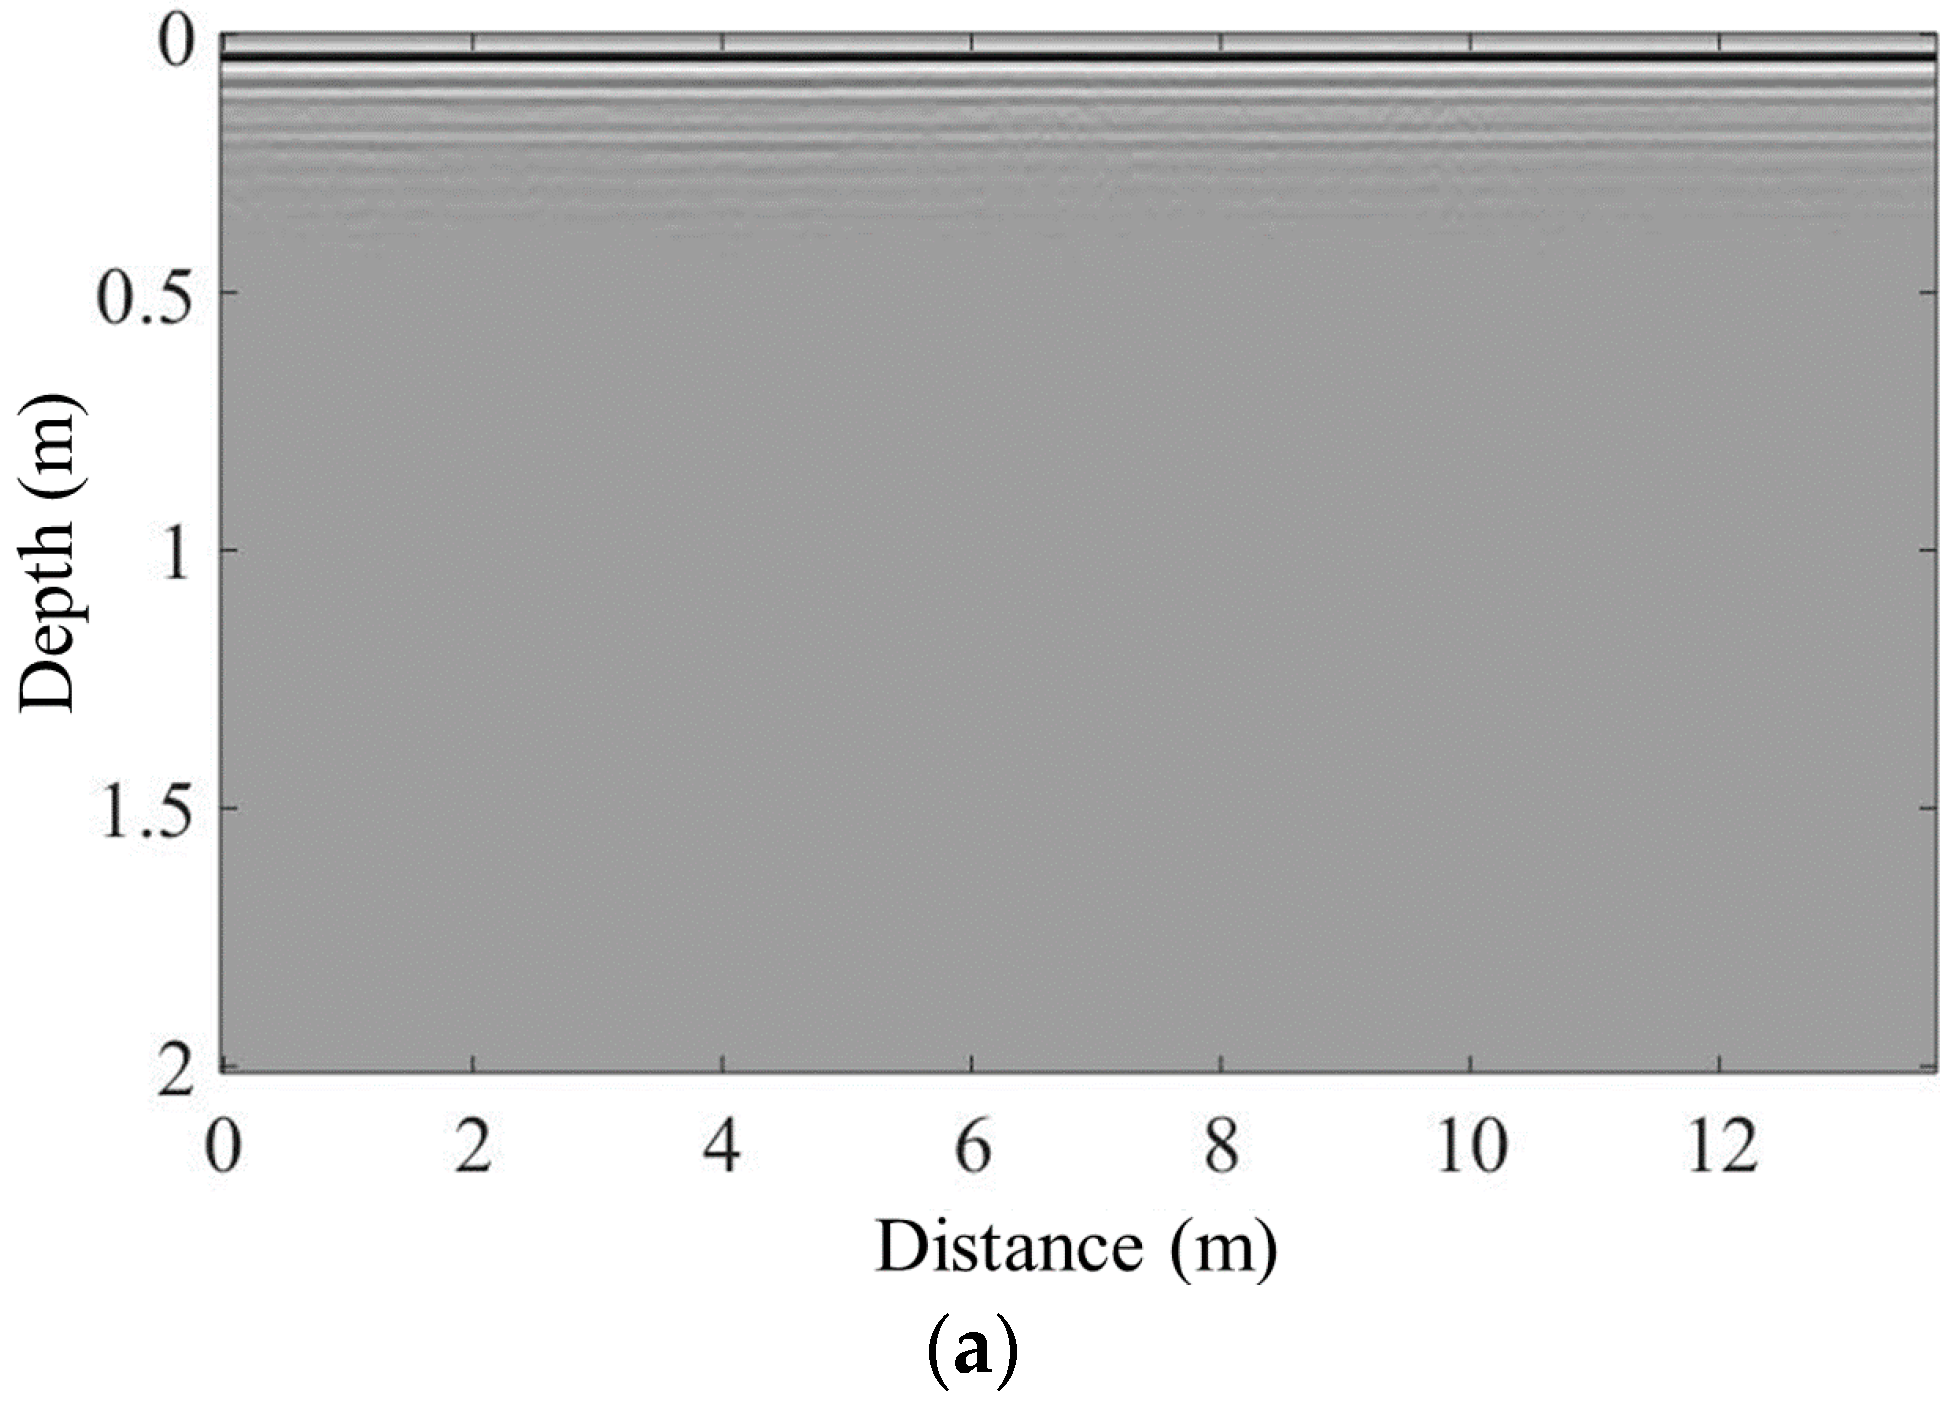
3.2. Classification Results for the Pristine Model

The proposed technique was first applied to the pristine model. The raw GPR image in Figure 6a represents a cross-sectional view of the model. As expected, no reflection from an underground object is observed, but dominant surface reflections are seen near the ground surface. The background filter was applied to this region to identify any reflections from underground objects while using the leftmost scanning location of the model as the reference point and the corresponding A-scan response as the reference signal. No distinguishable features are observed in Figure 6b after filtering, indicating that the proposed technique is valid for the pristine model and does not give a false positive.

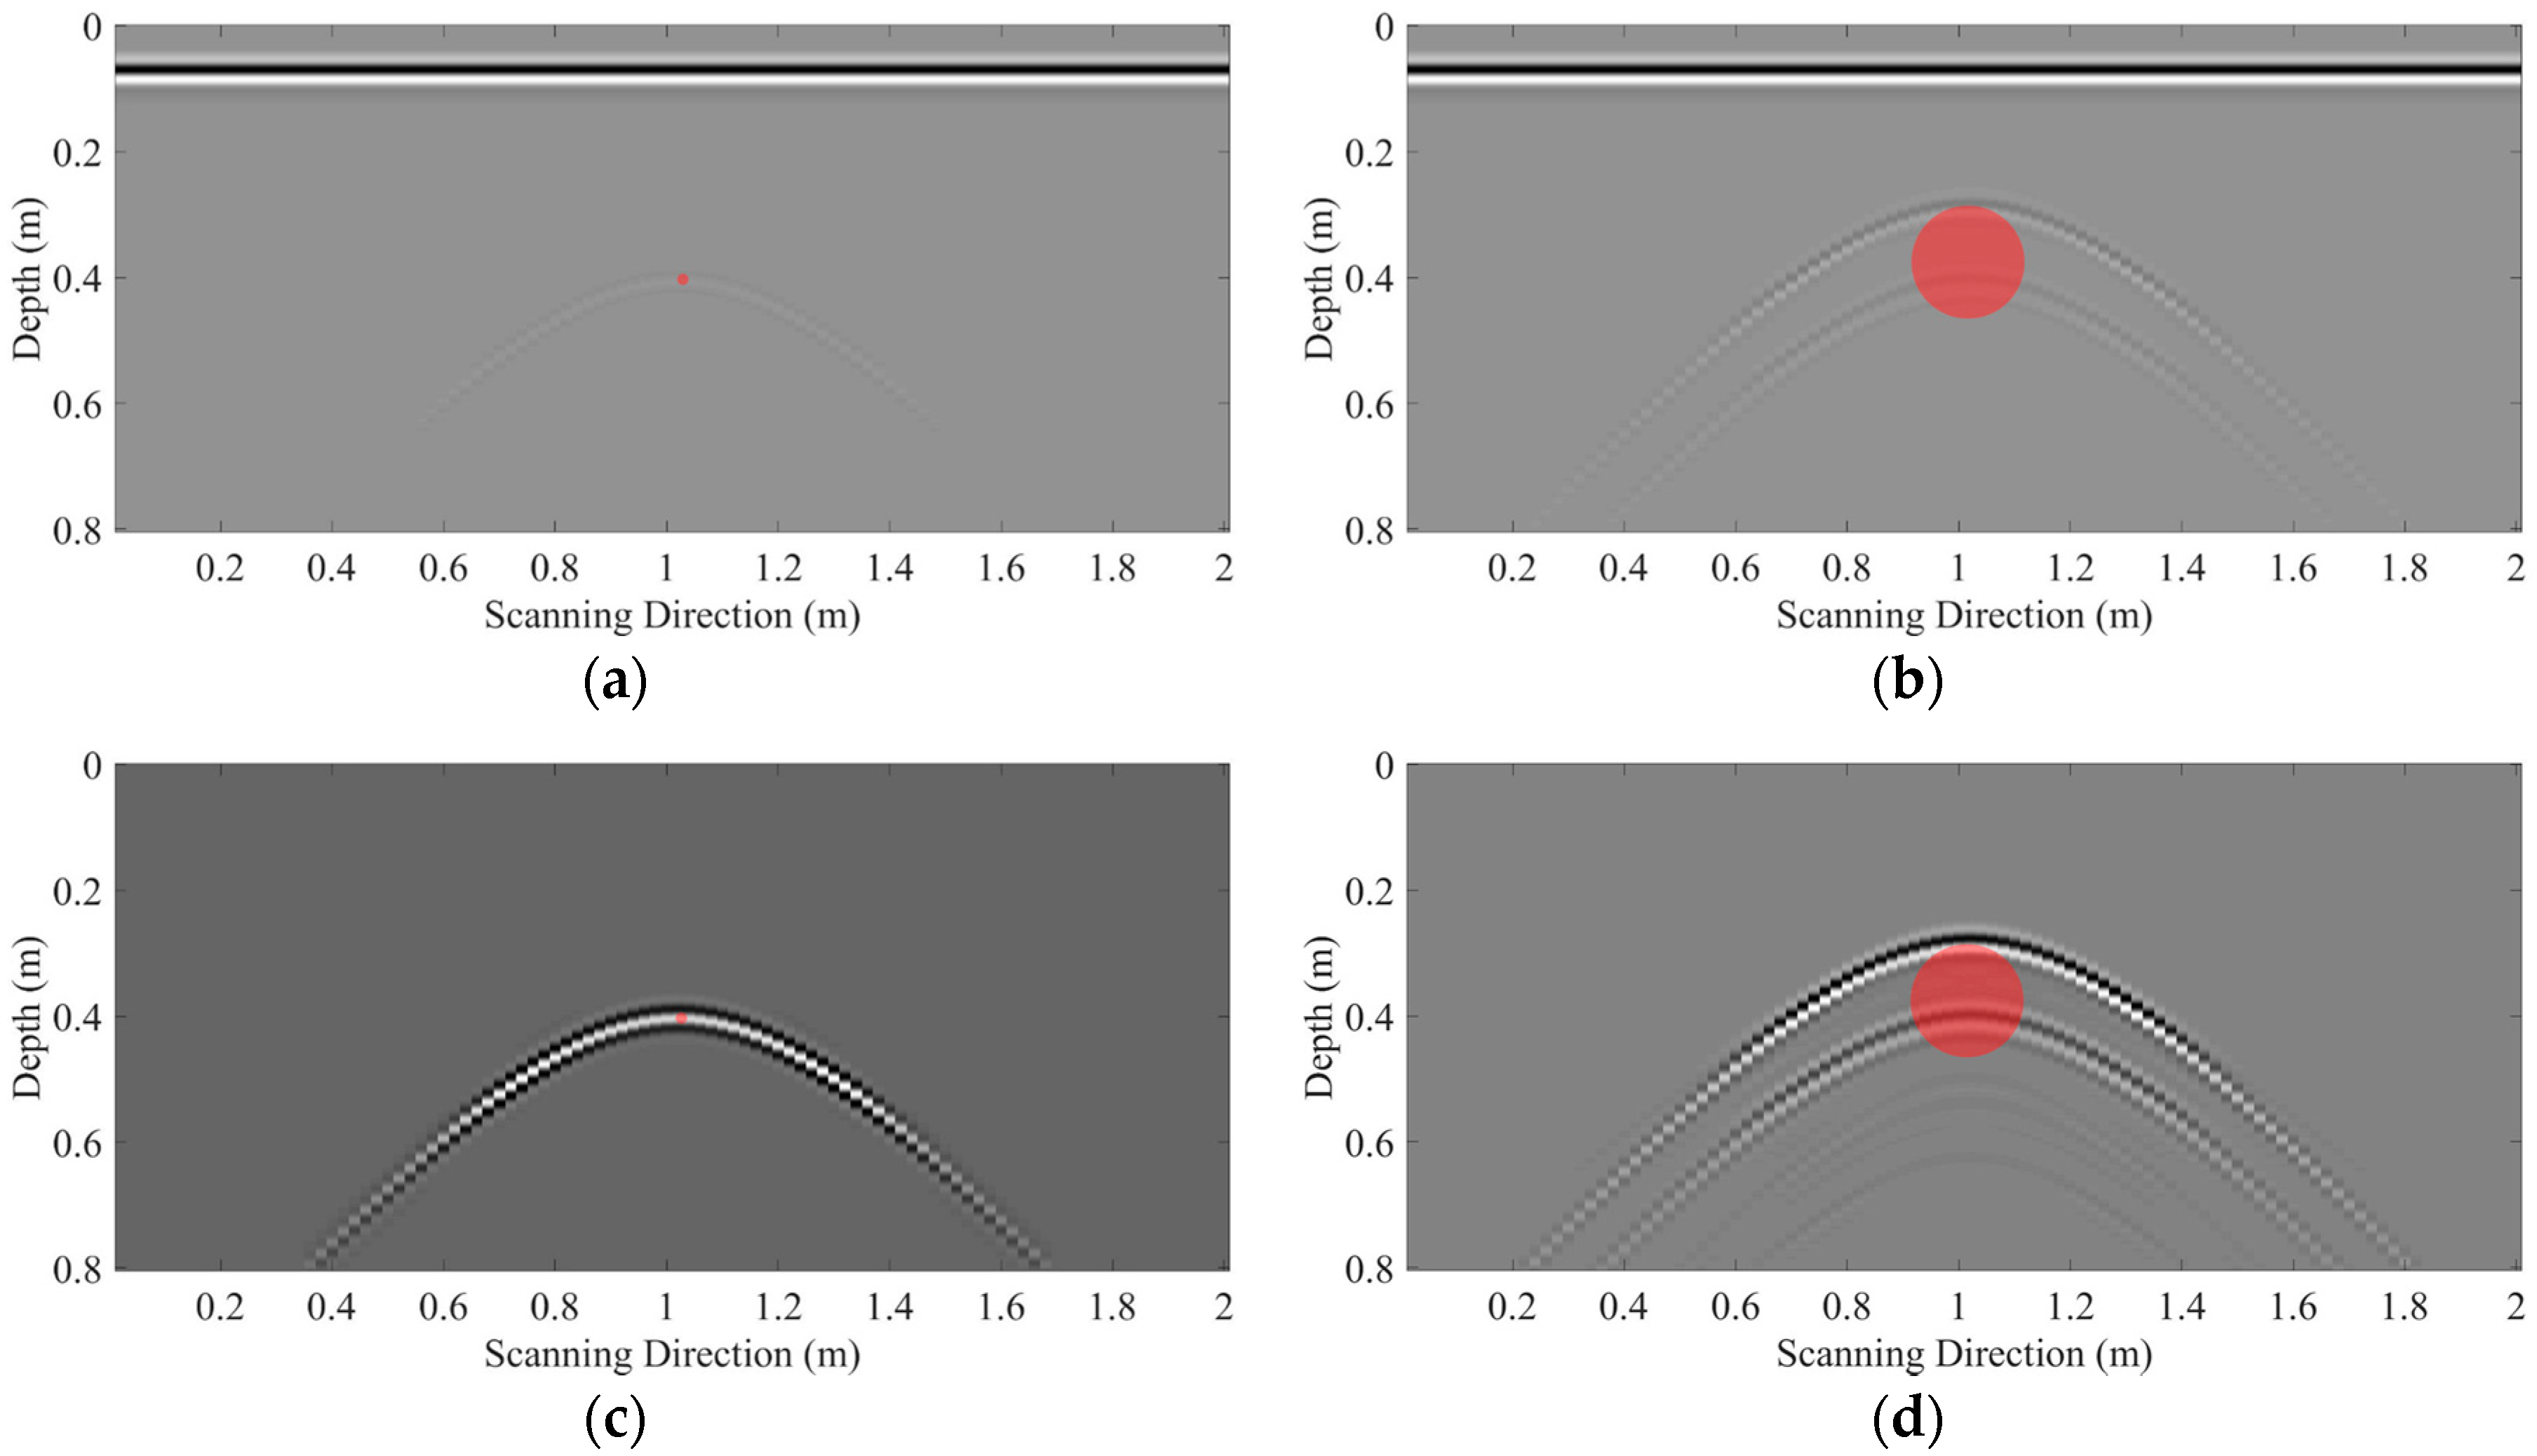
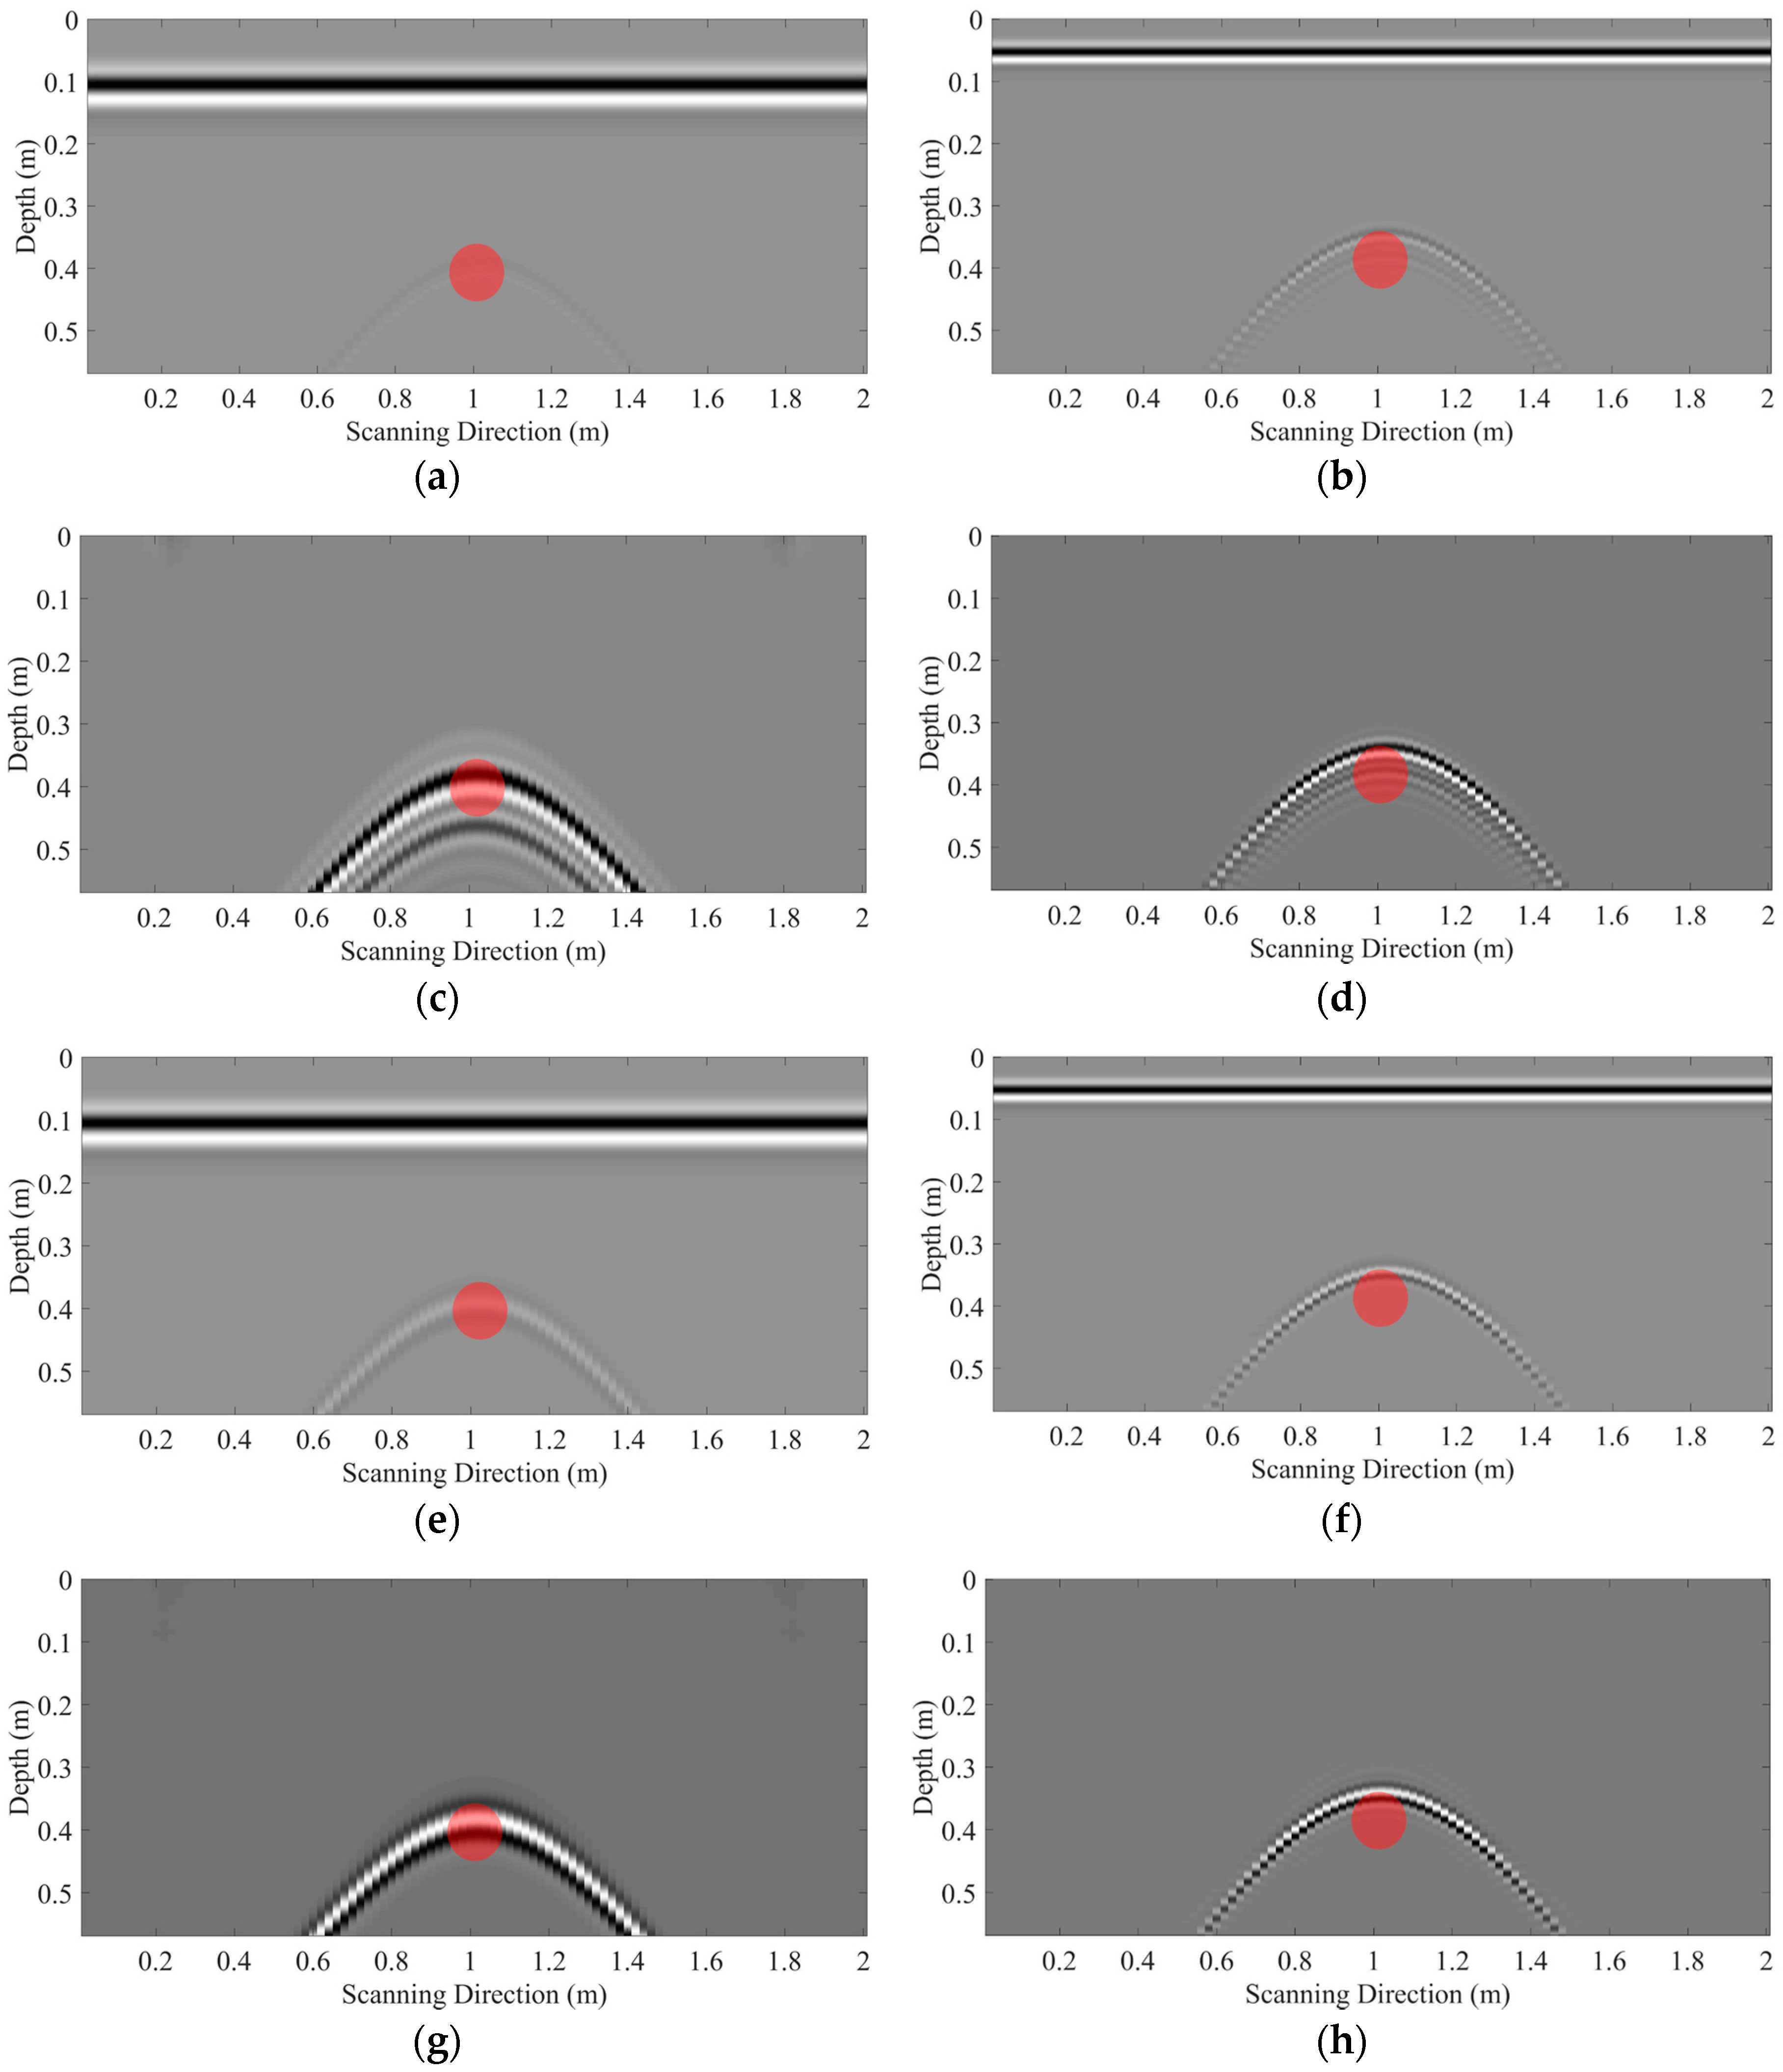
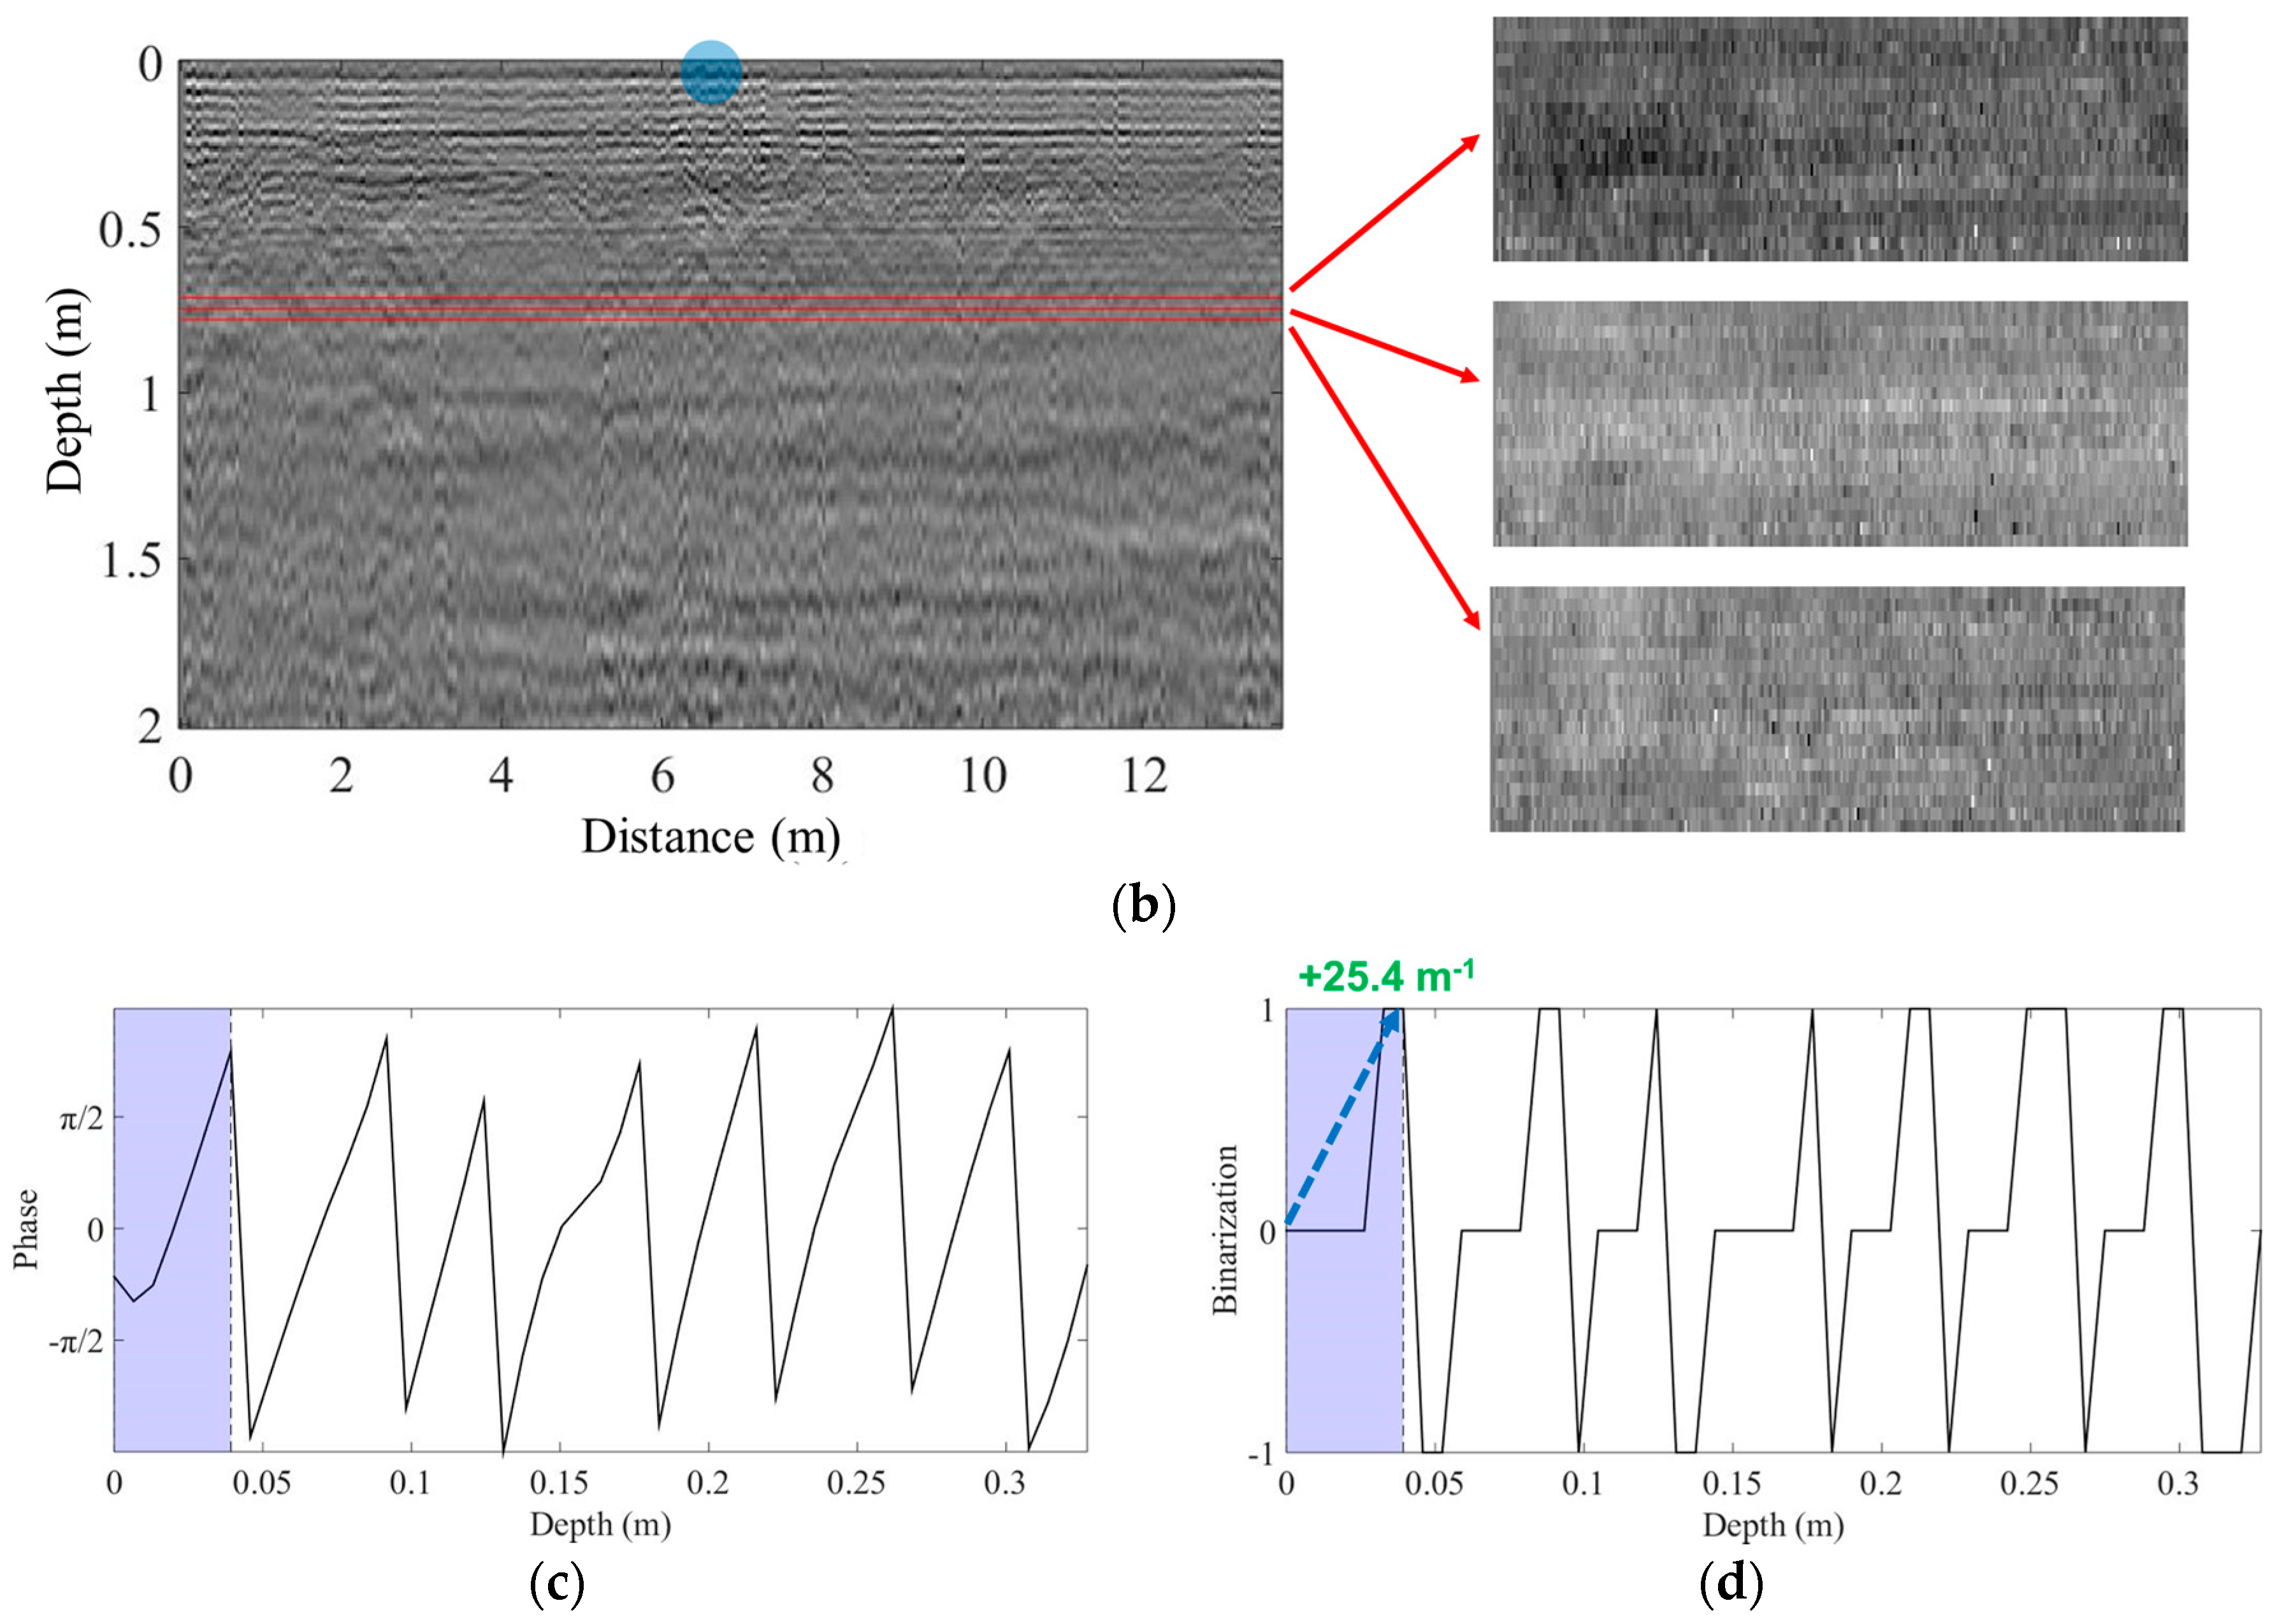
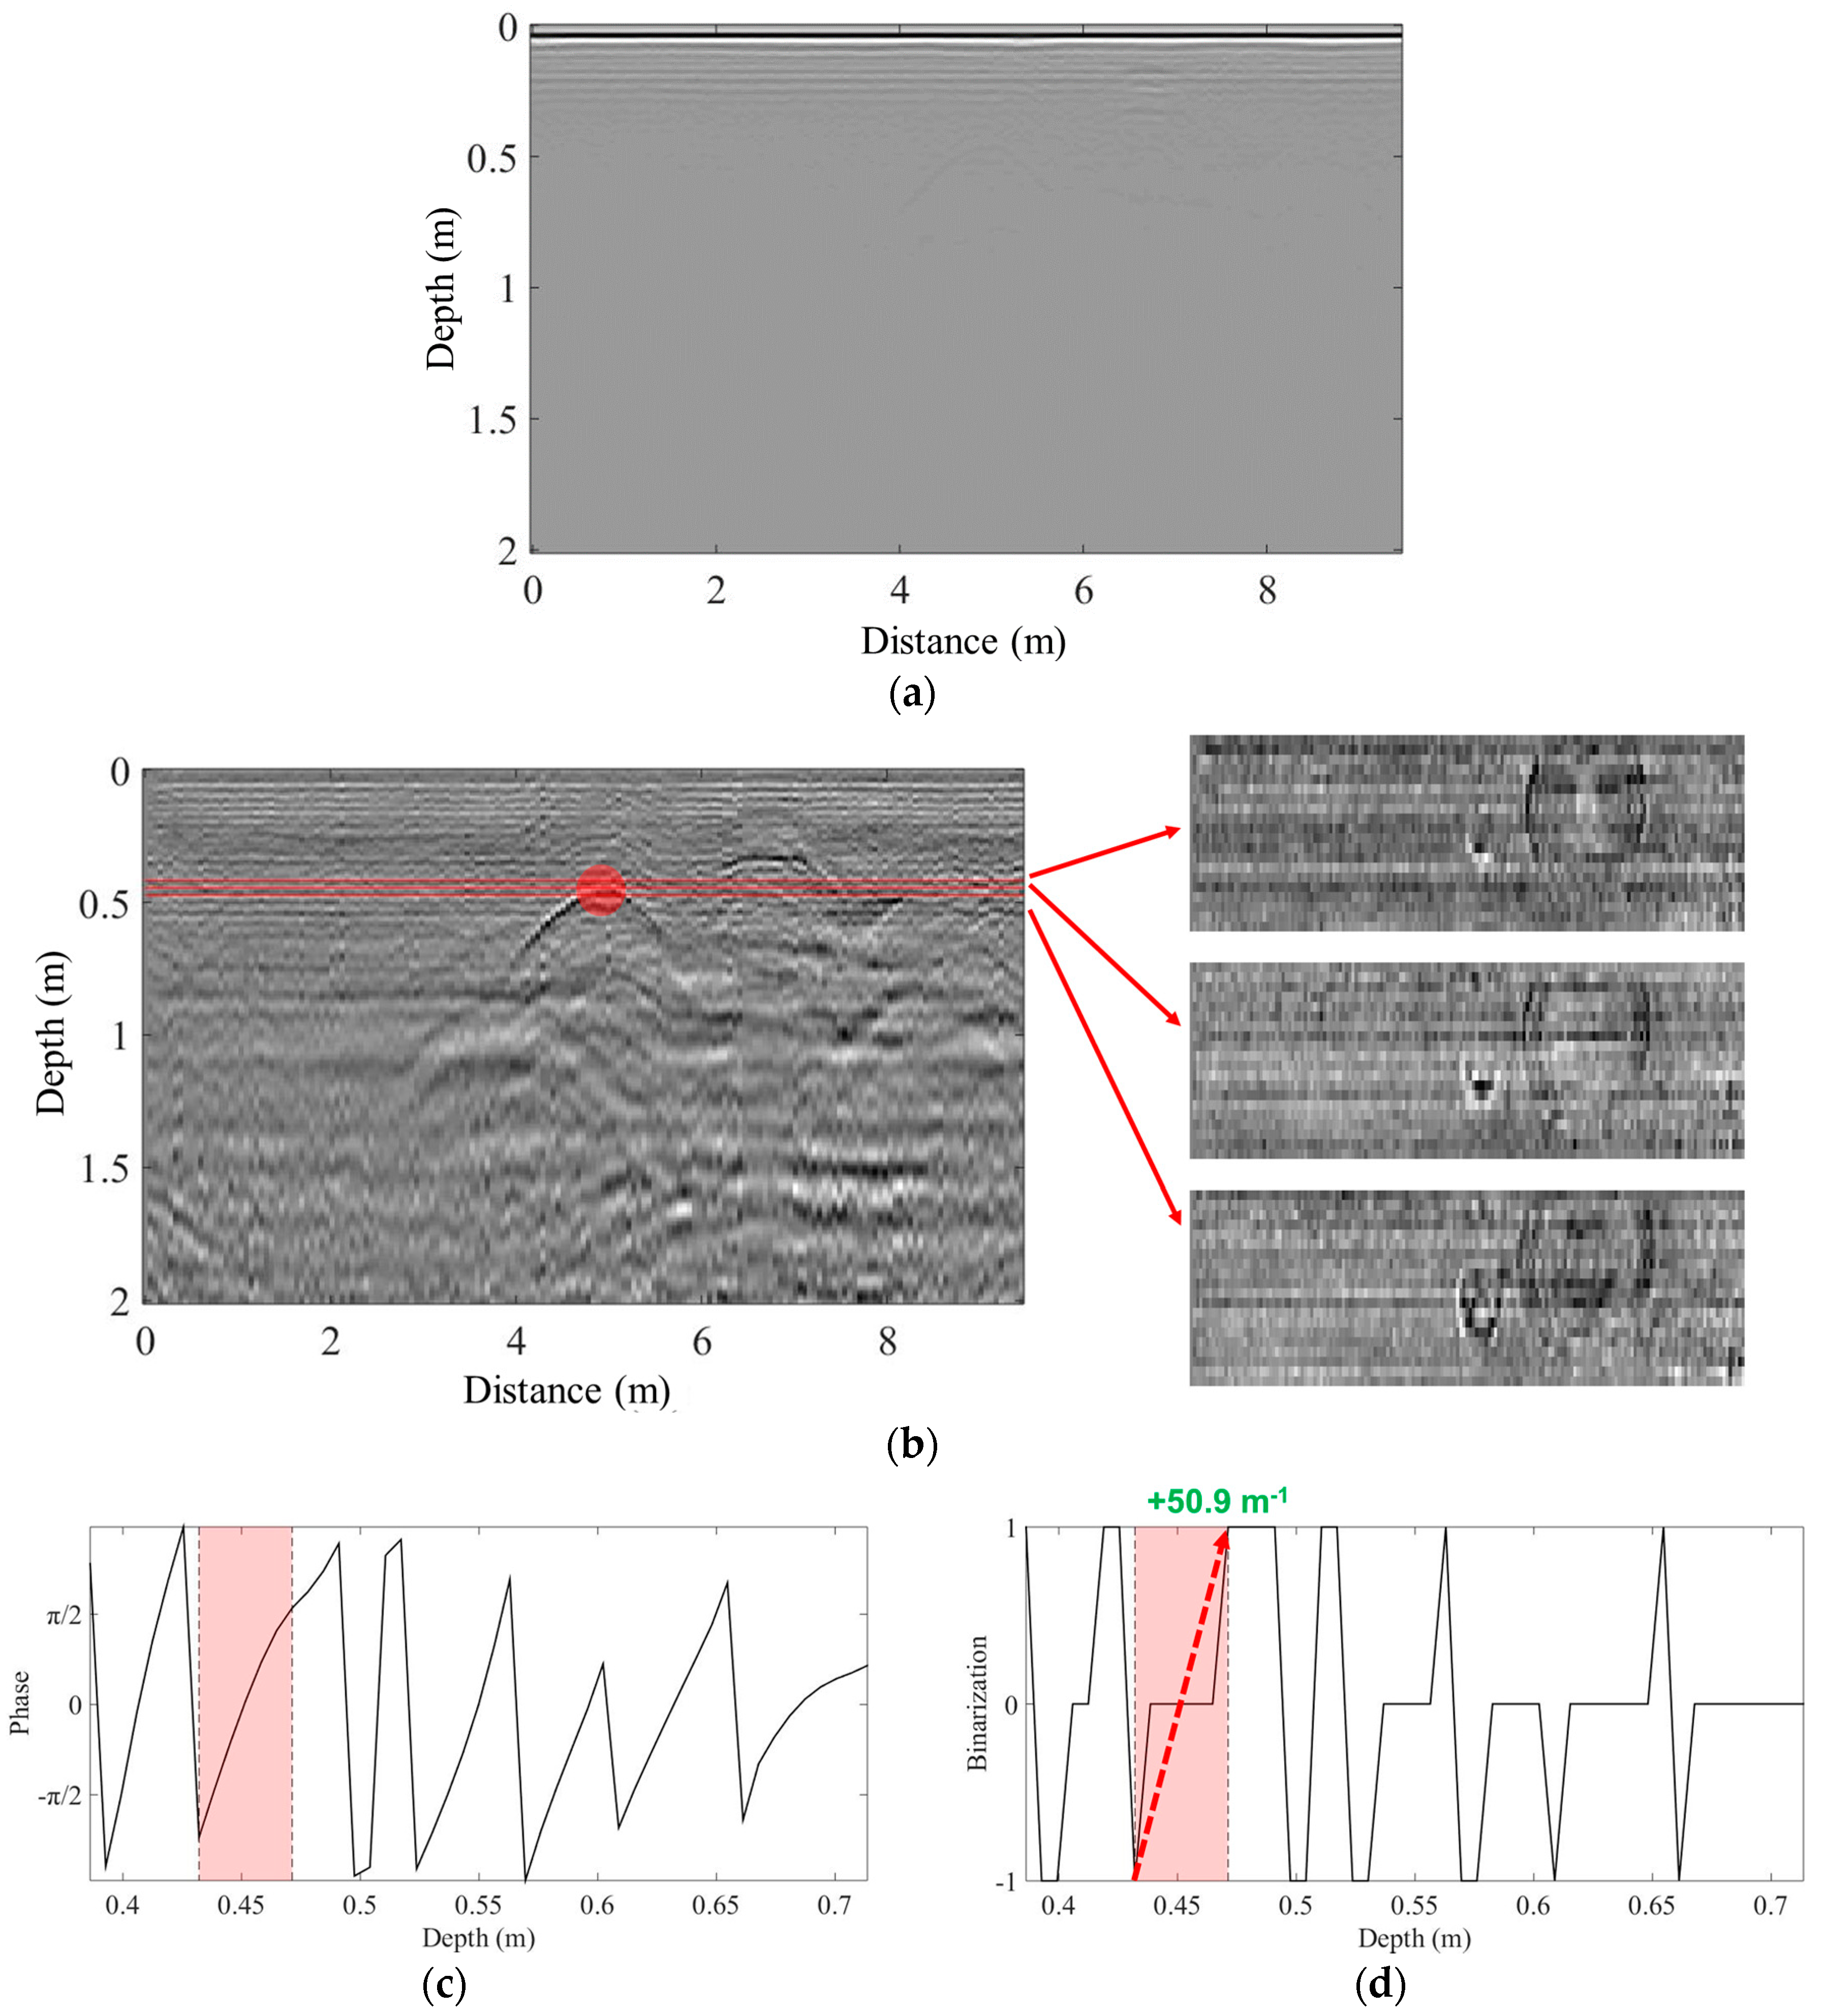
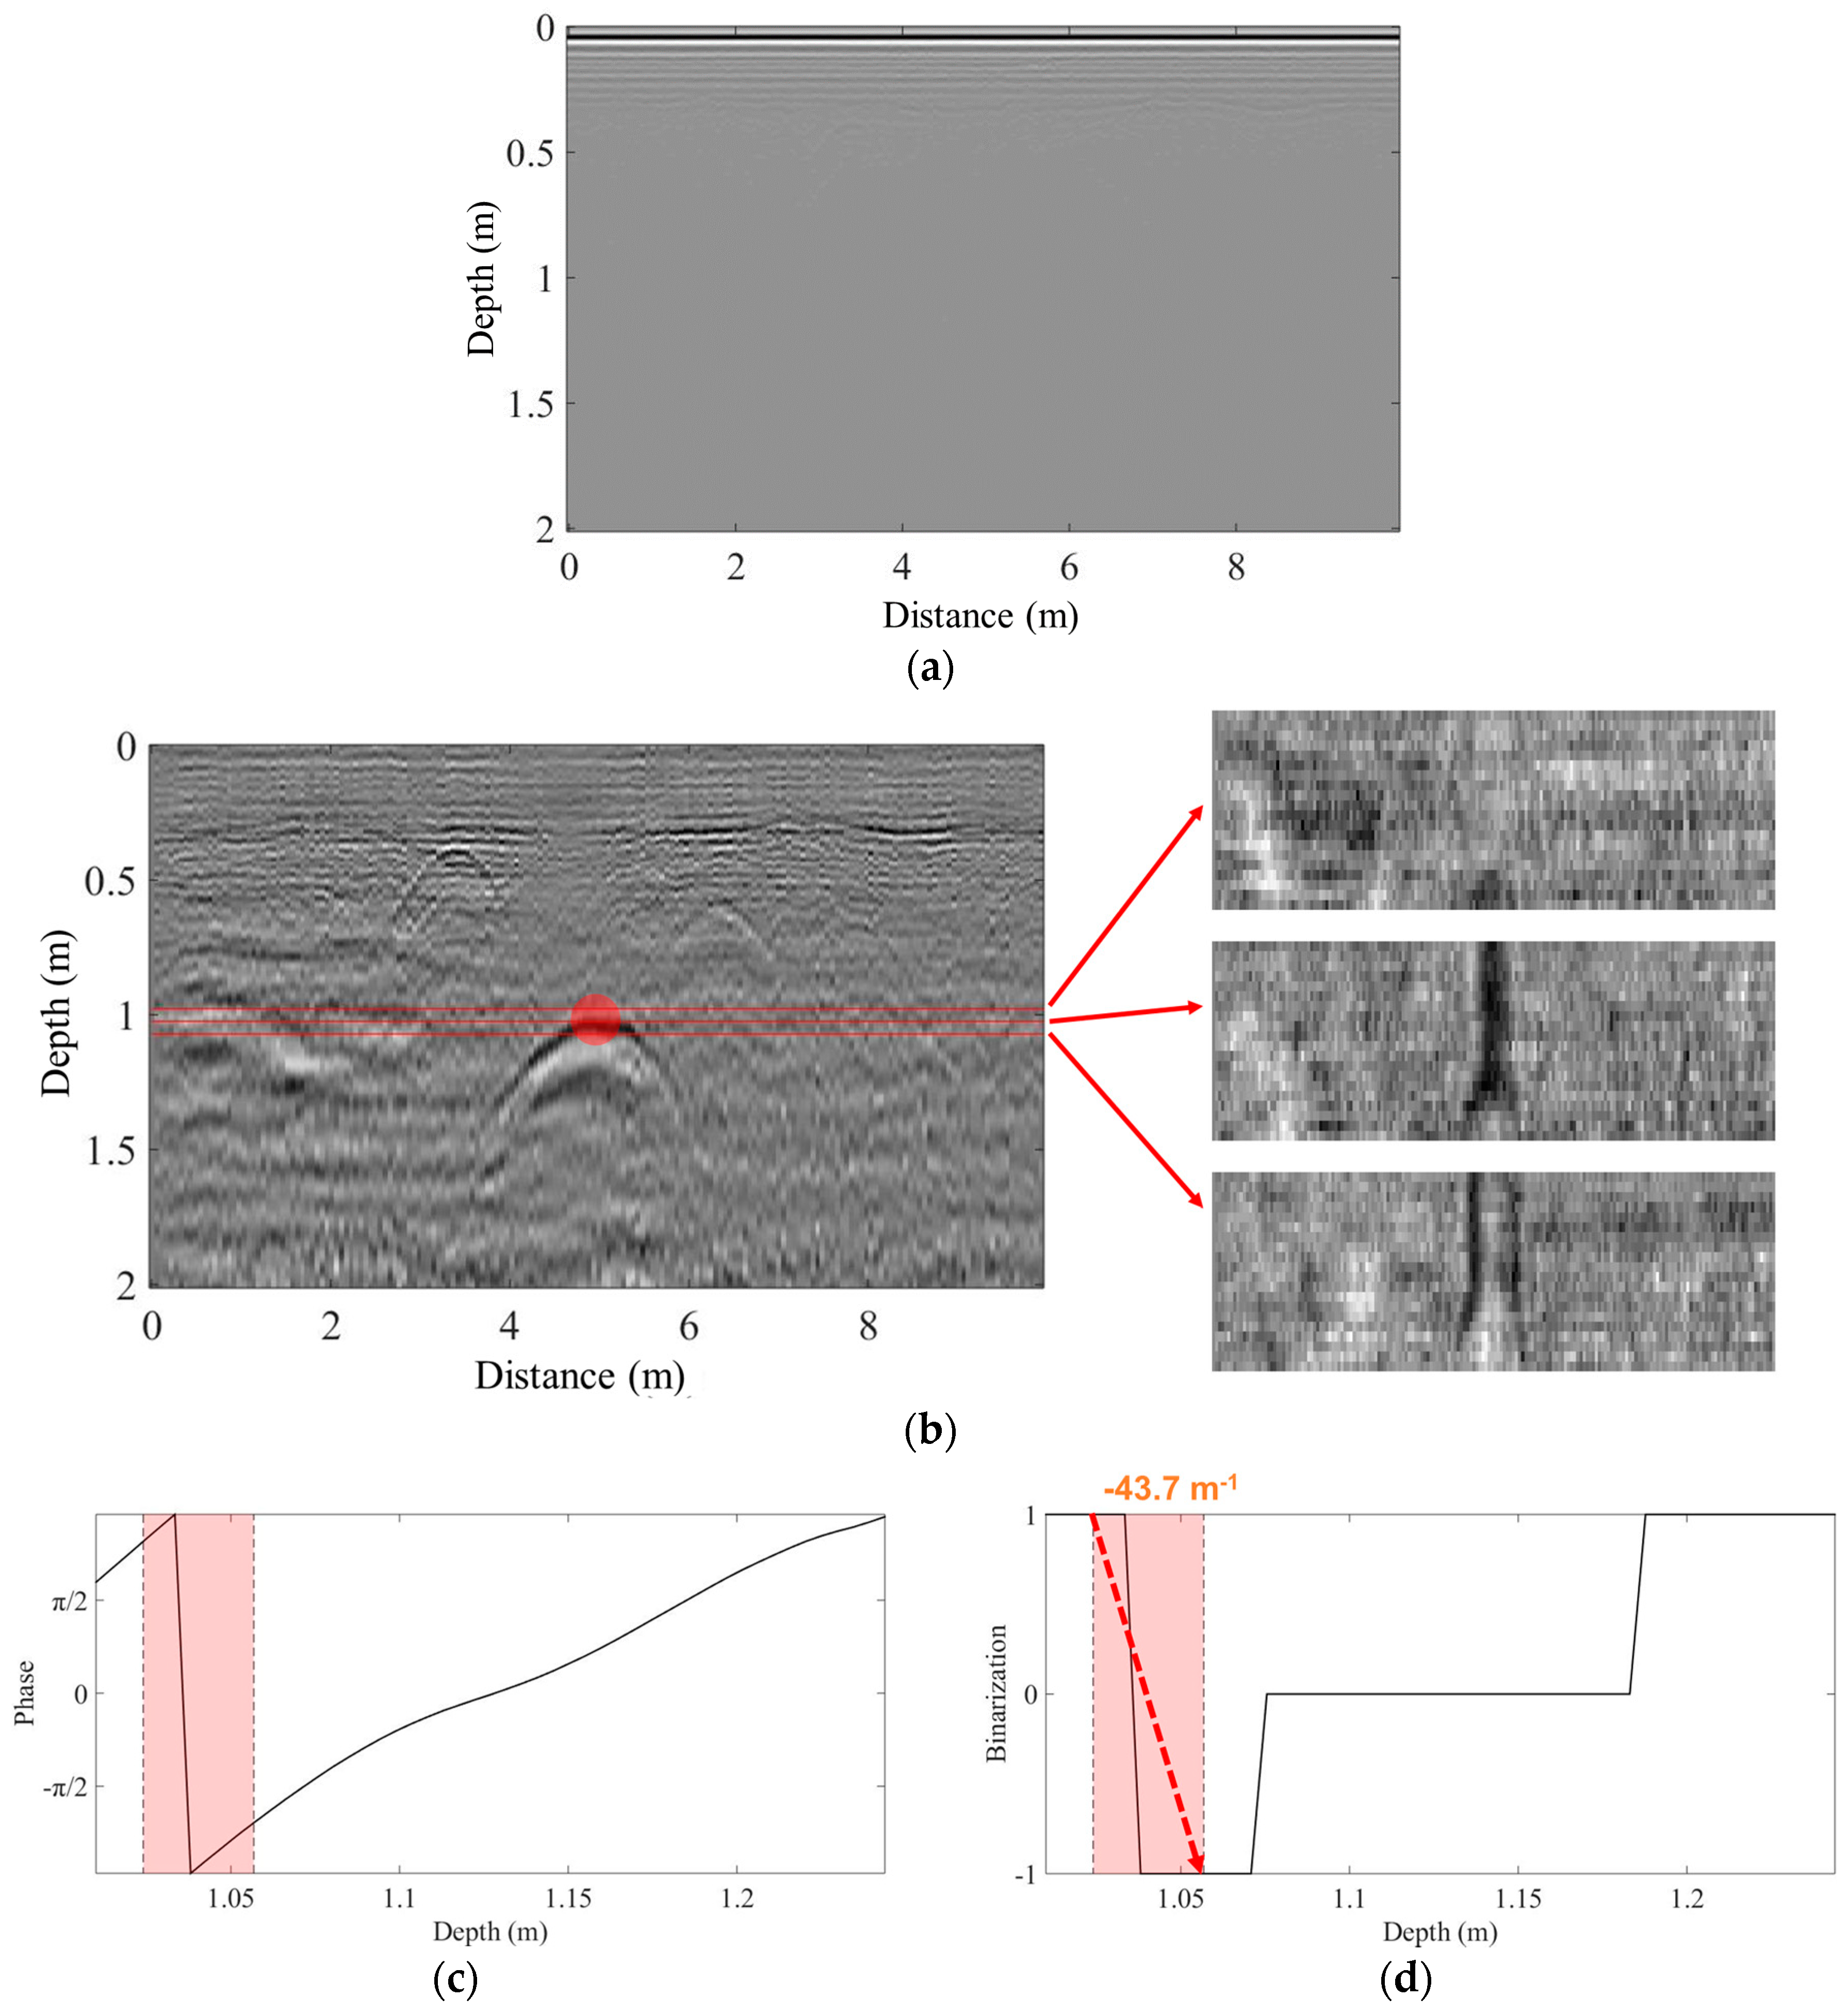
3.3. Classification Results for Models with Underground Objects

Next, the feasibility of the proposed technique for classifying underground objects was examined. First, visualization enhancement via the proposed technique was studied while using models with a cavity (Figure 7a) and a pipe (Figure 7b). Figure 7c,d shows that the background filtering effectively removes the dominant surface reflections, allowing the underground objects to be clearly visualized. In addition, the location of the first reflection wave packet perfectly matches the actual location of the underground object, which is represented by a red circle.
However, it is not possible to classify the type of underground object on the basis of the filtered images, as both objects are represented by parabolas. The instantaneous phase information for each case was therefore examined in the filtered images and compared with the direct wave phase, corresponding to the blue circles in Figure 7c,d. For the cavity (Figure 7e), the phase of the direct wave (blue box) and that at the location of the underground object (red box) match each other. This in-phase reflection implies that the cavity has lower permittivity relative to the surrounding soil. This can be distinguished more easily after the binarization of the raw phase signals (Figure 7g). Binarization transforms the phase value to −1, 0, or 1, simplifying the comparison with the direct wave phase. The phase change ratio is positive for both direct waves and the cavity reflection, indicating an in-phase relationship. However, at the underground pipe (Figure 7f), the reflection is out-of-phase with the direct wave because of its higher permittivity. The phase change ratio of the pipe reflection is negative, as shown in Figure 7h. This numerical simulation demonstrates that cavities and pipes can be clearly distinguished while using instantaneous phase information, as proposed in the previous section.

3.4. Robustness of the Proposed Technique to Complicated Underground Features

The proposed technique was applied to various simulation models with complicated underground features. First, the sensitivity of the proposed technique was studied with different diameters (2 cm and 25 cm) of the underground cavity. As shown in Figure 8, the predominant surface reflections were effectively removed after background filtering and the smallest cavity with a 2 cm diameter was clearly visualized. In addition, the location of the first reflection wave packet matched very well with the actual cavity location (red circles).
Second, the effect of the soil permittivity to the proposed technique was studied. Here, the soil permittivity ε s in Figure 5 was changed from 5 to 2 and 10. For the case ε s = 2 , smaller permittivity difference between the soil and the cavity weakened cavity reflections (Figure 9a). But, the proposed technique still highlights them (Figure 9b). Note that the GPR signals are dispersed to the depth axis due to the slower electromagnetic wave speed in low permittivity media. On the other hand, for the case ε s = 10 , stronger cavity reflections are observed, as predicted in Equation (5). There is no dramatic change in pipe reflections as the pipe permittivity was already set very high ( ε p = ) and the permittivity difference did not largely change after soil permittivity was changed. The dispersed GPR signals are still observed in Figure 9e,g.
Next, multiple underground objects existed in a single model. In Figure 10a, a cavity and a pipe were placed in parallel with 10 cm distance between them. The interactions of each electromagnetic wave reflections are clearly visualized in raw GPR image (Figure 10b), and still exists after removing the background signals (Figure 10c). However, the binarization of the phase signals clearly indicates the in-phase cavity reflection (Figure 10d) and out-of-phase pipe reflection (Figure 10e). This result implies that the proposed technique can identify multiple underground objects in the inspection region.
Finally, the effect of complex underground compositions was also studied. An additional sand layer ( ε d = 3 ) is located below (Figure 11a) and above (Figure 11b) the cavity, respectively. Though this layer creates another dominant reflection signals (Figure 11c,d), the proposed technique effectively removes them and demonstrates the robustness of the proposed technique to the underground disturbances (Figure 11e,f). The phase of the direct wave (blue box) and that at the location of the underground object (red box) match each other in both cases, implying their in-phase reflections. Note that additional phase packets.

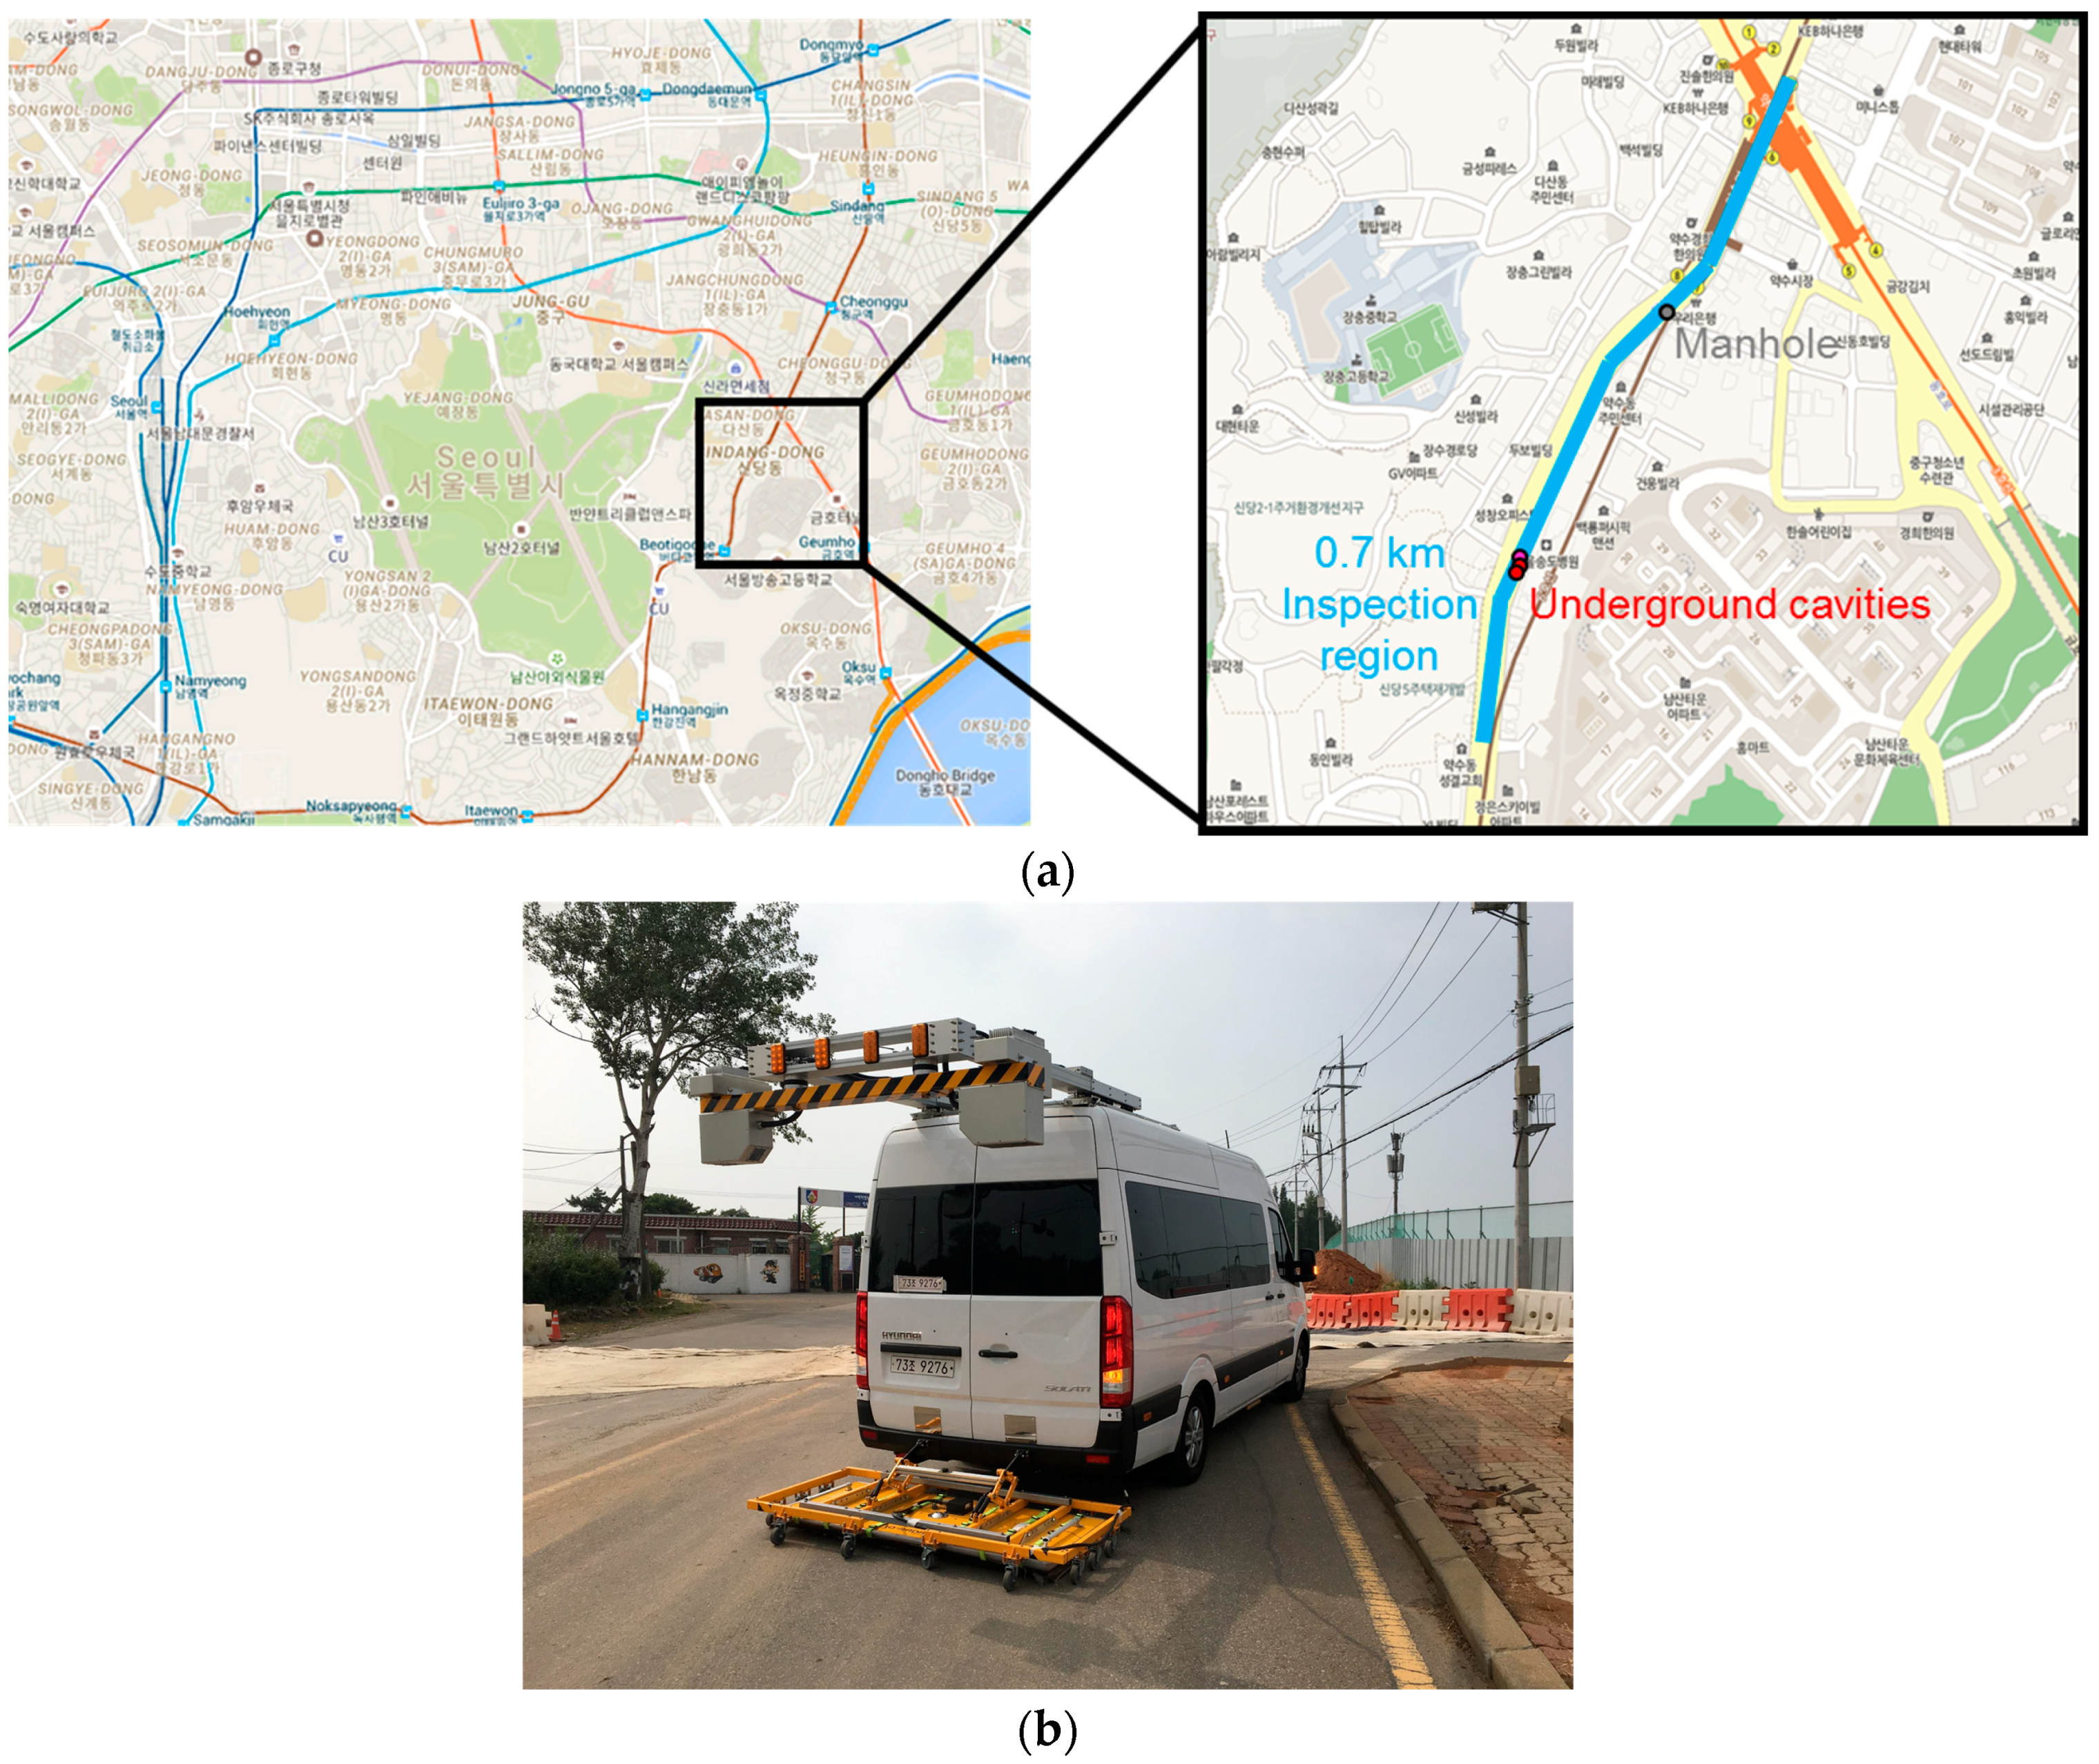
4. Experimental Result: Field Validation Tests Using 3D GPR Data

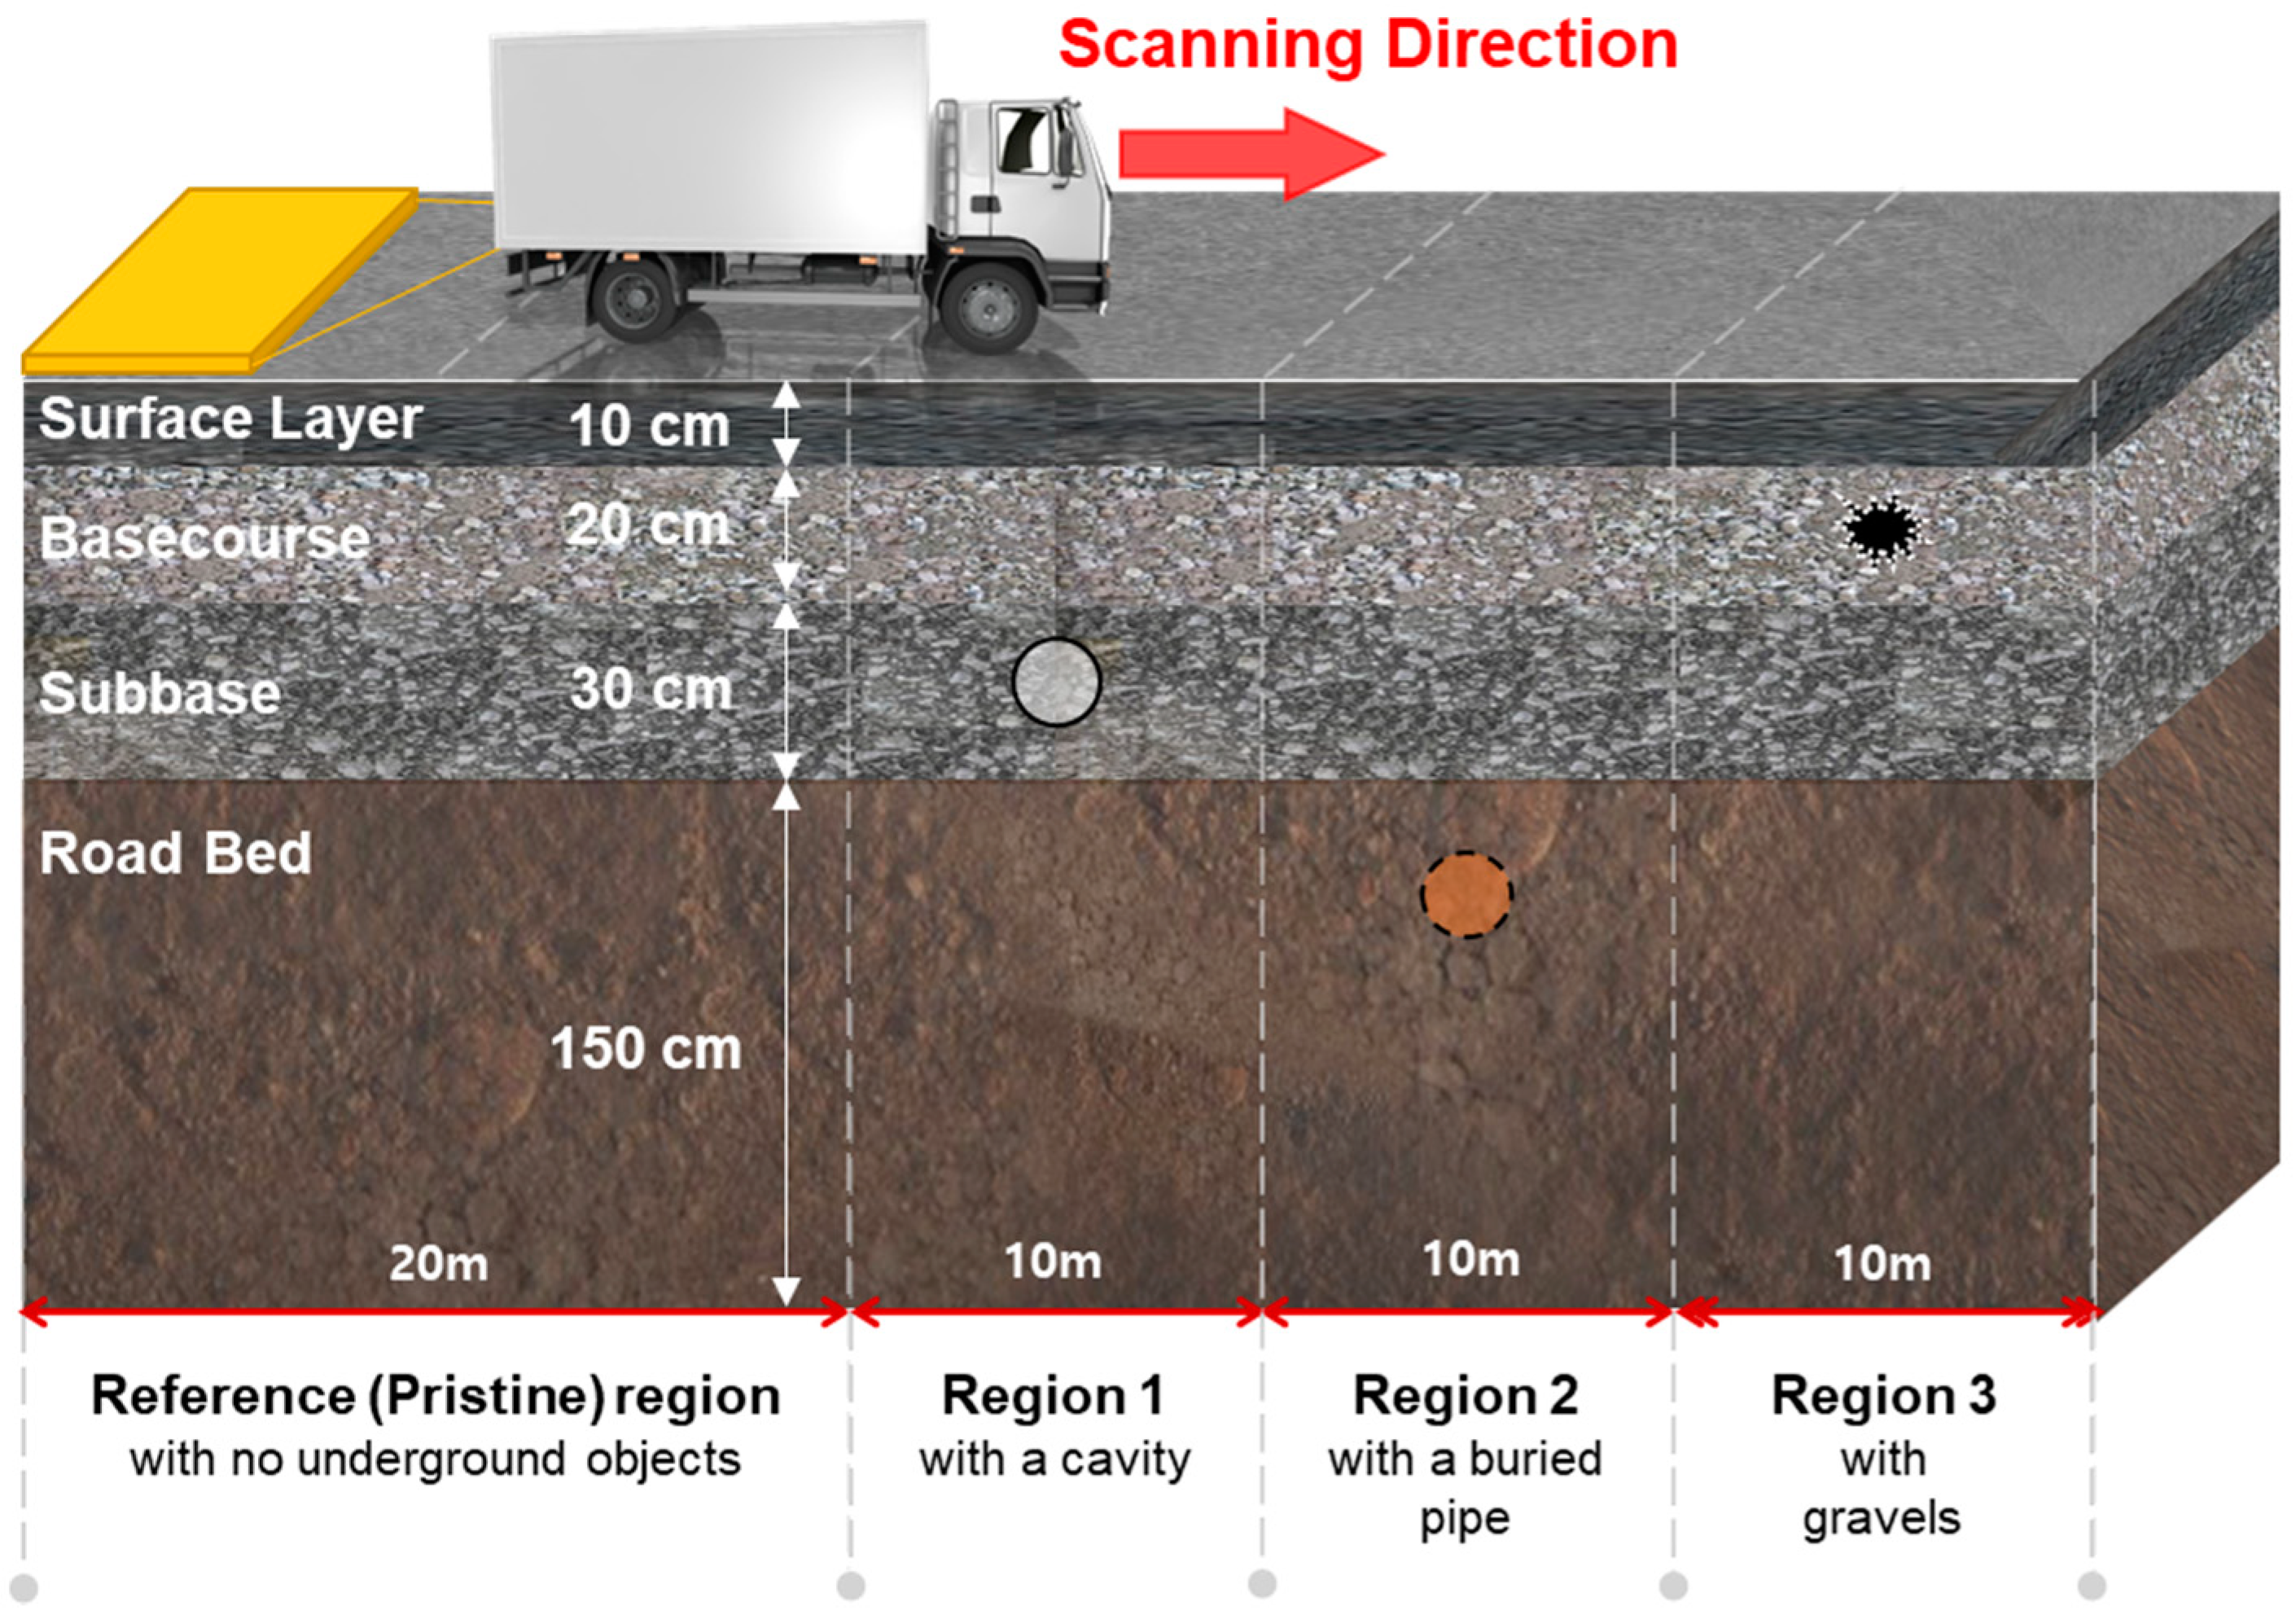
4.1. Experimental Setup

The proposed underground classification technique was experimentally validated by generating visualizations of underground cavities, buried pipes, and underground gravels from 3D GPR data collected from urban roads in Seoul, South Korea. The performance of the proposed method in analyzing a pristine region was also investigated to validate its robustness.
The inspected region was a 0.7 km stretch of an urban road in a residential area near Yaksu subway station, located in Jung-gu, Seoul, as shown in Figure 12a A DXG1820 GPR antenna (3D-RADAR), which includes 20 T and R channels corresponding to a 1.5 m scanning width, was used for this experiment. The measured GPR signals were collected with a GEOSCOPE MK IV data acquisition system that was provided by 3D-RADAR, which has a time resolution of 0.35 ns and a maximum sampling rate of 13,000 Hz. The input signal has a frequency range of 200–3000 MHz, with a step-frequency input waveform. Figure 12b shows the equipment that was used for field data collection. Automatic data collection was carried out by integrating the GPR device into a vehicle. The average scanning speed was approximately 5 km/h.
The region inspected was composed of four layers: a surface layer, a basecourse, a sub-base, and a road bed. The uppermost surface layer is a 10-cm-thick asphalt pavement. This is underlain by a 20-cm-thick basecourse (usually consisting of construction aggregate). The third layer is a 30-cm-thick sub-base of unbound granular or cement-bound materials. The road bed layer is typically much thicker than the other layers, depending on the ground conditions. Four representative regions of the 0.7 km inspection area were selected for the field validation of the proposed technique, as shown in Figure 13. The pristine region does not contain any underground objects. In Region 1, there is an underground cavity (gray circle with a solid outline) in the subbase layer. A pipe (brown circle with a dashed outline) is buried in Region 2 and it is perpendicular to the scanning direction. This region is inspected as an example of common artificial underground objects in urban road. There is a punctual gravel (black circle with a dotted outline) in the basecourse layer of Region 3. Gravels widely exist in urban roads but usually misclassified as cavities with their similar size and shape. The classification robustness of the proposed technique is examined with this region.

4.2. Underground Object Classification in the Pristine Region

The proposed technique was first applied to the pristine region. This region comprises the four underground layers, but there are no underground objects. The raw GPR image that is shown in Figure 14a is a representative B-scan side view at a width of 1.275 m. There are no visible reflections from underground objects, but there are clear dominant surface pavement reflections near the ground surface. Background filtering was applied to the image to locate any reflections from underground objects while using the leftmost scanning location of the region as the reference point and the corresponding response as the reference signal. This results in Figure 14b, in which no distinguishable features are observed. Moreover, no objects are identified in the three C-scan images on the right side of Figure 14b, which correspond to the red lines in the B-scan image. These results indicate that the proposed technique is suitable for analyzing pristine regions without giving false positives.
The instantaneous phase information of the direct waves corresponding to the blue circle in Figure 14b was analyzed and is represented by a blue box in Figure 14c. The phase change ratio is positive for the direct waves (Figure 14d).

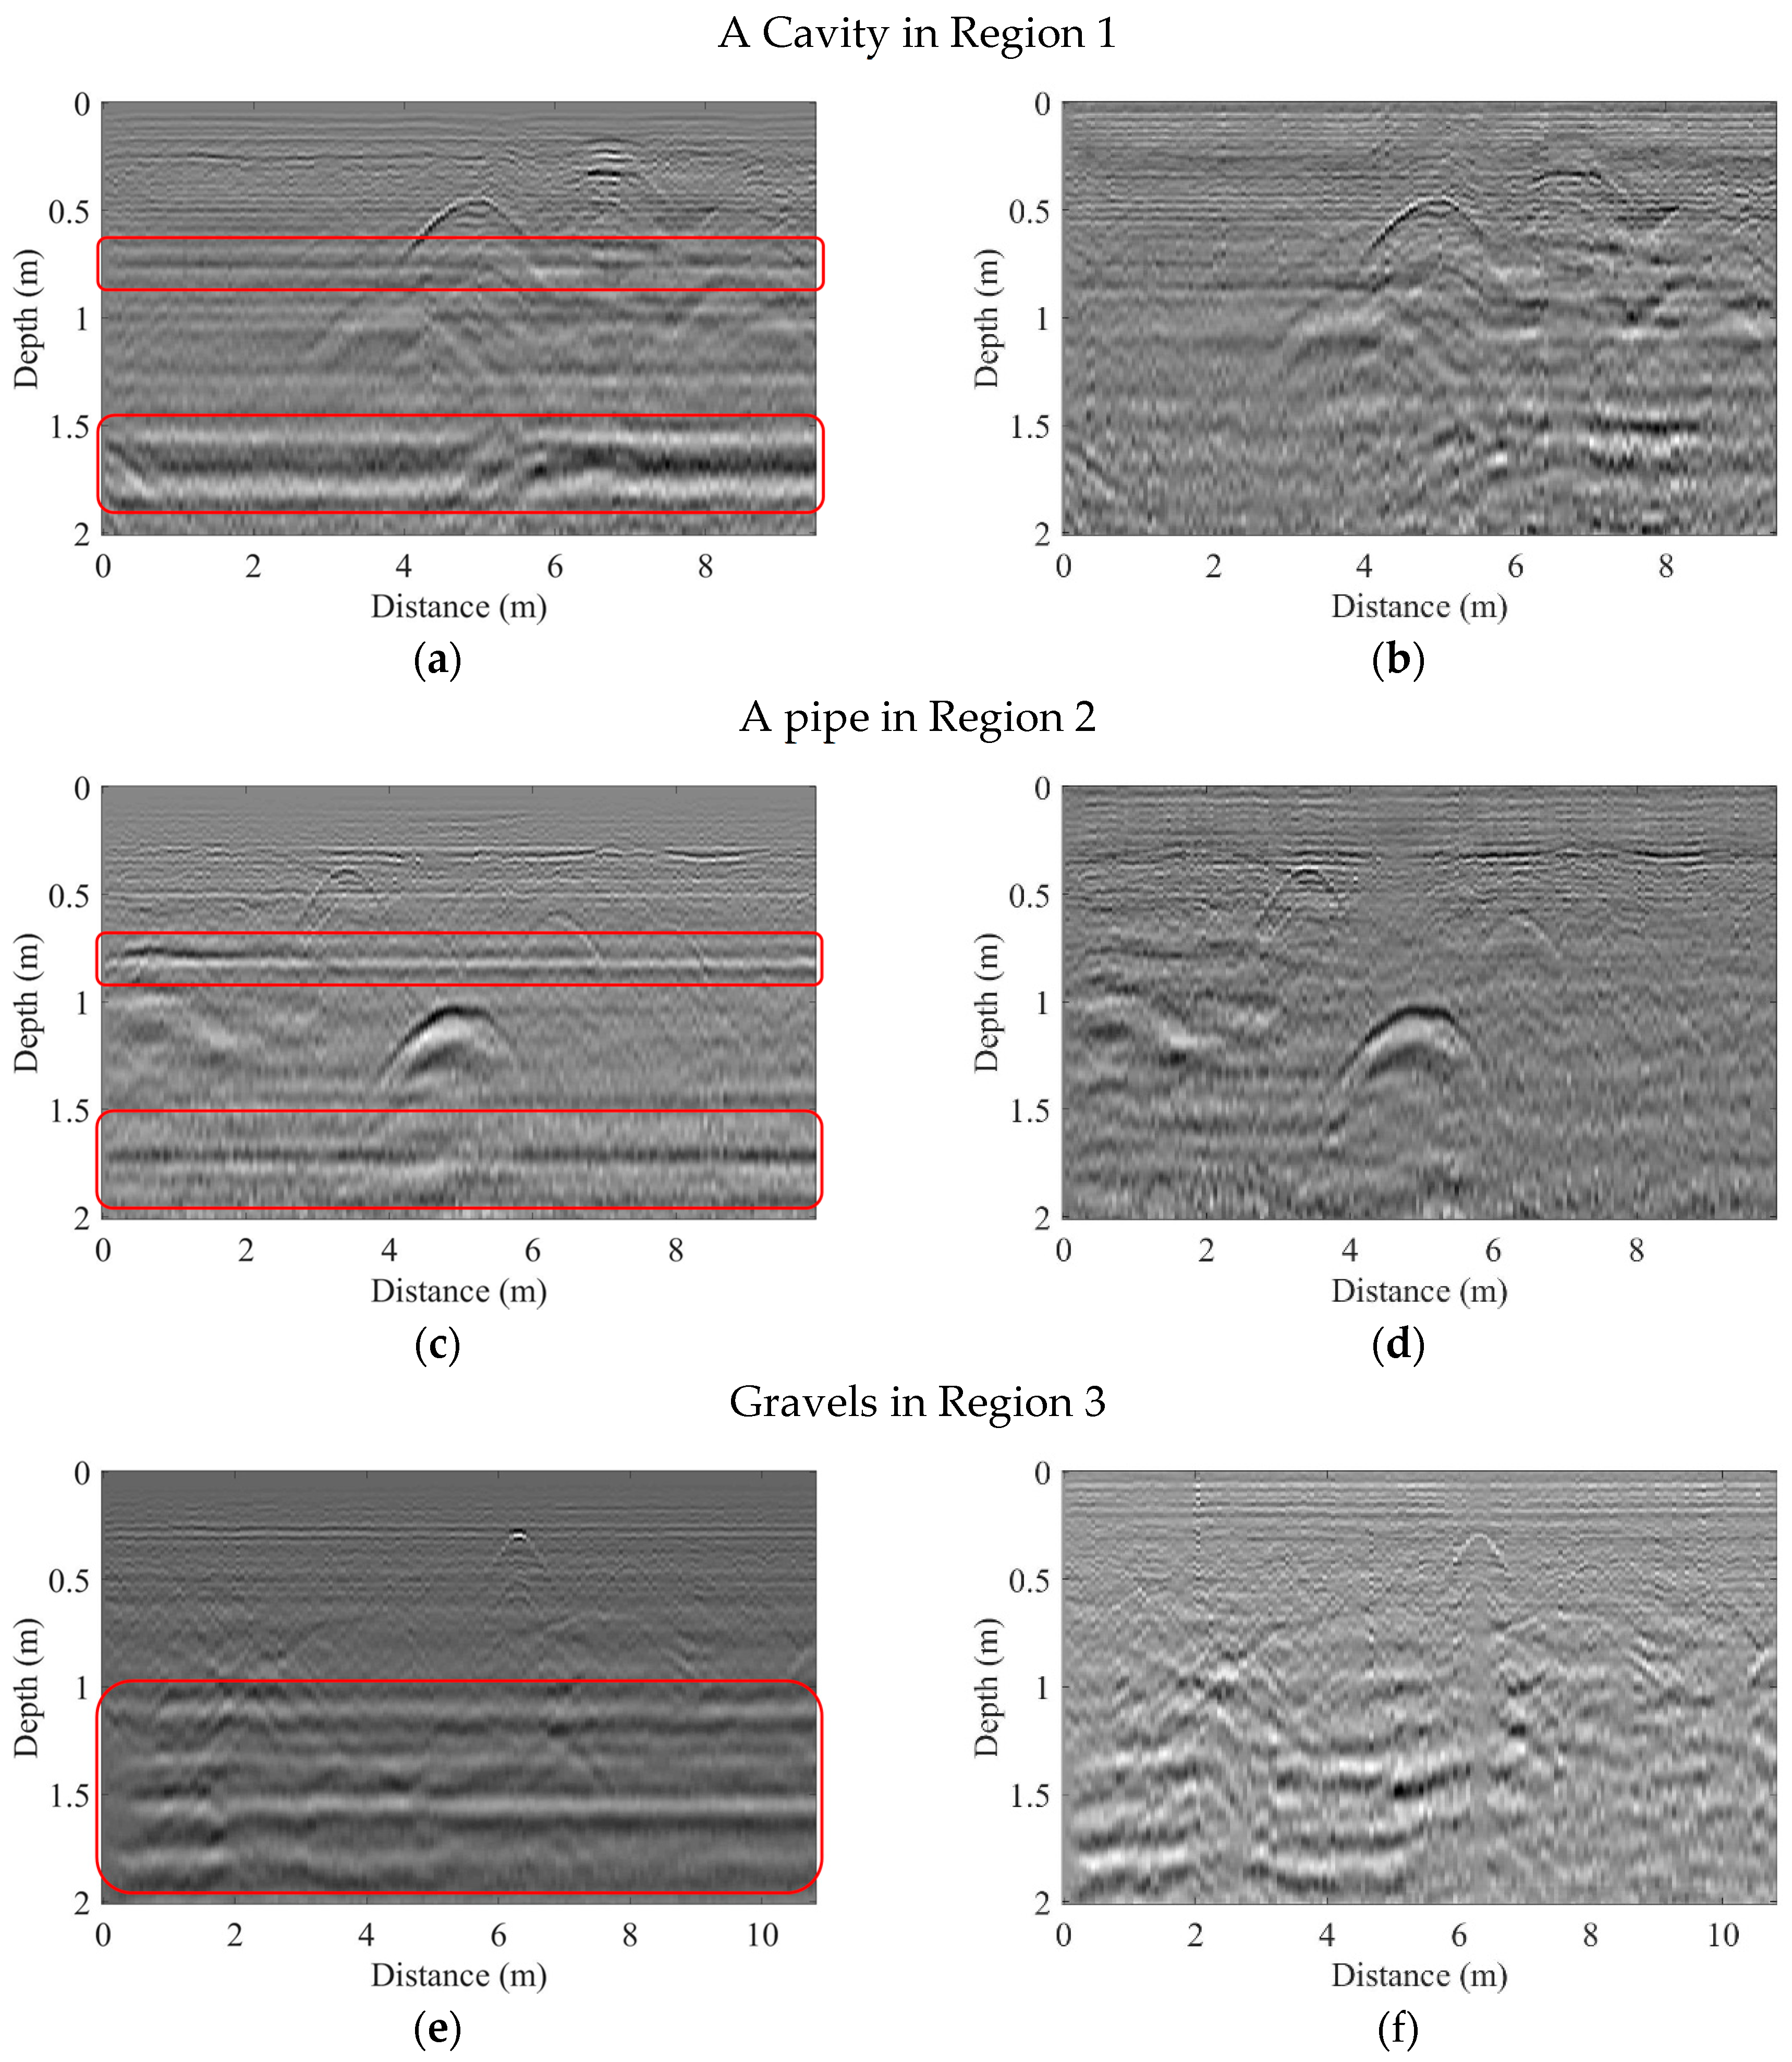
4.3. Underground Object Classification in the Regions with Underground Objects

The proposed technique was applied to the three regions with different underground objects. For all three regions, the proposed technique effectively visualized and classified the underground objects.
In Region 1, a cavity is located in the sub-base layers. However, there is no clear reflected signal from a cavity in the side view of the raw GPR image at 0.375 m width (Figure 15a), owing to the dominance of surface pavement reflections. After background filtering, the cavity reflections become much more apparent (Figure 15b). These reflections are also consistent with the actual cavity location, which is indicated by a red circle. A circular object can be seen in three C-scan images around the location of the observed object (red lines in Figure 15b). The instantaneous phase is shown in Figure 15c, with the phase corresponding to the cavity reflection being indicated by a red box. It has a positive phase change ratio (Figure 15d).
The next example is a pipe; these are very common under urban roads. The pipe in Region 2 is not visible in the raw GPR image (Figure 16a), but its location is clear after background filtering (Figure 16b). The C-scan images show that the pipe runs perpendicular to the scanning direction. The C-scan images show a pipe shape that is distinct from the cavity case (Figure 15), thus making it possible to distinguish a pipe from a cavity in 3D GPR images. In addition, the reflection from the pipe (Figure 16c,d) is out of phase with the direct wave in Figure 14 and it has a negative phase change ratio.
The last example is a gravel. Gravels are widely observed in urban underground GPR images, but it is challenging to distinguish them from a cavity on the basis of 3D GPR images only. While other underground structures, including pipes, can be easily differentiated from their shape in the C-scan images, a gravel is often misclassified as a cavity with their similar size and shape. Although an object is visualized in both the B-scan and C-scan (Figure 17b) images after background filtering, there are no grounds for classifying it as a cavity or a different type of underground object. However, the reflection from the identified object (Figure 17c,d) is out-of-phase with the direct wave in Figure 14, while the cavity reflections show in-phase reflections in Figure 15.

5. Discussion

5.1. Underground Object Classification Compared with the Conventional Subtraction Method

The underground object classification performance of the proposed technique is compared with the conventional subtraction method [12,13]. The subtraction method, which is being widely used in GPR data and image processing, eliminates the dominant surface reflections by subtracting a reference signal from the raw GPR data. However, this method is highly susceptible to noise and small signal disturbances in the time domain, e.g., variations in pavement thickness or unexpected arbitrary boundary conditions in the pavement.
Figure 18 clearly represents the limitation of the subtraction method. For each region, the dominant surface reflections are not fully eliminated, even after applying the subtraction method (Figure 18a,c,e). As the subtraction method assumes identical underground background reflections from every spatial point, even a small measurement disturbance from field condition affects its elimination performance. Another limitation is that the underground layer boundaries are also highlighted after applying gain enhancement. While the proposed technique extracts the object reflections information while using the basis pursuit approach, the subtraction method cannot distinguish the object reflection and the underground layer reflection and highlights both of them if they are placed nearby. The red boxes in Figure 18a,c,e indicate the uneliminated soil layer boundaries even after applying the subtraction method, while they are successfully eliminated using the proposed technique in Figure 18b,d,f. The basis pursuit approach can compensate the disturbance between the reference signal and the actual measurement, leading the effective elimination of the background reflections. As already presented in Section 3.4, the proposed technique has an effective underground layer reflection elimination performance and highlights only the underground object.

5.2. Underground Object Classification Using a Phase Change Ratio

Another limitation in the conventional GPR analysis, including the subtraction method, is that they do not tell about the nature of the identified underground objects. The proposed phase analysis technique is thus applied to classify the object. The phase information and the phase change ratio are analyzed for Regions 1 to 3 in Figure 15, Figure 16 and Figure 17, respectively, and the results are summarized in Table 1.
For the cavity reflection in Region 1, it has a positive phase change ratio (Figure 15d) and it matches the direct wave phase in the reference region (Figure 14d). It is thus an in-phase reflection, implying that the object has low permittivity in comparison with the surrounding soil and can therefore be classified as a cavity.
On the other hand, the reflection from the pipe (Figure 16c,d) is out of phase with the direct wave in Figure 14 and has a negative phase change ratio. Though the actual pipe material information is not provided to the authors, the pipe material is estimated to have higher permittivity than soil, possibly metal, from the observed phase inversion. Please note that the reflection from the pipe can be in phase if it has lower permittivity than the soil (e.g., polyethylene or Teflon) and the only use of phase information can lead to false alarms. However, the proposed technique still identifies the pipe while using both its background filtered C-scan images and the phase information, making it possible to be complementary to each other in underground object identification process. The negative phase change ration in Region 3 (Figure 17d) also indicates that the object is not a cavity and must be an underground object with a high permittivity, possibly a gravel.
Therefore, as the phase of the underground object reflection is related with the object permittivity, it is possible to have an additional information for underground object classification via the proposed phase analysis.

5.3. Limitations of the Proposed Technique

However, certain technical limitations of the proposed technique should be addressed before it can be applied to more realistic conditions. Careful selection of the reference signal is required, as the performance of the background filtering technique strongly depends on reference signal selection and dictionary construction. For example, if the reference signal includes any undesired underground object, the background filter will not work properly. Follow-up studies are underway to automate the reference signal selection process by using the machine-learning techniques.
Development of a fully automated identification system through integration with a GPR scanning system and further validation with multiple in situ datasets are also required.

6. Conclusions

This study proposes a robust technique for classifying underground objects while using (1) background filtering of 3D GPR data to remove environmental noise and field deviations and (2) phase analysis to distinguish underground cavities and possible sinkholes from other underground objects. The proposed technique enhances the visibility of underground objects by highlighting the electromagnetic waves reflected only from underground objects. The permittivity of the identified objects is then compared with that of the surrounding soils using the corresponding instantaneous phase information. The object is classified as a cavity if its permittivity is lower than that of its surroundings. The performance of the proposed technique was validated while using numerical simulations and field data obtained from urban roads in Seoul, South Korea. The use of such field-test data is particularly useful because of its rarity in previously published literature.
The authors are now extending the proposed technique to utilize a machine-learning-based automatic cavity classification system. The proposed technique provides additional information with which to train such a system, such as enhanced images and phase change ratios, promoting faster and more robust classification results than is possible through the time-consuming efforts of human experts.

Author Contributions

B.P., J.K., J.L., M.-S.K. and Y.-K.A. conceived and designed this study. M.-S.K. acquired simulation and experimental data. J.K. and J.L. performed simulation and experimental data processing and analysis. B.P. wrote the entire manuscript and designed the processing code. Y.-K.A. also helped to design the processing code and provided comments and corrections to the manuscript.

Funding

This research was supported by the Korea Railroad Research Institute (KRRI), Republic of Korea (PK1702C-1) and the National Research Foundation of Korea (NRF), Republic of Korea (NRF-2015R1C1A1A01052625).

Conflicts of Interest

The authors declare no conflicts of interest.

References

  1. Independent. Available online: http://www.independent.co.uk/news/world/asia/huge-sinkhole-opens-at-busy-chinese-intersection-a7000321.html (accessed on 21 July 2018).
  2. BBC. Available online: http://www.bbc.com/news/world-asia-37906065# (accessed on 21 July 2018).
  3. CBS Philly. Available online: http://philadelphia.cbslocal.com/2017/01/25/massive-sinkhole-opens-up-in-cheltenham-twp/ (accessed on 21 July 2018).
  4. Gutierrez, F.; Parise, M.; Waele, J.D.; Jourde, D. A review on natural and human-induced geohazards and impacts in karst. Earth-Sci. Rev. 2014, 138, 61–88. [Google Scholar] [CrossRef]
  5. Perlow, M. An overview of recent sinkhole problems in the Lehigh valley. In Proceedings of the Ninth Multidisciplinary Conference on Sinkholes and the Engineering and Environmental Impacts of Karst, Huntsville, AL, USA, 6–10 September 2003. [Google Scholar]
  6. Daniels, D.J. Ground Penetrating Radar, 2nd ed.; The Intuition of Electrical Engineering: London, UK, 2004; ISBN 9780863413605. [Google Scholar]
  7. Nuzzo, L.; Leucci, G.; Negri, S.; Carrozzo, T.; Quarta, T. Application of 3D visualization techniques in the analysis of GPR data for archaeology. Ann. Geophys. 2002, 45, 321–337. [Google Scholar] [CrossRef]
  8. Conyers, L.B. Ground-Penetrating Radar for Archaeology, 3rd ed.; AltaMira Press: Plymouth, UK, 2013; ISBN 9780759123502. [Google Scholar]
  9. Barone, P.M. Understanding Buried Anomalies: A practical Guide to GPR; Lambert Academic Publishing: Saarbrücken, Germany, 2016; ISBN 9783659935794. [Google Scholar]
  10. Persico, R. Introduction to Ground Penetrating Radar: Inverse Scattering and Data Processing; Wiley-IEEE Press: Hoboken, NJ, USA, 2014; ISBN 9781118305003. [Google Scholar]
  11. Soldovieri, F.; Lopera, O.; Lambot, S. Combination of advanced inversion techniques for an accurate target localization via GPR for demining application. IEEE Trans. Geosci. Remote Sens. 2010, 49, 451–461. [Google Scholar] [CrossRef]
  12. Singh, N.K. Ground penetrating radar (GPR) ‘Mineral base profiling and orebody optimization’. In Proceedings of the 6th International Heavy Minerals Conference, Hluhluwe, South Africa, 9–14 September 2007. [Google Scholar]
  13. Cardarelli, E.; Marrone, C.; Orlando, L. Evaluation of tunnel stability using integrated geophysical methods. J. Appl. Geophys. 2003, 52, 93–102. [Google Scholar] [CrossRef]
  14. Hammon, W.S., III; Mcmechan, G.A.; Zeng, X. Forensic GPR: Finite-difference simulations of responses from buried human remains. J. Appl. Geophys. 2000, 45, 171–186. [Google Scholar] [CrossRef]
  15. Batayneh, A.T.; Abdelruhman, A.A.; Moumani, K.A. Use of ground-penetrating radar for assessment of potential sinkhole conditions: An example from Ghor al Haditha area, Jordan. Environ. Geol. 2002, 41, 977–983. [Google Scholar] [CrossRef]
  16. Pueyo-Anchuela, O.; Pocovi Juan, A.; Soriano, M.A.; Casas-Sainz, A.M. Characterization of karst hazards from the perspective of the doline triangle using GPR-Examples from central Ebro Basin (Spain). Eng. Geol. 2009, 108, 225–236. [Google Scholar] [CrossRef]
  17. Rodriguez, V.; Gutierrez, F.; Green, A.G.; Carbonel, D.; Horstmeyer, H.; Schmelzbach, C. Characterizing sagging and collapse sinkholes in a mantled karst by means of ground penetrating radar (GPR). Environ. Eng. Geosci. 2014, 20, 109–132. [Google Scholar] [CrossRef]
  18. Benedetto, A.; Tosti, F.; Ciampoli, L.; Amico, F.D. An overview of ground-penetrating radar signal processing techniques for road inspections. Sig. Proc. 2017, 132, 201–209. [Google Scholar] [CrossRef] [Green Version]
  19. Annan, A.P. Practical Processing of GPR Data; Sensors and Software Inc.: Mississauga, ON, Canada, 1999. [Google Scholar]
  20. Horstmeyer, H.; Gurtner, M.; Buker, F.; Green, A.G. Processing 2-D and 3-D georadar data: Some special requirements. In Proceedings of the 2nd Meeting Environmental and Engineering Geophysics Society (EEGS-ES), Nantes, France, 2–5 September 1996. [Google Scholar]
  21. Takahashi, K.; Igel, J.; Preetz, H.; Kuroda, S. Basics and application of ground-penetrating radar as a tool for monitoring irrigation process. In Problmes, Perspectives and Challenges of Agricultural Water Management; Kumar, M., Ed.; InTech Europe: Rijeka, Croatia, 2012; ISBN 9789535101178. [Google Scholar]
  22. Griffiths, D. Introduction to Electrodynamics, 4th ed.; Cambridge University Press: New York, NY, USA, 2017; ISBN 9781108420419. [Google Scholar]
  23. Jol, H.M. Ground Penetrating Radar Theory and Applications; Elsevier Science: Oxford, UK, 2009; ISBN 9780444533487. [Google Scholar]
  24. Sadiku, M. Elements of Electromagnetics, 6th ed.; Oxford University Press: Oxford, UK, 2014; ISBN 9780199321384. [Google Scholar]
  25. Anton, H.; Busby, R.C. Contemporary Linear Algebra; Wiley: New York, NY, USA, 2003; ISBN 9780471163626. [Google Scholar]
  26. Park, B.; Sohn, H. Accelerated damage visualization using binary search with fixed pitch-catch distance laser ultrasonic scanning. Smart Mater. Struct. 2017, 26, 1. [Google Scholar] [CrossRef]
  27. Gribonval, R.; Nielsen, M. Sparse representations in unions of bases. IEEE Trans. Inform. Theory 2003, 49, 3320–3325. [Google Scholar] [CrossRef] [Green Version]
  28. Chen, S.; Donoho, D. Basis pursuit. In Proceedings of the 28th Asilomar Conference on Signals, Systems and Computers, Pacific Grove, CA, USA, 31 October–2 November 1994. [Google Scholar]
  29. L1-MAGIC. Available online: https://statweb.stanford.edu/~candes/l1magic/ (accessed on 6 September 2018).
  30. Warren, C.; Giannopoulos, A.; Giannakis, I. gprMax: Open source software to simulate electromagnetic wave propagation for ground penetrating radar. Comp. Phys. Commun. 2016, 209, 163–170. [Google Scholar] [CrossRef]
Figure 1. Working principles of ground-penetrating radar (GPR).
Remotesensing 10 01417 g001
Figure 2. Schematic flow diagram of the proposed underground object classification technique.
Remotesensing 10 01417 g002
Figure 3. Background filtering to enhance underground object visualization. Background signals are eliminated using a basis pursuit approach so that only underground object reflection signals remain.
Remotesensing 10 01417 g003
Figure 4. Phases of reflected waves from underground objects. The direct waves and the reflected waves are (a) in phase for cavities and (b) out of phase for high-permittivity objects, e.g., metallic pipes.
Remotesensing 10 01417 g004
Figure 5. Method of two-dimensional (2D) simulation for validation of the proposed technique.
Remotesensing 10 01417 g005
Figure 6. Underground classification for the pristine model: (a) raw GPR data and (b) processed GPR data.
Remotesensing 10 01417 g006
Figure 7. Underground object classification results where an underground (a) cavity and (b) pipe are present in the model. Red circles represent the locations of the underground objects. The reflections from the underground objects are better visualized in (c,d), where the background signals have been removed. The instantaneous phase values (e,f) show that the direct wave (blue box, corresponding to the blue circles in (a,b)) and the underground object reflection (red box, corresponding to the red circles in (a,b)) are in-phase for the cavity and out-of-phase for the pipe. This becomes easier to distinguish after binarization, as shown in (g,h). Both phase change ratios are positive in the case of a cavity reflection (g), whereas the change ratio of the pipe reflection is negative (h).
Remotesensing 10 01417 g007
Figure 8. Underground visualization results with different cavity sizes: (a,b) raw GPR images and (c,d) processed GPR images with 2 and 25 cm diameter cavities, respectively. The red circles indicate the size and location of each modeled cavity.
Remotesensing 10 01417 g008
Figure 9. Underground visualization results with different soil permittivity: (a,b) raw GPR images and (c,d) processed GPR images of a cavity with soil permittivity ε s = 2 and ε s = 10 , respectively. (e,f) raw GPR images and (g,h) processed GPR images of a pipe with soil permittivity ε s = 2 and ε s = 10 , respectively. The red circles indicate the size and location of each underground object.
Remotesensing 10 01417 g009
Figure 10. Underground visualization results with multiple underground objects: (a) an underground model with a cavity and a pipe, (b) raw GPR image and (c) background filtered GPR image. (d) and (e) presents the instantaneous phase values at the cavity and the pipe location, respectively.
Remotesensing 10 01417 g010
Figure 11. Underground visualization results for complex underground compositions: A sand layer is added (a) below and (b) above a cavity. (c,d) raw GPR images and (e,f) background filtered GPR images for each model. (g,h) presents the binarization of the phase signals at the cavity locations for each model, both showing in-phase reflections.
Remotesensing 10 01417 g011aRemotesensing 10 01417 g011b
Figure 12. Field testing on urban roads in Seoul, South Korea: (a) location of the region inspected and (b) field data collection system.
Remotesensing 10 01417 g012
Figure 13. Composition of the subsurface and the four analyzed regions.
Remotesensing 10 01417 g013
Figure 14. Results of subsurface analysis in the pristine region with (a) raw GPR data and (b) data processed using the proposed technique at a width of 1.275 m. The C-scan images on the right correspond to the red lines in (b). No underground objects are observed. (c) Raw phase and (d) binarized phase information for the direct wave (blue circle in (b)) are also shown.
Remotesensing 10 01417 g014aRemotesensing 10 01417 g014b
Figure 15. Results of underground classification for a cavity in Region 1 with (a) raw GPR data and (b) data processed using the proposed technique at a width of 0.375 m. The cavity is clearly visualized in the C-scan images on the right, which correspond to the red lines in (b). (c) Raw phase and (d) binarized phase information for the cavity reflection (red circle in (b)) show a positive phase change ratio.
Remotesensing 10 01417 g015
Figure 16. Results of underground classification for a pipe in Region 2 with (a) raw GPR data and (b) data processed using the proposed technique at a width of 1.2 m. The pipe is clearly visible in the C-scan images on the right, which correspond to the red lines in (b). (c) Raw phase and (d) binarized phase information for the cavity reflection (red circle in (b)) show a negative phase change ratio.
Remotesensing 10 01417 g016
Figure 17. Results of underground classification of Region 3 gravels with (a) raw GPR data and (b) data processed using the proposed technique at a width of 0.2625 m. The gravels are clearly visible in the C-scan images on the right, which correspond to the red lines in (b). (c) Raw phase and (d) binarized phase information for the gravel reflection (red circle in (b)) show a negative phase change ratio.
Remotesensing 10 01417 g017
Figure 18. Underground classification results for Regions 1, 2, and 3 with data processed by (a,c,e) the subtraction method and (b,d,f) the proposed technique, respectively. The red boxes in (a,c,e) indicates the uneliminated soil layer boundaries even after applying the subtraction method, while they are successfully eliminated using the proposed technique in (b,d,f).
Remotesensing 10 01417 g018
Table 1. Comparisons of the phase change ratio in each region with the reference region.
RegionUnderground ObjectPhase Change RatioComparison with the Reference
Reference-+25.4 m−1-
1Cavity+50.9 m−1In-phase
2Pipe−43.7 m−1Out-of-phase
3Gravels−25.4 m−1Out-of-phase

