1. Introduction
Rock toppling is a type of slope movement affecting natural and artificial slopes characterized by the detachment of blocks or rock fragments, ranging in size from few dm
3 to several hundred m
3 [
1,
2]. The detachment of blocks from a rocky slope is mainly influenced by: (i) the structural conditions of rock mass, that are related with the joint set features (such as orientation, persistency, or roughness, according to the definitions provided by ISRM, 1978 [
3]); (ii) the mechanical properties of both the rock mass and the joints; and (iii) external actions like pressured water within the discontinuities, the seismic shaking due to earthquakes, roots growth, and so on. Although the volume of the involved material can be limited, these events are characterized by a high temporal frequency of occurrence and, therefore, they can be highly hazardous for mankind and human activities [
4].
Furthermore, the high speed and the long run out distances that blocks can attain typically result in extremely hazardous events even with small mobilized volumes. However, the morphological evolution of a rock cliff may represent a serious threat not only for the areas located downslope, but also for hilltop towns that, especially in Central Italy, can be characterized by a high historical-artistic value. In this sense, well-known examples can be Civita di Bagnoregio and Calcata in Northern Latium [
5,
6] or the towns of Orvieto and Todi in Umbria [
7,
8]. In such cases, as in many others, rock toppling may originate from remote cliff slopes that, therefore, could be difficult to reach. Thus, using conventional investigation techniques that require the direct contact with the outcrop can be challenging. For this reason, techniques that can provide detailed point-based information through widespread remote sensing solutions, such as terrestrial laser scanning (TLS) and digital photogrammetry, are getting an increasing importance and interest in the scientific community [
9]. In particular, such methods have been successfully employed in the framework of slope stability analyses of high steep slopes [
10,
11] or cave sections [
12], also through the deployment of new technologies like unmanned aerial vehicles (UAV) [
13,
14].
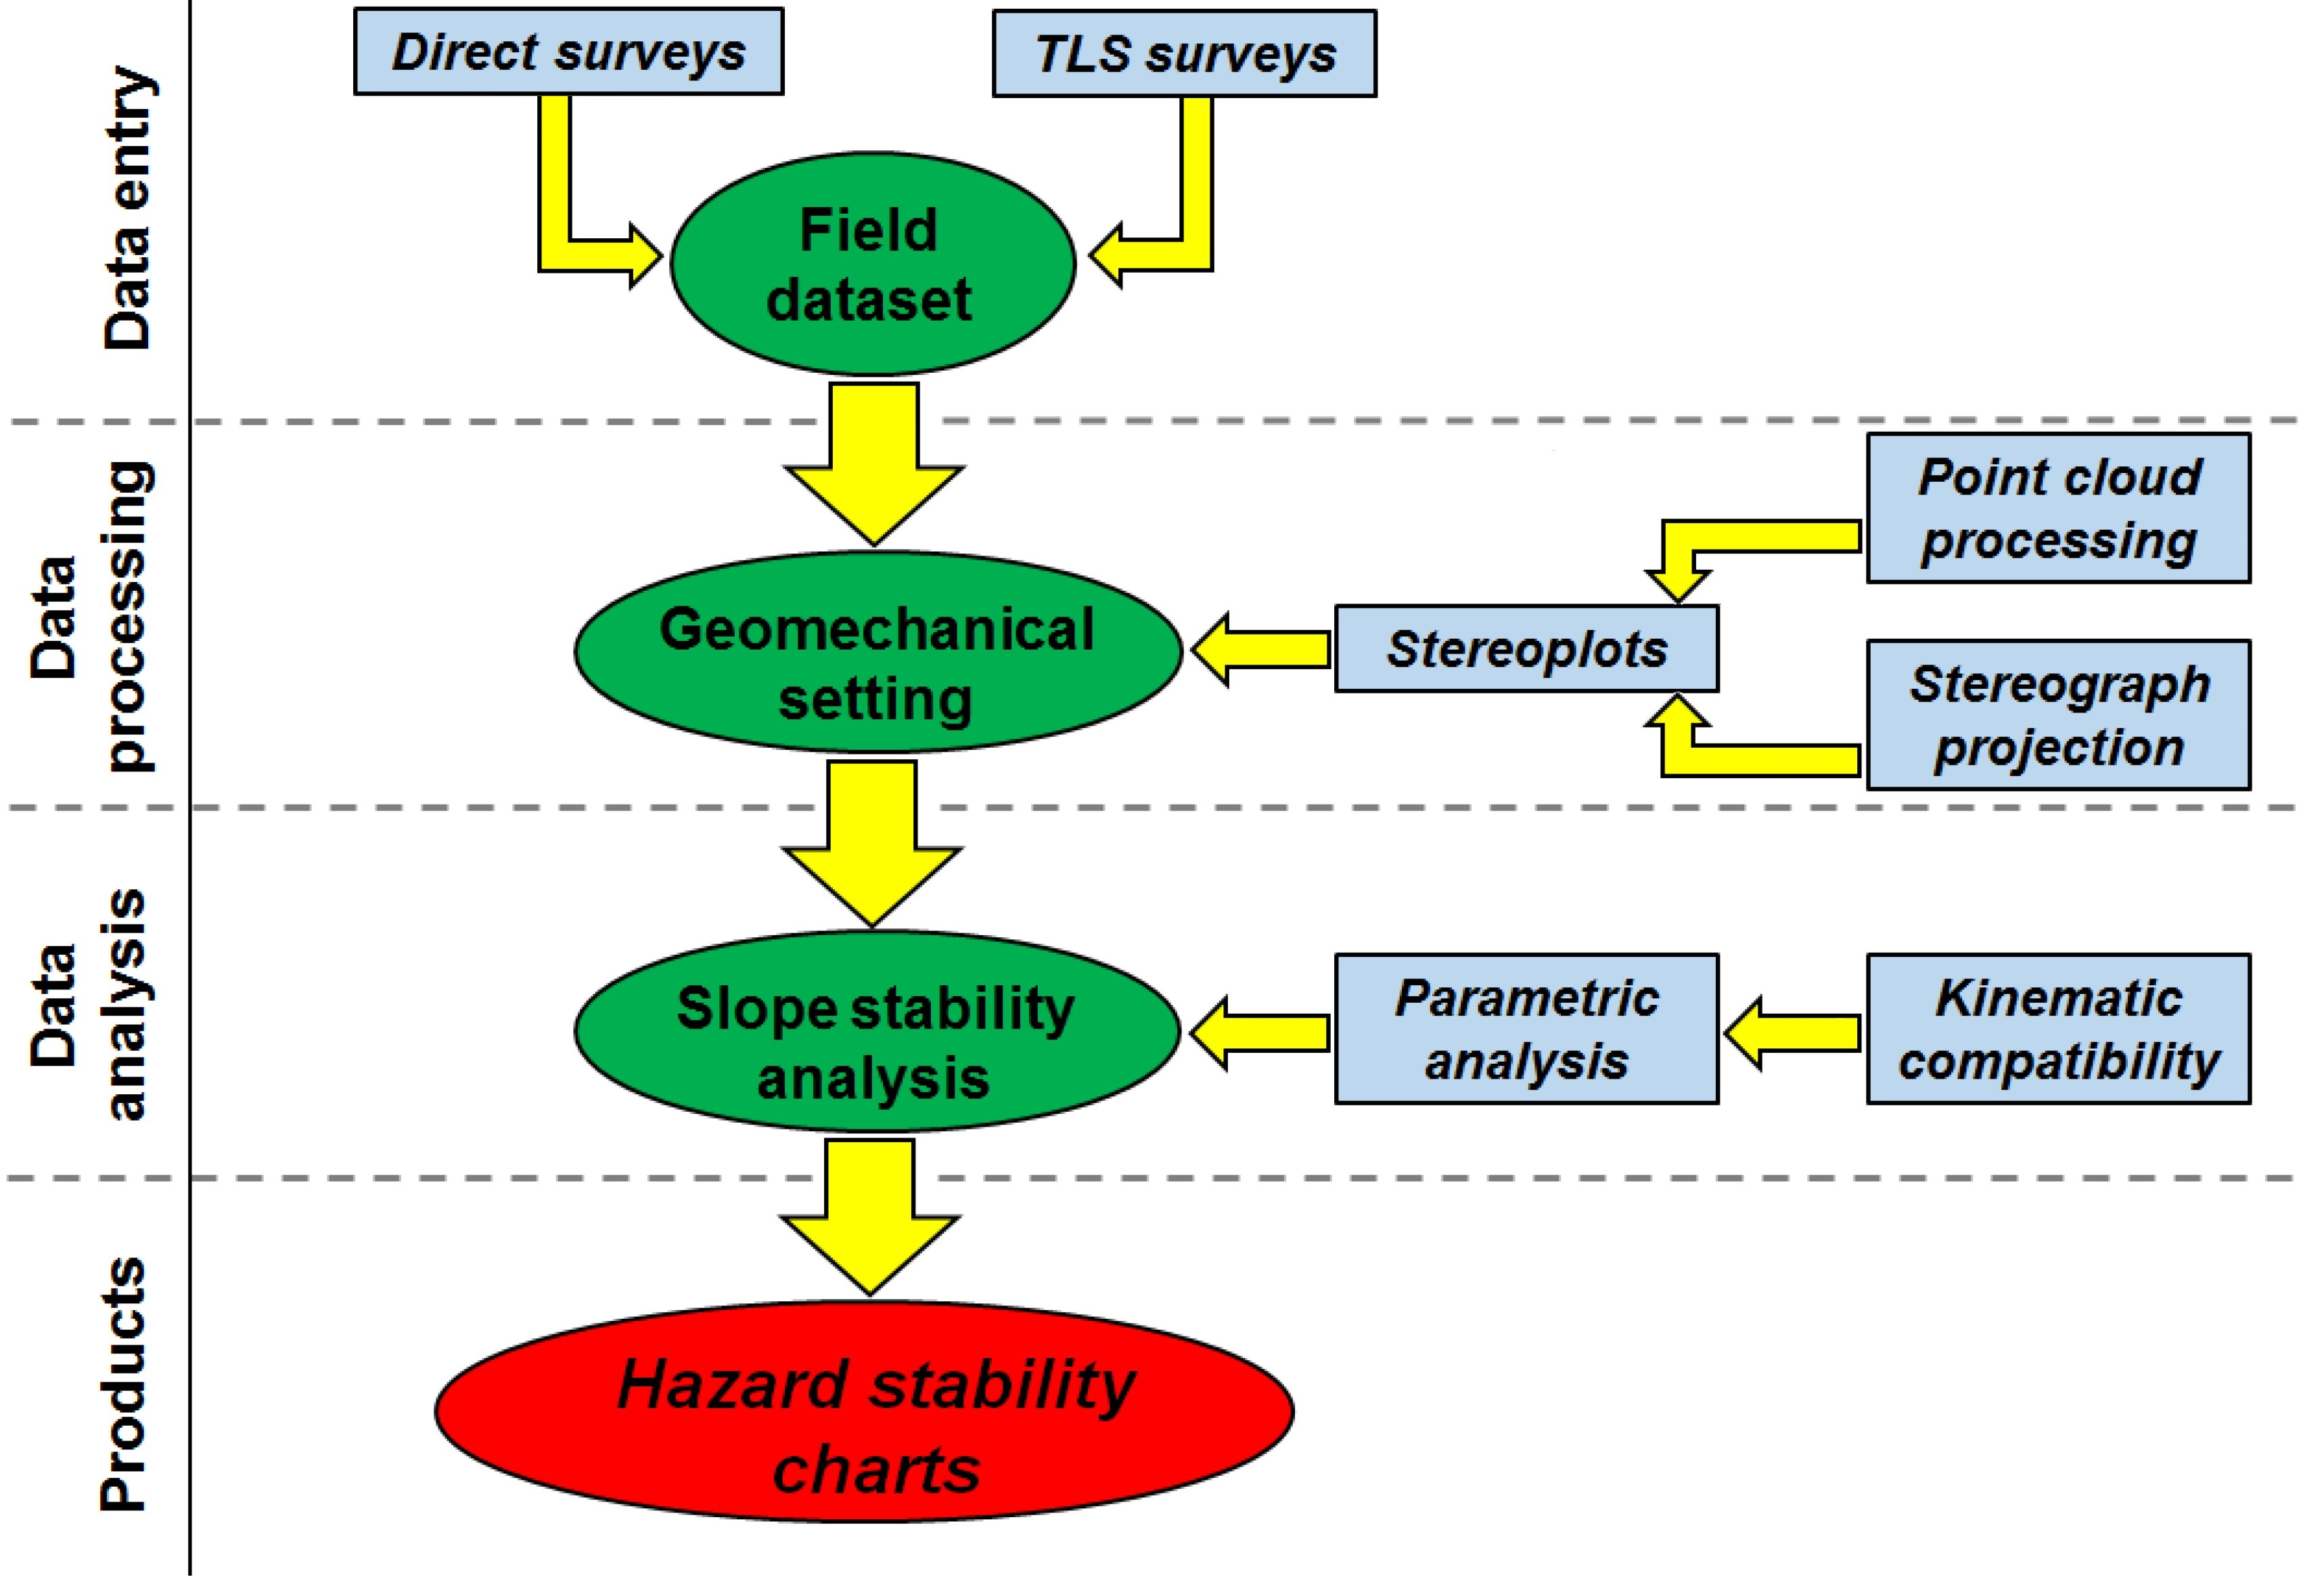
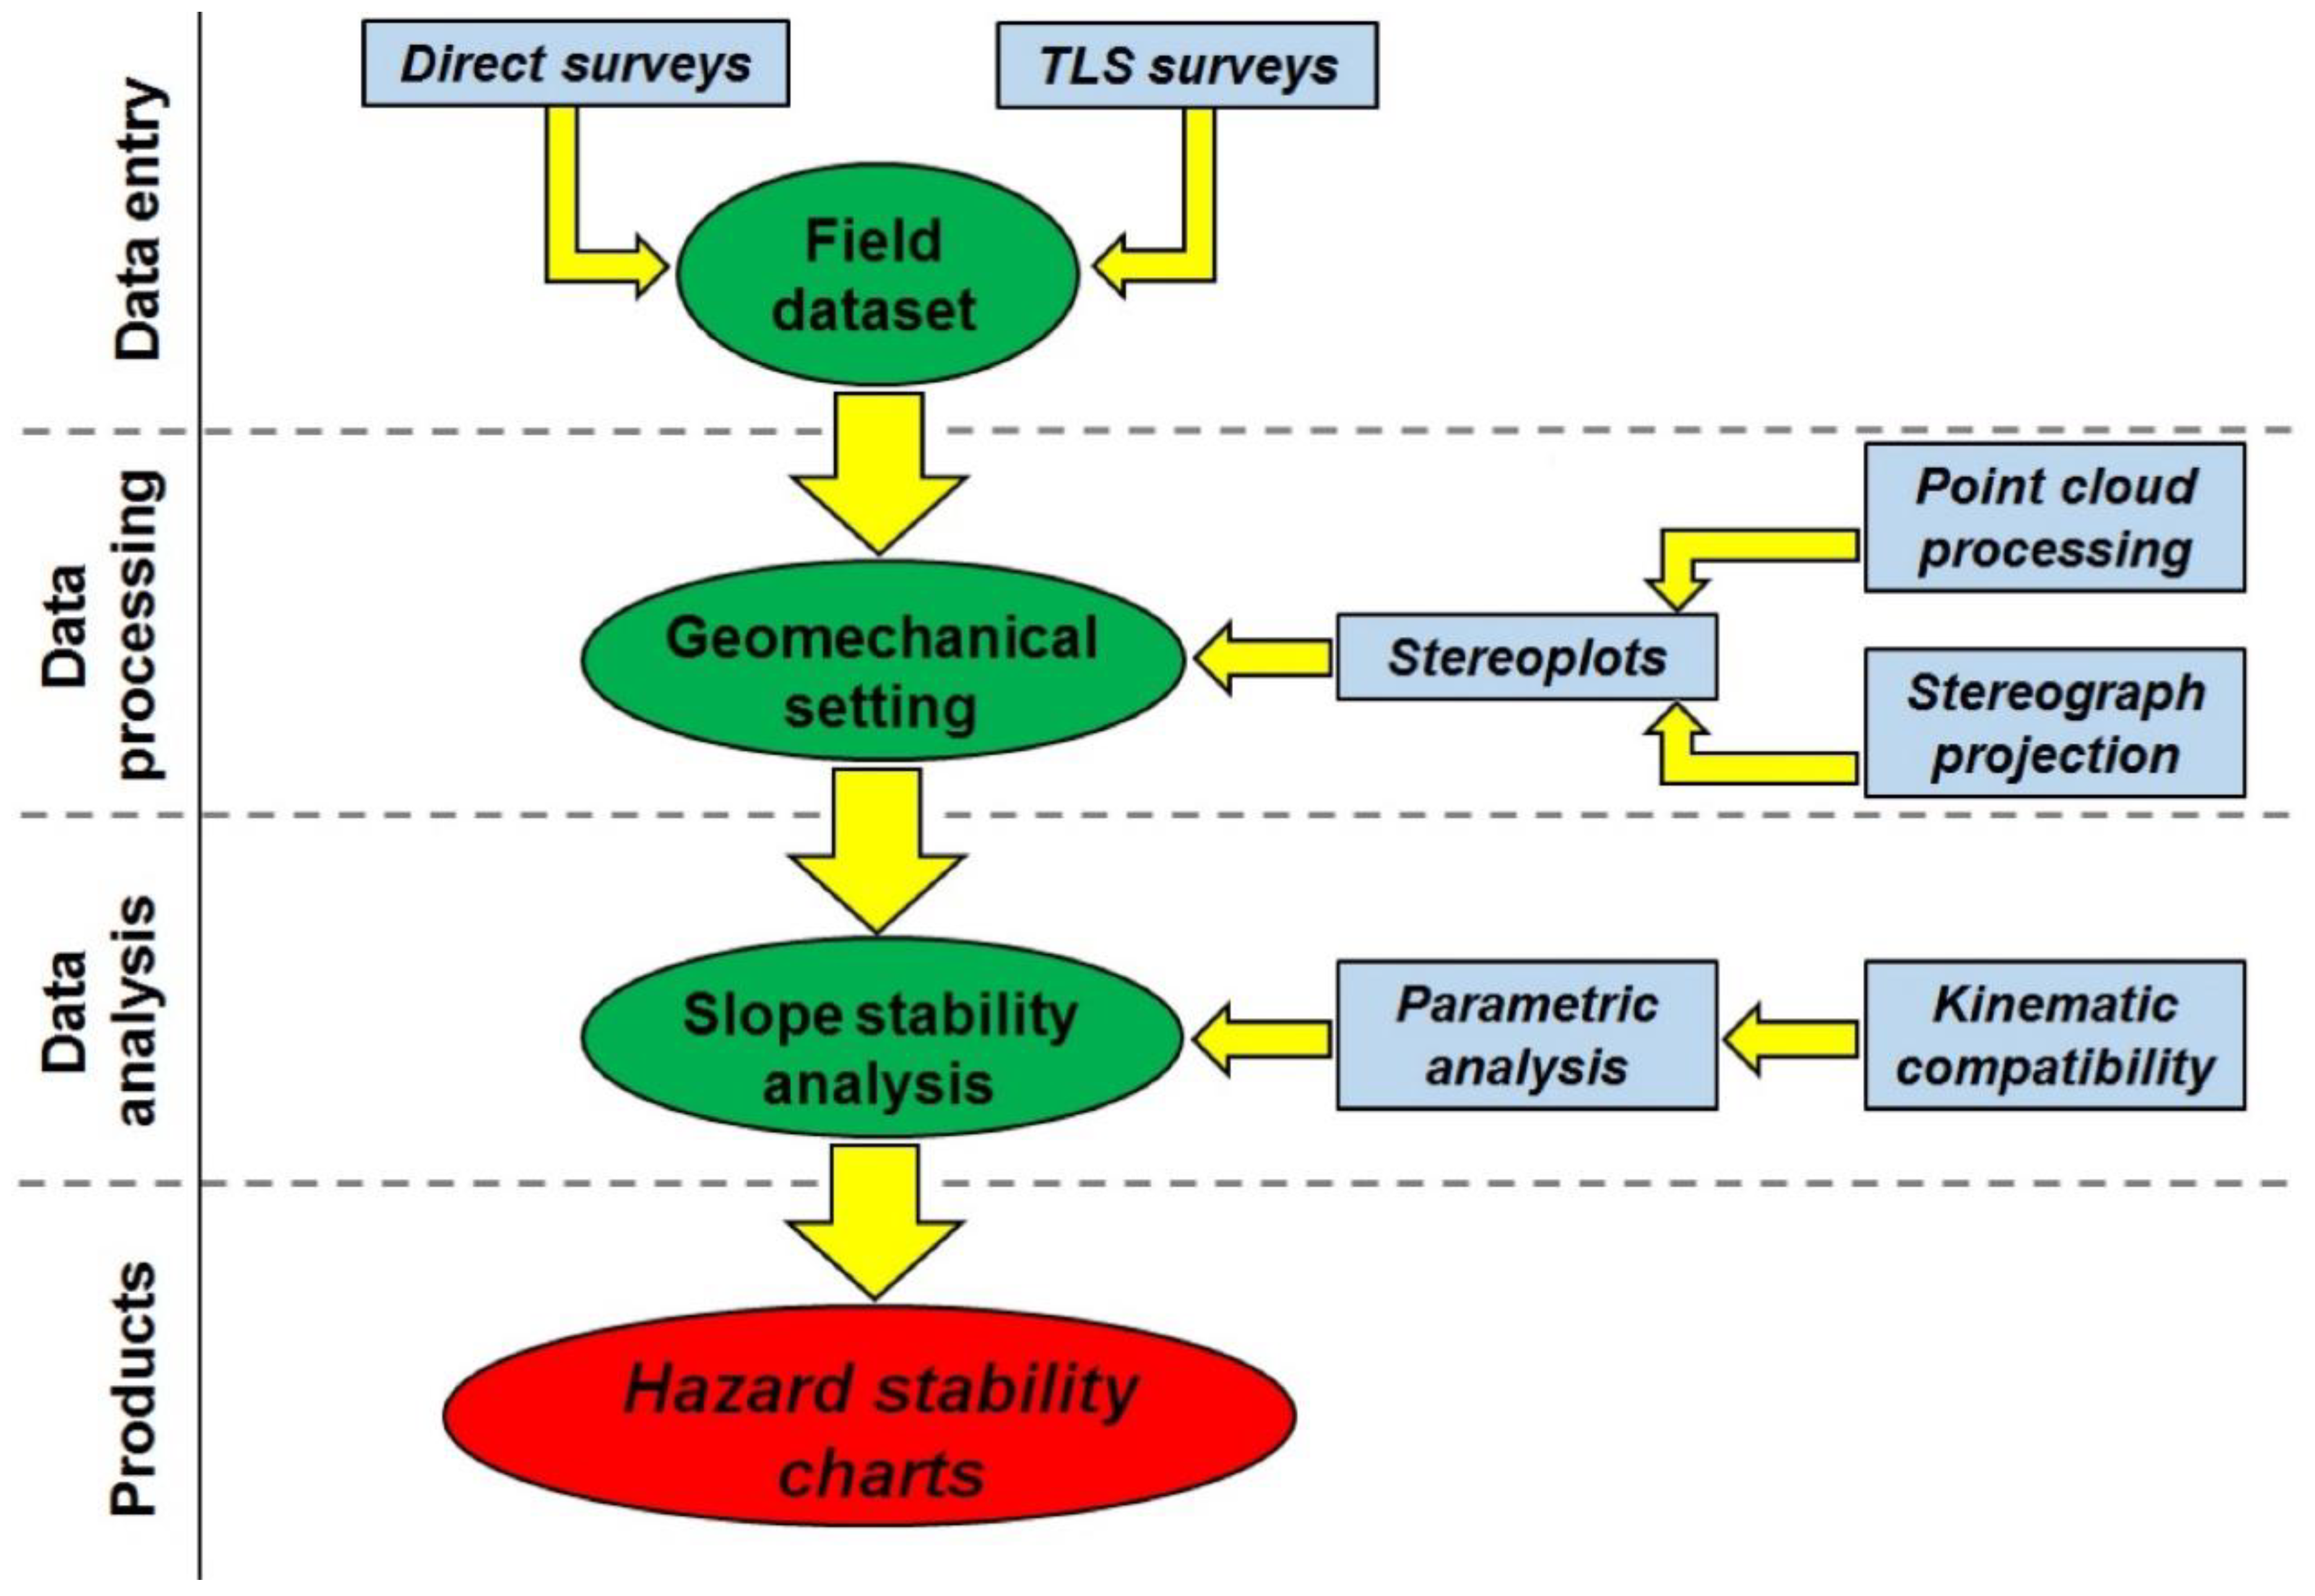
This paper describes a combined methodology that exploits the potential of TLS in the framework of a slope stability analysis of a rocky cliff. Specifically, we present the results of a detailed investigation carried out on a cliff frequently affected by instability processes located below the village of Sugano (close to Orvieto, Central Italy). Geomechanical characterization of the cliff was carried out starting from 3D high-resolution point clouds collected by TLS surveys [
15,
16] with the aim of assessing the overall predisposition to failure of the cliff by accounting for different triggering scenarios. Specifically, the adopted procedure can be summarized in four levels of activity (
Figure 1):
data acquisition, including direct geomechanical scan lines on site and TLS surveys;
data processing consisting in point cloud filtering and triangulation, stereograph projection and geomechanical setting restitution;
data analysis, including a kinematic compatibility analysis performed using the Markland tests [
17] for rock toppling and a sensitivity analysis for rock toppling in relation to different potential triggering factors; and
delivery of final products consisting in hazard stability charts.
2. Geological and Geomorphological Setting
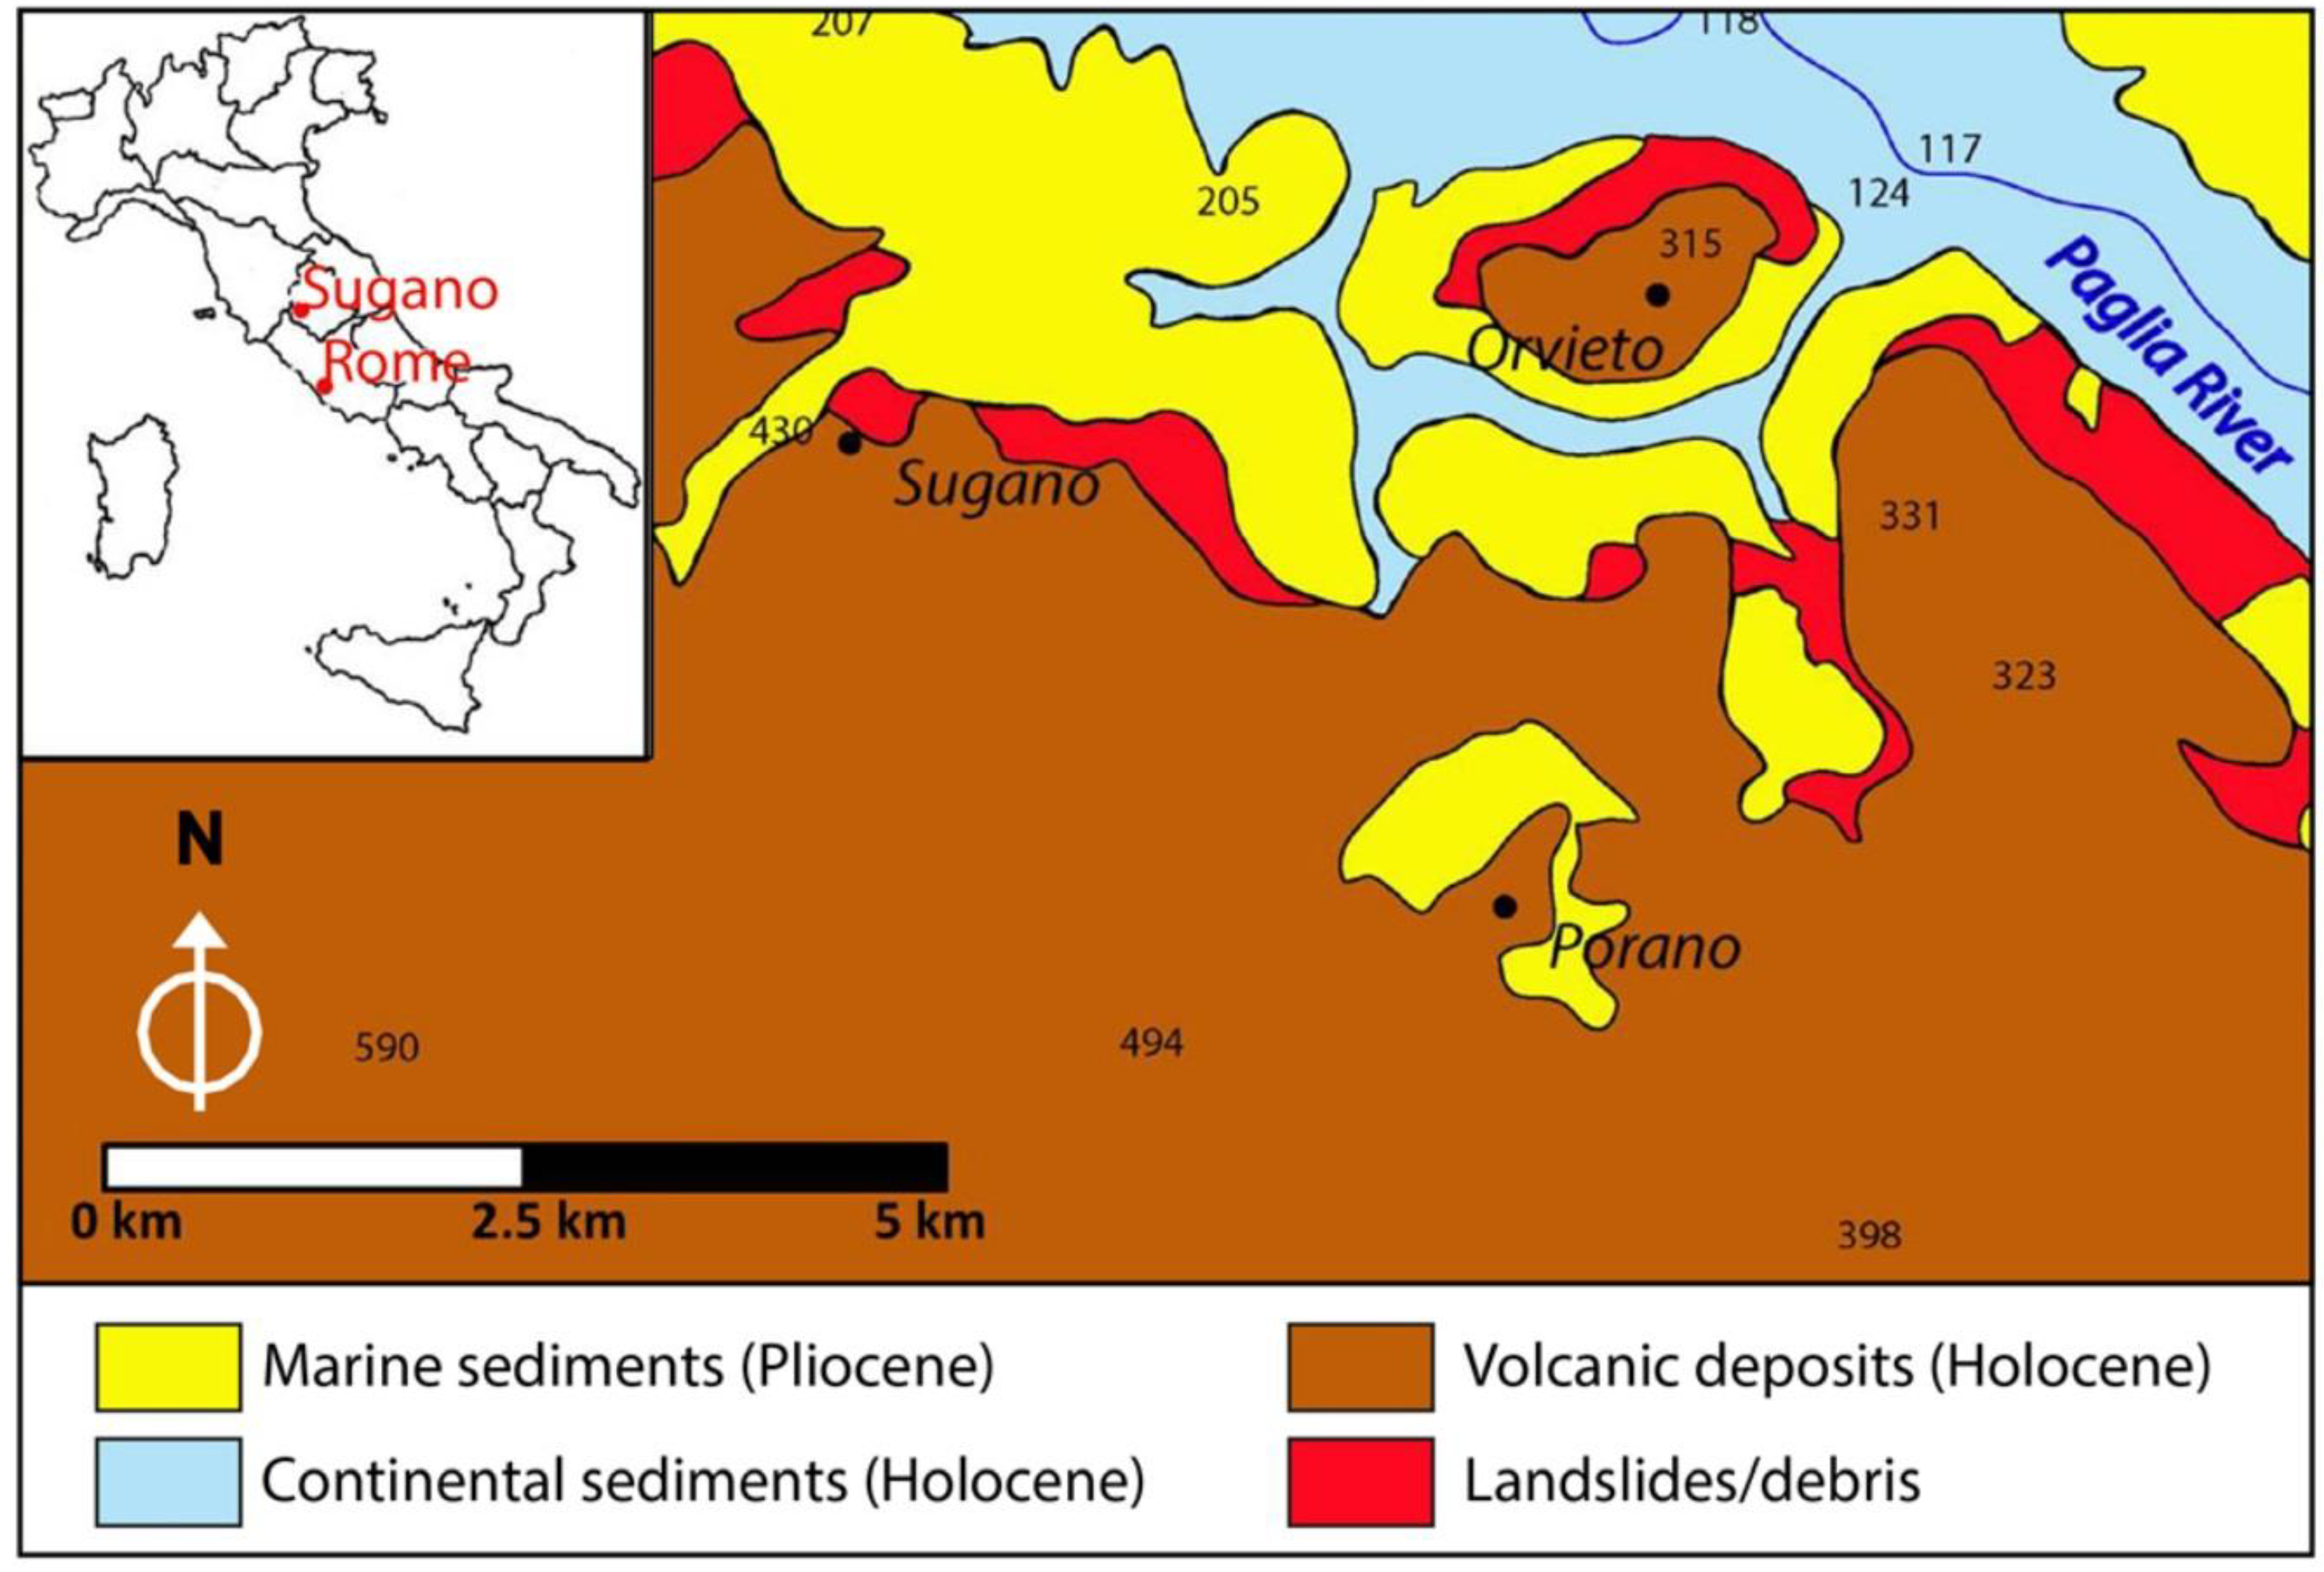
Sugano is a small hamlet of Orvieto Municipality in the province of Terni (Umbria, Central Italy), about 100 km north of Rome. The village is located in the geologic domain of the Alfina plateau, a broad quaternary volcanic plateau outcropping in the northern part of the Lazio Region [
18]. The outcropping rocks are namely Pliocene sedimentary rocks, volcanic deposits and recent alluvial sediments (
Figure 2).
The geological setting of the Sugano hill resulted from neotectonic and volcanic events occurred during Quaternary. The substratum of the volcanic Alfina plateau consists of Pliocene marine clays, which were deposited during an extensional tectonic phase started in Lower Pleistocene. The normal faults (striking approximately NW-SE) that developed in this phase, formed horst and graben basins which hosted lava and pyroclastic deposits coming from the Vulsini Volcanic Complex [
19] which corresponds to the current Bolsena Lake [
20]. From a geomorphological point of view, the erosion due to the Paglia River played a key role. In fact, the Plio-Pleistocene marine clays, which represent the substratum of the stratigraphic sequence, can be easily eroded then yielding the typical morphology of the area, characterized by sub-vertical cliffs of volcanic rocks, on which many small towns since the Middle Ages have been built (including Orvieto and Sugano). The lateral spreading phenomena, with consequent rock toppling, affect the volcanic cliffs since ancient times, threatening the stability of the above settlements [
5,
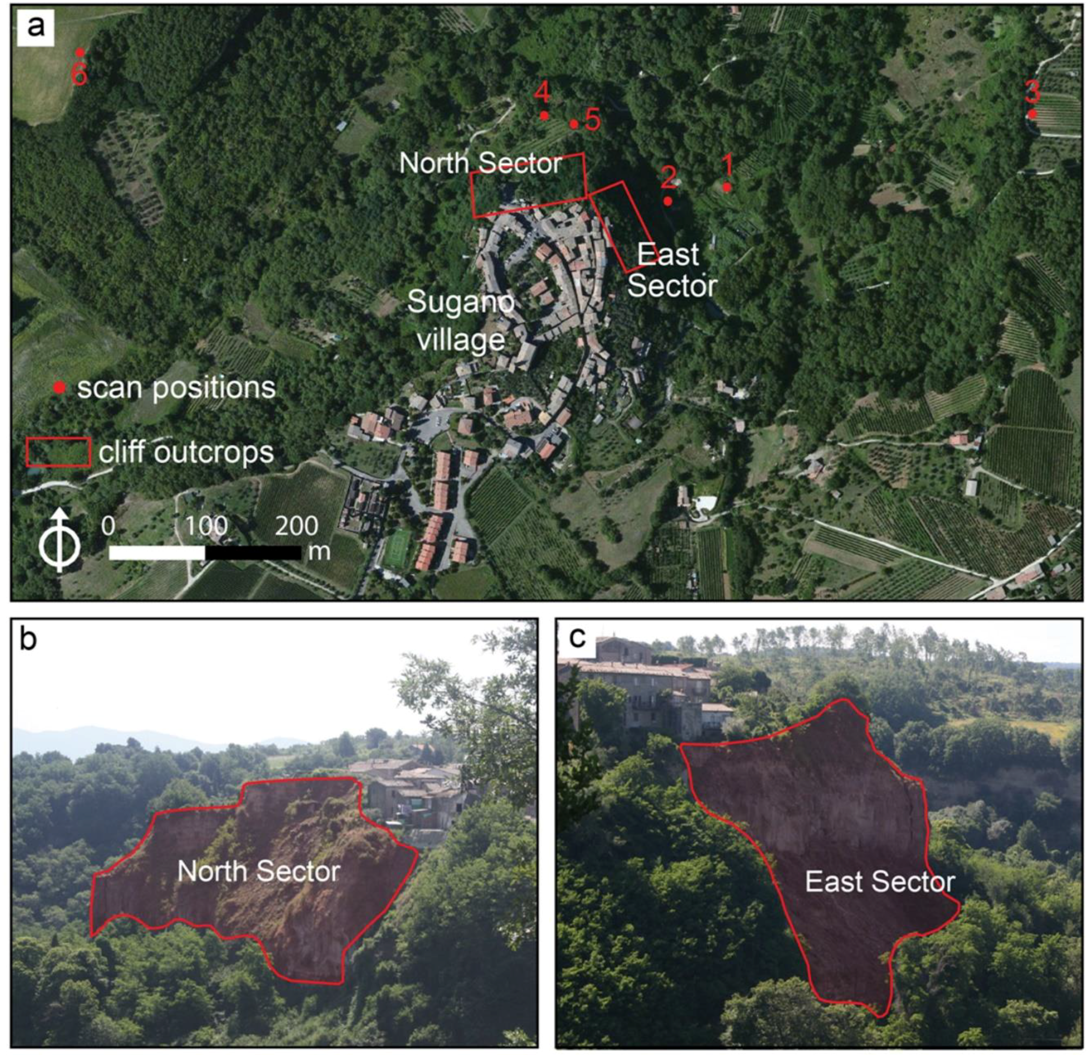
8]. The height of the Sugano cliff ranges between about 40 and 55 m, and the slope is characterized by two sectors with orientation of about 10° and 100° respectively. In the following sections, these two sectors have been indicated as North and East (
Figure 3) and analyzed separately.
3. Materials and Methods
3.1. Terrestrial Laser Scanner Survey
A geomechanical analysis of the Sugano cliff was performed through the analysis of high resolution point clouds collected by a dedicated TLS survey.
A terrestrial laser scanner is a ground-based, active imaging method that allows to retrieve 3D high-resolution digital models of both anthropic (structures, infrastructure, etc.) and natural objects (slopes, landslides, etc.). The device emits a laser pulse and records its backscattered radiation, measuring the distance between the sensor and the reflecting target. The distance measurements (thousands of measurements per second) are retrieved exploiting the time-of-flight information of emitted and received pulses by the sensor (as the light velocity is known). The laser scanner acquires plano-altimetric coordinates in the instrument reference system, and it is possible to convert these instrumental coordinates into the geographic reference system, using the exact positions of some cloud points (in addition to the laser ones). The distance measurements are, therefore, converted in point clouds. This type of surveys can be performed from different scanning positions, thus also allowing the 3D modelling of complex areas, minimizing the shadow zones: single scans from different positions can be aligned to a local coordinate frame for the generation of a single point cloud.
The integration with a high resolution digital camera (providing the actual RGB colors of the scenario) and the possibility to georeference the point clouds into any geographic reference system, make this technique suitable for several applications for both geological and structural fields (e.g., geomechanical rock mass characterization, analysis of the morphological and volumetric changes of slopes and landslides, and support for structure and infrastructure diagnostics, etc.). For this study, a Riegl VZ1000 sensor (Riegl Laser Measurement Systems, Horn, Austria) has been used from six different scan positions (
Figure 3). This system is internally equipped with a GPS antenna, an inclinometer sensor, and a digital compass for the georeferencing of the achieved data and a high resolution digital camera for the acquisition of true color 3D models. The distance between the slope and the survey system ranged from 20 to 360 m, while the scanning resolution angle ranged from 0.003° to 0.010°, (
Table 1).
A topographic survey was also performed using a Leica TCRM1202 total station (TS) in order to geocode the six collected point clouds in the same geographic reference system, by getting accurate 3D coordinates. For such a purpose, optical reflectors (detectable by both TLS and TS) were positioned in the scanning field of view, thus ensuring their visibility from different scan positions for a correct alignment of point clouds during the post-processing phase. Furthermore, in order to determine absolute coordinates of the positioned optical targets (network of control points) a differential GPS survey was performed by a Leica GS15 GPS receiver (Leica Geosystems AG, Heerbrugg, Switzerland).
The software used for registration, alignment and processing of acquired point clouds is RiSCAN PRO (Riegl Laser Measurement Systems, Horn, Austria) [
21]. The point clouds collected from different scan positions were combined in a single extended point cloud, which covers the whole investigated scenario. The two sectors (east and north) of the cliff have been individually analyzed. Therefore, a true-color point cloud of the whole cliff has been carried out, with a point density ranging between 3–4 and 14 points/cm
2 depending on the position of the cliff sectors (favorable or unfavorable with respect to the TLS sensor). Manual and automatic filters have been used for areas covered by vegetation, in order to get only the points on the outcropping rocks. On the basis of the analysis of multiple returns of the laser beam (“echos”), it is then possible to acquire information also in areas partially covered by vegetation [
22].
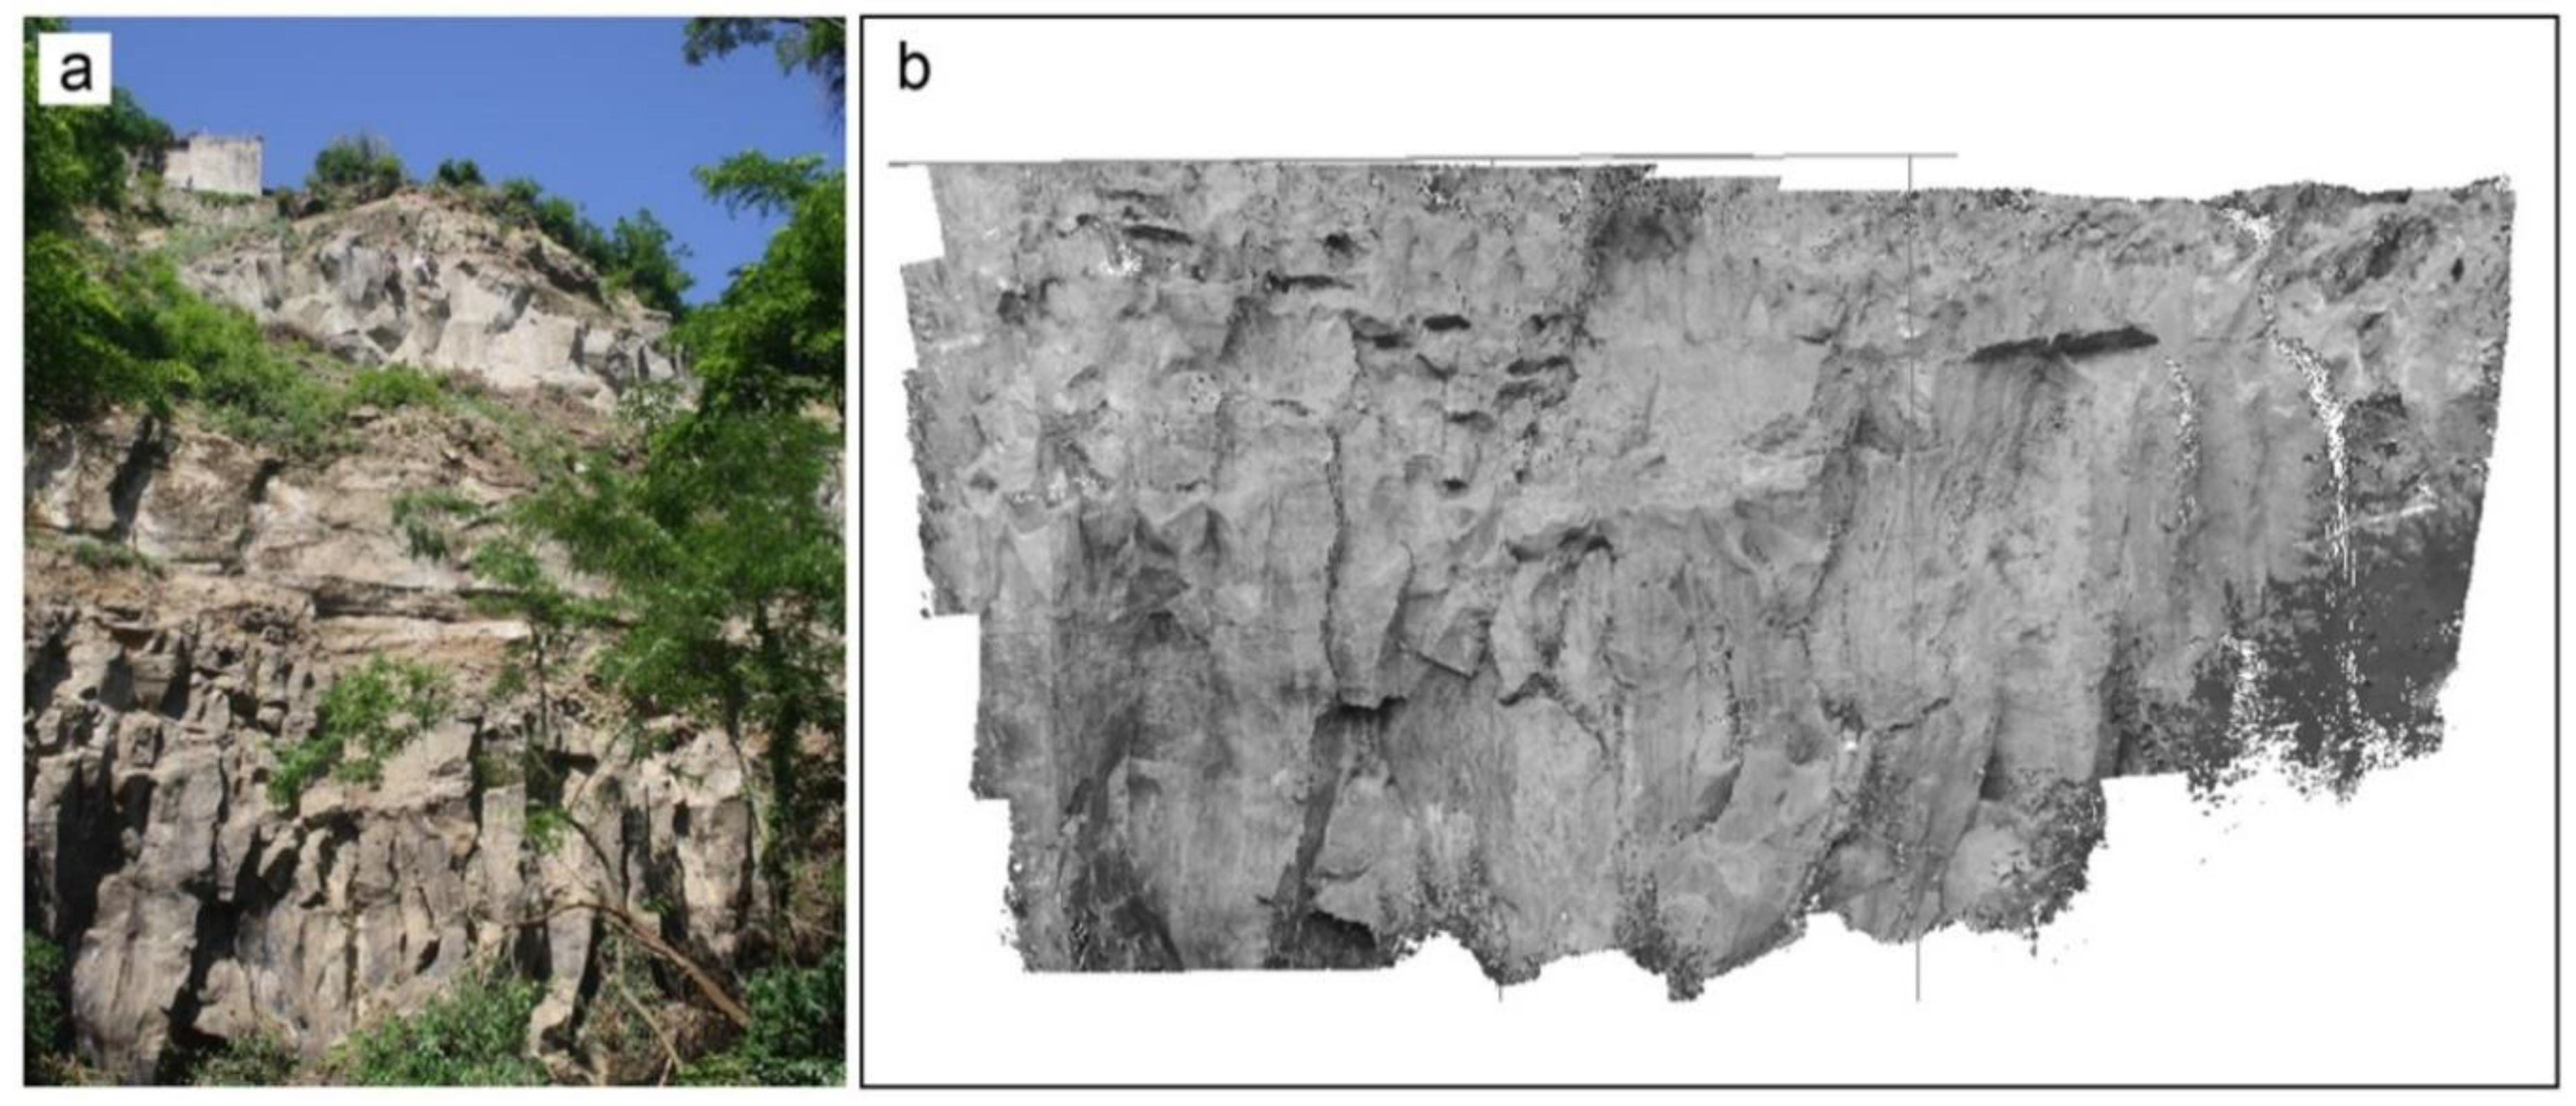
After this filtering procedure, a mesh was created by a 2D-Delaunay triangulation algorithm [
23,
24]. Additional automatic and semi-automatic filters were also applied in order to remove outliers due to artifacts. The achieved result is a 3D solid model of the Sugano cliff with cell resolution ranging from 0.003 m
2 to 0.6 m
2 (
Figure 4). Although part of the cliff was not surveyed due to the presence of thick vegetation, about 13,500 m
2 of the rock surface have been investigated through the laser scanner survey.
3.2. Geomechanical Analysis
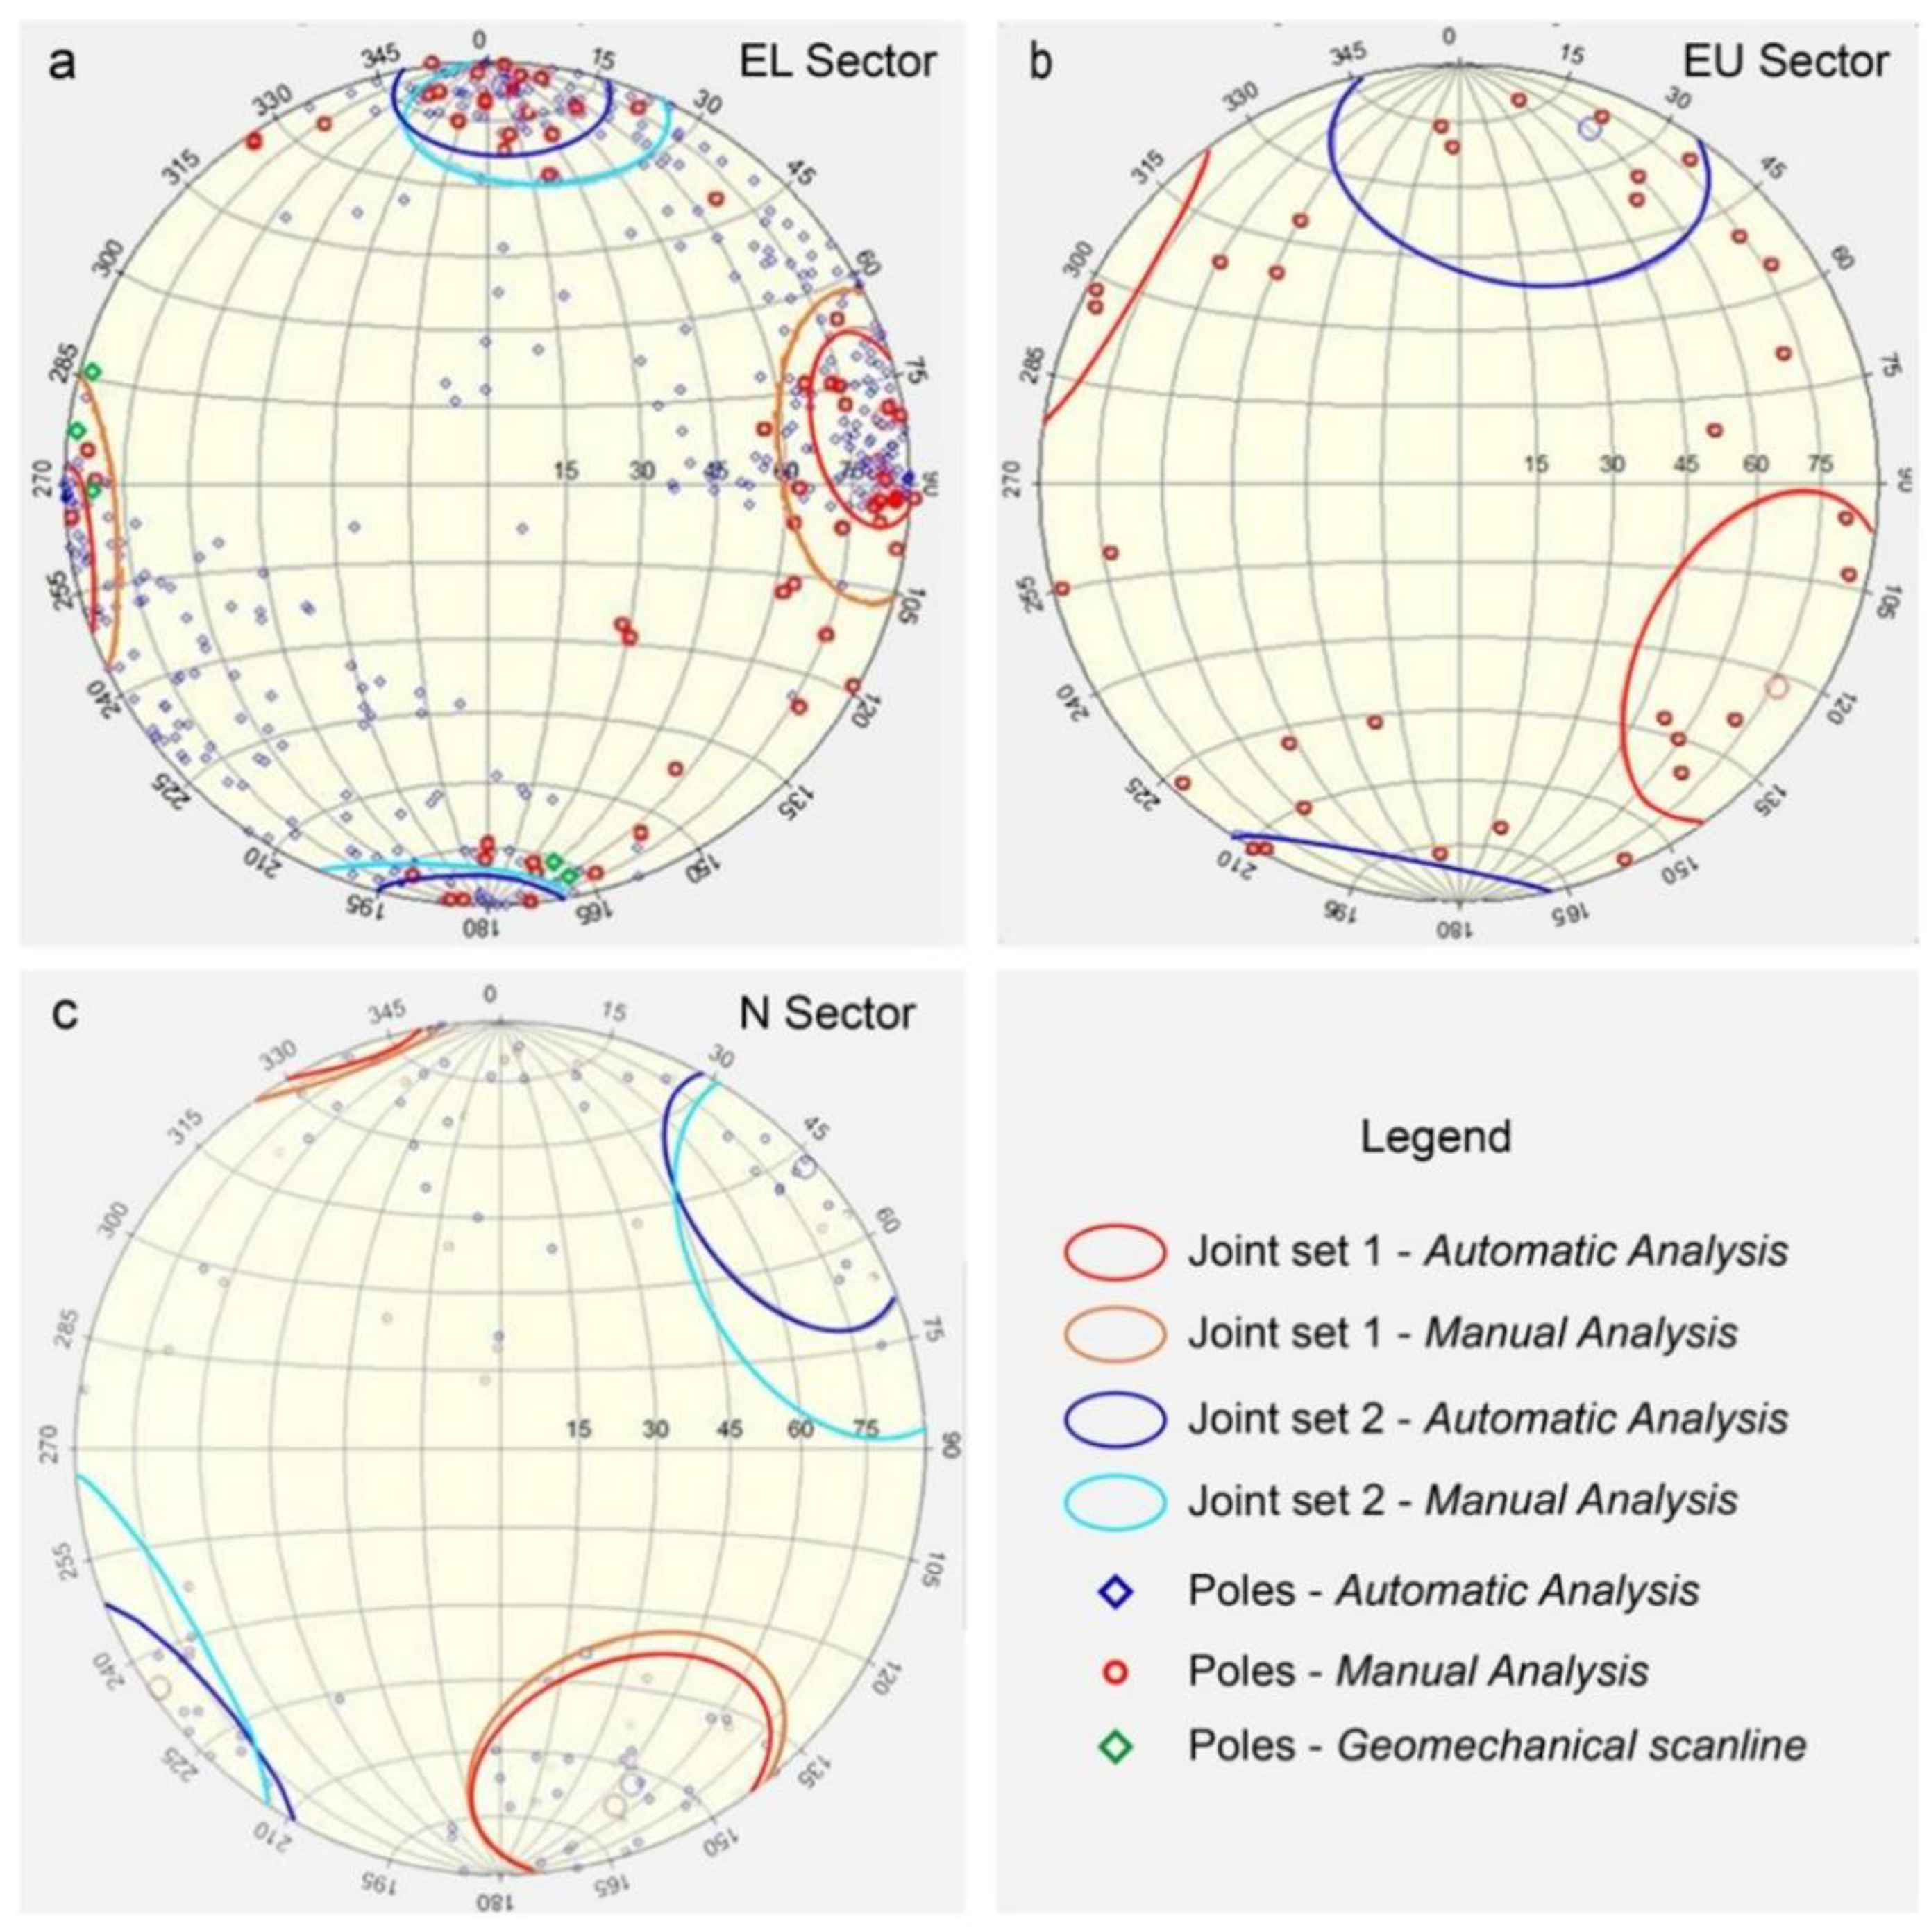
The geomechanical characterization of the Sugano cliff has been carried out by analyzing the collected point clouds with Split-FX software (Split Engineering, Tucson, Arizona, USA) [
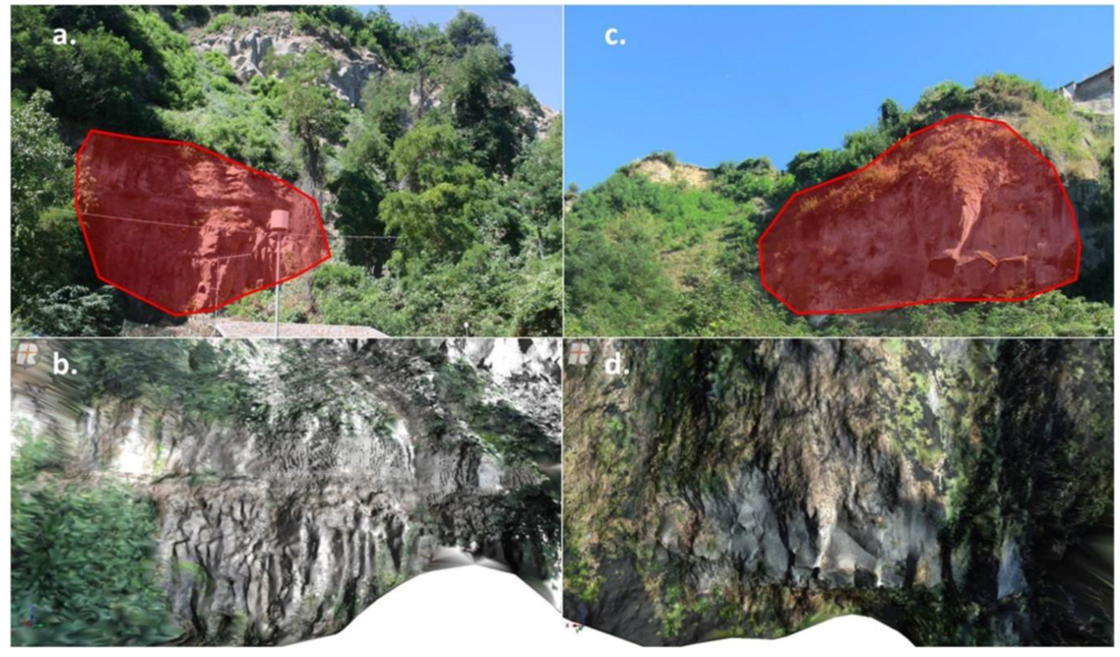
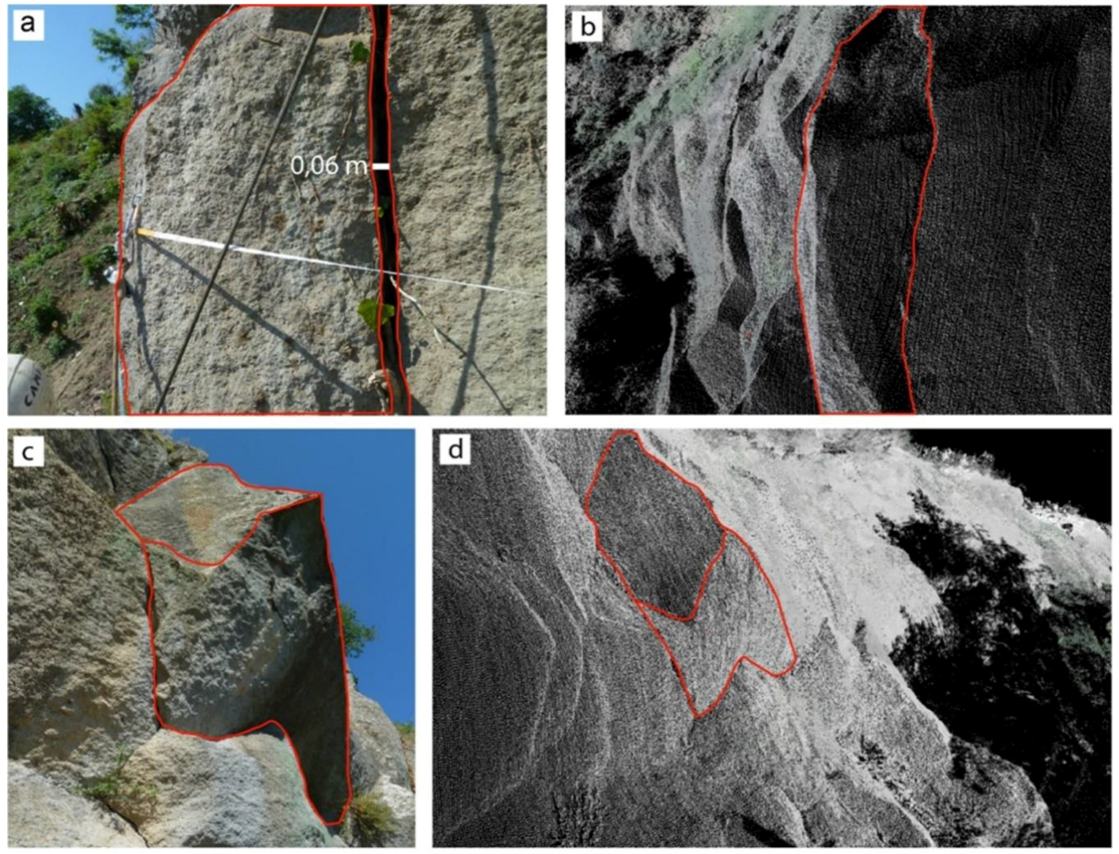
25], using both manual and automatic approaches. The aim of the analysis was to achieve information about the rock mass joint sets. In this respect, the lower part of the East sector (EL, see
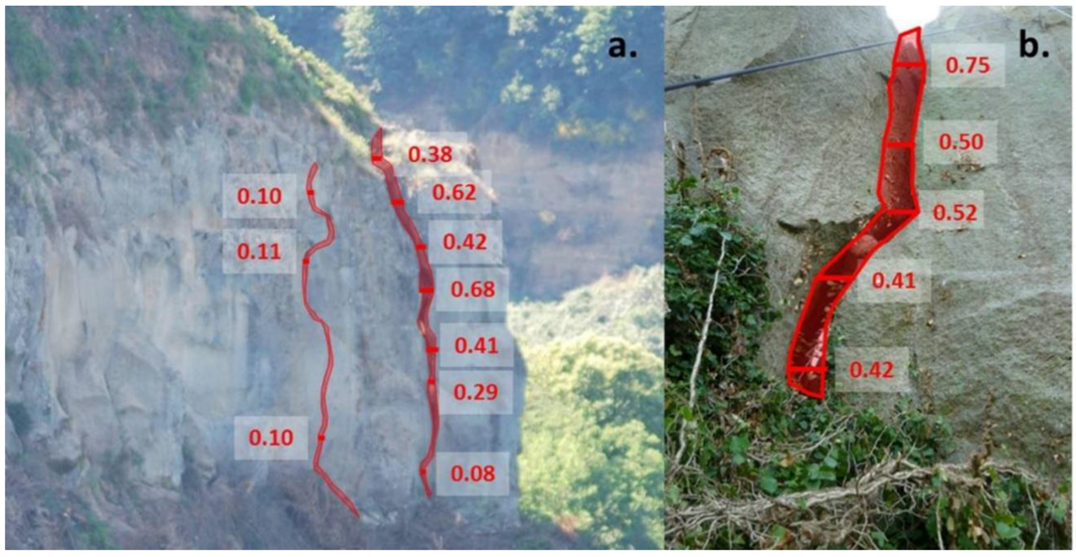
Figure 5) has been also analyzed through an in situ geomechanical survey, which shows the presence of two sub-vertical joint sets that shall release prismatic blocks (
Figure 6). The in-situ geomechanical survey was performed in order to obtain a reliable calibration measurement (through a conventional approach) to be compared with results from TLS analysis for validation purposes. The same analysis was not performed on the other sectors of the cliff (i.e., the upper east (EU) and the north (N) sector) due to the poor safety conditions.
The second phase of the analysis consisted in the automatic identification of patches [
26]. The parameters used for the automatic identification of patches are reported in
Table 2. It is important to specify that no automatic analysis was performed in the EU sector due to the poor quality of the preliminary results. Patches were also manually identified and drawn through the visual interpretation of the 3D mesh model. Patches identified by both manual and automatic approaches have been analyzed and compared in order to identify the main joint sets, whose features (i.e., spacing and persistency) also allowed the retrieval of the standard joint index (Jv), i.e., the number of joints per unit volume [
27].
3.3. Parametric Stability Analysis
Considering the presence of prismatic blocks prone to the detachment, the stability conditions of the Sugano cliff were evaluated assuming the toppling as the potential failure mechanism [
28]. For this reason, a preliminary kinematic compatibility analysis was performed using the Markland test. This test was carried out for each sector of the Sugano cliff, where the following conditions have been verified for confirming the kinematic compatibility for rock toppling [
28]:
A dip value of the joint set that releases the rock block (ψs) must be higher than the opposite of the average dip value of the slope (ψf); and
A bisector of the angle formed by the strike direction of two joint sets delimiting the rock block must shape a maximum angle of ±10° with respect to all dip directions of the slope.
Once the blocks that potentially can topple have been identified, the stability analysis has been performed by considering different static (i.e., weight force) and pseudostatic actions (i.e., seismic force and hydrostatic pressures within the joints). For all the supposed scenarios the safety factor (SF), i.e., the ratio between the stabilizing and destabilizing force-momentums, has been computed. At this aim, each potentially-unstable block, separated by joints, has been considered:
homogeneous;
with a height of the columnar block equal to the height h corresponding to the average spacing of the joint set which bounds the outcropping blocks at their top and bottom; and
characterized by a distance b between lateral surfaces corresponding to the average spacing of the joint set which laterally bounds the outcropping blocks.
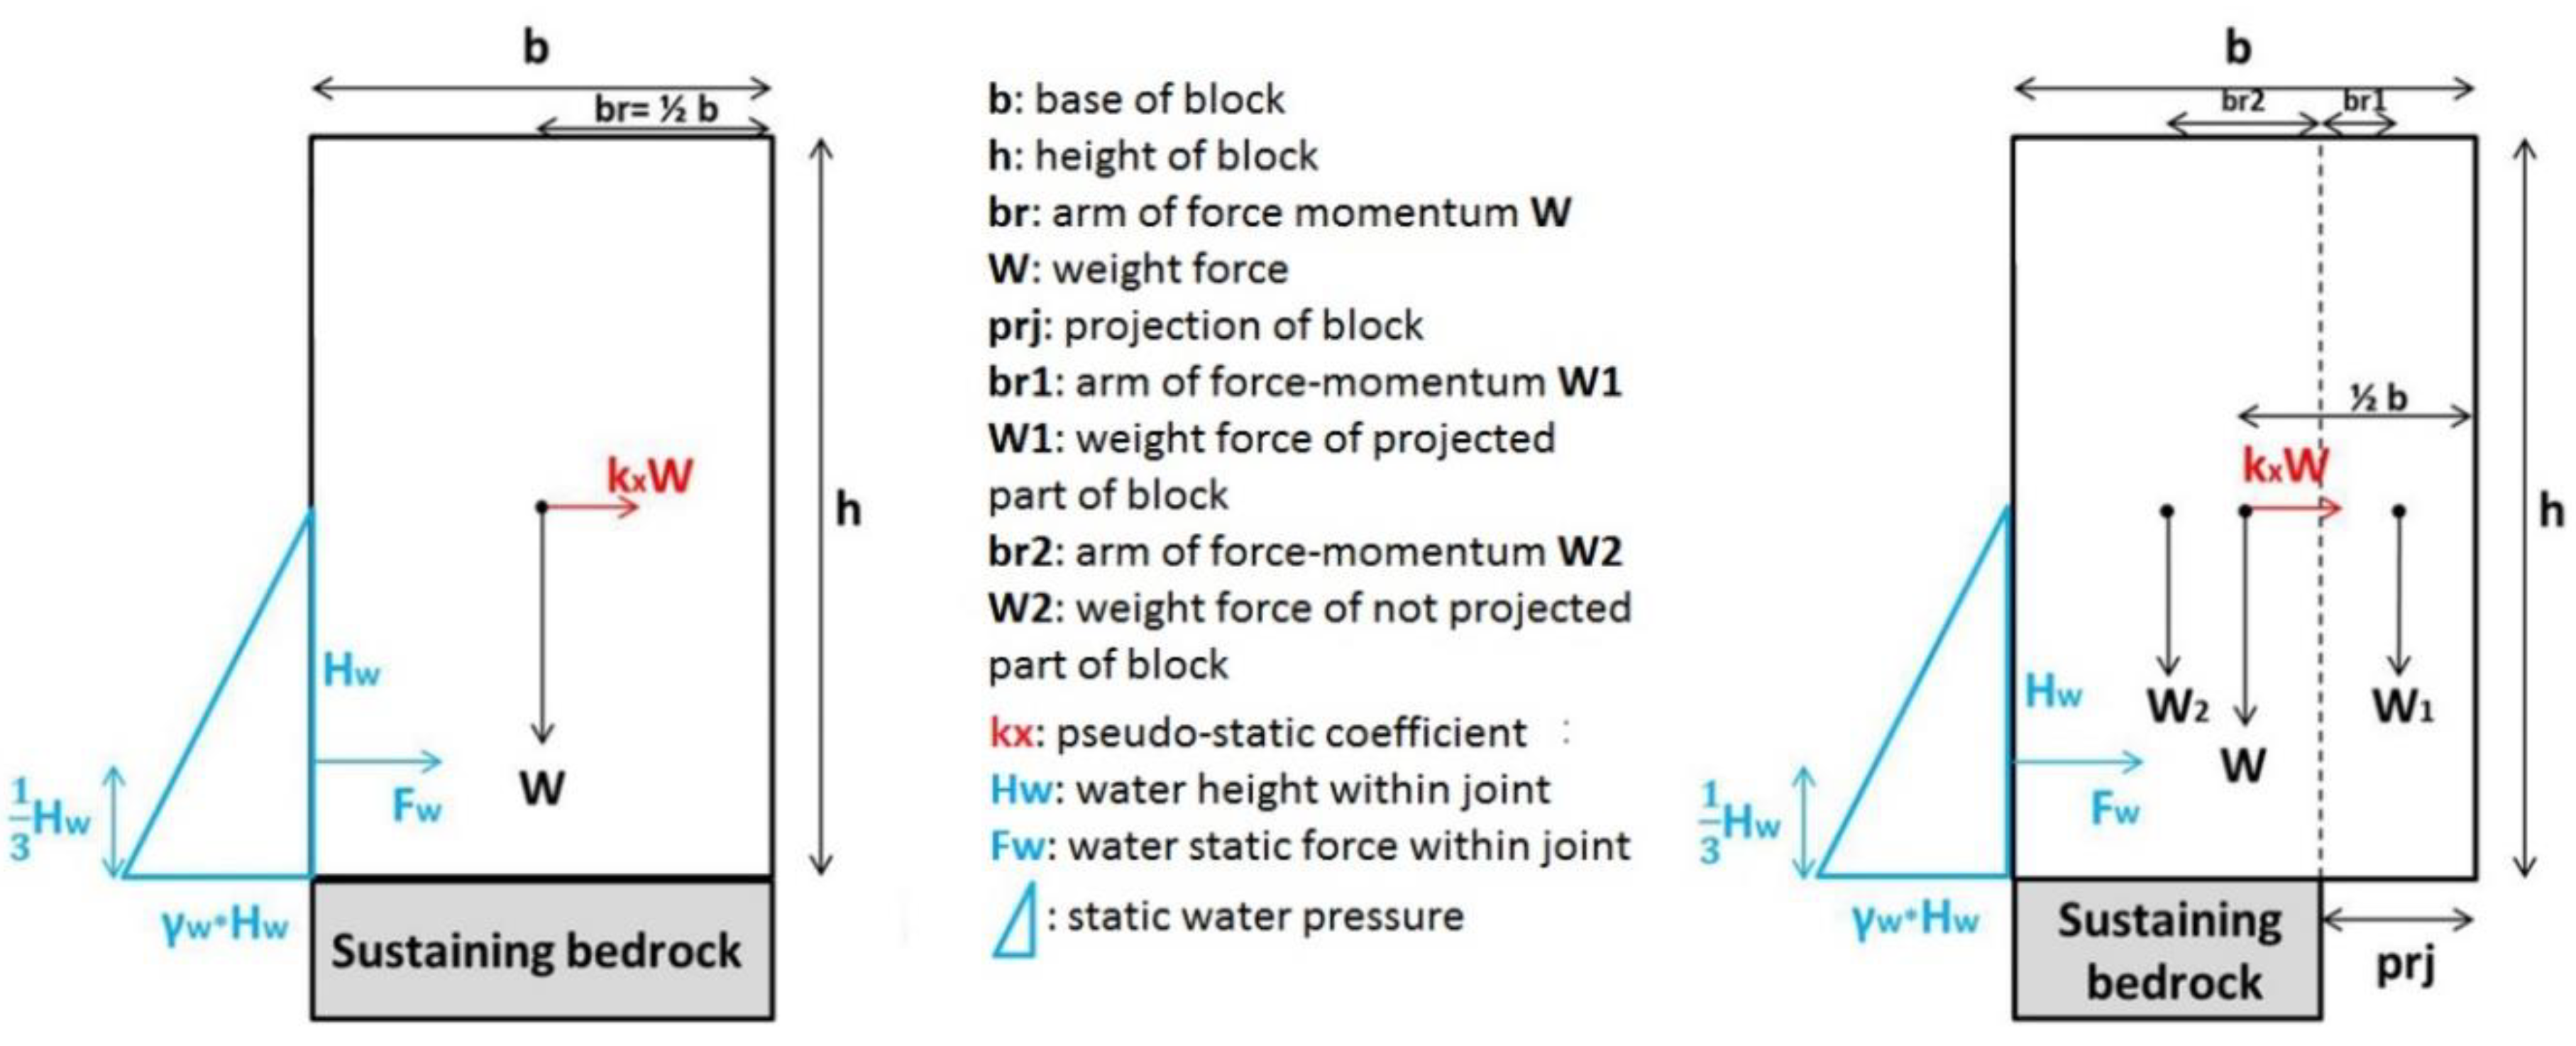
Beyond the different destabilizing actions, two types of analysis have been performed for the Sugano cliff, namely considering the presence of projecting and not projecting blocks (
Figure 7).
3.3.1. Sensitivity Stability Analysis to Rock Toppling: Static Condition
In the absence of projection (i.e., if the sustaining bedrock is as large as the potentially-unstable block) and considering the base as horizontal, the block is in equilibrium with respect to the toppling failure conditions. In case of projection, two weight forces have to be considered, i.e., W
1 for the projecting part of the block and W
2 for the not projecting part. In order to keep the equilibrium state, this condition has to be verified:
where br is the moment arm of W (1 and 2 subscripts indicate the projecting and not projecting portion of block, respectively). In this sense, if:
then the block is subject to rock topple (b is the base length of block). In this study, projection prj average value of 0.44 m varying in a range between ± 0.22, according to field observations on the outcropping blocks. At this point, for values of prj lower than b/2, a sensitivity analysis was performed.
3.3.2. Sensitivity Stability Analysis to Rock Toppling: Pseudostatic Seismic Action
If a pseudostatic coefficient k
x is applied to the blocks, the critical pseudostatic coefficient k
xc required to reach disequilibrium conditions for block toppling results from the equation:
where h is the average height of outcrop. The achieved k
xc values were compared with the values of the pseudostatic coefficients resulting from official Italian seismic hazard thematic maps (
http://zonesismiche.mi.ingv.it/) for return periods (T
r) of 475 years and 2475 years.
3.3.3. Sensitivity Stability Analysis to Rock Toppling: Hydrostatic Pressure Acting within Joints
If hydrostatic force due to water pressure distribution is considered within the joints, the critical water height H
wc required to reach disequilibrium conditions for block toppling is expressed by the following equations:
where γ
w is the water unit weight.
3.3.4. Sensitivity Stability Analysis to Rock Toppling: Hydrostatic Force Acting within Joints and Pseudostatic Seismic Action
If hydrostatic force due to a water pressure distribution is considered within the joints when a pseudostatic seismic action occurs, the critical water height H
wc required to reach disequilibrium conditions for block toppling can be derived from the following equations:
where k
xc is the critical pseudostatic coefficient.
5. Discussion
The present study demonstrates both the suitability and reliability of remote sensing techniques for the characterization of rock masses prone to instability, proving their advantages respect to other conventional techniques, especially for the investigation of not accessible slopes. Specifically, the opportunity to obtain information on the whole investigated slope plays a key role for an exhaustive rock mass characterization, especially in case of complex geostructural settings, where punctual conventional analyses may lead to misinterpretations. Furthermore, remote sensing surveys, as well as being generally safer and quicker compared to other approaches, allow to repeat different types of analyses on the collected data.
Nevertheless, some technical or logistic issues could preclude the repeatability of such methodology in other sites affected by similar problems. A suitable 3D model for an accurate geomechanical characterization can be achieved only by an appropriate design of the TLS survey, thus allowing the minimization of shadow zones potentially leading to the misinterpretation or the erroneous identification of the joint systems. In this regard, Martino et al. 2014 [
29] already pointed out the complexity and limitations of the use of terrestrial remote sensing techniques in case of partial and side visibility of cliff slopes. In such cases (like, for instance, sea cliffs or sites with complex logistics or accessibility), Digital photogrammetry by UAVs [
13,
14] may represent a suitable complementary technique, which is able to provide high resolution 3D models that can be integrated with the TLS ones.
Another technical issue to be taken into account is the variation of point clouds resolution and of the laser footprint over distances. Since both the automatic and manual approaches for the identification of joint systems are related to the statistical distribution of points in space, a high density of the analyzed point clouds is required (although minimal requirements cannot be defined since they significantly depend on the slope characteristics). Consequently, only short range target-sensor distances can be considered as effective. Finally, further limitations must be also considered, such as the reduced or non-operability of TLS technique in fog or heavily wet conditions and the need of an accurate georeferencing of the 3D output model (and, consequently, the need of a suitable support topographic survey).
Regarding the analysis of the collected TLS point clouds, it is opinion of the authors that, despite the growing number of more sophisticated software for automatic geostructural analysis, a critical interpretation of the data is essential for a supervised filtering of the results, a reliable rock mass characterization and, in a broader view, for the extrapolation of consistent information. This is the reason why, in the present work, both calibration in situ surveys by conventional approaches and independent manual analyses on 3D point clouds (lead by expert operators) have been also performed for comparison and validation purposes of the adopted method.
To investigate the stability conditions of the Sugano cliff taking into account the effect induced by earthquakes and/or by the presence of water within the joints, a conceptual stability chart has been designed (
Figure 12). This chart conceptualizes a hazard approach in a conventional sensitivity analysis output, and thus it can be applied to different case studies. The chart highlights the possibility that a slope could fail if two events occur, each having a different and independent probability of occurrence. Specifically, a critical line (C-line) distinguishes two fields related, respectively, to stability and instability conditions. Each point of this line (critical point, CP) corresponds to a couple of values representing the critical water height saturating the joints (H
cr) and the critical peak ground acceleration (PGA
cr). Each critical value is associated with a specific hazard (Hz, which represents the probability of occurrence); consequently, the total hazard of the CP (Hz
tot_CP) can be computed by combining the two probabilities of occurrence:
On the basis of this conceptual scheme, the C-line is a not-uniform hazard upper-bound-curve which shows how the highest hazard conditions can be reached in correspondence of both the highest admissible h value and the maximum expected PGA. At the same time, the critical line allows to deduce that the highest hazard is concentrated at the middle track of the line while it decreases moving toward the endmembers.
Since the hazard related to the water height saturating the joints is not available for the Sugano case study, the stability charts were obtained by considering the hz
PGA only. In particular, the relationship between k
x and the corresponding return period T
r (specific values for the Sugano cliff can be found at
http://esse1-gis.mi.ingv.it/) was used for quantifying such a hazard.
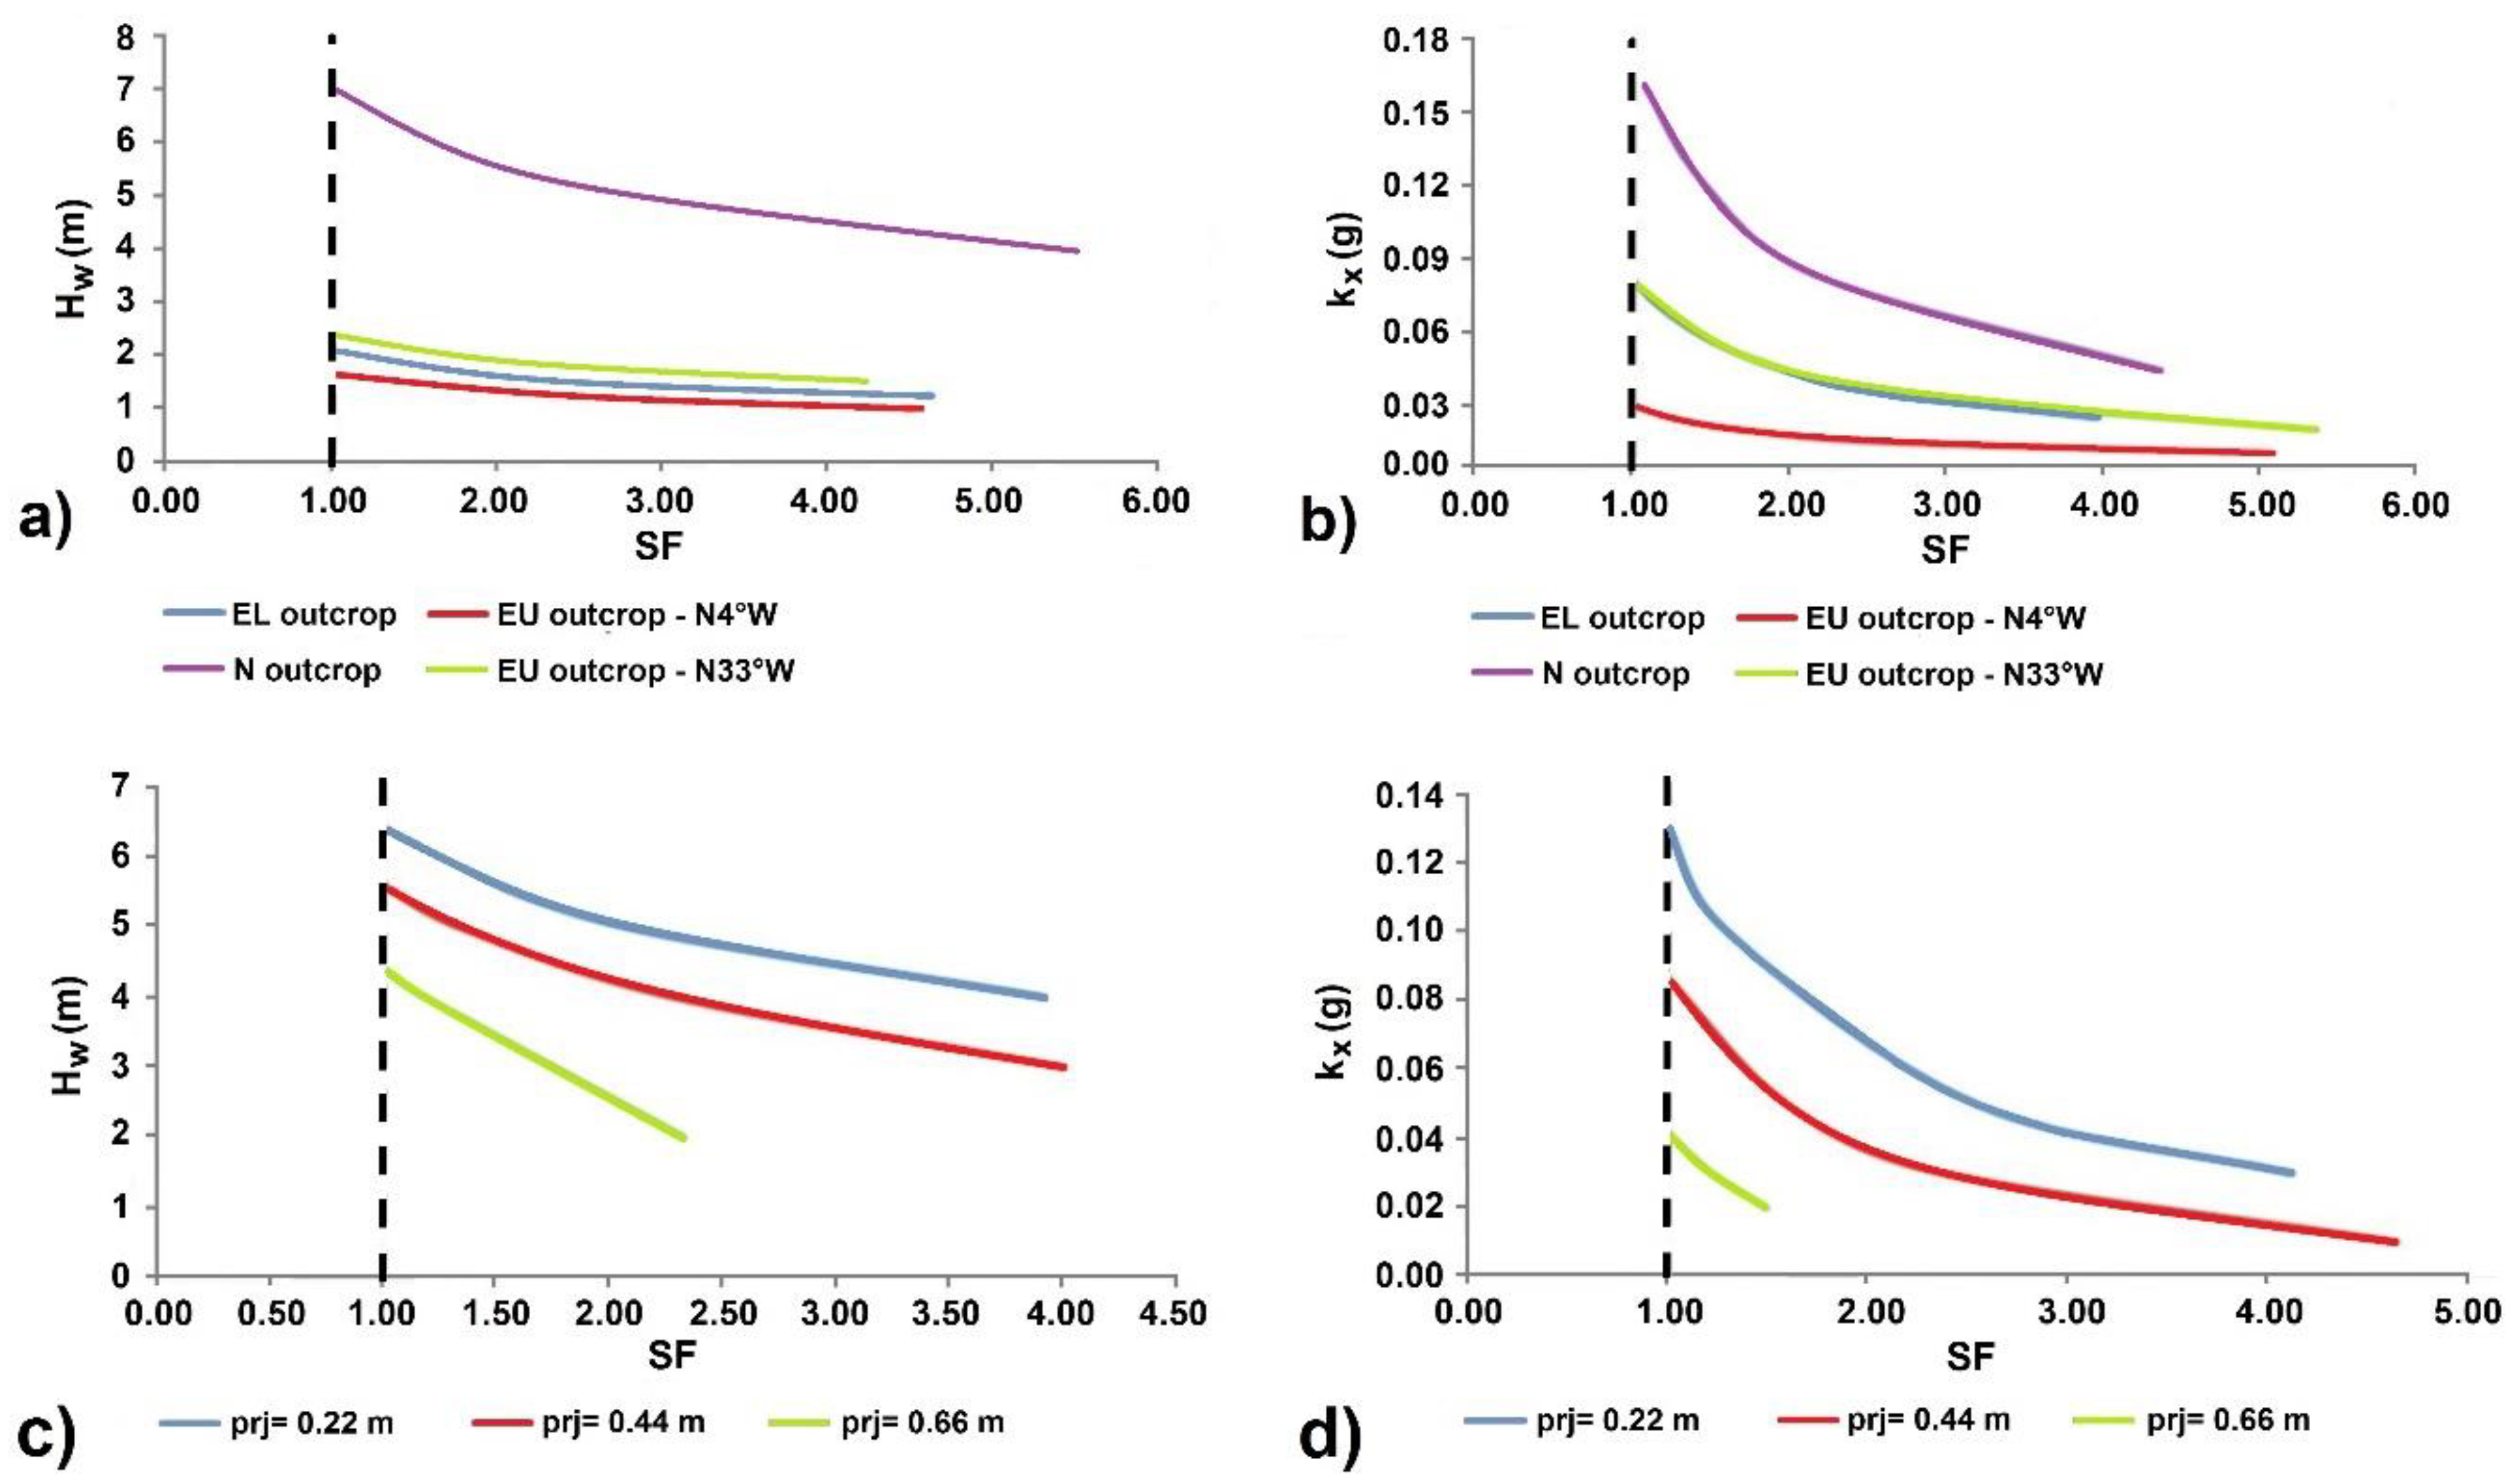
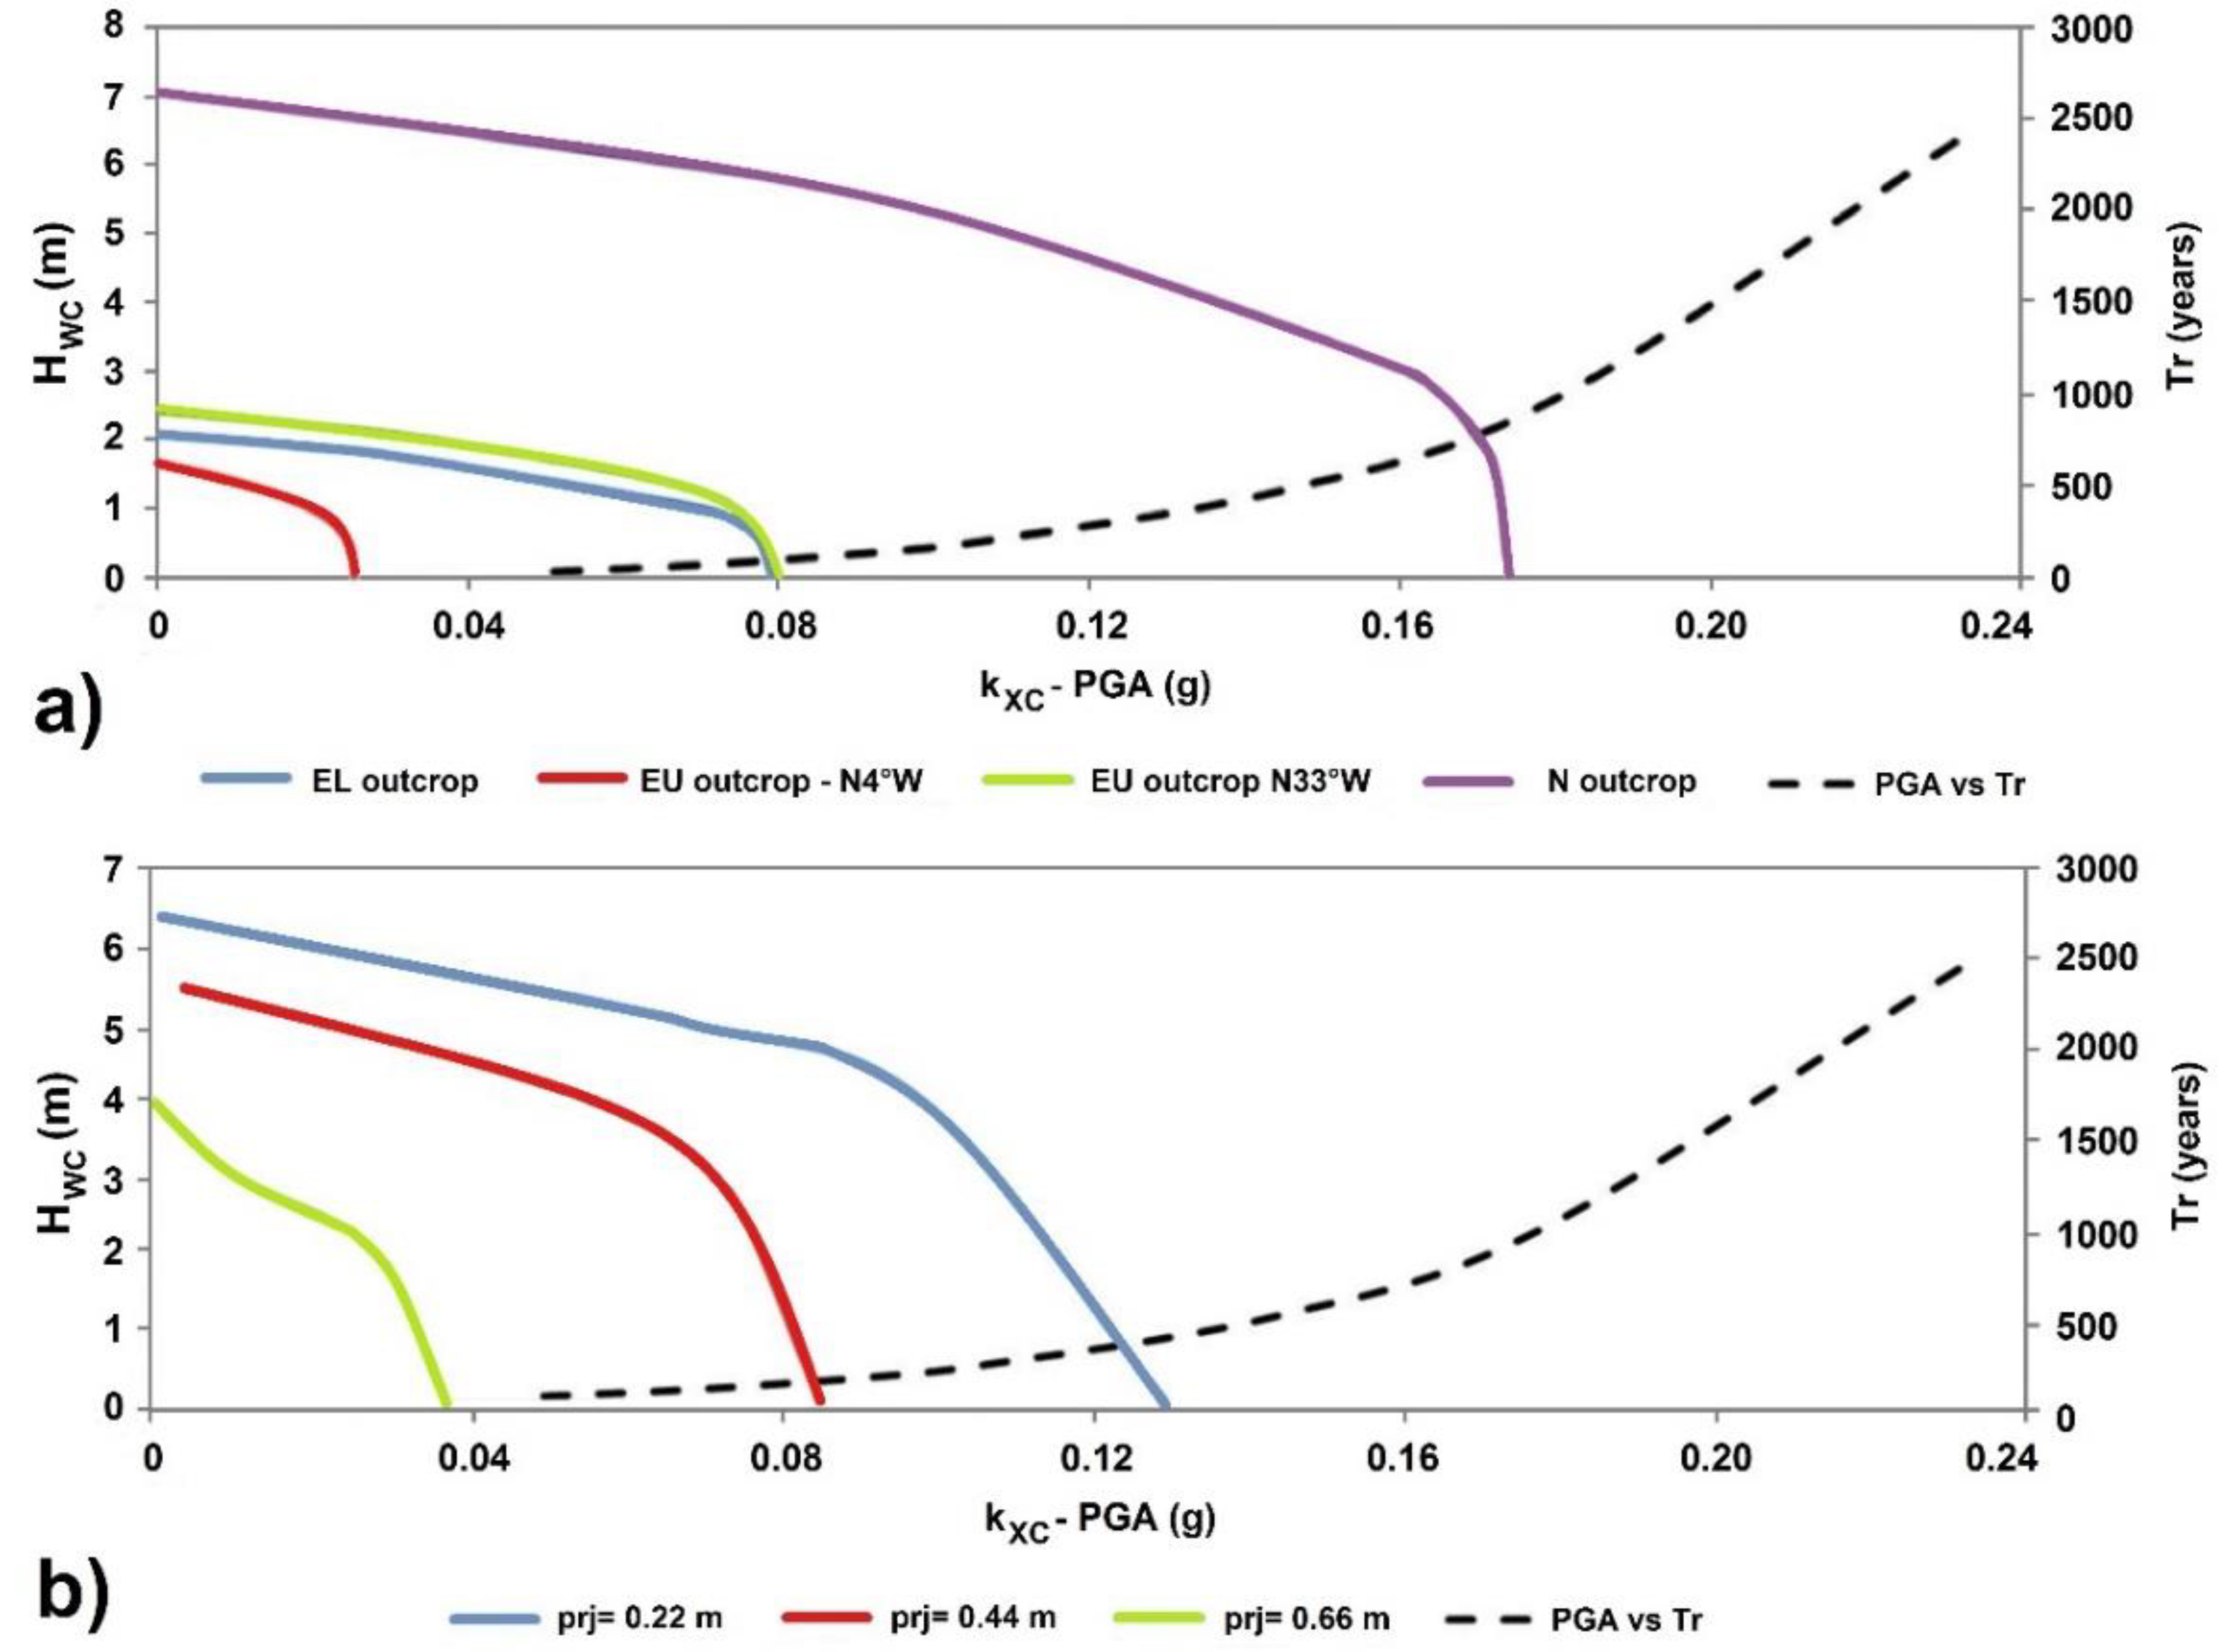
As it results from the derived stability charts, in the case of Sugano the overall stability of the east sector is lower than the north one (
Figure 13a). Furthermore, the northern sector results as more stable also considering projection of the blocks (
Figure 13b).
6. Conclusions
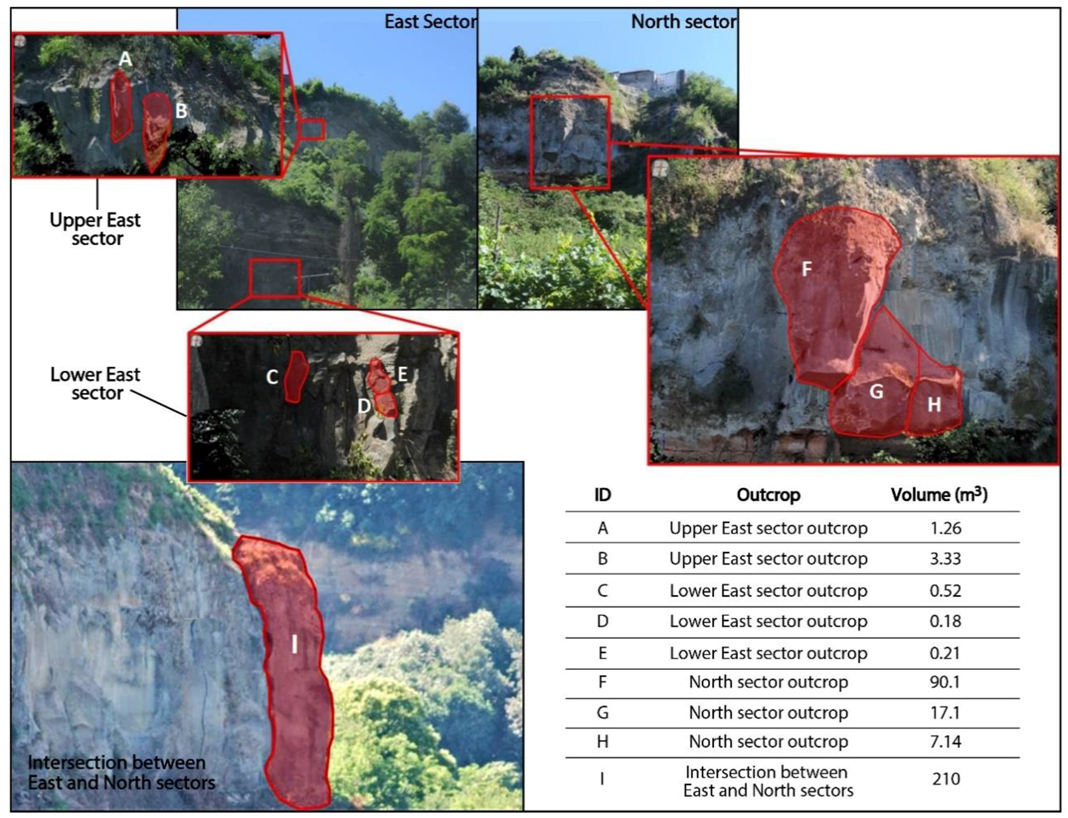
A detailed analysis of the Sugano cliff slope (Central Italy) was performed on the 3D high-resolution point cloud resulting from TLS remote surveys. Both manual (i.e., the interpretation of the 3D model by expert operators) and automatic (through suitable algorithms) analyses have been performed in order to characterize the rock mass through the identification of the main joint sets of the cliff. The identified joint sets tend to form isolate blocks of columnar shape in both eastern and northern sectors of the slope. On the basis of the kinematic compatibility tests, we considered rock toppling as the major gravitational process responsible for the morphological evolution of the Sugano cliff. In this respect, several potentially unstable rock blocks have been identified, whose volumes range from about 0.2 m3 and 90 m3, except for a localized sector where a 210 m3 hazardous block was identified.
We also took into account both seismic actions and water pressure within the joints as potential triggering factors by developing a conceptual chart of the stability conditions. In this respect, the performed parametric analysis indicates that instability conditions can be achieved in most of the outcropping rock mass for realistic triggering scenarios, such as local pseudostatic horizontal acceleration corresponding to return periods of 475 and 2475 years and hydrostatic water pressure induced by realistic temporary groundwater levels.
Despite limitations due to some residual shadow zones in the study area, the activity chain presented in this work can be considered a useful procedure for a preliminary assessment of the general stability conditions of cliff slopes. In this sense, the application of this method can simplify the identification of those sectors more prone to failure even in respect of different realistic triggering scenarios. Such an analysis can then help decision-makers in the management of risk related to the presence of structures built on the hilltops, that often represent (especially in Europe) a unique cultural heritage. In particular, if we consider the expensive maintenance and restoration works that historical buildings in such conditions generally require, detailed analyses on the geomechanical features of the rock mass performed just on those areas considered as critical, can greatly support the design of targeted slope stabilization works, also aimed at guaranteeing the safety of tourists and inhabitants.

 ,
, 


