Twenty Years of ASTER Contributions to Lithologic Mapping and Mineral Exploration


1
Jet Propulsion Laboratory, California Institute of Technology, Pasadena, CA 91104, USA
2
Graduate School of Environmental Studies, Nagoya University, Nagoya 464-8601, Japan
*
Author to whom correspondence should be addressed.
Remote Sens. 2019, 11(11), 1394; https://0-doi-org.brum.beds.ac.uk/10.3390/rs11111394
Submission received: 30 April 2019
/
Revised: 6 June 2019
/
Accepted: 8 June 2019
/
Published: 11 June 2019
(This article belongs to the Special Issue ASTER 20th Anniversary)
Abstract
:The Advanced Spaceborne Thermal Emission and Reflection Radiometer is one of five instruments operating on the National Aeronautics and Space Administration (NASA) Terra platform. Launched in 1999, the Advanced Spaceborne Thermal Emission and Reflection Radiometer (ASTER) has been acquiring optical data for 20 years. ASTER is a joint project between Japan’s Ministry of Economy, Trade and Industry; and U.S. National Aeronautics and Space Administration. Numerous reports of geologic mapping and mineral exploration applications of ASTER data attest to the unique capabilities of the instrument. Until 2000, Landsat was the instrument of choice to provide surface composition information. Its scanners had two broadband short wave infrared (SWIR) bands and a single thermal infrared band. A single SWIR band amalgamated all diagnostic absorption features in the 2–2.5 micron wavelength region into a single band, providing no information on mineral composition. Clays, carbonates, and sulfates could only be detected as a single group. The single thermal infrared (TIR) band provided no information on silicate composition (felsic vs. mafic igneous rocks; quartz content of sedimentary rocks). Since 2000, all of these mineralogical distinctions, and more, could be accomplished due to ASTER’s unique, high spatial resolution multispectral bands: six in the SWIR and five in the TIR. The data have sufficient information to provide good results using the simplest techniques, like band ratios, or more sophisticated analyses, like machine learning. A robust archive of images facilitated use of the data for global exploration and mapping.
1. Introduction
The Advanced Spaceborne Thermal Emission and Reflection Radiometer (ASTER) is one of five instruments on the U.S. Terra spaceborne platform (the other instruments are the Moderate Resolution Imaging Spectroradiometer (MODIS), Clouds and the Earth’s Radiant Energy System (CERES), Multi-angle Imaging SpectroRadiometer (MISR), and Measurement of Pollution in the Troposphere (MOPITT)). Launched in December 1999, ASTER has been continuously acquiring image data for 20 years. ASTER is a joint project between Japan’s Ministry of International Trade and Industry (MITI) (later changed to Ministry of economy, Trade and Industry (METI)) and the U.S. National Aeronautics and Space Administration (NASA). Japanese aerospace companies built the ASTER subsystems for METI; NASA provided the Terra platform and the Atlas 2AS launch vehicle. Both organizations are responsible for instrument calibration, scheduling, data archiving, processing, and distribution.
ASTER was conceived as a geologic mapping instrument. It was designed to provide several improvements over instruments existing at the time, like Landsat. The science team pushed for better spatial resolution, high spectral resolution short wave infrared (SWIR) bands, multispectral thermal infrared (TIR) bands, and along-track stereo capability. Until April 2008, the ASTER subsystems performed nominally. At that time, the SWIR subsystem had a failure of the detector cooling apparatus (not the Stirling cycle cooler), so no further SWIR data could be captured. Since April 2016, all of the ASTER scenes in the data archive, and all of their derived products, were made available to all users at no cost.
As a general-purpose imaging instrument, ASTER-acquired data are used in numerous scientific disciplines, including land use/land cover, urban monitoring, urban heat island studies, wetlands studies, agriculture monitoring, forestry, etc. [1]. Significant resources are devoted to monitoring 1500 active volcanoes and 3000 valley glaciers. However, of special importance is the use of ASTER data for geologic applications: lithologic mapping and mineral exploration.
This article reviews the geologic applications of early spaceborne optical instruments, discusses the history of the ASTER instrument, describes the instrument, and reviews applications of ASTER data for lithologic mapping and mineral exploration
2. Early Geologic Applications of Spaceborne Instruments
The first optical satellite data applied for geologic mapping were acquired by NASA’s Landsat 1 (also known as ERTS (Earth Resources Technology Satellite)) Multispectral Scanner (MSS) with four bands in the visible to near infrared wavelengths (VNIR), and about 80 m spatial resolution, launched in 1972. Several studies demonstrated the usefulness of these data for geologic mapping. An early publication by Goetz and his team in 1975 [2] described mapping the geology of the Coconino Plateau on the south rim of the Grand Canyon in northern Arizona. They were able to distinguish lithologic units and faults, applying the results for ground water exploration. Identification of the composition of sedimentary geologic units was not possible, given the scanner’s broad bands and restricted wavelength position; different mappable units could, however, be separated and mapped. Baker [3] reviewed similar applications in presentations delivered at one of the first geology applications symposia, focusing on additional results using Landsat MSS data.
In 1978 and 1980, two very influential textbooks describing the usage of Landsat 1 for geologic applications alerted the general applications community to the value of remote sensing data. The first of many textbooks describing geologic applications of satellite data was Remote Sensing: Principles and Interpretations written by Floyd Sabins in 1978 [4]. He introduced remote sensing to Chevron, leading to oil discoveries in Sudan and Papua New Guinea. His programs for digitally processing Landsat images discovered world-class Chile copper deposits. A second influential book was Remote Sensing in Geology, edited by Siegal and Gillespie [5] published in 1980. These two books alerted the general geologic community to the possible applications of satellite remote sensing data, and led several resource exploration companies to form their own in-house technical divisions.
In 1982, NASA launched the first in a series of Landsat Thematic Mapper (TM) instruments, on Landsat 4. This groundbreaking scanner had 30 m spatial resolution, repeat global coverage, and seven spectral bands: four in the VNIR like the MSS, two in the SWIR, and one in the TIR [6]. The late addition of SWIR band 7 in the 2–2.5 micron region, was directly the result of studies using aircraft instrument data, demonstrating the application of data from the SWIR region for detecting hydrothermal alteration minerals [7] (a change in mineralogy as a result of interaction of the rock with hot fluids). The Cuprite, Nevada test site, used for this study, became a spectral validation site for most future optical instruments.
A seminal study, detailing a 4-year NASA sponsored project, was the joint NASA and Geosat test case report, published in 1985 [8]. The project was a joint collaboration between NASA and the non-renewable resources exploration industry to test and document the applications of remote sensing data for porphyry copper, uranium, and petroleum exploration. Methods used for data processing were adopted by later researchers and exploration geologists.
For the next 18 years after 1982, Landsat TM data were the workhorse of the geology remote sensing community. A sampling of relevant publications includes geologic mapping and mineral targeting in Precambrian terrain in India [9]; mapping mafic and ultramafic rocks in the Oman Ophiolite, and targeting hydrothermal alteration zones related to possible massive sulfide copper deposits [10] (band 7 data were crucial for detecting hydrothermal alteration); mapping ophiolite lithologies in Cyprus, and delineation of a critical lithologic boundary to target possible massive sulfide deposits (all TM bands were needed to distinguish two types of lava flows [11]). Several geologic mapping studies in the Arabian Shield and Middle East focused on mineral exploration for uranium, gold, copper, and other metal deposits [12,13]; again, the availability of SWIR data was critical to detect hydrothermal alteration. In 1999, Sabins [14] published a comprehensive review of the application of remote sensing data for mineral exploration. Following on the heels of his earlier book on remote sensing applications to geology, this publication was key in influencing exploration companies to further embrace remote sensing technology in their reconnaissance exploration strategies.
A fascinating application of Landsat 5 TM data for geobotanical mapping was reported by Almeida et al. [15]. Their goal was to detect geobotanical anomalies associated with hydrothermal alteration in epithermal high-sulfidation gold deposits in the Amazon region in an area of virgin tropical rain forest, Brazil. Their method was to concentrate information and reduce data dimensionality by applying spectral indices, principal component analyses to the indices, another principal component analysis to the original VNIR and SWIR bands, and convolutional filtering. Field information showed a near-perfect spatial correlation between color classes highlighted in this Landsat image product and hydrothermal alteration facies identified in outcrops.
In 1992, NASDA/MITI/STA (National Space Development Agency/Science and Technology Agency) launched the Japanese Earth Resources Satellite (JERS-1) with a synthetic aperture radar instrument, and a high resolution optical scanner (OPS) with eight bands. In addition to three VNIR bands, OPS had four SWIR bands. The instrument was designed to provide remote sensing data to Japan’s resource exploration industry to search globally for non-renewable resources. The instrument had a 75 km swath width, and about 25 m spatial resolution [16]. The SWIR band performance was fairly poor, with excessive noise (the VNIR and SAR bands performed well). In one report [17], advanced image processing techniques were applied to the SWIR data. When combined with Landsat TM data for a test site in Eritrea, JERS-1 data permitted routine identification of marbles, and allowed distinction of rocks bearing either Al-OH or Mg-OH phyllosilicates. In 1998, JERS-1 ceased operations, with very few geologic studies reported. However, it did provide the foundation for the next generation Japanese instrument, by demonstrating the value of multispectral SWIR bands for geologic applications. As a result, ASTER came into being, as described in the following sections.
3. ASTER History
ASTER has its roots in several moderate resolution imaging sensors [18]. The Landsat instruments (Multispectral Scanner, and Thematic Mapper) had developed a large and devoted user community adapted to analyzing multispectral data. The second most used data was provided by the French SPOT (Satellite Pour l’Observation de la Terre) instruments, with 10–20 m VNIR wavelength data, and cross-track stereo. Between 1992 and 1998, the JERS-1 OPS acquired three bands of VNIR data, four bands of SWIR data, and along-track stereo data.
The Earth Observing System (EOS) ASTER program began as two separate instruments proposed separately by the U.S. and Japan [19] in the 1980s. The US had a proposal for the Thermal Infrared Ground Emission Radiometer (TIGER), a 14 channel imager plus a profiling spectrometer. At the same time Japan’s MITI was designing and proposed the Intermediate Thermal Infrared Radiometer (ITIR) with five SWIR bands and four TIR bands [20,21] as a follow-on to JERS-1. Once again, the design of the Japanese instrument focused on geologic applications. Starting in 1989, the joint U.S. and Japan science team worked jointly to come up with a compromise design for a VNIR-SWIR-TIR instrument to go on NASA’s EOS AM-1 platform (re-named Terra after launch). The number of TIR bands was increased to five; the number of SWIR bands was increased to six; spatial resolution was decided; VNIR band 3 was selected for the along-track stereo; and bandpasses of all the channels were determined. In December 1999, ASTER was launched on NASA’s Terra spacecraft, along with four other Earth observing instruments.
4. ASTER Instrument
The ASTER instrument comprises three separate scanners, located on different sites on the Terra platform (Figure 1). Each was built by a different Japanese aerospace company.
In accordance with the scientific objectives of the mission, the ASTER instrument was designed to meet certain baseline performance requirements. In addition, several specific improvements were included to better ASTER’s performance compared to existing optical sensors such as Landsat TM, SPOT HRV and JERS OPS:
- increased number of SWIR bands to six to improve mapping of surface composition;
- increased number of TIR bands to five to derive accurate surface temperature and emissivity measurements [22];
- improved radiometric accuracy and resolution [23].
- increased base-to-height (b/h) ratio of the stereo data, from 0.3 to 0.6, to improve surface elevation determination
ASTER acquires swaths of images that are 60 km wide, while orbiting the earth at 705 km altitude, in a sun-synchronous near-polar descending orbit. The equatorial crossing time is 10:30 am, a few minutes behind Landsat 7. ASTER (on the Terra platform) flew in formation with NASA’s EO-1 satellite and Argentina’s SAC-C satellite to form the morning constellation. ASTER must be tasked to acquire data; however, because the instrument has been in operation for almost 20 years, near-global coverage of the land has been achieved (Appendix A).
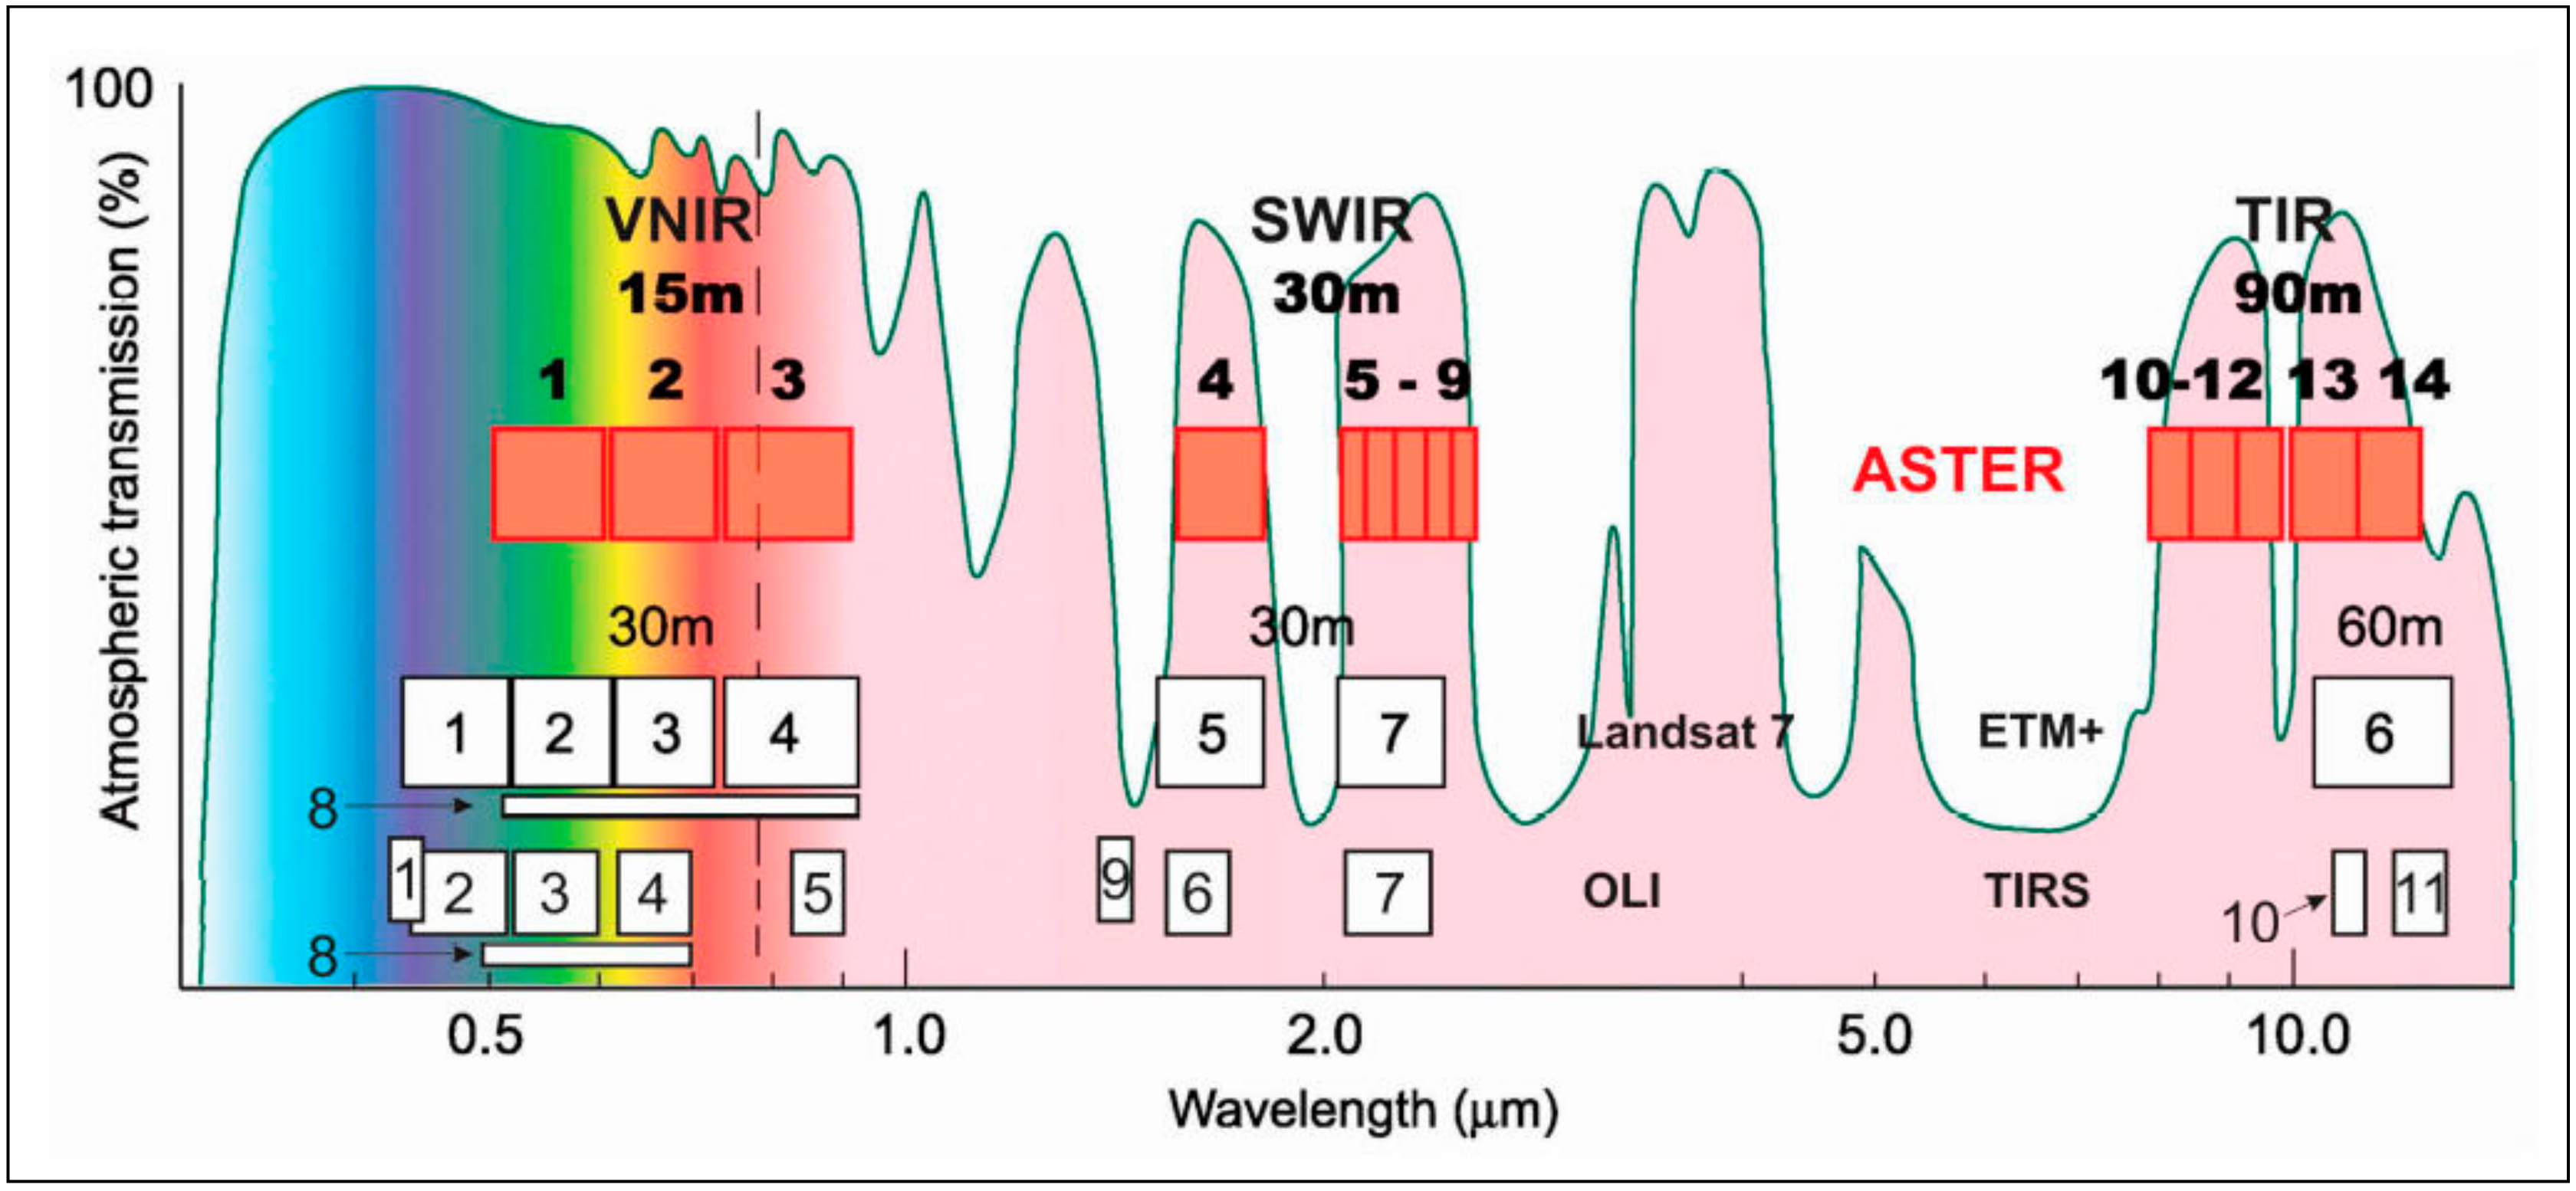
The three VNIR bands, with 15 m spatial resolution, have bandpasses similar to Landsat TM bands 2, 3, and 4 and the optical sensor of the JERS-1 OPS (Figure 2). In addition, the VNIR has along-track stereo coverage in band 3, with nadir and backward-looking telescopes. The base-to-height ratio of 0.6 allows calculation of Digital Elevation Models with 30 m postings, and about 15 m vertical accuracy [24]. The SWIR bands, with 30 m spatial resolution, were chosen mainly for the purpose of surface soil and mineral mapping. Band 4 is similar to TM band 5 located at 1.6 µm; bands 5–9 are narrow SWIR bands, replacing TM’s single band 7, positioned in the 2–2.5 µm region to detect the presence of mineral absorption features, such as occur in clays, carbonates, and sulfates (Figure 2). The TIR bands, with 90 m spatial resolution, provide two major improvements over TM’s single TIR band: derivation of emissivity values allows estimation of silica content, which is important in characterizing silicate rocks, the most prevalent rocks at the earth’s surface [25]; and by correcting for emissivity, accurate surface kinetic temperature can be determined for energy flux modeling and climate modeling. Thus, ASTER data have greater mineral and lithologic mapping capability than Landsat data due to more SWIR and TIR bands with corresponding higher spectral resolution (Figure 2).
5. Lithologic Mapping with ASTER Data
5.1. Mapping Using Only ASTER Data
In 2003, Rowan and Mars were one of the first researchers to report on lithologic mapping using ASTER data, over the rare earth mineral deposit at Mountain Pass, California [26]. Using all 14 ASTER bands, they were able to distinguish calcite from dolomite, mapped skarn deposits and marble in the contact metamorphic zones, distinguished Fe-muscovite from Al-muscovite in the granites and gneisses, and discriminated quartzose rocks. None of these discriminations could be accomplished with Landsat TM data, due to the lack of multispectral SWIR and TIR spectral bands. Watts and Harris [27] applied this method to map granite and gneiss in domes in the Himalayas. Yamaguchi and Naito [28] developed spectral indices using orthogonal transformation with ASTER SWIR bands for lithologic mapping. Their method relied on band ratios and thresholding. Wherever there were good rock exposures, ASTER data produced good results. Analyzing all of the ASTER spectral bands, Byrnes et al. [29] mapped volcanic lava flows from the Maunu Ulu eruption, Island of Hawaii. The TIR data highlighted variations in the silica coatings, the VNIR and SWIR bands indicated relative ages of the flows as they developed surface weathering products. Gomez et al. [30] published a paper describing lithologic mapping in arid Namibia using ASTER’s VNIR and SWIR bands. They first converted the data to apparent reflectance, then processed the data with principal components analysis and supervised classification. Comparison with an existing 1:250,000 scale geologic map indicated that the ASTER data could be used to discriminate most of the geologic units. Several additional units were found, based on compositional differences, though the geologic map defined them as belonging to the same stratigraphic unit. Kargel et al. [31] reviewed applications of ASTER data for glaciological studies. The data were used to distinguish differences in surface cover on top of glaciers, as well as the extent of glacial lakes.
One of the first applications of ASTER TIR data for lithologic mapping was published by Ninomiya et al. [32]. They developed mineralogical indices using blended ratios of the TIR bands to create a Quartz Index, Carbonate Index, and Mafic Index; then tested their technique over arid parts of northwest China, eastern central Australia, and southern Tibet. Their results demonstrated the stability of the mineral indices to temperature and atmospheric changes. In succeeding years, many projects used Ninomiya “indices” for lithologic mapping with ASTER TIR data. More quantitative analyses of ASTER TIR data were reported by Hook et al. [33], who determined weight percent silica in igneous rocks, and validated the findings with laboratory measurements of field samples.
About the same time, Rowan et al. [34] reported on lithologic mapping of ultramafic rocks with ASTER data in Mordor Pound, NT, Australia. Analysis of the data, coupled with lab measurements, showed dominantly Al-OH and ferric-iron VNIR–SWIR absorption features in felsic rock spectra, and ferrous-iron and Fe,Mg-OH features in the mafic–ultramafic rock spectra. ASTER ratio images, matched-filter, and spectral-angle mapper processing were evaluated for mapping the lithologies. Combining analyses of VNIR, SWIR and TIR data resulted in discrimination of four mafic–ultramafic categories; three categories of alluvial–colluvial deposits; and a significantly more completely mapped quartzite unit than could be accomplished by using either data set alone. Hewson et al. [35] described a method to seamlessly mosaic 35 ASTER scenes to produce a regional mosaic for analysis. They then mapped Al-OH and carbonate from SWIR data, and quartz content from TIR data. SWIR bands were also used to map Al-OH composition. Comparison with large-scale maps and airborne hyperspectral data, supplemented with field sampling, constrained the ASTER map accuracy.
Qiu et al. [36] compared several spectral classification techniques, using a laboratory spectral library, ground spectral measurements, or selecting endmembers from the image. In the Allaqi-Heiani suture, Egypt, they found all three methods fairly similar, and allowed successful mapping of the well-exposed lithologies. Mapping carbonates and associated rocks in Oman was published by Rajendran et al. [37] and Rajendran and Nasir [38]. They were able to separate the ophiolitic rocks, carbonates, quartz-rich silicates, and surficial deposits. The remote sensing maps were very similar to the published geologic maps, and they recommended using ASTER data for mapping in other, similar environments. Guha et al. [39] also mapped carbonates, using ASTER data for the Kolkhan limestone in India. They applied different spectral mapping techniques; the results were similar with each of them. In the region near Askja volcano, Iceland, Grattinger et al. [40] used ASTER data to map glaciovolcanic deposits, including glaciovolcanic tuffs and subaerial pumice. The results were applied to paleo-ice reconstruction in a relatively inaccessible area. Tayebi et al. [41] mapped salt diapirs and surrounding areas using neural network models in the Zagros fold belt, Iran. Field observations and X-ray diffraction analysis of field samples confirmed the minerals identified remotely.
Yajima and Yamaguchi [42] used simple color composites of TIR data to separate mafic-ultramafic rocks (such as gabbro, dolerite and dunite) from various quartz-rich felsic rocks (such as granite and alluvium). This is a simple method to display lithological information from the TIR bands. Ninomiya and Fu [43] applied Ninomiya indices (Quartz Index, Mafic Index, and Carbonate Index) for ASTER TIR data to do lithological mapping in Tibet. Mapping relied on classification of quartzose rocks based on variations on the carbonate and mafic indices, and the granitic rocks based on the feldspar content. Ozyavas [44] applied standard image processing techniques to ASTER data over the study area around the Salt Lake Fault, Turkey. They were able to map gypsum and carbonate rocks, primarily based on spectral differences in the SWIR bands. A variation of the band ratio method was described by Askari et al. [45] for lithologic mapping of sedimentary rocks, north Iran. Using VNIR and SWIR bands, they mapped quartz, carbonate, Al, Fe, Mg-OH bearing minerals, and created lithologic maps that matched well with existing geology maps. Hubbard et al. [46] used ASTER TIR emissivity images to characterize the physiochemical characteristics of sand dunes at seven different sites. They found that “… less dense minerals typically have higher abundances near the center of the active and most evolved dunes in the field, while more dense minerals and glasses appear to be more abundant along the margins of the active dune fields.” ASTER data were applied to characterize limestones for industrial rock resource assessment in Oman by Rajendran et al. [47]. They were able to separate dolomite from calcite-bearing marble; this has a direct application in the industrial rock business.
Several studies focused on mapping granitoid rocks. Massironi et al. [48], working in the Saghro massif, Morocco, used all the ASTER bands, applying simple processing techniques. They were able to distinguish different granitoid rocks with similar silica content based on secondary minerals, and separate plutons with varying silica content using TIR data. Bertoldi et al. [49] used field and laboratory data to guide processing of ASTER data to map lichen-covered granitic rocks in the western Himalayas. Their maps were based on characterizing spectral differences from various lichens, with spectral characteristics of muscovite. In the Dahab Basin, Egypt, Omran et al. [50] used band ratios of ASTER VNIR, SWIR, and TIR data, combined with field investigations, to map and separate granitoid rocks of Cambrian and Cretaceous ages. They revised and updated existing geologic maps by adding rock units and re-interpreting the geologic history. Zheng and Fu [51] used band ratios of ASTER SWIR and TIR data to separate alkali-feldspar granite, granite, granodiorite, and monzogranite. These distinctions relied on determination of silica difference expressed in the TIR bands. In the Anti-Atlas Mountains, Morocco, El Janati et al. [52] used classification algorithms to map the spatial distribution of porphyritic granites, granodiorites, and peraluminous leucogranites. They also were able to map different kinds of metamorphic rocks and carbonate cover rocks. Guha and Kumar [53] developed a variation of Ninomiya’s thermal indices to map granitoids in Dharwar Craton, India. They found that their mafic index was comparable with Ninomiya’s index, but their quartz index was better, for their study area. Asran et al. [54] used band ratios of ASTER data to separate granodiorite, monzogranite, syenogranite, and alkali-feldspar granite. Mapping their distribution, with structural information and microfabric data, led to revised interpretation of their deformation history.
Another group of reports described applications of ASTER data for mapping ophiolite complexes. These unusual terranes expose dominantly mafic and ultramafic rocks. ASTER data have been shown to be particularly effective in separating the dark rocks. Li et al. [55] mapped the Derni ophiolite complex using spectral matching methods with spectra from a spectral library. Their results were of mixed accuracy, dependent on the quality of their spectral library. Using similar methods, Huang and Zhang [56] were more successful in mapping various rock types, in the Yarlung-Zangpo suture zone, Tibet. They used both the VNIR-SWIR data, and TIR data to achieve their results. In the Neyruz ophiolite, Iran, Tangestani et al. [57] used field and laboratory spectral measurements to train supervised classification of ASTER data with spectral feature fitting algorithm. Results suggested that this method could be applied to map other, more poorly mapped, ophiolite complexes. Ozkan et al. [58] mapped an accretionary complex in Turkey using hybrid color composite images combining ratio images and principal components images. They were able to delineate peridotite, gabbro, basalt, epi-ophiolitic sedimentary rocks, siliceous and carbonate rocks, and degrees of serpentinization.
5.2. Lithologic Mapping with ASTER and Other Remote Sensing Data
Deller and Andrews [59] combined Landsat, ASTER, and Advanced Land Imager (ALI) data to discriminate three laterite facies in Eritrea and Arabia, based on differences of iron and clay minerals. The results can be used to assess ground water quality, agricultural land, building resources, and potential mineralization sites. Qari et al. [60] used Landsat data to identify lineaments, and ASTER data to map lithology of the basement rocks in an area of Saudi Arabia. The resulting 1:100,000 geologic map was validated by fieldwork. Lithologic mapping in the Sighan ophiolite complex, Iran, was the subject of work by Pournamdari et al. [61]. They used band ratios and principal components analysis to separate mafic and ultramafic rocks. In the Neyriz ophiolite, Iran, Eslami et al. [62] also applied ASTER and Landsat data for lithologic mapping, using similar techniques. In North Africa, Adiri et al. [63] combined Landsat and ASTER data to map sedimentary rocks in Morocco. Lamri et al. [64] combined airborne magnetic and gamma-ray spectrometry data with ASTER data to map geology in a hardly accessible area in Saharan Africa. Integration of the two data sets allowed mapping of the Paleozoic and aeolian sand sedimentary cover, and the underlying granitoids. In West Africa, Metelka et al. [65] analyzed ASTER, Landsat, Radarsat, and Japanese Phased Array type L-band Synthetic Aperture Radar (PALSAR) radar data, combined with airborne gamma-ray spectrometry, to map geomorphological landform units. The resulting maps, over an area of long-term lateritic weathering history, were more accurate than existing maps. Yang et al. [66] combined ASTER data with high spatial resolution Chinese GaoFen-1 data to map lithologic units in the Tien Shan mountains, China. In comparison with lithologic mapping results using ASTER data alone, the fused data set was more accurate. Ge at al. [67] combined ASTER data with Sentinel-2A and digital elevation data to map lithologies in the Shinbanjing Ophiolite Complex, Mongolia. They found their method yielded high classification accuracy.
Hassan et al. [68] combined analyses of Landsat and ASTER data to map the basement rocks associated with the Meatiq dime, Egypt. ASTER data analysis revealed four granitic varieties, and Landsat data analysis allowed regional geologic mapping. Ali-Bik et al. [69] used data from ASTER, Landsat, and Sentinel-2 to map gneiss complex, low-grade ophiolitic and island-arc assemblages in the Gebel Zabarra area, Egypt. They used ASTER mineral indices, principal components analysis, and color composites to map the different rock types. They were able to propose revised metamorphic and tectonic history for the area based on the remote sensing results. Hadigeh and Ranjbar [70] combined ASTER data with panchromatic Indian Remote Sensing (IRS) data (moderate to high spatial resolution VNIR data) to map lithologies in Iran. Their classification maps closely matched published geologic maps. By combining ASTER data with SPOT-5 data, Lohrer et al. [71] mapped weathered wadi deposits in Jordan. They found that the initial transformation from hematite to goethite is the dominant process, and it is possible to predict new archaeological areas using remote sensing techniques. Over the Newer Volcanic Province, Australia, Boyce et al. [72] used ASTER data, airborne magnetic data, digital elevation models, and Google Earth images to identify eruptive centers. Seven previously identified eruptive centers were brought into question, and three new ones were identified.
Soltaninejad et al. [73] compared ASTER data and Landsat data for mapping evaporite minerals of Sirjan Playa, Iran. They used both spectra from field samples, and endmember spectra to classify both sets of images. Classification accuracy was about 92% for both data sets; better accuracy was achieved using image derived spectra. Chen et al. [74] mapped variations in metamorphic rocks in the Wuliangshan Mountains, China. They looked for spectral differences from minerals such as actinolite, chlorite, epidote, biotite, muscovite, hornblende, and sillimanite. Identification of metamorphic rocks in five mapped areas were consistent with existing data. Two new areas of unmapped metamorphic rocks were identified for further field study. In a vegetated area in the Yanshan Mountains, China, Wang et al. [75] used ASTER data to classify quartz sandstone, carbonate rocks, gneiss and andesite. Compared to the outcrop geologic map, accuracies were 90%, 87%, 77%, and 52% respectively. This is excellent, considering the presence of vegetation contamination and cover. A final example, published in this 20th Anniversary ASTER Special Issue, by Kurata and Yamaguchi [76] proposed a method of combining and visualizing multiple lithological indices derived from ASTER data, and topographical information derived from digital elevation model data, in a single color image that can be easily interpreted from a geological point of view. Indices highlighted silicate rocks, carbonate rocks, and amounts and types of clay minerals. Results were verified by field survey and comparison with previous studies in the test area.
6. Mineral Exploration with ASTER Data
6.1. Technique Development for Alteration Mapping
Many studies focused on developing techniques to extract mineralogical information from ASTER data. Crosta et al. [77] applied principal components analysis to data over epithermal deposits in Patagonia. The method was adopted by many later users and is referred as the “Crosta” method. Galvao et al. [78] demonstrated that ASTER data could be useful for alteration detection even in tropical savannah environments where there was some surface material showing between the vegetation cover. More image processing technique development by Moore et al. [79] applied principal components analysis and matched filter processing to identify unknown targets based on training sets over known deposits. Data from ASTER’s thermal infrared bands were used by Rockwell and Hofstra [80] to identify quartz and carbonate minerals in Nevada based on detection of emissivity features in the TIR region. ASTER’s unique multispectral TIR bands particularly allow mapping of SiO2 variation, often a key characteristic of alteration associated with mineralization. Hosseinjani and Tangestani [81] used sub-pixel unmixing to determine the relative proportions of different minerals within each pixel. This technique relies on having a laboratory of mineral spectral responses, or end-member spectra extracted from the data. Another application of principal components analysis by Honarmand et al. [82] combined this with spectral angle mapper [83] to determine the probability of a mineral being present in a pixel.
In Birjand, Iran, Abdi and Karimpour [84] also applied spectral angle mapper to ASTER data to discriminate hydrothermal alteration. Spectral feature fitting method was used in Rabor area, Iran, to enhance hydrothermal alteration by Abbaszadeh and Hezarkhani [85]. This method compares the fit of image spectra to reference spectra using a least-squares technique. Additionally, in Iran, in the Dehaj-Sarduiyeh Copper Belt, Zadeh et al. [86] used mixture tuned matched filtering approach to map alteration. This method estimates the relative degree of match to each reference spectrum, and estimates the sub-pixel abundance [87]. More sophisticated (complicated) image processing methods were reported by Tayebi et al. [88]. They integrated coded spectral ratio images with SOM neural network models. Results were acceptable, though the method is transportable to other areas, and able to be used by other researchers, with great difficulty. Continued interest in application of sub-pixel unmixing was published by Modaberri et al. [89] for areas in Iran. They sought to map the usual assortment of alteration minerals, including alunite and jarosite.
6.2. General Alteration Mapping
In one of the first studies to appear, Rowan et al. [90] used ASTER data to map hydrothermal alteration minerals and zones at the Cuprite, Nevada test site. The work verified earlier results obtained with airborne scanners, and validated the mineralogical information extractable from the ASTER VNIR, SWIR, and TIR data. Numerous subsequent studies used newly-developed image processing techniques (described in the previous section) for alteration mapping. Bhadra et al. [91] reported on their analysis of ASTER data for mineral potential mapping in central Rajasthan, India, using standard image processing classification methods. In Jiafushaersu Area, China, Liu et al. [92] used color composites and principal components to map alteration associated with molybdenum mineralization adjacent to granitoid intrusions. Popov and Bakardjiev [93] used band ratios and spectral angle mapper analyses to identify alteration minerals in a humid and vegetated area. Known deposits with pits and tailings ponds were found. Several other possible, unknown targets were identified. In the Gobi Desert area, China, Son et al. [94] used band ratios to characterize a known Cu-Au mineral deposit. Using the indicator mineral assemblage, they identified a new area with pervasive argillic alteration. Two test sites in India, exposing intrusive and volcanic rocks, were sampled by Canbaz et al. [95] for material to analyze in the laboratory, using XRD (X-ray diffraction) and spectrometer measurements. They used the lab measurements to help interpret ASTER ratio and principal components images, and found that the combination of lab and remote sensing data were effective in mapping argillic alteration zones. In a highly vegetated area in India, Mahanta and Maiti [96] used band ratios and principal components analysis of ASTER data to map alteration assemblages: iron-rich gossans, sericitization, ferruginization, and chloritization. They identified two potential mineral prospects, one for hydrothermal polymetallic sulfides, and secondary iron and manganese mineralization. In Egypt, band ratios and principal components analysis were used by Abdelkareem and El-Baz [97] to identify hydrothermal alteration zones. Spectral analyses allowed characterization of chlorite, kaolinite, muscovite, and hematite. Validation by field investigations and XRD analyses contributed to the delineation of important prospects for gold and massive sulfide mineralization.
In another example, ASTER data were even used for lithological and alteration mapping in Antarctica. Pour et al. [98] reported work in the Oscar II coast area, northeastern Graham Land, Antarctic Peninsula. They applied special band ratios and band combinations with all 14 ASTER bands to detect muscovite, kaolinite, illite, montmorillonite, epidote, chlorite, and biotite. In their three-scene strip area, good geologic maps existed for the central scene, providing some control. However, poor or no maps existed for the northern and southern areas. Despite shadows, snow, and glaciers, they concluded that their approach for lithological and alteration mapping was highly successful.
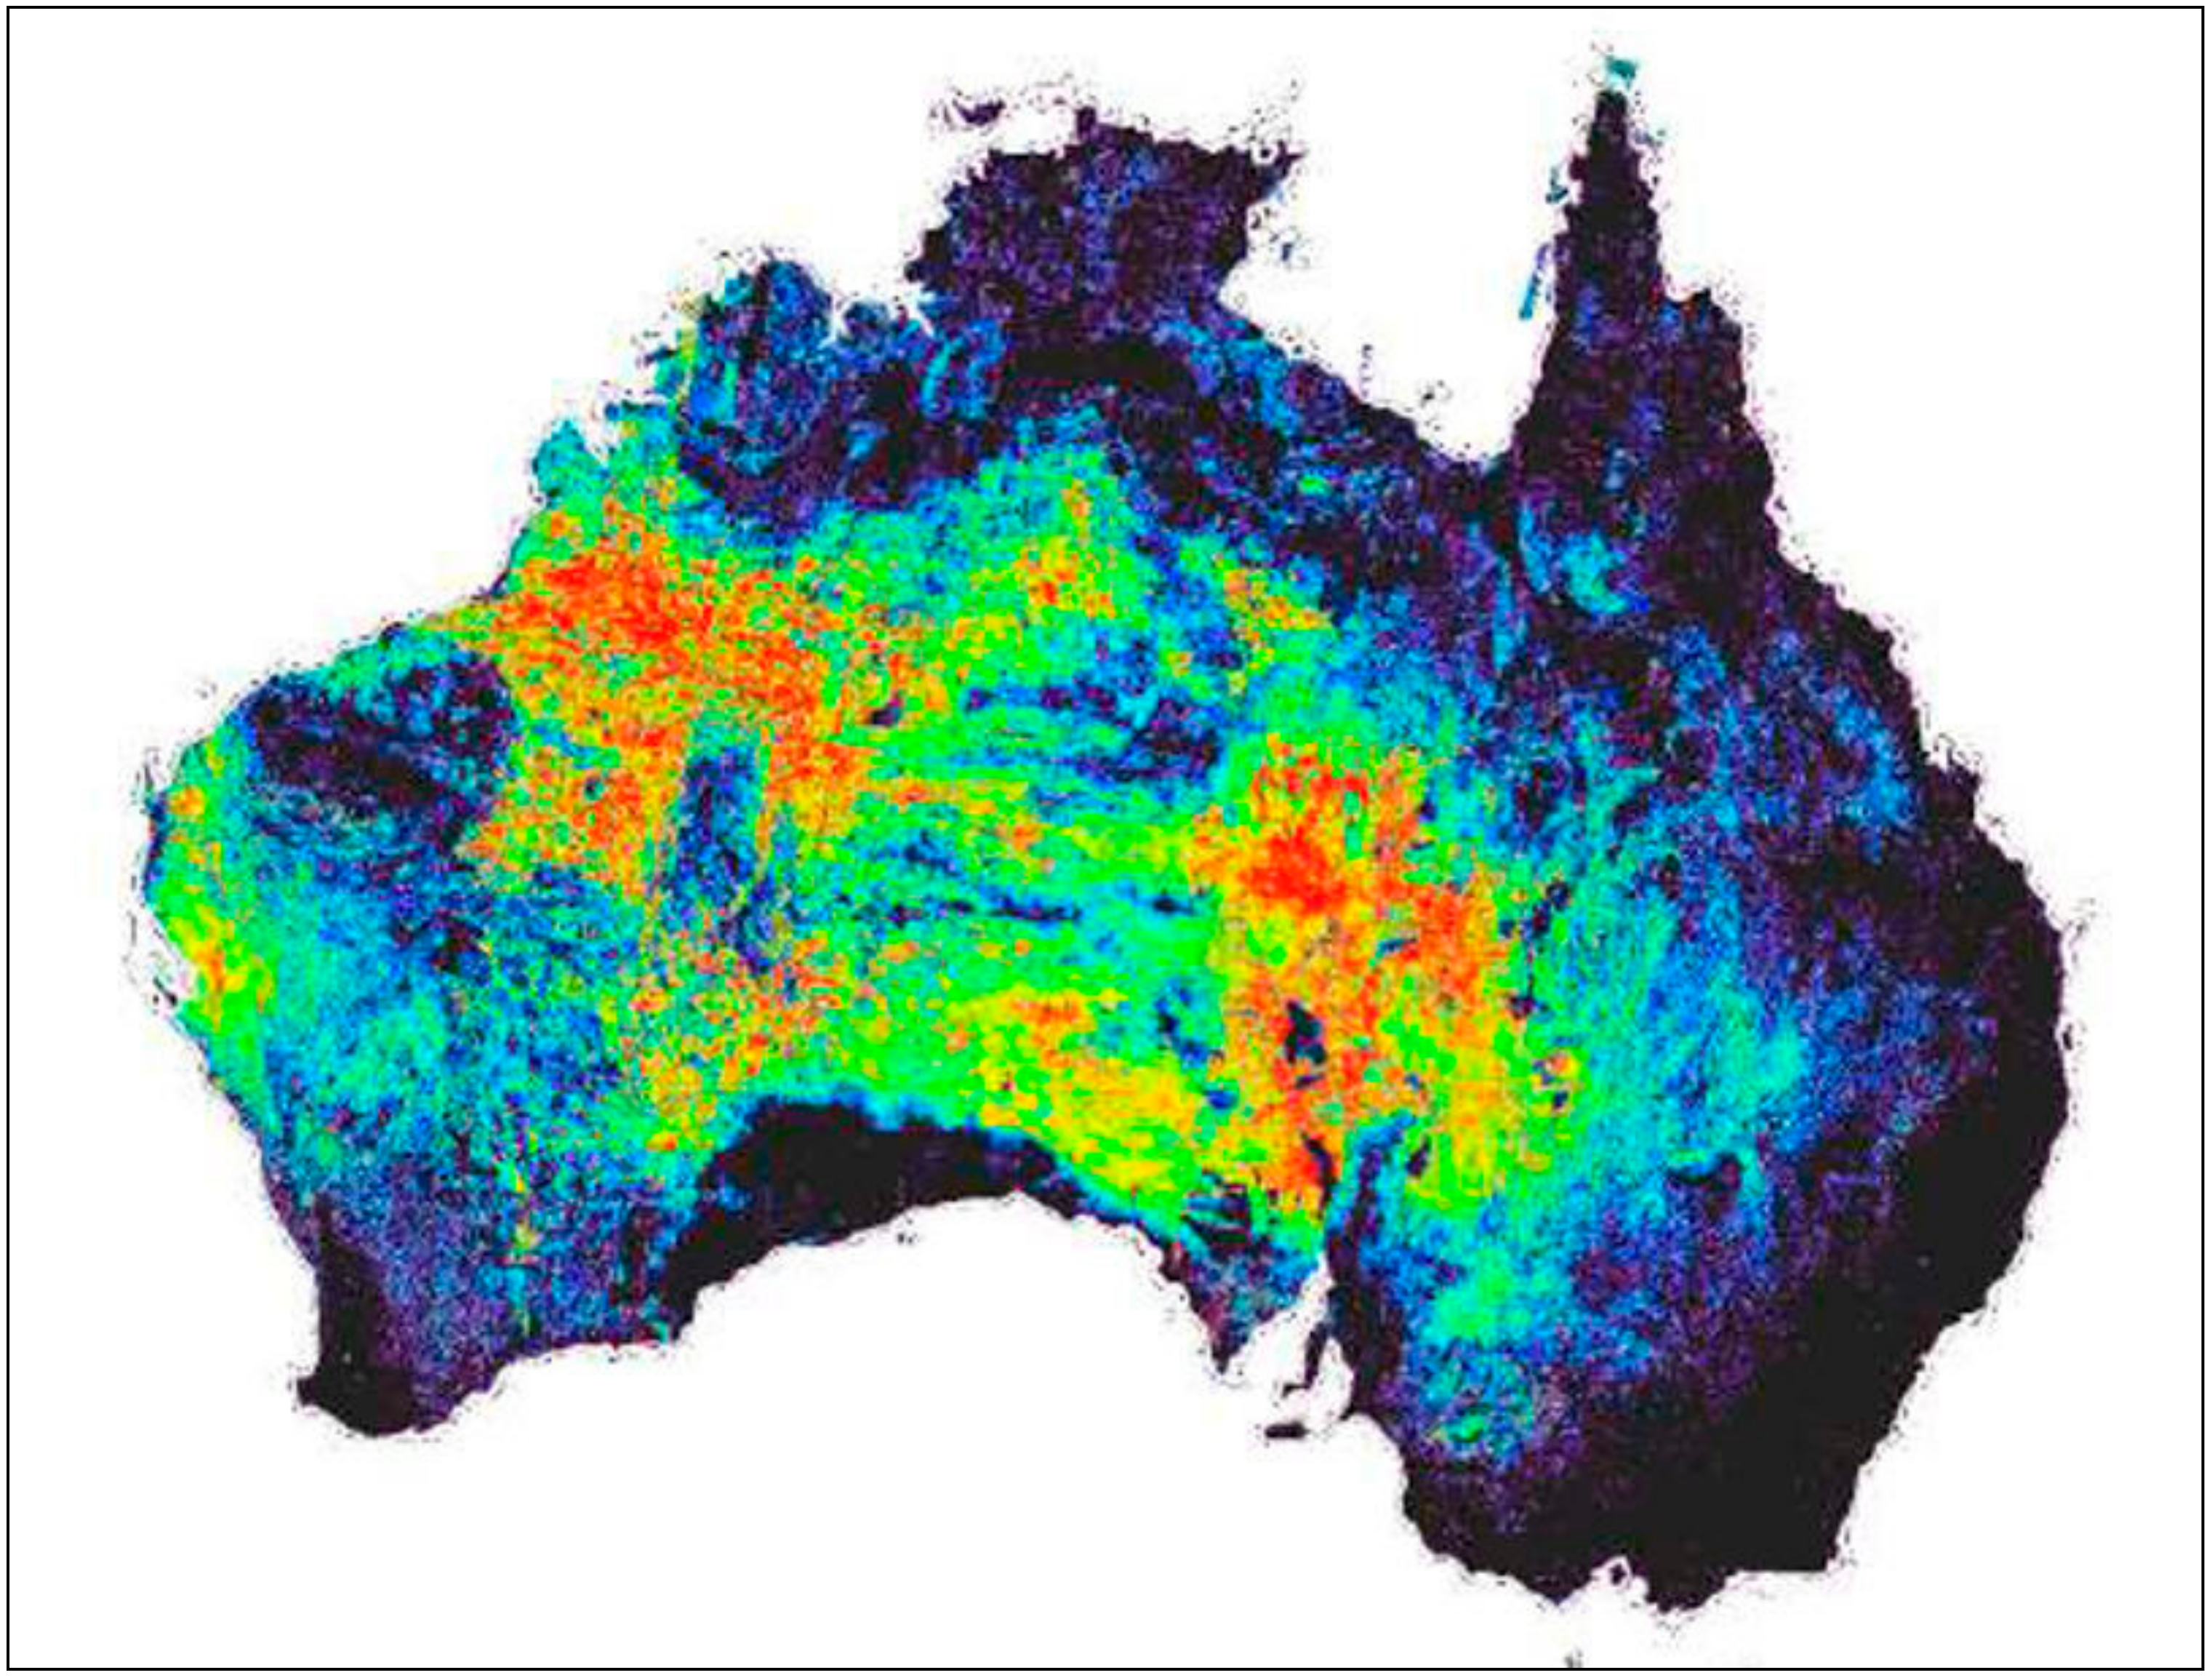
In 2012, Australia’s Commonwealth Scientific and Industrial Research Organization (CSIRO) released a series of Geoscience mineral maps for the continent of Australia, described by Cudahy [99]. These maps were created from thousands of ASTER scenes, acquired between 2000 and 2008. The CSIRO maps are the first (and only) continental-scale mineral maps generated from an imaging satellite, designed to measure clays, quartz, and other minerals. There are 17 Australia Geoscience products, such as kaolinite abundance, iron oxide species, and quartz content. Each product is a calibrated index of the geoscience product it represents. Color-coded displays are a visualization of the product’s values. Their 100 m spatial resolution allows them to be used at the deposit as well as the regional scale. An example of the iron oxide abundance map is shown in Figure 3.
More recent publications attest to the continuing use of ASTER data for mineral exploration. Testa et al. [100] described their work on the eastern flank of the Andean Cordillera, Argentina to do lithologic and hydrothermal alteration mapping of epithermal, porphyry, and tourmaline breccia districts. Argillic, phyllic, propylitic, and silicic alteration mineral assemblages were identified and mapped from the ASTER images. The results from field control areas confirmed the presence of the targeted minerals. They concluded “ASTER image processing of large areas has the ability to effectively discriminate smaller targets where it is possible to find mineral deposits. We believe it is critical to understand that interpreted hydrothermal alteration zones may not be real, so field verification is essential.”
6.3. Alteration Mapping with ASTER Data and Other Data Sources
A few years after launch, geologists starting using ASTER data in combination with other remote sensing data and geophysical data for alteration mapping. An early study by Hubbard et al. [101] compared alteration mapping with ASTER, Hyperion, and ALI data in the VNIR and SWIR regions. Hyperion’s hyperspectral data provided more information about mineralogy than either ASTER or ALI. However, the 7.5 km swath width was a distinct limitation. In Greenland, Bedini [102] used aircraft HyMap data with ASTER data to detect alteration minerals (HyMap has 128 bands in the 0.4–2.45 µm region and 5 m spatial resolution). Results and conclusions were similar to the previous study. In the Kerman magmatic arc in Iran, Honarmand et al. [103] used ASTER and ALI data to map alteration. Since ALI has broad spectral bands, similar to Landsat, very little additional information was added to the ASTER data. In another project Pour and Hashim [104] used ASTER, ALI, and Hyperion data for both lithologic and alteration mapping. Hyperion added additional mineralogical separation information, but ALI added very little to the ASTER data. Similarly, in a project reported by Ramos et al. [105] in the Andes, Hyperion data supplemented ASTER data for alteration mineral mapping, but was limited by its spatial coverage. In Gabal Dara, Egypt, Gemail et al. [106] used airborne magnetic geophysical data to complement mineralogical information from ASTER data for mineral exploration. The geophysical data added lithologic characteristics not available from optical remote sensing data. In Australia, most of the country is covered with weathered regolith, making exploration challenging. Lampinen et al. [107] used ASTER SWIR data with surface geochemistry analysis and gamma-ray spectrometry over a known base-metal deposit. The geophysical data allowed discrimination of lithologic units underneath the regolith. This guided interpretation of the geochemical and ASTER spectral information. Two recent studies over sites in China described combined use of ASTER data with other, seldom-reported, remote sensing instruments. Liu et al. [108] combined information from the Chinese hyperspectral scanner on the Tiangong-1 space station, with ASTER data for regional alteration mapping in the Jintanzi-Malianquan area. The hyperspectral instrument allowed detection of muscovite, kaolinite, chlorite, epidote calcite and dolomite, while ASTER data allowed detection of the first five, not dolomite. Hu et al. [109] combined ASTER data with Sentinel-2A multispectral data and Hyperion data. The image processing results were validated by field investigations. Identified hydrothermally altered rocks corresponded with five porphyry copper deposits. By extrapolation, three new prospects were discovered as a result.
6.4. ASTER Data Applied to Porphyry Copper Exploration
As early as 2003, a report was published by Volesky et al. [110] describing use of ASTER data to characterize massive sulfide copper deposits in Saudi Arabia. ASTER’s SWIR data were crucial to characterize hydrothermal alteration minerals associated with these deposits.
Starting about the same time, and continuing to the present, studies in Iran dominate the literature on porphyry copper deposits, characterized by analysis of ASTER data. There are several reasons for this: (1) Iran hosts the largest number of porphyry copper deposits yet found; (2) the deposits are located in arid, desert landscapes: vegetation cover is minimal, exposures of the surface are almost 100%; (3) a wide range of alteration minerals are present, as erosion has cut into different depths of individual porphyry copper systems, exposing alteration zones from potassic and phyllic to propylitic and argillic.
One type of report concentrated on characterizing existing, known deposits in Iran. Karimpour et al. [111] described discrimination of erosion levels in the Maherabad, Shadan, and Chah Shaljami areas. Mohebi et al. [112] reported on delineation of structural controls on alteration and mineralization around Hanza Mountain. Sojdehee et al. [113] described discriminating hydrothermal alteration zones using SWIR data at the Daralu copper deposit. Farahbanksh [114] combined ASTER data with QuickBird data to characterize the Naysian porphyry copper deposit. Yousefi et al. [115,116] discriminated alteration zones using SWIR and TIR data to map sericitic, phyllic, and quartz-rich alteration zones in the Kerman Magmatic Arc. Safari et al. [117] combined Landsat and ASTER data to characterize the Shar-e-Babak deposit. In every one of these studies, the unique mineralogical information contained in the ASTER SWIR bands was critical to detect and map hydrothermal alteration zones.
A second type of report on the Iranian copper deposits focused on using ASTER data as an exploration tool to identify promising targets, usually extracting information gleaned by analyzing known deposits, then extrapolating to poorly explored or unexplored areas. The use of ASTER SWIR data featured strongly in Pour and Hashim’s [118,119] in the Urumieh-Dokhtar Volcanic Belt. Applying a porphyry copper formation model, that postulated concentric alteration zones with characteristic mineral assemblages, promising targets were identified. Honarpazhouh [120] combined stream sediment geochemistry with ASTER data for reconnaissance mapping in the Khatun Abad area. This was a more effective exploration strategy than using the remote sensing data alone. Pazand et al. [121] applied ASTER data for reconnaissance exploration for porphyry copper mineralization in the Ahar area. In the Daraloo-Sarmeshk area, Alimohammadi et al. [122] used ASTER data to explore for undetected copper deposits using ASTER SWIR data to highlight alteration zones. Similar projects were reported by Yazdi et al. [123] in the Chahargonbad area, by Saadat [124] in the Feyz-Abad area, and by Zadeh and Honarmand [125] in the Dehaj-Sarduiyeh copper belt.
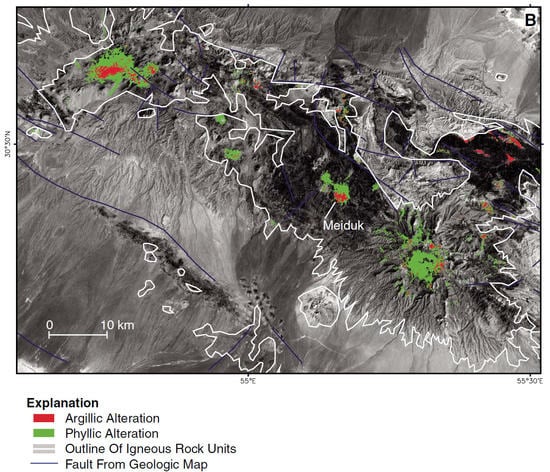
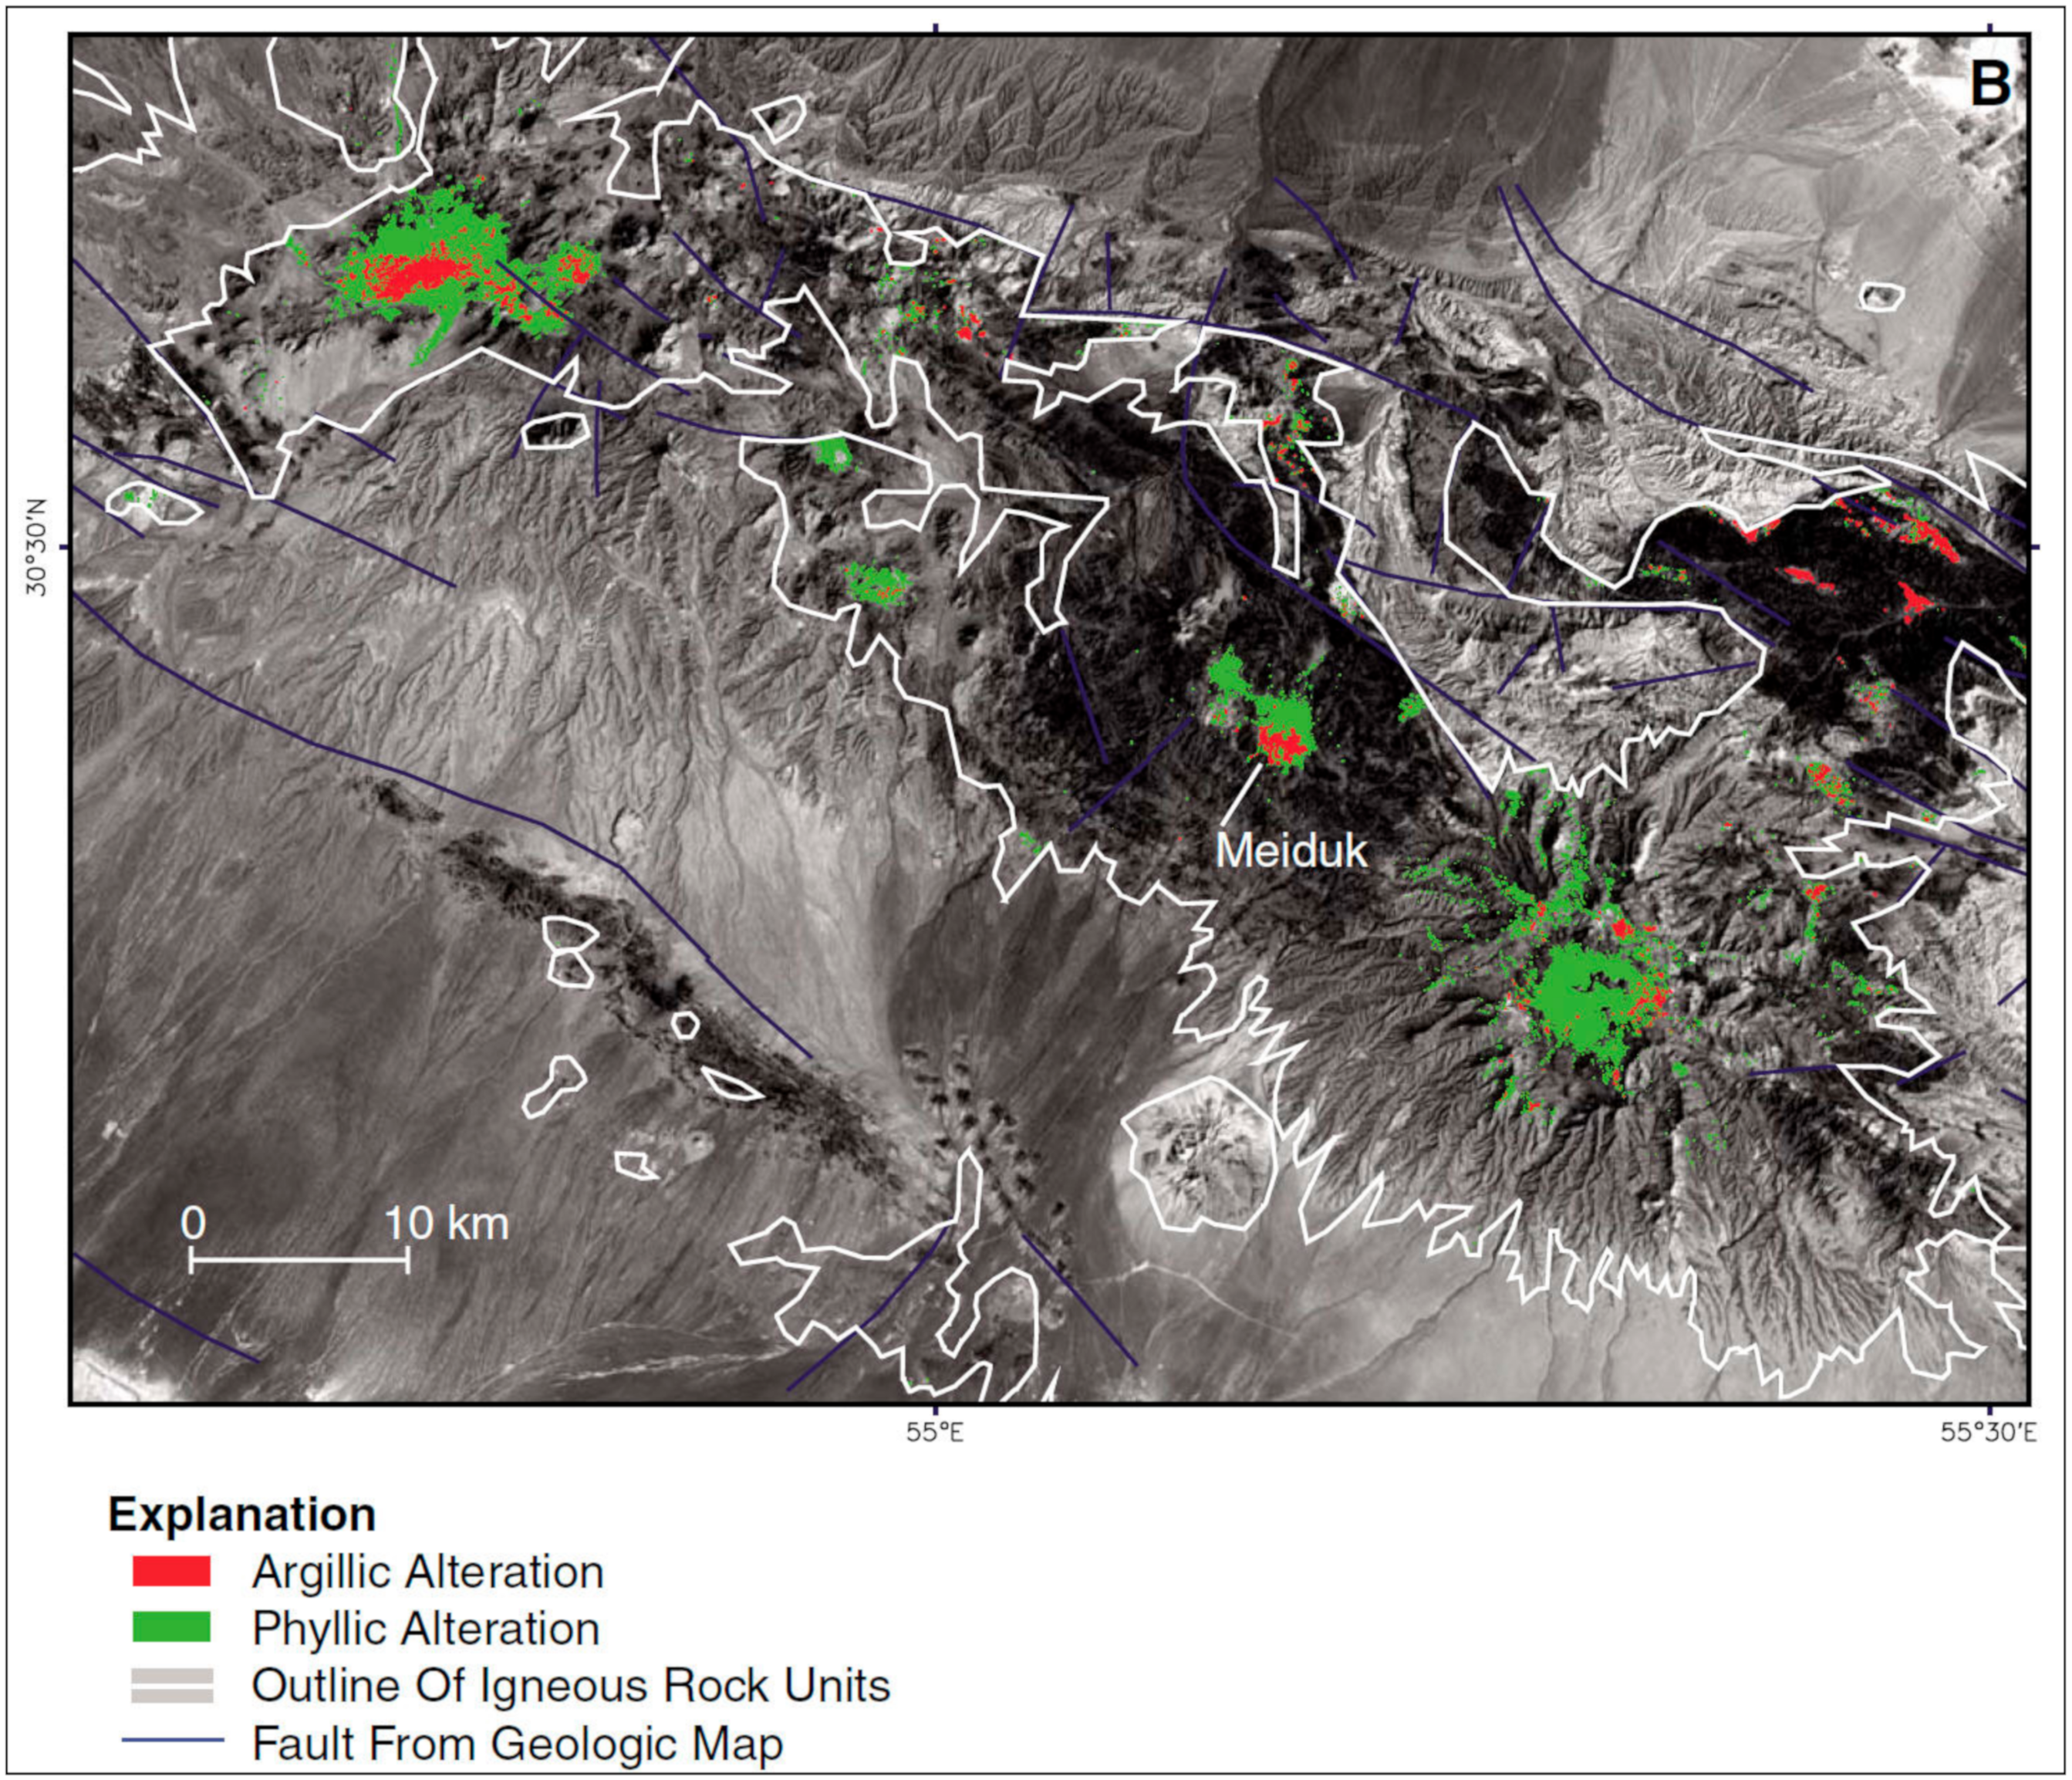
One of the best applications of ASTER data for regional mineral exploration in a copper belt was published by Mars and Rowan in 2006 [126]. They mosaicked 62 ASTER scenes covering a 900 km-wide belt in the Zagros magmatic arc, Iran. They first developed a series of logical operators involving band ratios and thresholds of ASTER data to highlight the presence of spectral absorption features associated with phyllic and argillic alteration. The operators were tested over the Cuprite, Nevada calibration and validation site [7], before being applied to the Iran data. Based on the alteration patterns, ~50 potential porphyry coper deposits were mapped northwest of the Zagros-Makran transform zone, and 11 potential deposits were mapped southeast of the transform. A small part of the mapped area is shown in Figure 4, around the Meiduk copper mine. Note the two large alteration centers northwest and southeast of the mine.
Studies focused on other areas of the world include Carrino et al.’s [127] project in the Chapi Chiara area of southern Peru. They used ASTER data to map the geology and alteration mineralogy of the region to define possible copper targets. Ibrahim et al. [128] applied ASTER and Landsat data, with field data in the North Hamisana shear zone, Egypt, to detect structural and lithologic controls for base metal sulfide deposits. By combining information extracted from ASTER and Landsat data, Zhang et al. [129] mapped hydrothermal alteration minerals around the Duolong copper deposit in Tibet. Rajendran and Nasir [130] characterized the spectral response of ASTER bands to map alteration zones of volcanogenic massive sulfide deposits in several known deposits. Additional work in China, by Zhang and Zhou [131] over the Baogutu porphyry copper deposit, used ASTER data to identify the associated alteration zones. This information could be used to explore other nearby areas with similar geology. In the Bangonghu-Nujiang metallogenic belt, Tibet, Dai et al. [132] used alteration detection from ASTER data to define new target areas with characteristic spectral features related to desired mineralogical assemblages.
6.5. ASTER Data Applied to Gold Exploration
Second in numbers to reports on applications of ASTER data for porphyry copper exploration, are publications describing exploration for gold. The largest number of studies focused on describing alteration associated with gold deposits, and developing methods to identify new targets in Egypt. The mineralogical information provided in the ASTER SWIR bands provided the unique tool to successfully detect and map different intensities of hydrothermal alteration, in the same way as was done for porphyry copper exploration. Egypt is an arid, desert environment, with near 100% surface rock and soil exposures; ideal for application of optical remote sensing data.
Amer et al. [133] used ASTER data to detect gold-related alteration in the Um Rus area. Salem et al. [134] combined geologic mapping and alteration mapping with ASTER data to identify new exploration targets at the Barramiya District. Mapping alteration associated with potential gold deposits at Wadi Allaqi was published by Salem and Soliman [135]. Hasan et al. [136] combined spectral analysis of ASTER data with aeromagnetic data to identify promising gold exploration targets in the Eastern Desert. The two data sets provided complementary information on rock types and mineralogy, allowing a fuller picture to be created of promising areas. By combining ASTER spectral analysis with geochemical data from surface-collected samples, Salem et al. [137] were able to validate alteration zones detected on the remote sensing data, and strengthen the association of ASTER-defined targets with potential gold deposits. Abdelnasser [138] and Salem et al. [139], in separate studies, reported similar ASTER-plus-geochemistry studies at the Atud gold deposit and the Samut area, respectively. By establishing a physical tie between alteration and gold occurrence, an exploration strategy using only remote sensing data was formulated.
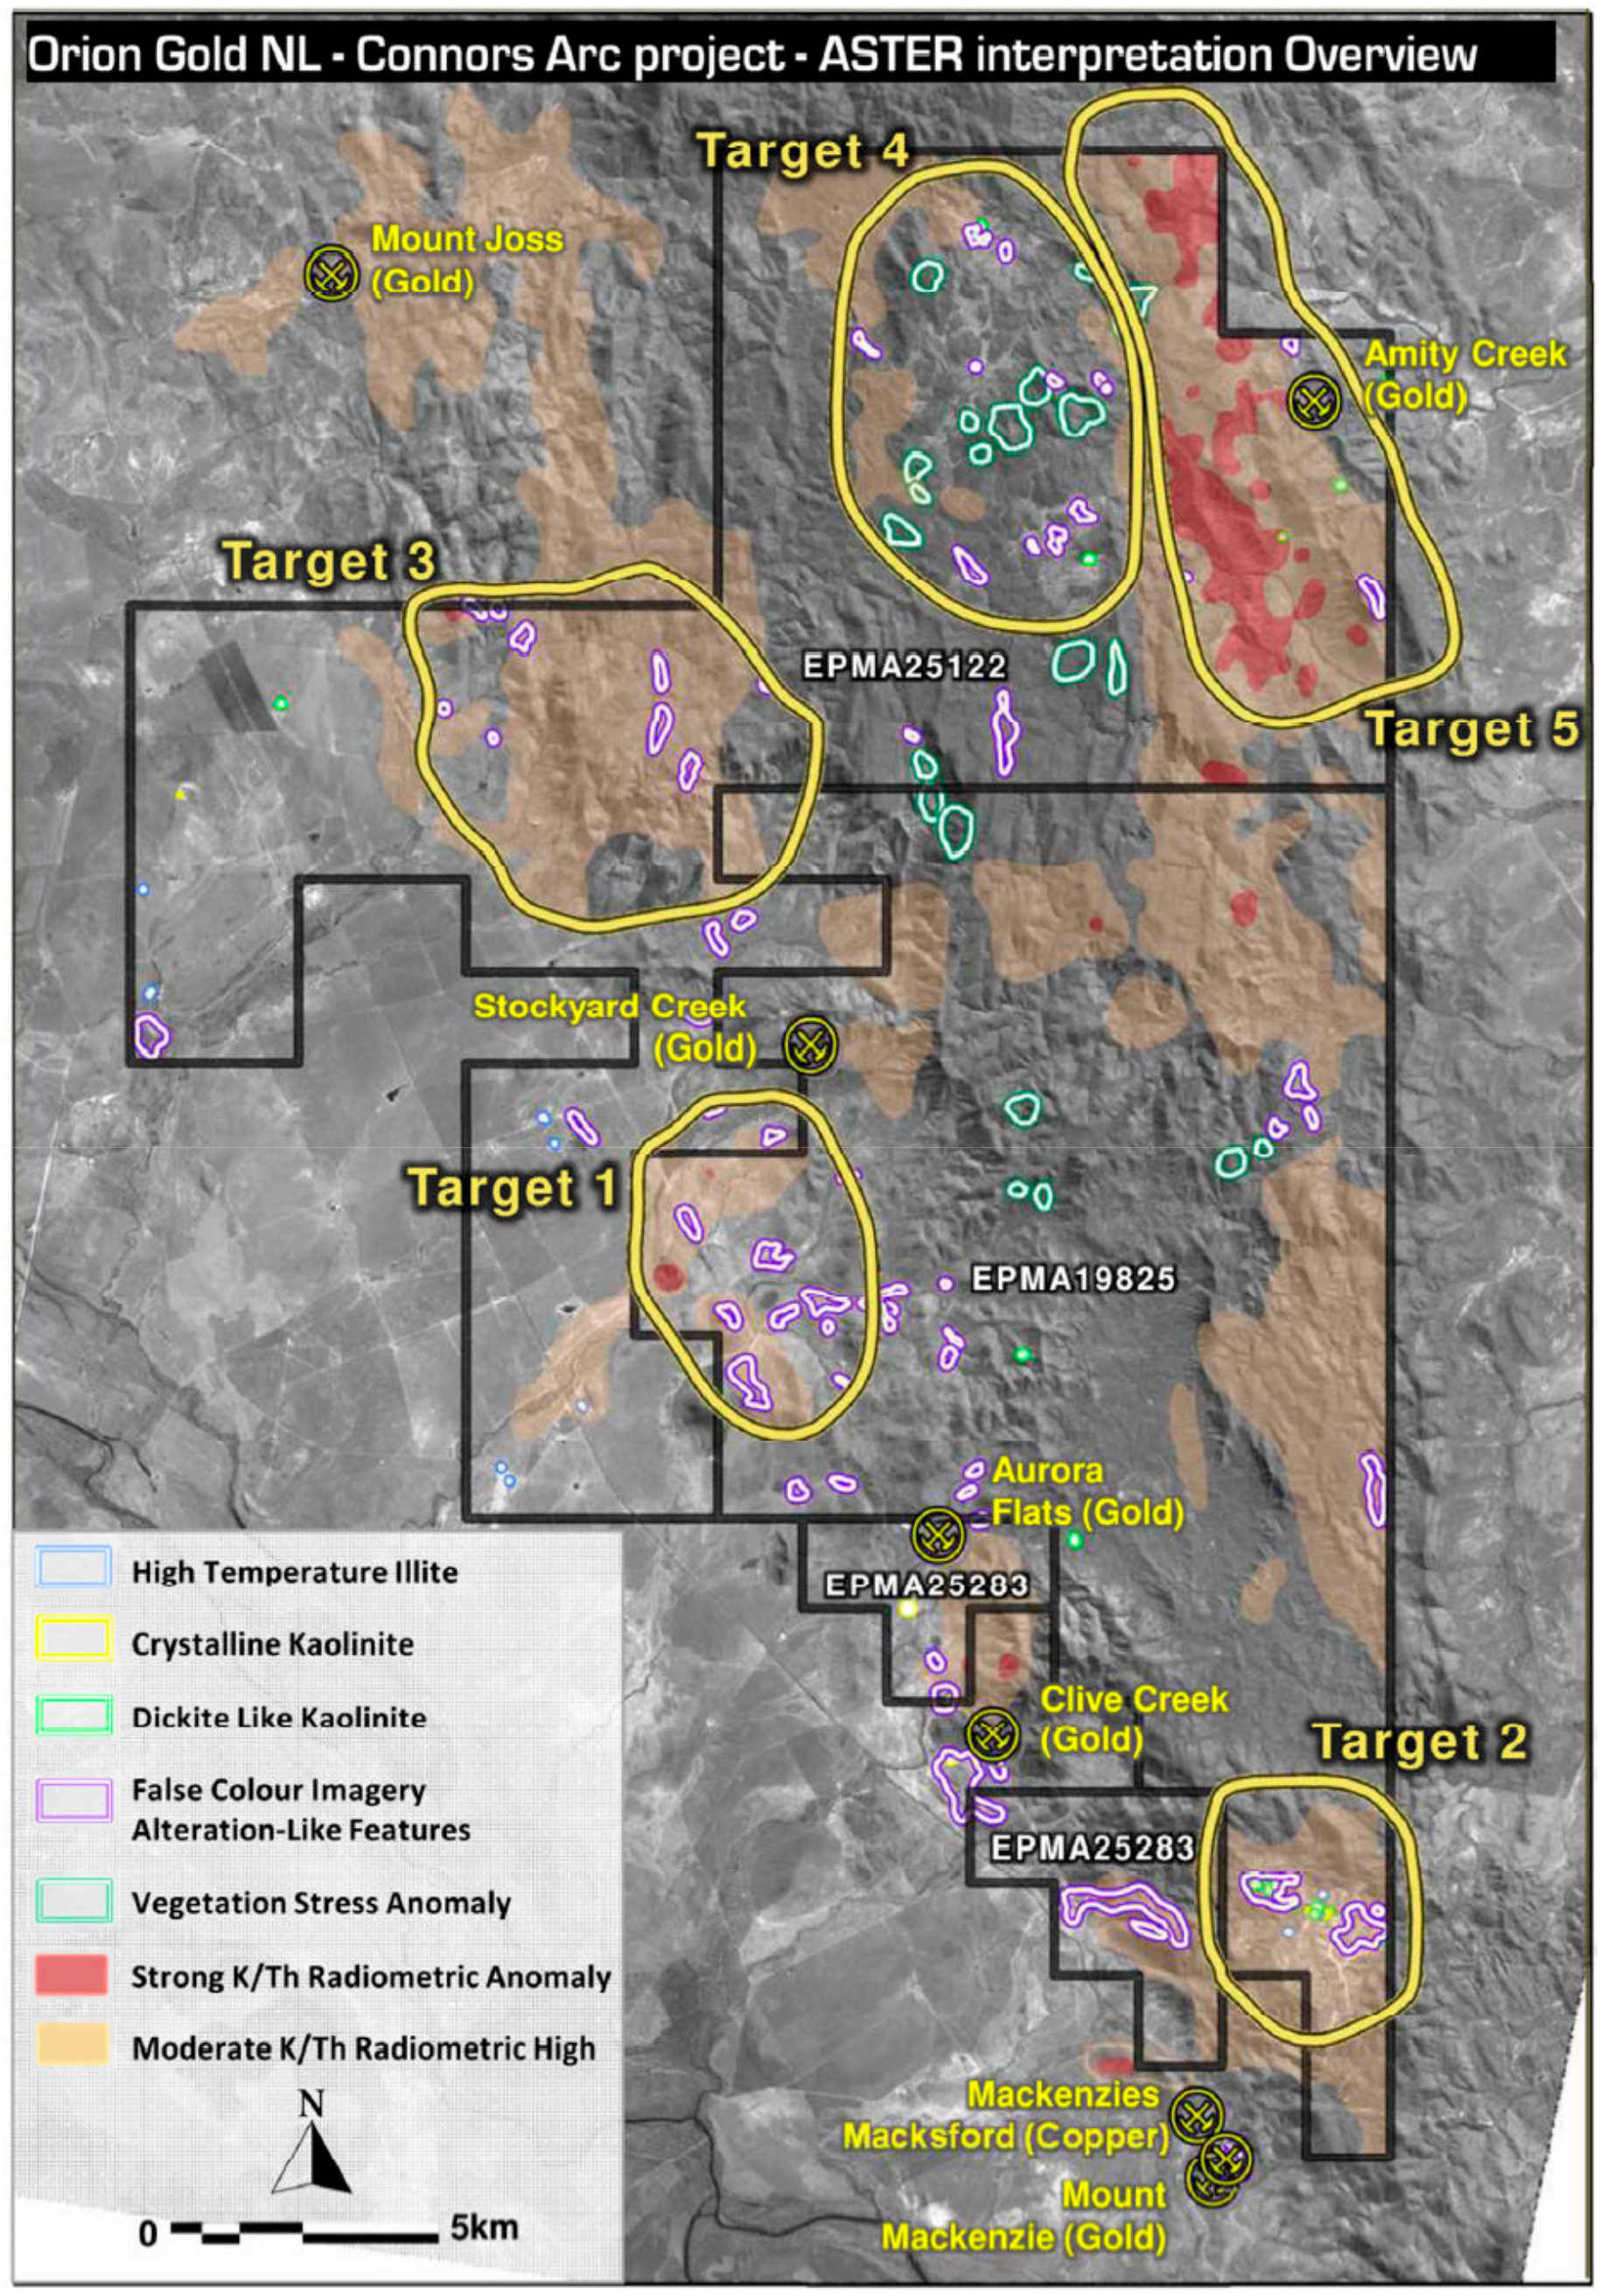
Orion Gold announced in 2013 [140] the discovery of new exploration gold target areas in Queensland, Australia, based on analysis of ASTER images. The area has known productive mines in low sulfidation epithermal gold systems and porphyry gold-copper systems. ASTER data were interpreted to locate occurrences of high temperature illite, crystalline kaolinite, dickite, and possible vegetation anomalies. Along with K/Th radiometric anomalies, five target areas were identified (Figure 5) for further ground- and laboratory-based analyses. Follow-up drilling in 2015 intersected multiple epithermal veins and stockwork zones.
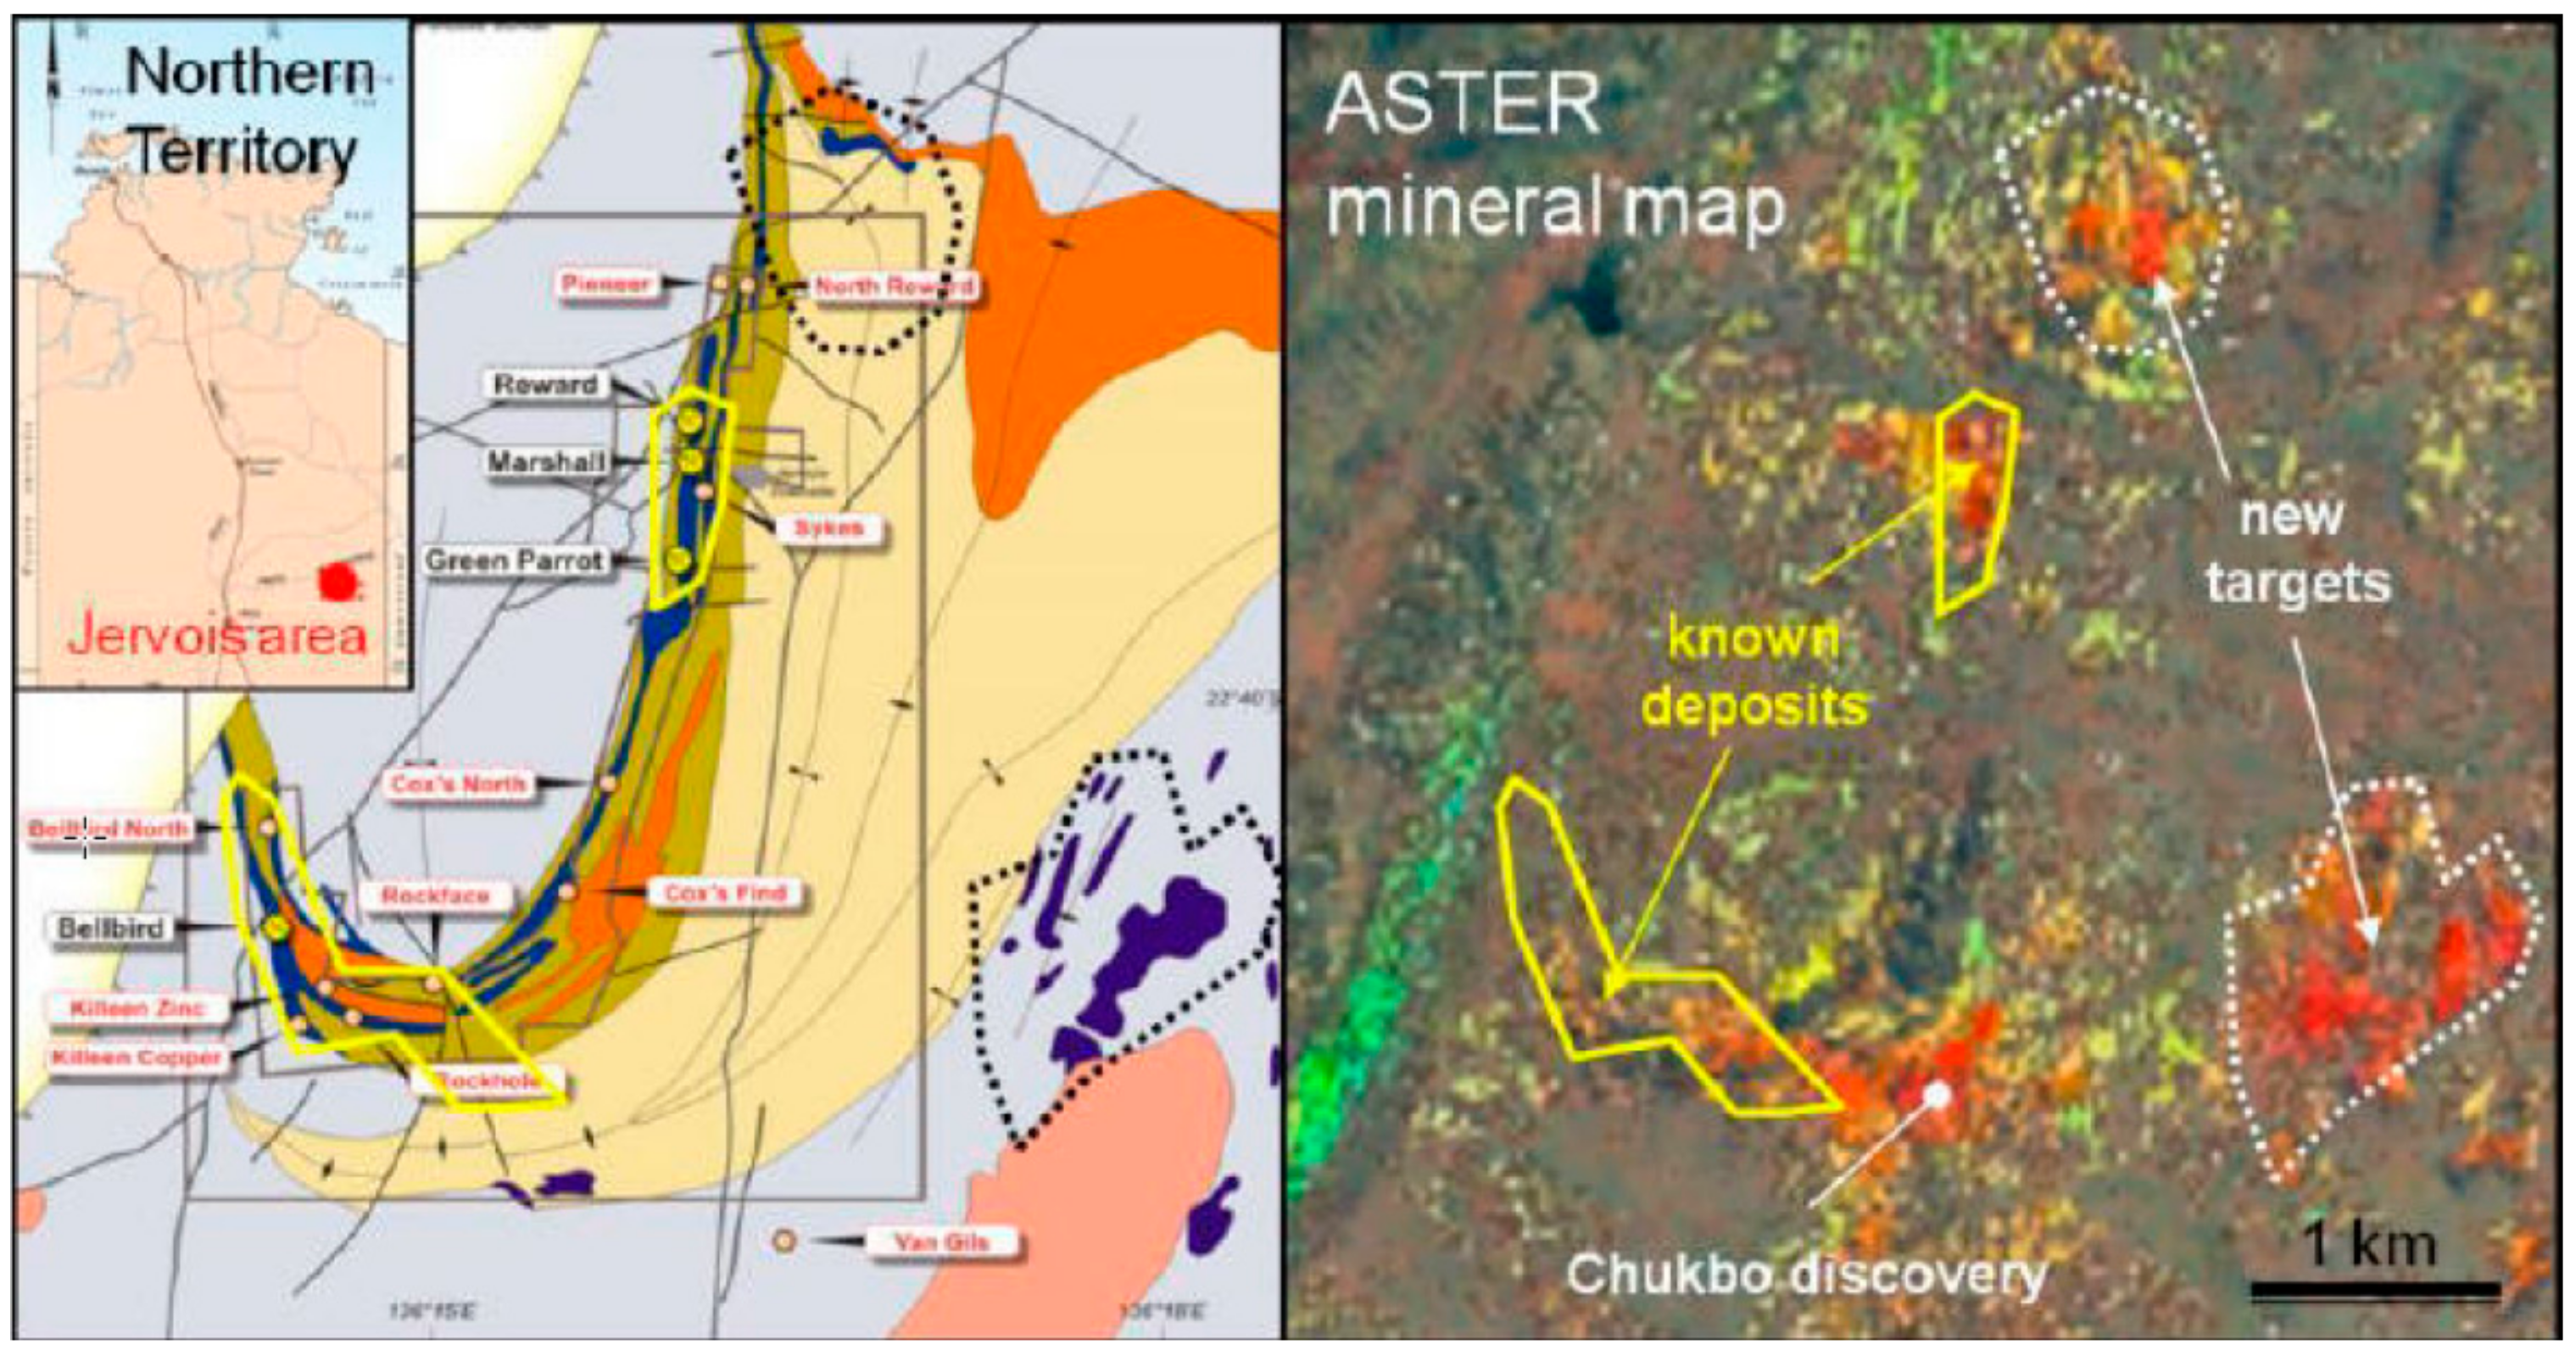
The first gold discovery using the Australia ASTER Geoscience minerals maps (described previously) was announced in 2014 by Kentor Gold Limited on the Australian Stock Exchange soon after the public release of the satellite products [141]. Their discovery at Chukbo in the east Arunta of the Northern Territory, Australia was based on recognition in the ASTER geoscience maps of coincident phyllic and propyllitic alteration (Figure 6). Similar new additional targets are also apparent.
Articles have been published describing applications of ASTER data for gold exploration in other parts of the world. An early work by Zhang et al. [142] applied ASTER data for lithologic mapping and alteration detection in the Chocolate Mountains, California. They analyzed the geologic setting of a known gold mine, then used the extracted characteristics to search for similar environments. A similar study by de Palomera [143] was carried out in the Deseado Massif, Argentina to prospect for epithermal gold-silver deposits. At Mount Olympus, Australia, Wells et al. [144] used ASTER data to characterize alteration associated with sediment-hosted gold mineralization. Their results defined a different suite of alteration minerals compared with hydrothermal alteration found in epithermal or Carlin-type gold deposits. At the Gua Musang Goldfield, China, Yao et al. [145] applied ASTER SWIR and TIR data to map rock types and quartz content to search for promising host rocks for possible gold mineralization. Yousefi et al. [146] integrated ASTER and Landsat data to map geologic setting of the Zarshuran Carlin-type deposit in Iran. ASTER data provided mineralogical and lithologic information, and Landsat provided regional structural information. Rani et al. [147] combined mineralogical information from ASTER data with ground magnetic data, ground spectroscopy and gravity data to identify potential targets for gold sulfide mineralization. This project was an improvement over many other, remote-sensing only projects: bringing in geophysical data provided a more complete geologic picture of the setting; ground spectroscopy provided validation of the mineralogical information derived from the ASTER data.
6.6. ASTER Data Applied to Exploration for Other Minerals
Several papers have appeared describing application of ASTER data in the search for iron ore deposits. Using ASTER data alone, or in combination with data from other satellites (Landsat and Hyperion) or airborne geophysics, methods were developed over targets in India, Iran, Brazil, and Australia by Rajendran et al. [148], Huang et al. [149], Duuring et al. [150], Mansouri et al. [151], and Mazhari et al. [152]. One report by Moghtaderi et al. [153] used ASTER and Landsat data to determine iron mineral contamination in an iron mine area in Iran. These studies mainly relied on the VNIR bands, as this spectral region covers the diagnostic spectral absorption features associated with ferric and ferrous iron minerals.
A few articles have appeared where ASTER data have been applied in the search for specific minerals. Cardoso-Fernandez [154] reported on the use of ASTER data in the search for lithium-bearing pegmatites. TIR data were one of the key inputs to their exploration model. Shawky et al. [155] processed ASTER data to detect the presence of known uranium localities in Egypt, hoping to develop a more general exploration tool. In Australia, Hewson et al. [156] analyzed ASTER data to map geology associated with manganese mineralization. In Kurdistan, Othman and Gloaguen [157] discovered a new chromite body in the Mawat Ophiolite Complex. They combined lithologic mapping to delineate possible host rocks, then identified targets using Support Vector Machine classification, searching for unknown deposits using known targets as training sites.
ASTER data have been applied in oil exploration to search for hydrocarbon seepage induced alteration by Fu et al. [158], Shi et al. [159], Siydon et al. [160], Pena and Abdelsalam [161], and Petrovic et al. [162]. Generally, surface effects are reduction/oxidation reactions, and alteration to produce clay minerals. In a few cases, over known oil fields, alteration has been successfully detected. Application as an exploration tool is still in the experimental stage; but ASTER data are considered an addition to an exploration protocol.
7. Discussion and Conclusions
All of these examples conclusively demonstrate the tremendous advances in lithologic mapping and mineral exploration provided by ASTER’s multispectral SWIR and TIR bands. For the first time, global image data were acquired at sufficient spatial resolution to be applicable to deposit-scale mapping, as well as regional reconnaissance exploration. In addition, the systematic search for indicators of potential base and precious metal deposits was enabled by the ability to detect minerals associated with propylitic, argillic, potassic, phyllic, and silicic hydrothermal alteration. Clays, carbonates, sulfates, and other hydrous minerals were discriminated, not just lumped into a single category as with Landsat data.
Researchers described a variety of initial ASTER data products (radiance-at-the-sensor, surface reflectance, etc.) as their inputs for analysis. Further pre-processing steps varied, depending on the final analysis and information extraction algorithms used. This variety of data analysis and processing methods, then applied to the pre-processed ASTER data, shows that there is no “perfect workflow” to successfully extract mineralogical information. The data have sufficient information to provide satisfactory results using the simplest techniques like color composites and band ratios of radiance-at-the-sensor data, or more sophisticated analyses, like machine learning. Mineralogical indices seem to be a good middle ground (see Appendix B).
The aerospace commercial sector took note of the sizable exploration geology user community using ASTER and Landsat data, and gauged there was a sufficiently large market to add multispectral SWIR capability to a for-hire satellite scanner. Since 2015, DigitalGlobe’s WorldView-3 instrument has provided data for sale to customers desiring high spatial resolution data. The instrument provides eight SWIR bands with 7.5 m pixel size, four in the 1.6–1.75 µm region and four in the 2.15–2.35 µm region; and eight VNIR bands with ~1.2 m pixel size, and has bands with similar bandpasses to ASTER VNIR-SWIR bands except for ASTER SWIR band 9. The images have a swath width of 13.1 km, so the data are not suitable for reconnaissance of medium to large areas, as can be done with ASTER data. However, the band positions allow better clay and carbonate mineral identification than with ASTER, as reported by Mars [163] over the Mountain Pass, California site. No funded, future instrument by any country or agency currently exists to provide high spatial resolution TIR data. Several hyperspectral VNIR-SWIR scanners are either operational or planned for launch in the next few years. None of these provide global coverage, as they are all sampling missions, with narrow (~30 km) swath widths.
Since the launch of the Landsat MSS scanner in 1972, geologists have increasingly turned to satellite-based remote sensing data as an integral tool in lithologic mapping and mineral exploration programs. The 1982 launch of the Landsat Thematic Mapper scanner, with its single 2–2.5 µm band, was a breakthrough for detecting hydrothermal alteration that could be associated with potential mineral deposits. Japan’s 1992 launch of OPS with its four SWIR bands demonstrated the potential capability to not only detect hydrothermal alteration minerals, but to identify individual and classes of these minerals. The ASTER instrument, with its six SWIR bands, and five TIR bands, was the next logical step in developing a spaceborne instrument with greatly enhanced geological mapping capabilities. For the past 20 years, ASTER data have been shown again and again to be an important tool to map the surface of the Earth. Several announced mineral deposit discoveries (and undoubtedly many unannounced discoveries) attest to the success of ASTER’s design.
Author Contributions
Conceptualization and writing by M.A. and Y.Y.
Funding
Yamaguchi was funded by JSPS KAKENHI (Grant No. 15H04225).
Acknowledgments
Work by Abrams was performed at the Jet Propulsion Laboratory, California Institute of Technology under contract with the National Aeronautics and Space Administration.
Conflicts of Interest
The authors declare no conflict of interest.
Acronyms
| AIST | National Institute of Advanced Industrial Science and Technology |
| ALI | Advanced Land Imager |
| ASTER | Advanced Spaceborne Thermal Emission and Reflection Radiometer |
| CSIRO | Commonwealth Scientific and Industrial Research Organisation |
| EO-1 | Earth Observer |
| EOS | Earth Observing System |
| ERTS | Earth Resources Technology Satellite |
| GDEM | Global digital elevation model |
| HRV | High resolution visible |
| IRS | Indian Remote Sensing |
| ITIR | Intermediate Thermal Infrared Radiometer |
| JERS | Japan Earth Resources Satellite |
| LPDAAC | Land Processes Distributed Active Archive Center |
| METI | Ministry of Economy, Trade and Industry |
| MITI | Ministry of International Trade and Industry |
| MSS | Multispectral scanner |
| NASA | National Aeronautics and Space Administration |
| NASDA | National Space Development Agency |
| OLI | Operational Land Imager |
| OPS | Optical sensor |
| PALSAR | Phased Array type L-band Synthetic Aperture Radar |
| SAC-C | Scientific Application Satellite-C |
| SPOT | Satellite pour l’Observation de la Terre |
| STA | Science and Technology Agency |
| SWIR | Short wave infrared |
| TIGER | Thermal Infrared Ground Emission Radiometer |
| TIR | Thermal infrared |
| TM | Thematic Mapper |
| VNIR | Visible and near infrared |
Appendix A. ASTER Operations
Appendix A.1. Data Acquisition
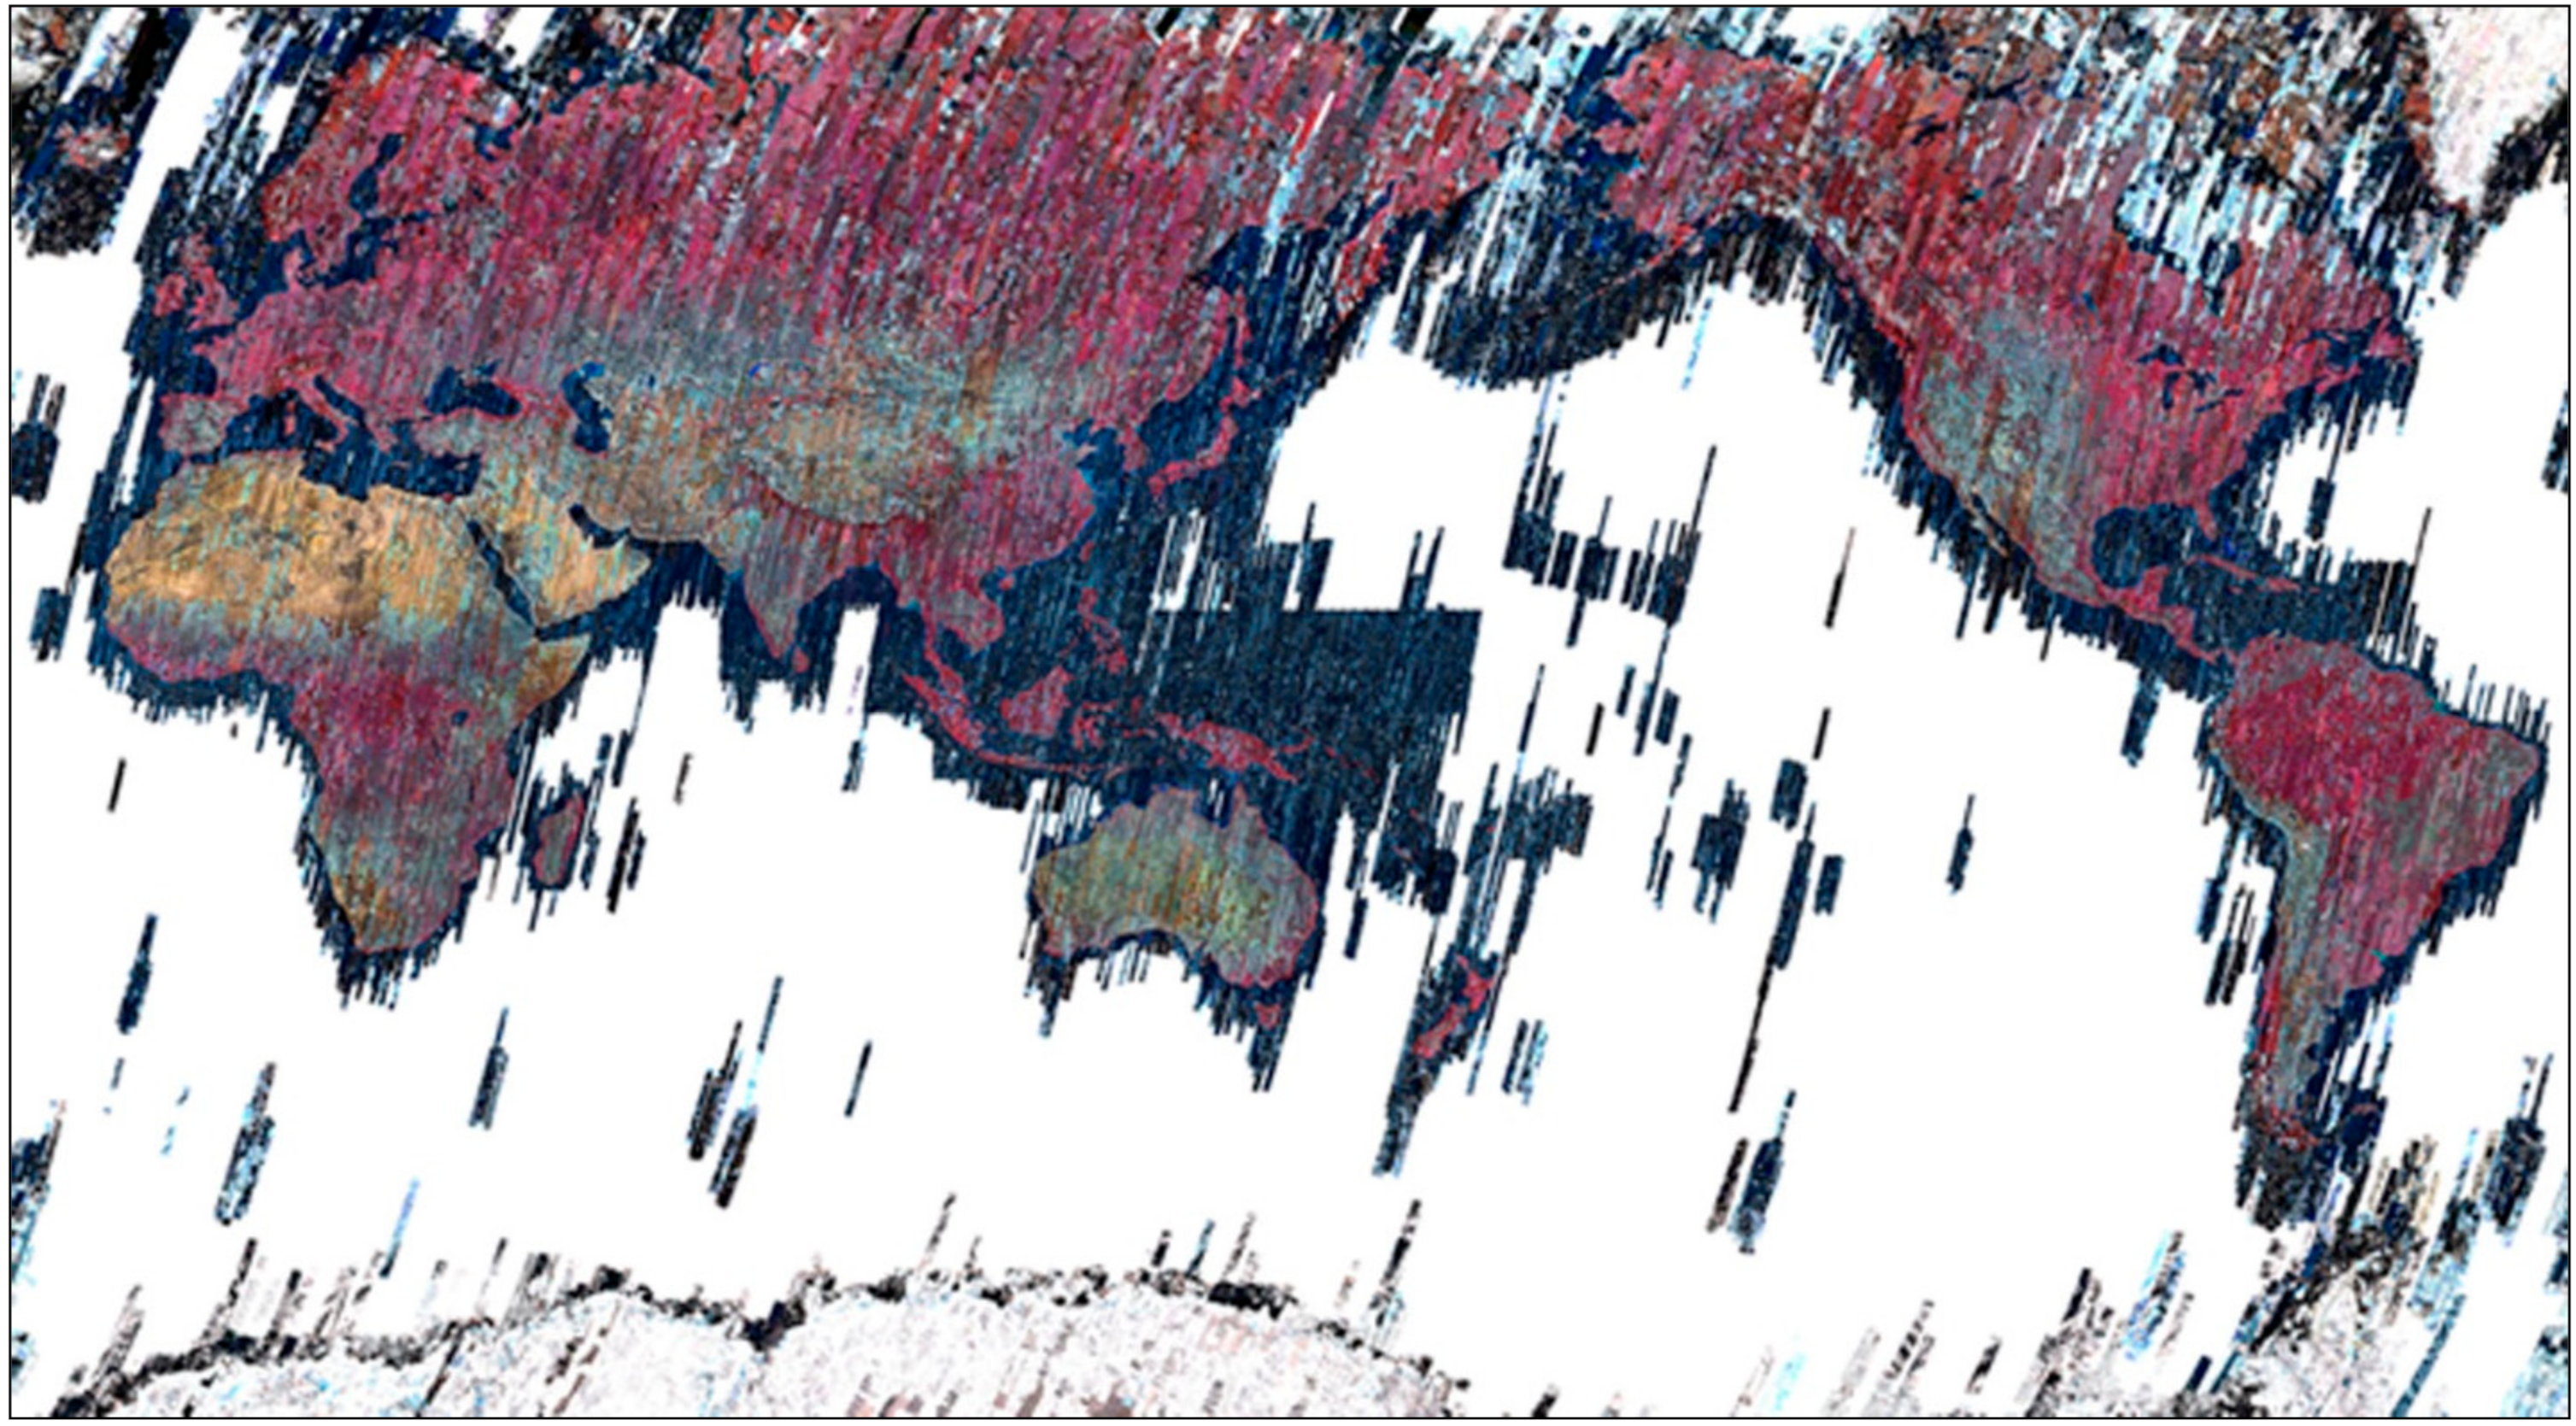
Due to its limited duty cycle, the ASTER instrument is scheduled each day for specific data collections. On any given day there are thousands of possible data acquisitions that could be collected. The ASTER science team developed an automatic scheduler to prioritize the possible acquisitions and produce a daily acquisition schedule. On average, about 500–550 scenes are collected daily, limited by the capacity of the onboard data recorders. To date, ASTER has acquired almost 4 million images (Figure A1).
Figure A1.
Mosaic of ASTER browse images showing near-global coverage achieved over the lifetime of the mission.
Figure A1.
Mosaic of ASTER browse images showing near-global coverage achieved over the lifetime of the mission.

Appendix A.2. Data Products
The ASTER project provides the user community with Standard Data Products throughout the life of the mission. Algorithms to create these products were created by the ASTER Science Team, and were rigorously peer reviewed by outside scientists [164]. This ensured that the products met NASA standards for accuracy and scientific soundness. Adhering to NASA procedures, products are labeled by level, from 1 to 3. “Level 1A are reconstructed, unprocessed instrument data at full resolution, time-referenced and annotated with ancillary information, including geometric and radiometric calibration coefficients and georeferencing parameters computed and appended but not applied to Level 0 data. Level 1B data are L1A data that have been processed to sensor units. Level 2 data are derived geophysical variables at the same resolution and location as Level 1 source data. Level 3 data are variables mapped on uniform space-time grid scales, usually with some completeness and accuracy.” [165]. A list of the ASTER data products can be found here [166].
Appendix A.3. Data Archiving and Distribution
In the U.S., NASA’s Land Processes Distributed Active Archive Center (LPDAAC; https://lpdaac.usgs.gov) is responsible for archiving, processing, and distribution of all ASTER data products. In Japan, Japan Space Systems (http://jspacesystems.or.jp) is responsible for archiving the entire ASTER Level 0 and Level 1 data. Distribution of a limited suite of ASTER products in Japan is implemented by the National Institute of Advanced Industrial Science and Technology (AIST) through the Geologic Survey of Japan (https://gbanks.gsj.jp/madas/). As of January 2019 ASTER had acquired over 3.8 million images. A complete catalog of links to ASTER data providers can be found on the ASTER website (https://asterweb.jpl.nasa.gov/data.asp).
Since April 2016, both METI and NASA agreed to distribute all ASTER data products to all users at no cost. For the period April 2016 to April 2019, over 32 million ASTER Level 1, 2, and 3 files have been distributed (excluding the Global Digital Elevation Model (GDEM)). For the past two years, the most popular product has been the ASTER GDEM. The number of these files ordered has exceeded 55 million.
Appendix B. Spectral Indices
Appendix B.1. TIR Spectral Indices
In 2005, Ninomiya et al. [32] proposed mineralogical spectral indices using ASTER’s TIR bands. The indices were based on spectral absorption features of silicates and carbonates, located in the 8–12 micron wavelength region.
- CI = Carbonate index = B13/B14, where B13 is the value of radiance-at-sensor of ASTER TIR band 13; CI is high for calcite and dolomite
- QI = Quartz Index = (B11 × B11)/(B10 + B12)
- MI = Mafic Index = (B12 × B143)/B134
Appendix B.2. Logical Operators
In 2006, Mars and Rowan [126] developed logical operators to map argillic and phyllic alteration. Their algorithms were written using IDL (Interactive Data Language). Input data were the ASTER calibrated surface reflectance products, atmospherically corrected. In addition, the ASTER data were adjusted using Hyperion data, resampled to ASTER bandpasses.
Argillic alteration:
((float(B3/B2 le 1.35) and (B4 gt 260) and ((float (B4)/B5) gt 1.25) and ((float(B5/B6) le 1.05) and ((float(b7)/B6) ge 1.03)
The first term masks vegetation; the second term masks dark pixels; the third term maps the 2.165 micron feature; the fourth term delineates argillic from phyllic alteration; the last term maps the 2.20 micron feature.
Phyllic alteration:
((float(B3)/B2) le 1.35) and (B4 gt 260) and ((float(B4)/B6) gt 1.25) and ((float(B5)/(B6) gt 1.05) and ((float(B7)/B6) ge 1.03)
The first term masks vegetation; the second term masks dark pixels; the third term maps the 2.20 micron feature; the fourth term delineates argillic from phyllic alteration; the last term maps the 2.20 micron feature.
Appendix B.3. Australian Geoscience Maps
In 2012, CSIRO released “Satellite ASTER Geoscience Products for Australia” [99]. These consisted of 17 geoscience products for the entire continent of Australia, created from 35,000 ASTER images. Fourteen were from the VNIR and SWIR bands, three from the TIR bands. The geoscience maps started with ASTER radiance-at-sensor data products; further processing included geometric correction, cloud and vegetation masking, mosaicking images to make a seamless mosaic, and application of product masks/thresholds to generate the geoscience products.
The 17 products are false color (Bands 3,2,1 in RGB); Landsat TM Regolith ratios; green vegetation content; ferric oxide content; ferric oxide composition; ferrous iron index; opaque index; AlOH group content; AlOH group composition; Kaolin group index; FeOH group content; MgOH group content; MgOH group composition; ferrous iron content in MgOH/carbonate; silica index; quartz index; and gypsum index.
An example of the algortihms used is the MgOH group content, designed to highlight the abundance of calcite, dolomite, magnesite, chlorite, epidote, amphibole, talc and serpentinite.
- Algorithm = (B6+B9)/(B7+B8)
- Masks = green vegetation <1.4 and cloud, water, shadow and sun glint
- Stretch = linear 1.05–1.2
References
- Abrams, M.; Tsu, H.; Hulley, G.; Iwao, K.; Pieri, D.; Cudahy, T.; Kargel, J. The Advanced Spaceborne Thermal Emission and Reflection Radiometer (ASTER) after Fifteen Years: Review of Global Data Product. Int. J. Appl. Earth Obs. Geoinform. 2015, 38, 292–301. [Google Scholar] [CrossRef]
- Goetz, A.; Billingsley, F.; Elston, D.; Lucchitta, I.; Shoemaker, E.; Abrams, M.; Gillespie, A.; Squires, R. Applications of ERTS Images and Image Processing to Regional Problems and Geologic Mapping in Northern Arizona; NASA/JPL Technical Reports 32-1597; NASA: Pasadena, CA, USA, 1975.
- Baker, R. Landsat Data: A new perspective for geology. Photogramm. Eng. Remote Sens. 1975, 41, 1233–1239. [Google Scholar]
- Sabins, F. Remote Sensing: Principles and Interpretation; W. H. Freeman: San Francisco, CA, USA, 1975; p. 426. [Google Scholar]
- Siegal, B.; Gillespie, A. (Eds.) Remote Sensing in Geology; Wiley: New York, NY, USA, 1980; p. 702. [Google Scholar]
- Landsat Science. Available online: https://landsat.gsfc.nasa.gov/the-thematic-mapper/ (accessed on 29 January 2019).
- Abrams, M.; Ashley, R.; Rowan, L.; Goetz, A.; Kahle, A. Mapping hydrothermal alteration in the Cuprite mining district, Nev., using aircraft scanner imagery for the 0.46–2.36 micron spectral region. Geology 1977, 5, 713–718. [Google Scholar] [CrossRef]
- Abrams, M. The Joint NASA Geosat Test Case Project: Final Report; American Association of Petroleum Geologists: Tulsa, OK, USA, 1985; 3 volumes. [Google Scholar]
- Abdelhamid, G.; Rabba, I. An investigation of mineralized zones revealed during geologic mapping, Jabal-Hamra-Faddan Wadi area, Jordan, using Landsat-TM data. Int. J. Remote Sens. 1994, 15, 1495–1506. [Google Scholar] [CrossRef]
- Rothery, D.; Abrams, M. Improved discrimination of rock units using Landsat Thematic Mapper imagery of the Oman Ophiolite. J. Geol. Soc. Lond. 1987, 144, 587–597. [Google Scholar] [CrossRef]
- Van Der Meer, F.; Vazquez-Torres, M.; Van Dijk, P. Spectral characterization of ophiolite lithologies in the Troodos Ophiolite complex of Cyprus and its potential in prospecting for massive sulfide deposits. Int. J. Remote Sens. 1997, 18, 1245–1257. [Google Scholar] [CrossRef]
- Elrakaiby, M. The use of enhanced Landsat-TM image in the characterization of uraniferous granitic rocks I the central eastern desert of Egypt. Int. J. Remote Sens. 1995, 16, 1063–1074. [Google Scholar] [CrossRef]
- Qari, M. Application of Landsat TM data to geological studies, Al-Khabt area, southern Arabian shield. Photogramm. Eng. Remote Sens. 1991, 57, 421–429. [Google Scholar]
- Sabins, F. Remote sensing for mineral exploration. Ore Geol. Rev. 1999, 14, 157–183. [Google Scholar] [CrossRef]
- Almeida, T.; Filho, C.; Juliani, C.; Branco, F. Application of Remote Sensing to Geobotany to Detect Hydrothermal Alteration Facies in Epithermal High-Sulfidation Gold Deposits in the Amazon Region. Rev. Econ. Geol. 2006, 16, 135–142. [Google Scholar]
- eoPortal Directory. Available online: https://earth.esa.int/web/eoportal/satellite-missions/j/jers-1 (accessed on 30 January 2019).
- DeSouza, C.; Drury, S. Evaluation of JERS-1 (FUYO-1) OPS and Landsat TM images for mapping of gneissic rocks in arid areas. Int. J. Remote Sens. 1998, 19, 3569–3594. [Google Scholar] [CrossRef]
- Salomonson, V.; Abrams, M.; Kahle, A.; Barnes, W.; Xiong, X.; Yamaguchi, Y. Evolution of NASA’s earth Observing System and development of the Moderate Resolution Imaging Spectrometer and the Advanced Spaceborne Thermal Emission and Reflection radiometer instruments. In Land Remote Sensing and Global Environmental Change; Ramachandran, R., Justice, C., Abrams, M., Eds.; Springer: New York, NY, USA, 2011; Chapter 1; pp. 3–34. [Google Scholar]
- Yamaguchi, Y.; Tsu, H.; Fujisada, H. Scientific basis of ASTER instrument design. Proc. SPIE 1998, 1939, 150–160. [Google Scholar]
- Plafcan, D. Technoscientific Diplomacy: The practice of international policies in the ASTER collaboration. In Land Remote Sensing and Global Environmental Change; Ramachandran, R., Justice, C., Abrams, M., Eds.; Springer: New York, NY, USA, 2011; Chapter 4; pp. 483–508. [Google Scholar]
- Yamaguchi, Y.; Sato, I.; Tsu, H. ITIR design concept and science mission. In The Use of EOS for Studies of Atmospheric Physics; Gille, J.C., Visconti, G., Eds.; Elsevier: New York, NY, USA, 1992; pp. 229–310. [Google Scholar]
- Yamaguchi, Y.; Kahle, A.; Tsu, H.; Kawakami, T.; Pniel, M. Overview of Advanced Spaceborne Thermal Emission and Reflection Radiometer (ASTER). IEEE Trans. Geosci. Remote Sens. 1998, 36, 1062–1071. [Google Scholar] [CrossRef] [Green Version]
- Fujisada, H. Terra ASTER Instrument Design and Geometry. In Land Remote Sensing and Global Environmental Change; Ramachandran, R., Justice, C., Abrams, M., Eds.; Springer: New York, NY, USA, 2011; Chapter 4; pp. 59–82. [Google Scholar]
- Fujisada, H.; Bailey, G.; Kelly, G.; Hara, S.; Abrams, M. ASTER DEM Performance. IEEE Trans. Geosci. Remote Sens. 2005, 43, 2702–2714. [Google Scholar] [CrossRef]
- Balick, L.; Gillespie, A.; French, A.; Danilina, I.; Allard, J.P.; Mushkin, A. Longwave thermal infrared spectral variability in individual rocks. IEEE Geosci. Remote Sens. Lett. 2009, 6, 52–56. [Google Scholar] [CrossRef]
- Rowan, L.; Mars, J. Lithologic mapping in the Mountain Pass, California area using ASTER data. Remote Sens. Environ. 2003, 84, 350–366. [Google Scholar] [CrossRef]
- Watts, D.; Harris, N. Mapping granite and gneiss in domes along the North Himalayan antiform with ASTER SWIR band ratios. Geol. Soc. Am. Bull. 2005, 117, 879–886. [Google Scholar] [CrossRef]
- Yamaguchi, Y.; Naito, C. Spectral indices for lithologic discrimination and mapping by using the ASTER SWIR bands. Int. J. Remote Sens. 2003, 24, 4311–4323. [Google Scholar] [CrossRef]
- Byrnes, J.; Ramsey, M.; Crown, D. Surface unit characterization of the Mauna Ulu flow field, Kilauea Volcano, Hawaii, using integrated field and remote sensing analyses. J. Volcanol. Geotherm. Res. 2004, 135, 169–193. [Google Scholar] [CrossRef]
- Gomez, C.; Delacourt, C.; Allemand, P.; Ledru, P.; Wackerle, R. Using ASTER remote sensing data set for geological mapping, in Namibia. Phys. Chem. Earth 2005, 30, 97–108. [Google Scholar] [CrossRef]
- Kargel, J.; Abrams, M.; Bishop, M.; Bush, A.; Hamilton, G.; Jiskoot, H.; Kaag, A.; Kieffer, H.; Lee, E.; Paul, F.; et al. Multispectral imaging contributions to global land ice measurements from space. Remote Sens. Environ. 2005, 99, 187–219. [Google Scholar] [CrossRef]
- Ninomiya, Y.; Fu, B.; Cudahy, T. Detecting lithology with Advanced Spaceborne Thermal Emission and Reflection radiometer (ASTER) multispectral thermal infrared “radiance-at-sensor” data. Remote Sens. Environ. 2005, 99, 127–139. [Google Scholar] [CrossRef]
- Hook, S.; Dmochowski, J.; Howard, K.; Rowan, L.; Karlstrom, K.; Stock, J. Mapping variations in weight percent silica measured from multispectral thermal infrared imagery; examples from the Hiller Mountains, Nevada, USA and Tres Virgenes-La Reforma, Baja California Sur, Mexico. Remote Sens. Environ. 2005, 95, 273–289. [Google Scholar] [CrossRef]
- Rowan, L.; Mars, J.; Simpson, C. Lithologic mapping of the Mordor, NT, Australia ultramafic complex by using Advanced Spaceborne Thermal Emission and Reflection Radiometer (ASTER). Remote Sens. Environ. 2005, 99, 105–126. [Google Scholar] [CrossRef]
- Hewson, R.; Cudahy, T.; Mizuhiko, S.; Ueda, K.; Mauger, A. Seamless geological map generation using ASTER in the Broken Hill-Curnamona province of Australia. Remote Sens. Environ. 2005, 99, 159–172. [Google Scholar] [CrossRef]
- Qiu, F.; Abdelsalam, M.; Thakkar, P. Spectral analysis of ASTER data covering part of the Neoproterozoic Allaqi-Heiani suture, Southern Egypt. J. Afr. Earth Sci. 2006, 44, 169–180. [Google Scholar] [CrossRef]
- Rajendran, S.; Hersi, O.; Al-Harthy, A.; Al-Wardi, M.; El-Ghali, M.; Al-Abri, A. Capability of Advanced Spaceborne Thermal Emission and Reflection radiometer (ASTER) on discrimination of carbonates and associated rocks and mineral identification of eastern mountain region (Saih Hatat window) of Sultanate of Oman. Carbonates Evaporates 2011, 26, 352–364. [Google Scholar]
- Rajendran, S.; Nasir, S. ASTER spectral sensitivity of carbonate rocks—Study in Sultanate of Oman. Adv. Space Res. 2014, 53, 656–673. [Google Scholar] [CrossRef]
- Guba, A.; Kumar, K.; Rao, E.; Parveen, R. An image processing approach for converting ASTER derived spectral maps for mapping Kolhan limestone, Jharkhand, Indian. Curr. Sci. 2014, 106, 40–49. [Google Scholar]
- Graettinger, A.; Ellis, M.; Skilling, I.; Reata, K.; Ramsey, M.; Lee, R.; Hughes, C.; McGarvie, D. Remote sensing and geologic mapping of glaciovolcanic deposits in the region surrounding Askja (Dyngjufjoll) volcano, Iceland. Int. J. Remote Sens. 2013, 34, 7178–7198. [Google Scholar] [CrossRef]
- Tayebi, M.; Tangestani, M.; Roosta, H. Mapping salt diapirs and salt diapir-affected areas using MLP neural network model and ASTER data. Int. J. Dig. Earth 2013, 6, 143–157. [Google Scholar] [CrossRef]
- Yajima, T.; Yamaguchi, Y. Geological mapping of the Francistown area in northeastern Botswana by surface temperature and spectral emissivity information derived from ASTER thermal infrared data. Ore Geol. Rev. 2013, 53, 134–144. [Google Scholar] [CrossRef]
- Ninomiya, Y.; Fu, B. Regional Lithological Mapping Using ASTER-TIR Data: Case Study for the Tibetan Plateau and the Surrounding Area. Geosciences 2016, 6, 39. [Google Scholar] [CrossRef]
- Ozyavas, A. Assessment of image processing techniques and ASTER SWIR data for the delineation of evaporates and carbonate outcrops along the Salt Lake Fault, Turkey. Int. J. Remote Sens. 2016, 37, 770–781. [Google Scholar] [CrossRef]
- Askari, G.; Pour, A.; Pradhan, B.; Sarfi, M.; Nazemnejad, F. Band Ratios Matrix Transformation (BRMT): A Sedimentary Lithology Mapping Approach Using ASTER Satellite Sensor. Sensors 2018, 18, 3213. [Google Scholar] [CrossRef] [PubMed]
- Hubbard, B.; Hooper, D.; Solano, F.; Mars, J. Determining mineralogical variations of aeolian deposits using thermal infrared emissivity and linear deconvolution methods. Aeolian Res. 2018, 30, 54–96. [Google Scholar] [CrossRef]
- Rajendran, S.; Nasir, S.; El-Ghali, M.; Alzebdeh, K. Spectral Signature Characterization and Remote Mapping of Oman Exotic Limestones for Industrial Rock Resource Assessment. Geosciences 2018, 8, 145. [Google Scholar] [CrossRef]
- Massironi, M.; Bertoldi, L.; Calafa, P.; Visona, D. Interpretation and processing of ASTER data for geological mapping and granitoids detection in the Saghro massif (eastern Anti-Atlas, Morocco). Geosphere 2008, 4, 736–759. [Google Scholar] [CrossRef]
- Bertoldi, L.; Massironi, M.; Visona, D.; Caros, R.; Montomoli, C.; Gubert, F.; Naletto, G.; Pelizzo, M. Mapping the Buraburi granite in the Himalaya of Western Nepal: Remote sensing analysis in a collisional belt with vegetation cover and extreme variation of topography. Rem Sens. Environ. 2011, 115, 1129–1144. [Google Scholar] [CrossRef]
- Omran, A.; Hahn, M.; Hochschild, V.; El-Reyes, A. Lithological Mapping of Dahab Basin, South Sinai, Egypt, using ASTER Data. Photogramm. Fernerkund. Geoinform. 2012, 6, 711–726. [Google Scholar] [CrossRef]
- Zheng, S.; Fu, B. Lithological mapping of granitiods in the western Junggar from ASTER SWIR-TIR multispectral data: Case study in Karamay pluton, Xinjiang. Acta Petrol. Sin. 2013, 29, 2936–2948. [Google Scholar]
- El Janati, M.; Soulaimani, A.; Admou, H.; Youbi, M.; Hafid, A.; Hefferan, K. Application of ASTER remote sensing data to geological mapping of basement domains in arid regions: A case study from the Central Anti-Atlas, Iguerda inlier, Morocco. Arab. J. Geosci. 2014, 7, 2407–2422. [Google Scholar] [CrossRef]
- Guha, A.; Kumar, K. New ASTER derived thermal indices to delineate mineralogy of different granitoids of an Archaean Craton and analysis of their potentials with reference to Ninomiya’s indices for delineating quartz and mafic minerals of granitoids—An analysis in Dharwar Craton, Indian. Ore Geol. Rev. 2016, 74, 76–87. [Google Scholar]
- Asran, A.; Emam, A.; E-Fakharani, A. Geology, structure, geochemistry and ASTER-based mapping of Neoproterozoic Gebel El-Delihimmi granites, Central Eastern Desert of Egypt. Lithos 2017, 282, 358–372. [Google Scholar] [CrossRef]
- Li, P.; Long, X.; Liu, L. Ophiolite mapping using ASTER data: A case study of Derni ophiolite complex. Acta Petrol. Sin. 2007, 23, 1175–1180. [Google Scholar]
- Huang, Z.; Zhang, X. Lithological mapping of ophiolite composition in Zedan-Luobusha, Yarlung Zangbo suture zone using Advanced Spaceborne Thermal Emission and Reflection Radiometer (ASTER) data. Acta Petrol. Sin. 2010, 26, 3589–3596. [Google Scholar]
- Tangestani, M.; Jaffari, L.; Vincent, R.; Sridhar, B. Spectral characterization and ASTER-based lithological mapping of an ophiolite complex: A case study from Neyriz ophiolite, SW Iran. Remote Sens. Environ. 2011, 115, 2243–2254. [Google Scholar] [CrossRef]
- Ozkan, M.; Celik, O.; Ozyavas, A. Lithological discrimination of accretionary complex (Sivas, northern Turkey) using novel hybrid color composites and field data. J. Afr. Earth Sci. 2018, 138, 75–85. [Google Scholar] [CrossRef]
- Deller, M.; Andrews, S. Facies discrimination in laterites using Landsat Thematic Mapper, ASTER and ALI data—Examples from Eritrea and Arabia. Int. J. Remote Sens. 2006, 27, 2389–2409. [Google Scholar] [CrossRef]
- Qari, M.; Madani, A.; Matsah, M.; Hamimi, Z. Utilization of ASTER and Landsat data in geologic mapping of basement rocks of Arafat Area, Saudi Arabia. Arab. J. Sci. Eng. 2008, 33, 99–116. [Google Scholar]
- Pournamdari, M.; Hashim, M.; Pour, A. Spectral transformation of ASTER and Landsat TM bands for lithological mapping of Soghan ophiolite complex, South Iran. Adv. Space Res. 2015, 54, 694–709. [Google Scholar] [CrossRef]
- Eslami, A.; Ghaderi, M.; Rajendran, S. Integration of ASTER and Landsat TM remote sensing data for chromite prospecting and lithological mapping in Neyriz ophiolite zone, south Iran. Resour. Geol. 2015, 65, 375–388. [Google Scholar] [CrossRef]
- Adiri, Z.; El Harti, A.; Jellouli, A.; Maacha, L.; Bachaoui, E. Lithological mapping using Landsat 8 OLI and Terra ASTER multispectral data in the Bas Draa inlier, Moroccan Anti Atlas. J. Appl. Remote Sens. 2016, 10. [Google Scholar] [CrossRef]
- Lamri, T.; Djemai, S.; Hamoudi, M.; Zoheir, B.; Benaouda, A.; Ouzegane, K.; Amara, M. Satellite imagery and airborne geophysics for geologic mapping of the Edembo area, Eastern Hoggar (Algerian Sahara). J. Afr. Earth Sci. 2016, 115, 143–158. [Google Scholar] [CrossRef]
- Metelka, V.; Baratoux, L.; Jessell, M.; Barth, A.; Jezek, J.; Naba, S. Automated regolith landform mapping using airborne geophysics and remote sensing data, Burkina Faso, West Africa. Remote Sens. Environ. 2018, 204, 964–978. [Google Scholar] [CrossRef]
- Yang, M.; Kang, L.; Chen, H.; Zhou, M.; Zhang, J. Lithological mapping of East Tianshan area using integrated data fused by Chinese GF-1 PAN and ASTER multi-spectral data. Open Geosci. 2018, 10, 532–543. [Google Scholar] [CrossRef]
- Ge, W.; Cheng, Q.; Jing, L.; Armenakis, C.; Ding, H. Lithological discrimination using ASTER and Sentinel-2A in the Shibanjing ophiolite complex of Beishan orogenic in Inner Mongolia, China. Adv. Space Res. 2018, 62, 1702–1716. [Google Scholar] [CrossRef]
- Hassan, S.; El Kazzaz, Y.; Taha, M. Late Neoproterozoic basement rocks of Meatiq area, Central Eastern Desert, Egypt: Petrography and remote sensing characterizations. J. Afr. Earth Sci. 2017, 131, 14–31. [Google Scholar] [CrossRef]
- Ali-Bik, M.; Hassan, S.; Abou El Maaty, M.; Moustafa, A.; El Rahim, A.; Said, H. The late Neoproterozoic Pan-African low-grade metamorphic ophiolitic and island-arc assemblages at Gebel Zabara area, Central Eastern Desert, Egypt: Petrogenesis and remote sensing—Based geologic mapping. J. Afr. Earth Sci. 2018, 144. [Google Scholar] [CrossRef]
- Hadigheh, S.; Ranjbar, H. Lithological Mapping in the Eastern Part of the Central Iranian Volcanic Belt Using Combined ASTER and IRS data. J. Indian Soc. Remote Sens. 2013, 41, 921–931. [Google Scholar] [CrossRef]
- Lohrer, R.; Bertrams, M.; Eckmeier, E.; Protze, J. Mapping the distribution of weathered Pleistocene wadi deposits in Southern Jordan using ASTER, SPOT-5 data and laboratory spectroscopic analysis. Catena 2013, 107, 57–70. [Google Scholar] [CrossRef]
- Boyce, J.; Keays, R.; Nicholls, I.; Hayman, P. Eruption centres of the Hamilton area of the Newer Volcanics Province, Victoria, Australia: Pinpointing volcanoes from a multifaceted approach to landform mapping. Austral. J. Earth Sci. 2014, 61, 735–754. [Google Scholar] [CrossRef]
- Soltaninejad, A.; Ranjbar, H.; Honarmand, M.; Dargahi, S. Evaporite mineral mapping and determining their source rocks using remote sensing data in Sirjan playa, Kerman, Iran. Carbonates Evaporites 2018, 33, 255–274. [Google Scholar] [CrossRef]
- Chen, Q.; Zhao, Z.; Jiang, Q.; Tan, S.; Tian, Y. Identification of metamorphic rocks in Wuliangshan Mountains (Southwest China) using ASTER data. Arab. J. Geosci. 2018, 11. [Google Scholar] [CrossRef]
- Wang, R.; Lin, J.; Zhao, B.; Xiao, Z. Integrated Approach for Lithological Classification Using ASTER Imagery in a Shallowly Covered Region-The Eastern Yanshan Mountain of China. IEEE J. Sel. Top. Appl. Earth Obs. Remote Sens. 2018, 11, 4791–4807. [Google Scholar] [CrossRef]
- Kurata, K.; Yamaguchi, Y. Integration and Visualization of Mineralogical and Topographical Information Derived from ASTER and DEM Data. Remote Sens. 2019, 11, 162. [Google Scholar] [CrossRef]
- Crosta, A.; De Souza, C.; Azevedo, F. Targeting key alteration minerals in epithermal deposits in Patagonia, Argentina, using ASTER imagery and principal component analysis. Int. J. Remote Sens. 2003, 24, 4233–4240. [Google Scholar] [CrossRef]
- Galvao, L.; Almeida, R.; Vitorello, I. Spectral discrimination of hydrothermally altered materials using ASTER short-wave infrared bands: Evaluation in a tropical savannah environment. Int. J. Appl. Earth Obs. Geoinform. 2005, 7, 107–114. [Google Scholar] [CrossRef]
- Moore, F.; Rastmanesh, F.; Asadi, H.; Modabberi, S. Mapping mineralogical alteration using principal-component analysis and matched filter processing in the Takab area, north-west Iran, from ASTER data. Int. J. Remote Sens. 2008, 29, 2851–2867. [Google Scholar] [CrossRef]
- Rockwell, B.; Hofstra, A. Identification of quartz and carbonate minerals across northern Nevada using ASTER thermal infrared emissivity data—Implications for geologic mapping and mineral resource investigations in well-studied and frontier areas. Geosphere 2008, 4, 218–246. [Google Scholar] [CrossRef]
- Hosseinjani, M.; Tangestani, M. Mapping alteration minerals using sub-pixel unmixing of ASTER data in the Sarduiyeh area, SE Kerman, Iran. Int. J. Dig. Earth 2011, 4, 487–504. [Google Scholar] [CrossRef]
- Honarmand, M.; Ranjbar, H.; Shahabpour, J. Application of Principal Component Analysis and Spectral Angle Mapper in the Mapping of Hydrothermal Alteration in the Jebal-Barez Area, Southeastern Iran. Res. Geol. 2012, 62, 119–139. [Google Scholar] [CrossRef]
- Kruse, F.; Boardman, A.; Lefkoff, A.; Heidebrecht, K.; Shapiro, A.; Goetz, A. The spectral image processing system (SIPS)—Interactive visualization and analysis of imaging spectrometer data. Remote Sens. Environ. 1993, 44, 145–163. [Google Scholar] [CrossRef]
- Abdi, M.; Karimpour, M. Application of Spectral Angle Mapper Classification to Discriminate Hydrothermal Alteration in Southwest Birjand, Iran, Using Advanced Spaceborne Thermal Emission and Reflection Radiometer Image Processing. Acta Geol. Sin. 2012, 86, 1289–1296. [Google Scholar] [CrossRef]
- Abbaszadeh, M.; Hezarkhani, A. Enhancement of hydrothermal alteration zones using the spectral feature fitting method in Rabor area, Kerman. Iran. Arab. J. Geosci. 2013, 6, 1957–1964. [Google Scholar] [CrossRef]
- Zadeh, M.; Tangestani, M.; Roldan, F.; Yusta, I. Mineral Exploration and Alteration Zone Mapping Using Mixture Tuned Matched Filtering Approach on ASTER Data at the Central Part of Dehaj-Sarduiyeh Copper Belt, SE Iran. IEEE J. Sel. Top. Appl. Earth Obs. Remote Sens. 2014, 7, 284–289. [Google Scholar] [CrossRef]
- Available online: https://ww2w.harrisgeospatial.com.docs/MTMF.html (accessed on 20 March 2019).
- Tayebi, M.; Tangestani, M.; Vincent, R. Alteration mineral mapping with ASTER data by integration of coded spectral ratio imaging and SOM neural network model. Turk. J. Earth Sci. 2014, 23, 627–644. [Google Scholar] [CrossRef]
- Modabberi, S.; Ahmadi, A.; Tangestani, M. Sub-pixel mapping of alunite and jarosite using ASTER data; a case study from north of Semnan, north central Iran. Ore Geol. Rev. 2017, 80, 429–436. [Google Scholar] [CrossRef]
- Rowan, L.; Hook, S.; Abrams, M.; Mars, J. Mapping hydrothermally altered rocks at Cuprite, Nevada, using the advanced Spaceborne Thermal Emission and Reflection Radiometer (ASTER), a new satellite-imaging system. Econ. Geol. 2003, 98, 1019–1027. [Google Scholar] [CrossRef]
- Bhadra, B.; Pathak, S.; Karunakar, G.; Sharma, J. ASTER Data Analysis for Mineral Potential Mapping Around Sawar-Malpura Area, Central Rajasthan. J. Indian Soc. Remote Sens. 2013, 41, 391–404. [Google Scholar] [CrossRef]
- Liu, L.; Zhou, J.; Yin, F.; Feng, M.; Zhang, B. The Reconnaissance of Mineral Resources through ASTER Data-Based Image Processing, Interpreting and Ground Inspection in the Jiafushaersu Area, West Junggar, China. J. Earth Sci. 2014, 25, 397–406. [Google Scholar] [CrossRef]
- Popov, K.; Bakardjiev, D. Identification of hydrothermal alteration areas in the Panagyurishte ore region by satellite ASTER spectral data. Comptes Rendus de L’Academie Bulgare des Sciences 2014, 67, 1547–1554. [Google Scholar]
- Son, Y.; Kang, M.; Yoon, W. Lithological and mineralogical survey of the Oyu Tolgoi region, Southeastern Gobi, Mongolia using ASTER reflectance and emissivity data. Int. J. Appl. Earth Obs. Geoinform. 2014, 26, 205–216. [Google Scholar] [CrossRef]
- Canbaz, O.; Gursoy, O.; Gokce, A. Detecting Clay Minerals in Hydrothermal Alteration Areas with Integration of ASTER Image and Spectral Data in Kosedag-Zara (Sivas), Turkey. J. Geol. Soc. India 2018, 91, 483–488. [Google Scholar] [CrossRef]
- Mahanta, P.; Maiti, S. Regional scale demarcation of alteration zone using ASTER imageries in South Purulia Shear Zone, East India: Implication for mineral exploration in vegetated regions. Ore Geol. Rev. 2018, 102, 846–861. [Google Scholar] [CrossRef]
- Abdelkareem, M.; El-Baz, F. Characterizing hydrothermal alteration zones in Hamama area in the central Eastern Desert of Egypt by remotely sensed data. Geocarto Int. 2018, 33, 1307–1325. [Google Scholar] [CrossRef]
- Pour, A.; Hashim, M.; Park, Y.; Hong, J. Mapping alteration mineral zones and lithological units in Antarctic regions using spectral bands of ASTER remote sensing data. Geocarto Int. 2018, 33, 1281–1306. [Google Scholar] [CrossRef]
- Cudahy, T. Satellite ASTER Geoscience Product Notes for Australia. In Australian ASTER Geoscience Product Notes, Version 1; CSIR0 ePublish No. EP-30-07-12-44; CSIRO: Canberra, Australia, 7 August 2012. [Google Scholar]
- Testa, F.; Villanueva, C.; Cooke, D.; Zhang, L. Lithological and hydrothermal alteration mapping of epithermal, porphyry and tourmaline breccia districts in the Argentine Andes using ASTER imagery. Remote Sens. 2018, 10, 203. [Google Scholar] [CrossRef]
- Hubbard, B.; Crowley, J.; Zimbelman, D. Comparative alteration mineral mapping using visible to shortwave infrared (0.4-2.4 mu m) Hyperion, ALI, and ASTER imagery. IEEE Trans. Geosci. Remote Sens. 2003, 41, 1401–1410. [Google Scholar] [CrossRef]
- Bedini, E. Mineral mapping in the Kap Simpson complex, central East Greenland, using HyMap and ASTER remote sensing data. Adv. Space Res. 2011, 47, 60–73. [Google Scholar] [CrossRef]
- Honarmand, M.; Ranjbar, H.; Shahabpour, J. Combined use of ASTER and ALI data for hydrothermal alteration mapping in the northwestern part of the Kerman magmatic arc, Iran. Int. J. Remote Sens. 2013, 34, 2023–2046. [Google Scholar] [CrossRef]
- Pour, A.; Hashim, M. ASTER, ALI and Hyperion sensors data for lithological mapping and ore minerals exploration. Springerplus 2014, 3. [Google Scholar] [CrossRef]
- Ramos, Y.; Goita, K.; Peloquin, S. Mapping advanced argillic alteration zones with ASTER and Hyperion data in the Andes Mountains of Peru. J. Appl. Remote Sens. 2016, 10. [Google Scholar] [CrossRef]
- Gemail, K.; Abd-El Rahman, N.; Ghiath, B. Integration of ASTER and airborne geophysical data for mineral exploration and environmental mapping: A case study, Gabal Dara, North Eastern Desert, Egypt. Environ. Earth Sci. 2016, 75. [Google Scholar] [CrossRef]
- Lampinen, H.; Laukamp, C.; Occhipinti, S.; Metelka, V. Delineating Alteration Footprints from Field and ASTER SWIR Spectra, Geochemistry, and Gamma-Ray Spectrometry above Regolith-Covered Base Metal Deposits-An Example from Abra, Western Australia. Econ. Geol. 2017, 8, 1977–2003. [Google Scholar] [CrossRef]
- Liu, L.; Feng, J.; Han, L.; Zhou, J.; Xu, X.; Liu, R. Mineral mapping using spaceborne Tiangong-1 hyperspectral imagery and ASTER data: A case study of alteration detection in support of regional geological survey at Jintanzi-Malianquan area, Beishan, Gansu Province, China. Geol. J. 2018, 53, 372–383. [Google Scholar] [CrossRef]
- Hu, B.; Xu, Y.; Wan, B.; Wu, X.; Yi, G. Hydrothermally altered mineral mapping using synthetic application of Sentinel-2A MSI, ASTER and Hyperion data in the Duolong area, Tibetan Plateau, China. Ore Geol. Rev. 2018, 101, 384–397. [Google Scholar]
- Volesky, J.; Stern, R.; Johnson, P. Geological control of massive sulfide mineralization in the Neoproterozoic Wadi Bidah shear zone, southwestern Saudi Arabia, inferences from orbital remote sensing and field studies. Precambrian Res. 2003, 123, 235–247. [Google Scholar] [CrossRef]
- Karimpour, M.; Mazhari, N.; Shafaroudi, A. Discrimination of Different Erosion Levels of Porphyry Cu Deposits using ASTER Image Processing in Eastern Iran: A Case Study in the Maherabad, Shadan, and Chah Shaljami Areas. Acta Geol. Sin. 2014, 88, 1195–1213. [Google Scholar] [CrossRef]
- Mohebi, A.; Mirnejad, H.; Lentz, D. Controls on porphyry Cu mineralization around Hanza Mountain, southeast of Iran: An analysis of structural evolution from remote sensing, geophysical, geochemical and geological data. Ore Geol. Rev. 2015, 69, 187–198. [Google Scholar] [CrossRef]
- Sojdehee, M.; Rasa, I.; Nezafati, M.; Abedini, M. Application of spectral analysis to discriminate hydrothermal alteration zones at Daralu copper deposit, SE Iran. Arab. J. Geosci. 2016, 9. [Google Scholar] [CrossRef]
- Farahbakhsh, E.; Shirmard, H.; Bahroudi, A. Fusing ASTER and QuickBird-2 Satellite Data for Detailed Investigation of Porphyry Copper Deposits Using PCA; Case Study of Naysian Deposit, Iran. J. Indian Soc. Remote Sens. 2016, 44, 525–537. [Google Scholar] [CrossRef]
- Yousefi, S.J.; Ranjbar, H.; Alirezaei, S.; Dargahi, S. Discrimination of Sericite Phyllic and Quartz-Rich Phyllic Alterations by Using a Combination of ASTER TIR and SWIR Data to Explore Porphyry Cu Deposits Hosted by Granitoids, Kerman Copper Belt, Iran. J. Indian Soc. Remote Sens. 2018, 46, 717–727. [Google Scholar] [CrossRef]
- Yousefi, S.; Ranjbar, H.; Alirezaei, S.; Dargahi, S. Comparison of hydrothermal alteration patterns associated with porphyry Cu deposits hosted by granitoids and intermediate-mafic volcanic rocks, Kerman Magmatic Arc, Iran: Application of geological, mineralogical and remote sensing data. J. Afr. Earth Sci. 2018, 142, 112–123. [Google Scholar] [CrossRef]
- Safari, M.; Maghsoudi, A.; Pour, A. Application of Landsat-8 and ASTER satellite remote sensing data for porphyry copper exploration: A case study from Shahr-e-Babak, Kerman, south of Iran. Geocarto Int. 2018, 33, 1186–1201. [Google Scholar] [CrossRef]
- Pour, A.; Hashim, M. Identifying areas of high economic-potential copper mineralization using ASTER data in the Urumieh-Dokhtar Volcanic Belt, Iran. Adv. Space Res. 2012, 49, 753–769. [Google Scholar] [CrossRef]
- Pour, A.; Hashim, M. Identification of hydrothermal alteration minerals for exploring of porphyry copper deposit using ASTER data, SE Iran. J. Asian Earth Sci. 2011, 42, 1309–1323. [Google Scholar] [CrossRef]
- Honarpazhouh, J.; Hassanipak, A.; Shabani, K. Integration of stream sediment geochemical and ASTER data for porphyry copper deposit exploration in Khatun Abad, NW Iran. Arch. Min. Sci. 2013, 58, 37–54. [Google Scholar]
- Pazand, K.; Sarvestani, J.; Ravasan, M. Hydrothermal Alteration Mapping Using ASTER Data for Reconnaissance Porphyry Copper Mineralization in the Ahar Area, NW Iran. J. Indian Soc. Remote Sens. 2013, 41, 379–389. [Google Scholar] [CrossRef]
- Alimohammadi, M.; Alirezaei, S.; Kontak, D. Application of ASTER data for exploration of porphyry copper deposits: A case study of Daraloo-Sarmeshk area, southern part of the Kerman copper belt, Iran. Ore Geol. Rev. 2015, 70, 290–304. [Google Scholar] [CrossRef]
- Yazdi, Z.; Rad, A.; Ajayebi, K. Analysis and modeling of geospatial datasets for porphyry copper prospectivity mapping in Chahargonbad area, Central Iran. Arab. J. Geosci. 2015, 8, 8237–8248. [Google Scholar] [CrossRef]
- Saadat, S. Comparison of various knowledge-driven and logistic-based mineral prospectivity methods to generate Cu and Au exploration targets Case study: Feyz-Abad area (North of Lut block, NE Iran). J. Min. Environ. 2017, 8, 611–619. [Google Scholar]
- Zadeh, M.; Honarmand, M. A remote sensing-based discrimination of high- and low-potential mineralization for porphyry copper deposits; a case study from Dehaj-Sarduiyeh copper belt, SE Iran. Eur. J. Remote Sens. 2017, 50, 332–342. [Google Scholar] [CrossRef]
- Mars, J.; Rowan, L. Regional mapping of phyllic- and argillic-altered rocks in the Zagros magmatic arc, Iran, using Advanced Spaceborne Thermal Emission and Reflection Radiometer (ASTER) data and logical operator algorithms. Geosphere 2006, 2, 161–186. [Google Scholar] [CrossRef]
- Carrino, T.; Crosta, A.; Toledo, C.; Silva, A.; Silva, J. Geology and Hydrothermal Alteration of the Chapi Chiara Prospect and Nearby Targets, Southern Peru, Using ASTER Data and Reflectance Spectroscopy. Econ. Geol. 2015, 110, 73–90. [Google Scholar] [CrossRef]
- Ibrahim, W.; Watanabe, K.; Yonezu, K. Structural and litho-tectonic controls on Neoproterozoic base metal sulfide and gold mineralization in North Hamisana shear zone, South Eastern Desert, Egypt: The integrated field, structural, Landsat 7 ETM + and ASTER data approach. Ore Geol. Rev. 2016, 79, 62–77. [Google Scholar] [CrossRef]
- Zhang, T.; Yi, G.; Li, H. Integrating Data of ASTER and Landsat-8 OLI (AO) for Hydrothermal Alteration Mineral Mapping in Duolong Porphyry Cu-Au Deposit, Tibetan Plateau, China. Remote Sens. 2016, 8, 890. [Google Scholar] [CrossRef]
- Rajendran, S.; Nasir, S. Characterization of ASTER spectral bands for mapping of alteration zones of volcanogenic massive sulphide deposits. Ore Geol. Rev. 2017, 88, 317–335. [Google Scholar] [CrossRef]
- Zhang, N.; Zhou, K. Identification of hydrothermal alteration zones of the Baogutu porphyry copper deposits in northwest China using ASTER data. J. Appl. Remote Sci. 2017, 11. [Google Scholar] [CrossRef]
- Dai, J.; Qu, X.; Song, Y. Porphyry Copper Deposit Prognosis in the Middle Region of the Bangonghu-Nujiang Metallogenic Belt, Tibet, Using ASTER Remote Sensing Data. Resour. Geol. 2018, 68, 65–82. [Google Scholar] [CrossRef]
- Amer, R.; El Mezayen, A.; Hasanein, M. ASTER spectral analysis for alteration minerals associated with gold mineralization. Ore Geol. Rev. 2016, 75, 239–251. [Google Scholar]
- Salem, S.; Soliman, N.; Ramadan, T.; Greiling, R. Exploration of new gold occurrences in the alteration zones at the Barramiya District, Central Eastern Desert of Egypt using ASTER data and geological studies. Arab. J. Geosci. 2014, 7, 1717–1731. [Google Scholar] [CrossRef]
- Salem, S.; Soliman, N. Exploration of gold at the east end of Wadi Allaqi, South Eastern Desert, Egypt, using remote sensing techniques. Arab. J. Geosci. 2015, 8, 9271–9282. [Google Scholar] [CrossRef]
- Hasan, E.; Fagin, T.; El Alfy, Z. Spectral Angle Mapper and aeromagnetic data integration for gold-associated alteration zone mapping: A case study for the Central Eastern Desert Egypt. Int. J. Remote Sens. 2016, 37, 1762–1776. [Google Scholar] [CrossRef]
- Salem, S.; El Sharkawi, M.; El-Alfy, Z.; Soliman, N.; Ahmed, S. Exploration of gold occurrences in alteration zones at Dungash district, Southeastern Desert of Egypt using ASTER data and geochemical analyses. J. Afr. Earth Sci. 2016, 117, 389–400. [Google Scholar] [CrossRef]
- Abdelnasser, A.; Kumral, M.; Zoheir, B.; Karaman, M. REE geochemical characteristics and satellite-based mapping of hydrothermal alteration in Atud gold deposit, Egypt. J. Afr. Earth Sci. 2018, 145, 317–330. [Google Scholar] [CrossRef]
- Salem, S.; El Sharkawi, M.; El Alfy, Z.; Ahmed, S. The use of ASTER data and geochemical analyses for the exploration of gold at Samut area, South Eastern Desert of Egypt. Arab. J. Geosci. 2018, 11, 11–18. [Google Scholar] [CrossRef]
- Hot Copper. Available online: https://hotcopper.com.au/threads/ann-aster-interpretation-identifies-new-target-a.2066859/ (accessed on 3 January 2019).
- Western Australia Satellite Technology and Applications Consortium (WASTAC). 2014 Annual Report; 2014; 56p. Available online: https://www.wastac.wa.gov.au (accessed on 23 August 2018).
- Zhang, X.; Pamer, M.; Duke, N. Lithologic and mineral information extraction for gold exploration using ASTER data in the south Chocolate Mountains (California). ISPRS J. Photogramm. Remote Sens. 2007, 62, 271–282. [Google Scholar] [CrossRef]
- De Palomera, P.; van Ruitenbeek, F.; Carranza, E. Prospectivity for epithermal gold-silver deposits in the Deseado Massif, Argentina. Ore Geol. Rev. 2015, 71, 484–501. [Google Scholar] [CrossRef]
- Wells, M.; Laukamp, C.; Hancock, E. Reflectance spectroscopic characterisation of mineral alteration footprints associated with sediment-hosted gold mineralisation at Mt Olympus (Ashburton Basin, Western Australia). Aust. J. Earth Sci. 2016, 63, 987–1002. [Google Scholar]
- Yao, K.; Pradhan, B.; Idrees, M. Identification of Rocks and Their Quartz Content in Gua Musang Goldfield Using Advanced Spaceborne Thermal Emission and Reflection Radiometer Imagery. J. Sens. 2017. [Google Scholar] [CrossRef]
- Yousefi, T.; Aliyari, F.; Abedini, A.; Calagari, A. Integrating geologic and Landsat-8 and ASTER remote sensing data for gold exploration: A case study from Zarshuran Carlin-type gold deposit, NW Iran. Arab. J. Geosci. 2018, 11, 482–499. [Google Scholar] [CrossRef]
- Rani, K.; Guha, A.; Mondal, S.; Pal, S.; Kumar, K. ASTER multispectral bands, ground magnetic data, ground spectroscopy and space-based EIGEN6C4 gravity data model for identifying potential zones for gold sulphide mineralization in Bhukia, Rajasthan, Indian. J. Appl. Geophys. 2019, 160, 28–46. [Google Scholar] [CrossRef]
- Rajendran, S.; Thirunavukkarasu, A.; Balamurugan, G.; Shankar, K. Discrimination of iron ore deposits of granulite terrain of Southern Peninsular India using ASTER data. J. Asian Earth Sci. 2011, 41, 99–106. [Google Scholar] [CrossRef]
- Huang, S.; Chen, S.; Zhang, Y. Comparison of altered mineral information extracted from ETM plus, ASTER and Hyperion data in aguas Claras iron ore, Brazil. IET Image Proc. 2019, 13, 355–364. [Google Scholar] [CrossRef]
- Duuring, P.; Hagemann, S.; Novikova, Y.; Cudahy, T.; Laukamp, C. Targeting Iron Ore in Banded Iron Formations Using ASTER Data: Weld Range Greenstone Belt, Yilgarn Craton, Western Australia. Econ. Geol. 2012, 107, 585–597. [Google Scholar] [CrossRef]
- Mansouri, E.; Feizi, F.; Rad, A.; Arian, M. Remote-sensing data processing with the multivariate regression analysis method for iron mineral resource potential mapping: A case study in the Sarvian area, Central Iran. Solid Earth 2018, 9, 373–384. [Google Scholar] [CrossRef]
- Mazhari, N.; Shafaroudi, A.; Ghaderi, M. Detecting and mapping different types of iron mineralization in Sangan mining region, NE Iran, using satellite image and airborne geophysical data. Geosci. J. 2017, 21, 137–148. [Google Scholar] [CrossRef]
- Moghtaderi, A.; Moore, F.; Ranjbar, H. Application of ASTER and Landsat 8 imagery data and mathematical evaluation method in detecting iron minerals contamination in the Chadormalu iron mine area, central Iran. J. Appl. Remote Sci. 2017, 11, 016027. [Google Scholar] [CrossRef]
- Cardoso-Fernandes, J.; Teodoro, A.; Lima, A. Remote sensing data in lithium (Li) exploration: A new approach for the detection of Li-bearing pegmatites. Int. J. Appl. Earth Obs. Geoinform. 2019, 76, 10–25. [Google Scholar] [CrossRef]
- Shawky, M.; El-Arafy, R.; El Zalaky, M. Validating (MNF) transform to determine the least inherent dimensionality of ASTER image data of some uranium localities at Central Eastern Desert. Egypt. J. Afr. Earth Sci. 2019, 149, 441–450. [Google Scholar] [CrossRef]
- Hewson, R.; Cudahy, T.; Drake-Brockman, J.; Meyers, J.; Hashemi, A. Mapping geology associated with manganese mineralisation using spectral sensing techniques at Woodie Woodie, East Pilbara. Explor. Geophys. 2006, 37, 389–400. [Google Scholar] [CrossRef]
- Othman, A.; Gloaguen, R. Improving Lithological Mapping by SVM Classification of Spectral and Morphological Features: The Discovery of a New Chromite Body in the Mawat Ophiolite Complex (Kurdistan, NE Iraq). Remote Sens. 2014, 6, 6867–6896. [Google Scholar] [CrossRef] [Green Version]
- Fu, B.; Zheng, G.; Ninomiya, Y.; Wang, C.; Sun, G. Mapping hydrocarbon-induced mineralogical alteration in the northern Tian Shan using ASTER multispectral data. Terra Nova 2007, 19, 225–231. [Google Scholar] [CrossRef]
- Shi, B.; Fu, B.; Ninomiya, Y.; Wang, C. Multispectral remote sensing mapping for hydrocarbon seepage-induced lithologic anomalies in the Kuqa foreland basin, south Tian Shan. J. Asian Earth Sci. 2012, 46, 70–77. [Google Scholar] [CrossRef]
- Soydan, H.; Koz, A.; Duzgun, H. Identification of hydrocarbon microseepage induced alterations with spectral target detection and unmixing algorithms. Int. J. Appl. Earth Obs. Geoinform. 2019, 74, 209–221. [Google Scholar] [CrossRef]
- Pena, S.; Abdelsalam, M. Orbital remote sensing for geological mapping in southern Tunisia: Implication for oil and gas exploration. J. Afr. Earth Sci. 2006, 44, 203–219. [Google Scholar] [CrossRef]
- Petrovic, A.; Khan, S.; Chafetz, H. Remote detection and geochemical studies for finding hydrocarbon-induced alterations in Lisbon Valley, Utah. Mar. Petrol. Geol. 2008, 25, 696–705. [Google Scholar] [CrossRef]
- Mars, J. Mineral and lithologic mapping capability of WorldView 3 data at Mountain Pass, California, using true- and false-color composite images, band rations, and logical operator algorithms. Econ. Geol. 2018, 113, 1587–1601. [Google Scholar] [CrossRef]
- Abrams, M. ASTER: Data products for the high spatial resolution imager on NASA’s EOS-AM1 platform. Int. J. Remote Sens. 2000, 21, 847–861. [Google Scholar] [CrossRef]
- Data Processing Levels. Available online: https://science.nasa.gov/earth-science/earth-science-data/data-processing-levels-for-eosdis-data-products (accessed on 15 August 2018).
- ASTER Data Products. Available online: https://lpdaac.usgs.gov/dataset_discovery/aster/aster_products_table (accessed on 9 August 2018).
Figure 1.
Artist’s rendition of Terra platform and position of Advanced Spaceborne Thermal Emission and Reflection Radiometer (ASTER)’s visible to near infrared wavelengths (VNIR), short wave infrared (SWIR) and thermal infrared (TIR) imaging sensors.
Figure 1.
Artist’s rendition of Terra platform and position of Advanced Spaceborne Thermal Emission and Reflection Radiometer (ASTER)’s visible to near infrared wavelengths (VNIR), short wave infrared (SWIR) and thermal infrared (TIR) imaging sensors.

Figure 2.
Spectral bandpasses of ASTER, Landsat Thematic Mapper, and the Operational Land Imager (OLI), the newest Landsat 8. Background is atmospheric transmission (Testa, F. et al. 2018).
Figure 2.
Spectral bandpasses of ASTER, Landsat Thematic Mapper, and the Operational Land Imager (OLI), the newest Landsat 8. Background is atmospheric transmission (Testa, F. et al. 2018).

Figure 3.
Australian ASTER Geoscience map of iron oxide abundance. Color code is red for high, to black for low [99].
Figure 3.
Australian ASTER Geoscience map of iron oxide abundance. Color code is red for high, to black for low [99].

Figure 4.
Landsat TM band 7 image with ASTER-derived argillic and phyllic alteration around the Meiduk copper mine, Iran. (From [126], Figure 17).
Figure 4.
Landsat TM band 7 image with ASTER-derived argillic and phyllic alteration around the Meiduk copper mine, Iran. (From [126], Figure 17).

Figure 5.
ASTER interpretation of clay anomalies and delineation of five target areas. Pick/shovel symbol represents known gold of copper prospects. ASX (Australian Stock Exchange) announcement [140].
Figure 5.
ASTER interpretation of clay anomalies and delineation of five target areas. Pick/shovel symbol represents known gold of copper prospects. ASX (Australian Stock Exchange) announcement [140].

Figure 6.
Published (from Kentor Gold) geology and mineral occurrences in the Jervois area, Northern Territory (left) and propyllitic alteration (warmer colors) evident in the ASTER “MgOH” product, which was critical in the discovery of Chukbo (right).
Figure 6.
Published (from Kentor Gold) geology and mineral occurrences in the Jervois area, Northern Territory (left) and propyllitic alteration (warmer colors) evident in the ASTER “MgOH” product, which was critical in the discovery of Chukbo (right).

© 2019 by the authors. Licensee MDPI, Basel, Switzerland. This article is an open access article distributed under the terms and conditions of the Creative Commons Attribution (CC BY) license (http://creativecommons.org/licenses/by/4.0/).
Share and Cite
MDPI and ACS Style
Abrams, M.; Yamaguchi, Y. Twenty Years of ASTER Contributions to Lithologic Mapping and Mineral Exploration. Remote Sens. 2019, 11, 1394. https://0-doi-org.brum.beds.ac.uk/10.3390/rs11111394
AMA Style
Abrams M, Yamaguchi Y. Twenty Years of ASTER Contributions to Lithologic Mapping and Mineral Exploration. Remote Sensing. 2019; 11(11):1394. https://0-doi-org.brum.beds.ac.uk/10.3390/rs11111394
Chicago/Turabian StyleAbrams, Michael, and Yasushi Yamaguchi. 2019. "Twenty Years of ASTER Contributions to Lithologic Mapping and Mineral Exploration" Remote Sensing 11, no. 11: 1394. https://0-doi-org.brum.beds.ac.uk/10.3390/rs11111394
Note that from the first issue of 2016, this journal uses article numbers instead of page numbers. See further details here.