Performance Assessment of SM2RAIN-CCI and SM2RAIN-ASCAT Precipitation Products over Pakistan


1
State Key Laboratory of Hydroscience and Engineering, Tsinghua University, Beijing 100084, China
2
NICE, SCEE, National University of Sciences & Technology Islamabad, Islamabad 44000, Pakistan
*
Author to whom correspondence should be addressed.
Remote Sens. 2019, 11(17), 2040; https://0-doi-org.brum.beds.ac.uk/10.3390/rs11172040
Submission received: 16 July 2019
/
Revised: 12 August 2019
/
Accepted: 27 August 2019
/
Published: 29 August 2019
(This article belongs to the Special Issue Remote Sensing of Precipitation: Part II)
Abstract
:Accurate estimation of precipitation from satellite precipitation products (PPs) over the complex topography and diverse climate of Pakistan with limited rain gauges (RGs) is an arduous task. In the current study, we assessed the performance of two PPs estimated from soil moisture (SM) using the SM2RAIN algorithm, SM2RAIN-CCI and SM2RAIN-ASCAT, on the daily scale across Pakistan during the periods 2000–2015 and 2007–2015, respectively. Several statistical metrics, i.e., Bias, unbiased root mean square error (ubRMSE), Theil’s U, and the modified Kling–Gupta efficiency (KGE) score, and four categorical metrics, i.e., probability of detection (POD), false alarm ratio (FAR), critical success index (CSI), and Bias score, were used to evaluate these two PPs against 102 RGs observations across four distinct climate regions, i.e., glacial, humid, arid and hyper-arid regions. Total mean square error (MSE) is decomposed into systematic (MSEs) and random (MSEr) error components. Moreover, the Tropical Rainfall Measurement Mission Multi-Satellite Precipitation Analysis (TRMM TMPA 3B42v7) was used to assess the performance of SM2RAIN-based products at 0.25° scale during 2007–2015. Results shows that SM2RAIN-based product highly underestimated precipitation in north-east and hydraulically developed areas of the humid region. Maximum underestimation for SM2RAIN-CCI and SM2RIAN-ASCAT were 58.04% and 42.36%, respectively. Precipitation was also underestimated in mountainous areas of glacial and humid regions with maximum underestimations of 43.16% and 34.60% for SM2RAIN-CCI. Precipitation was overestimated along the coast of Arabian Sea in the hyper-arid region with maximum overestimations for SM2RAIN-CCI (SM2RAIN-ASCAT) of 59.59% (52.35%). Higher ubRMSE was observed in the vicinity of hydraulically developed areas. Theil’s U depicted higher accuracy in the arid region with values of 0.23 (SM2RAIN-CCI) and 0.15 (SM2RAIN-ASCAT). Systematic error components have larger contribution than random error components. Overall, SM2RAIN-ASCAT dominates SM2RAIN-CCI across all climate regions, with average percentage improvements in bias (27.01% in humid, 5.94% in arid, and 6.05% in hyper-arid), ubRMSE (19.61% in humid, 20.16% in arid, and 25.56% in hyper-arid), Theil’s U (9.80% in humid, 28.80% in arid, and 26.83% in hyper-arid), MSEs (24.55% in humid, 13.83% in arid, and 8.22% in hyper-arid), MSEr (19.41% in humid, 29.20% in arid, and 24.14% in hyper-arid) and KGE score (5.26% in humid, 28.12% in arid, and 24.72% in hyper-arid). Higher uncertainties were depicted in heavy and intense precipitation seasons, i.e., monsoon and pre-monsoon. Average values of statistical metrics during monsoon season for SM2RAIN-CCI (SM2RAIN-ASCAT) were 20.90% (17.82%), 10.52 mm/day (8.61 mm/day), 0.47 (0.43), and 0.47 (0.55) for bias, ubRMSE, Theil’s U, and KGE score, respectively. TMPA outperformed SM2RAIN-based products across all climate regions. SM2RAIN-based datasets are recommended for agricultural water management, irrigation scheduling, flood simulation and early flood warning system (EFWS), drought monitoring, groundwater modeling, and rainwater harvesting, and vegetation and crop monitoring in plain areas of the arid region.

1. Introduction
Precipitation is one of the most critical components of global energy and water cycles and ranked first by the Global Climate Observing System (GCOS) [1,2]. Reliable long-term temporal precipitation records at fine spatiotemporal (<20 km at daily and sub-daily scales) resolution is crucial for planning and managing water resources, drought assessment, flood forecasting, assessment of crop water requirements, hydrometeorology, and climate studies [3,4,5,6,7]. Precipitation also plays an important role in weather prediction, agricultural management, vector and water-borne diseases [8].
Precipitation is highly erratic spatiotemporally, which makes its estimation challenging both with ground observation (rain gauges and meteorological radars) and satellite precipitation products (PPs). The complex topography, varying climate, dense vegetation, and coastal regions attribute to further complexity in precipitation estimation [9,10]. Ground-based rain gauges (RGs) provide accurate local precipitation estimates [11], and are considered as the most reliable precipitation record source for hydrological modeling and monitoring purposes. However, their non-homogeneous coverage, limited spatial representativeness, and high maintenance cost restrain their global scale application [12].
Meteorological models, such as reanalysis products, are alternatively used to estimate precipitation, especially in regions with scarce RGs and reliable ground observations [13]. The uncertainties associated with these estimates in areas with scarce RGs can be substantial [14]. Therefore, in the past 30 years, different remote sensing techniques have been developed to improve the precipitation estimations and provide full regional and global spatial coverage [15]. The standard precipitation measurement methods are based on instantaneous precipitation measurements from space retrieved from microwave radiometers, radars, and infrared sensors [16]. These methods invert the atmospheric signals reflected or radiated by hydrometeors and known as the “top-down” approach [9].
PPs estimate precipitation from thermal infrared sensors onboard geosynchronous earth orbit (GEO), and microwave sensors (both passive and active) onboard low-earth orbit (LEO) satellites [10,17]. Some PPs combine infrared- and microwave-based estimates by utilizing high temporal resolution infrared platforms and shows high precision in precipitation estimation of microwave sensors [18]. Such PPs include the most recently developed PPs with high spatial (0.1°) and temporal (30 minutes) resolution, i.e., Integrated Multi-Satellite Retrievals for Global Precipitation Measurement (IMERG) of the Global Precipitation Measurement (GPM) mission [15], near-real-time and post real versions of the Tropical Rainfall Measurement Mission Multi-Satellite Precipitation Analysis (TRMM TMPA 3B42RT, 3B42V6/V7) [19], the Climate Hazards Group InfraRed Precipitation with Stations (CHIRPS) [20], Climate Prediction Center (CPC) Morphing (CMORPH) [21], Precipitation Estimation from Remotely Sensed Information using Artificial Neural Networks (PERSIANN) [22,23], Global Satellite Mapping of Precipitation (GSMaP) [24] and many more.
Soil Moisture (SM) TO RAIN (SM2RAIN) is an algorithm based on approaches provided by Crow et al. [25] and Pellarin et al. [26] and further developed by Brocca et al. [27], which can be used for direct precipitation estimation from in-situ and/or satellite-based SM observations. The method provides daily precipitation estimates on a global scale and has been successfully applied to satellite SM data [9,28,29]. SM2RAIN approach is appropriate for accumulated precipitation estimates and has been verified against in-situ SM data and single-sensor SM products [30,31] providing reliable results at the regional scale [32,33,34].
SM2RAIN is based on the “bottom-up” approach that estimates precipitation from various single-sensors surface soil moisture (SSM), as opposed to “top-down” approach of other PPs [27,30,35,36]. The bottom-up approach differs from top-down approach in such a way that the bottom-up approach considers accumulated precipitation while the top-down approach is based on instantaneous precipitation rate. The bottom-up approach has an edge over top-down when accumulated precipitation (e.g., daily precipitation) estimates are desirable as this approach requires a limited number of satellite sensors and measurements. On the other hand, the limitations of the bottom-up approach are its dependence on topography (low accuracy over complex topography) and land use (low accuracy over dense vegetation), unable to estimate precipitation in over-saturated soil, and applicable only to terrestrial rainfall [9].
The bottom-up approach has been extensively validated over extended-spectrum of spatial scales, including global [9,25,37], continental [35,38], and regional [32,39,40,41,42] scales. Different SM PPs are considered, such as SMOS (Soil Moisture Ocean Salinity Mission, [35]), ASCAT (Advanced SCATterometer, [43]), AMSR-E (Advanced Microwave Scanning Radiometer, [44]), and SMAP (Soil Moisture Active and Passive, [28,29]). Recently, a number of studies have employed precipitation estimates from satellites obtained through the bottom-up approach in hydrological and water resources applications [3,17,31,45]. These studies demonstrated the potential benefits and main limitations of the bottom-up approach in estimating precipitation from space. The accuracy of the bottom-up approach is strongly influenced by the accuracy and temporal resolution of satellite SM products [46].
The objectives of this study were two-fold, i.e., to assess the performance of SM2RAIN-CCI and SM2RAIN-ASCAT for the first time in Pakistan, a country with a complex topography and diverse climate, and to evaluate the performance of SM2RAIN-derived products against extensively evaluated PP in Pakistan (TRMM TMPA 3B42v7, hereinafter referred as TMPA). The analysis was performed in four climate regions of Pakistan, i.e., glacial, humid, arid and hyper-arid regions, during the period 2000-2015. This study is the first of its kind that evaluates the quality of SM2RAIN-based precipitation datasets across Pakistan. This study can be used as a reference for hydrological modeling, water resources management, and agricultural water management practices. Moreover, there are very limited studies on integrated performance evaluation of SM2RAIN-based precipitation datasets in regions with complex topography and diverse climate, especially in Pakistan.
Pakistan is a developing country that has very limited/scarce rain gauges (RGs), which are non-homogenously distributed. Even with a significant increase in the number of RGs over the last few decades, their density does not meet scientific and practical requirements. To overcome the current scenario, Pakistan needs the application of advanced remote sensing techniques for hydrological and meteorological applications, climate change studies, agricultural water management, and water resources management. This study evaluated the soil moisture-based precipitation datasets, which will be a useful alternative to conventional precipitation products for different hydrological and meteorological applications and will address the data scarcity problems in Pakistan.
The significance of the current study is: (1) This study demonstrates the worth/quality of SM2RAIN-based datasets by evaluation on spatial and temporal scales, (2) the spatial and temporal evaluation helps us to understand where, when and how these precipitation products might be used, (3) better performance of these products in the arid (and semi-arid regions), i.e., Punjab province of Pakistan considered as agricultural hub of the country, illustrates the potential application of SM2RAIN-based datasets for agriculture (vegetation and crop growth monitoring) and agricultural water management, and much more.
2. Materials and Methods
2.1. Study Area
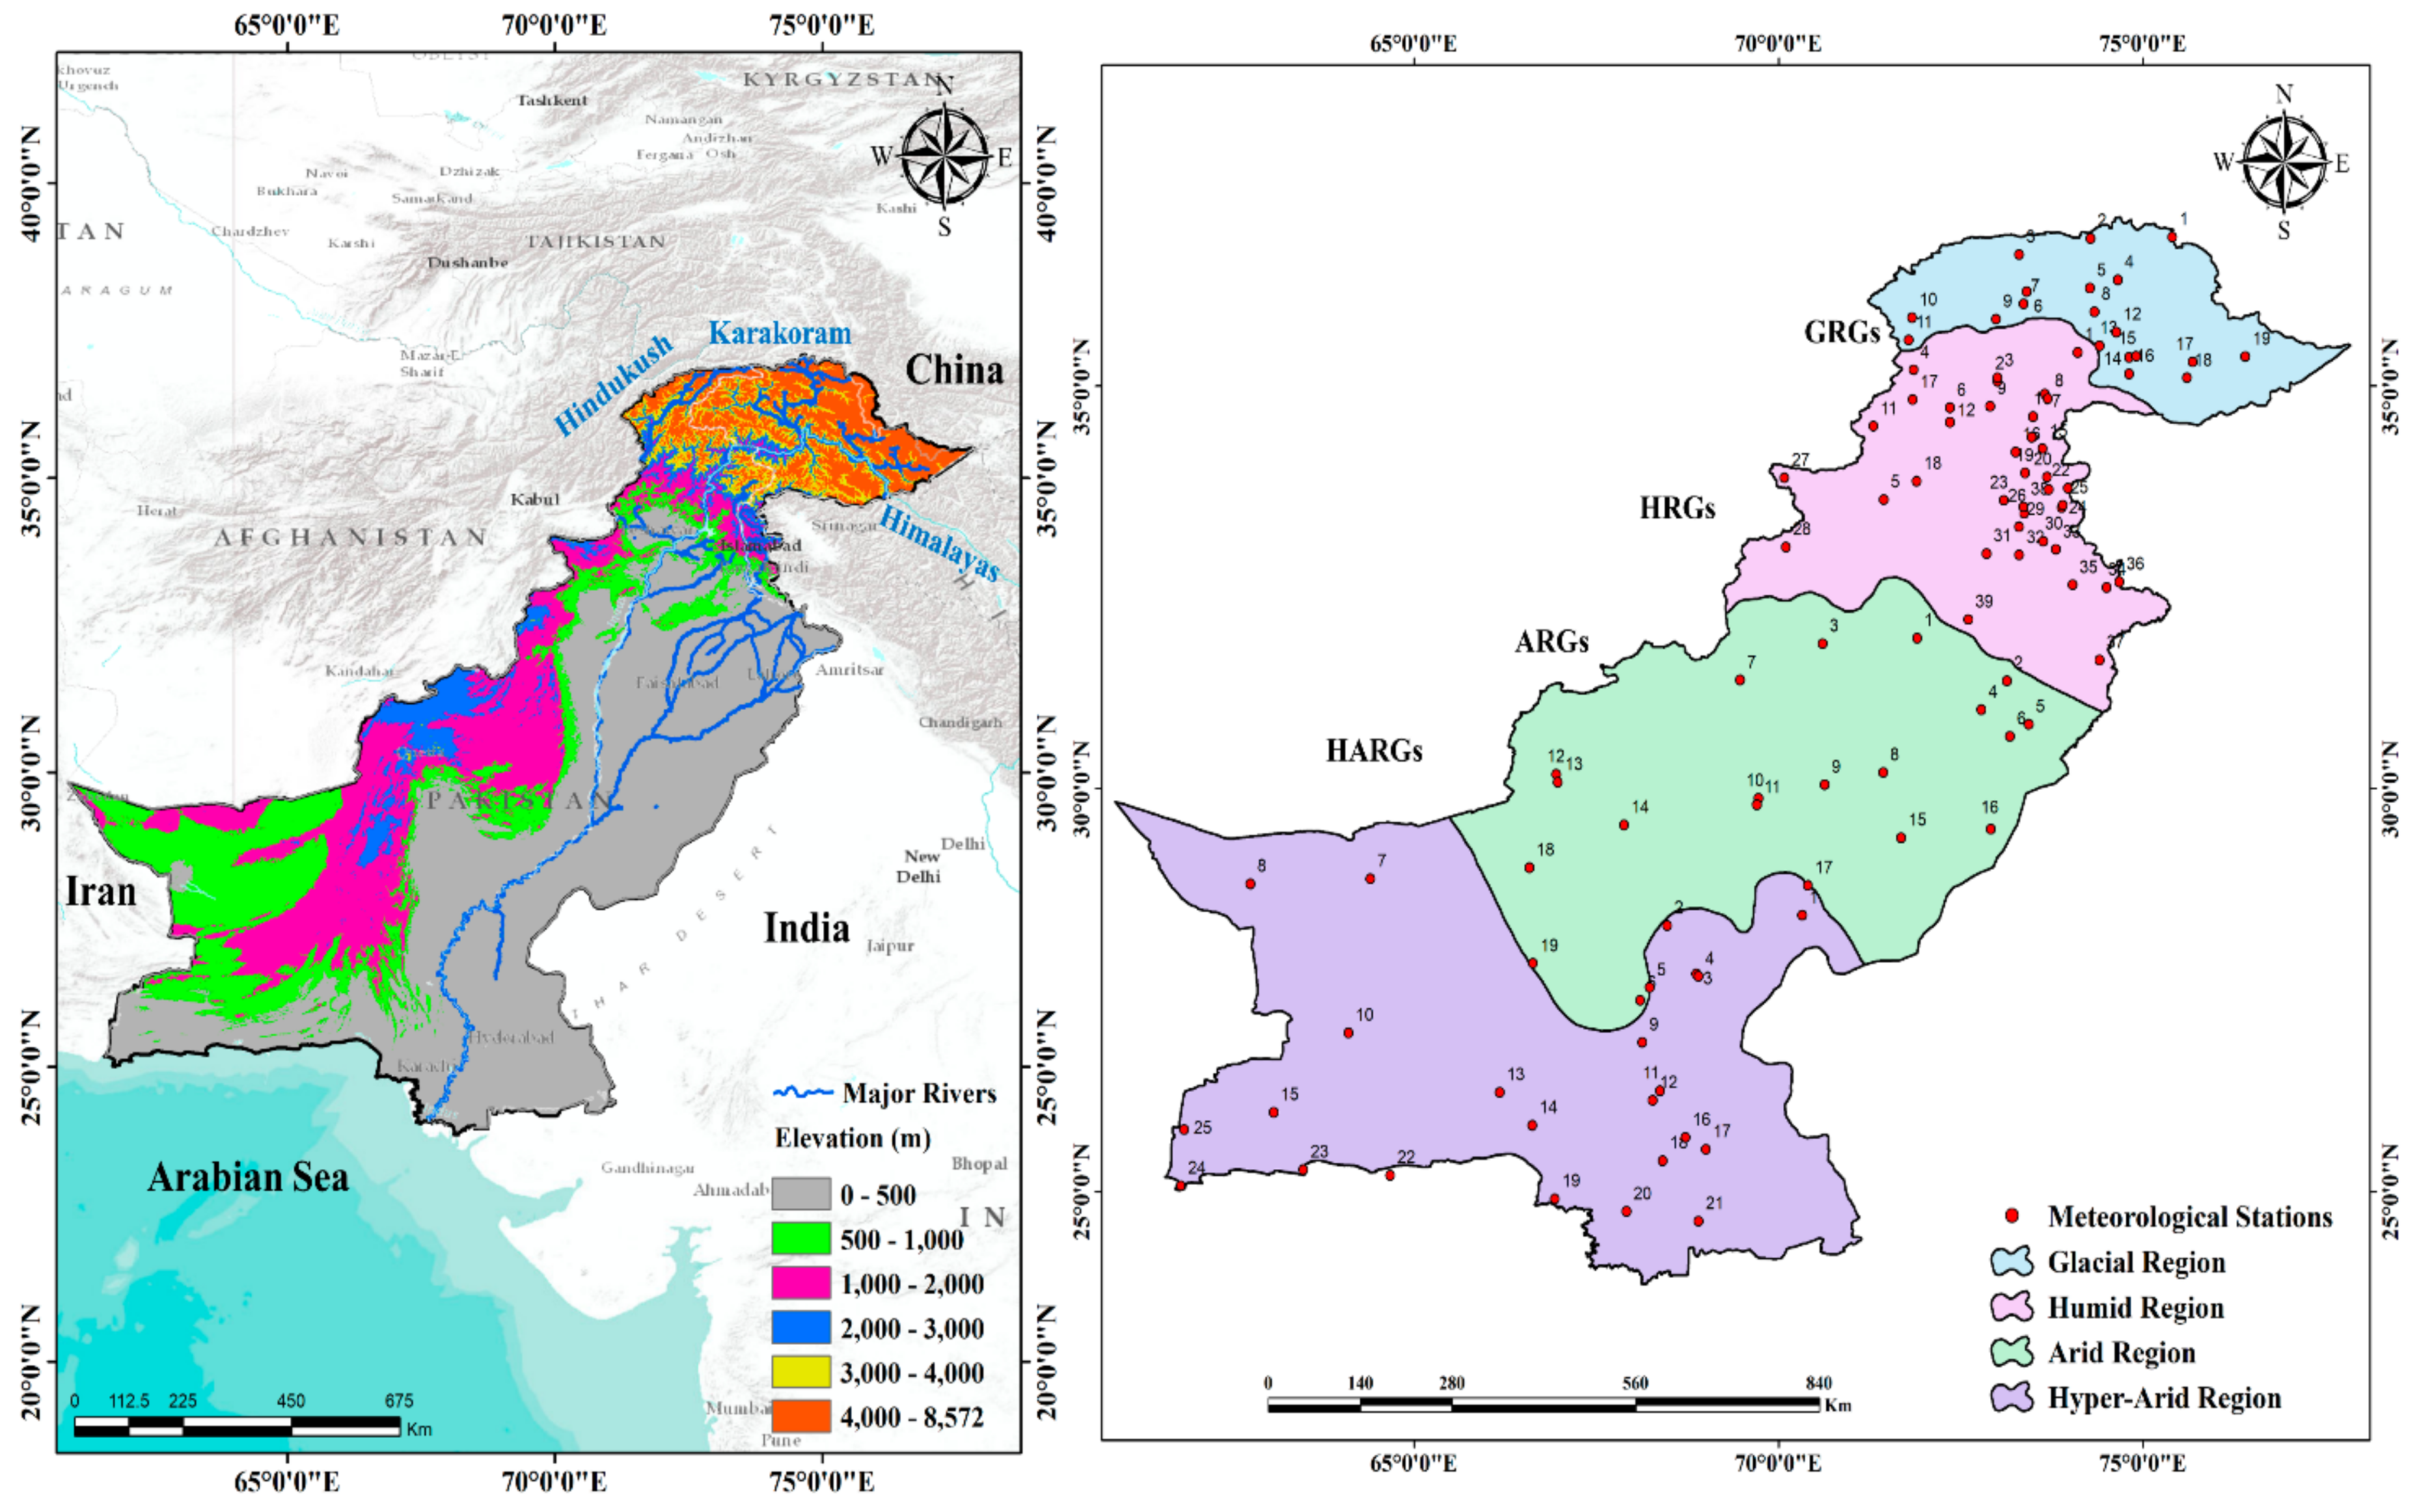
Pakistan lies between latitude 23.5°–37.5°N and longitude 62°–75°E in the western region of South-Asia with an area of 803,940 km2 (Figure 1a). Pakistan is bounded by China at its north, Iran and Afghanistan at the west, India at the east, and the Arabian Sea at the south. The study area has complex topography with a diverse climate. Elevation of Pakistan ranges from 8600 m (at Hindukush-Himalaya mountain ranges) at the extreme north to 0 m (at the coast of Arabian Sea) [47]. The climate of Pakistan changes abruptly, ranging from glacial to humid, arid and hyper-arid regions. According to climate variability, the study area is divided into glacial, humid, arid and hyper-arid climate regions (Figure 1b).
The glacial region, situated in the extreme north of Pakistan, is characterized by permanent glaciers and snow cover. Mean elevation of the glacial region is 4158 m, with the mean annual precipitation of 348 mm. Snow and glaciers from the glacial region melt in summer and feed the Indus river and its branches. Water from snowmelt is the primary source of agricultural, domestic, and industrial water use in Pakistan. Moreover, the country is threatened by excessive snow and glacier melt that causes acute flooding, such as the 2010 flood which severely damaged the infrastructure, the country’s economy and took thousands of lives. The glacial region is located between 34°N to 38°N and comprised of the world-famous mountains of Hindukush Himalayas, which are famous for snow after the polar regions.
The humid region consists of mountains ranges of Hindukush–Karakoram–Himalaya (HKH) ranges, and all of the main rivers originating from these mountains, including Indus, Kabul, Gilgit, Hunza, Swat, Panjkora, Kurram, and Jhelum rivers. Mean elevation and mean annual precipitation of the humid region is 1286 m and 852 mm, respectively. The humid region is the hydraulically developed region of the country which consists of the largest dam, Tarebla dam, and Mangla dam. The Tarbela dam, constructed on the Indus river, has 3500 MW of capacity, while the Mangla dam constructed on Jhelum river has 1000 MW hydropower capacity [48]. Moreover, the humid region is built up with extensive barrages, headworks, and a developed integrated irrigation canal system. The secondary purpose of the hydraulic structures is to support the agriculture sector of the country by meeting the extensive irrigation water requirements [48].
The arid region is mostly comprised of the major agricultural regions of Punjab province. The Indus river and other rivers flowing through this region are the primary sources of water for agricultural, domestic, and industrial purposes. Mean elevation of the arid region is 663 m with mean annual precipitation of 322 mm. Extreme west (elevated mountainous areas) of this region is cold in winter (with snowfall in December and January) and hot in the summer seasons. The remaining of the arid zone is dry and hot in nature where maximum temperatures are recorded in Sibbi and Jacobabad. The area is plain with some area included in the famous Thar Desert [49].
Sindh and Balochistan provinces and the south part of the Punjab province of Pakistan lie in the hyper-arid region. Most of the hyper-arid region is comprised of deserts, plateaus, barren lands, dry mountains, and coastal region along the Arabian Sea. Mean elevation and mean annual precipitation in the hyper-arid region are 444 m and 133 mm, respectively.
Precipitation in Pakistan is spatially varying from the maximum of 1500 mm/a in the north to a minimum of 100 mm/a in the south. Monsoon and winter (western disturbance) are the dominant seasons where maximum rainfall occurs [50]. Monsoon (July to September) precipitation in Pakistan commences from the Bay of Bengal entering Pakistan from northeast and east sides. Heavy and intense precipitation accounting 55%–60% of precipitation per annum occurs in Pakistan during the monsoon season [51]. Winter (December to March) precipitation originating from the Mediterranean Sea enters Pakistan through Afghanistan and Iran. Only 30% of total precipitation (moderate magnitude) occurs during winter. Precipitation across Pakistan varies spatially in magnitude; low precipitation in the glacial region from 34 to 36° N (<100 mm/month), high in the humid region from 29 to 33° N (>700 mm/month in North-East) and low again in the hyper-arid region from 24 to 28° N (around 100 mm) [47].
2.2. Ground-Based Precipitation Data
Rain gauges (RGs) are considered as standard sources of precipitation estimates that are used for satellite precipitation calibration and validation processes. The Pakistan Meteorology Department (PMD) and the Snow and Ice Hydrology Project (SIHP) of Water And Power Development Authority (WAPDA) own the climate and hydrological data in Pakistan. SIHP operates the meteorological stations at high elevation mostly located in glacial and humid regions. For the current study, daily precipitation records from 102 meteorological stations for the period 2000–2015 were collected from both organizations, where precipitation records of 79 RGs were collected from PMD and 23 from WAPDA. The location of meteorological stations across Pakistan is shown in Figure 1b. RGs in the current studies are named with respect to each climate region, i.e., RGs in glacial, humid, arid and hyper-arid regions are represented as GRG, HRG, ARG, and HARG, respectively. Main features and number of RGs in selected climate regions are presented in Table 1.
The data obtained from PMD and WAPDA were manually collected, and consequently might be subjected to personal and instrumental errors. Besides, the stations located at high elevation may also be subjected to splashing and wind errors. These associated errors affect the quality of the data. Therefore, PMD and WAPDA correct the RGs precipitation following the World Meteorology Organization’s standard code (WMO-N). Moreover, the quality of the data was tested using skewness and kurtosis methods, and missing data was filled using the zero-order method [47].
2.3. Satellite-Based Precipitation Products
2.3.1. SM2RAIN-CCI
The European Space Agency Climate Change Initiative (ESA-CCI) released the ESA CCI SM (Soil Moisture) v3.2 datasets in early 2017. SM retrievals from active and passive microwave instruments onboard different satellite platforms were merged to develop the dataset, which provides global daily SM estimates with 0.25° spatial resolution from 1978–2015 [52,53,54]. Accumulated precipitation estimates between 00:00 to 23:59 UTC are obtained from an application of a weighted average-based integration procedure. Quality flag provided within the raw SM observations (i.e., EA CCI SM v3.2) is used to remove the low-quality data and observations distinguished by retrieval issues (e.g., glacial regions, frozen soil, complex topography, and dense vegetation). The SM2RAIN algorithm was calibrated on a pixel-by-pixel basis during the periods of 1998–2001, 2002–2006, and 2007–2013 against Global Precipitation Climatology Centre Full Daily Data (GPCC-FDD) [37]. These different calibration periods are dependent on types of data and sensors that have been utilized in developing the active and passive SM datasets.
The SM2RAIN algorithm, a novel approach, estimates precipitation from SM using the inverted soil water balance equation [9]. The basic assumption of the SM2RAIN algorithm is that surface runoff and evapotranspiration rate are insignificant during the precipitation event [9,32]. The simple form of soil–water balance equation can be illustrated as
where p(t) is precipitation rate [L/T], Z*=nZ is soil water capacity [L] in the soil layer with a depth of Z and porosity of n, s(t) represents relative soil saturation, t is time [T], and the two parameters a and b represent the nonlinearity between drainage and soil saturation. The parameters Z*, a, and b are calculated through calibration analysis [37]. The main limitation of the SM2RAIN algorithm is that it is not able to estimate the precipitation when the soil is saturated or nearly saturated, because the SM algorithm is unable to derive SM variation as the SM approaches saturation [30]. A more detailed description of SM2RAIN algorithm can be found in [32]. In the current study, v2.0 of the SM2RAIN-CCI product, available from 1 January 1998 to 31 December 2015 (released in July 2018) with 0.25° spatial and daily temporal resolutions, is used.
2.3.2. SM2RAIN-ASCAT
The SM2RAIN algorithm was applied to three surface SM products obtained from Advanced Microwave Scanning Radiometer for Earth Observing (AMSR-E), Soil Moisture and Ocean Salinity (SMOS), and Advanced SCATterometer (ASCAT) to develop the SM2RAIN-ASCAT dataset [9]. ASCAT is a scatterometer and consists of the space segment of the EUMETSAT Polar System (EPS), operating at 5.255 GHz (C-band VV polarization) onboard MetOp A, B, and C satellites [55]. The spatial resolution of SM2RAIN-ASCAT is the same as the parent ASCAT SM dataset (previously developed datasets were resampled to spatial resolutions of 0.5° and 1°). SM2RAIN-ASCAT has 12.5 km spatial and daily temporal resolutions available for the period 2007–2018 [46]. The SM2RAIN-ASCAT showed more accuracy when evaluated on the basis of root mean square error (RMSE), Pearson correlation coefficient (R), and detection of precipitation [9].
The main differences between SM2RAIN-CCI and SM2RAIN-ASCAT datasets are the input SM datasets (input products for SM2RAIN-CCI are the ESA CCI SM product [56], and the time span of SM2RAIN-CCI that is available, namely, the period of 1998–2015). Moreover, the SM2RAIN-ASCAT is bias-corrected and calibrated against the Medium-Range Weather Forecasts (ERA5) instead of GPCC-FDD as SM2RAIN-CCI [43,46]. In the current study, version 1.0 of SM2RAIN-ASCAT, released in March 2019, is used.
2.3.3. TRMM TMPA
TRMM TMPA 3B42 v7 (hereinafter TMPA) was established by the joint efforts of the National Aeronautics and Space Administration (NASA) Goddard Space Flight Center (GSFC) and the Japan Aerospace Exploration Agency (JAXA). TMPA has 0.25° (~25 km at the equator) spatial resolution ranging from 50° S and 50° N bands with 3 hours temporal resolution available from January 1998 to the present. Precipitation estimation is based on the observations in infrared and microwave bands obtained by satellites. Re-analyzed precipitation data from the GPCC-FDD dataset was used to compute these multi-satellite precipitation estimates [57,58]. The complete description of TMPA is provided by reference [19]. The motivation behind the selection of TMPA is the fact that it has been evaluated comprehensively by many studies and is reported for its supremacy in comparison to other datasets [47,59].
2.4. Methods
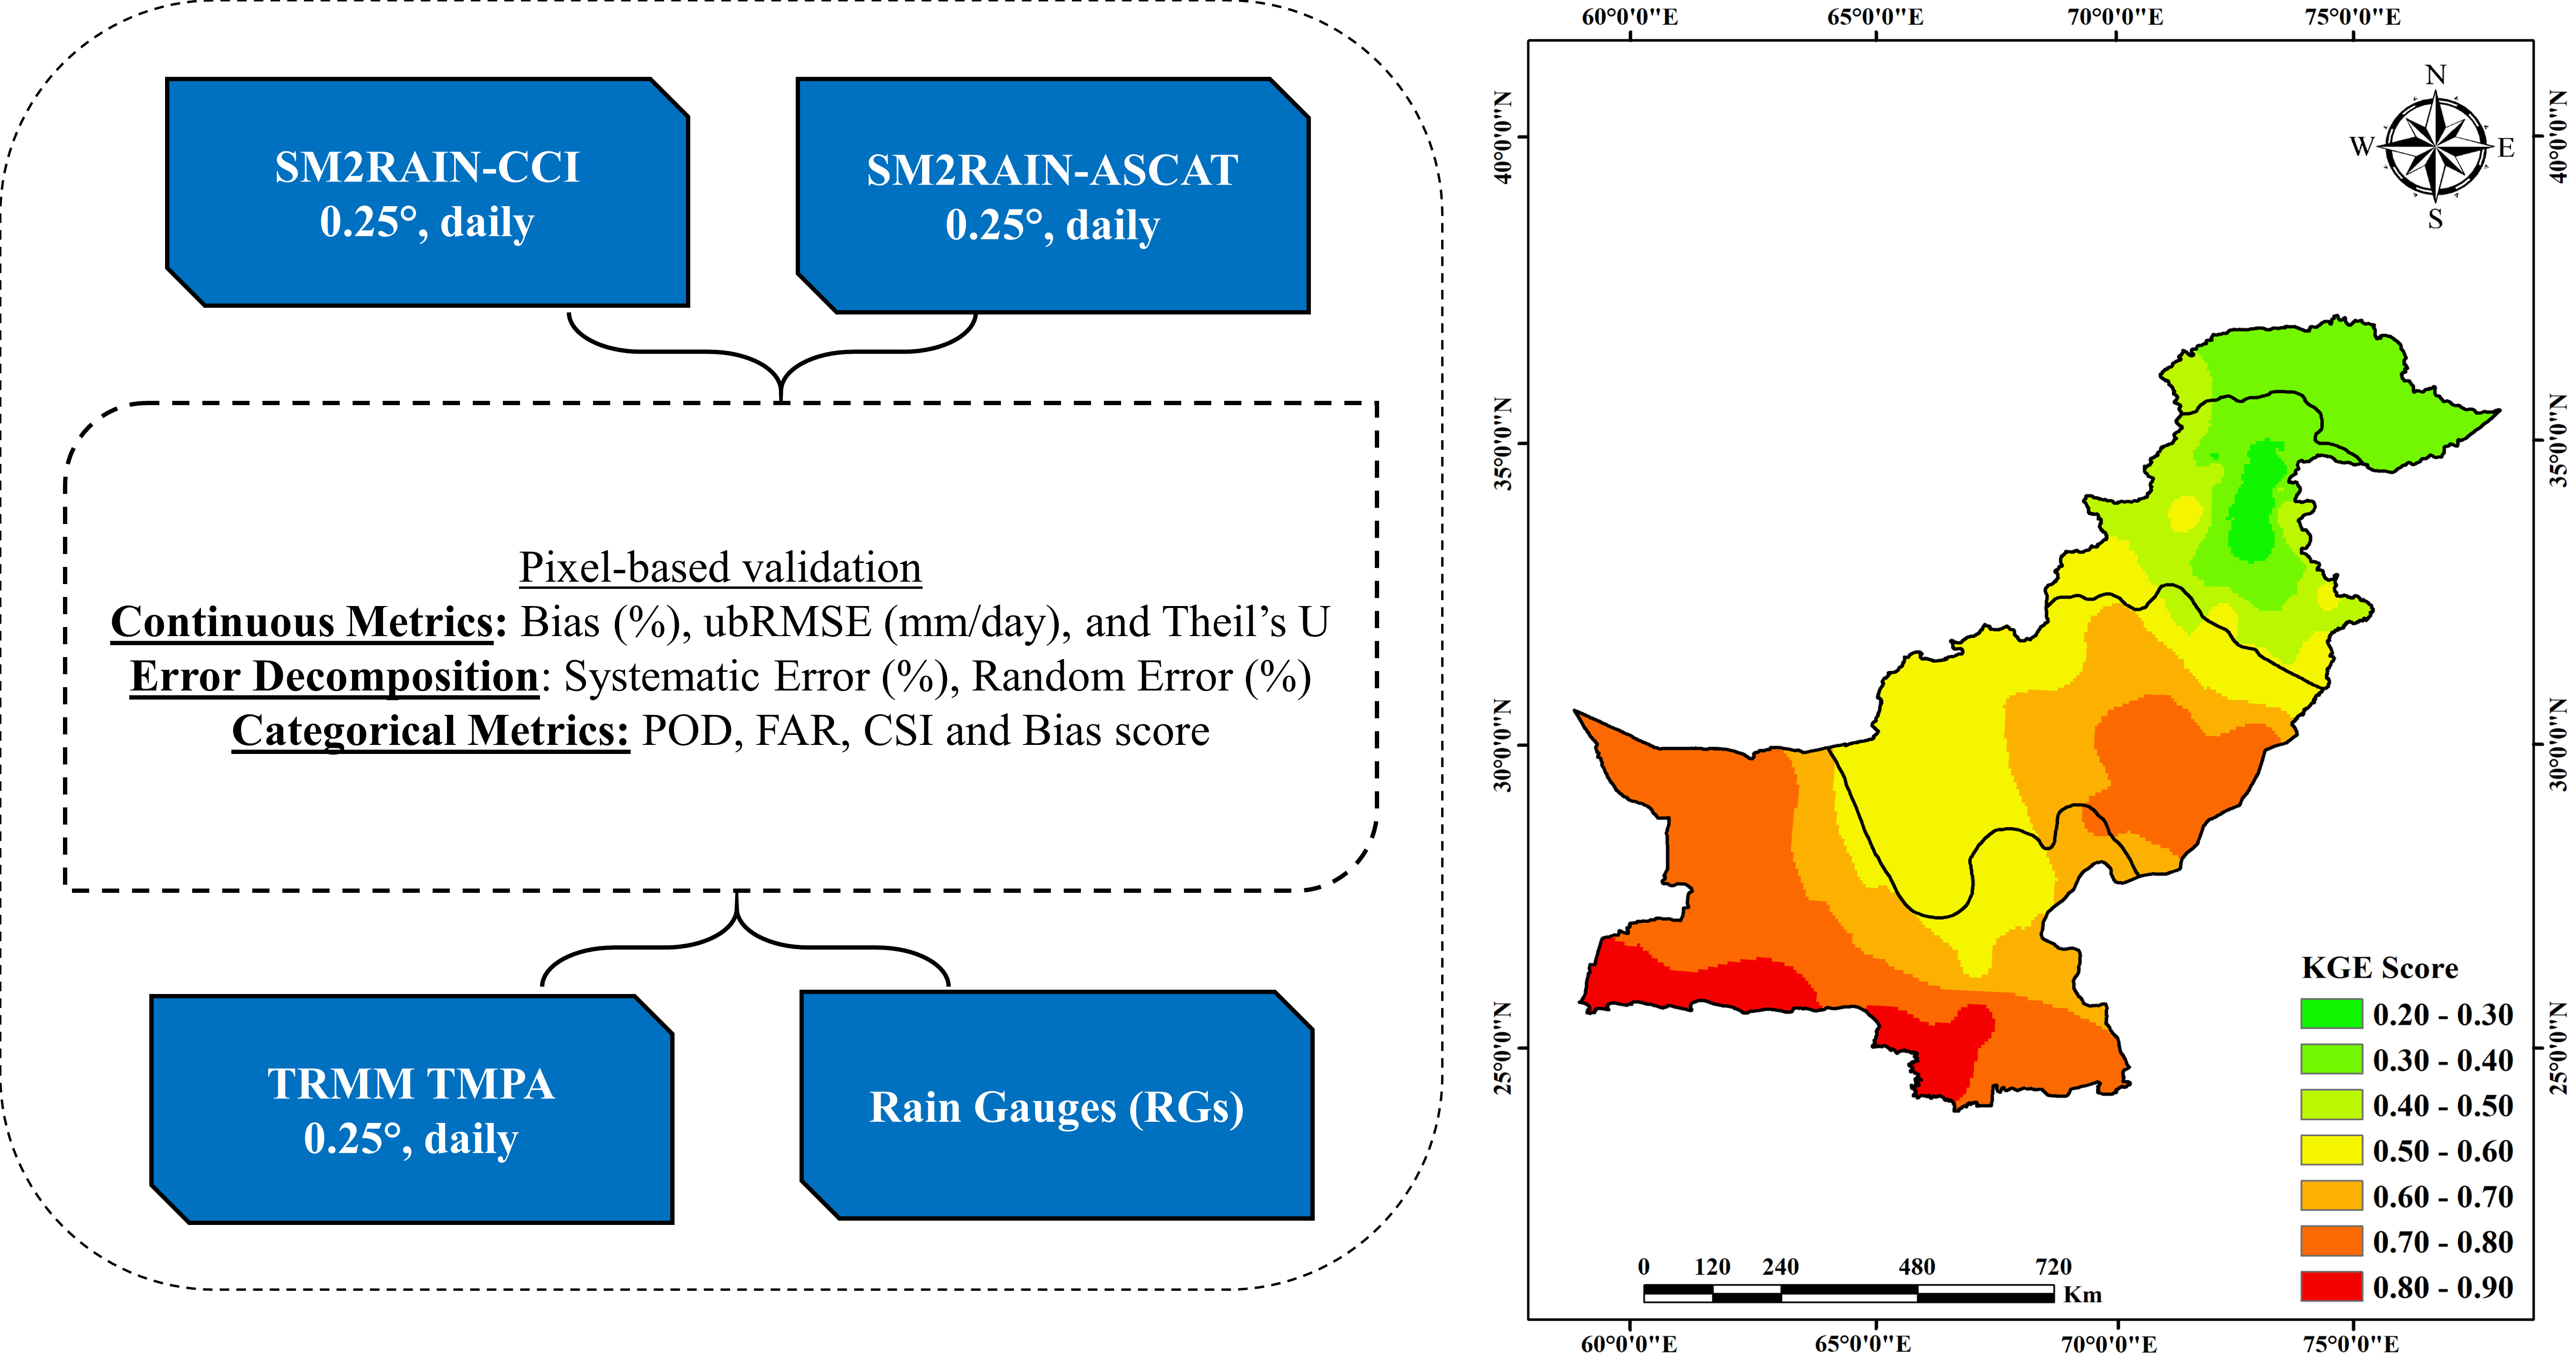
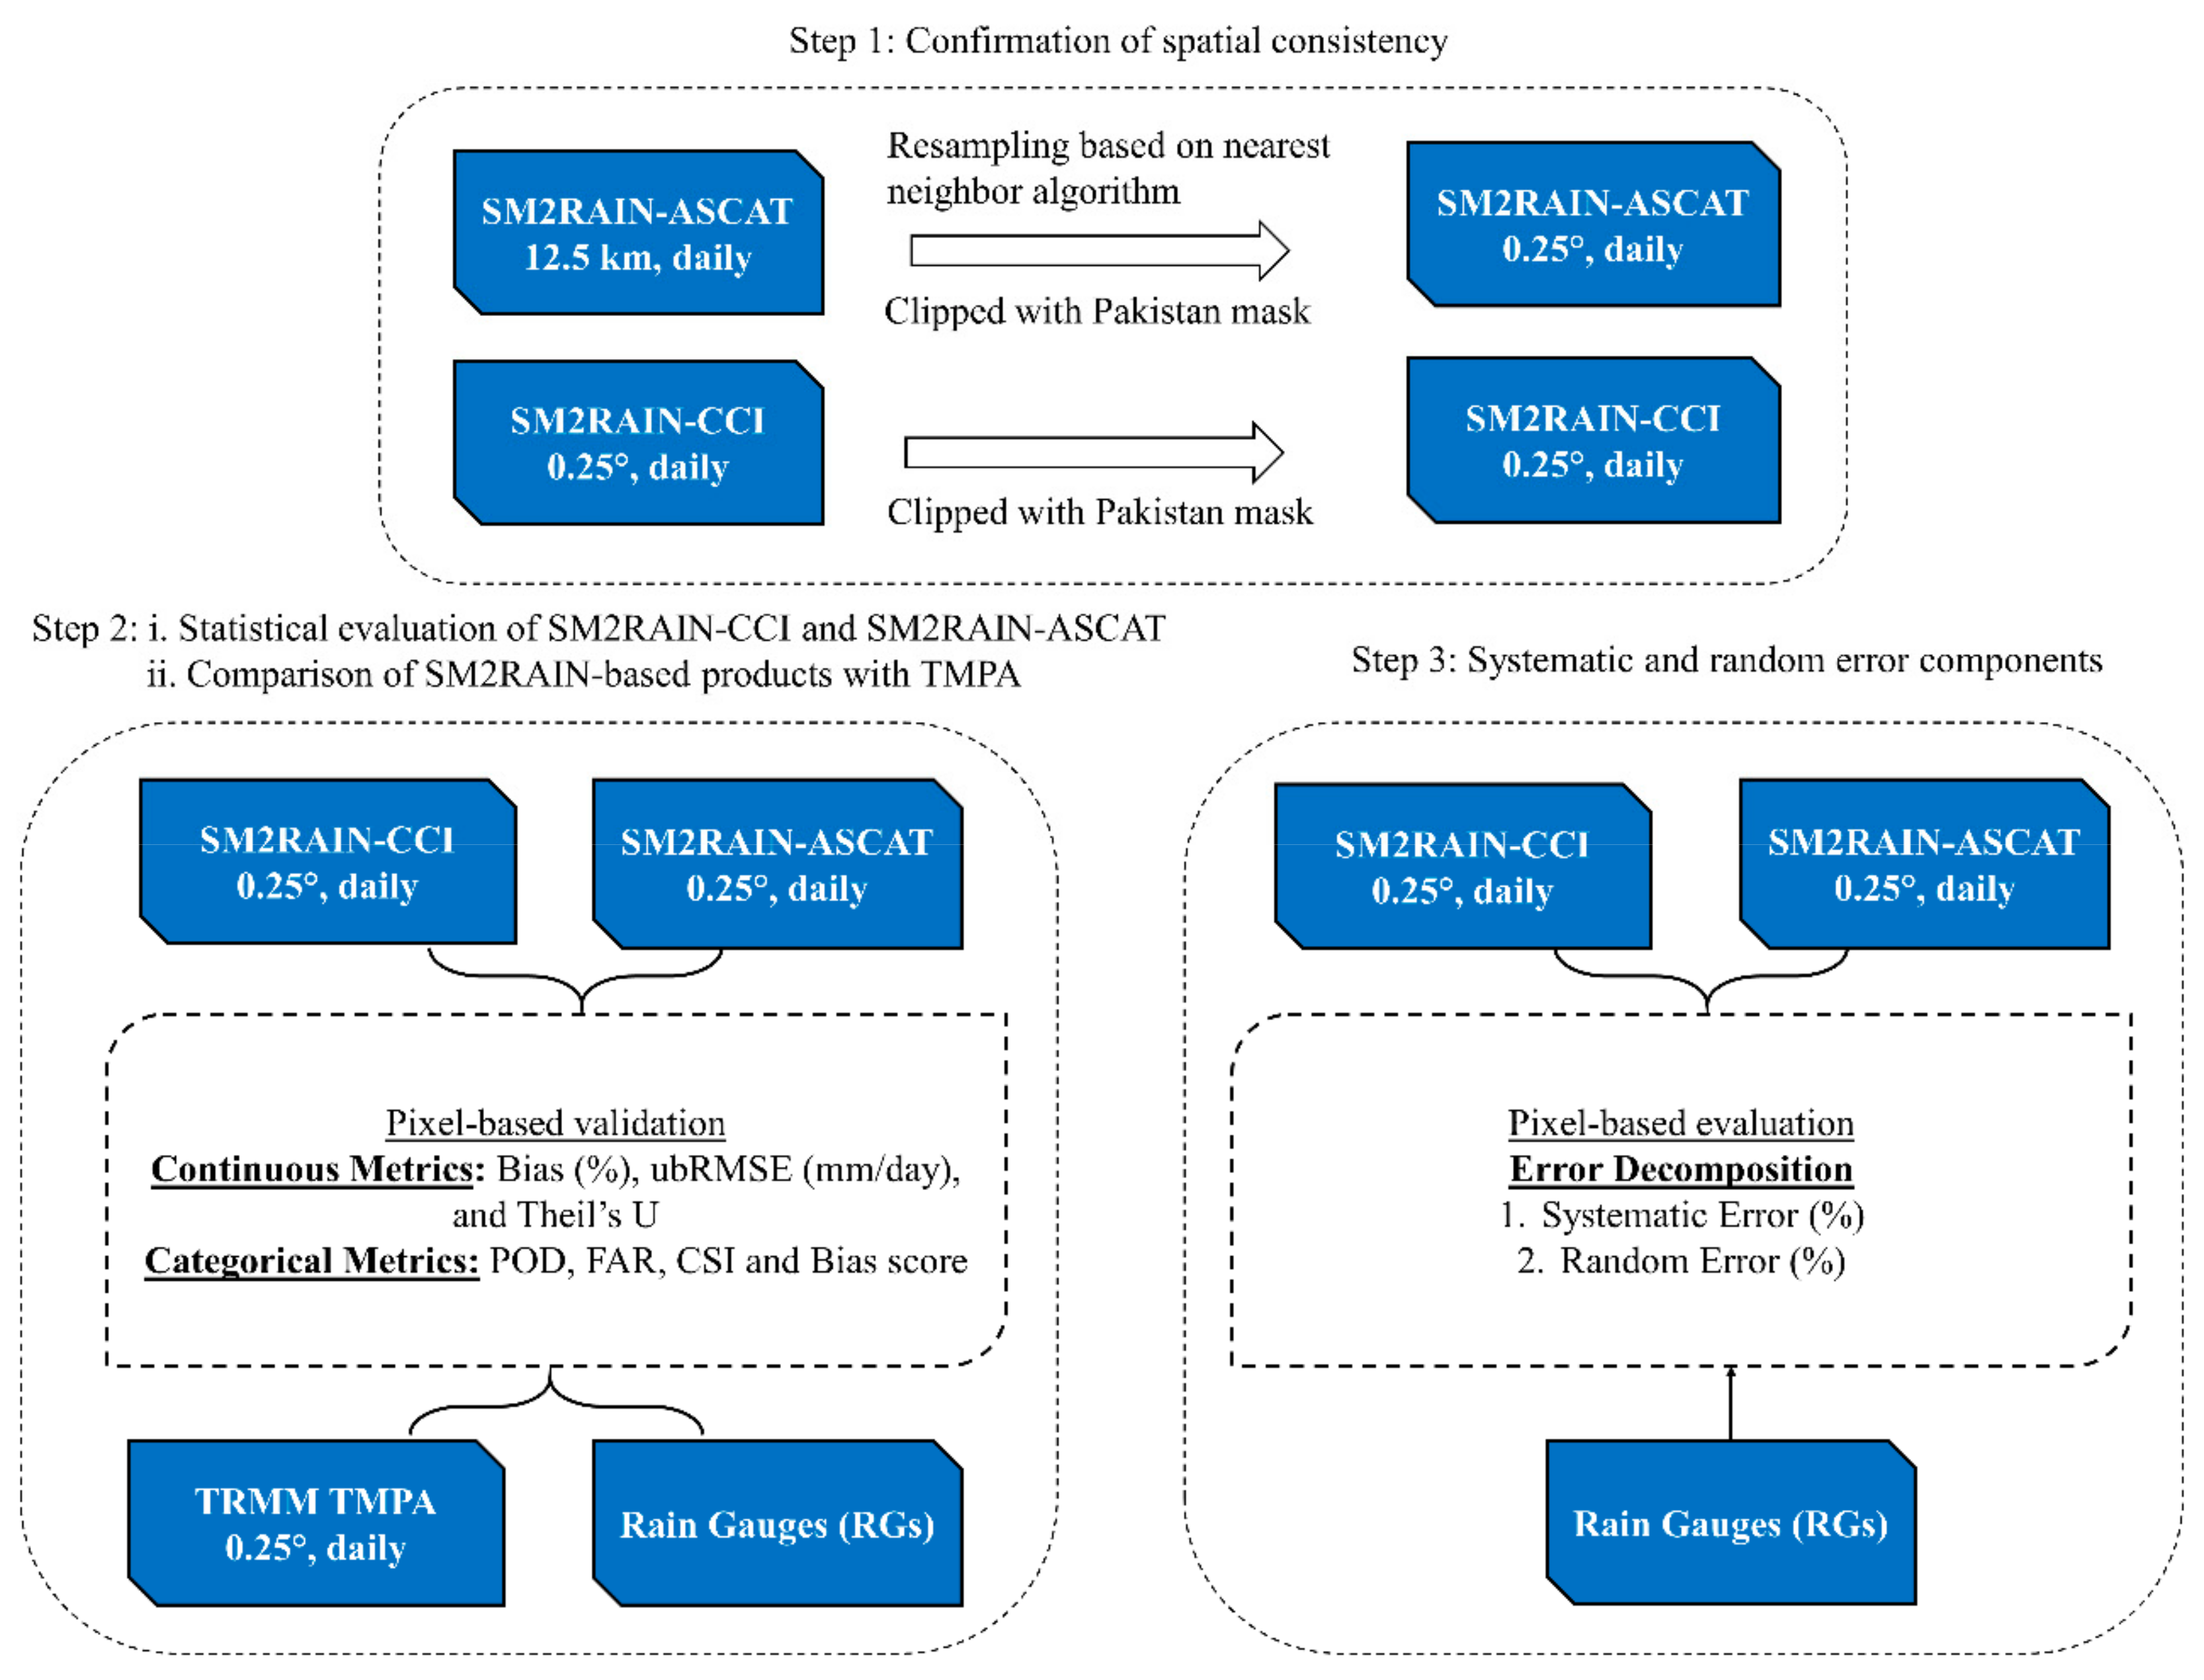
Figure 2 represents the flow chart of the proposed methodology applied in the current study. SM2RAIN-CCI is compared and evaluated against the RGs during 2000–2015; while, SM2RAIN-ASCAT is evaluated during 2007–2015. Moreover, due to the difference in time duration of the considered PPs, the performance of each dataset is compared with TMPA during the shared period from 2007 to 2015. To ascertain the impartial inter-comparison of SM2RAIN-ASCAT with SM2RAIN-CCI and TMPA, SM2RAIN-ASCAT has been re-gridded using nearest neighbor algorithm at 0.25° spatial resolution. Figure 2 shows that inter-comparison of daily precipitation estimates from SM2RAIN-CCI, SM2RAIN-ASCAT, and TMPA with RGs is conducted to assess the spatial consistency of precipitation datasets over Pakistan. Further, the performance of precipitation datasets is also assessed based on precipitation topography and seasonal time scale using continuous and categorical metrics. Finally, systematic and random error components of SM2RAIN-CCI and SM2RAIN-ASCAT are also assessed utilizing a decomposition method (the final step in Figure 2).
Three continuous metrics were used to assess the performance of SM2RAIN-CCI and SM2RAIN-ASCAT against the RGs. These metrics were based on inter-comparison of precipitation estimates from each product with precipitation records from RGs on a pixel scale. The Bias (B), unbiased root mean square error (ubRMSE), and Theil’s U coefficient (U) are considered in this study (Table 2). B is used to estimate the over/under-estimation of precipitation by each product, where positive values indicate overestimation and negative values underestimation. ubRMSE measures the difference between estimated and observed precipitation values. ubRMSE attain only positive values where minimum values indicate better performance. Theil’s U predicts the forecasting accuracy of PPs with respect to RGs. The lower bound of Theil’s U is zero, indicating the perfect forecast; the value of 1 indicates that PPs forecast the same error as the naïve no-change extrapolation. A value greater than 1 indicates the worst forecasting and has to be rejected [60].
Moreover, the method developed by AghaKouchak, et al. [61] is used to decompose the total mean square error (MSE) in PPs into random (MSEr) and systematic (MSEs) errors, which are presented as
(mm/day) in Equations (3)–(5) is calculated on the daily scale by least squared linearly regressing the PPs estimates against the RGs at each pixel. Therefore, a and b in Equation (5) are offset and scale parameters [62].
In addition, the performance of PPs was also assessed using the modified Kling–Gupta efficiency (KGE) score. KGE combines correlation coefficient (r), bias ratio (β) and variability ratio (γ) [63], which is represented as follows:
where CV denotes the coefficient of variation. The perfect values of KGE, β and γ are all 1.
The precipitation detection competences of SM2RAIN-CCI and SM2RAIN-ASCAT are examined using four categorical metrics (Table 3), including the probability of detection (POD), false alarm ratio (FAR), critical success index (CSI), and Bias score (BS). POD represents the capability of PPs to detect precipitation events. A threshold of 1 mm is considered to distinguish precipitation from dry days (no precipitation) at any time scale [64]. FAR indicates the fraction of predicted precipitation event that did not occur. POD and FAR ranges between 0–1 with a perfect values of 1 and 0, respectively [62]. CSI is a fraction of precipitation events correctly detected by PPs. The CSI value ranges between 0 to 1, with the perfect value of 1 [65]. BS represents the fraction of all PPs precipitation events that were correctly predicted. The range of BS values is 0 to 1 with perfect score equal to 1.
3. Results
3.1. Regional Evaluation of SM2RAIN-CCI Dataset
Accuracy of daily precipitation estimates from the SM2RAIN-CCI and SM2RAIN-ASCAT were assessed using the RGs data as a benchmark for each climate region during the period 2000–2015 and 2007–2015, respectively. The continuous metrics (listed in Table 2) values are statistical quantification of variations in the amount of precipitation from SM2RAIN-CCI/ASCAT datasets from the RGs data at the pixel scale (considered only the common pixels). The ordinary kriging method is used to interpolate the pixel base data over entire Pakistan (climate regions) to comprehensively understand the spatial distribution trend of error characteristics.
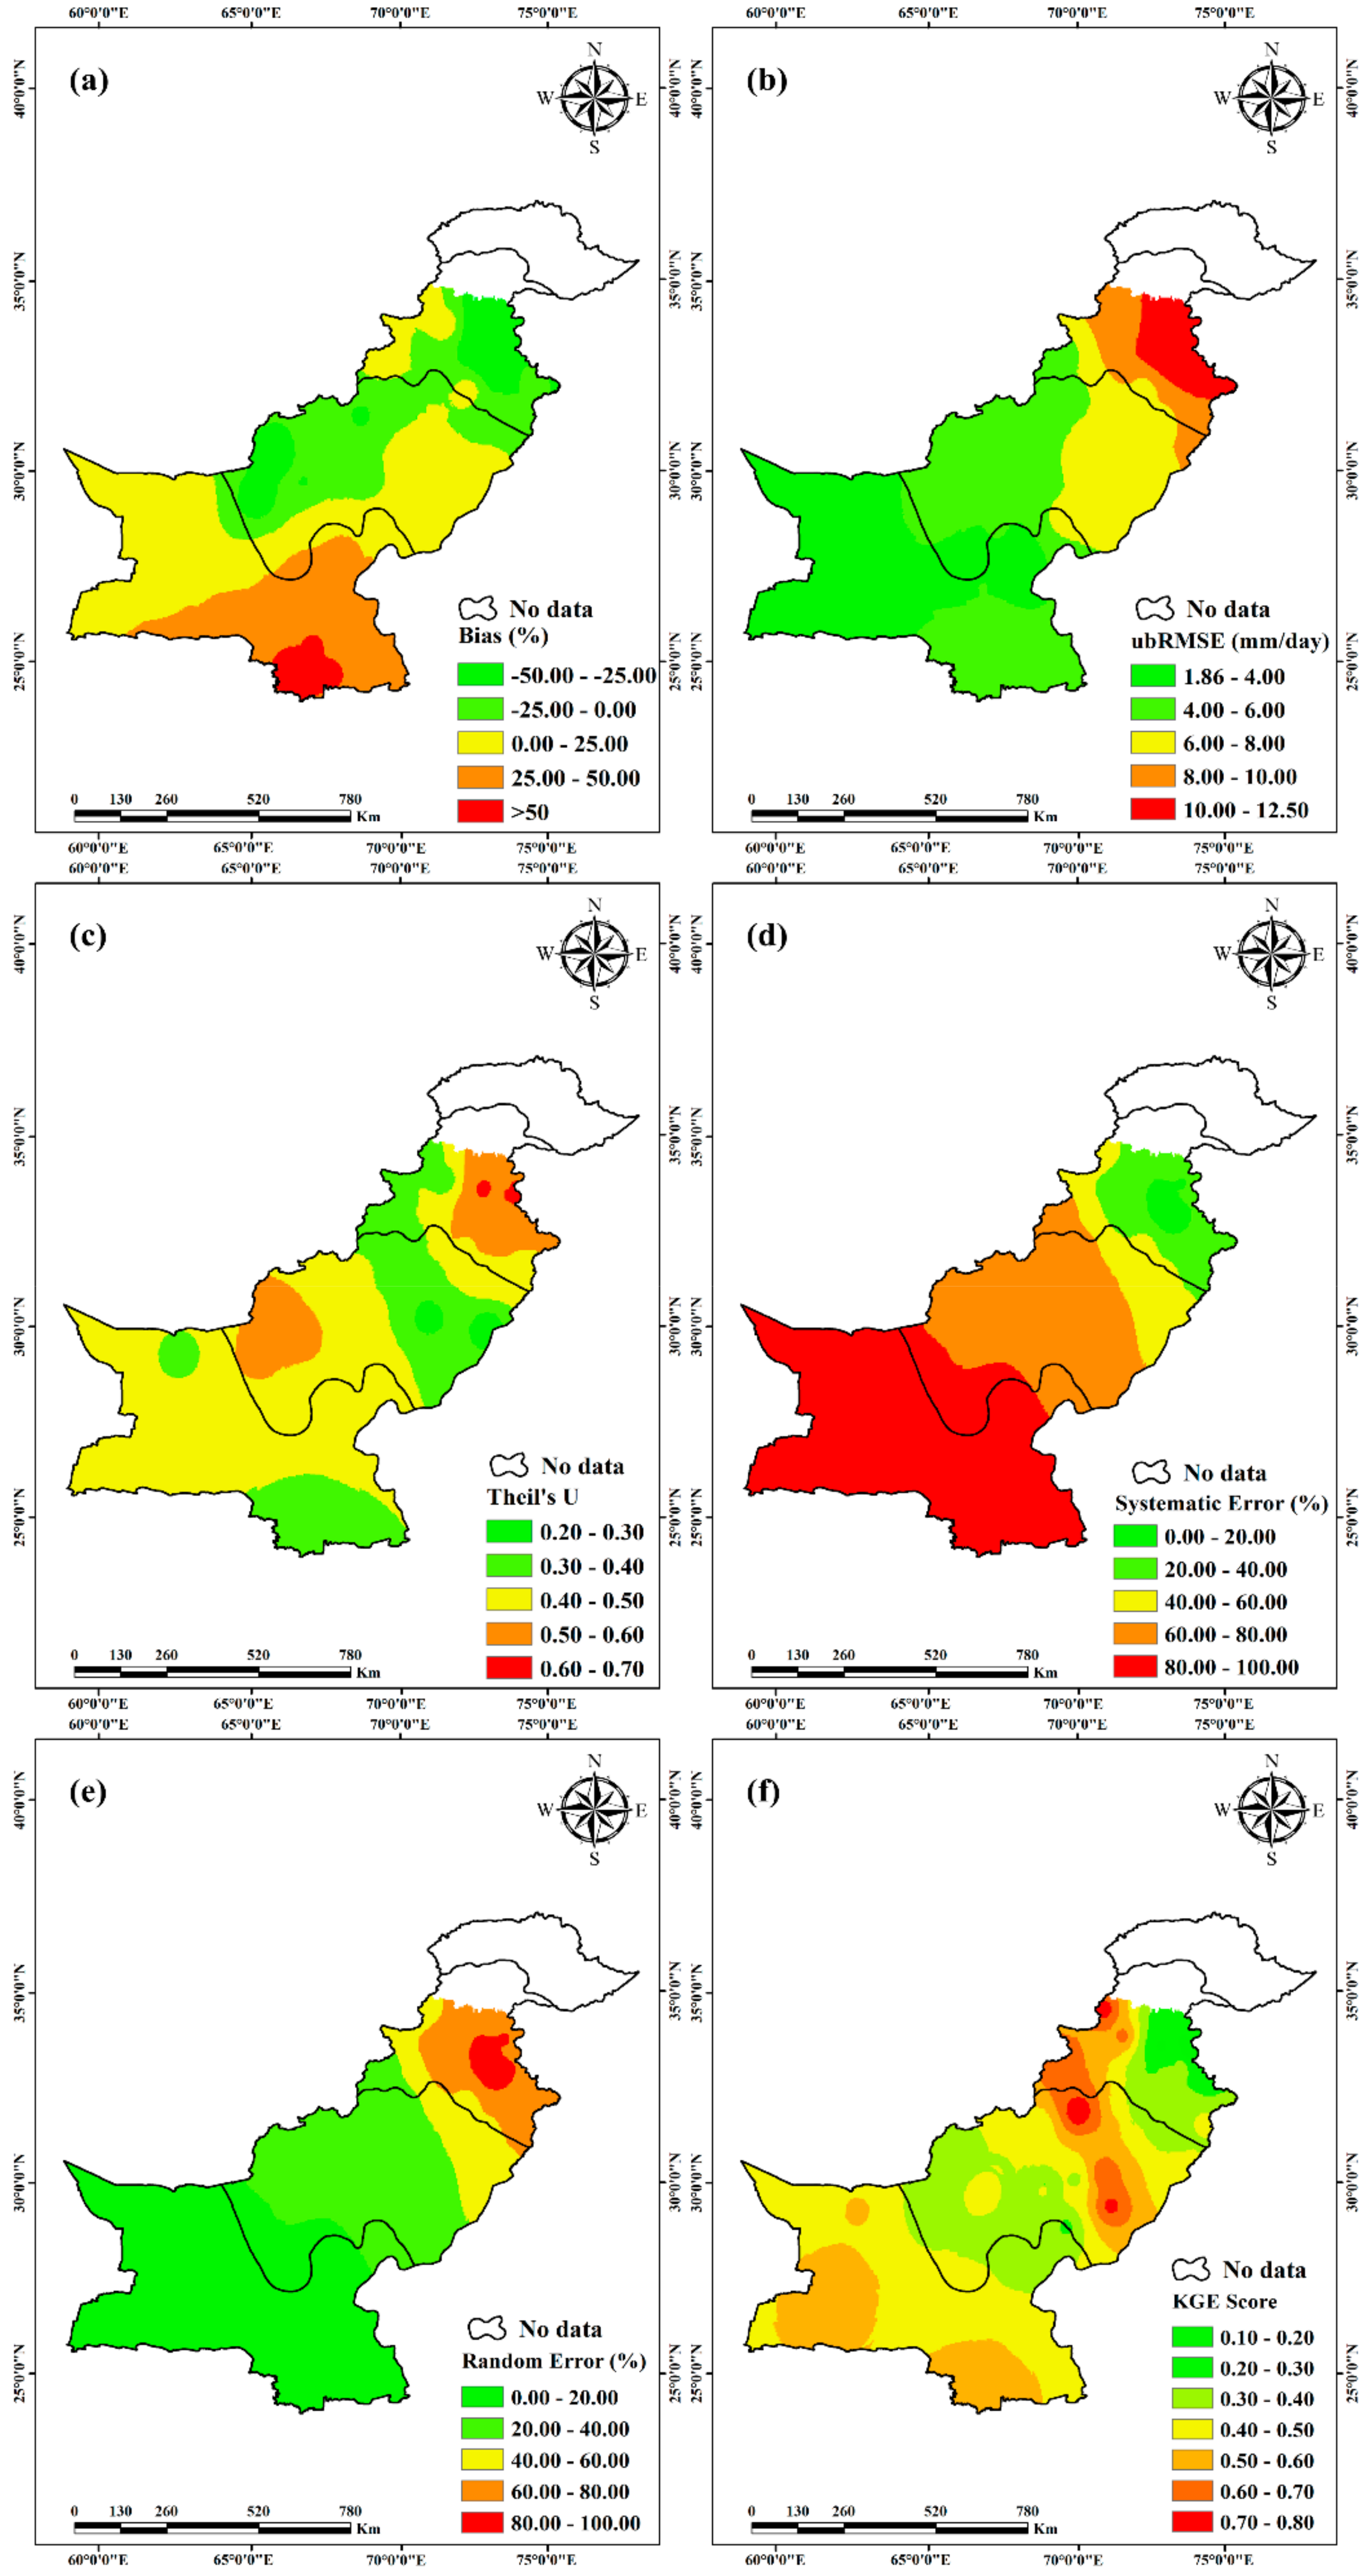
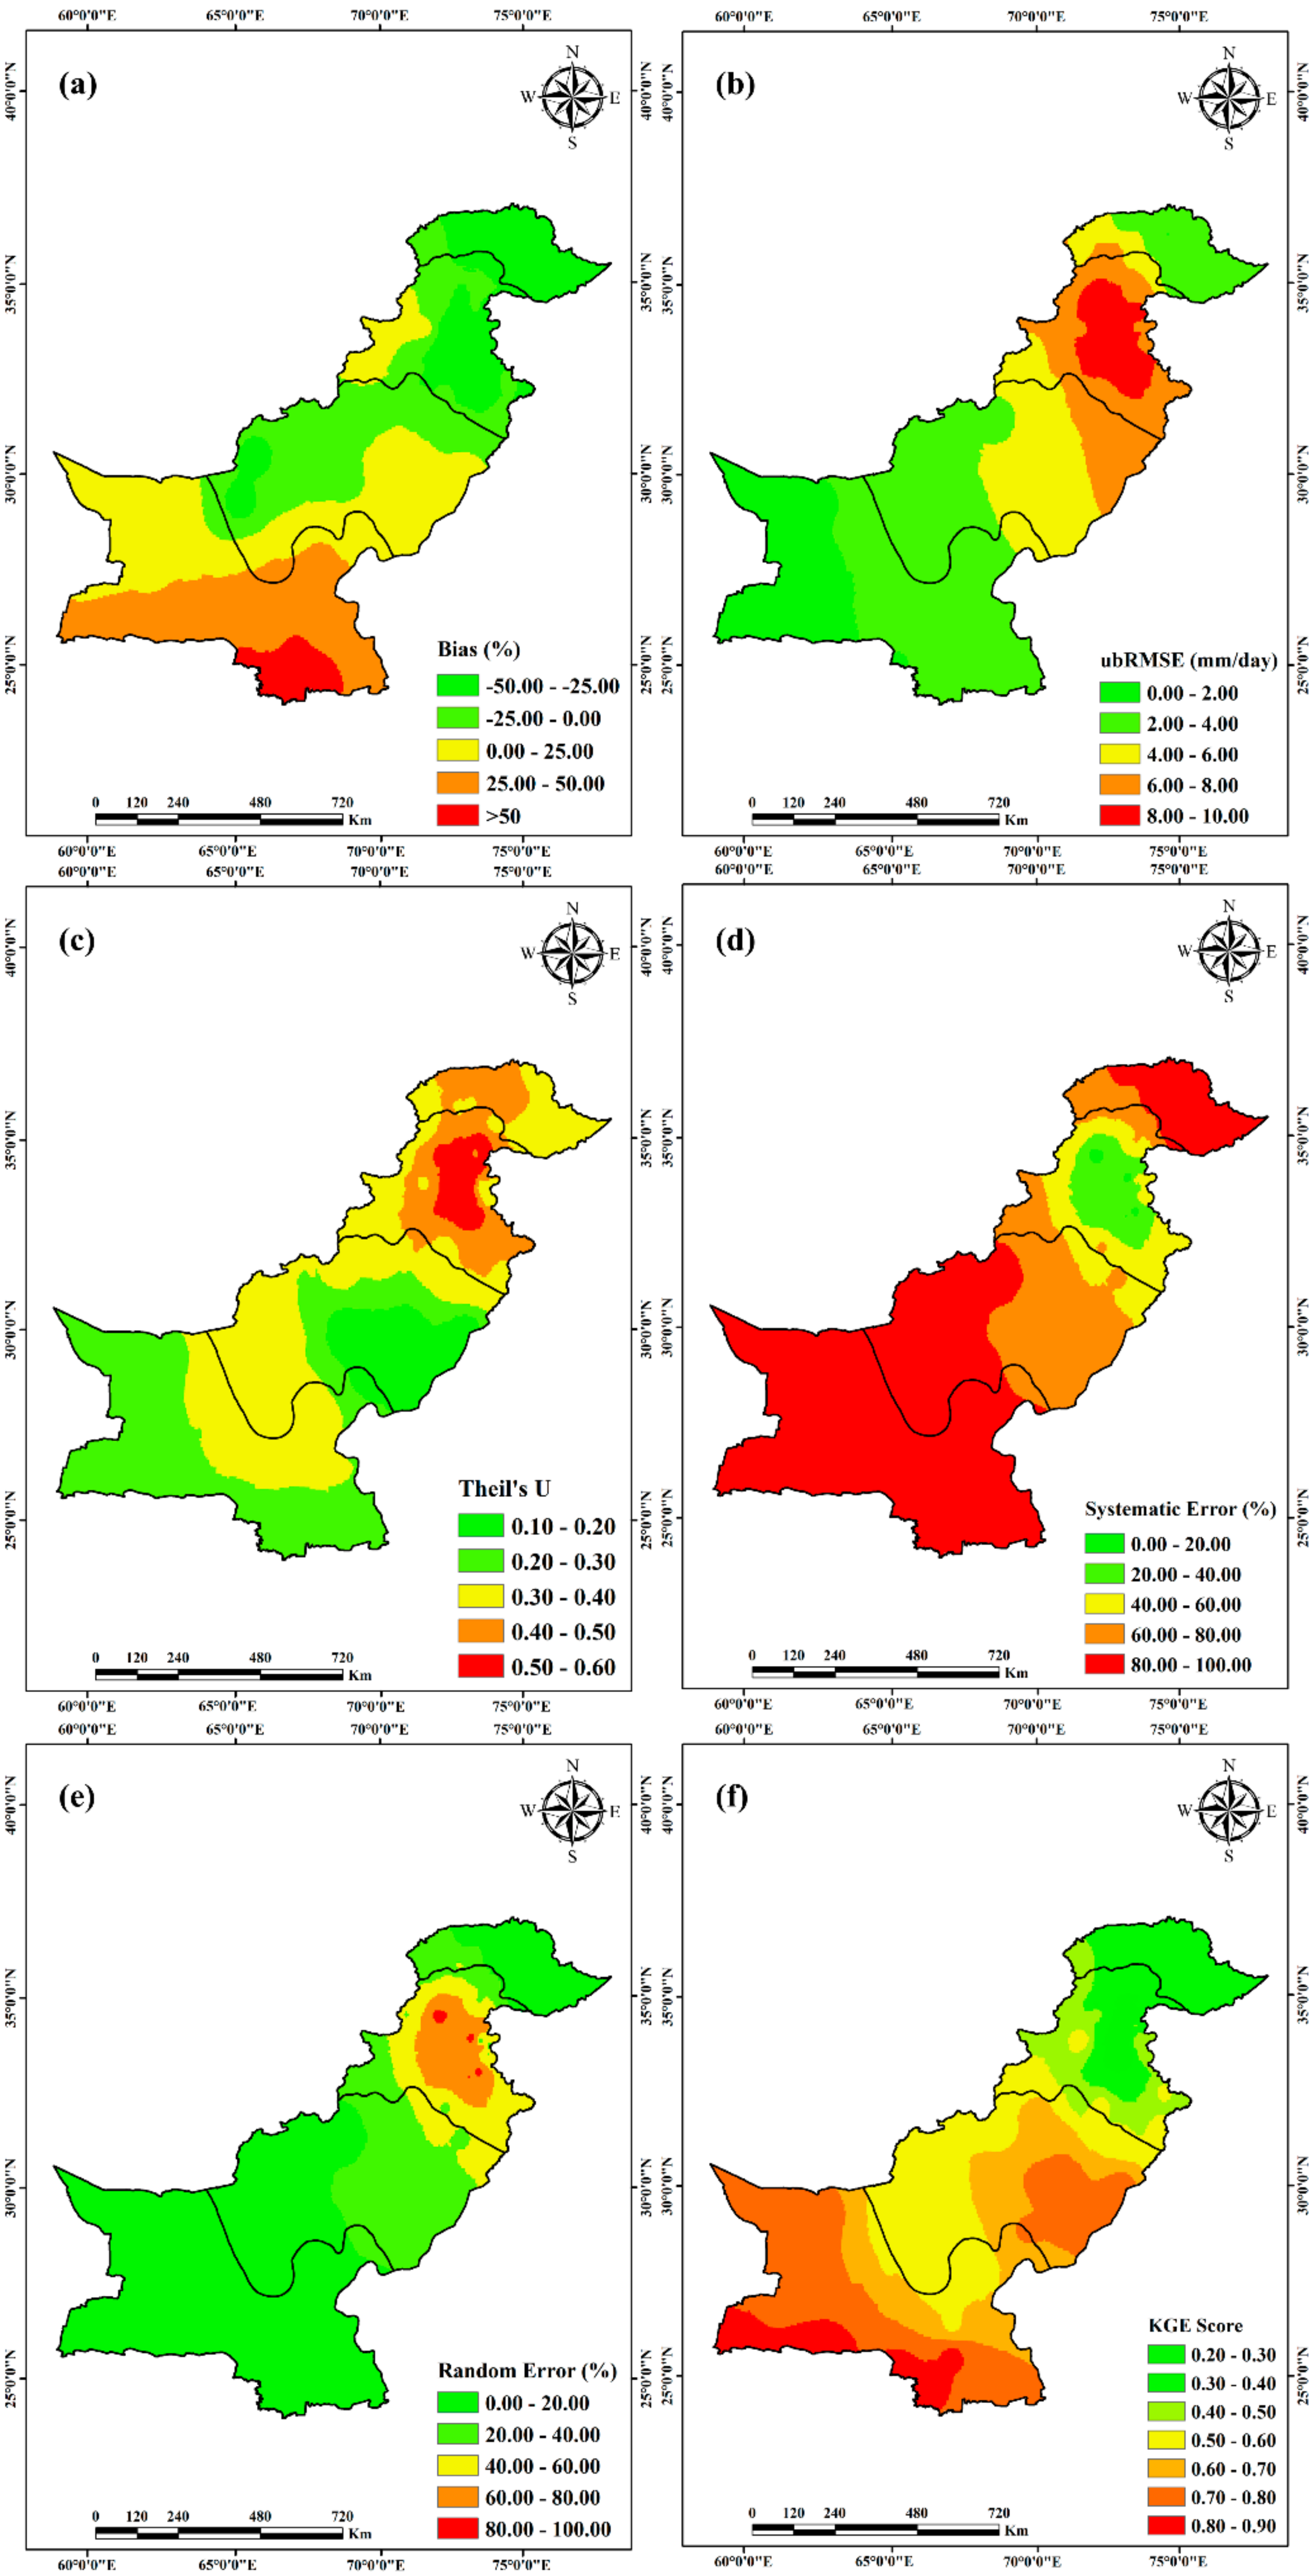
Figure 3 shows the spatial distribution of statistical metrics of SM2RAIN-CCI over four distinct climate regions, i.e., glacial, humid, arid and hyper-arid regions in Pakistan. Precipitation data for SM2RAIN-CCI is not available in the glacial region and high elevated areas of humid region due to masking, i.e., precipitation data of SM2RAIN-CCI is masked out in frozen soil, snow-dominated regions and complex topography.
Figure 3a represents the spatial distribution of SM2RAIN-CCI biases (B) across Pakistan in comparison with RG observations for the study period (2000–2015) on a daily temporal scale. In the humid region, larger negative biases (underestimation) are evident over north-east of the humid region but decreases gradually towards the west (slightly overestimated). The north-east of humid region consists of the Mangla dam, barrages, headworks and an extensively developed integrated irrigation canal system (comprised of 12 interlink canals and 43 independent irrigation canals commands) of the country (hereinafter called hydraulically developed areas), which results in the groundwater level rise in the vicinity of these structures and the soil water saturation in irrigated land after irrigation. Besides, the area is also subjected to heavy and intense precipitation that may saturate the soil in a quick span of time. Since the SM2RAIN-based products work on the principles of soil–water balance, the excessive precipitation cannot be considered when the soil gets saturated, and hence resulting in higher biases (higher underestimation). The sign of biases shows an interesting feature along the west of arid region indicating a considerable underestimation of precipitation. Western side of arid regions is comprised of mild elevated mountainous ranges (i.e., Koh-e-Suleman, Koh-e-Chiltan, Koh-e-Murdaar, and Koh-e-Takatu) having cold weather in winter and hot in summer with mean annual precipitation of 317 mm [47]. Precipitation is underestimated in this region due to the low infiltration capacity (the area is mostly covered with rocks) and also due to the snow factor in the winter season. However, precipitation is overestimated in the plain agricultural areas of the arid region (east and south-east). Hyper-arid region is the hottest region located at the coast of the Arabian Sea and experience mean annual precipitation of 133 mm. Precipitation is overestimated in the region by SM2RAIN-CCI, which may be due to seawater intrusion from the Arabian Sea [66]. High overestimation is observed in the south-east coastal area which gradually decreases towards the west.
Figure 3b presents the spatial distribution of ubRMSE over different climate regions of Pakistan. A common trend of lower ubRMSE towards the west in comparison to the east of each climate region is observed in the figure. Higher ubRMSE is observed in the hydraulically developed areas in the north-east of humid region. Lower ubRMSE is observed in the hyper-arid region, most specifically near the coast of the Arabian Sea. The hyper-arid region is a precipitation deficit region where there is plenty of time for precipitation to infiltrate and saturate the soil. The reason for lower ubRMSE in the hyper-arid region is low intensity and low magnitude precipitation. Higher ubRMSE was observed at HRG23 (12.44 mm/day) while minimum at HARG8 (1.83 mm/day).
Figure 3c depicts the distribution of Theil’s U coefficient that shows the accuracy of SM2RAIN-CCI to accurately detect a precipitation event. Smaller values (close to zero) represent better forecasting accuracy, while values closer to 1 depicts poor forecasting. The figure reveals better forecasting accuracies at ARG16 (0.24) and ARG8 (0.23), with poor forecasting accuracies in north-east of humid region, more specifically at HRG23 (0.66) and HRG24 (0.69), respectively. Locations of high accuracies (minimum Theil’s U) in the arid region are in the vicinity of the agricultural region (ARG9) and the Thar desert (ARG16) where soil is mostly unsaturated. The only source of water for agriculture is irrigation water. Agriculture in the location helps to preserve the water in the soil. Beside the arid region, moderate accuracy is depicted in south-east of the hyper-arid region near HARG18, HARG19, HARG20, and HARG21. The average values of Theil’s U in the humid, arid and hyper-arid regions were 0.51, 0.40, and 0.42, and the median values were 0.53, 0.43, and 0.41, respectively.
Spatial distributions of mean square error components, i.e., random and systematic errors, in SM2RAIN-CCI across Pakistan are presented in Figure 3d,e. Before the integration of any PP in the hydrological application, the knowledge about systematic and random errors for implementation of any statistical adjustment and bias correction is extremely vital [61]. In comparison with the random error component, systematic errors have larger contributions over Pakistan. The analysis depicts that SM2RAIN-CCI needs proper adjustments in biases before assimilating into any hydrological application. Larger systematic errors are observed in the hyper-arid and downstream portion of arid regions while minimum values are in the humid region.
Figure 3f presents the spatial distribution of KGE score for the SM2RAIN-CCI product as compared to RGs observation. Results shows smaller KGE scores in the humid region, which increases to maximum values in the middle of the arid region, then decreasing at the end of the arid region. Smaller KGE scores in north-east of the humid region might be due to the relatively poor performance of SM2RAIN-CCI in the hydraulically developed areas. Besides that, the uncertainties in gauge-based estimates associated with sparse gauge density also play a vital role. The highest KGE scores were observed at ARG3 (0.78), HRG11 (0.74), and ARG15 (0.73). The minimum KGE score was observed at HRG24 (0.13).
3.2. Regional Evaluation of SM2RAIN-ASCAT Dataset
Figure 4 shows the spatial distribution of statistical metrics of SM2RAIN-ASCAT. The bias of SM2RAIN-ASCAT (Figure 4a) shows an almost similar trend compared to SM2RAIN-CCI (Figure 3a). However, the magnitude of biases at each RG is significantly reduced when compared to SM2RAIN-CCI. Precipitation is highly underestimated at the north-east sides of the glacial and humid regions of the country, which gradually decreases towards the west of the regions. The reason for high underestimation might be the abundant water availability in the specific region due to dams, barrages, headworks, and well-developed irrigation systems. Besides, snowmelt and high precipitation events that saturate the soil also contribute to an underestimation of precipitation in high elevated regions (i.e., the glacial region and upstream areas of the humid regions). SM2RAIN-ASCAT highly overestimated precipitation in the south-east of the hyper-arid region. The average (median) values of bias in the glacial, humid, arid and hyper-arid regions were −28.76% (−29.25%), −29.86% (−23.31%), −6.18% (−12.68%) and 34.87% (27.66%), respectively.
SM2RAIN-ASCAT depicts an improved performance in comparison with SM2RAIN-CCI considering ubRMSE (Figure 4b). ubRMSE shows the same spatial trend as compared to SM2RAIN-CCI with maximum and minimum values in the humid and hyper-arid regions, respectively. The regional average (median) ubRMSE values were 3.73 mm/day (3.57 mm/day) in glacial, 7.87 mm/day (7.54 mm/day) in humid, 4.83 mm/day (4.32 mm/day) in humid and 2.21 mm/day (2.19 mm/day) in hyper-arid regions. Maximum and minimum ubRMSE values were depicted by HRG12 (9.91 mm/day) and HARG8 (1.21 mm/day).
SM2RAIN-ASCAT shows high forecasting accuracy at the south-east of the arid region while moderate accuracies in extreme south of hyper-arid region (Figure 4c). Lower accuracies are depicted in humid region mostly in the vicinity of hydraulically developed areas. The regional average (median) values of Theil’s U coefficient were 0.40 (0.39) in glacial, 0.46 (0.48) in humid, 0.25 (0.19) in arid, and 0.30 (0.28) in hyper-arid regions. The maximum and minimum of Theil’s U values were 0.59 (HRG39) and 0.12 (ARG10).
The comparison reveals that SM2RAIN-ASCAT dominates the SM2RAIN-CCI across all climate regions. The average percentage improvements in humid, arid and hyper-arid regions were: Bias (27.01%), ubRMSE (19.61%), Theil’s U (9.80%), MSEs (24.55%), MSEr (19.41%), and KGE (5.26%) in the humid region; Bias (5.94%), ubRMSE (20.16%), Theil’s U (28.20%), MSEs (13.83%), MSEr (29.20%), and KGE (28.12%) in the arid region; and Bias (6.05%), ubRMSE (25.56%), Theil’s U (26.83%), MSEs (8.22%), MSEr (24.14%), and KGE (24.72%) in the hyper-arid region.
Figure 4d,e represents the spatial distribution of systematic and random errors of SM2RAIN-ASCAT over four climate regions of Pakistan. Higher random errors were observed in the humid region, which decreases towards the arid and hyper-arid regions. The regional average (median) random errors were 15.41% (13.81%), 57.12% (59.87%), 22.81% (21.97%), and 6.04% (6.75%) in glacial, humid, arid and hyper-arid regions, respectively. Overall the random error average across Pakistan was 25.35%. On the other hand, systematic errors were larger than a random error with an average of 74.65% across the whole of Pakistan. Maximum systematic errors were depicted in hyper-arid (average: 93.96%, median: 93.25%) and glacial (average: 84.76%, median: 86.20%) followed by arid (average: 77.19%, median: 78.03%) and humid (average: 41.59%, median: 40.13%) regions.
Figure 4f displays the spatial distribution of KGE score compared with RG observations. Maximum KGE is observed in the hyper-arid region showing a high performance of SM2RAIN-ASCAT in the region. Smaller KGE scores are observed in the humid and glacial regions depicting poor performance in those mentioned climate regions. However, the KGE score illustrates moderate performance in the arid region. Average (median) KGE scores in glacial, humid, arid and hyper-arid regions were 0.36 (0.34), 0.38 (0.41), 0.64 (0.64), and 0.72 (0.77), respectively.
3.3. Seasonal Evaluation of SM2RAIN-CCI and SM2RAIN-ASCAT
SM2RAIN-CCI and SM2RAIN-ASCAT are compared during four seasons, i.e., pre-monsoon from April to June (A-M-J), monsoon from July to September (J-A-S), post-monsoon from October to November (O-N), and winter from December to March (D-J-F-M) [47,67] for a common period of 2007–2015. Table 4 shows the statistical evaluation of SM2RAIN-CCI in four seasons across Pakistan. The analysis shows poor performance of the precipitation products with an increase in precipitation magnitude and intensity, i.e., monsoon and pre-monsoon seasons. Table 4 shows higher KGE scores in winter season with maximum and minimum values of 0.75 and 0.49, depicting better performance in winter while poor performance in monsoon season (KGE scores ranged between 0.53 (maximum) to 0.19 (minimum)). Similarly, lower biases, ubRMSE, and Theil’s U values were observed in winter and post-monsoon seasons. It is concluded from the results that SM2RAIN-CCI shows higher performance in winter followed by post-monsoon season.
Table 5 represents the seasonal evaluation of SM2RAIN-ASCAT. SM2RAIN-ASCAT also depicts poor performance in heavy and intense precipitation seasons such as the monsoon and pre-monsoon. Lowest biases and ubRMSE values are observed during the winter season. Theil’s U also depicts better performance of SM2RAIN-ASCAT during the winter and post-monsoon seasons. Moreover, similar to SM2RAIN-CCI, the highest KGE scores are observed in winter and post-monsoon seasons while the lowest score in the monsoon season, depicting better performance during low precipitation seasons. Overall, high performances are depicted in winter and post-monsoon seasons. However, SM2RAIN-ASCAT outperformed SM2RAIN-CCI in all four seasons.
3.4. Performance of SM2RAIN-CCI and SM2RAIN-ASCAT in Detecting Precipitation Events
Table 6 shows the daily scale averaged regional categorical metrics of SM2RAIN-CCI and SM2RAIN-ASCAT during a common period of 2007–2015. The categorical metrics are calculated by using a threshold of 1 mm/day. Higher POD (lower FAR) values were detected in the hyper-arid region. The humid region has a lower POD (higher FAR) because of high precipitation magnitude and intensity in the region. Moreover, saturated soil and water storage in hydraulic structures might be the cause of lower POD (higher FAR) in the humid region. Similarly, CSI and the bias score (BS) was also higher in the hyper-arid region and lower in humid region. About the skill of detecting precipitation events, SM2RAIN-ASCAT outperformed SM2RAIN-CCI across three climate regions of Pakistan. In terms of POD (FAR), SM2RAIN-ASCAT improved the precipitation detection capability by 11.94% (15%) in humid, 10.67% (14.28%) in arid and 8.53% (19.05%) in hyper-arid regions.
3.5. Evaluation of SM2RAIN-CCI/ASCAT against TMPA
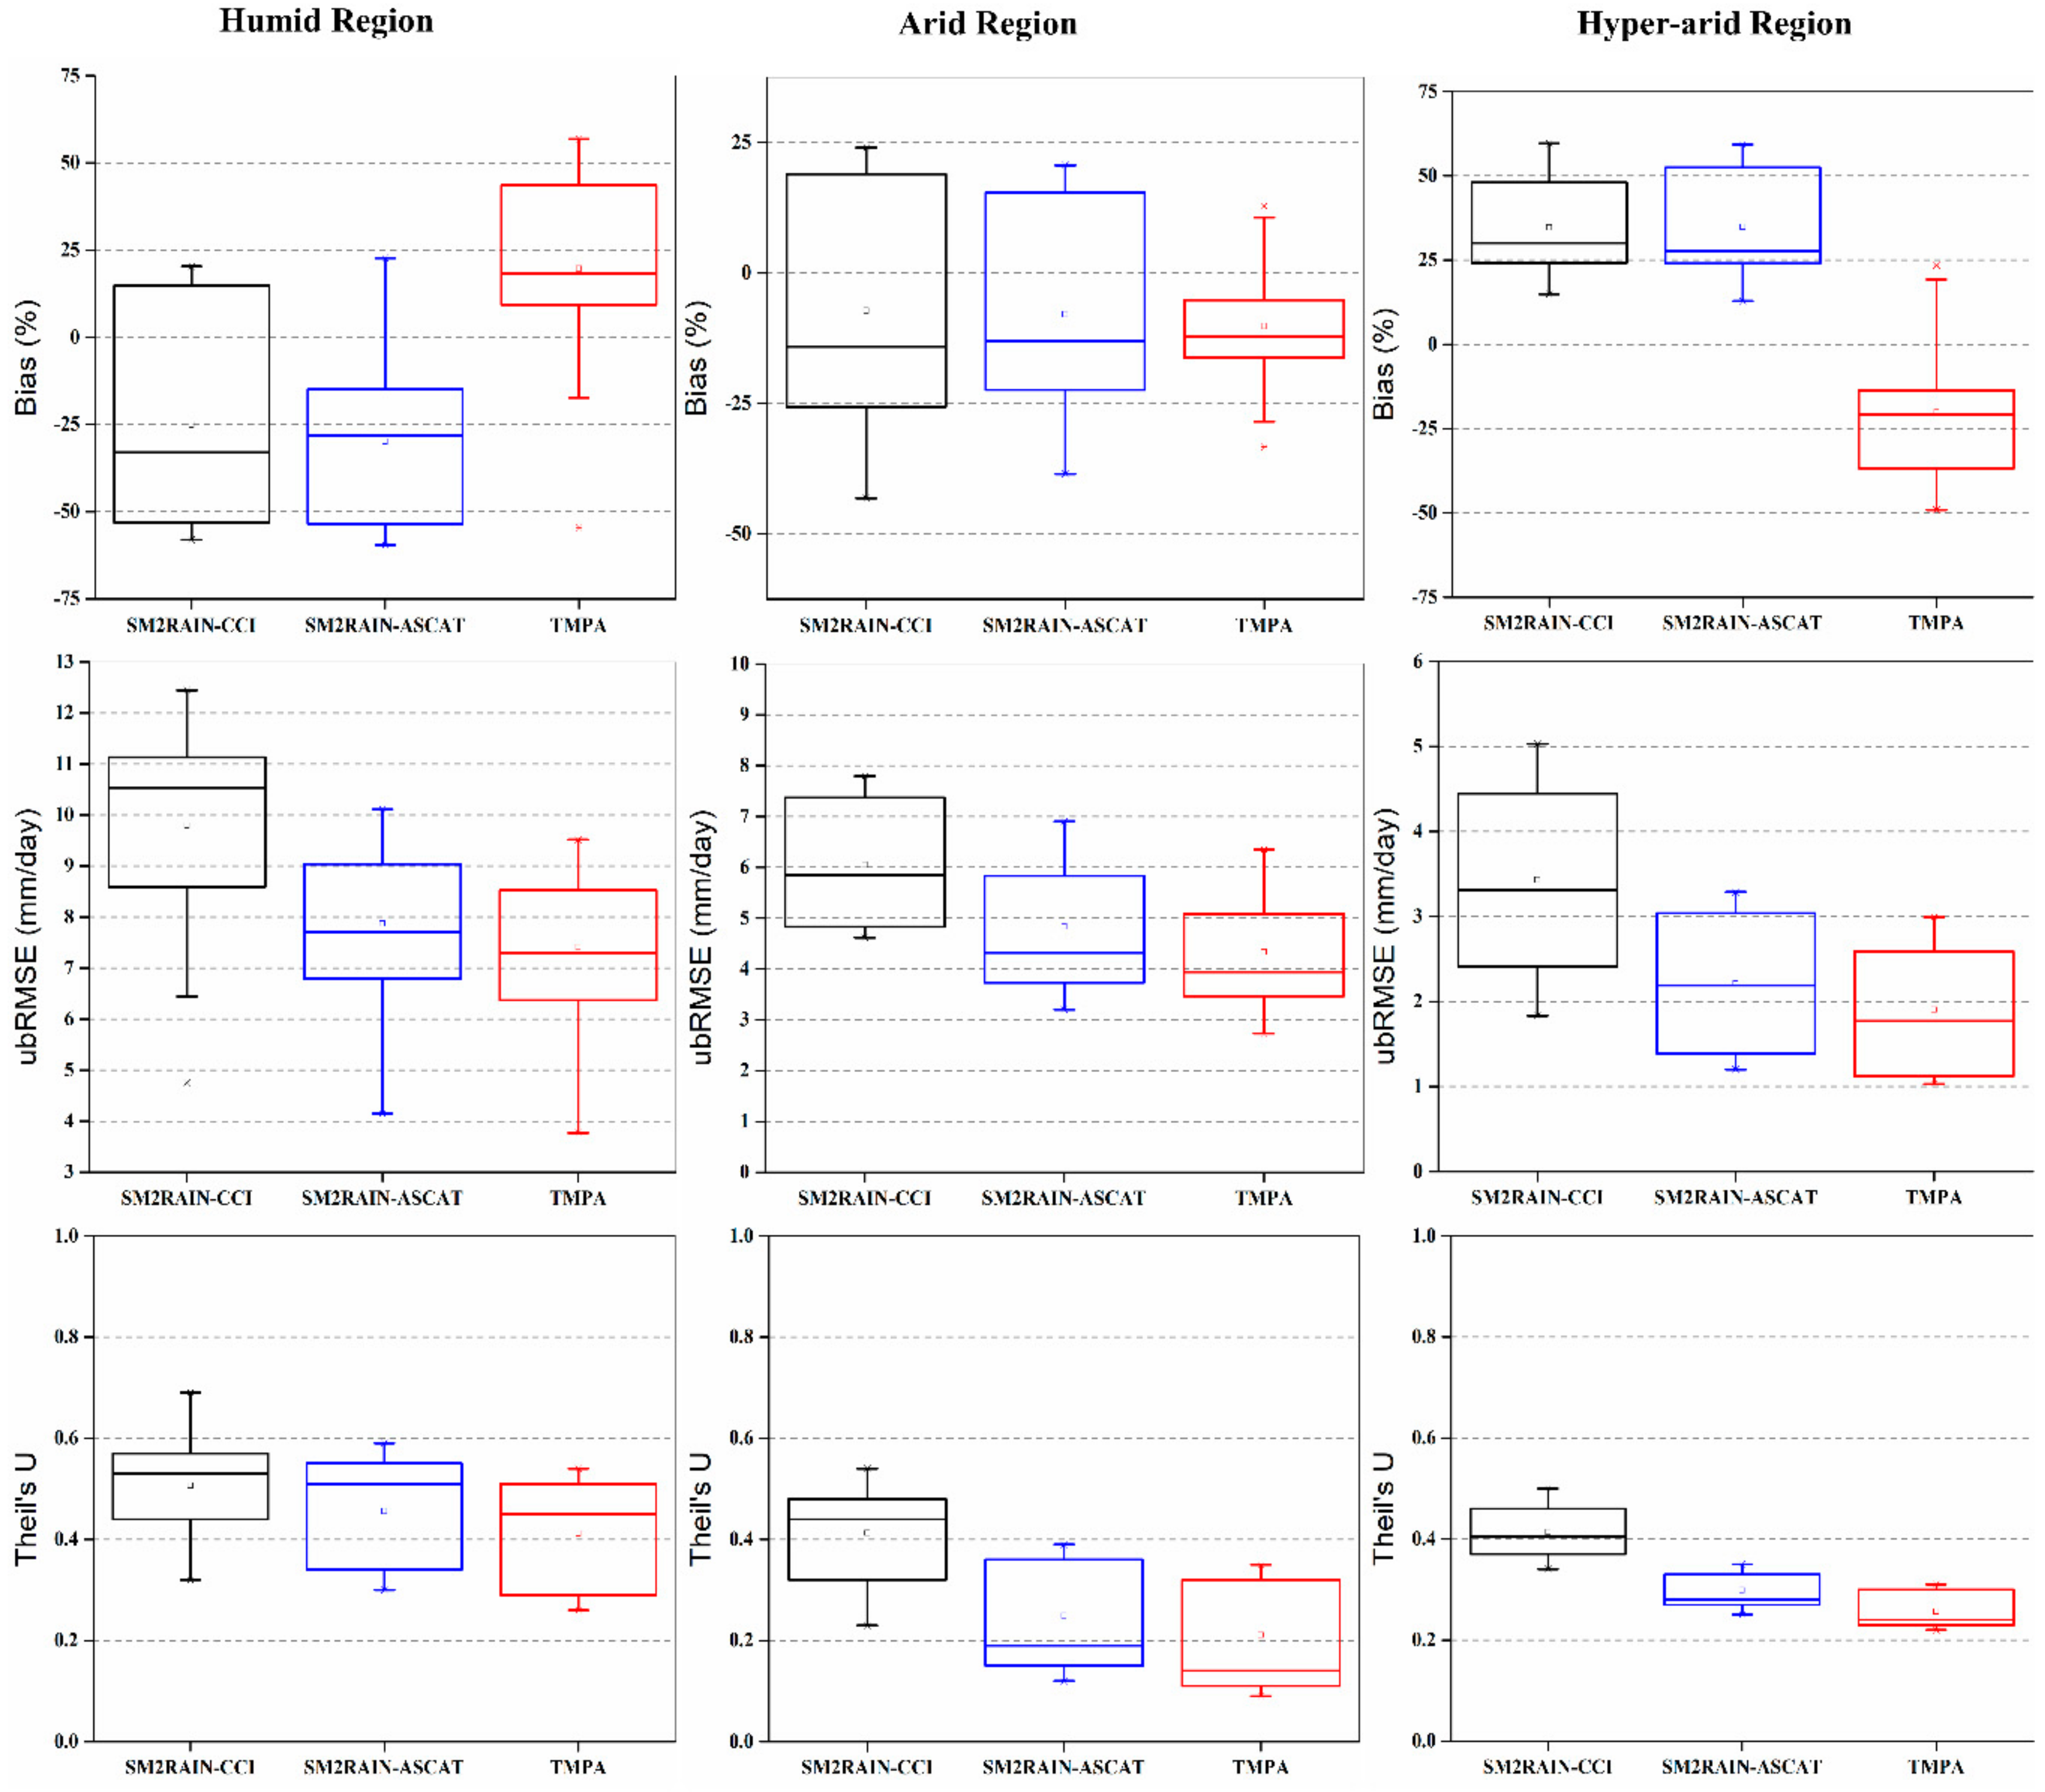
Previous studies [47,59,67] reported the better performance of TMPA across Pakistan than other PPs, including TRMM-3B42RT, PERSIANN-CDR, PERSIANN-CCS, and CMORPH. Therefore, TMPA was selected to comprehensively assess the performance of SM2RAIN-CCI and SM2RAIN-ASCAT. Three statistical metrics, i.e., Bias, ubRMSE, and Theil’s U are used to assess the performance of SM2RAIN-CCI/ASCAT against TMPA during the common period of 2007–2015. Figure 5 shows a comparison of performances of three precipitation products using box-plots. SM2RAIN-CCI data was not available for the glacial region, therefore this region is neglected.
In the humid region, SM2RAIN-CCI underestimated precipitation (negative Biases) and SM2RAIN-ASCAT under/overestimated precipitation (slightly positive Biases), however, TMPA had completely overestimated (positive Biases) precipitation. Moreover, the SM2RAIN-based product showed over/underestimation in the arid region while TMPA overestimated precipitation. A contrasting scenario is observed in the hyper-arid region where TMPA underestimated, and SM2RAIN-CCI/ASCAT overestimated precipitation. Overall, smaller biases are observed when TMPA is compared with RGs, in comparison with SM2RAIN-CCI/ASCAT.
In the case of ubRMSE, TMPA outperformed the SM2RAIN-ASCAT in all three climate regions, while both of them were superior to the SM2RAIN-CCI. The ubRMSE of SM2RAIN-ASCAT and TMPA were almost comparable in humid and hyper-arid regions. Moreover, ubRMSE decreased significantly from humid region to hyper-arid region, which might be associated with the precipitation magnitude, intensity and any other hydrological (hydraulic) activities in these climate regions.
Among these three PPs, Theil’s U coefficient depicts the best performance of TMPA, followed by SM2RAIN-ASCAT and SM2RAIN-CCI. Theil’s U shows higher variation (as well as best forecasting accuracy) in the arid region. Overall, TMPA dominated the SM2RAIN-based products across all Pakistan. SM2RAIN-ASCAT and SM2RAIN-CCI need proper bias adjustments before integrating into any hydrological applications.
4. Discussion
The performance of SM2RAIN-CCI (2000–2015) and SM2RAIN-ASCAT (2007–2015) precipitation products against the RGs observations (obtained from PMD and WAPDA departments of Pakistan) was assessed using six statistical and four categorical metrics. Both precipitation products were evaluated over the complex topography and diverse climate of Pakistan, and their performance was also compared with TRMM TMPA 3B42v7 (TMPA) during the period from 2007 to 2015. SM2RAIN-CCI precipitation observations were not available over snow cover, frozen soil, high topographical regions, and rainforests because of the mask used to remove the areas characterized by issues in SM retrieval [45] (shown in Figure 3). Inputs for SM2RAIN-CCI are based on integrating the active and passive ESA CCI SM datasets with bias-corrected and calibrated observations from GPCC-FDD [37]. However, SM2RAIN-ASCAT observations are obtained from application of the SM2RAIN algorithm to ASCAT SM data without consideration of any filter [32]. The observations are calibrated and bias-corrected based on the ERA5 reanalysis data [43].
Soil moisture-based precipitation products, i.e., SM2RAIN-CCI and SM2RAIN-ASCAT, captured the precipitation both spatially and temporally relatively well. However, both of them tended to fail to estimate the precipitation in the humid region characterized with high precipitation intensity and heavy magnitude (>700 mm), and more specifically in the hydraulically developed region with dams, barrages, headworks, and an extensively developed irrigation canal system (Figure 3 and Figure 4). The performance of SM2RAIN-based products is strongly influenced by spatial and temporal variation of precipitation. Comparatively better performance is observed in the arid and hyper-arid region, which is characterized by low precipitation magnitude (<100 mm). Furthermore, the temporal (seasonal) evaluation also revealed poor performance in monsoon and pre-monsoon seasons, having high precipitation intensity and magnitude. References [9,30] confirmed the poor performance of SM2RAIN algorithm that is unable to adequately estimate precipitation when the soil is close to saturation because the algorithm is unable to derive SM variation when the SM is constant. Similarly, references [41,42] evaluated the performance of SM2RAIN-CCI over north-eastern Brazil and concluded its poor performance in wetter precipitation regimes.
SM2RAIN-CCI and SM2RAIN-ASCAT highly overestimated and underestimated the precipitation in the coastal hyper-arid and mountainous regions of Pakistan, respectively (Figure 3a and Figure 4a). This can be considered as SM retrieval uncertainties, which significantly deteriorate the accuracy of precipitation estimates from the SM2RAIN algorithm (i.e., due to error propagation) [43]. Underestimation of precipitation is associated to poor infiltration capacity and soil moisture storage capacities of rocks (hills), permanent snow and glacier cover, hydraulic developmental activities, and intense and heavy precipitation during monsoon and pre-monsoon seasons, while overestimation is associated to low precipitation intensity and magnitude.
Though SM2RAIN-ASCAT underestimated the precipitation significantly in humid and glacial regions, the locations of heavy rainfall were relatively accurately detected as compared to SM2RAIN-CCI (Figure 3 and Figure 4). Larger biases and uncertainties at those locations are due to the impact of complex topography and diverse climate, which have been well documented in previous literature [47,59,67,68]. Higher positive or negative biases for SM2RAIN-based products are expected over densely vegetated and forest regions (glacial and hilly areas of the humid region) where signals of satellite sensors do not breach into dense vegetation [69], or in the region where the soil remains saturated for longer period of time such as flooded regions (the humid region, especially the hydraulically developed areas) [9], respectively. Considering other statistical metrics, all the metrics showed poor performance in precipitation dominated regions and seasons (Figure 3 and Figure 4, Table 4 and Table 5). References [9,41] confirm the findings of the current study.
Concerning the error components, the analysis revealed that SM2RAIN-CCI and SM2RAIN-ASCAT were similar in the spatial distribution of systematic and random errors (Figure 3d,e and Figure 4d,e). The results revealed that systematic error contributed significantly in comparison with random errors, supporting the findings of previous studies conducted by Prakash [6] and Paredes-Trejo, Barbosa and dos Santos [41] in India and Brazil, respectively. Therefore, these products require refinement and corrections before their integration into a particular hydrological application [70].
Seasonal evaluation of SM2RAIN-CCI and SM2RAIN-ASCAT presented a better performance in moderate to low precipitation seasons, i.e., post-monsoon and winter seasons (Table 4 and Table 5). During these two seasons, precipitation has had enough time to infiltrate into the soil and then saturate; therefore, the precipitation estimation capabilities of SM2RAIN-based precipitation products are high and hence produce relatively accurate results. However, precipitation in summer (monsoon season), which is distinguished by intense and short duration precipitation events, is the influential factor that affected the performance of both SM2RAIN-based products in terms of biases. Therefore, the possibility exists that the sensors might have not accurately estimated (or missed) the precipitation during the period [41].
The TMPA precipitation product performed reasonably well across different climate regions when compared with SM2RAIN-CCI and SM2RAIN-ASCAT (Figure 5). A different trend is observed in the humid and arid regions where SM2RAIN-based products overestimate and underestimates the precipitation; TMPA overestimates the precipitation. In contrast, in the hyper-arid region, TMPA underestimates while SM2RAIN-based product overestimates the precipitation. SM2RAIN-CCI depicted poor performance, implying high uncertainties when compared to SM2RAIN-ASCAT and TMPA across all three climate regions. TMPA showed comparatively good agreement with gauged based observations in different climate regions and different seasons relative to the SM2RAIN-based products.
The performance of SM2RAIN-based products across glacial, humid, arid and hyper-arid regions during the common period (2007-2015) are summarized in Table 7 and Table 8.
Based on spatial and temporal evaluation of SM2RAIN-CCI/ASCAT precipitation products across Pakistan along different climate regions, and the obtained results, the following recommendations are suggested for further studies and applications: (1) Agricultural water management and irrigation scheduling in the arid region (the Punjab province, which is agricultural hub of the country), where SM2RAIN-based PPs performed comparatively better, (2) An early flood warning system (EFWS) and flood simulation, where soil moisture (besides the precipitation intensity) plays important role, and bias-corrected SM2RAIN-based products will be helpful for reducing the impact of flood on society, (3) Drought monitoring in drought-prone arid and hyper-arid regions, including hydrological drought (shortage in water storage as well as net precipitation at same time) and meteorological drought (shortage in the catchment’s water fluxes such as precipitation), (4) Vegetation and crop growth monitoring, and (5) Groundwater modeling and rainwater harvesting studies.
5. Conclusions
In this study, the performance of SM2RAIN-CCI and SM2RAIN-ASCAT were assessed extensively across Pakistan using the rain gauge (RGs) observations. The assessment was carried across four different climate regions of Pakistan, namely glacial, humid, arid and hyper-arid regions during the period 2000–2015 (for SM2RAIN-CCI) and 2007–2015 for (SM2RAIN-ASCAT) on a daily scale. Three statistical metrics, i.e., Bias (%), ubRMSE (mm/day), and Theil’s U coefficient, and four categorical metrics, i.e., POD, FAR, CSI and Bias score, were used to assess the performance of SM2RAIN-based products. Moreover, the total mean square error was also decomposed to random and systematic error components, while KGE was also used to evaluate the performance of PPs. Finally, SM2RAIN-CCI and SM2RAIN-ASCAT were compared and evaluated against an extensively evaluated satellite precipitation product, i.e., TRMM TMPA 3B42 v7 (TMPA). Based on the results, following conclusions were drawn:
- (1)
- Both SM2RAIN-CCI and SM2RAIN-ASCAT underestimated precipitation in north-east of the humid region and hydraulically developed areas, i.e., regions with barrages, headworks, dams and an extensively developed irrigation canal system. Maximum underestimation for SM2RAIN-CCI (SM2RIAN-ASCAT) was 58.04% (42.36%).
- (2)
- SM2RAIN-based product underestimated precipitation over mountainous and glacial regions (SM2RAIN-ASCAT). In mountainous regions, the maximum underestimation of SM2RAIN-CCI was 43.16% (at ARG12) and 34.60% (at GRG17). This underestimation is due to low infiltration and soil water storage capacities of these mountainous areas.
- (3)
- Besides, overestimation is also observed in coastal hyper-arid areas (near the coast of Arabian Sea), which can be considered due to soil moisture retrieval errors, i.e., propagation errors that affect the quality of precipitation estimates from the SM2TAIN algorithm and soil water intrusion from the Arabian Sea. Maximum overestimation for SM2RAIN-CCI (SM2RAIN-ASCAT) was 59.59% (52.35%) at HARG20.
- (4)
- Based on the Theil’s U, high forecasting accuracies for SM2RAIN-based products were observed in the arid region (plain areas). Theil’s U for SM2RAIN-CCI (SM2RAIN-ASCAT) was 0.23 at ARG15 (0.15 at ARG16).
- (5)
- SM2RAIN-ASCAT outperformed SM2RAIN-CCI across all climate regions of Pakistan. The average percentage improvements were: Bias (27.01% in humid, 5.94% in arid, and 6.05% in hyper-arid), ubRMSE (19.61% in humid, 20.16% in arid, and 25.56% in hyper-arid), Theil’s U (9.80% in humid, 28.80% in arid, and 26.83% in hyper-arid), MSEs (24.55% in humid, 13.83% in arid, and 8.22% in hyper-arid), MSEr (19.41% in humid, 29.20% in arid, and 24.14% in hyper-arid) and KGE score (5.26% in humid, 28.12% in arid, and 24.72% in hyper-arid).
- (6)
- The reliability of SM2RAIN-based products is dependent on topography and climate (precipitation variability), for instance, SM2RAIN-based products failed to estimate precipitation in mountains and semi-arid climate (west of arid region).
- (7)
- Among the systematic and random errors of SM2RAIN-CCI and SM2RAIN-ASCAT, systematic error dominated random error across all Pakistan, which suggest that the products need bias correction before integrating them in any hydrological application.
- (8)
- SM2RAIN-based products failed to accurately capture the intense (short duration) and heavy (long term events) precipitation during the monsoon and pre-monsoon seasons. Average values of statistical metrics during the monsoon season for SM2RAIN-CCI (SM2RAIN-ASCAT) were 20.90% (17.82%), 10.52 mm/day (8.61 mm/day), 0.47 (0.43), and 0.47 (0.55) for Bias, ubRMSE, Theil’s U, and KGE score, respectively. However, the performance improved from post-monsoon to the winter season as the precipitation magnitude decreased. Average values for statistical metrics during winter seasons for SM2RAIN-CCI (SM2RAIN-ASCAT) were 11.45% (8.59%), 3.39 mm/day (2.04 mm/day), 0.34 (0.29), and 0.69 (0.71) for Bias, ubRMSE, Theil’s U, and KGE score, respectively.
- (9)
- Comparison of SM2RAIN-based products with TMPA revealed the better performance of TMPA across all climate regions in terms of all statistical metrics.
Author Contributions
K.U.R. and S.S. conceived the research topic and formulated the methods; K.U.R. and M.S. collected and arranged the data, K.U.R. and Y.W. performed data processing and analysis, K.U.R. and S.S. interpreted the results, K.U.R. wrote the paper, S.S., M.S. and Y.W. provided reviews and revised manuscript.
Funding
This research was partially supported by the National Natural Science Foundation of China (grant numbers 51779119 and 51839006).
Acknowledgments
The authors would like to thank the Pakistan Meteorological Department (PMD) and Water and Power Development Authority (WAPDA) for providing the gauge based precipitation records and grateful to the developers of SM2RAIN-based precipitation products. The authors are thankful to editor and anonymous reviewers for their insightful comments and constructive suggestions, which have substantially improved the quality of the paper.
Conflicts of Interest
The authors declare no conflicts of interest.
References
- Maggioni, V.; Massari, C. On the performance of satellite precipitation products in riverine flood modeling: A review. J. Hydrol. 2018, 558, 214–224. [Google Scholar] [CrossRef]
- Skofronick-Jackson, G.; Petersen, W.A.; Berg, W.; Kidd, C.; Stocker, E.F.; Kirschbaum, D.B.; Kakar, R.; Braun, S.A.; Huffman, G.J.; Iguchi, T. The global precipitation measurement (GPM) mission for science and society. Bull. Am. Meteorol. Soc. 2017, 98, 1679–1695. [Google Scholar] [CrossRef] [PubMed]
- Brunetti, M.; Melillo, M.; Peruccacci, S.; Ciabatta, L.; Brocca, L. How far are we from the use of satellite rainfall products in landslide forecasting? Remote Sens. Environ. 2018, 210, 65–75. [Google Scholar] [CrossRef]
- Forootan, E.; Khaki, M.; Schumacher, M.; Wulfmeyer, V.; Mehrnegar, N.; van Dijk, A.; Brocca, L.; Farzaneh, S.; Akinluyi, F.; Ramillien, G. Understanding the global hydrological droughts of 2003–2016 and their relationships with teleconnections. Sci. Total Environ. 2019, 650, 2587–2604. [Google Scholar] [CrossRef] [PubMed]
- Pendergrass, A.G.; Knutti, R. The uneven nature of daily precipitation and its change. Geophys. Res. Lett. 2018, 45, 11,980–911,988. [Google Scholar] [CrossRef]
- Prakash, S. Performance assessment of CHIRPS, MSWEP, SM2RAIN-CCI, and TMPA precipitation products across India. J. Hydrol. 2019, 571, 50–59. [Google Scholar] [CrossRef]
- Zambrano, F.; Wardlow, B.; Tadesse, T.; Lillo-Saavedra, M.; Lagos, O. Evaluating satellite-derived long-term historical precipitation datasets for drought monitoring in Chile. Atmos. Res. 2017, 186, 26–42. [Google Scholar] [CrossRef]
- Rinaldo, A.; Bertuzzo, E.; Mari, L.; Righetto, L.; Blokesch, M.; Gatto, M.; Casagrandi, R.; Murray, M.; Vesenbeckh, S.M.; Rodriguez-Iturbe, I. Reassessment of the 2010–2011 Haiti cholera outbreak and rainfall-driven multiseason projections. Proc. Natl. Acad. Sci. USA 2012, 109, 6602–6607. [Google Scholar] [CrossRef]
- Brocca, L.; Ciabatta, L.; Massari, C.; Moramarco, T.; Hahn, S.; Hasenauer, S.; Kidd, R.; Dorigo, W.; Wagner, W.; Levizzani, V. Soil as a natural rain gauge: Estimating global rainfall from satellite soil moisture data. J. Geophys. Res. Atmos. 2014, 119, 5128–5141. [Google Scholar] [CrossRef]
- Maggioni, V.; Meyers, P.C.; Robinson, M.D. A review of merged high-resolution satellite precipitation product accuracy during the Tropical Rainfall Measuring Mission (TRMM) era. J. Hydrometeorol. 2016, 17, 1101–1117. [Google Scholar] [CrossRef]
- Villarini, G.; Mandapaka, P.V.; Krajewski, W.F.; Moore, R.J. Rainfall and sampling uncertainties: A rain gauge perspective. J. Geophys. Res. Atmos. 2008, 113. [Google Scholar] [CrossRef]
- Kidd, C.; Becker, A.; Huffman, G.J.; Muller, C.L.; Joe, P.; Skofronick-Jackson, G.; Kirschbaum, D.B. So, how much of the Earth’s surface is covered by rain gauges? Bull. Am. Meteorol. Soc. 2017, 98, 69–78. [Google Scholar] [CrossRef] [PubMed]
- Ebert, E.E.; Janowiak, J.E.; Kidd, C. Comparison of near-real-time precipitation estimates from satellite observations and numerical models. Bull. Am. Meteorol. Soc. 2007, 88, 47–64. [Google Scholar] [CrossRef]
- Massari, C.; Crow, W.; Brocca, L. An assessment of the performance of global rainfall estimates without ground-based observations. Hydrol. Earth Syst. Sci. 2017, 21, 4347–4361. [Google Scholar] [CrossRef] [Green Version]
- Hou, A.Y.; Kakar, R.K.; Neeck, S.; Azarbarzin, A.A.; Kummerow, C.D.; Kojima, M.; Oki, R.; Nakamura, K.; Iguchi, T. The global precipitation measurement mission. Bull. Am. Meteorol. Soc. 2014, 95, 701–722. [Google Scholar] [CrossRef]
- Kidd, C.; Levizzani, V. Status of satellite precipitation retrievals. Hydrol. Earth Syst. Sci. 2011, 15, 1109–1116. [Google Scholar] [CrossRef] [Green Version]
- Abera, W.; Brocca, L.; Rigon, R. Comparative evaluation of different satellite rainfall estimation products and bias correction in the Upper Blue Nile (UBN) basin. Atmos. Res. 2016, 178, 471–483. [Google Scholar] [CrossRef]
- Kimani, M.; Hoedjes, J.; Su, Z. An assessment of satellite-derived rainfall products relative to ground observations over East Africa. Remote Sens. 2017, 9, 430. [Google Scholar] [CrossRef]
- Huffman, G.J.; Bolvin, D.T.; Nelkin, E.J.; Wolff, D.B.; Adler, R.F.; Gu, G.; Hong, Y.; Bowman, K.P.; Stocker, E.F. The TRMM multisatellite precipitation analysis (TMPA): Quasi-global, multiyear, combined-sensor precipitation estimates at fine scales. J. Hydrometeorol. 2007, 8, 38–55. [Google Scholar] [CrossRef]
- Funk, C.; Peterson, P.; Landsfeld, M.; Pedreros, D.; Verdin, J.; Shukla, S.; Husak, G.; Rowland, J.; Harrison, L.; Hoell, A. The climate hazards infrared precipitation with stations—a new environmental record for monitoring extremes. Sci. Data 2015, 2, 150066. [Google Scholar] [CrossRef]
- Joyce, R.J.; Xie, P. Kalman filter–based CMORPH. J. Hydrometeorol. 2011, 12, 1547–1563. [Google Scholar] [CrossRef]
- Sorooshian, S.; Hsu, K.-L.; Gao, X.; Gupta, H.V.; Imam, B.; Braithwaite, D. Evaluation of PERSIANN system satellite-based estimates of tropical rainfall. Bull. Am. Meteorol. Soc. 2000, 81, 2035–2046. [Google Scholar] [CrossRef]
- Nguyen, P.; Ombadi, M.; Sorooshian, S.; Hsu, K.; AghaKouchak, A.; Braithwaite, D.; Ashouri, H.; Thorstensen, A.R. The PERSIANN family of global satellite precipitation data: A review and evaluation of products. Hydrol. Earth Syst. Sci. 2018, 22, 5801–5816. [Google Scholar] [CrossRef]
- Ushio, T.; Sasashige, K.; Kubota, T.; Shige, S.; Okamoto, K.I.; Aonashi, K.; Inoue, T.; Takahashi, N.; Iguchi, T.; Kachi, M. A Kalman filter approach to the Global Satellite Mapping of Precipitation (GSMaP) from combined passive microwave and infrared radiometric data. J. Meteorol. Soc. Jpn. Ser. II 2009, 87, 137–151. [Google Scholar] [CrossRef]
- Crow, W.; van Den Berg, M.; Huffman, G.; Pellarin, T. Correcting rainfall using satellite-based surface soil moisture retrievals: The Soil Moisture Analysis Rainfall Tool (SMART). Water Resour. Res. 2011, 47. [Google Scholar] [CrossRef]
- Pellarin, T.; Louvet, S.; Gruhier, C.; Quantin, G.; Legout, C. A simple and effective method for correcting soil moisture and precipitation estimates using AMSR-E measurements. Remote Sens. Environ. 2013, 136, 28–36. [Google Scholar] [CrossRef]
- Brocca, L.; Moramarco, T.; Melone, F.; Wagner, W. A new method for rainfall estimation through soil moisture observations. Geophys. Res. Lett. 2013, 40, 853–858. [Google Scholar] [CrossRef]
- Koster, R.D.; Brocca, L.; Crow, W.T.; Burgin, M.S.; De Lannoy, G.J. Precipitation estimation using L-band and C-band soil moisture retrievals. Water Resour. Res. 2016, 52, 7213–7225. [Google Scholar] [CrossRef] [Green Version]
- Tarpanelli, A.; Massari, C.; Ciabatta, L.; Filippucci, P.; Amarnath, G.; Brocca, L. Exploiting a constellation of satellite soil moisture sensors for accurate rainfall estimation. Adv. Water Resour. 2017, 108, 249–255. [Google Scholar] [CrossRef]
- Ciabatta, L.; Brocca, L.; Massari, C.; Moramarco, T.; Puca, S.; Rinollo, A.; Gabellani, S.; Wagner, W. Integration of satellite soil moisture and rainfall observations over the Italian territory. J. Hydrometeorol. 2015, 16, 1341–1355. [Google Scholar] [CrossRef]
- Ciabatta, L.; Massari, C.; Brocca, L.; Reimer, C.; Hann, S.; Dorigo, W.; Wagner, W. Using Python® Language for the Validation of the CCI Soil Moisture Products Via SM2RAIN. PeerJ Preprints 2016, 4, e2131v4. [Google Scholar] [CrossRef]
- Brocca, L.; Massari, C.; Ciabatta, L.; Moramarco, T.; Penna, D.; Zuecco, G.; Pianezzola, L.; Borga, M.; Matgen, P.; Martínez-Fernández, J. Rainfall estimation from in situ soil moisture observations at several sites in Europe: An evaluation of the SM2RAIN algorithm. J. Hydrol. Hydromech. 2015, 63, 201–209. [Google Scholar] [CrossRef]
- Chiaravalloti, F.; Brocca, L.; Procopio, A.; Massari, C.; Gabriele, S. Assessment of GPM and SM2RAIN-ASCAT rainfall products over complex terrain in southern Italy. Atmos. Res. 2018, 206, 64–74. [Google Scholar] [CrossRef]
- Massari, C.; Camici, S.; Ciabatta, L.; Brocca, L. Exploiting satellite-based surface soil moisture for flood forecasting in the Mediterranean area: State update versus rainfall correction. Remote Sens. 2018, 10, 292. [Google Scholar] [CrossRef]
- Brocca, L.; Pellarin, T.; Crow, W.T.; Ciabatta, L.; Massari, C.; Ryu, D.; Su, C.H.; Rüdiger, C.; Kerr, Y. Rainfall estimation by inverting SMOS soil moisture estimates: A comparison of different methods over Australia. J. Geophys. Res. Atmos. 2016, 121, 12,062–12,079. [Google Scholar] [CrossRef]
- Ciabatta, L.; Marra, A.C.; Panegrossi, G.; Casella, D.; Sanò, P.; Dietrich, S.; Massari, C.; Brocca, L. Daily precipitation estimation through different microwave sensors: Verification study over Italy. J. Hydrol. 2017, 545, 436–450. [Google Scholar] [CrossRef]
- Ciabatta, L.; Massari, C.; Brocca, L.; Gruber, A.; Reimer, C.; Hahn, S.; Paulik, C.; Dorigo, W.; Kidd, R.; Wagner, W. SM2RAIN-CCI: A new global long-term rainfall data set derived from ESA CCI soil moisture. Earth Syst. Sci. Data 2018, 10, 267. [Google Scholar] [CrossRef]
- Wanders, N.; Pan, M.; Wood, E.F. Correction of real-time satellite precipitation with multi-sensor satellite observations of land surface variables. Remote Sens. Environ. 2015, 160, 206–221. [Google Scholar] [CrossRef]
- Massari, C.; Brocca, L.; Moramarco, T.; Tramblay, Y.; Lescot, J.-F.D. Potential of soil moisture observations in flood modelling: Estimating initial conditions and correcting rainfall. Adv. Water Resour. 2014, 74, 44–53. [Google Scholar] [CrossRef]
- Román-Cascón, C.; Pellarin, T.; Gibon, F.; Brocca, L.; Cosme, E.; Crow, W.; Fernández-Prieto, D.; Kerr, Y.H.; Massari, C. Correcting satellite-based precipitation products through SMOS soil moisture data assimilation in two land-surface models of different complexity: API and SURFEX. Remote Sens. Environ. 2017, 200, 295–310. [Google Scholar] [CrossRef]
- Paredes-Trejo, F.; Barbosa, H.; dos Santos, C.A. Evaluation of the Performance of SM2RAIN-Derived Rainfall Products over Brazil. Remote Sens. 2019, 11, 1113. [Google Scholar] [CrossRef]
- Paredes-Trejo, F.; Barbosa, H.; Rossato Spatafora, L. Assessment of SM2RAIN-Derived and State-of-the-Art Satellite Rainfall Products over Northeastern Brazil. Remote Sens. 2018, 10, 1093. [Google Scholar] [CrossRef]
- Brocca, L.; Crow, W.T.; Ciabatta, L.; Massari, C.; De Rosnay, P.; Enenkel, M.; Hahn, S.; Amarnath, G.; Camici, S.; Tarpanelli, A. A review of the applications of ASCAT soil moisture products. IEEE J. Sel. Top. Appl. Earth Obs. Remote Sens. 2017, 10, 2285–2306. [Google Scholar] [CrossRef]
- Crow, W.T.; Huffman, G.J.; Bindlish, R.; Jackson, T.J. Improving satellite-based rainfall accumulation estimates using spaceborne surface soil moisture retrievals. J. Hydrometeorol. 2009, 10, 199–212. [Google Scholar] [CrossRef]
- Camici, S.; Ciabatta, L.; Massari, C.; Brocca, L. How reliable are satellite precipitation estimates for driving hydrological models: A verification study over the Mediterranean area. J. Hydrol. 2018, 563, 950–961. [Google Scholar] [CrossRef]
- Brocca, L.; Filippucci, P.; Hahn, S.; Ciabatta, L.; Massari, C.; Camici, S.; Schüller, L.; Bojkov, B.; Wagner; Wolfgang, W. SM2RAIN-ASCAT (2007–2018): Global daily satellite rainfall from ASCAT soil moisture. Earth Syst. Sci. Data 2019. Under Review. [Google Scholar] [CrossRef]
- Rahman, K.U.; Shang, S.; Shahid, M.; Li, J. Developing an Ensemble Precipitation Algorithm from Satellite Products and Its Topographical and Seasonal Evaluations over Pakistan. Remote Sens. 2018, 10, 1835. [Google Scholar] [CrossRef]
- Balkhair, K.S.; Rahman, K.U. Sustainable and economical small-scale and low-head hydropower generation: A promising alternative potential solution for energy generation at local and regional scale. Appl. Energy 2017, 188, 378–391. [Google Scholar] [CrossRef]
- Salma, S.; Shah, M.; Rehman, S. Rainfall trends in different climate zones of Pakistan. Pak. J. Meteorol. 2012, 9, 37–47. [Google Scholar]
- Dimri, A.; Niyogi, D.; Barros, A.; Ridley, J.; Mohanty, U.; Yasunari, T.; Sikka, D. Western disturbances: A review. Rev. Geophys. 2015, 53, 225–246. [Google Scholar] [CrossRef]
- Asmat, U.; Athar, H. Run-based multi-model interannual variability assessment of precipitation and temperature over Pakistan using two IPCC AR4-based AOGCMs. Theor. Appl. Climatol. 2017, 127, 16. [Google Scholar] [CrossRef]
- Liu, Y.Y.; Parinussa, R.; Dorigo, W.A.; De Jeu, R.A.; Wagner, W.; Van Dijk, A.; McCabe, M.F.; Evans, J. Developing an improved soil moisture dataset by blending passive and active microwave satellite-based retrievals. Hydrol. Earth Syst. Sci. 2011, 15, 425–436. [Google Scholar] [CrossRef] [Green Version]
- Dorigo, W.; Gruber, A.; De Jeu, R.; Wagner, W.; Stacke, T.; Loew, A.; Albergel, C.; Brocca, L.; Chung, D.; Parinussa, R. Evaluation of the ESA CCI soil moisture product using ground-based observations. Remote Sens. Environ. 2015, 162, 380–395. [Google Scholar] [CrossRef]
- Cui, C.; Xu, J.; Zeng, J.; Chen, K.-S.; Bai, X.; Lu, H.; Chen, Q.; Zhao, T. Soil moisture mapping from satellites: An intercomparison of SMAP, SMOS, FY3B, AMSR2, and ESA CCI over two dense network regions at different spatial scales. Remote Sens. 2018, 10, 33. [Google Scholar] [CrossRef]
- Wagner, W.; Hahn, S.; Kidd, R.; Melzer, T.; Bartalis, Z.; Hasenauer, S.; Figa-Saldaña, J.; de Rosnay, P.; Jann, A.; Schneider, S. The ASCAT soil moisture product: A review of its specifications, validation results, and emerging applications. Meteorol. Z. 2013, 22, 5–33. [Google Scholar] [CrossRef]
- Dorigo, W.; Wagner, W.; Albergel, C.; Albrecht, F.; Balsamo, G.; Brocca, L.; Chung, D.; Ertl, M.; Forkel, M.; Gruber, A. ESA CCI Soil Moisture for improved Earth system understanding: State-of-the art and future directions. Remote Sens. Environ. 2017, 203, 185–215. [Google Scholar] [CrossRef]
- Melo, D.C.D.; Xavier, A.C.; Bianchi, T.; Oliveira, P.T.; Scanlon, B.R.; Lucas, M.C.; Wendland, E. Performance evaluation of rainfall estimates by TRMM Multi-satellite Precipitation Analysis 3B42V6 and V7 over Brazil. J. Geophys. Res. Atmos. 2015, 120, 9426–9436. [Google Scholar] [CrossRef]
- Caparoci Nogueira, S.; Moreira, M.; Lordelo Volpato, M. Evaluating precipitation estimates from Eta, TRMM and CHRIPS Data in the south-southeast region of Minas Gerais State—Brazil. Remote Sens. 2018, 10, 313. [Google Scholar] [CrossRef]
- Iqbal, M.F.; Athar, H. Validation of satellite based precipitation over diverse topography of Pakistan. Atmos. Res. 2018, 201, 247–260. [Google Scholar] [CrossRef]
- Bliemel, F. Theil’s Forecast Accuracy Coefficient: A Clarification; SAGE Publications Sage CA: Los Angeles, CA, USA, 1973. [Google Scholar]
- AghaKouchak, A.; Mehran, A.; Norouzi, H.; Behrangi, A. Systematic and random error components in satellite precipitation data sets. Geophys. Res. Lett. 2012, 39. [Google Scholar] [CrossRef] [Green Version]
- Huang, A.; Zhao, Y.; Zhou, Y.; Yang, B.; Zhang, L.; Dong, X.; Fang, D.; Wu, Y. Evaluation of multisatellite precipitation products by use of ground-based data over China. J. Geophys. Res. Atmos. 2016, 121, 10654–10675. [Google Scholar] [CrossRef]
- Kling, H.; Fuchs, M.; Paulin, M. Runoff conditions in the upper Danube basin under an ensemble of climate change scenarios. J. Hydrol. 2012, 424, 264–277. [Google Scholar] [CrossRef]
- Chen, F.; Li, X. Evaluation of IMERG and TRMM 3B43 monthly precipitation products over mainland China. Remote Sens. 2016, 8, 472. [Google Scholar] [CrossRef]
- Toté, C.; Patricio, D.; Boogaard, H.; Van Der Wijngaart, R.; Tarnavsky, E.; Funk, C. Evaluation of satellite rainfall estimates for drought and flood monitoring in Mozambique. Remote Sens. 2015, 7, 1758–1776. [Google Scholar] [CrossRef]
- Zia, I.; Zafar, H.; Shahzad, M.I.; Meraj, M.; Kazmi, J.H. Assessment of sea water inundation along Daboo Creek area in Indus Delta Region, Pakistan. J. Ocean. Univ. China 2017, 16, 1055–1060. [Google Scholar] [CrossRef]
- Khan, S.I.; Hong, Y.; Gourley, J.J.; Khattak, M.U.K.; Yong, B.; Vergara, H.J. Evaluation of three high-resolution satellite precipitation estimates: Potential for monsoon monitoring over Pakistan. Adv. Space Res. 2014, 54, 670–684. [Google Scholar] [CrossRef]
- Hussain, Y.; Satgé, F.; Hussain, M.B.; Martinez-Carvajal, H.; Bonnet, M.-P.; Cárdenas-Soto, M.; Roig, H.L.; Akhter, G. Performance of CMORPH, TMPA, and PERSIANN rainfall datasets over plain, mountainous, and glacial regions of Pakistan. Theor. Appl. Climatol. 2018, 131, 1119–1132. [Google Scholar] [CrossRef]
- Rodríguez-Fernández, N.J.; Muñoz Sabater, J.; Richaume, P.; Rosnay, P.D.; Kerr, Y.H.; Albergel, C.; Drusch, M.; Mecklenburg, S. SMOS near-real-time soil moisture product: Processor overview and first validation results. Hydrol. Earth Syst. Sci. 2017, 21, 5201–5216. [Google Scholar] [CrossRef]
- Bhatti, H.; Rientjes, T.; Haile, A.; Habib, E.; Verhoef, W. Evaluation of bias correction method for satellite-based rainfall data. Sensors 2016, 16, 884. [Google Scholar] [CrossRef]
Figure 1.
Study area and geographical location of rain gauges (RGs). (a) The elevation map of Pakistan derived from Shuttle Radar Topography Model (SRTM), (b) The four climate regions considered in this study.
Figure 1.
Study area and geographical location of rain gauges (RGs). (a) The elevation map of Pakistan derived from Shuttle Radar Topography Model (SRTM), (b) The four climate regions considered in this study.

Figure 2.
A general framework for the proposed methodology.

Figure 3.
Spatial distribution of bias (a), ubRMSE (b), Theil’s U coefficient (c), systematic error (d), random error (e), and KGE score (f) based on a daily scale across Pakistan from SM2RAIN-CCI compared to RGs data for the period of 2000–2015.
Figure 3.
Spatial distribution of bias (a), ubRMSE (b), Theil’s U coefficient (c), systematic error (d), random error (e), and KGE score (f) based on a daily scale across Pakistan from SM2RAIN-CCI compared to RGs data for the period of 2000–2015.

Figure 4.
Spatial distribution of bias (a), ubRMSE (b), Theil’s U coefficient (c), systematic error (d), random error (e), and KGE score (f) based on a daily scale across Pakistan from SM2RAIN-ASCAT compared to RGs data for the period of 2007–2015.
Figure 4.
Spatial distribution of bias (a), ubRMSE (b), Theil’s U coefficient (c), systematic error (d), random error (e), and KGE score (f) based on a daily scale across Pakistan from SM2RAIN-ASCAT compared to RGs data for the period of 2007–2015.

Figure 5.
Daily box-plots for Bias (%), ubRMSE (mm/day) and Theil’s U for SM2RAIN-CCI (black box) and SM2RAIN-ASCAT (blue box) against TMPA (red box) during the period 2007–2015. The line in each box indicates the median values and each box (top and bottom lines) depicts the 25th and 75th percentile, while the lines perpendicular to boxes (whiskers) extend to the extreme data points.


Table 1.
Main features of the selected four climate regions.
| Climate Region | Area (km2) | Mean Elevation (m) | Mean Annual Precipitation (mm) | Meteorological Stations |
|---|---|---|---|---|
| Glacial | 72,774 | 4158 | 348 | 19 |
| Humid | 137,753 | 1286 | 852 | 39 |
| Arid | 270,484 | 633 | 322 | 19 |
| Hyper-Arid | 322,929 | 444 | 133 | 25 |
Table 2.
Statistical metrics used to assess the performance of SM2RAIN-CCI and SM2RAIN-ASCAT. E is the estimated precipitation (PPs), O is the observed precipitation records from RGs, n is the total number of data points, is the average of estimated precipitation, and is the average of observed precipitation.
| Statistical Metrics | Formula | Perfect Value |
|---|---|---|
| Bias | 0 | |
| Root Mean Square Error | 0 | |
| Unbiased root mean square error | 0 | |
| Theil’s U | . | 0 |
Table 3.
Categorical metrics, where hit indicates the number of precipitation events correctly detected both by PPs and RGs, miss indicates the number of precipitation events not detected by PPs but recorded by RGs, false_alarm is number of precipitation events detected by PPs while no precipitation records are available at RGs, and N is the total number of events.
| Statistical Metric | Formula | Perfect Score |
|---|---|---|
| Probability of Detection | 1 | |
| False_alarm_ratio | 0 | |
| Critical-Success-Index | 1 | |
| Bias score | 1 |
Table 4.
Seasonal evaluation of SM2RAIN-CCI across Pakistan during 2007-2015.
| Season | Statistics | Bias (%) | ubRMSE (mm/Day) | Theil’s U | KGE Score |
|---|---|---|---|---|---|
| Pre-monsoon (A-M-J) | Maximum | 68.21 | 9.81 | 0.63 | 0.59 |
| Minimum | −36.12 | 0.73 | 0.20 | 0.31 | |
| Average | 16.80 | 4.65 | 0.45 | 0.58 | |
| Median | 16.19 | 4.28 | 0.44 | 0.56 | |
| Monsoon (J-A-S) | Maximum | 79.53 | 19.69 | 0.68 | 0.53 |
| Minimum | −40.44 | 1.16 | 0.23 | 0.19 | |
| Average | 20.90 | 10.52 | 0.47 | 0.47 | |
| Median | 22.01 | 10.27 | 0.48 | 0.48 | |
| Post-monsoon (O-N) | Maximum | 56.43 | 7.45 | 0.57 | 0.68 |
| Minimum | −32.28 | 0.56 | 0.18 | 0.42 | |
| Average | 13.76 | 2.65 | 0.38 | 0.65 | |
| Median | 14.59 | 2.12 | 0.38 | 0.63 | |
| Winter (D-J-F-M) | Maximum | 53.88 | 6.96 | 0.47 | 0.75 |
| Minimum | −33.22 | 0.39 | 0.15 | 0.49 | |
| Average | 11.45 | 3.39 | 0.34 | 0.69 | |
| Median | 10.98 | 3.85 | 0.33 | 0.67 |
Table 5.
Seasonal evaluation of SM2RAIN-ASCAT across Pakistan during 2007-2015.
| Season | Statistics | Bias (%) | ubRMSE (mm/day) | Theil’s U | KGE Score |
|---|---|---|---|---|---|
| Pre-monsoon (A-M-J) | Maximum | 61.72 | 8.23 | 0.54 | 0.70 |
| Minimum | −33.20 | 0.56 | 0.16 | 0.42 | |
| Average | 11.20 | 3.97 | 0.38 | 0.61 | |
| Median | 12.29 | 4.02 | 0.40 | 0.60 | |
| Monsoon (J-A-S) | Maximum | 71.38 | 17.94 | 0.59 | 0.62 |
| Minimum | −47.03 | 0.82 | 0.20 | 0.26 | |
| Average | 17.82 | 8.61 | 0.43 | 0.55 | |
| Median | 17.31 | 8.47 | 0.42 | 0.53 | |
| Post-monsoon (O-N) | Maximum | 49.21 | 6.38 | 0.52 | 0.78 |
| Minimum | −29.09 | 0.52 | 0.15 | 0.49 | |
| Average | 12.32 | 2.39 | 0.36 | 0.65 | |
| Median | 12.62 | 2.31 | 0.33 | 0.66 | |
| Winter (D-J-F-M) | Maximum | 43.29 | 5.91 | 0.44 | 0.84 |
| Minimum | −25.90 | 0.44 | 0.12 | 0.55 | |
| Average | 8.59 | 2.04 | 0.29 | 0.71 | |
| Median | 8.55 | 1.97 | 0.28 | 0.70 |
Table 6.
Daily scale averaged regional categorical metrics of SM2RAIN-CCI (SM2RAIN-ASCAT) during 2007–2015.
Table 6.
Daily scale averaged regional categorical metrics of SM2RAIN-CCI (SM2RAIN-ASCAT) during 2007–2015.
| Climate Region | Statistics | POD | FAR | CSI | Bias Score |
|---|---|---|---|---|---|
| Humid | Average | 0.59 (0.67) | 0.40 (0.34) | 0.57 (0.63) | 0.67 (0.73) |
| Median | 0.62 (0.69) | 0.39 (0.35) | 0.56 (0.65) | 0.72 (0.74) | |
| Arid | Average | 0.67 (0.75) | 0.28 (0.24) | 0.72 (0.79) | 0.76 (0.81) |
| Median | 0.69 (0.73) | 0.24 (0.23) | 0.71 (0.77) | 0.77 (0.84) | |
| Hyper-Arid | Average | 0.75 (0.82) | 0.21 (0.17) | 0.81 (0.90) | 0.82 (0.88) |
| Median | 0.75 (0.81) | 0.18 (0.14) | 0.82 (0.89) | 0.80 (0.89) |
Table 7.
Summary of the performance of SM2RAIN-CCI datasets across the four climate regions of Pakistan during 2007–2015.
Table 7.
Summary of the performance of SM2RAIN-CCI datasets across the four climate regions of Pakistan during 2007–2015.
| Climate Region | Evaluation Metrics | Performance | Reasons |
|---|---|---|---|
| Humid | *Bias **ubRMSE **Theil’s U **KGE ***Systematic error ****Random error | *Underestimation (majority) **Poor performance ***Lower magnitude **** Higher magnitude | *High underestimation due to hydraulically developed area ** Due to intense and heavy precipitation |
| Arid | *Bias **ubRMSE **Theil’s U **KGE ***Systematic error ****Random error | *Underestimation over mountainous areas while overestimation in plain areas **Comparatively better ubRMSE while higher accuracy is detected over agricultural areas and low accuracy at over mountainous areas **High KGE in plain areas while low in mountain areas ***Highest in the south while higher in rest of the region ****Lowest in the south while lower in rest of the region | *Underestimation is due to poor infiltration capacity of rock in the east of the region, moreover, snow cover in winter also contributes to underestimation **Higher performance in the region in terms of ubRMSE and Theil’s U is due to agriculture and moderate precipitation in the region |
| Hyper-arid | *Bias **ubRMSE **Theil’s U **KGE ***Systematic error ****Random error | *Overestimation in all the regions (higher in south-east) **Lowest ubRMSE while moderate to lower forecasting accuracy **Moderate KGE ***Highest among all climate regions ****Lowest among all climate regions | *Overestimation due to seawater intrusion and minimum precipitation in the region |
Table 8.
Summary of the performance of SM2RAIN-ASCAT dataset across four climate regions of Pakistan during 2007–2015.
Table 8.
Summary of the performance of SM2RAIN-ASCAT dataset across four climate regions of Pakistan during 2007–2015.
| Climate Region | Evaluation Metrics | Performance | Reasons |
|---|---|---|---|
| Glacial | *Bias **ubRMSE **Theil’s U **KGE ***Systematic error ****Random error | *Underestimation, high in east while relatively low in west **Relatively better performance in east **Poor forecasting in middle of the region **Lower KGE ***Highest toward the east ****Lowest toward the east | *Underestimation due to permanent snow and glacier cover **Errors due to low infiltration and storage capacity in the region |
| Humid | *Bias **ubRMSE **Theil’s U **KGE ***Systematic error ****Random error | *Underestimation in the north-east while overestimation in the west of the region **Poor performance **Poor forecasting accuracy **Lower KGE score ***Lower systematic error ****High random error | *High underestimation is due to heavy and intense precipitation in north-east *Hydraulically developed areas and flooded regions |
| Arid | *Bias **ubRMSE **Theil’s U **KGE ***Systematic error ****Random error | *Underestimation in the mountainous region while overestimation in plain agricultural lands **Moderate RMSE and high forecasting accuracy in plain areas **High KGE in plain areas while low over mountain areas ***Highest over elevated areas while moderate in plain areas ****Lowest over mountain areas while moderate in plain areas | *Underestimation in the west due to snow cover in winter season, poor infiltration and soil water storage capacity of hilly areas **Moderate precipitation and agricultural activities which preserve soil moisture |
| Hyper-arid | *Bias **ubRMSE **Theil’s U **KGE ***Systematic error ****Random error | **Overestimation in all the regions (higher in south-east) **Lowest ubRMSE (west) while moderate (extreme south along the coast of Arabian Sea) to lower forecasting (north of the region) accuracy **High KGE along the coast, moderate to relatively low in rest of the region ***Highest systematic error ****Lowest random error | *Hyper-arid region receives very low precipitation. Seas water intrusion might be the reason for the overestimation **Low precipitation magnitude in the region causes lower uncertainties |
© 2019 by the authors. Licensee MDPI, Basel, Switzerland. This article is an open access article distributed under the terms and conditions of the Creative Commons Attribution (CC BY) license (http://creativecommons.org/licenses/by/4.0/).
Share and Cite
MDPI and ACS Style
Rahman, K.U.; Shang, S.; Shahid, M.; Wen, Y. Performance Assessment of SM2RAIN-CCI and SM2RAIN-ASCAT Precipitation Products over Pakistan. Remote Sens. 2019, 11, 2040. https://0-doi-org.brum.beds.ac.uk/10.3390/rs11172040
AMA Style
Rahman KU, Shang S, Shahid M, Wen Y. Performance Assessment of SM2RAIN-CCI and SM2RAIN-ASCAT Precipitation Products over Pakistan. Remote Sensing. 2019; 11(17):2040. https://0-doi-org.brum.beds.ac.uk/10.3390/rs11172040
Chicago/Turabian StyleRahman, Khalil Ur, Songhao Shang, Muhammad Shahid, and Yeqiang Wen. 2019. "Performance Assessment of SM2RAIN-CCI and SM2RAIN-ASCAT Precipitation Products over Pakistan" Remote Sensing 11, no. 17: 2040. https://0-doi-org.brum.beds.ac.uk/10.3390/rs11172040
Note that from the first issue of 2016, this journal uses article numbers instead of page numbers. See further details here.