On the Applicability of Laboratory Thermal Infrared Emissivity Spectra for Deconvolving Satellite Data of Opaque Volcanic Ash Plumes


Abstract
:1. Introduction
2. Materials and Methods
2.1. Sample Collection
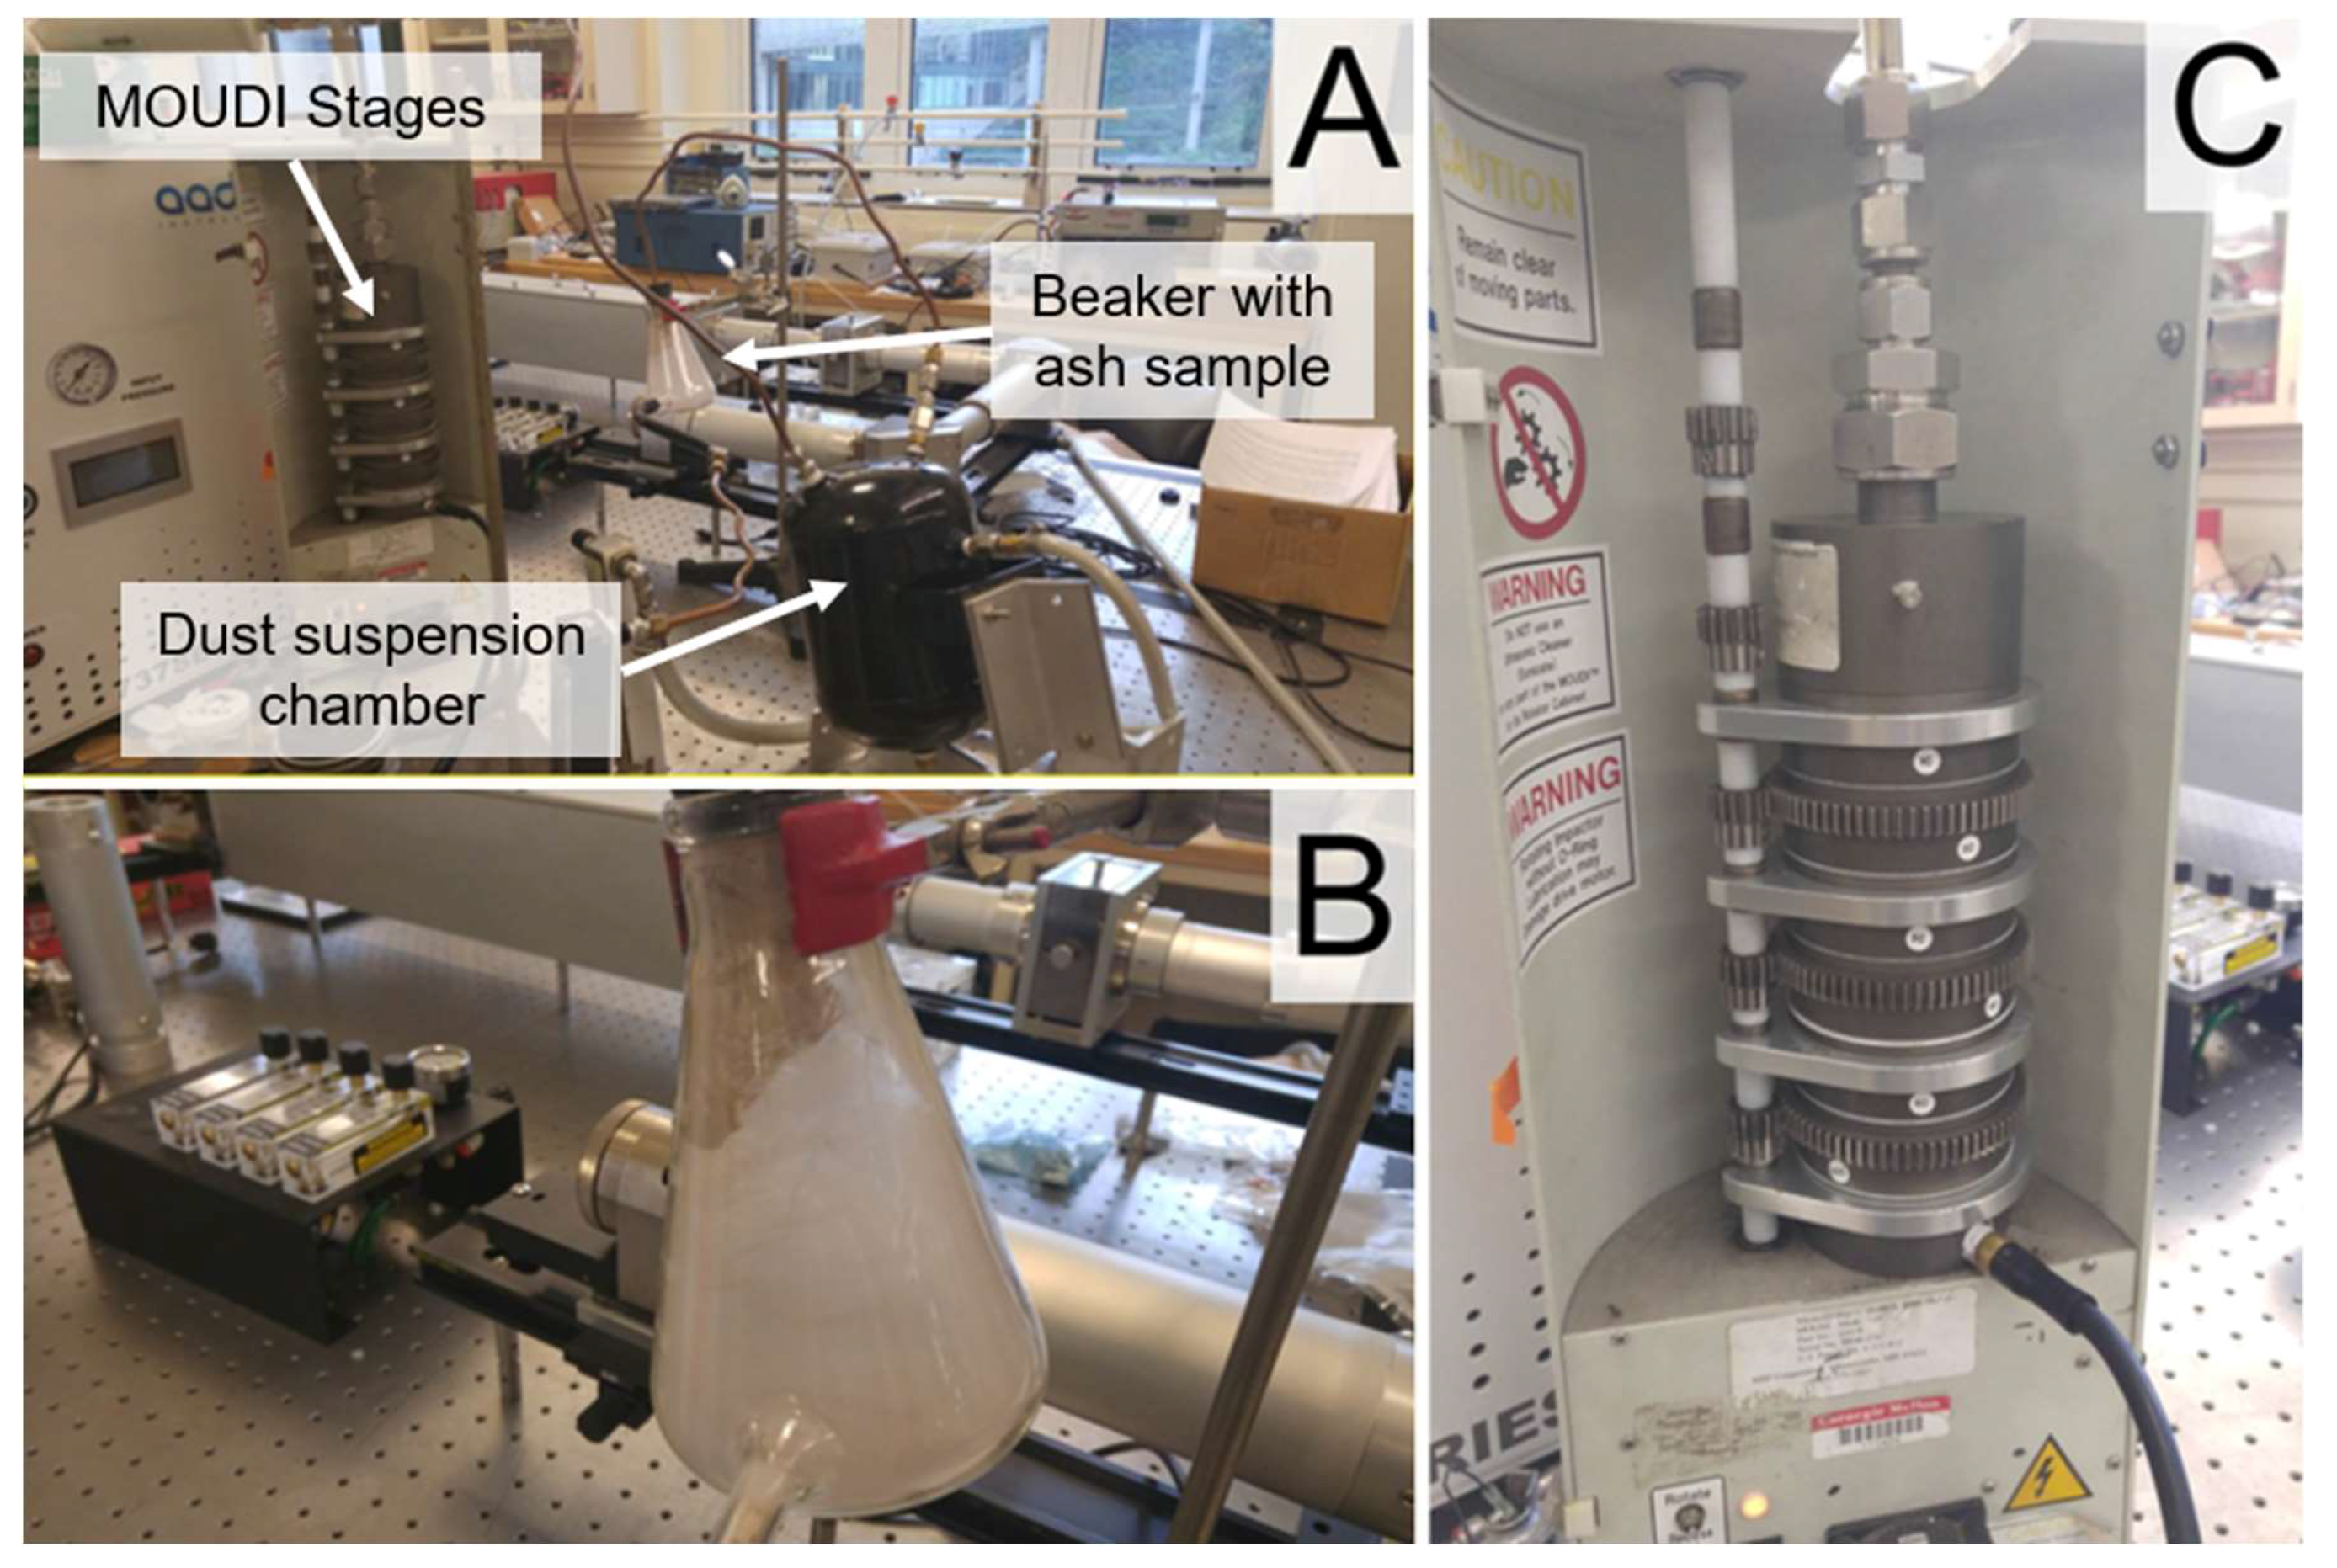
2.2. Sample Preparation and Separation
2.3. Collection of Emissivity Spectra
2.4. Additional Analyses
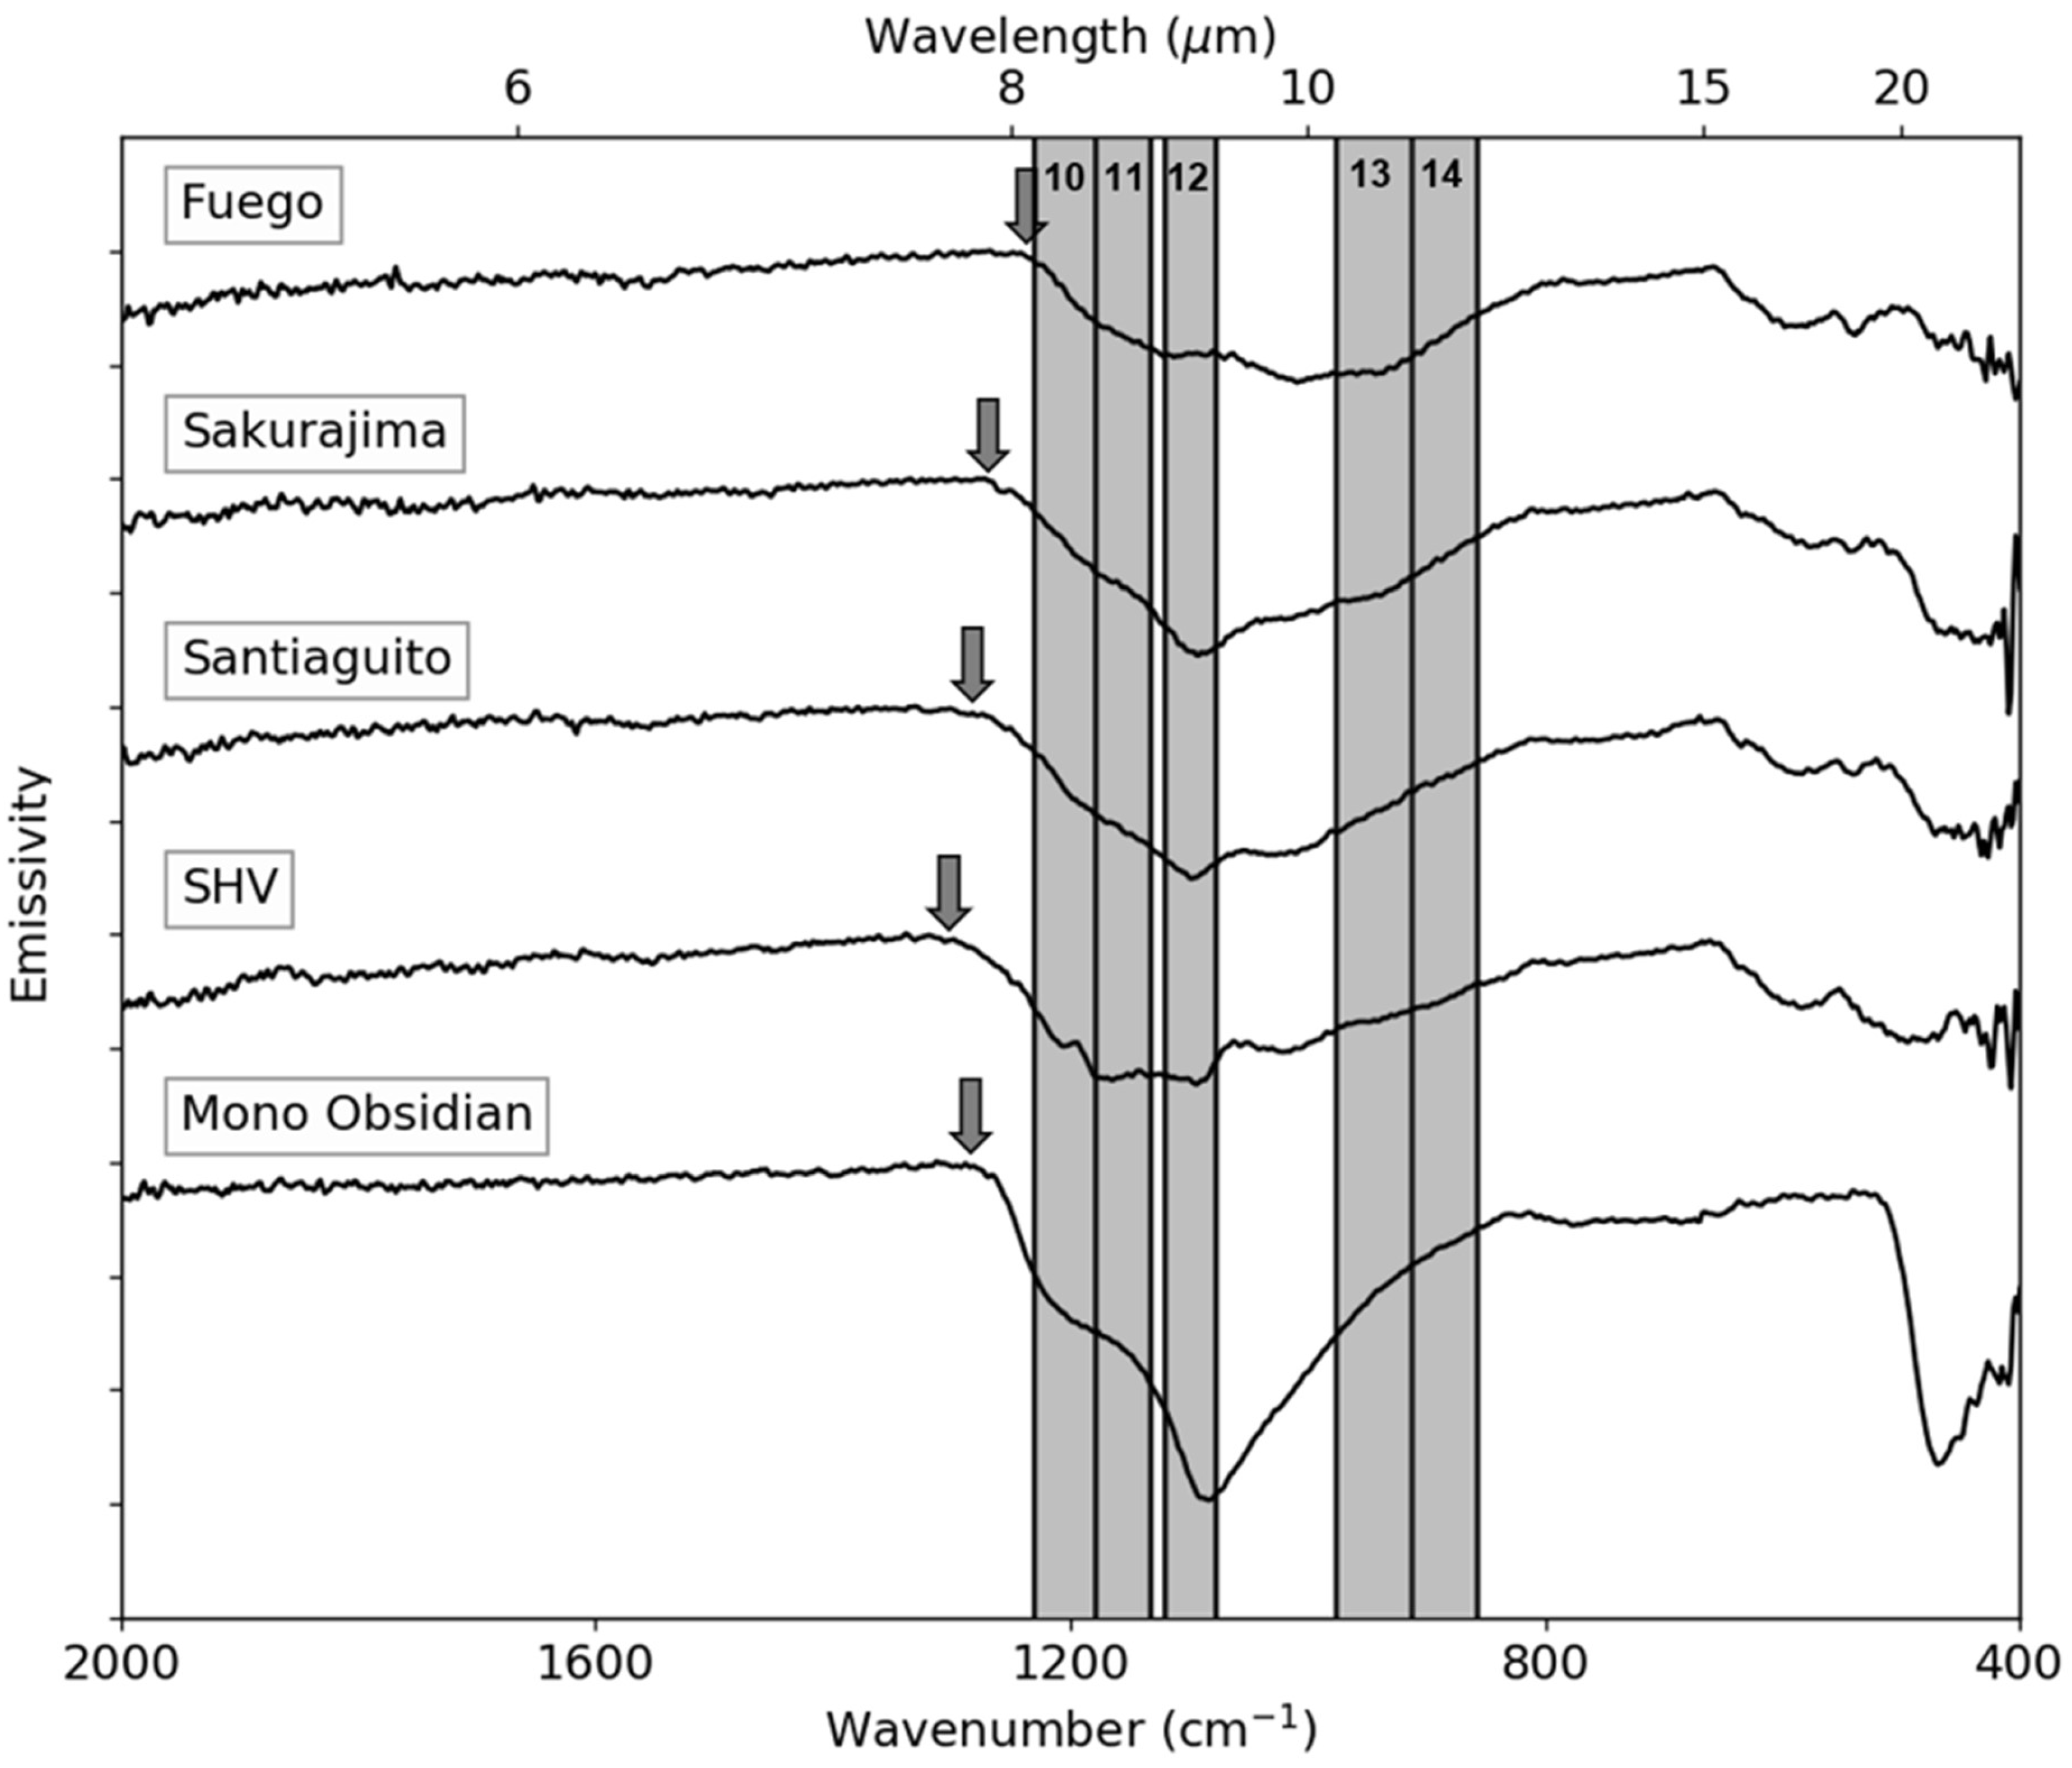
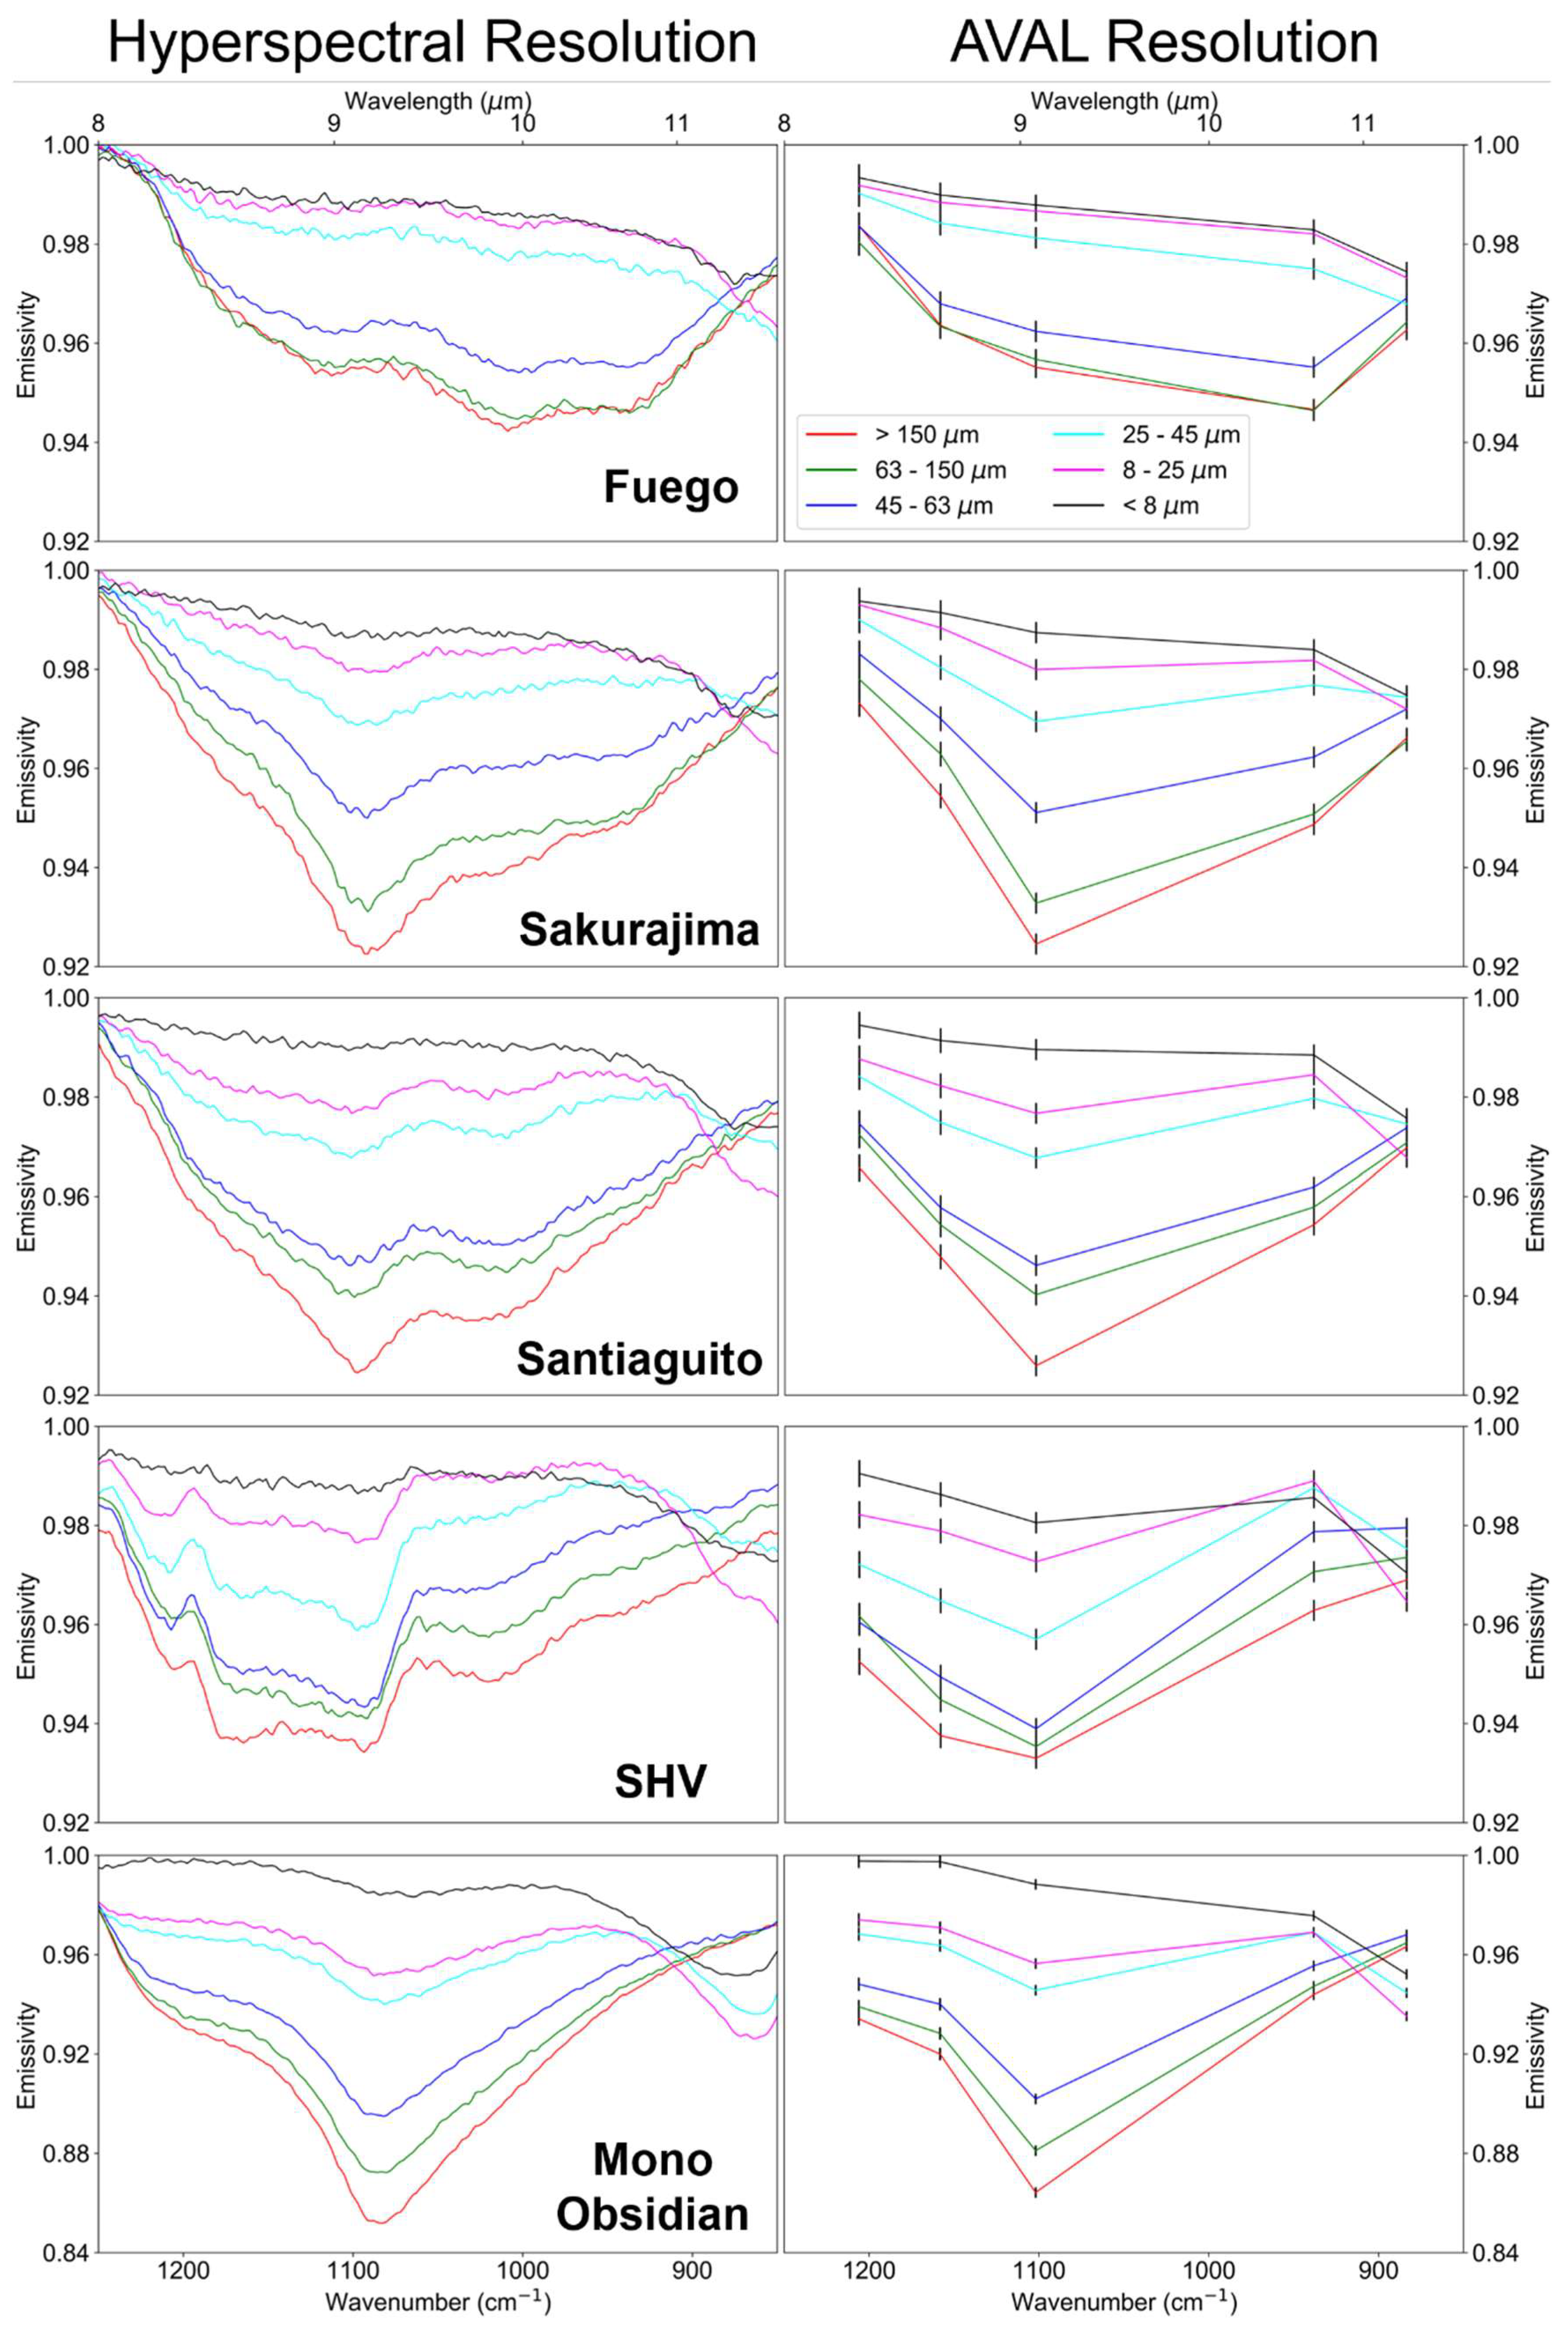
3. Laboratory Results
4. Application to ASTER Data
5. Conclusions
Author Contributions
Funding
Acknowledgments
Conflicts of Interest
References
- Heiken, G.; Wohletz, K. Volcanic Ash; University Presses of California, Chicago, Harvard & MIT: London, UK, 1985. [Google Scholar]
- Rose, W.I.; Durant, A.J. Fine ash content of explosive eruptions. J. Volcan. Geotherm. Res. 2009, 186, 32–39. [Google Scholar] [CrossRef]
- Heiken, G.; Wohletz, K. Fragmentation processes in explosive volcanic eruptions. In Sedimentation in Volcanic Settings: SEPM Special Publications, 1st ed.; Fisher, R.V., Smith, G.A., Eds.; Society for Sedimentary Geology: Tulsa, OK, USA, 1991; Volume 45, pp. 19–26. [Google Scholar]
- Klug, C.; Cashman, K.V. Permeability development in vesiculating magmas: implications for fragmentation. Bull. Volc. 1996, 58, 87–100. [Google Scholar] [CrossRef]
- Brown, R.J.; Bonadonna, C.; Durant, A.J. A review of volcanic ash aggregation. Phys. Chem. Earth Pts. A/B/C 2011, 45–46, 65–78. [Google Scholar] [CrossRef]
- Brazier, S.; Davis, A.N.; Sigurdsson, H.; Sparks, R.S.J. Fall-out and deposition of volcanic ash during the 1979 explosive eruption of the Soufriere of St. Vincent. J. Volc. Geotherm. Res. 1982, 14, 335–359. [Google Scholar] [CrossRef]
- Sorem, R.K. Volcanic ash clusters: tephra rafts and scavengers. J. Volc. Geotherm. Res. 1982, 13, 63–71. [Google Scholar] [CrossRef]
- Parfitt, E.A. A study of clast size distribution, ash deposition and fragmentation in a Hawaiian-style volcanic eruption. J. Volc. Geotherm. Res. 1998, 84, 197–208. [Google Scholar] [CrossRef]
- Taddeucci, J.; Scarlato, P.; Montanaro, C.; Cimarelli, C.; Del Bello, E.; Freda, C.; Andronico, D.; Gudmundsson, M.T.; Dingwell, D.B. Aggregation-dominated ash settling from the Eyjafjallajökull volcanic cloud illuminated by field and laboratory high-speed imaging. Geology 2011, 39, 891–894. [Google Scholar] [CrossRef]
- Van Eaton, A.R.; Mastin, L.G.; Herzog, M.; Schwaiger, H.F.; Schneider, D.J.; Wallace, K.L.; Clarke, A.B. Hail formation triggers rapid ash aggregation in volcanic plumes. Nat. Comms. 2015, 6, 7860. [Google Scholar] [CrossRef]
- Folch, A.; Sulpizio, R. Evaluating long-range volcanic ash hazard using supercomputing facilities: Application to Somma-Vesuvius (Italy), and consequences for civil aviation over the Central Mediterranean Area. Bull. Volc. 2010, 72, 1039–1059. [Google Scholar] [CrossRef]
- Baxter, P.J.; Bonadonna, C.; Dupree, R.; Hards, V.L.; Kohn, S.C.; Murphy, M.D.; Nichols, A.; Nicholson, R.A.; Norton, G.; Searl, A.; et al. Cristobalite in volcanic ash of the Soufrière Hills volcano, Montserrat, British West Indies. Science 1999, 283, 1142–1145. [Google Scholar] [CrossRef]
- Horwell, C.J.; Baxter, P.J. The respiratory health hazards of volcanic ash: A review for volcanic risk mitigation. Bull. Volc. 2006, 69, 1–24. [Google Scholar] [CrossRef]
- Barsotti, S.; Andronico, D.; Nieri, A.; Del Carlo, P.; Baxter, P.J.; Aspinall, W.P.; Hincks, T. Quantitative assessment of volcanic ash hazards for health and infrastructure at Mt. Etna (Italy) by numerical simulation. J. Volc. Geotherm. Res. 2010, 192, 85–96. [Google Scholar] [CrossRef]
- Bebbington, M.; Cronin, S.J.; Chapman, I.; Turner, M.B. Quantifying volcanic ash fall hazard to electricity infrastructure. J. Volc. Geotherm. Res. 2008, 177, 1055–1062. [Google Scholar] [CrossRef]
- Cronin, S.J.; Hedley, M.J.; Neal, V.J.; Smith, G. Agronomic impact of tephra fallout from 1995 and 1996 Ruapehu Volcano eruptions, New Zealand. Env. Geo. 1998, 34, 21–30. [Google Scholar] [CrossRef]
- Guffanti, M.; Tupper, A. Volcanic ash hazards and aviation risk. In Volcanic Hazards, Risks and Disasters, 1st ed.; Shroder, J.F., Papale, P., Eds.; Elesvier: New York, NY, USA, 2015; pp. 87–108. [Google Scholar]
- Taddeucci, J.; Pompilio, M.; Scarlato, P. Monitoring the explosive activity of the July–August 2001 eruption of Mt. Etna (Italy) by ash characterization. Geophys. Res. Lett. 2002, 29, 1230. [Google Scholar] [CrossRef]
- Orr, T.R.; Hoblitt, R.P. A Versatile Time-Lapse Camera System Developed by the Hawaiian Volcano Observatory for Use at Kilauea Volcano, Hawaii. Scientific Investigations Report No. 2008–5117; Geological Survey (U.S.): Reston, WA, USA, 2008; pp. 1–8. [Google Scholar]
- Pergola, N.; Tramutoli, V.; Marchese, F.; Scaffidi, I.; Lacava, T. Improving volcanic ash cloud detection by a robust satellite technique. Rem. Sens. Env. 2004, 90, 1–22. [Google Scholar] [CrossRef]
- Folch, A.; Costa, A.; Macedonio, G. FALL3D: A computational model for transport and deposition of volcanic ash. Comp. Geosci. 2009, 35, 1334–1342. [Google Scholar] [CrossRef]
- Realmuto, V.J.; Worden, H.M. Impact of atmospheric water vapor on the thermal infrared remote sensing of volcanic sulfur dioxide emissions: A case study from the Pu’u ‘O’vent of Kilauea Volcano, Hawaii. J. Geophys. Res. Sol. Earth. 2000, 105, 21497–21507. [Google Scholar] [CrossRef]
- Urai, M. Sulfur dioxide flux estimation from volcanoes using advanced spaceborne thermal emission and reflection radiometer—a case study of Miyakejima volcano, Japan. J. Volc. Geotherm. Res. 2004, 134, 1–13. [Google Scholar] [CrossRef]
- Prata, A.J. Observations of volcanic ash clouds in the 10–12 μm window using AVHRR/2 data. Int. J. Rem. Sens. 1989, 10, 751–761. [Google Scholar] [CrossRef]
- Prata, A.J. Infrared radiative transfer calculations for volcanic ash clouds. Geophys. Res. Lett. 1989, 16, 1293–1296. [Google Scholar] [CrossRef]
- Elrod, G.P.; Connell, B.H.; Hillger, D.W. Improved detection of airborne volcanic ashusing multispectral thermal infrared satellite data. J. Geophys. Res. Atmos. 2003, 108. [Google Scholar] [CrossRef]
- Pavolonis, M.J.; Feltz, W.F.; Heidinger, A.K.; Gallina, G.M. A daytime complement to the reverse absorption technique for improved automated detection of volcanic ash. J. Atmos. Ocean. Tech. 2006, 23, 1422–1444. [Google Scholar] [CrossRef]
- Webley, P.W.; Lopez, T.M.; Ekstrand, A.L.; Dean, K.G.; Rinkleff, P.; Dehn, J.; Cahill, C.F.; Wessels, R.L.; Bailey, J.E.; Izbekov, P.; et al. Remote observations of eruptive clouds and surface thermal activity during the 2009 eruption of Redoubt volcano. J. Volc. Geotherm. Res. 2013, 259, 185–200. [Google Scholar] [CrossRef]
- Pavolonis, M.J.; Sieglaff, J.; Cintineo, J. Automated Detection of Explosive Volcanic Eruptions Using Satellite-Derived Cloud Vertical Growth Rates. Earth Space Sci. 2018, 5, 903–928. [Google Scholar] [CrossRef] [Green Version]
- Wen, S.; Rose, W.I. Retrieval of sizes and total masses of particles in volcanic clouds using AVHRR bands 4 and 5. J. Geophys. Res. Atmos. 1994, 99, 5421–5431. [Google Scholar] [CrossRef]
- Prata, A.J.; Grant, I.F. Retrieval of microphysical and morphological properties of volcanic ash plumes from satellite data: Application to Mt Ruapehu, New Zealand. Quart. J. Royal Meteo. Soc. 2001, 127, 2153–2179. [Google Scholar] [CrossRef]
- Simpson, J.J.; Hufford, G.; Pieri, D.; Berg, J. Failures in detecting volcanic ash from a satellite-based technique. Rem. Sens. Environ. 2000, 72, 191–217. [Google Scholar] [CrossRef]
- Prata, F.; Bluth, G.; Rose, B.; Schneider, D.; Tupper, A. Comments on “Failures in detecting volcanic ash from a satellite-based technique”. Rem. Sens. Environ. 2001, 78, 341–346. [Google Scholar] [CrossRef]
- Bonadonna, C.; Folch, A.; Loughlin, S.; Puempel, H. Future developments in modelling and monitoring of volcanic ash clouds: Outcomes from the first IAVCEI-WMO workshop on Ash Dispersal Forecast and Civil Aviation. Bull. Volc. 2012, 74, 1–10. [Google Scholar] [CrossRef]
- Pollack, J.B.; Toon, O.B.; Khare, B.N. Optical properties of some terrestrial rocks and glasses. Icarus 1973, 19, 372–389. [Google Scholar] [CrossRef]
- Reed, B.E.; Peters, D.M.; McPheat, R.; Grainger, R.G. The complex refractive index of volcanic ash aerosol retrieved from spectral mass extinction. J. Geophys. Res. Atmos. 2018, 123, 1339–1350. [Google Scholar] [CrossRef]
- Mackie, S.; Millington, S.; Watson, I.M. How assumed composition affects the interpretation of satellite observations of volcanic ash. Meteo. App. 2014, 21, 20–29. [Google Scholar] [CrossRef]
- Ramsey, M.S.; Christensen, P.R. Mineral abundance determination: Quantitative deconvolution of thermal emission spectra. J. Geophys. Res. Sol. Earth 1998, 103, 577–596. [Google Scholar] [CrossRef]
- Walter, L.S.; Salisbury, J.W. Spectral characterization of igneous rocks in the 8-to 12-μm region. J. Geophys. Res. Sol. Earth. 1989, 94, 9203–9213. [Google Scholar] [CrossRef]
- Rowan, L.C.; Salisbury, J.W.; Kingston, M.J.; Vergo, N.; Bostick, N.H. Evaluation of visible and near-infrared and thermal-infrared reflectance spectra for studying thermal alteration of Pierre Shale, Wolcott, Colorado. J. Geophys. Res. Sol. Earth. 1991, 96, 18047–18057. [Google Scholar] [CrossRef]
- Clark, R.N.; Swayze, G.A.; Wise, R.; Livo, E.; Hoefen, T.; Kokaly, R.; Sutley, S.J. USGS digital spectral library splib06a: U.S. Geological Survey, Digital Data Series 231. 2006. Available online: http://speclab.cr.usgs.gov/spectral.lib06 (accessed on 17 November 2018).
- Baldridge, A.M.; Hook, S.J.; Grove, C.I.; Rivera, G. The ASTER Spectral library version 2.0. Rem. Sens. Environ. 2009, 113, 711–715. [Google Scholar] [CrossRef]
- Christensen, P.R.; Bandfield, J.L.; Hamilton, V.E.; Howard, D.A.; Lane, M.D.; Piatek, J.L.; Ruff, S.W.; Stefanov, W.L. A thermal emission spectral library of rock-forming minerals. J. Geophys. Res. 2000, 105, 9735–9739. [Google Scholar] [CrossRef] [Green Version]
- Horwell, C.J. Grain-size analysis of volcanic ash for the rapid assessment of respiratory health hazard. J. Environ. Monitor. 2007, 9, 1107–1115. [Google Scholar] [CrossRef]
- Cashman, K.V.; Rust, A.C. (2015) Volcanic Ash: Generation and Spatial Variations. In Volcanic Ash: Hazard Observation, 1st ed.; Mackie, S., Cashman, K.V., Rickets, H., Rust, A.C., Watson, I.M., Eds.; Elsevier: Amsterdam, The Netherlands, 2015; pp. 5–22. [Google Scholar]
- Byrnes, J.M.; Ramsey, M.S.; King, P.L.; Lee, R.J. Thermal infrared reflectance and emission spectroscopy of quartzofeldspathic glasses. Geophys. Res. Lett. 2007, 34, L01306. [Google Scholar] [CrossRef]
- King, P.L.; McMillan, P.F.; Moore, G.M. Infrared spectroscopy of silicate glasses with application to natural systems. In Infrared Spectroscopy in Geochemistry, Exploration Geochemistry and Remote Sensing, 1st ed.; King, P.L., Ramsey, M.S., Swayze, G.A., Eds.; Mineralogical Association of Canada: London, Ontario, 2004; pp. 93–133. [Google Scholar]
- Minitti, M.E.; Hamilton, V.E. A search for basaltic-to-intermediate glasses on Mars: Assessing Martian crustal mineralogy. Icarus 2010, 210, 135–149. [Google Scholar] [CrossRef]
- Salisbury, J.W.; Wald, A. The role of volume scattering in reducing spectral contrast of reststrahlen bands in spectra of powdered minerals. Icarus 1992, 96, 121–128. [Google Scholar] [CrossRef]
- Marple, V.A.; Rubow, K.L.; Behm, S.M. A microorifice uniform deposit impactor (MOUDI): Description, calibration, and use. Aero. Sci. Tech. 1991, 14, 434–446. [Google Scholar] [CrossRef]
- Ruff, S.W.; Christensen, P.R.; Barbera, P.W.; Anderson, D.L. Quantitative thermal emission spectroscopy of minerals: A laboratory technique for measurement and calibration. J. Geophys. Res. Sol. Earth. 1997, 102, 14899–14913. [Google Scholar] [CrossRef]
- Abbey, S. Studies In “standard samples” of silicate rocks and minerals 1969–1982. Can. Geol. Surv. Paper 1983, 114, 83-15. [Google Scholar]
- Govindaraju, K. 1994 compilation of working values and sample description for 383 geostandards. Geostandards News 1994, 18, 1–158. [Google Scholar] [CrossRef]
- Logan, L.M.; Hunt, G.R.; Salisbury, J.W.; Balsamo, S.R. Compositional implications of Christiansen frequency maximums for infrared remote sensing applications. J. Geophys. Res. 1973, 78, 4983–5003. [Google Scholar] [CrossRef]
- Conel, J.E. Infrared emissivities of silicates: Experimental results and a cloudy atmosphere model of spectral emission from condensed particulate mediums. J. Geophys. Res. 1996, 74, 1614–1634. [Google Scholar] [CrossRef]
- Ramsey, M.S.; Fink, J.H. Estimating silicic lava vesicularity with thermal remote sensing: A new technique for volcanic mapping and monitoring. Bull. Volc. 1999, 61, 32–39. [Google Scholar] [CrossRef]
- Ramsey, M.S. Synergistic use of satellite thermal detection and science: A decadal perspective using ASTER. Geo. Soc. Lond. Spec. Pub. 2016, 426, 115–136. [Google Scholar] [CrossRef]
- Williams, D.B. An analysis of proximal volcanic ash emissions. Doctoral Dissertation, University of Pittsburgh, Pittsburgh, PA, USA, 11 August 2018. [Google Scholar]
- Abrams, M. The Advanced Spaceborne Thermal Emission and Reflection Radiometer (ASTER): Data products for the high spatial resolution imager on NASA’s Terra platform. Int. J. of Rem. Sens. 2000, 21, 847–859. [Google Scholar] [CrossRef]
- Gillespie, A.; Rokugawa, S.; Matsunaga, T.; Cothern, J.S.; Hook, S.; Kahle, A.B. A temperature and emissivity separation algorithm for Advanced Spaceborne Thermal Emission and Reflection Radiometer (ASTER) images. IEEE Trans. Geo. Rem. Sens. 1998, 36, 1113–1126. [Google Scholar] [CrossRef]
- Gustafson, W.T.; Gillespie, A.R.; Yamada, G.J. Revisions to the ASTER temperature/emissivity separation algorithm. In Proceedings of the 2nd International Symposium on Recent Advances in Quantitative Remote Sensing, University of Valencia Global Change Unit, Torrent, Spain, 25–29 September 2006. [Google Scholar]
- Kulkarni, G.; Nandasiri, M.; Zelenyuk, A.; Beranek, J.; Madaan, N.; Devaraj, A.; Shutthanandan, V.; Thevuthasan, S.; Varga, T. Effects of crystallographic properties on the ice nucleation properties of volcanic ash particles. Geophys. Res. Lett. 2015, 42, 3048–3055. [Google Scholar] [CrossRef]


| Volcano Name (Country) | Collected/Donated | Date of Collection | Eruption Style | Coordinates (UTM)/Notes |
|---|---|---|---|---|
| Fuego (Guatemala) | Collected | 02/24/2015 | Strombolian | Trinidad Barranca, Volcán De Fuego, Guatemala (15P, 729744.46m E, 1597125.24m N) |
| Sakurajima (Japan) | Donated | 07/22/2013 | Vulcanian | Collected during active ash fall. Sakurajima, Japan (52R, 659328.42 m E, 3492357.64 m N) |
| Santiaguito (Guatemala) | Collected | 03/07/2016 | Vulcanian | Opposite 2007 lava flow, Santiaguito, Guatemala (15P, 653738.00m E, 1626906.00m N) |
| Soufrière Hills Volcano (SHV) (Montserrat) | Donated | 02/2010 | Vulcanian | Belham Valley, Montserrat † |
| Mono-Inyo Craters (USA) | Collected | 07/15/2012 | Sub-Plinian | Mono-Inyo Craters complex, California, USA. Sample is glassy obsidian that was crushed and sieved (11S, 321901.22 m E, 4180047.07 m N). |
| Fuego | Sakurajima | Santiaguito | SHV | Mono-Inyo Obsidian | |
|---|---|---|---|---|---|
| Christiansen Frequency (cm−1 /λ) | 1265/7.9 | 1290/7.8 | 1305/7.7 | 1338/7.4 | 1322/7.6 |
| ε minimum (cm−1/λ) | 1001/9.9 | 1086/9.2 | 1090/9.2 | 1093/9.1 | 1084/9.2 |
| Measured Glass/Crystals (%) | 20/80 | 64/38 | 64/38 | 76/24 | 100/0 |
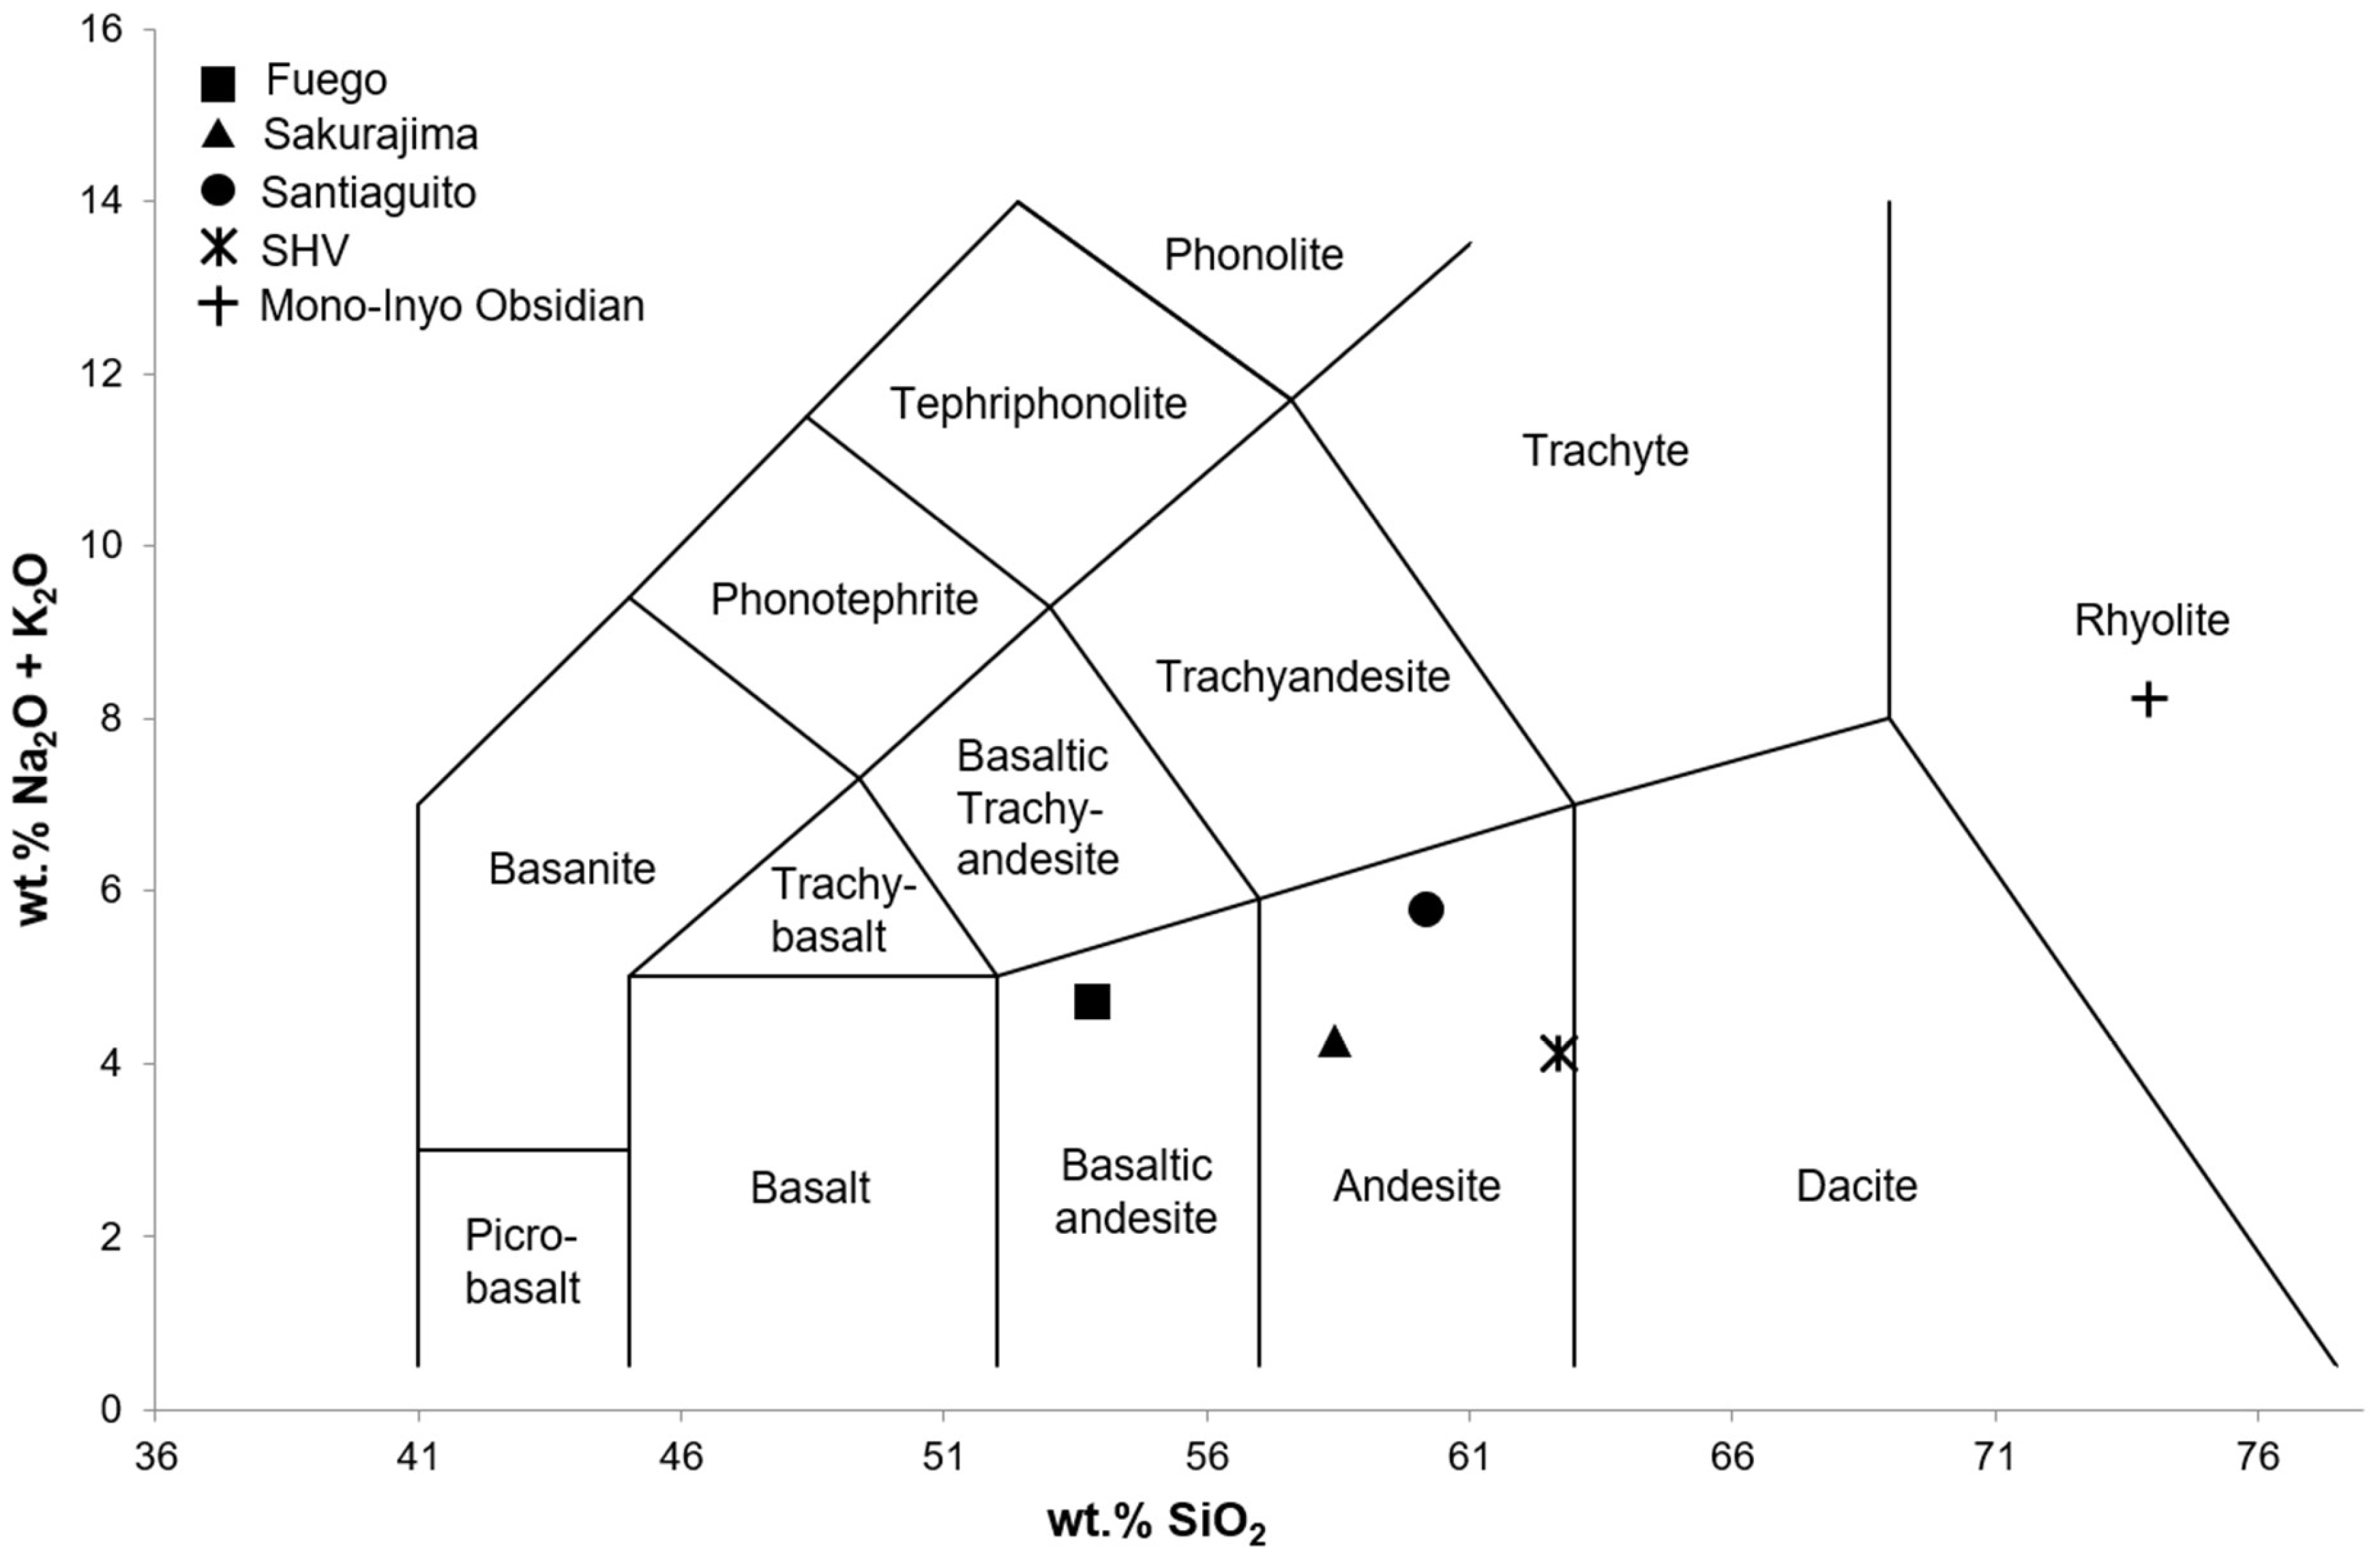
| Wt. % SiO2 | 53.82 | 58.46 | 60.16 | 62.67 | 73.92 |
© 2019 by the authors. Licensee MDPI, Basel, Switzerland. This article is an open access article distributed under the terms and conditions of the Creative Commons Attribution (CC BY) license (http://creativecommons.org/licenses/by/4.0/).
Share and Cite
Williams, D.B.; Ramsey, M.S. On the Applicability of Laboratory Thermal Infrared Emissivity Spectra for Deconvolving Satellite Data of Opaque Volcanic Ash Plumes. Remote Sens. 2019, 11, 2318. https://0-doi-org.brum.beds.ac.uk/10.3390/rs11192318
Williams DB, Ramsey MS. On the Applicability of Laboratory Thermal Infrared Emissivity Spectra for Deconvolving Satellite Data of Opaque Volcanic Ash Plumes. Remote Sensing. 2019; 11(19):2318. https://0-doi-org.brum.beds.ac.uk/10.3390/rs11192318
Chicago/Turabian StyleWilliams, Daniel B., and Michael S. Ramsey. 2019. "On the Applicability of Laboratory Thermal Infrared Emissivity Spectra for Deconvolving Satellite Data of Opaque Volcanic Ash Plumes" Remote Sensing 11, no. 19: 2318. https://0-doi-org.brum.beds.ac.uk/10.3390/rs11192318