Article

Contribution to Sandy Site Characterization: Spectro-Directional Signature, Grain Size Distribution and Mineralogy Extracted from Sand Samples

1
ONERA DOTA Université de Toulouse, F-31055 Toulouse, France
2
NOVELTIS 153 Rue du Lac, 31670 Labège, France
3
ESA Keplerlaan 1, PB 299, NL-2200 AG Noordwijk, The Netherlands
4
KAUST, Red Sea Research Center (RSRC), Biological and Environmental Sciences & Engineering Division (BESE), Bioscience program, Thuwal 23955-6900, Saudi Arabia
5
KAUST, Visual Computing Center (VCC), Computer, Electrical and Mathematical Sciences & Engineering Division (CEMCE), Thuwal 23955-6900, Saudi Arabia
*
Author to whom correspondence should be addressed.
Remote Sens. 2019, 11(20), 2446; https://0-doi-org.brum.beds.ac.uk/10.3390/rs11202446
Submission received: 30 September 2019 / Revised: 14 October 2019 / Accepted: 15 October 2019 / Published: 21 October 2019
(This article belongs to the Section Engineering Remote Sensing)

Abstract

:
The characterization of sands detailed in this paper has been performed in order to support the in-flight radiometric performance assessment of space-borne optical sensors over the so-called Pseudo-Invariant Calibration Sites (PICS). Although the physical properties of PICS surface are fairly stable in time, the signal measured from space varies with the illumination and the viewing geometries. Thus, there is a need to characterize the spectro-directional properties of PICS. This could be done on a broad scale, thanks to multi-spectral multi-directional space-borne sensors such as the POLDER instrument (with old data). However, interpolating or extrapolating the spectro-directional reflectance measured from space to spectral bands of another sensor is not straightforward. The hyperspectral characterization of sand samples collected within or nearby PICS could contribute to a solution. In this context, a set of 31 sand samples was compiled. The BiConical Reflectance Factor (BCRF), linked to Bidirectional Reflectance Distribution Function (BRDF), was measured between 0.4 and 2.5 µm, over a half hemisphere when the amount of sand in the sample was large enough and for only a single fixed angular configuration for small samples. These optical measurements were complemented by grain size distribution measurements and mineralogical analysis and compiled together with previously published measurements in the so-called PICSAND database, freely available online.

Graphical Abstract

1. Introduction

Some sandy desert sites known for their temporal stability and their spatial uniformity have been used for a long time to radiometrically calibrate and monitor optical space-borne sensors [1]. Thus, the better the knowledge about these sites, the better the calibration and the monitoring.
Regular acquisitions over these sites also referred to as Pseudo-Invariant Calibration Sites (PICS) provide time series as well as opportunities of cross-comparison between sensors.
Although it is believed that the physical properties of their surface are fairly stable in time, the signal measured from space still varies with the illumination and the viewing geometries. Thus, there is a need to characterize the spectro-directional properties of PICS in order to remove the directional effects from the measured radiometric signal. The characterization of PICS directional signature could be achieved, at a kilometric scale, and in narrow spectral bands thanks to multi-spectral multi-directional space-borne sensors such as the POLDER (POLarization and Directionality of Earth Reflectances) instrument [2] (with old data). This characterization enables, in the first instance, to compare calibration sites in terms of the magnitude of directional effects, considering that the lower, the better for instrument drift assessment [3]. However, the interpolation/extrapolation of the directional properties found at a limited number of spectral bands (e.g., for POLDER: 490, 565, 670, 765, 865, 1020 nm) to other spectral channels is not straight forward and can be achieved only through hyperspectral sensor measurements or modeling assumptions on the atmosphere and surface optical properties (e.g., [4]).
Even when similar illumination and viewing geometries are selected for cross-comparison between sensors, the spectral response differences between sensors induce differences in radiometric measurements that should be distinguished from radiometric calibration differences [5]. The upcoming generation of hyperspectral space-borne sensors will probably alleviate this issue.
As access to most PICS for the large-scale optical characterization of their surface remains difficult even to airborne instruments, the hyperspectral characterization in the reflective range (0.4–2.5µm) of a limited number of sand samples collected at the PICS can provide an alternative means to understand and model the large scale optical behavior of the selected site [6].
In this context, the hyperspectral directional signatures of a set of sand samples were measured over the 350–2500 nm spectral range, and over the nearly full half of the hemisphere, several of these samples coming from identified areas near or inside PICS. The measurements of the BiConical Reflectance Factor (BCRF), linked to the Bidirectional Reflectance Distribution Function (BRDF) as explained in Section 2, were performed in the laboratory with “Banc de BRDF Grands Echantillons” (BBGE) for 16 samples having a sufficient amount of sand. The representativeness of a few BRDF models for our laboratory measurements was investigated. For 15 smaller samples, we measured their hyperspectral BCRF at a single viewing and illumination geometry. The characterization of the optical properties of the sand samples was completed by the determination of their mineralogical composition and grain size distribution. A database including the sand optical properties measured from these sand samples, as well as other measurements of sand spectro-directional properties available in the literature, was built and made available to the scientific community. The dataset can be downloaded from the dedicated web portal https://picsand.noveltis.fr.
The next section defines the measured optical quantities. The third section deals with the material, including a description of the selected sites, the collected sand samples and the laboratory devices used for the measurements. The fourth section describes the methods for BCRF measurements, mineralogy determination, and grain size distribution assessment. The fifth section presents the results and illustrates them with the case of an Arabian sand sample. This section also presents the parametric BRDF models to fit the laboratory measurements. It ends with the description of the PICSAND database. A discussion of the results is provided in section six before the conclusion.

2. Definition and Nomenclature of the Measured Physical Quantities

The relevant optical property for remote sensing optical sensors is reflectance. It is defined by the ratio of the radiation reaching the sensor looking at a target to the incident radiation on the target. In order to mathematically describe the optical signal propagation from the ground surface to the sensor entrance lens, other definitions, such as stated in Nicodemus et al. [7], need to be introduced. Indeed, for the characterization of the surface optical properties using space-borne measurements, the relevant quantities are the directional-directional reflectance factor and the hemispherical-directional reflectance factor (ρdd and ρhd of Table 1).
In the laboratory, the measured quantity is the bi-conical Reflectance Factor (BCRF) corresponding to the conical-conical case (ρcc) of Table 1.
BCRF is, by definition, the ratio of the reflected flux to the flux that would be reflected by an ideal perfectly diffuse standard surface illuminated by a collimated source. For small conical angles (which is the case for the measurement devices used in this study) and for smooth directional variations of the Bidirectional Reflectance Factor (BRF), which is the case for sand, the BCRF is a good approximation of the BRF.
As BRF (unitless) is just equal to BRDF (sr−1) multiplied by π, for the measurements made, we consider that:
BCRF ≈ BRF = π · BRDF

3. Materials

As this work was motivated by contributing to PICS characterization most commonly used, the priority was given to sand samples from the six PICS endorsed by the Comity of Earth Observation Satellites (CEOS) (Algeria3, Algeria5, Libya1, Libya4, Mauritania1, and Mauritania2) and then to the other PICS defined by Cosnefroy et al. in 1998 [1] and new ones proposed by Bacour et al. in 2019 (Arabia_PICSAND1 and Namibia_PICSAND1, PICSAND being the name of the database presented in Section 5.5) [3]. Collecting sand samples from these sites has been a challenging task. Indeed, most of the sites are located in remote places with difficult access from a logistic point of view. Moreover, geopolitical contexts (as in Libya or Mauritania) enhance the accessibility issue. Therefore, samples were collected for only a few of these PICS.
Two Algerian samples were collected by Hélène Cosnefroy in 1993 and archived at ONERA (Office National d’Etudes et de Recherches Aérospatiales), one is very close to Algeria3, and the other comes from Algeria4. Professor Charles Bristow from Birkbeck University of London (UK) kindly provided three samples (SPL) from Algeria5.
A campaign was organized by Malika Kheireddine, Mustapha Ouhssain, and Ramzi Idoughi, working at the King Abdullah University of Science and Technology (KAUST) in order to collect samples from Arabia_PICSAND1. Six sand samples were collected in December 2017.
Although we could not obtain sand samples from the region identified in Namibia [3], Laurent Poutier from ONERA was able to collect a sand sample from a dune close to Gobabeb, which is approximately located 160 km north to the site (collection performed in July 2017).
Moreover, a number of sand samples were kindly provided by several investigators. The list of sand samples that were characterized in this study, is presented in Table 2. These samples originate from other areas of potential interest for Calibration/Validation (Cal/Val) activities: five samples from Namibia [9,10] and among them one coming from the RADiometric CALibration NETwork of automated instruments (RadCalNet) [11], six samples from the Pinnacles desert in Australia [12], two samples of bays in Australia which are used as Standard for laboratory measurements [13], two samples from Libya, one sample from Morocco, one sample from Niger, and two samples from well-known Cal/Val sites from United States of America [14,15].

4. Methods

The methods depend on the sample and on the kind of measurement.

4.1. BCRF Measurement

Two devices were used depending on the amount of sand available. They cover the 0.35–2.5 µm spectral range with a spectral resolution of 3 nm in the visible to near-infrared (VNIR: 0.35–1 µm) and 10 nm in the shortwave infrared (SWIR: 1–2.5 µm) spectral ranges thanks to an ASD Fieldspec spectroradiometer. For samples heavier than 600 g, the “Banc de BRDF grands échantillons” (BBGE) device, shown in Figure 1a, was used. The zenith angles of the source (SZA) and of the spectrometer collection optics (VZA) can vary between 0° and 60° with an accuracy of 1°. The azimuthal angle of the spectrometer collection optics (VAA) could vary between 0° and 180° with an accuracy of 1°. Thus, the set-up enables to record a spectral radiance for a sequence of angular configurations over nearly a full quarter of a sphere. However, due to the occultation of the source by the collection optics, measurements were not possible in the backscattering direction ±10°.
For BCRF assessment, the set up enables us to measure the radiance for the sample for various illumination and observation angles. Just before and just after, the sample is replaced by a reference panel (Spectralon©), and the corresponding radiance is measured for one angular configuration.
With this experimental set-up configuration, the source remaining the same and just moving along the device arm, the bi-conical reflectance factor of a sample, noted B C R F s , could be expressed as follows:
B C R F s ( S Z A , V Z A , V A A , λ , t ) = L s ( S Z A , V Z A , V A A , λ , t ) L r e f ( S Z A 0 , V Z A 0 , V A A 0 , λ , t 0 ) × c o s ( S Z A ) c o s ( S Z A 0 ) × B C R F r e f ( S Z A 0 , V Z A 0 , V A A 0 , λ ) × L ( S Z A 0 , V Z A 0 ,   V A A 0 ,   λ , t 0 ) L ( S Z A 0 , V Z A 0 ,   V A A 0 ,   λ , t )
where
  • SZA is the Source Zenith Angle,
  • VZA is the View Zenith Angle,
  • VAA is the View Azimuthal Angle,
  • λ is the wavelength,
  • t is the measurement time,
  • Ls is the measured radiance for the sample,
  • Lref is the measured radiance for the reference panel,
  • BCRFref is the BCRF of the reference panel,
  • SZA0, VZA0 and VAA0 are the chosen angles for the radiance measurement of the reference panel,
  • t0 is the reference panel measurement time.
The various steps of the measurement protocol are listed hereafter:
  • Put the samples in the laboratory the day before the measurements and open the boxes or bags,
  • Put the sand in the plate and level it when switching the device on,
  • Switch the temperature and humidity monitoring on,
  • Warm up during 1 hour,
  • Perform radiance measurement with the reference panel (SZA = 40 to 50°, step = 5°; VZA = 0°; VAA = 0° and 180°),
  • Perform radiance measurement with the sand sample (SZA = 10 to 60°, step = 10°; VZA = 0° to 50°, step = 10°; VAA = 0° to 180°, step = 20°),
  • Rotate the sample plate of 90° and perform a new radiance measurement,
  • Rotate the sample plate of another 90° and perform another new radiance measurement,
  • Perform another measurement with the reference panel (SZA = 40 to 50°, step = 5°; VZA = 0°; VAA = 0° and 180°),
  • Switch all off,
  • Collect between 9 and 35 g of the center sand surface for physical analysis.
Measurements are repeated for three positions of the sample: initial (pos0), after a rotation of 90° (pos90) and after the second rotation of 90° leading to a 180° rotation (pos180) in order to assess the reproducibility of the directional measurements for a given sample.
For the smaller samples, a BCRF measurement was performed for only one angular configuration (illumination and view zenith angles of respectively 12° and 35°) using the ASD Fieldspec contact probe. It is an ASD spectroradiometer device that enables us to measure a bi-conical radiance for small samples (with a diameter at least equal to the contact probe (3 cm) and depth of about 1 cm, which corresponds to about 50 g of sand). Figure 1b shows the experiment: the sample is put on a horizontal table with up and down translation to ensure good contact between the probe and the sample.
An uncertainty budget has been established. The various contributors to this budget are not correlated, but there might be a correlation for the same contributor for two measurements. For instance, the uncertainties on Ls and Lref due to spectrometer accuracy might be partially correlated. As this information is not available, we will consider that they are independent, which may lead to overestimating the global uncertainty. Thus, the square of the relative uncertainty will be computed as the sum of the square of relative uncertainty of each term of equation (2):
( u ( R F s ) R F s ) 2 = ( u ( L s ) L s ) 2 + ( u ( L r e f ) L r e f ) 2 + ( u ( B C R F r e f ) B C R F r e f ) 2 + ( u ( L ( t ) / L ( t 0 ) ) L ( t ) / L ( t 0 ) ) 2

4.2. Mineralogy

The French geological survey named BRGM (Bureau de Recherches Géologiques et Minières) has established the mineralogy of the main samples. The fraction of the crystalline phase of the samples has been determined by X-ray diffractometry after reducing a small fraction of each sample into powder. The diffractometer used is a Bruker D8 Advance, and the diagrams were analyzed using the DIFFRAC software. The quantitative analysis was carried out with the SiroQuant V4. Software (using the Rietveld refinement method).

4.3. Grain Size Distribution

The grain size distribution has been measured by GEOPS (GEOsciences Paris Sud), a French research laboratory, using a laser granulometer (Malvern 2000 Hydro-G).

5. Results

5.1. BCRF Spectral Behavior

The spectral behavior of BCRF measured by the BBGE is presented for an intermediate source zenithal angle, 40°, and a nadir viewing.

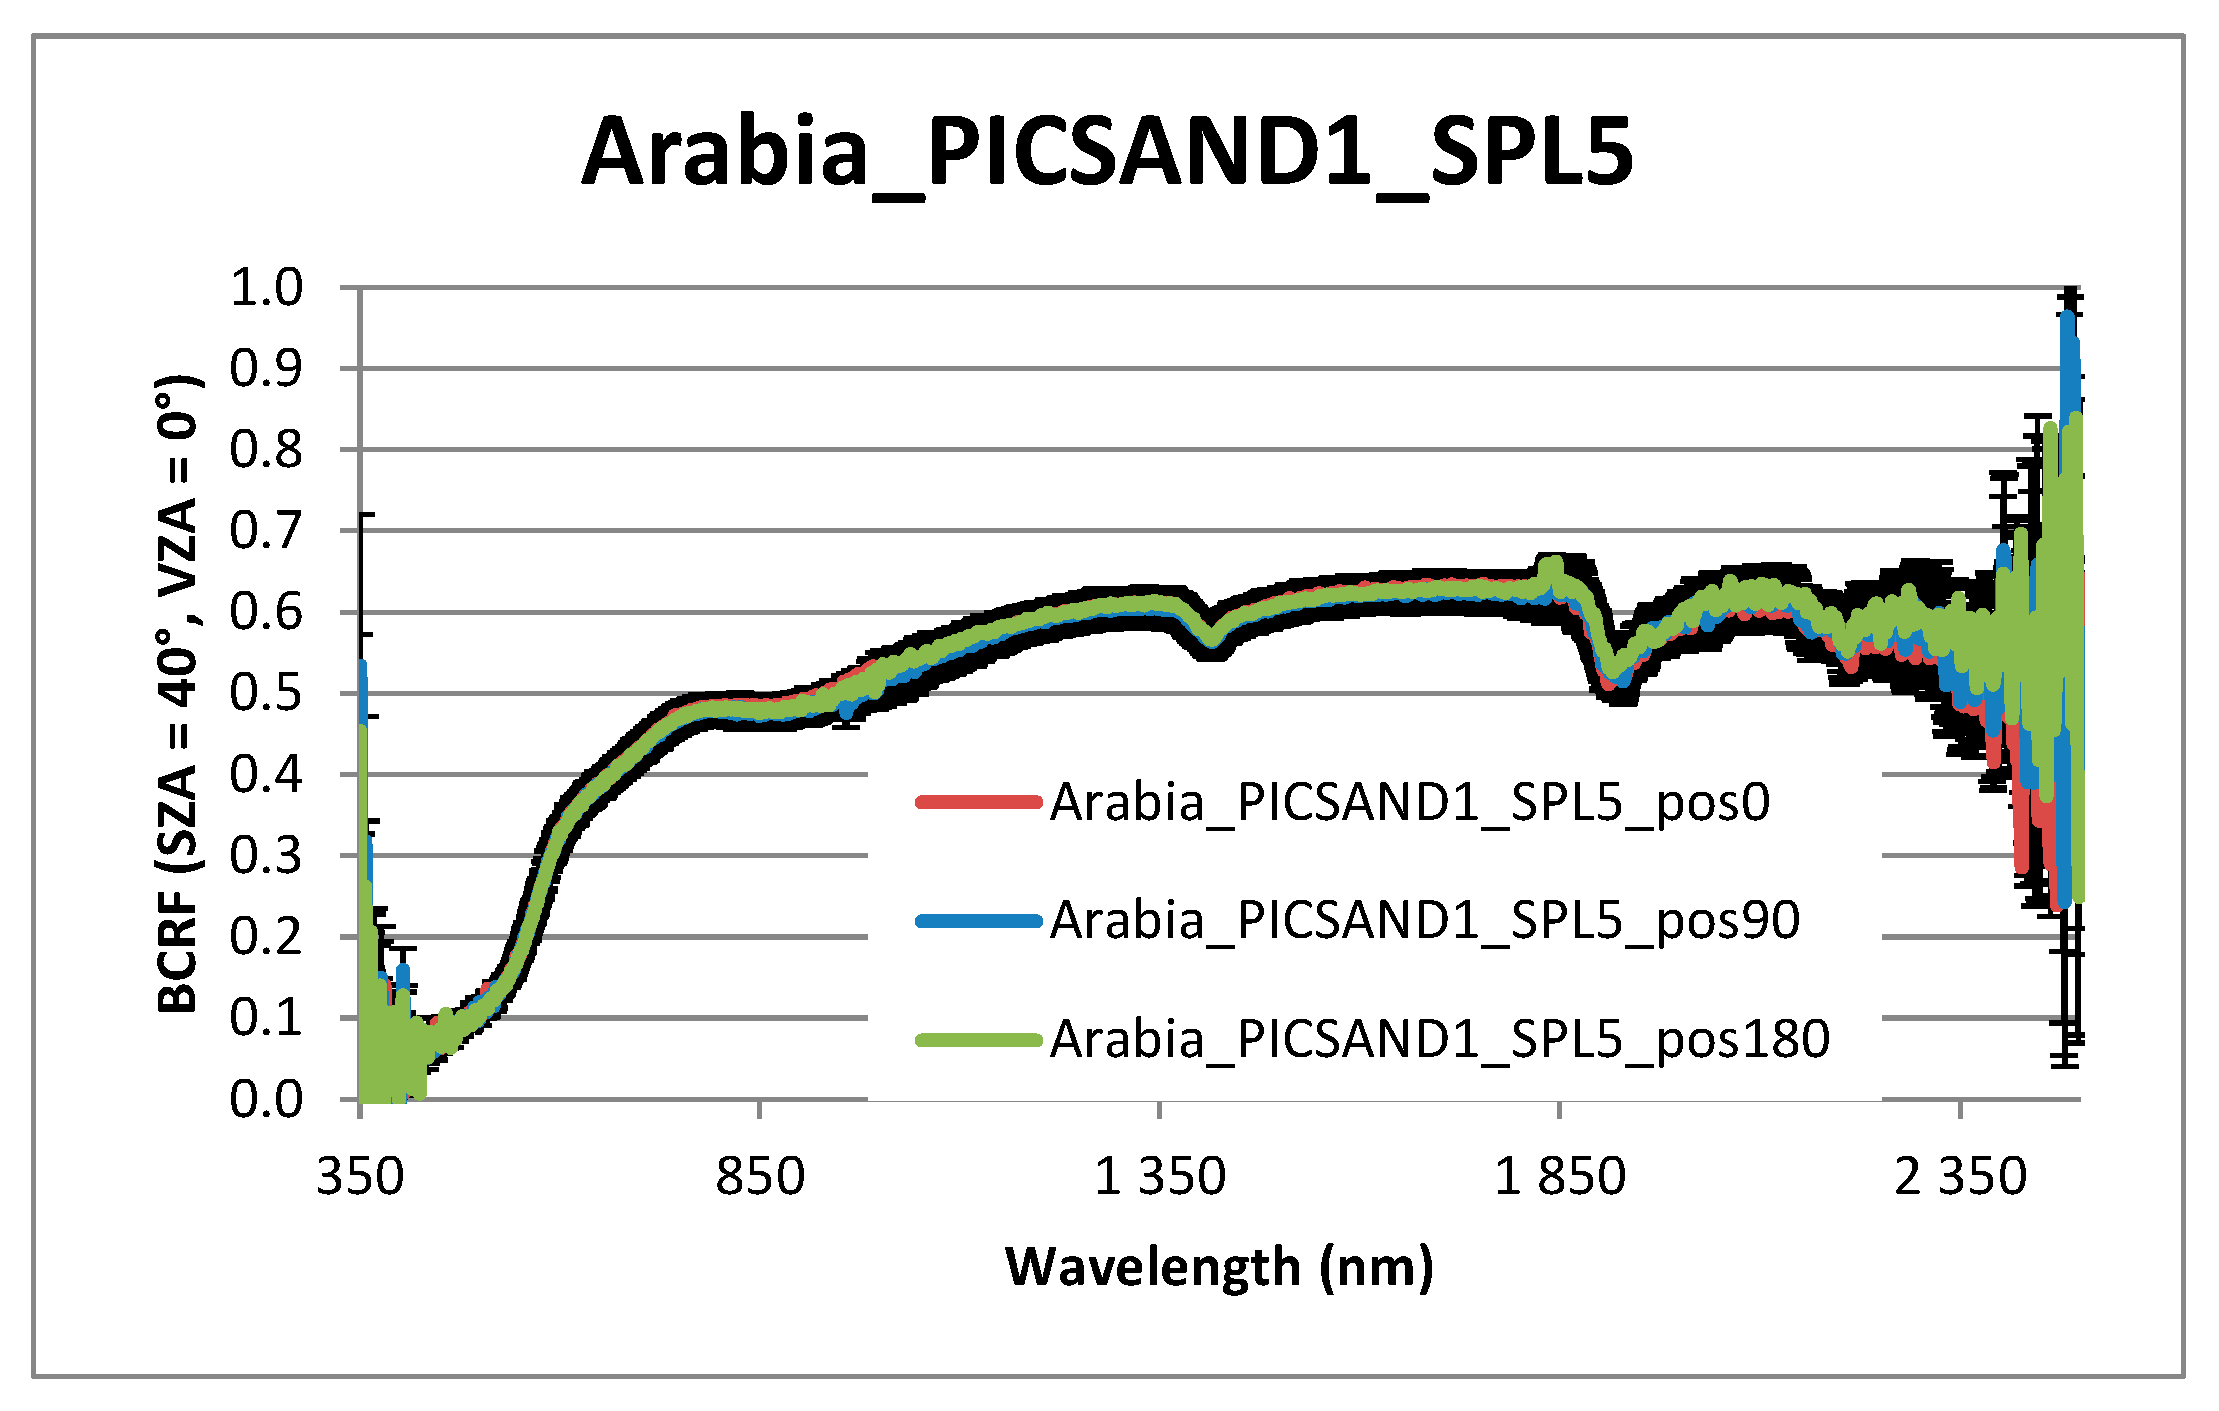
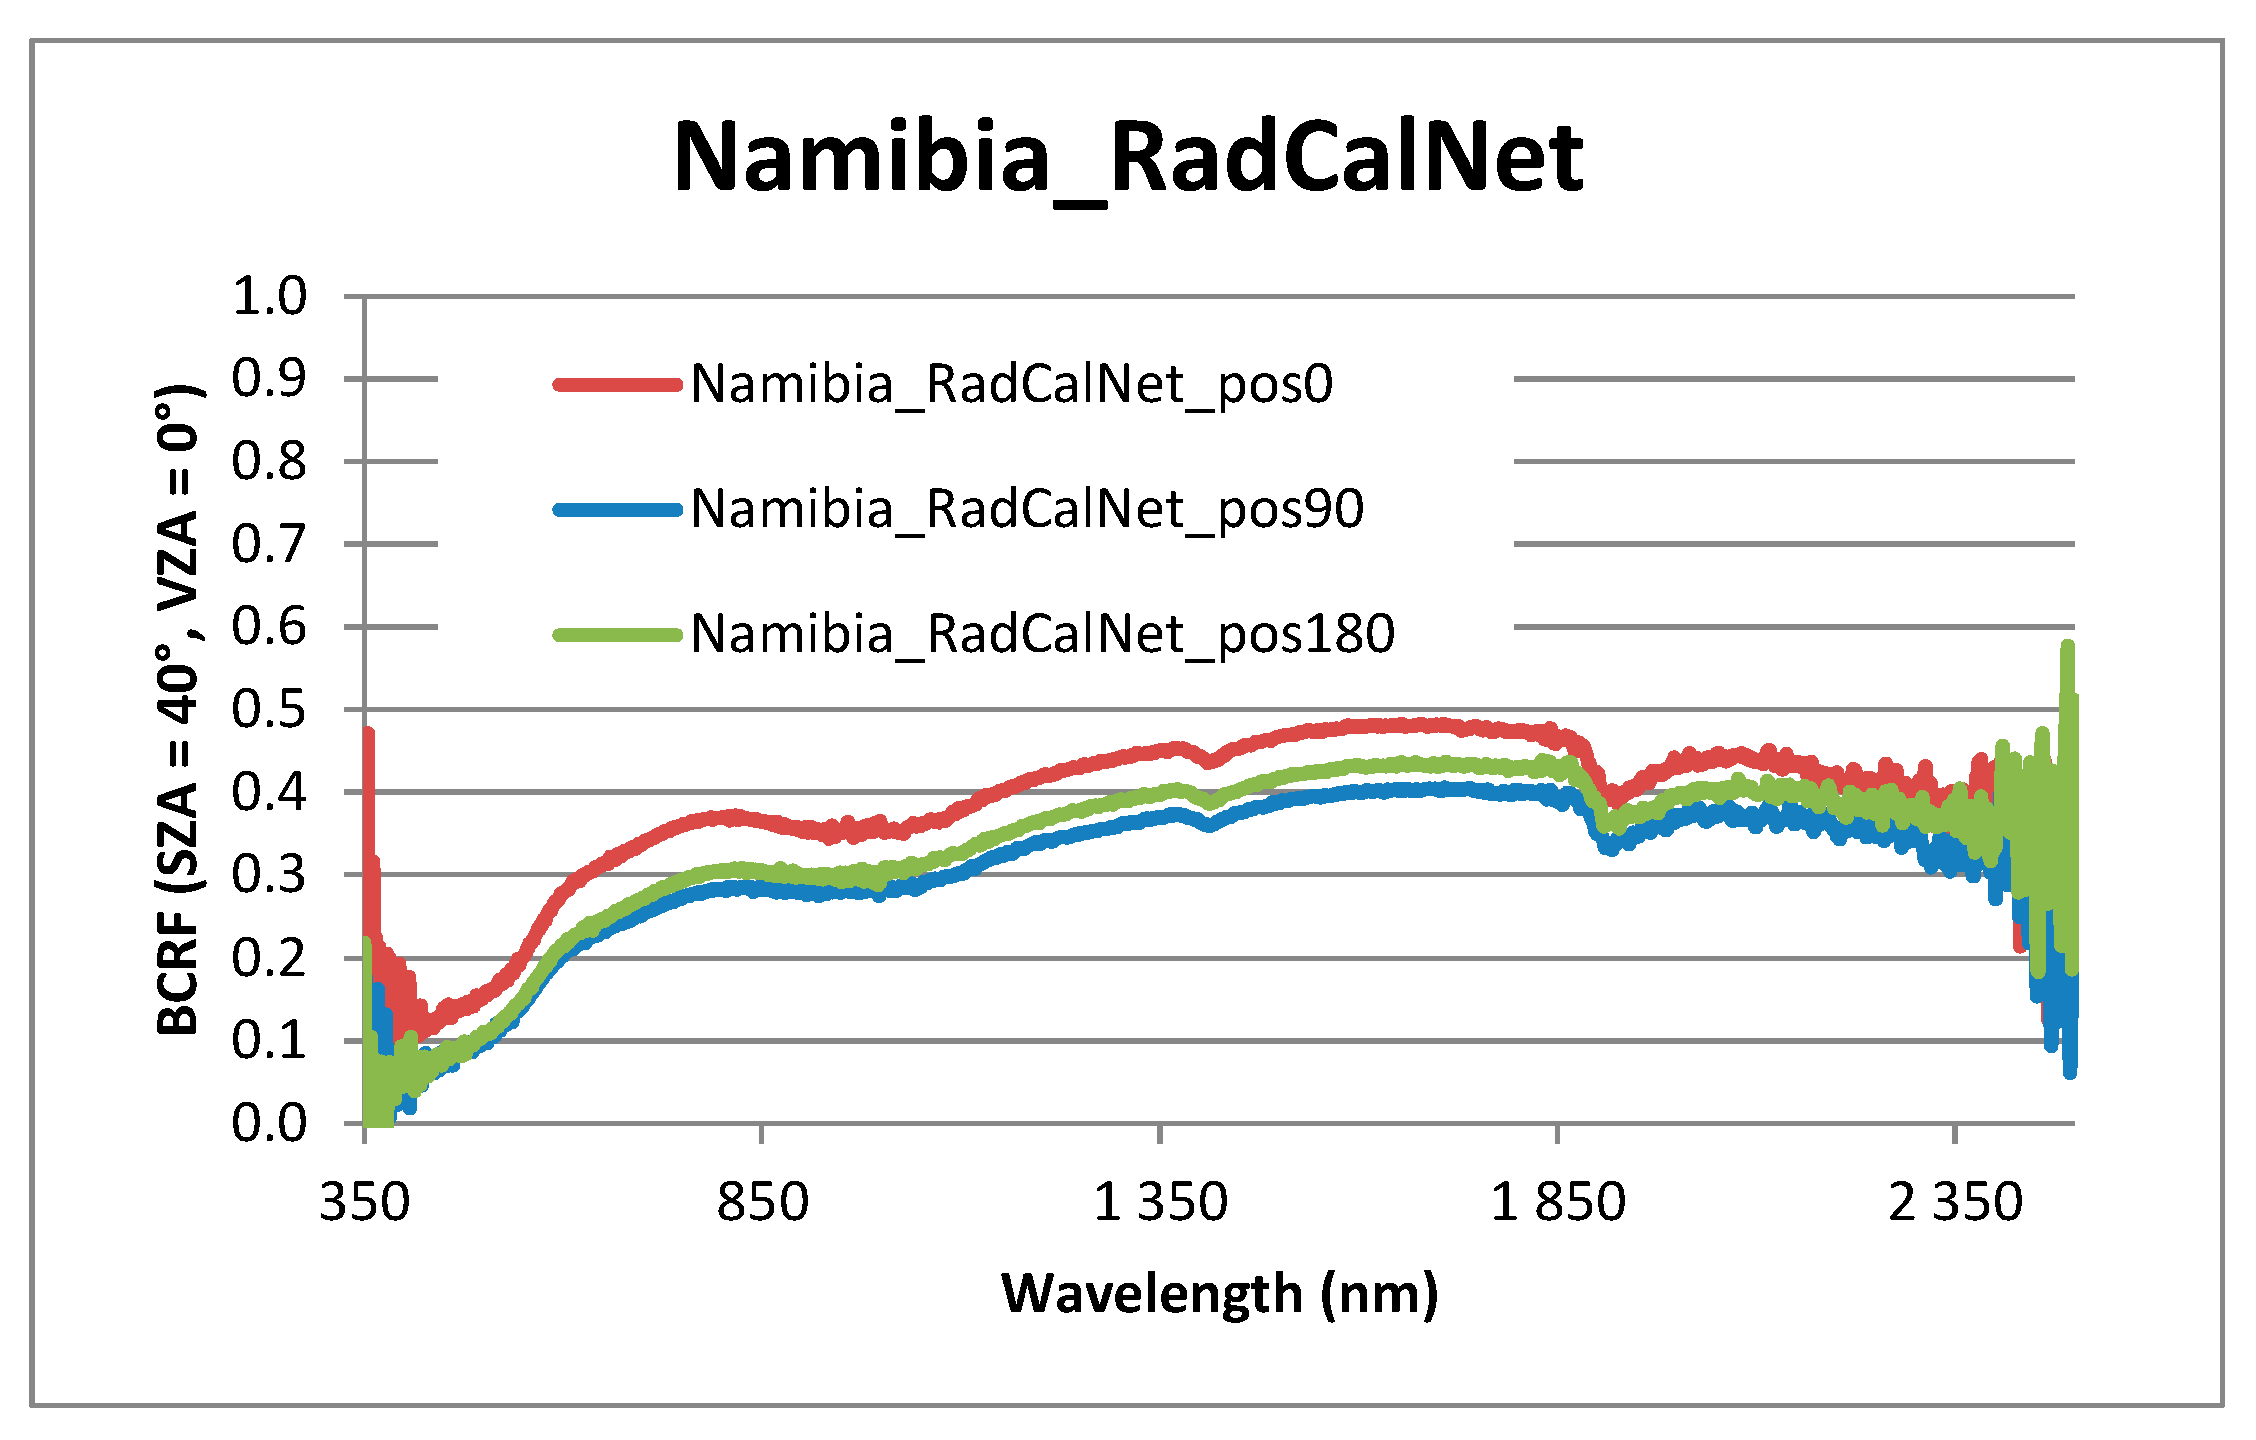
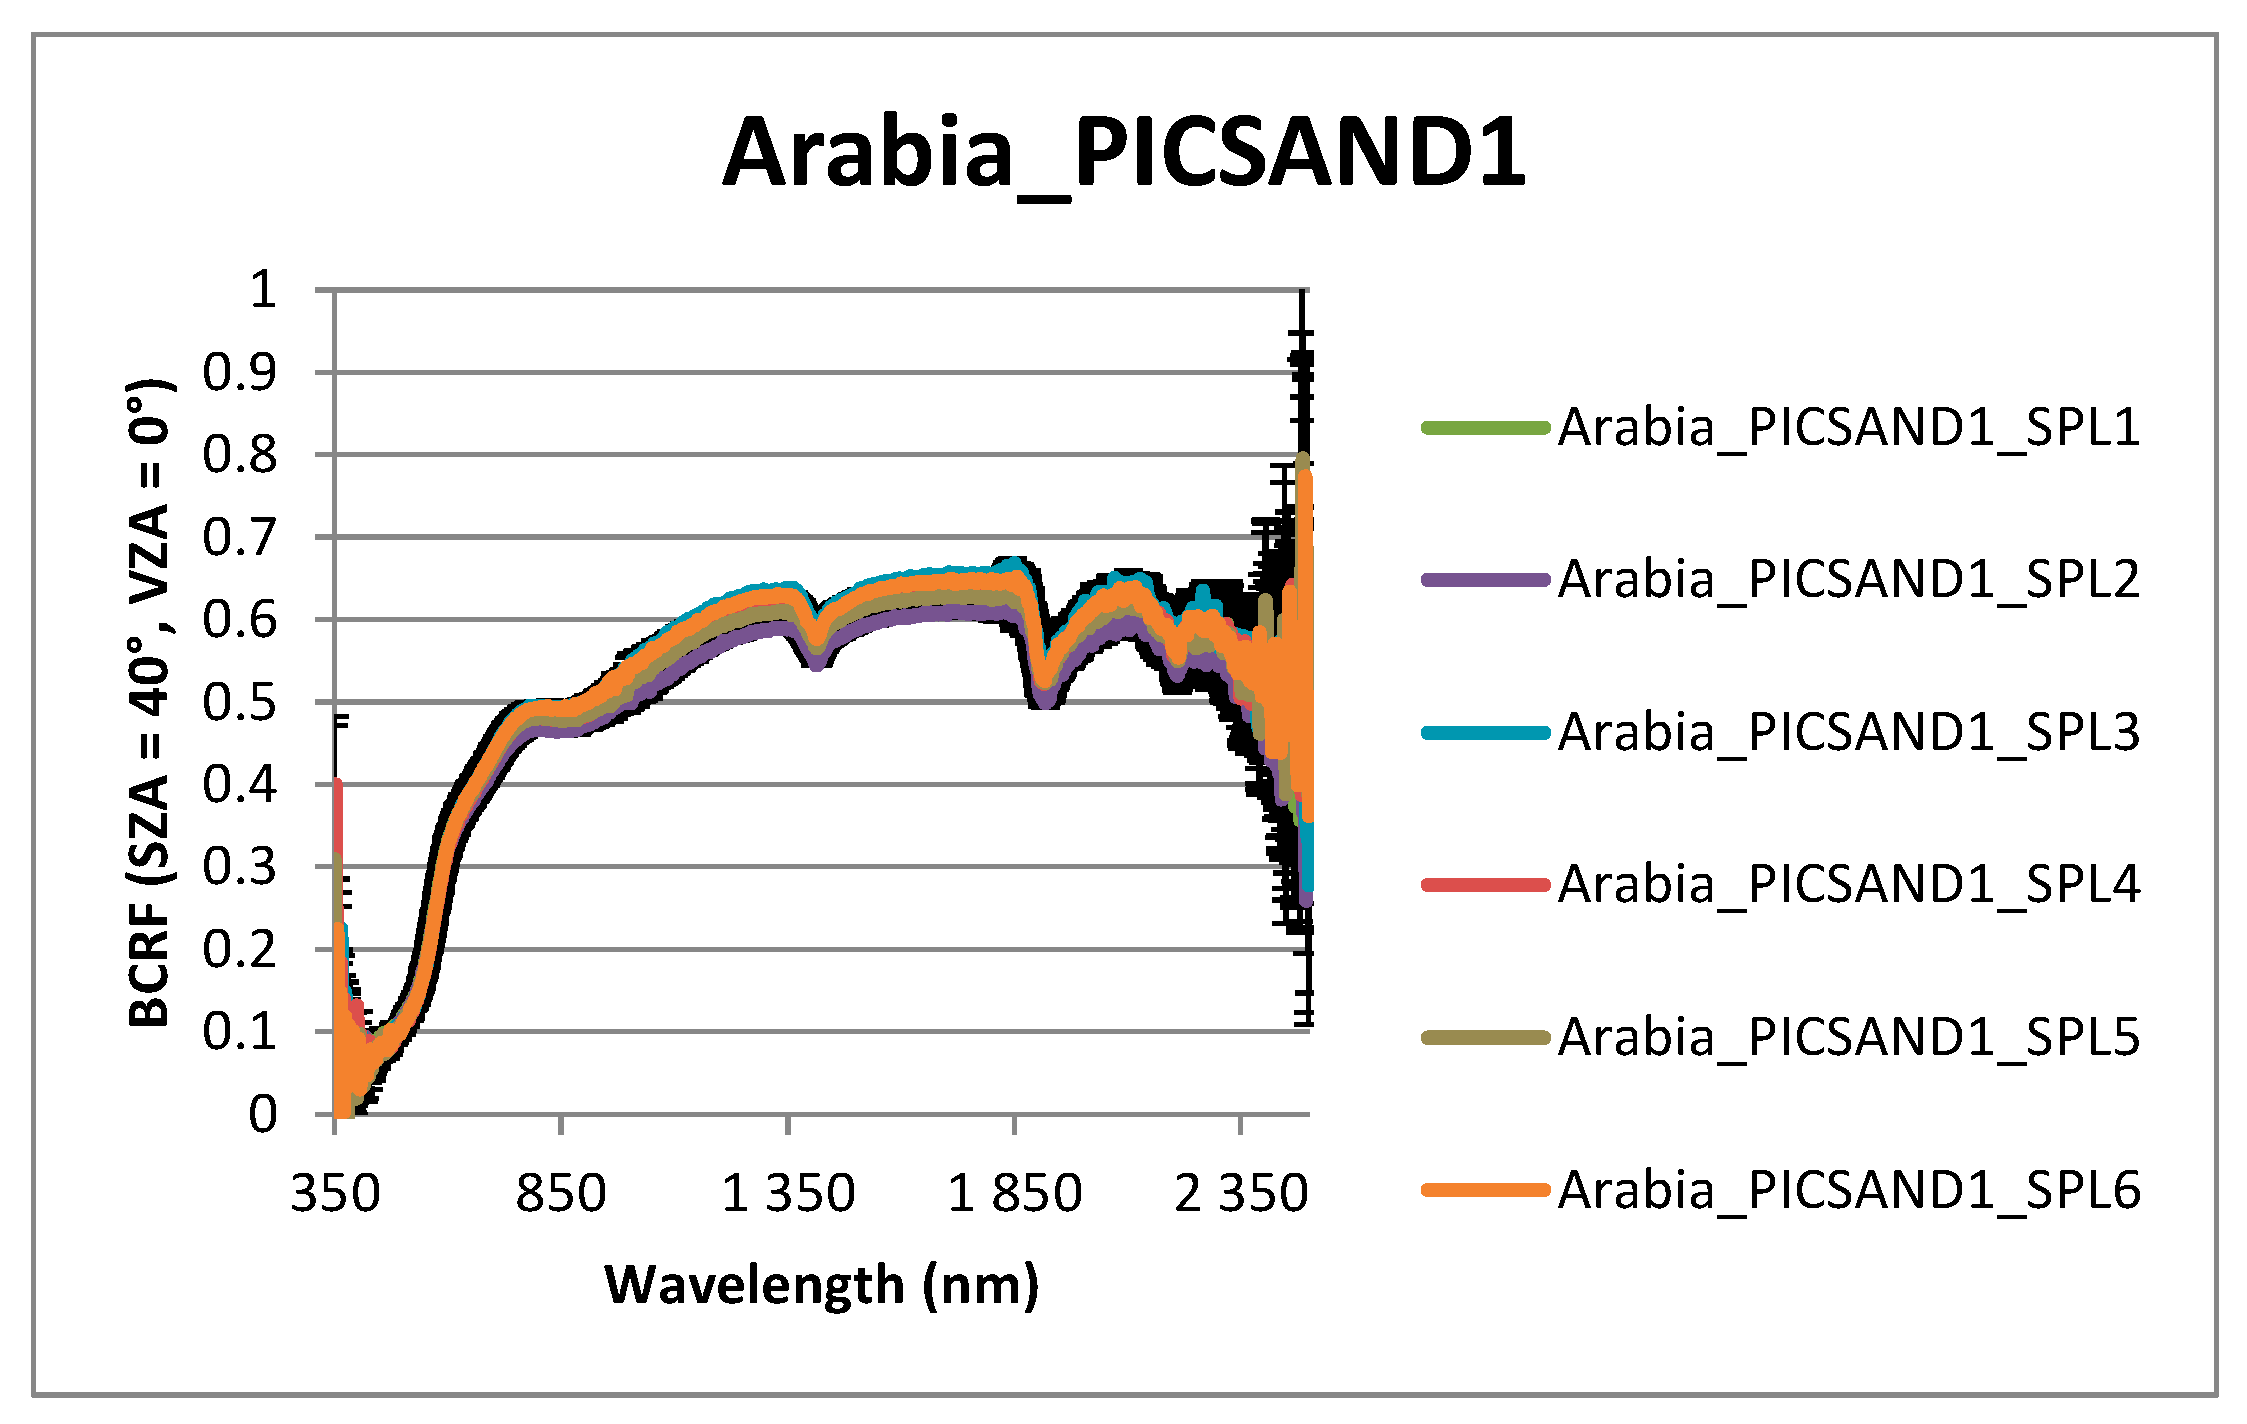
5.1.1. Consistency of the BCRF for the Different Sample Positions

First, the three measurements performed for each sample (depending on the orientation of the sample) are compared. Globally, the estimated BCRF (SZA = 40°, VZA = 0°) remains similar across the three sample positions (0°, 90°, 180°). The only exception concerns the Namibia_RadCalNet sample. Indeed, this sand sample appears more heterogeneous (Figure 2a), with a higher granularity as compared to the other ones (as depicted in Figure 2b for the illustrative sample of the Arabia_PICSAND1_SPL5). The reflectance for the three sample positions over the spectral range 350–2500 nm is given in Figure 3 for the Arabia_PICSAND1_SPL5 sample. Uncertainty bars corresponding to ± standard deviation computed according to equation (3) are added to the BCRF pos0 curve. It shows that the discrepancy between various positions of the sample is below the uncertainty associated with a measurement. The Namibia_RadCalNet sample case is presented in Figure 4.
Due to the weak radiance of the BBGE source between 350 and 450 nm and between 2350 and 2500 nm, the measurements are quite noisy in these spectral ranges. The BCRF uncertainty is about 0.02 between 450 nm and 1000 nm and about 0.025 between 1000 and 1800 nm. The main contributors to the uncertainty are the noise and the ASD Fieldspec spectroradiometer calibration accuracy.

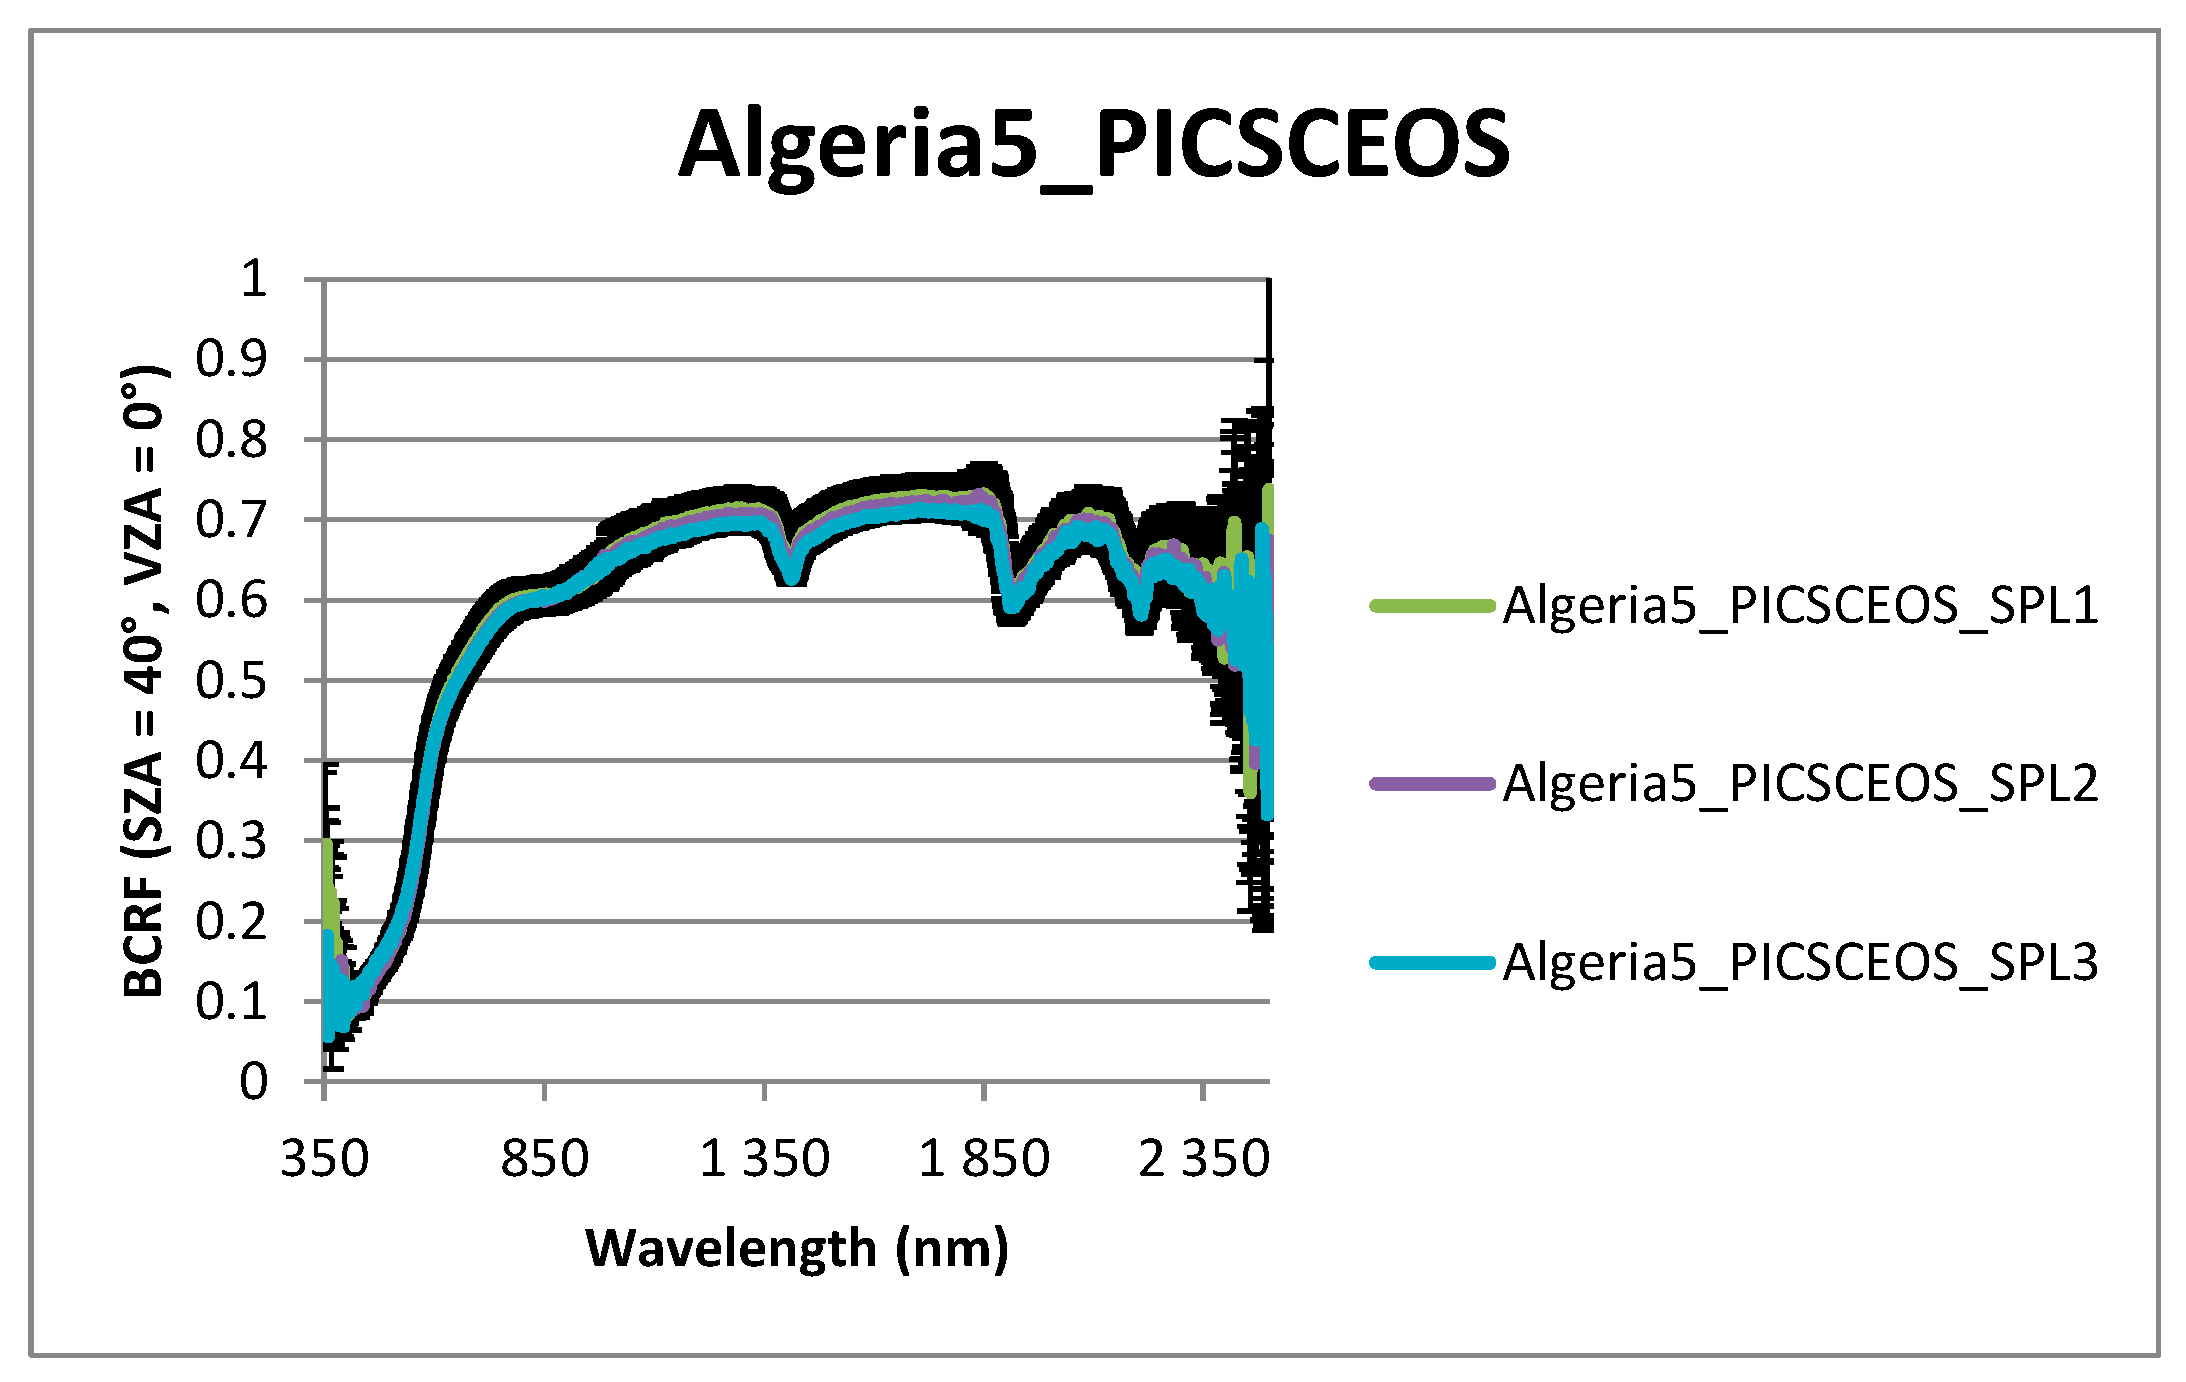
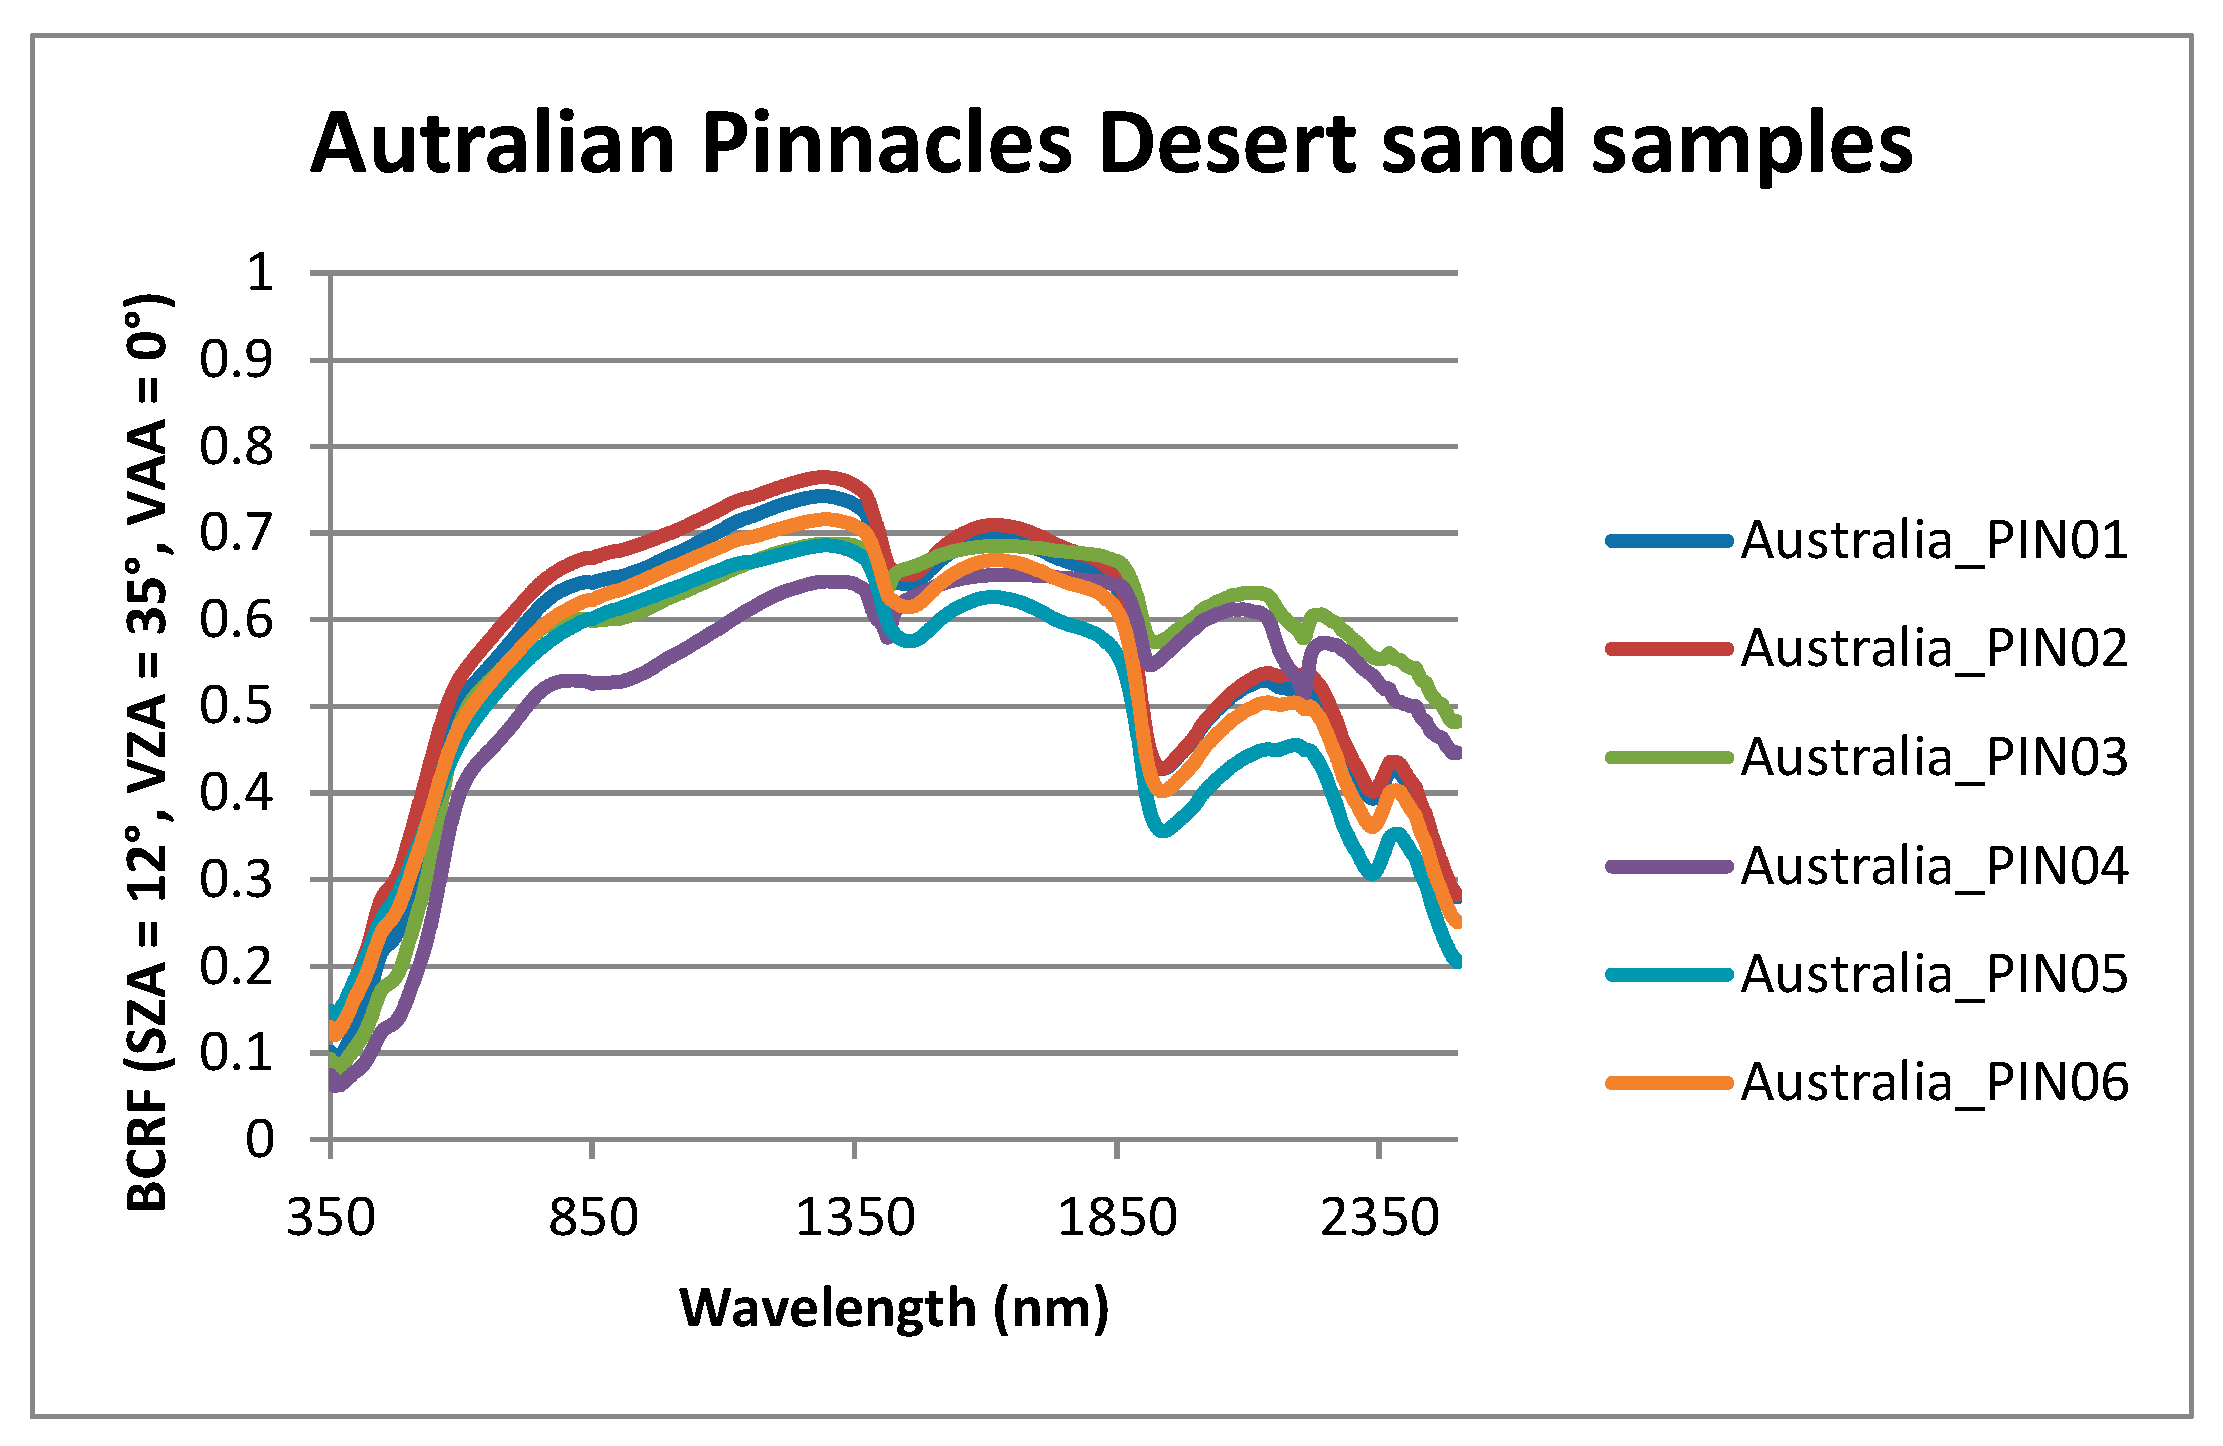
5.1.2. Intra-Site Variability of BCRF

The comparison of the optical properties between the various samples collected at a given site is performed regarding the mean reflectance factor over the measurements performed with the BBGE for the three positions (0°, 90°, and 180°). For the smaller samples, such as the Pinnacles, only one measurement is available and taken into account.
The bi-conical reflectance factors for the various samples collected at Algeria5, Arabia_PICSAND1, and the Pinnacles site are presented in Figure 5, Figure 6 and Figure 7, respectively. It shows that the BCRF discrepancy for the three Algeria5_PICSCEOS samples is below the measurement uncertainty, whereas the discrepancy for the five Arabia_PICSAND1 samples is equivalent or slightly above the uncertainty.
For the Pinnacles desert samples, the discrepancy between samples is higher. This fairly high variability in the spectral signature is in agreement with the clear visual differences observed between the Pinnacles desert samples.

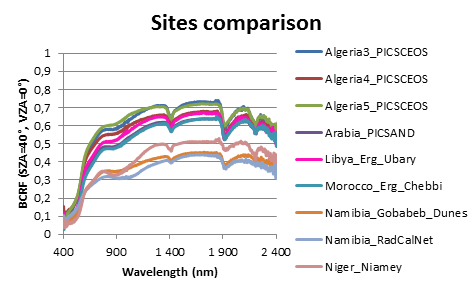
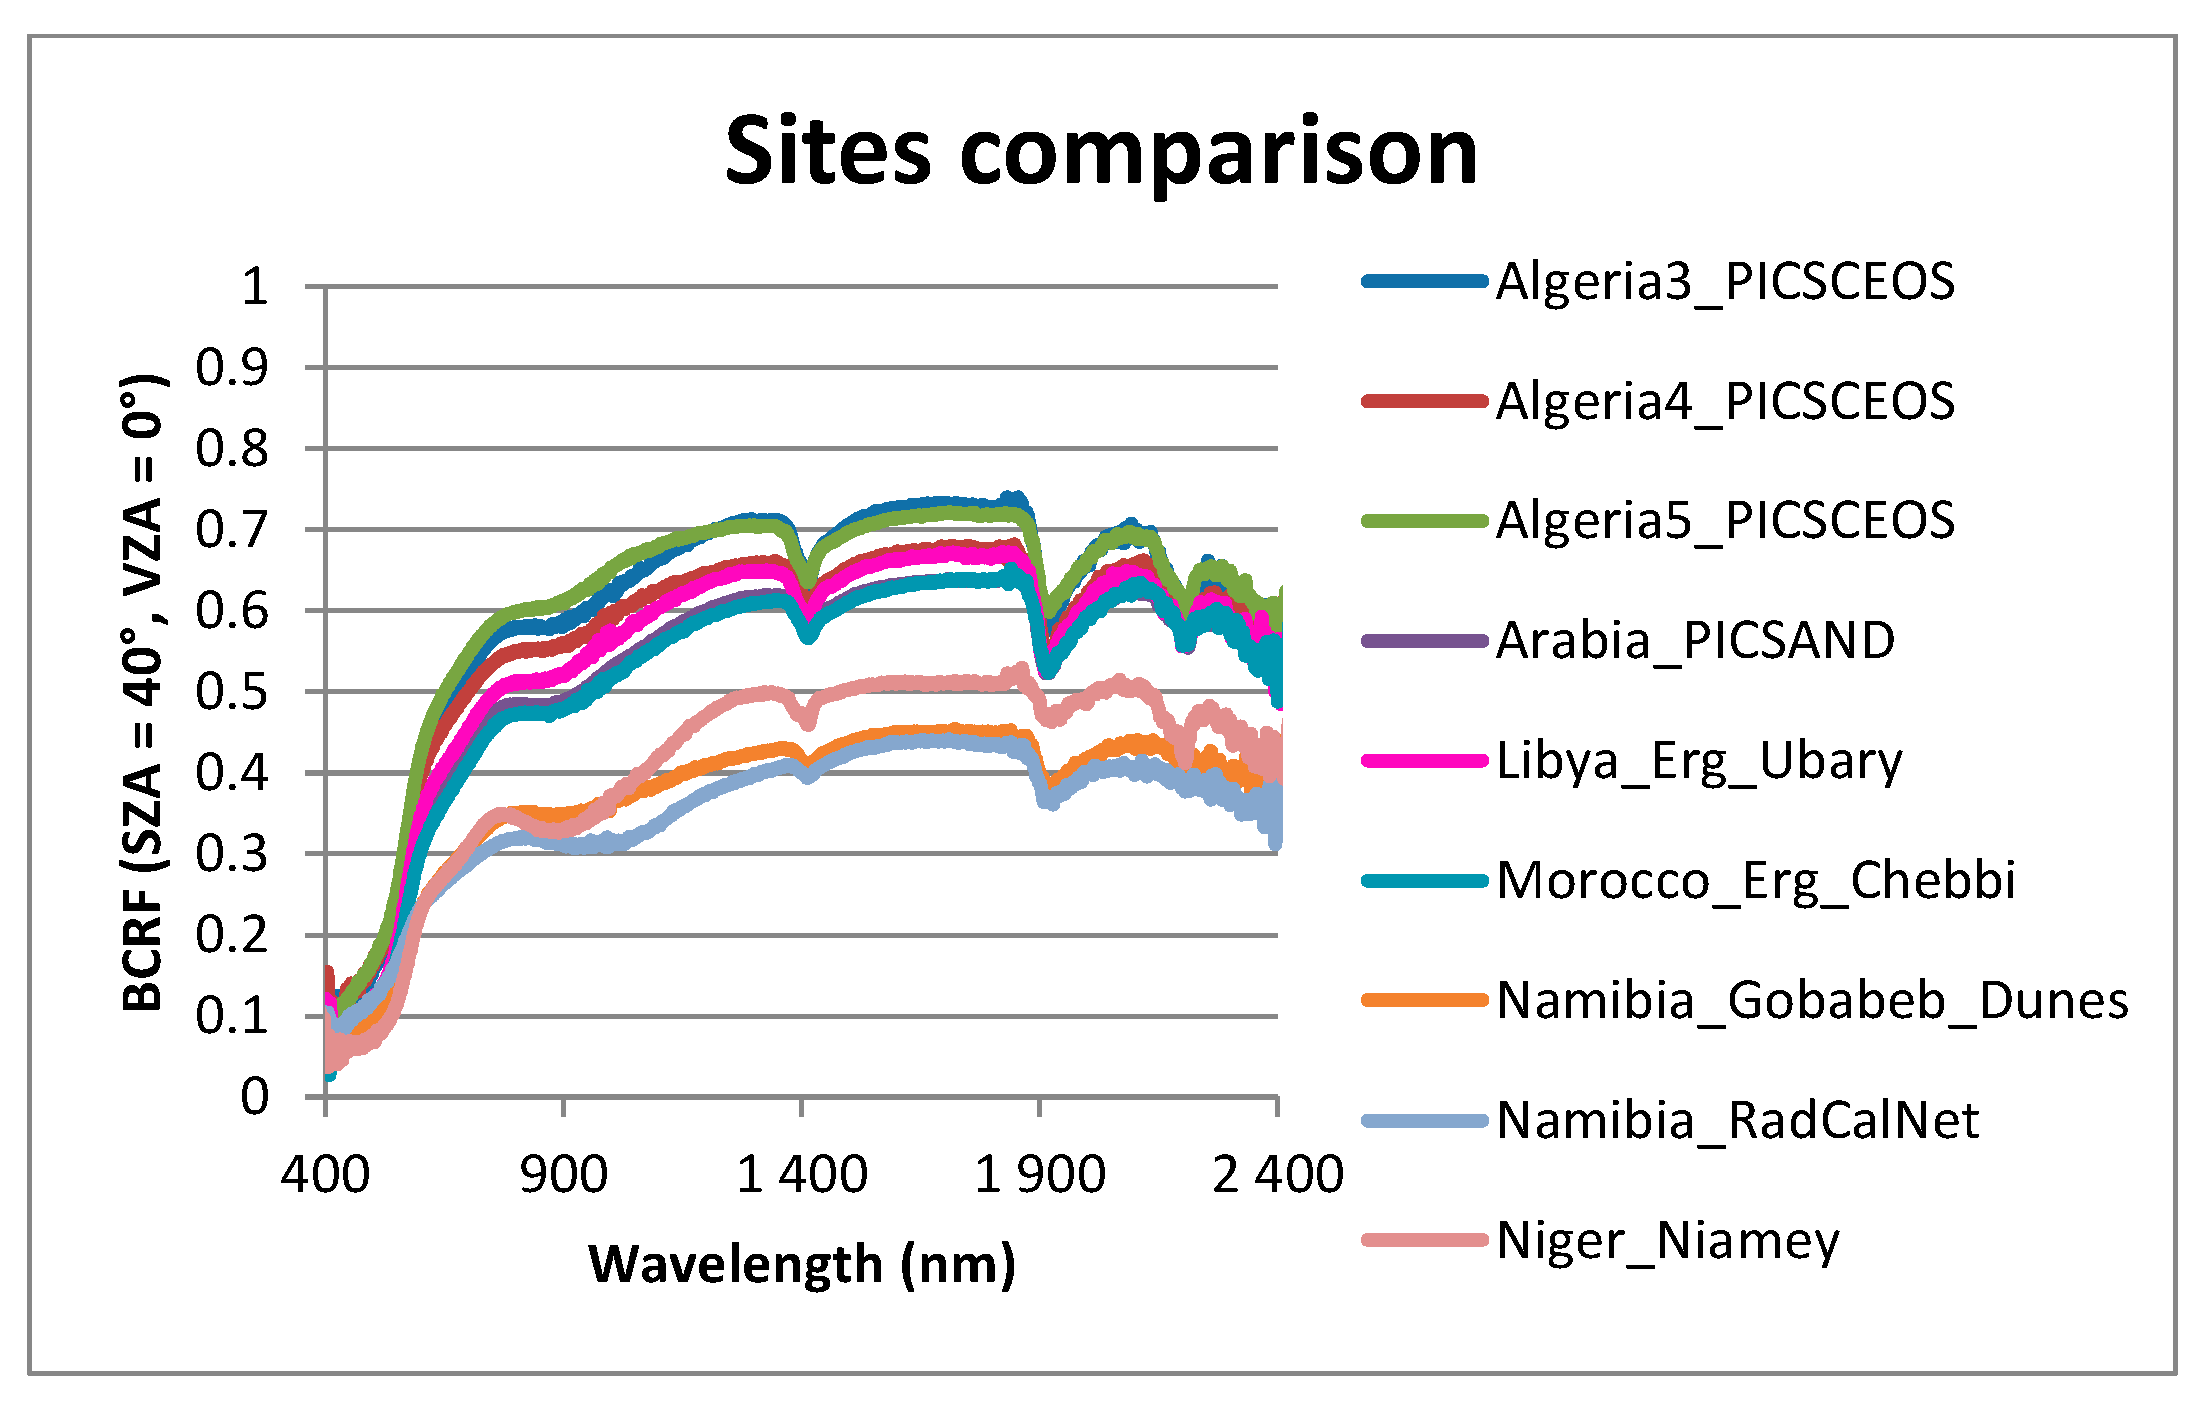
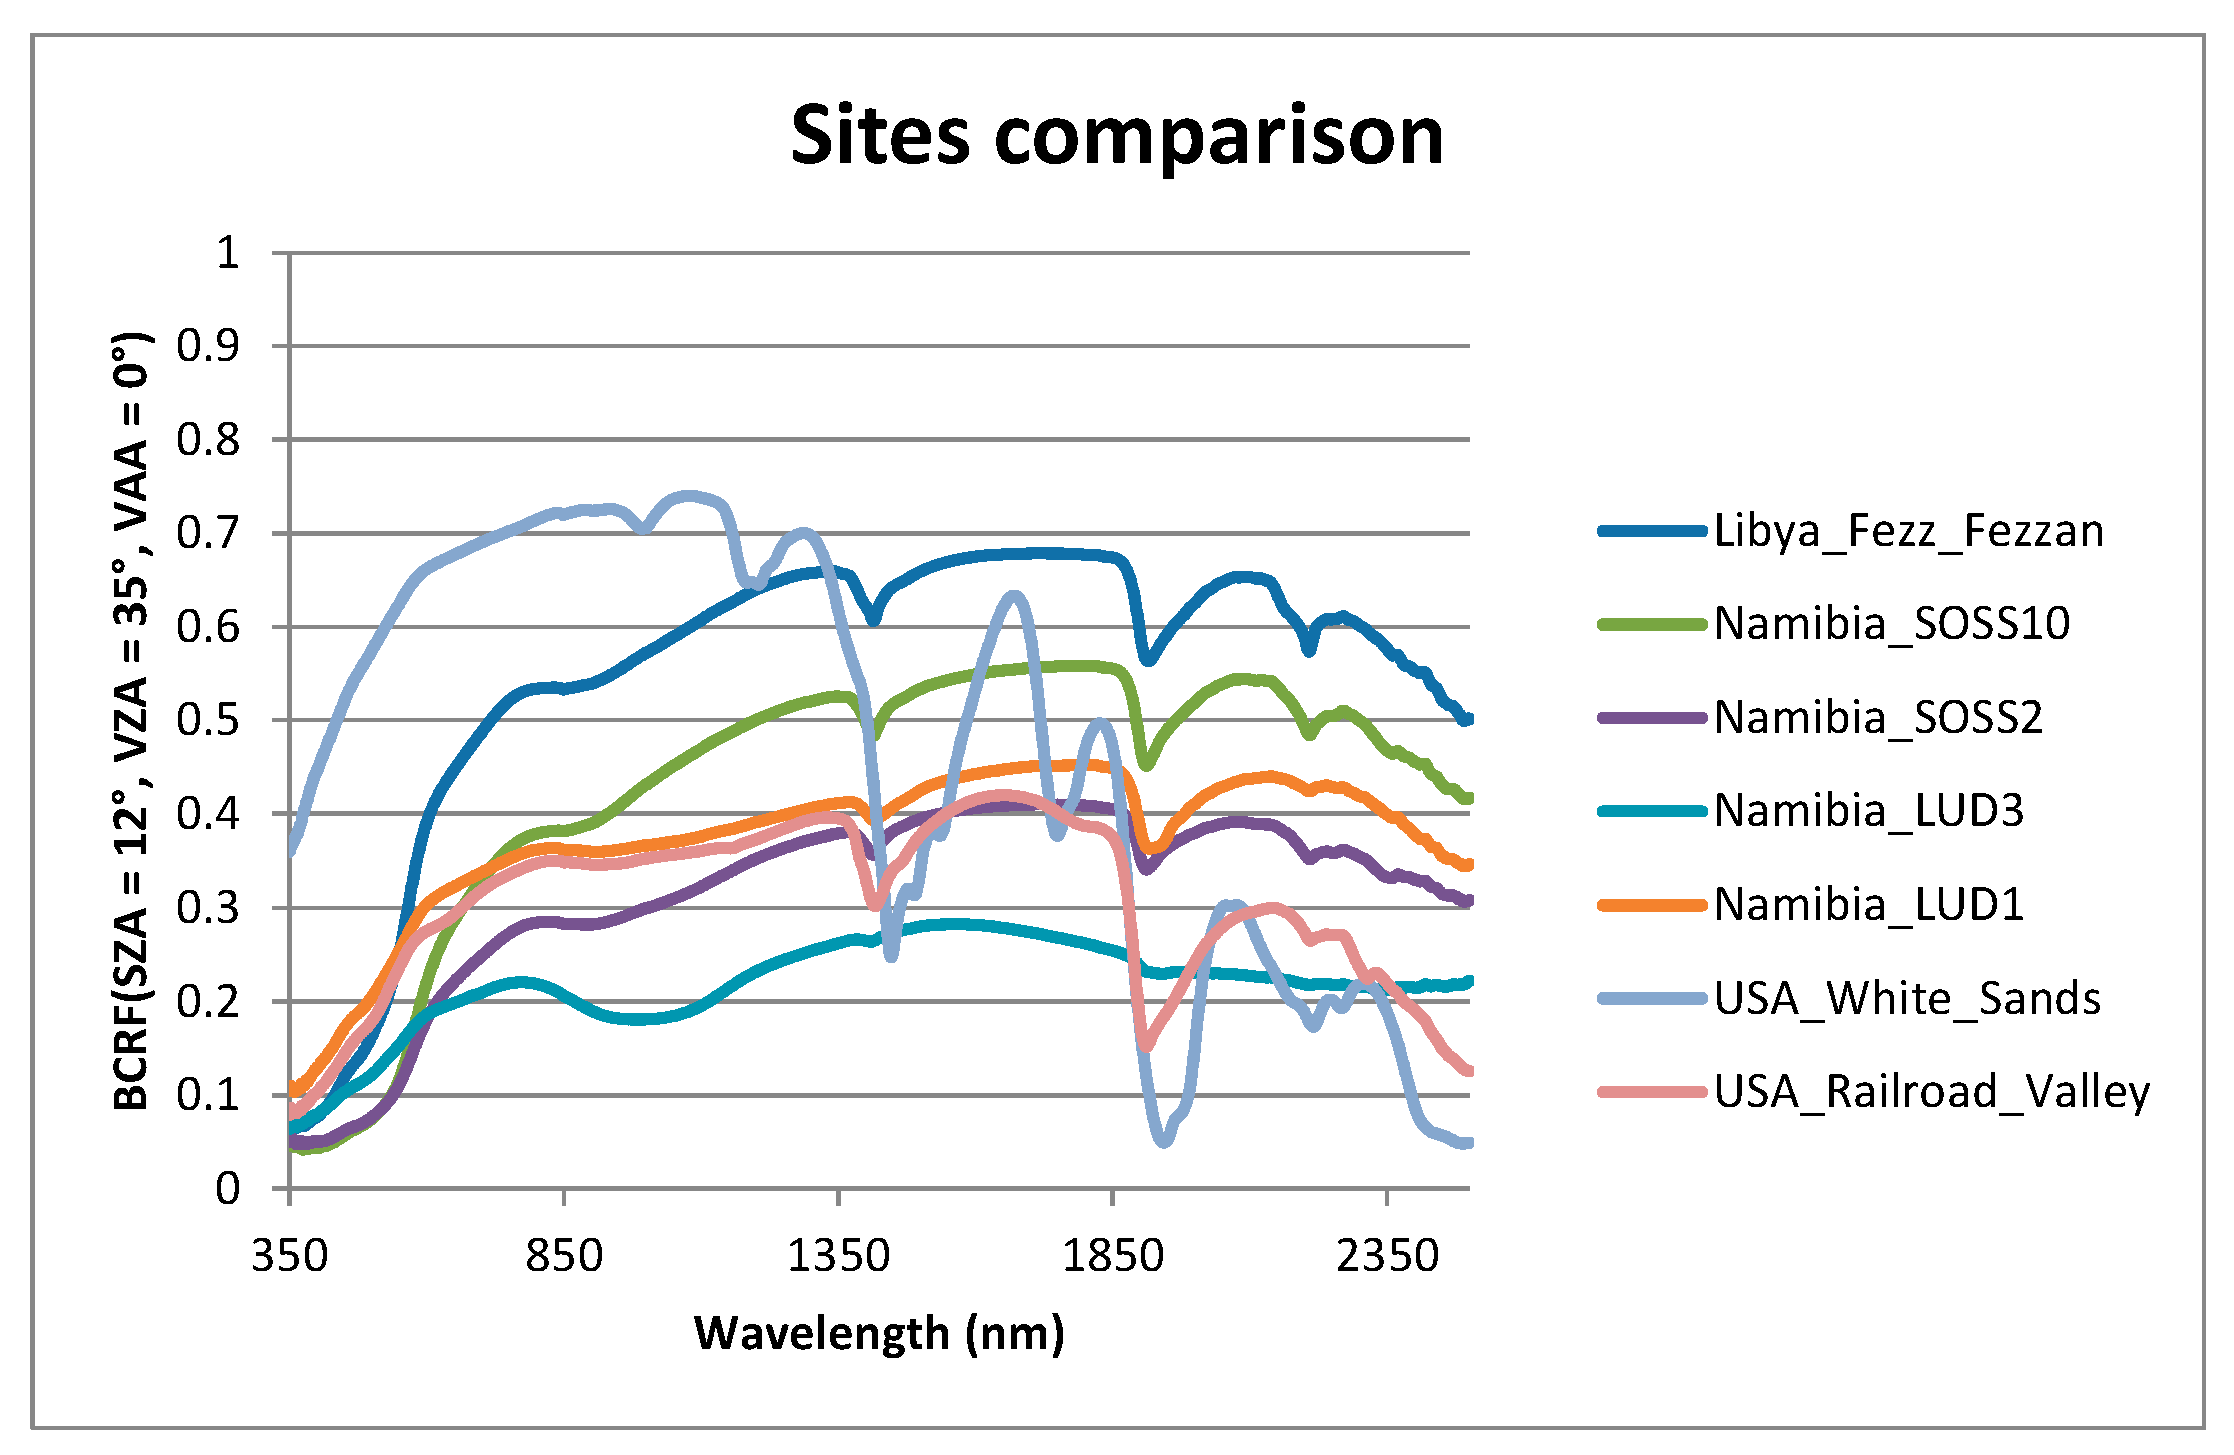
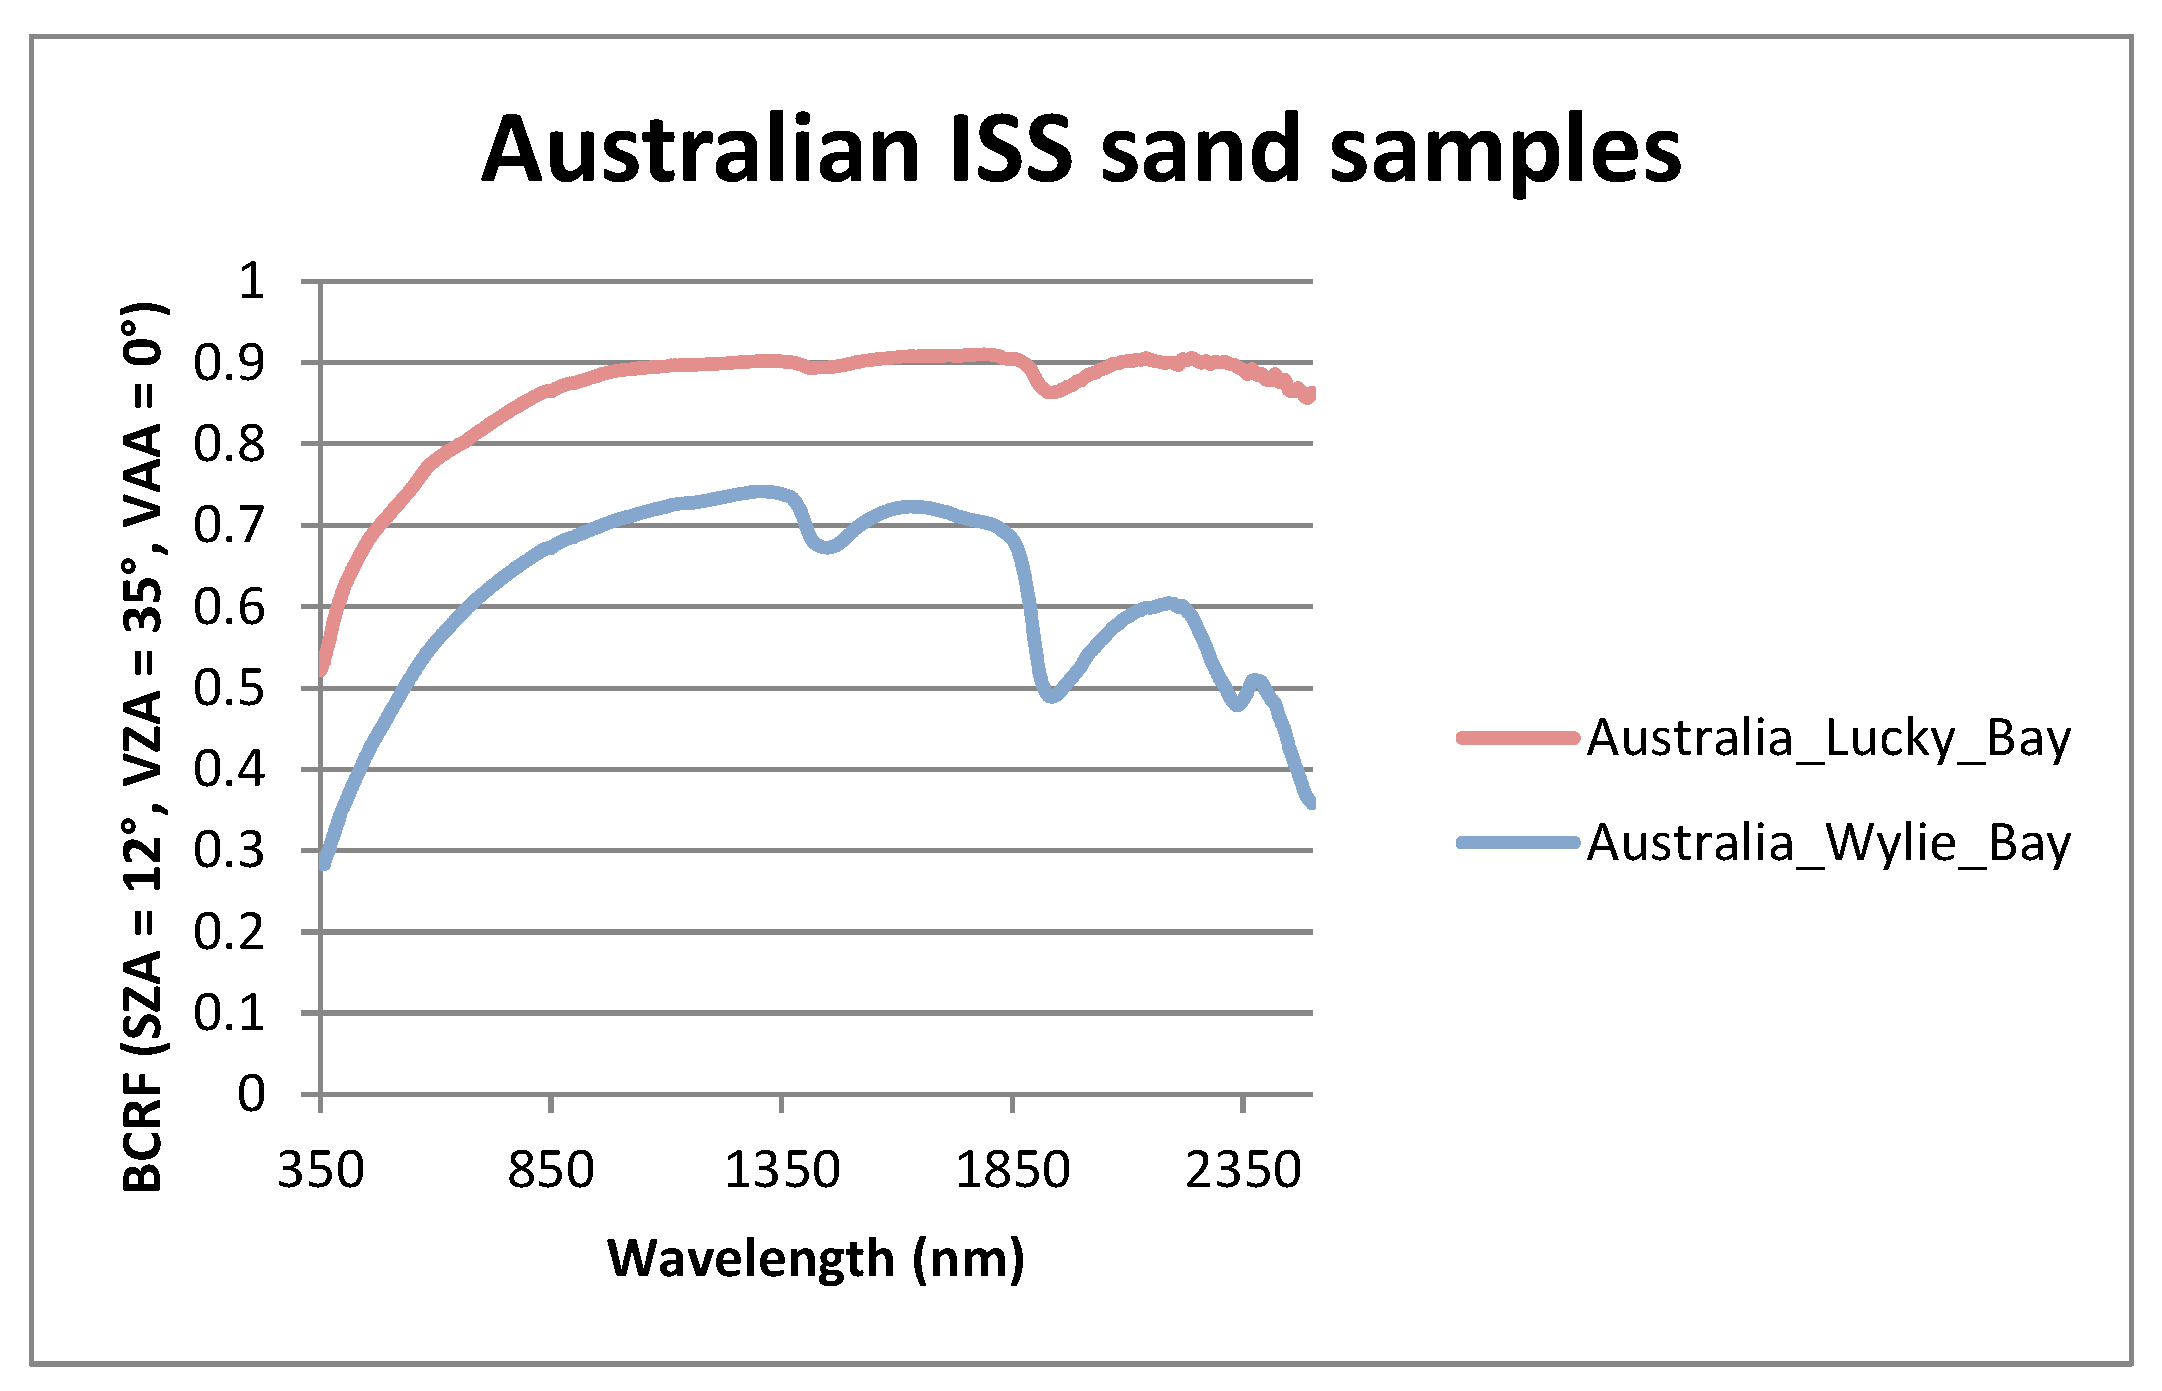
5.1.3. Inter-Site Variability of BCRF

The optical properties between samples at various sites are compared relative to their mean reflectance factor over the three measurements for a given sample. When several samples, for a given site are available, the BCRF is averaged.
The bi-conical reflectance factors for various sites are presented in Figure 8. Two groups of sites could be distinguished—one with higher reflectance factors (typically above 0.5 in the near-infrared), including Algerian, Libyan, Moroccan, and Arabian samples and a second with lower reflectance factors including Namibian and Nigerian samples.
Figure 9 illustrates the wide variation of spectral shape for the samples from Libya, Namibia, and United States of America, which were characterized by the contact probe.

5.1.4. Results for the Internal Soil Standard

The sand samples from Australian bays are Internal Soil Standard (ISS). Including ISS measurements offers the ability to align measurements to others if necessary [13]. The measurements performed for these two ISS samples are presented in Figure 10 and are in agreement with the BCRF presented in [13].

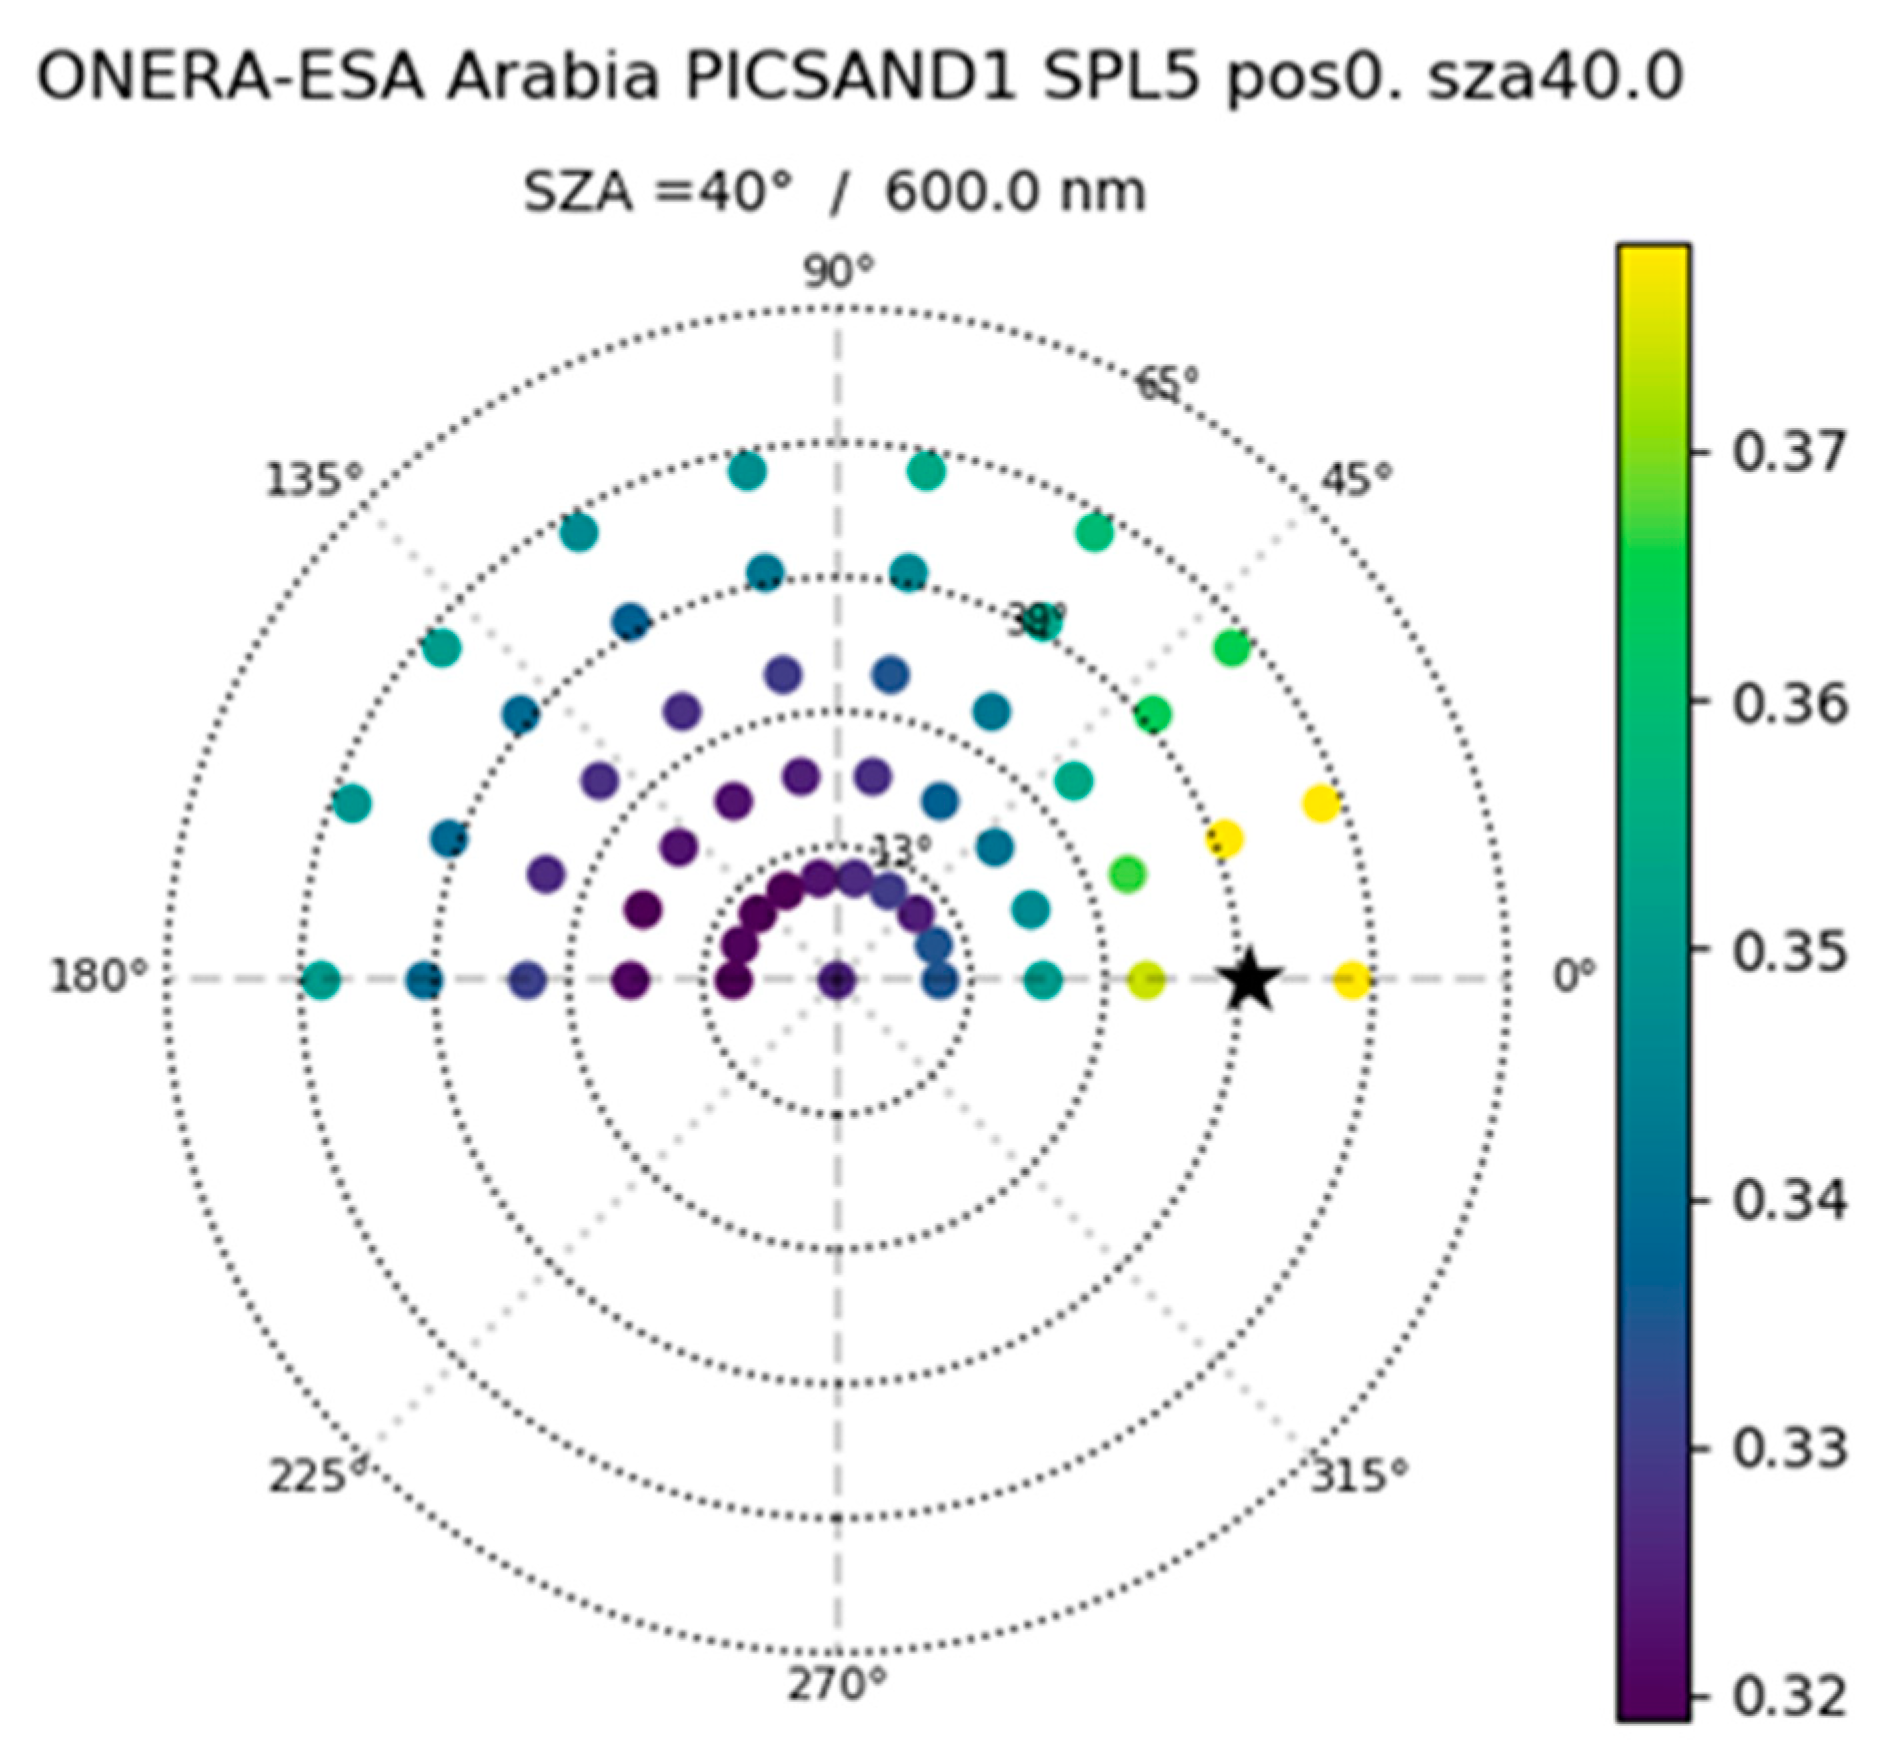
5.2. BCRF Directional Behavior

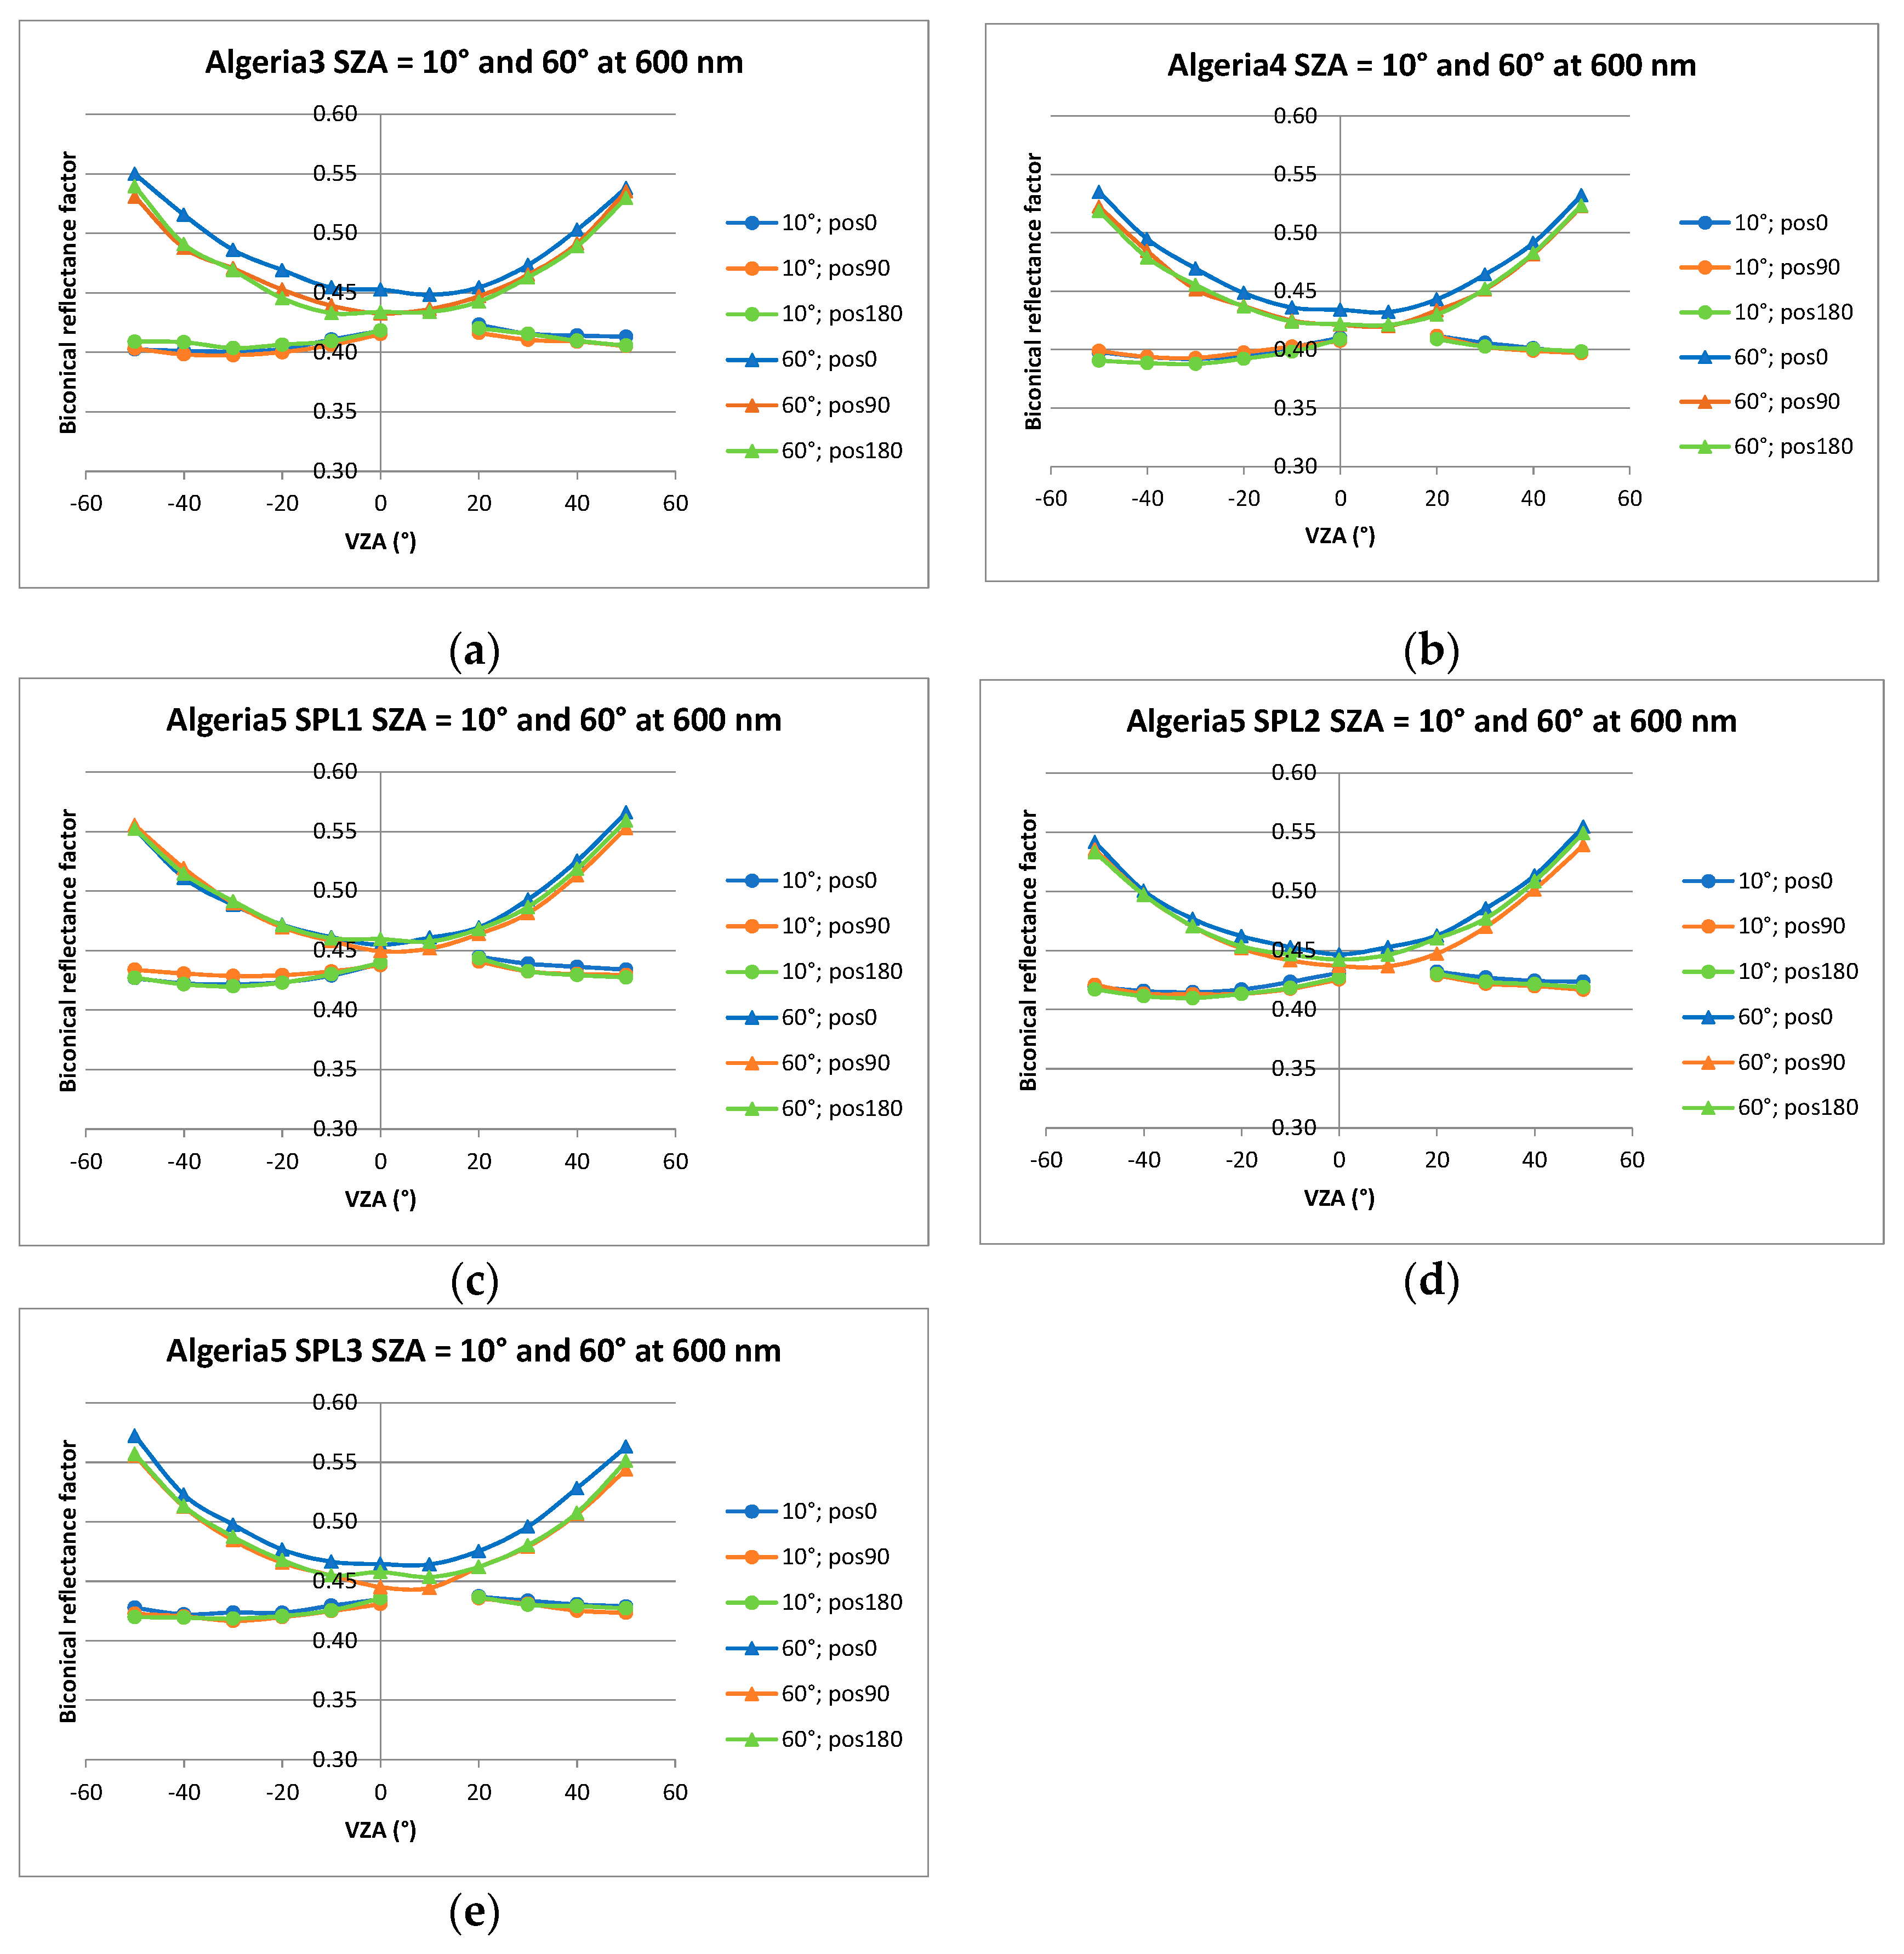
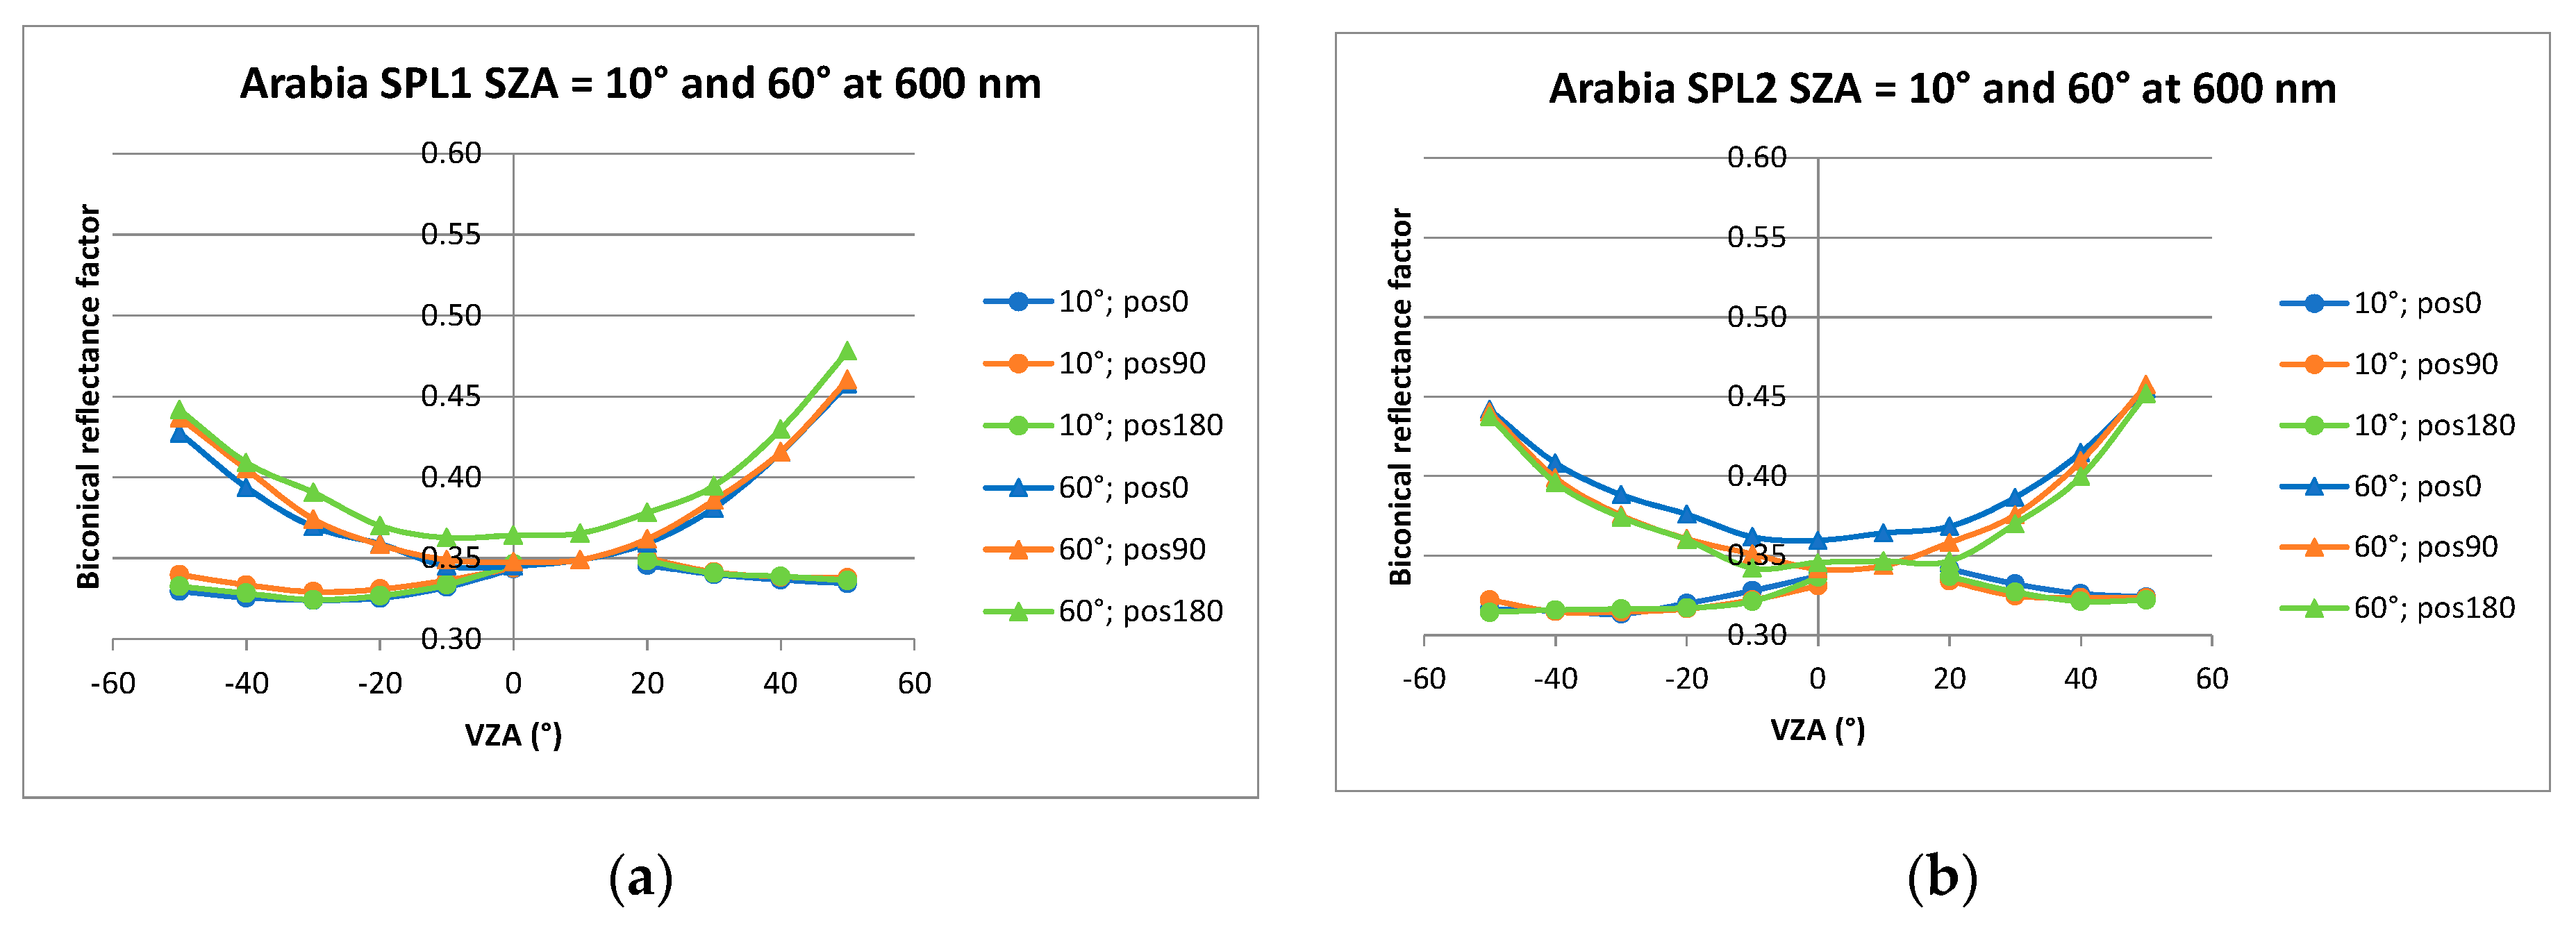
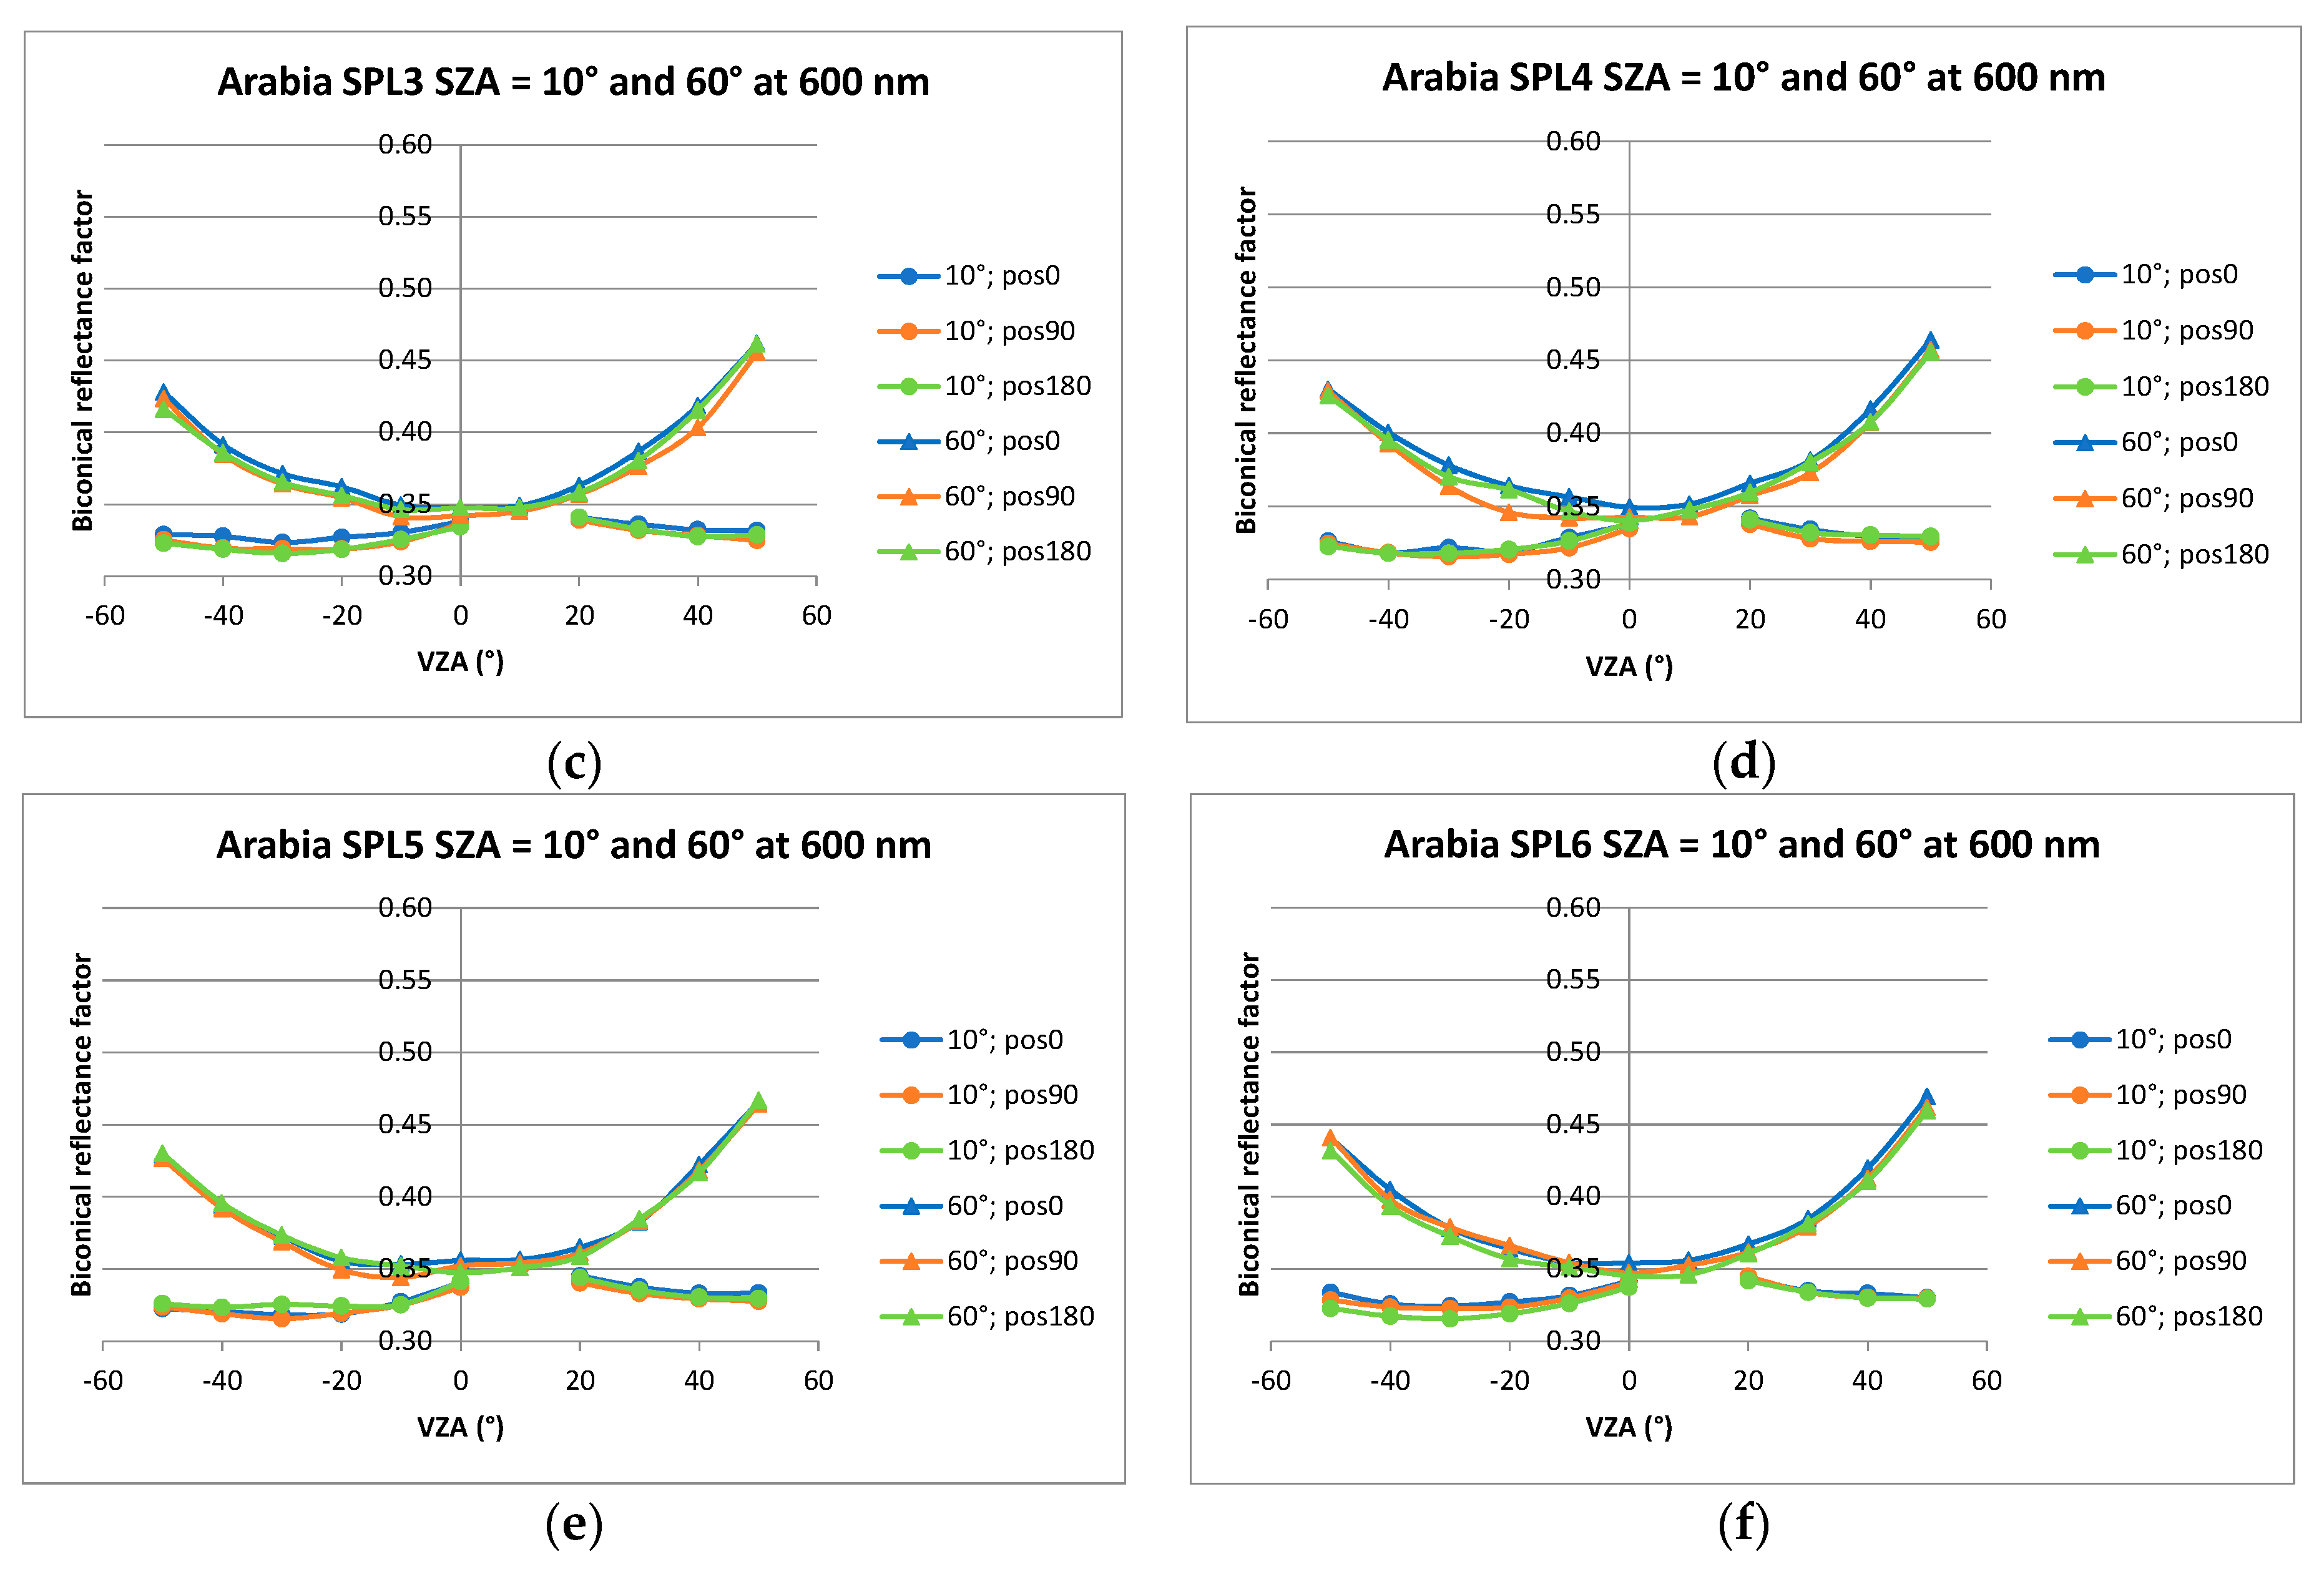
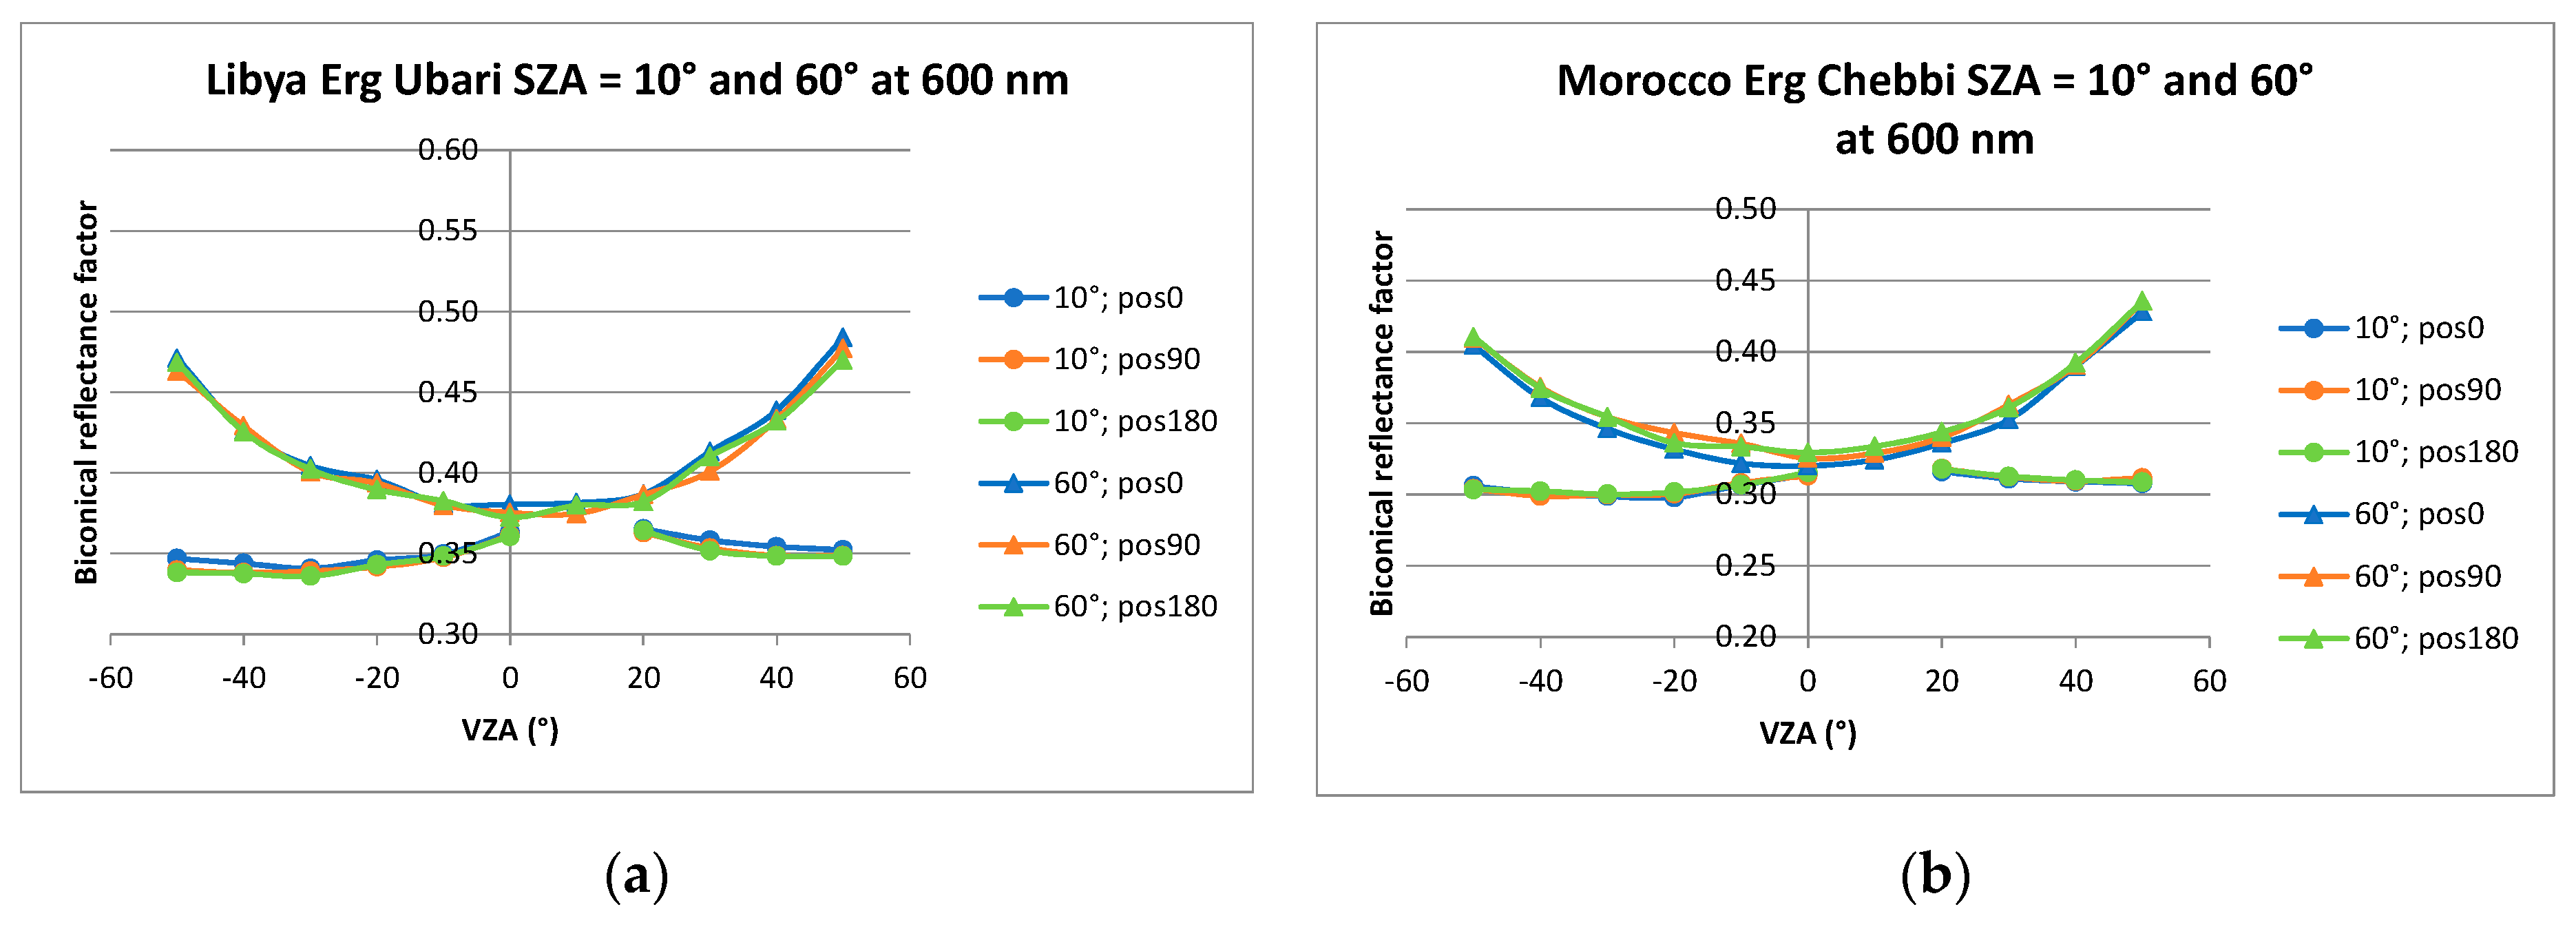
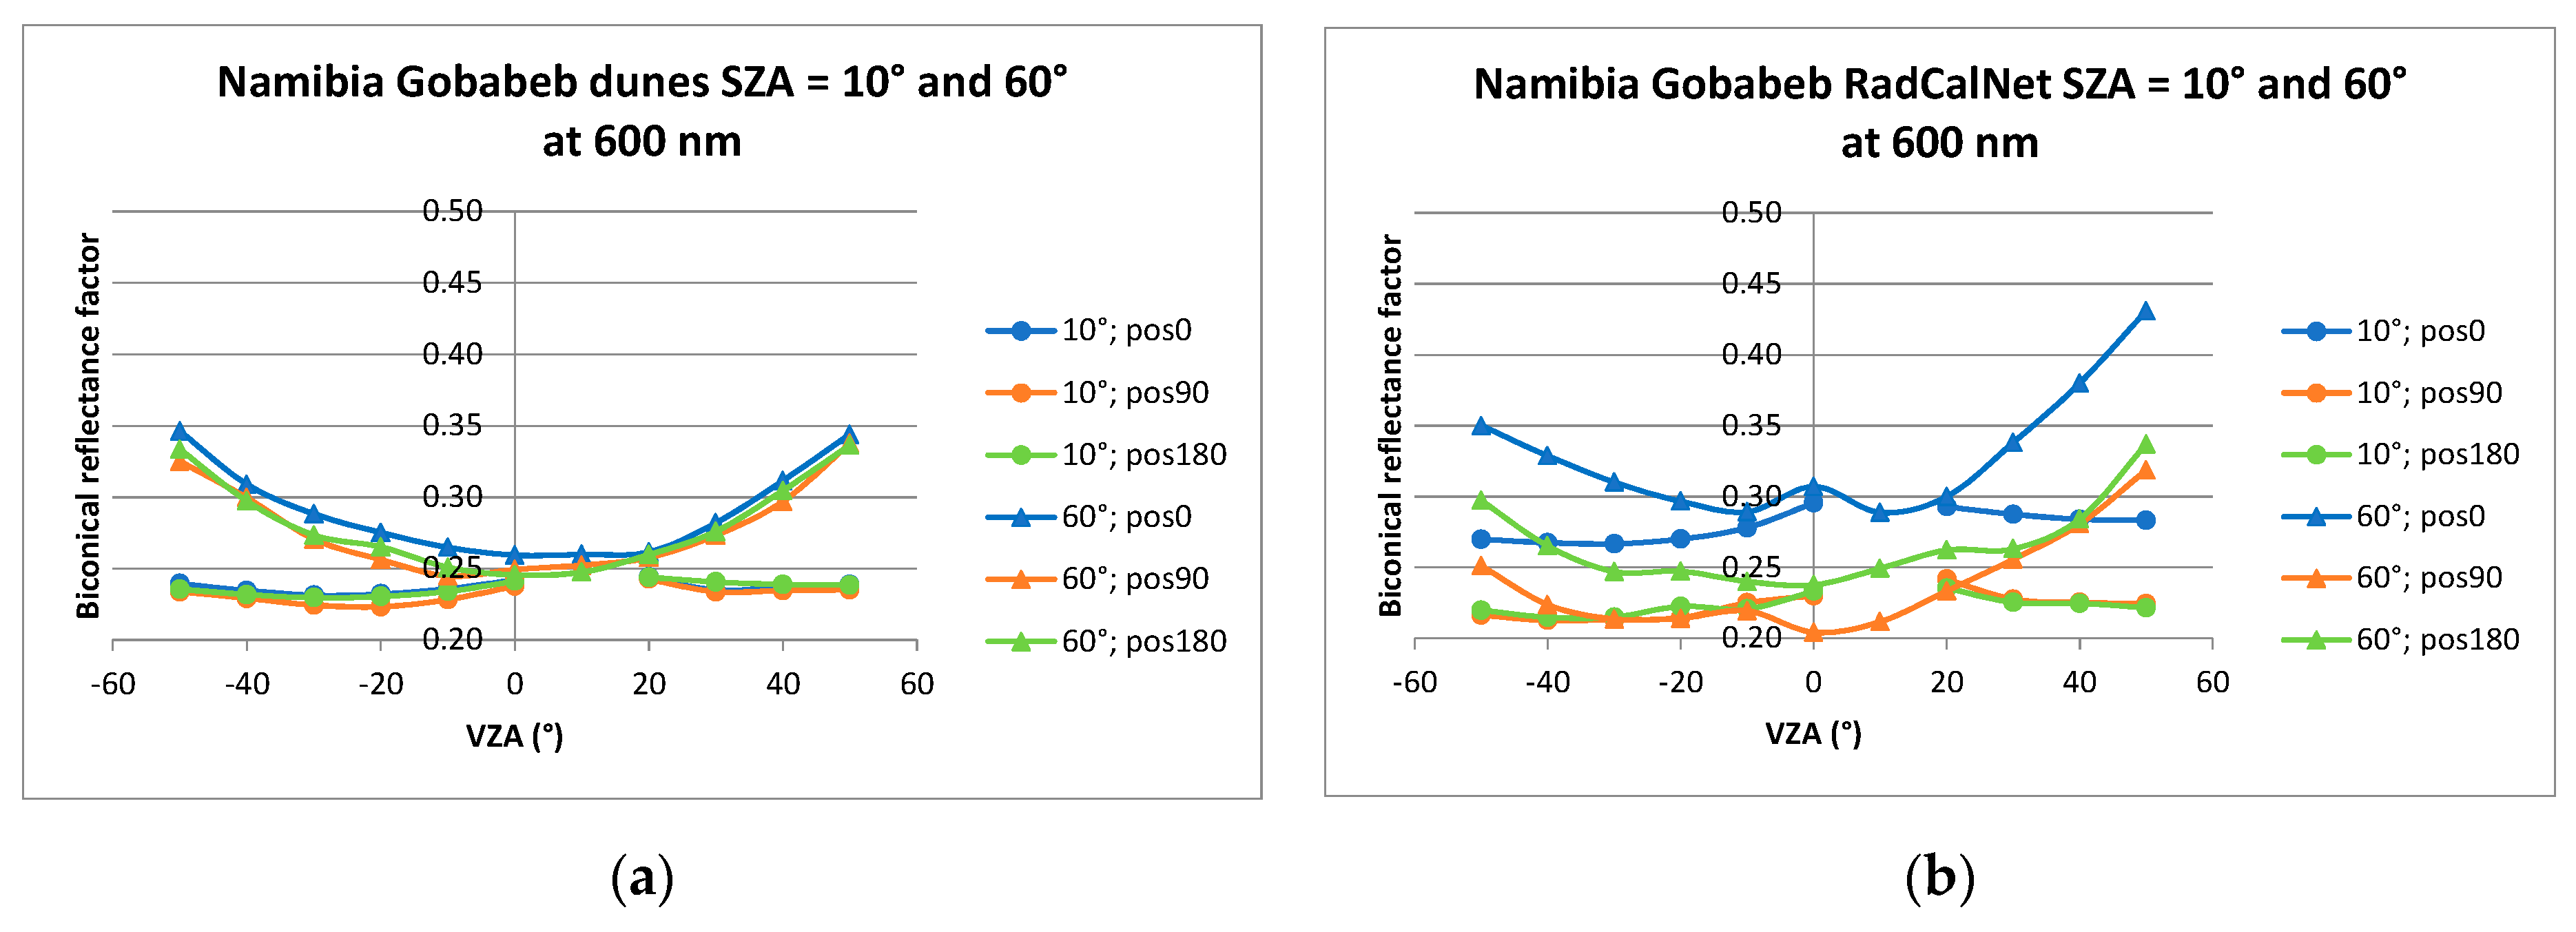
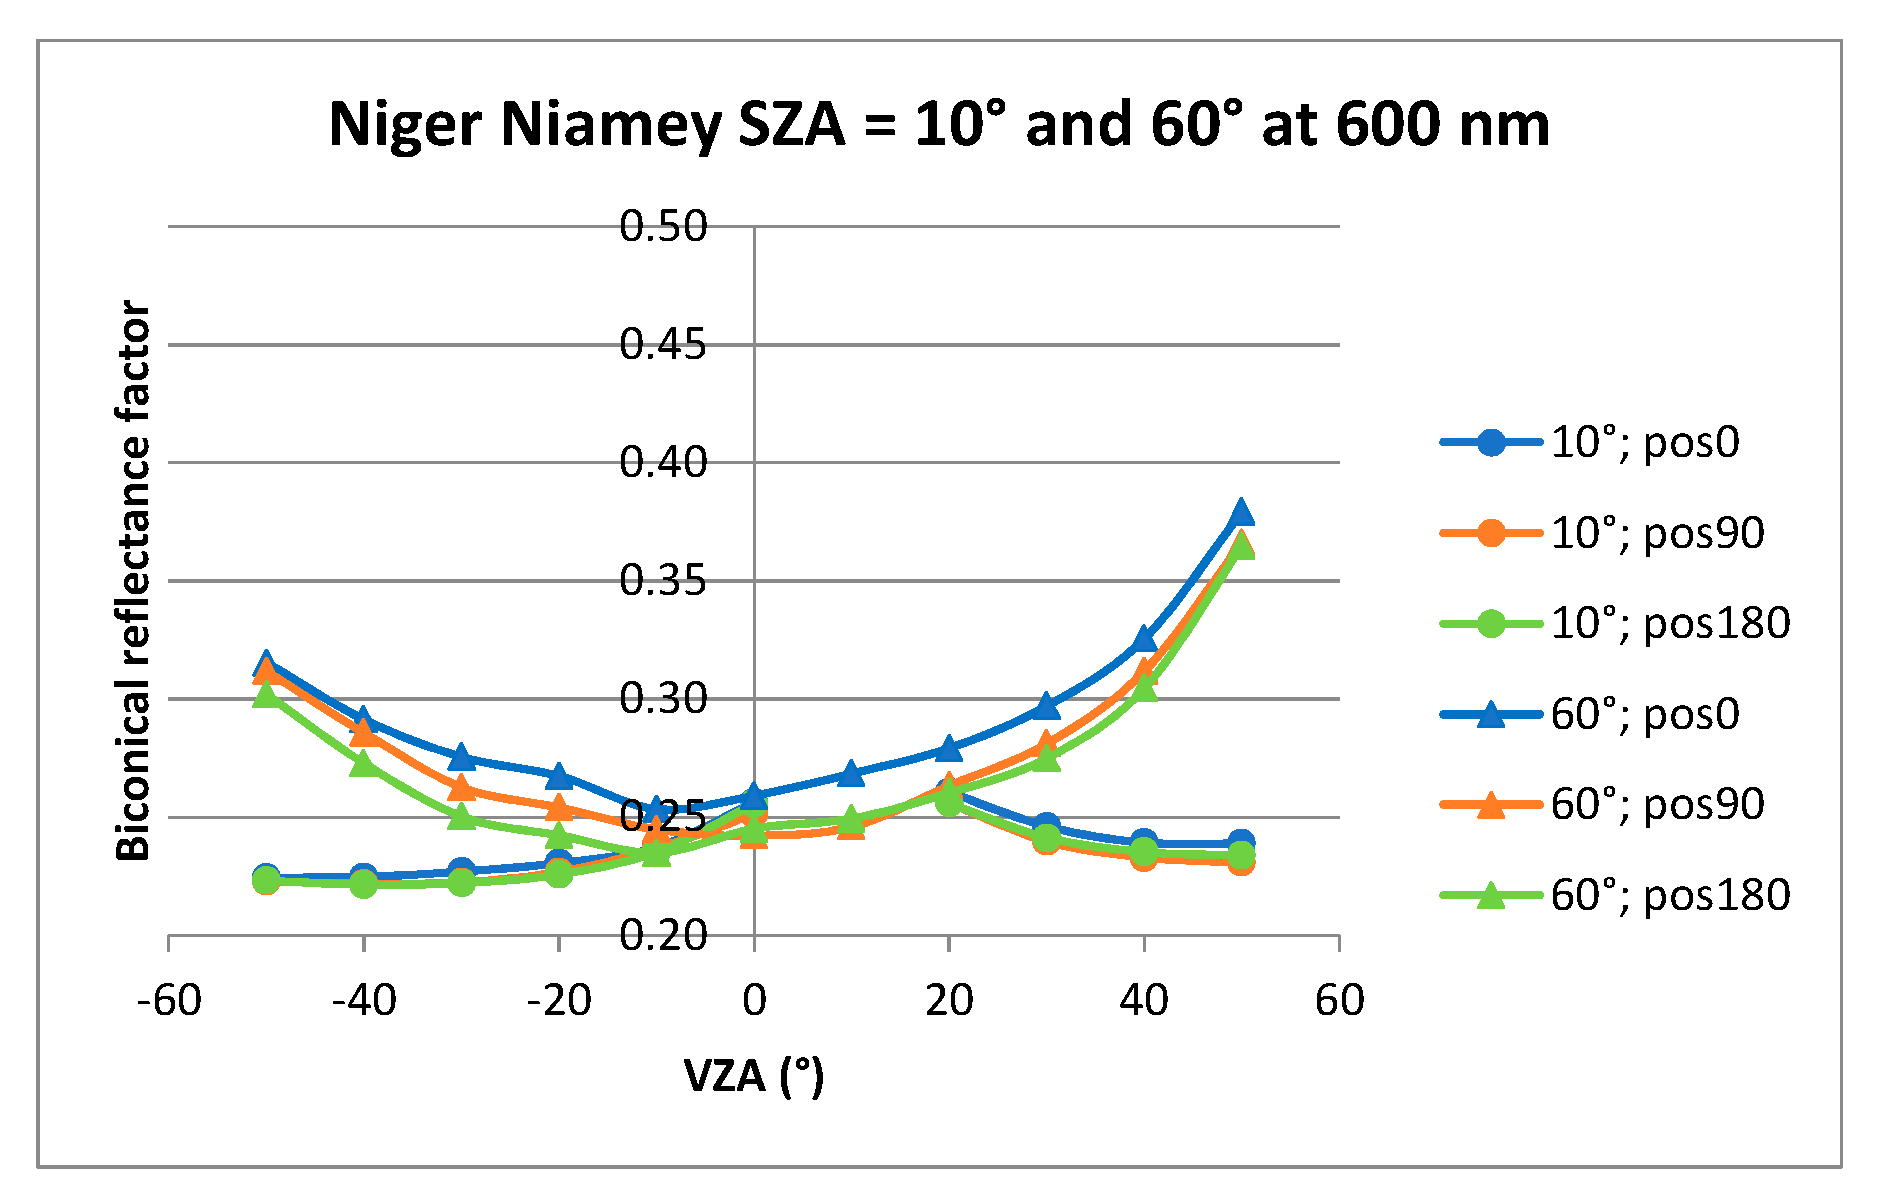
5.2.1. Analysis in the Principal Plane

For the directional behavior analysis, an arbitrary wavelength, 600 nm, is chosen to display the directional signatures. Measurements at this wavelength benefit from high signal to noise ratio.
Figure 11, Figure 12, Figure 13, Figure 14 and Figure 15 compare, in the principal plane, the measurements performed for the three sample orientations for a sample from each site. The BCRF curves for the minimum (10°) and the maximum (60°) solar zenithal angles are presented for each case. The results show that differences in the directional variations of BCRF are not always seen between the three positions of a sample. We, therefore, conclude that these differences are not related to the measurement set-up but originate from the sample itself—little ripples or inhomogeneity, as for the Namibia_RadCalNet sample in Figure 2a.

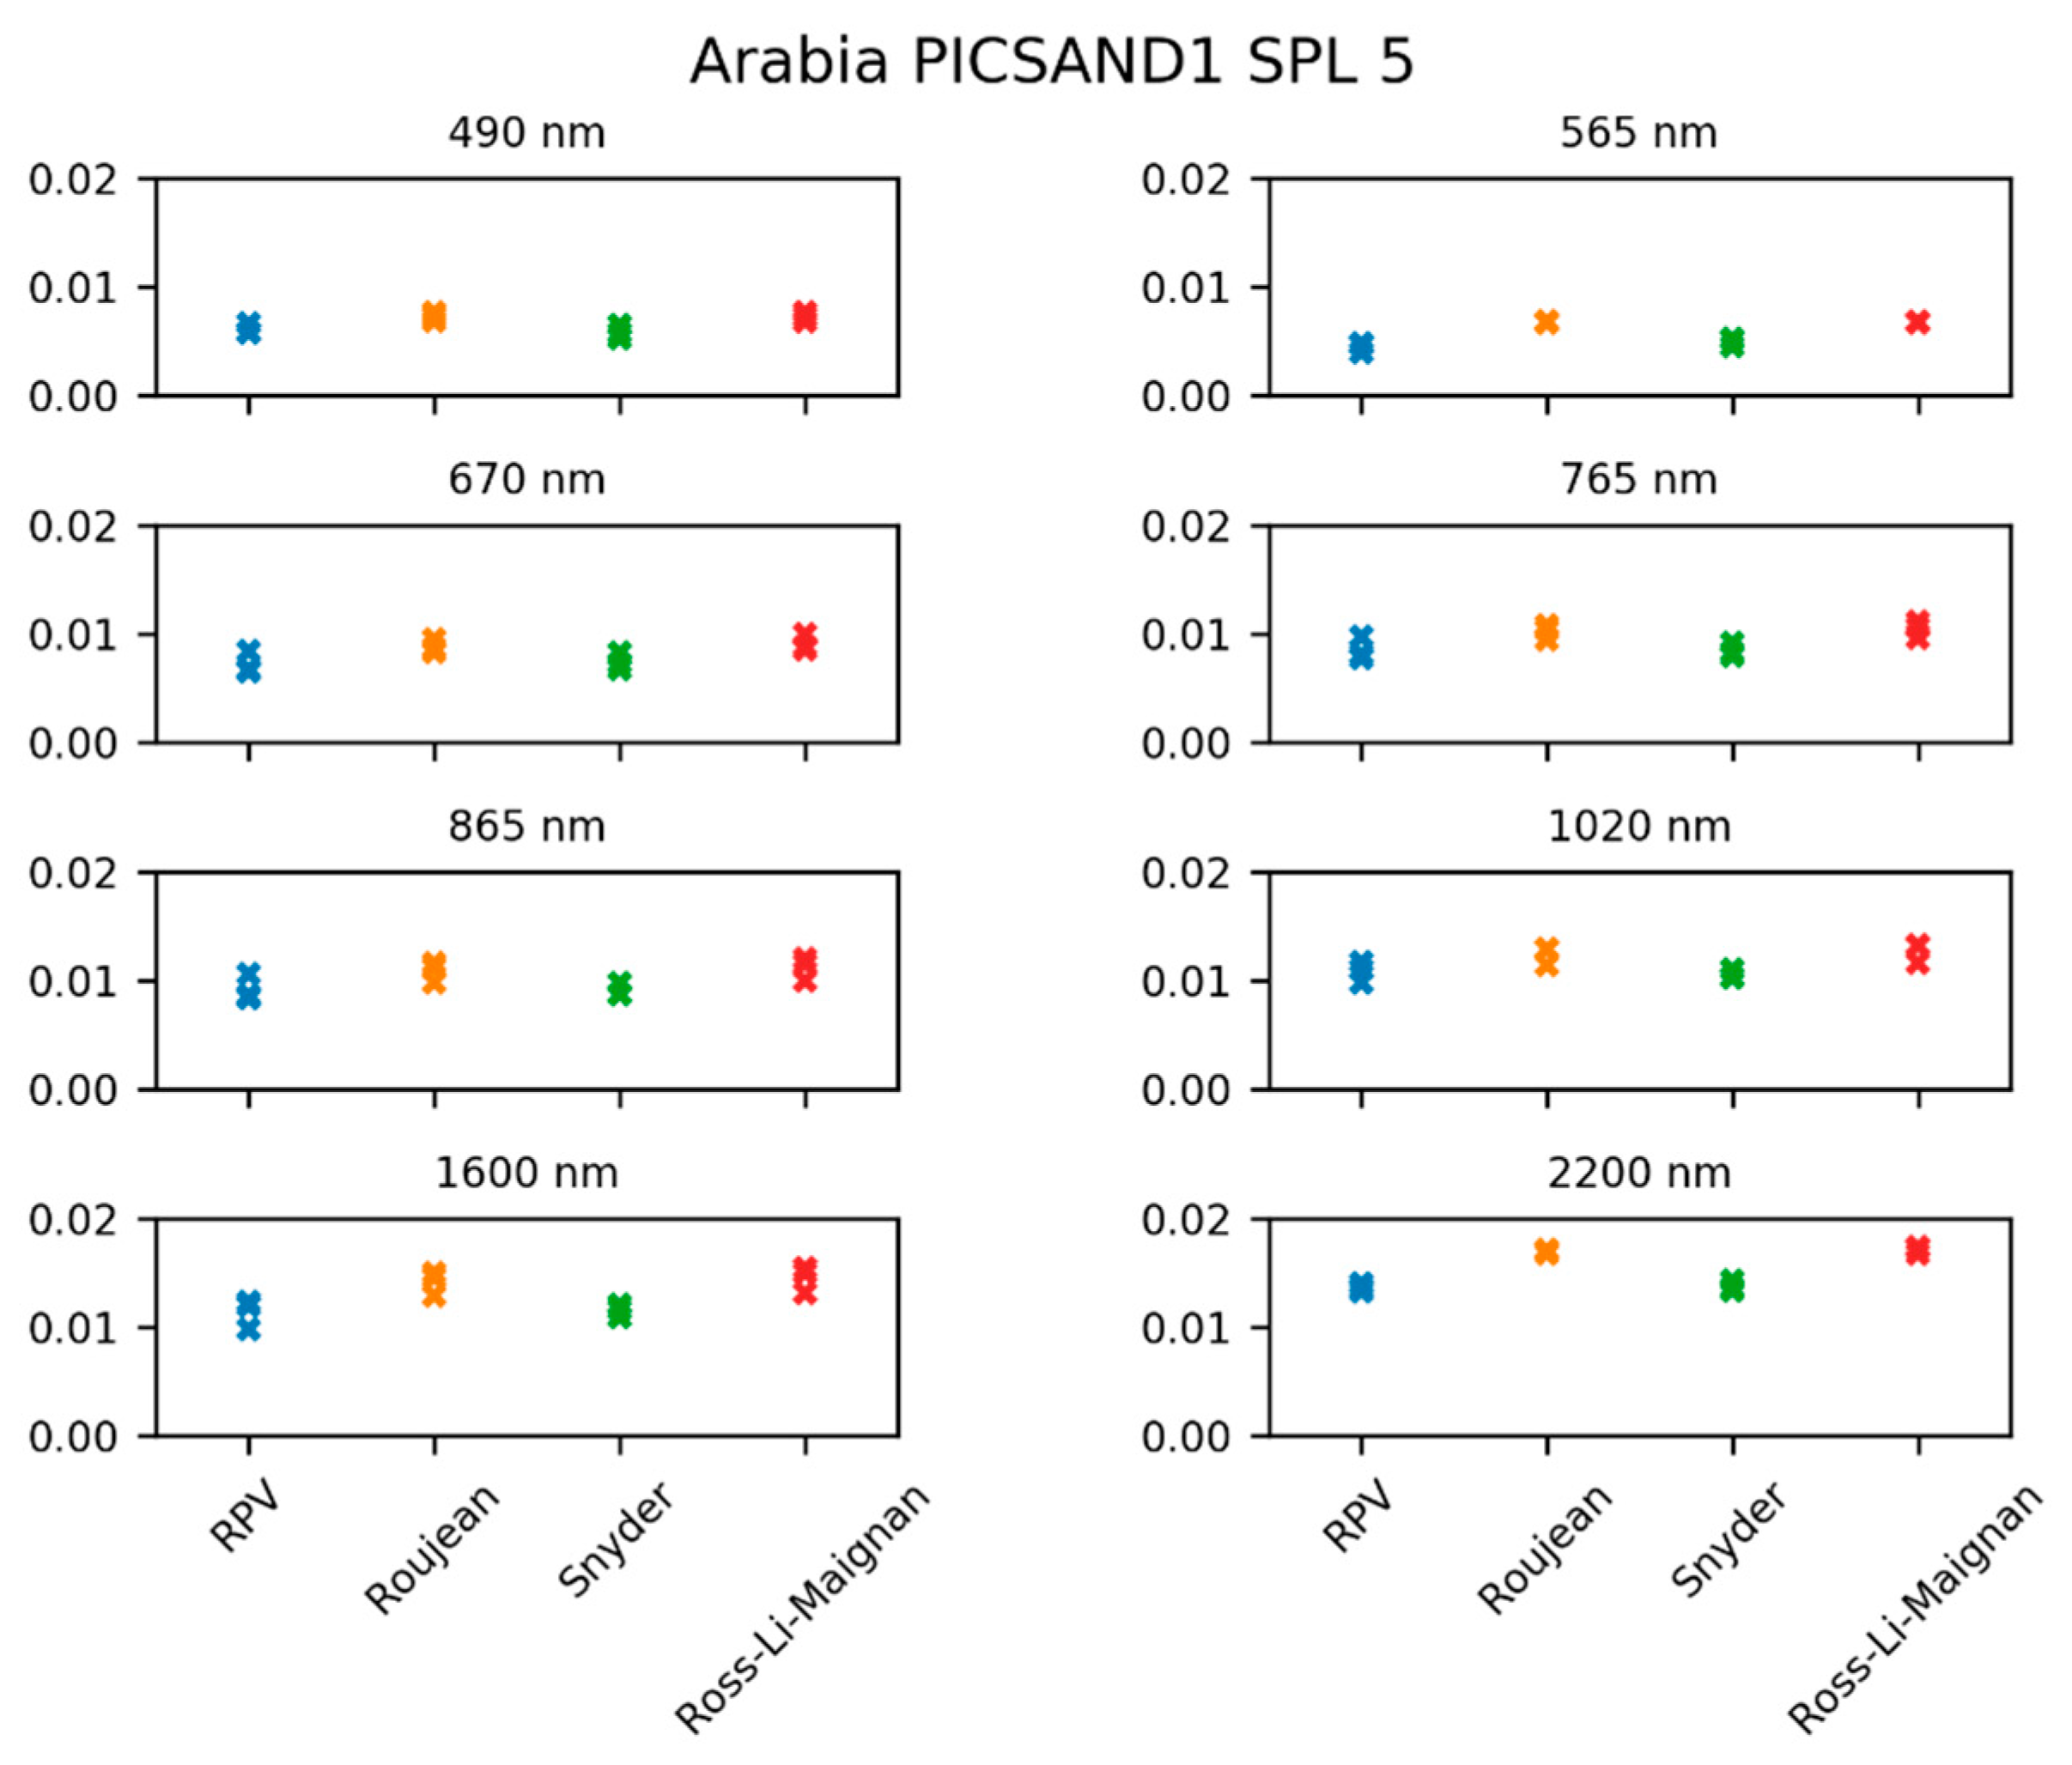
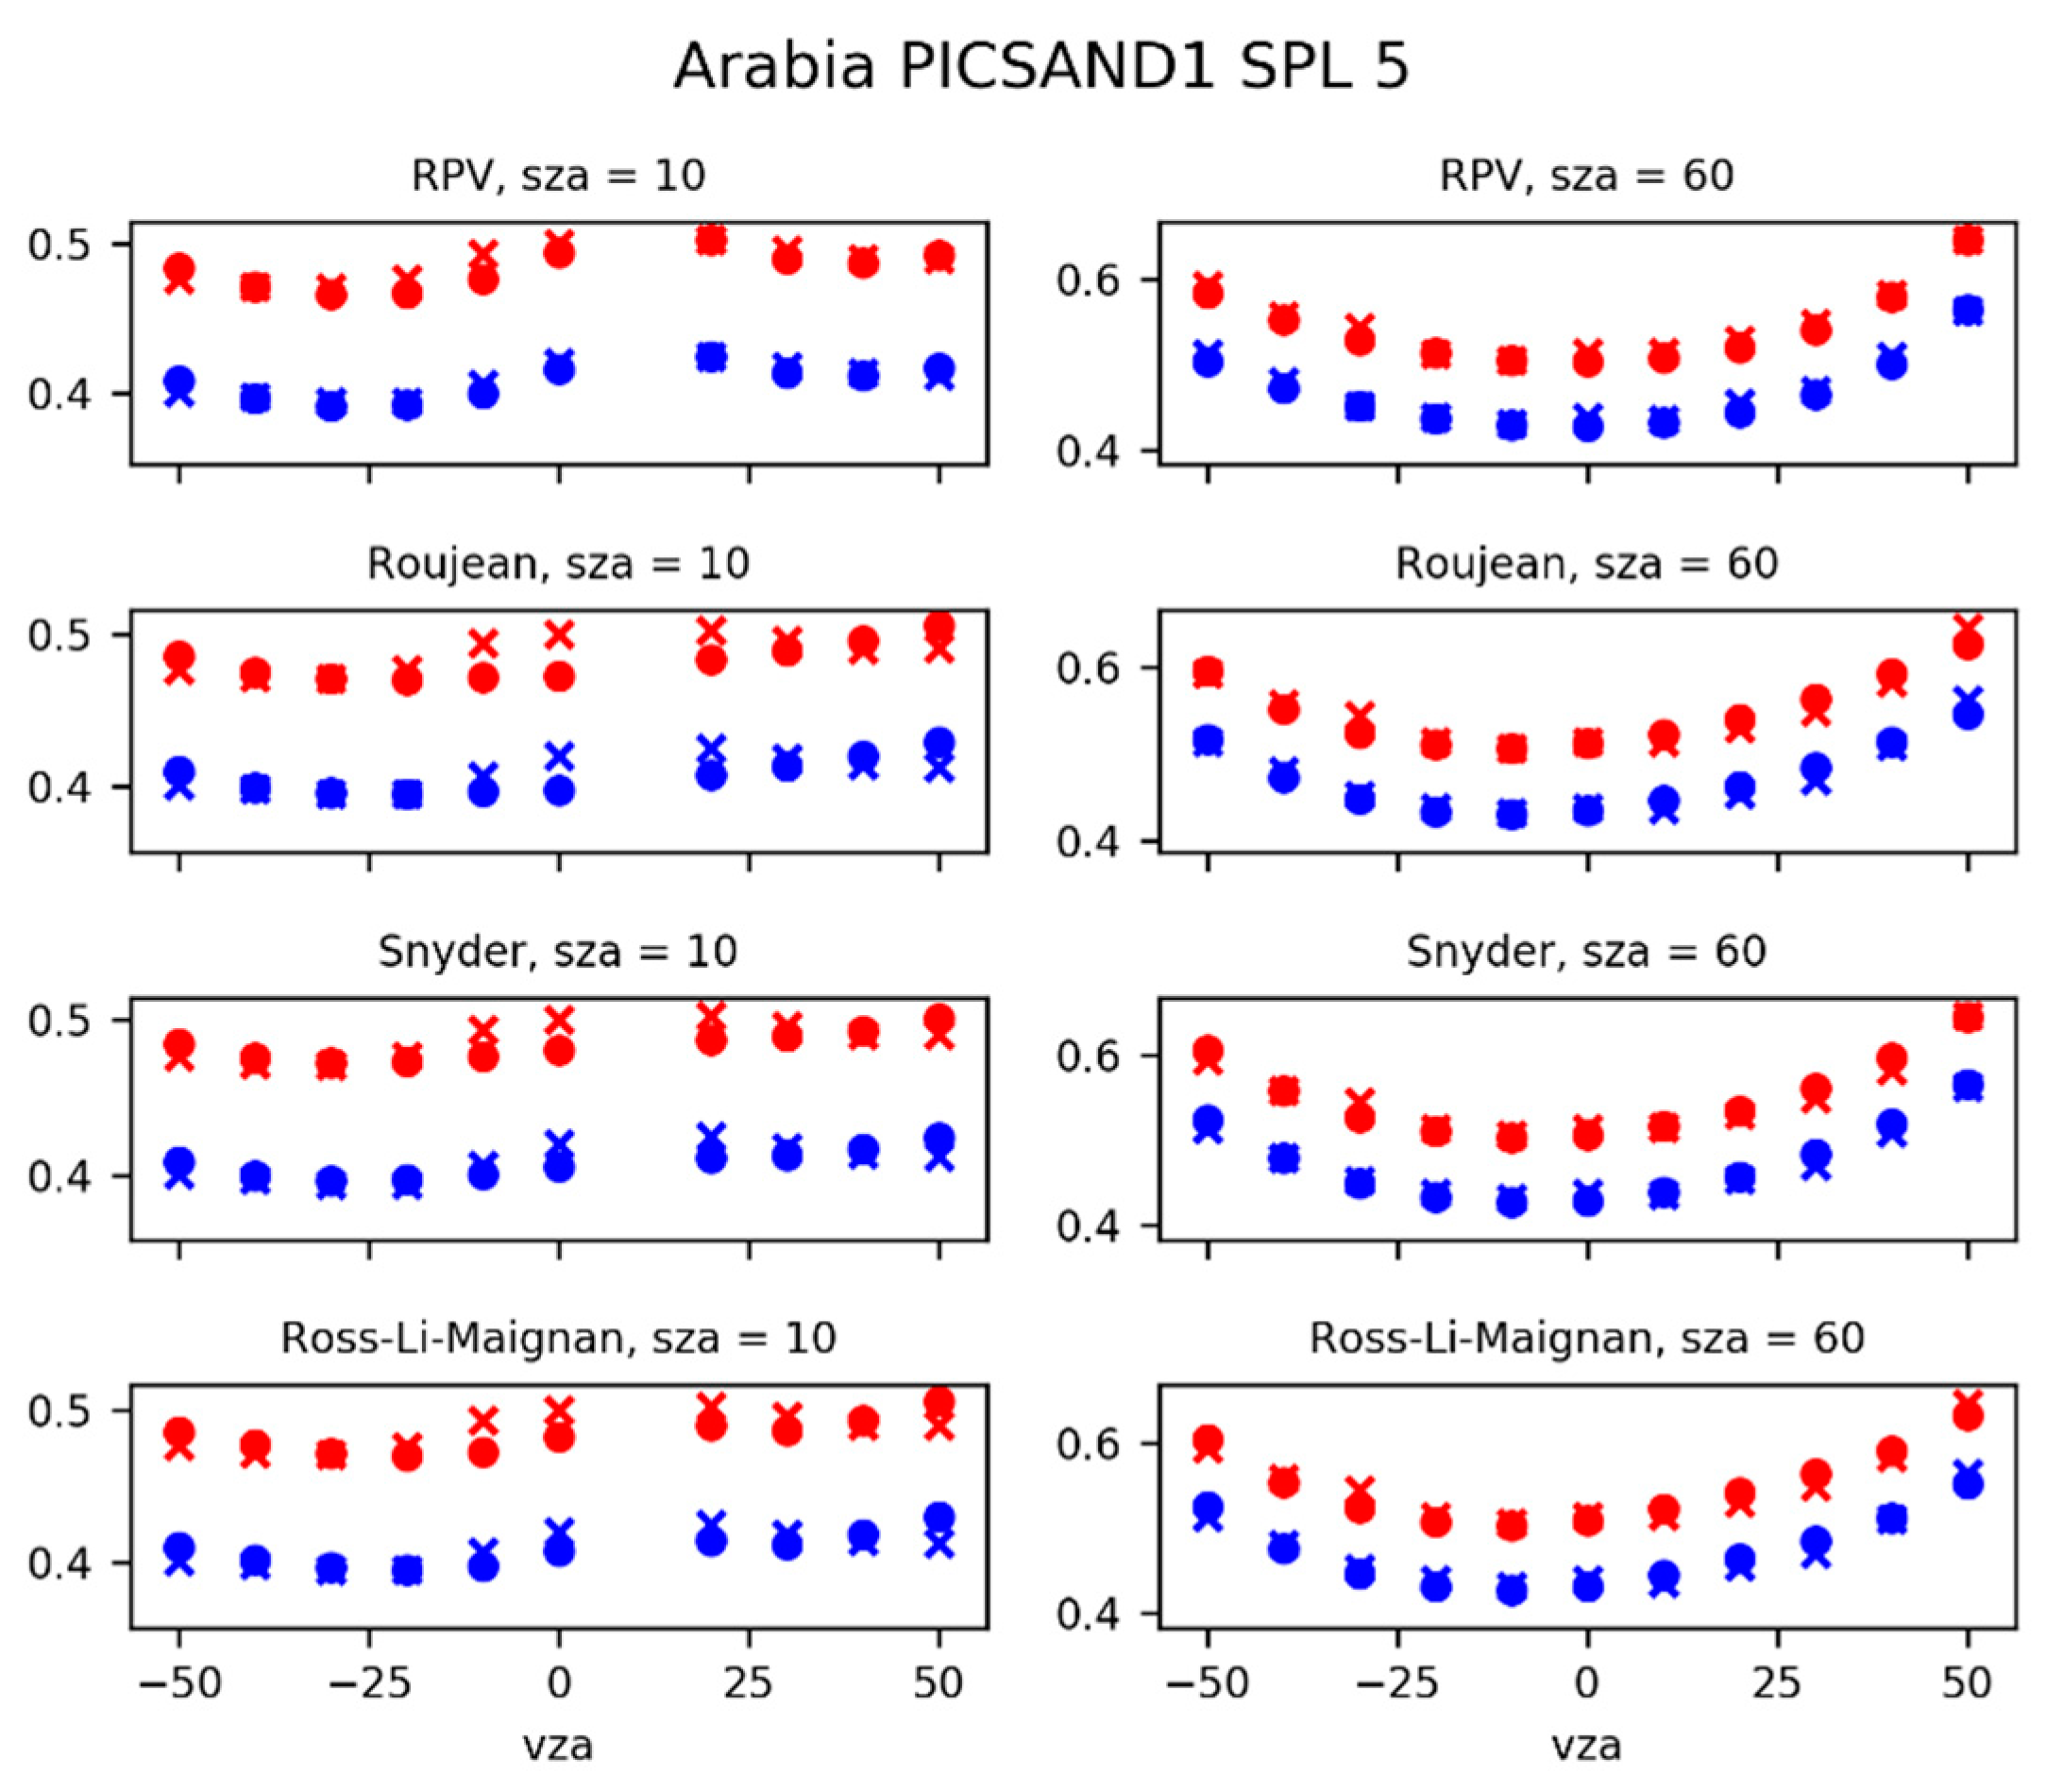
5.2.2. Reproducibility of Directional Signatures with BRDF Models

A set of BRDF models were fitted to the measurements (omitting the π factor) in order to know if a given model performs better than the others for the majority of the sand samples or if the best model varies a lot with the sample considered.
The selected models are those found adequate for reproducing sand directional signature [16,17]. The list of the models, as well as their main features, are given in Table 3.
The optimization of the BRDF model parameters using the measured BCRF were achieved thanks to the Simplex method [21]. In order to overcome possible issues of convergence into local minima, the optimization is run starting from twenty different initial conditions generated randomly. Among the corresponding twenty solutions, the one giving the lowest Root Mean Square Difference (RMSD) between model and data is selected as the optimal one. The models are fitted on the whole set of BCRF values corresponding to the whole range of observation geometries described in Section 4.1.
For each sample, the fitting performance (corresponding to the RMSD) is measured independently for each of the six POLDER wavelengths (490, 565, 670, 765, 865, and 1020 nm) plus two wavelengths in the SWIR domain: 1600 and 2200 nm, and for the three rotating positions.
The relative fitting performance between the BRDF models is fairly similar, whatever the sample. The Snyder and the RPV (Rahman, Pinty, Verstraete) models generally provide the best fitting performances for all studied wavelengths. They are also models with the largest numbers of fitting parameters. The results are illustrated through the Arabia_PICSAND_SPL5 case in Figure 16.
The behavior of each model compared to the BCRF, in the principal plane, is shown in Figure 17 for the Arabia_PICSAND_SPL5 case. The curves correspond to:
  • the position 0° (pos0) of the samples,
  • two wavelengths: 670 and 875 nm,
  • two solar zenith angles (SZA): 10 and 60°.

5.3. Mineralogy

The results for the sample Arabia_PICSAND_SPL5 are given in Table 4. The results for the other samples are available in the PICSAND database described in Section 5.5.

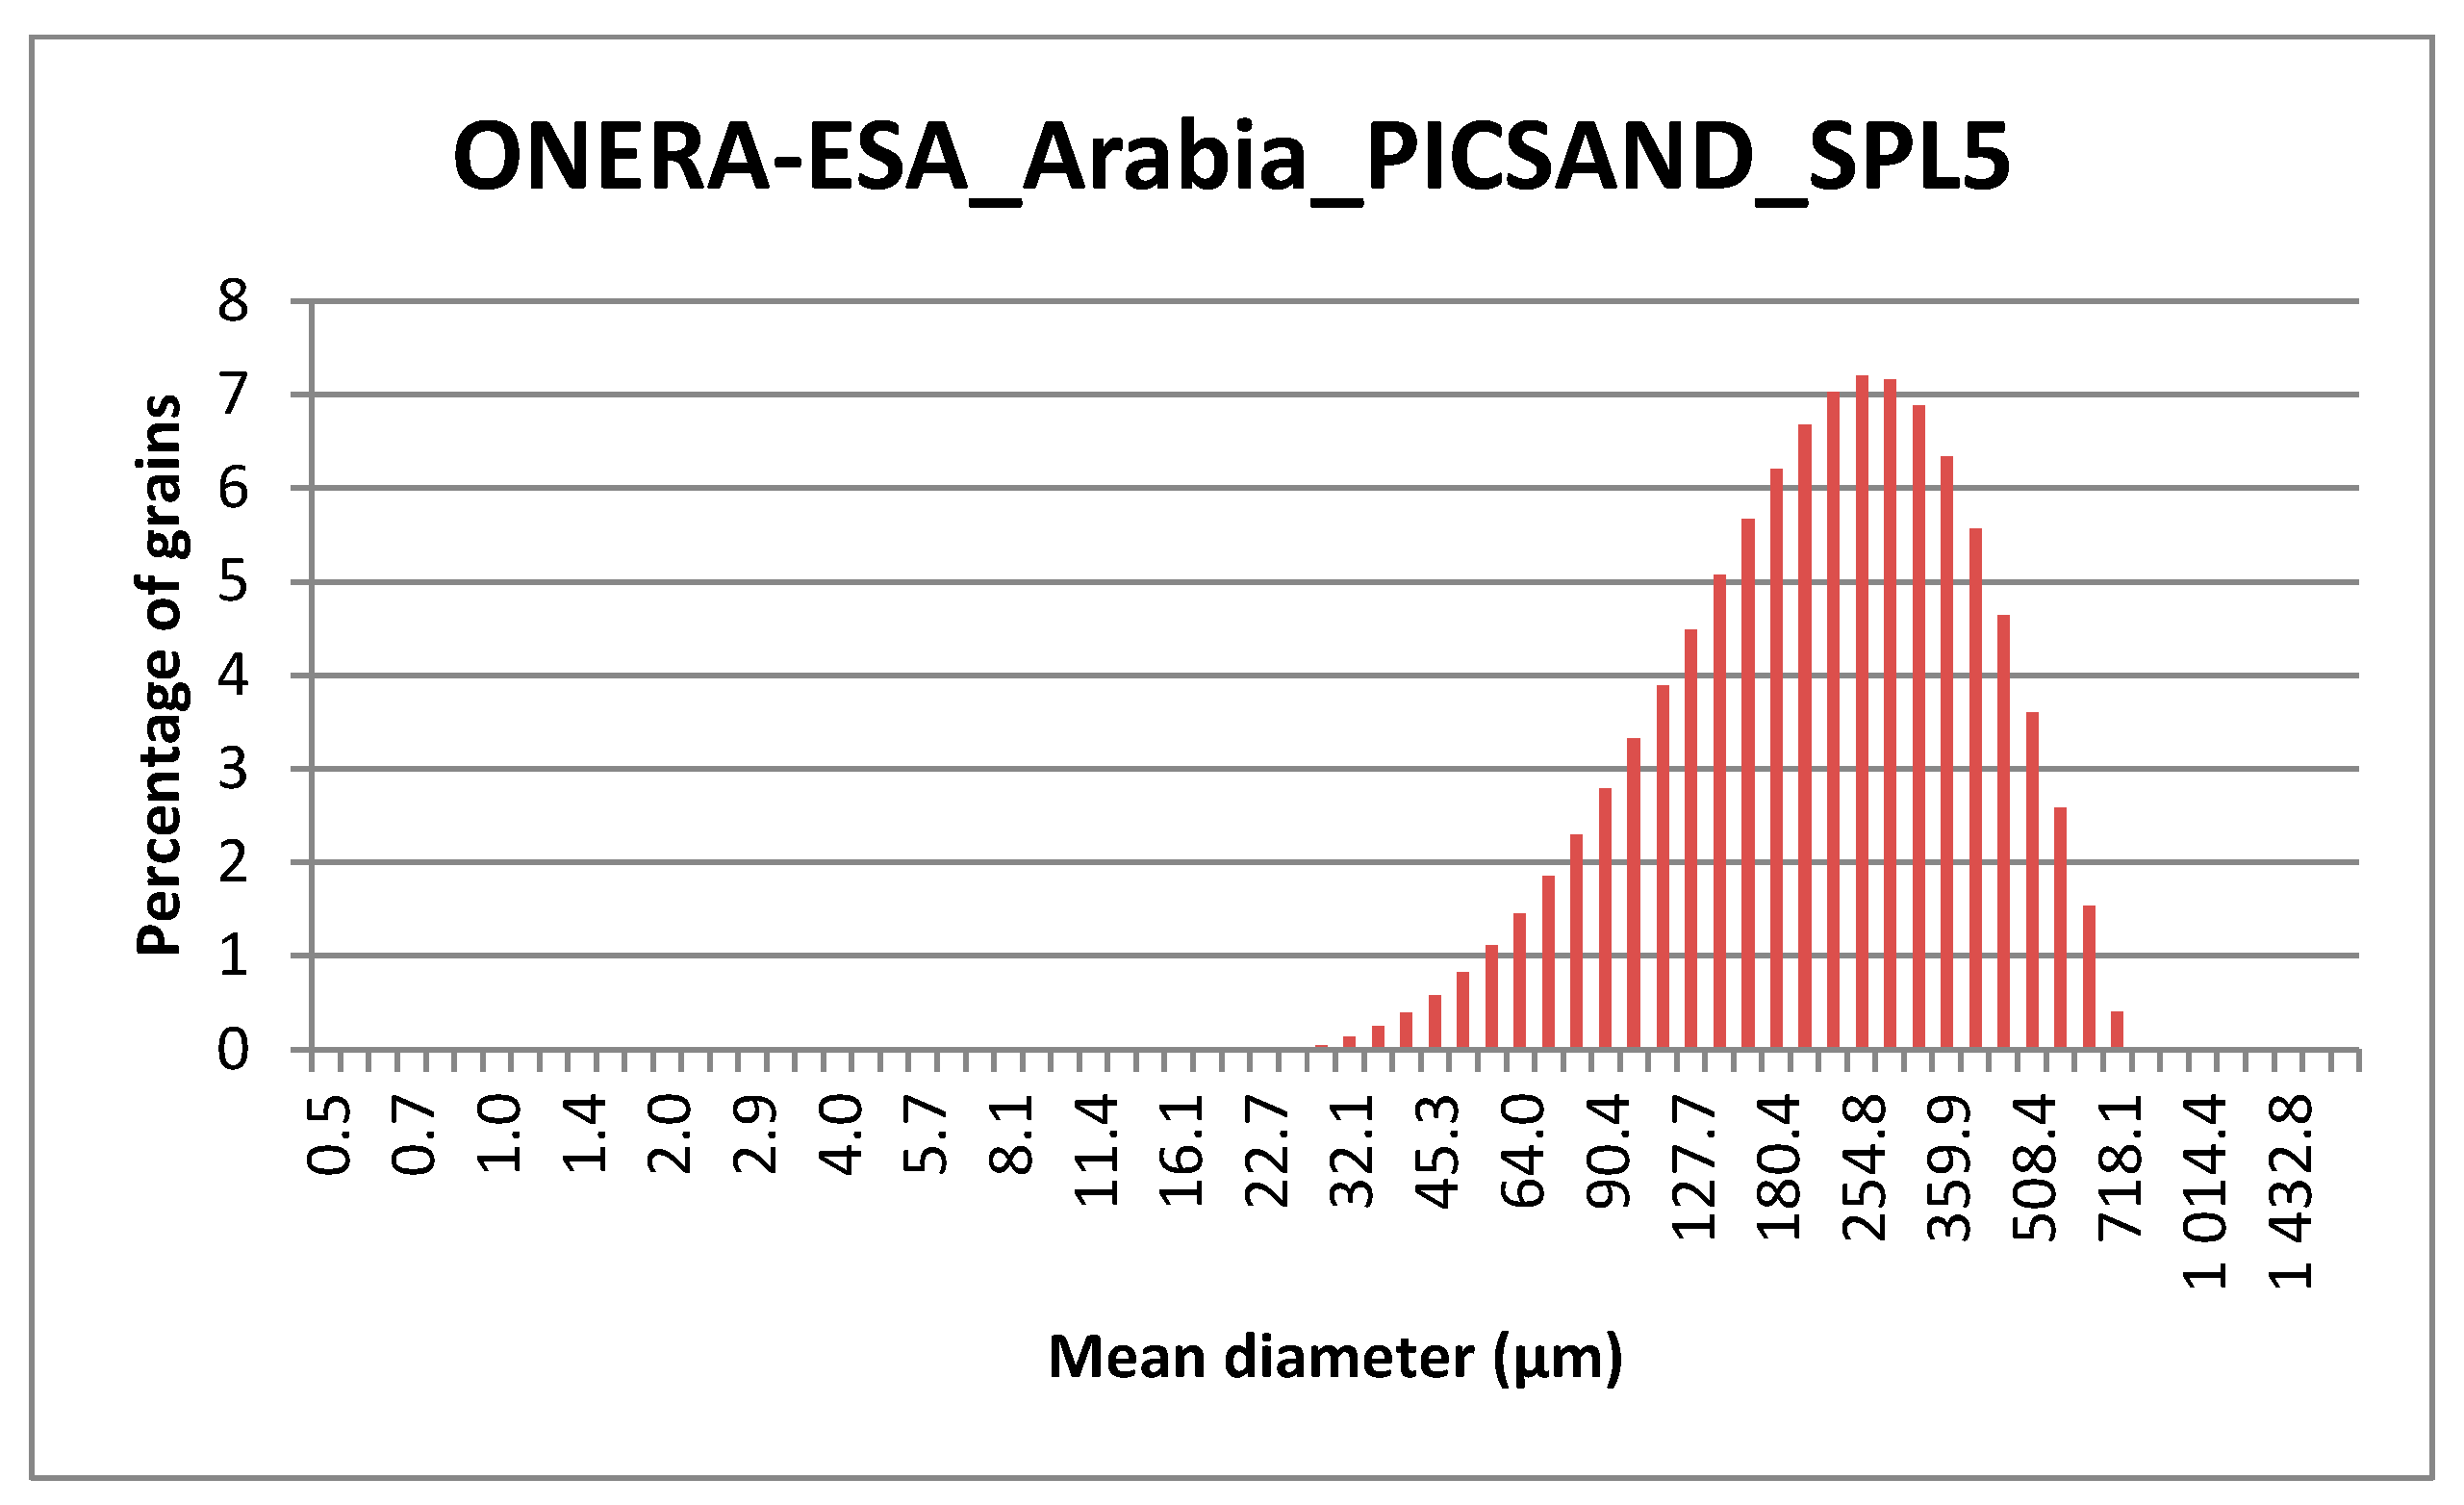
5.4. Grain Size Distribution

The whole results can be found in the database (cf. Section 5.5). For the various samples, Table 5 lists the diameters corresponding to the maximum of the grain size distribution. Note that due to grain diameters below 50 µm, the Rail Road Valley sample cannot be considered as pure sand. The distribution for the Arabia_PICSAND_SPL5 case is given in Figure 18 as an illustration.

5.5. Overview of the PICSAND Database

The measurements for the samples presented in Table 2 have been complemented with other available optical measurements over sand (performed either in situ or in the laboratory) and available in the literature. They are described in Table 6 for spectro-directional datasets and in Table 7 for spectral datasets. The different datasets have been merged into the so-called PICSAND database.
The PICSAND database is freely accessible at https://picsand.noveltis.fr. It is also referenced from the CEOS/IVOS portal: http://calvalportal.ceos.org. The database can be accessed to and explored thanks to a user-friendly interface enabling display (for some predefined conditions for the spectral/spectro-directional figures of the reflectance) and downloaded. A search tool is available in order to filter datasets depending on a few predefined criteria (i.e., spectro-directional vs. spectral data, data associated with the PICS sites or not, in situ measurements vs. laboratory measurements). An example of the polar plot is shown in Figure 19 for the Arabia_PICSAND_SPL5 sample at 600 nm.
The different datasets were processed in order to generate homogenized data files. The processing was performed so that the output data are as close as possible to the original ones, keeping only three significant digits for the reflectance data and removing abnormal reflectance values. In situ measurements can be strongly contaminated by atmospheric absorption in specific absorption bands (water vapor and carbon dioxide mainly). We chose to keep the corresponding measurements, even if very noisy, and hence, likely non-usable. However, we added a ‘quality’ flag (determined empirically based on the reflectance spectral variations), enabling to screen the corresponding measurements, depending on the user’s choice.

6. Discussion

In the previous section, optical, and physical properties of sands were presented. In this section, we discuss the relationship between the spectral shape and the directional behavior and the physical properties of the samples. The section also deals with the relationship between laboratory and space-borne measurements.

6.1. Spectral Shape

Looking at the mineral composition, the paper written by J. E. Bullard and K. White [35] explains the origin of the main features of the spectral reflectance by the chemical composition. The Fe3+–O ultraviolet charge transfer band is at the origin of the low reflectance before 550 nm, and Hematite, as a Fe oxide has a broad crystal field transition around 900 nm. An explanation for the feature around 1400 nm is given in [36] and comes from the hydroxide ion trapped in the silicates.
Besides these specific features, the spectral signature depends on iron oxide coatings of grains, and on grain size and shape. The visual color of the sand is highly correlated with the amount of iron oxide [35].
Regarding the impact of grain size, for a given material, a paper written by G. S. Okin et al. [37] deals with its relationship with reflectance. The reflectance increases between the beginning and the end of the studied sand plume. This is explained by the evolution of the sand grain size along the line of the plume. The smaller grains are transported farther than the bigger ones. Sand samples are taken at different distances to the fields in the line of the plume and analyzed. The analysis confirms that the grain size decreases with an increasing distance. Based on this analysis, the reflectance is computed using a radiative transfer model for various quartz grain sizes µm with a rind of montmorillonite and Hematite. These computations lead to an increasing reflectance with decreasing grain size. It is mentioned that the reflectance depends strongly on the thickness of the grain coating as well as the quartz grain size itself.
Still, regarding the impact of the grain size, G. V. G. Baranoski et al. in 2013 [38] show that the sensitivity of the optical properties varies a lot with the sand and its mineral composition. This study presents the sensitivity of reflectance to grain roundness and sphericity in the visible domain, for three sand samples (one from Australia, one from Peru and one from California). Reflectance computed thanks to the Spectral LIgtht Transfer model for Sand (SPLITS) being in agreement with the measured reflectance, the authors have modified the roundness and sphericity parameters and observed the impact on the reflectance. For these three cases, the impact of the roundness is fairly weak. The impact of sphericity differs from one type of sand to another depending on the way iron oxides are distributed, mixed with the parent material (quartz in these cases) for the Australian sample, half pure and half coated grains for the two other samples.
All this seems to indicate that the spectral shape is mainly driven by the mineralogy of the sample. Table 5 shows the samples ranked according to the grain diameter corresponding to the maximum of the distribution. The order of the samples does not reflect the similarity of the spectral signature. This is in agreement with the previous indications.

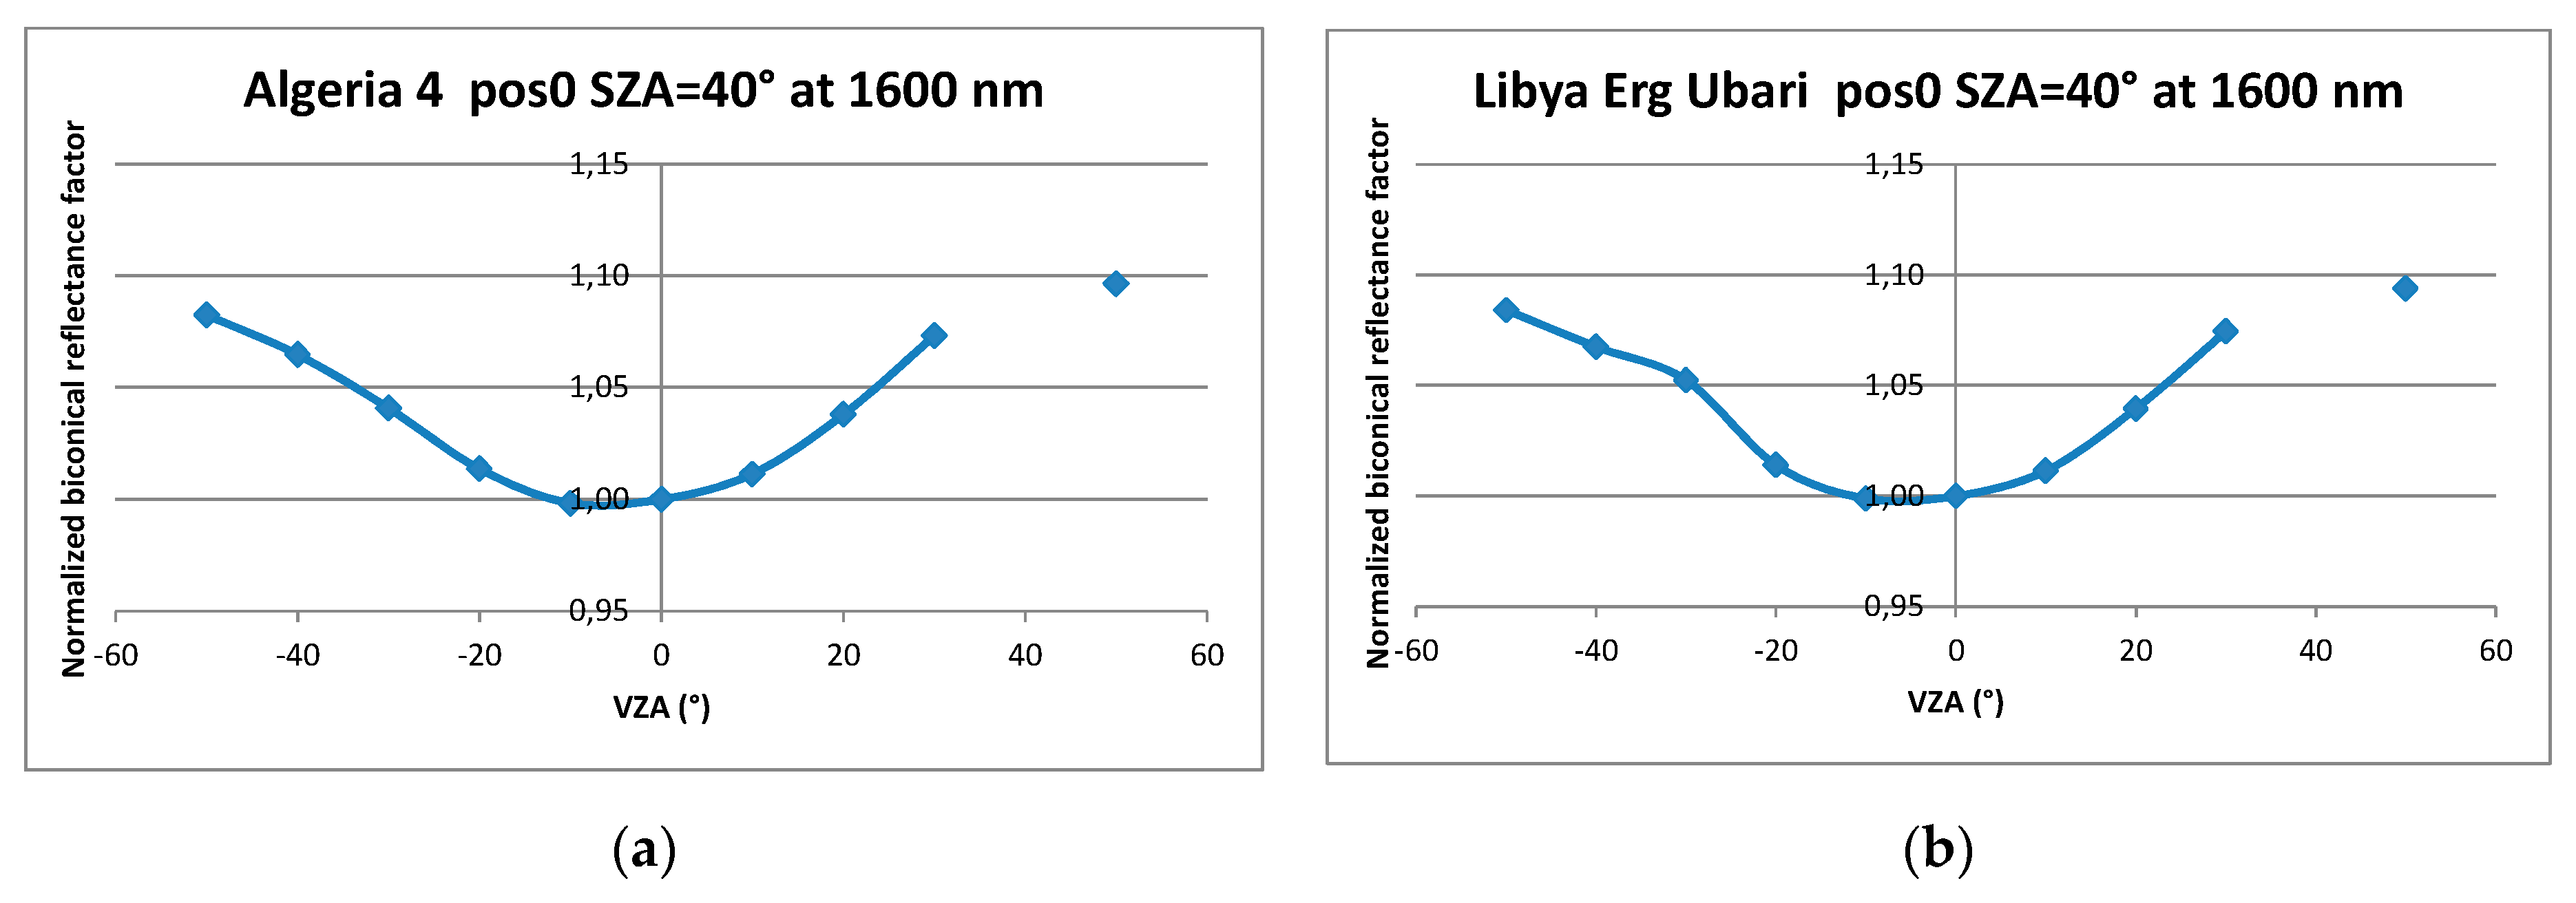
6.2. Directional Effects

As any small particle infers scattering effects, the grain size is expected to impact BCRF directional behavior. For the sand sample, Zhongqiu Sun et al. [28] indicates that the larger the grain size, the larger the directional effects. Moreover, it mentions that the BRF difference due to grain size difference is maximum for the forward direction and minimum for the backscattering direction. In order to try to highlight the relation between grain size and impact of directional effect, the BCRF measured in this study has been normalized by dividing the BCRF by its value for VZA = 0°. In Figure 20, the corresponding normalized BCRF are plotted in the principal plane for two sites with different grain sizes (diameter of 0.13 mm for Algeria4 and 0.32 mm for Libya_Erg_Ubari) for an illumination angle of 40° and at 1600 nm. No clear difference appears between the two curves, which could illustrate the grain size impact on the directional effect.
A paper written by Doctor K. Z. [39] analyzes the dependency of the BCRF on wavelengths for beach sands. The principal component analysis (PCA) of the measurements shows that, when the sand surface is smooth with uniform and fine grain size, the directional signature does not depend on the wavelength (there is just one wavelength cluster in the correlation matrix). When the sand has a visually rough surface, there are three-wavelength clusters in the correlation matrix associated with PCA, and this enables to identify three spectral domains for the BRF directional effects. The general conclusion is that the BRDF of beach sands has weak wavelength dependence, and this dependence increases with the surface visual roughness.

6.3. Relationship between Laboratory and Space-Borne Measurements

Analysis of the spectral and directional signature at the ground sample level allows to some extent to test BRDF modeling assumptions made when trying to retrieve the PICS surface BRDF from space as in [4]. In this paper, the RPV model is retrieved from a time series of the Medium Resolution Imaging Spectrometer (MERIS) measurements in narrow spectral bands, spectrally interpolated and used as a hyperspectral BRDF model for Top Of Atmosphere (TOA) simulations.
Thanks to our measurements of various sand samples, the RPV and the Snyder models are found to be the most representative whatever the sample. The same result was obtained over multi-spectral and multi-directional surface reflectance observations from the POLDER instrument [3], which implies a much larger scale than for a sample. Given the fewer number of parameters to be optimized along with the performance, the RPV model seems to be a better choice than the Snyder one.
Thus coming back to the method described in [4], future work could compare the directional behavior of the RPV surface model retrieved from MERIS measurements and the directional behavior of the RPV model fitted from the laboratory sand sample measurements.
Considering spectral behavior, the spectral variation of the parameters of the RPV model fitted on the samples could be compared to the ones obtained with the fit on MERIS data for the spline spectral interpolation case. If the agreement is good enough, which means that the sample is representative of the mean behavior of the whole site, it could be used to constrain the spectral interpolation. It could also be interesting to compare the spectral reconstruction obtained, either with the database originally used in [2] or with a new database constituted with our measurements, to the spectral behavior of a chosen sample.

7. Conclusions

The presented work results in a database giving access to an unprecedented set of optical and physical properties of various sand samples. This database can be used to check assumptions and enhance radiometric calibration methodology based on PICS. One of the key and practical results of the study concerns the modeling of the BRDF properties of sandy sites. Ignoring the peculiarities of the backscattering direction, the RPV and the Snyder BRDF models provide the highest fitting performances, whatever the site, the tested wavelength, and the observational case: spectro-directional properties derived from satellite measurements or measurements on sand sample carried out in the laboratory.
Although the spatial scale of the sample measured in laboratory (or in-situ) measurement is different from the kilometric spatial resolution of medium resolution space-borne sensor, the sand spectral characteristics stored in the database should be useful to spectrally interpolate the PICS surface BRDF models retrieved from space for some narrow spectral bands. It would allow a more accurate radiometric comparison of sensors as per [4] or [5].
The wealth of the information collected and produced opens large future prospects not only for calibration of earth observation sensors but also for spectro-directional signature analysis aiming at characterizing and understanding the relationship between sample BCRF, grain size, and mineralogy.
We aim in the future at maintaining PICSAND as a living database: anyone willing to contribute to the database is invited to send a first contact email to [email protected].

Author Contributions

F.V.-R. performed the optical measurements for sand samples characterization, processed the data, performed their analysis, conceived and wrote the original draft. C.B. collected and reformatted the other optical measurements included in the PICSAND database. M.B. supervised the work. M.K., M.O. and R.I. collected the Arabian sand samples. L.G. and E.M. developed the PICSAND database. F.L. performed the BBGE characterization and T.R. adapted and run the software to fit the BRDF models to the experimental values.

Funding

The study was funded by ESA (European Space Agency), contract no. 4000116561/16/NL/AF, and performed in the framework of the PICSAND project (“Exploitation of the CEOS Pseudo Invariant Calibration Sites (PICS) for Vicarious Calibration of Optical Imagers”).

Acknowledgments

We wish to acknowledge all the contributors to the database: Jerzy Cierniewski (University in Poznań, Poland) and Arnon Karnieli (Blaustein International Center for Desert Studies, Israel), Craig Coburn (University of Lethbridge, Canada), Jouni Peltoniemi (Finnish Geodetic Institute, Masala, Finland), Peter Roosjen (Laboratory of Geo-Information Science and Remote Sensing, Wageningen University & Research, The Netherlands), Zhongqiu Sun (School of Geographical Science, Northeast Normal University, Changchun, Jilin, China), Hong Zhang, and Zhengchao Chen (Institute of Remote Sensing and Digital Earth, Chinese Academy of Sciences, Beijing, China), Kenneth Voss (University of Miami, Miami, USA) and Hao Zhang (China University of Geosciences, Wuhan, China), Claire Greenwell (National Physical Laboratory, UK), Andreas Hueni (University of Zurich, Switzerland), Kevin White (University of Reading, UK) and Joanna Bullard (Loughborough University, UK), and the sand samples providers: Charles Bristow from the Birkbeck University of London (United Kingdom), Ian Lau from CSIRO (Australia), Laurent Poutier from ONERA (France), Michael Schaepmann from University of Zurich (Switzerland), Kevin White from the University of Reading (United Kingdom), Burton Jones and Wolfgang Heidrich from King Abdullah University of Sciences and Technology (Kingdom of Saudi Arabia) and the French Defense Forces.

Conflicts of Interest

The authors declare no conflict of interest.

References

  1. Cosnefroy, H.; Briottet, X.; Leroy, M.; Lecomte, P.; Santer, R. A field experiment in Saharan Algeria for the calibration of optical sensors. Int. J. Remote Sens. 1997, 18, 3337–3359. [Google Scholar] [CrossRef]
  2. Tanré, D.; Bréon, F.M.; Deuzé, J.L.; Dubovik, O.; Ducos, F.; François, P.; Goloub, P.; Herman, M.; Lifermann, A.; Waquet, F. Remote sensing of aerosols by using polarized, directional and spectral measurements within the A-Train: The PARASOL mission. Atmos. Meas. Tech. 2011, 4, 1383–1395. [Google Scholar] [CrossRef]
  3. Bacour, C.; Briottet, X.; Bréon, F.M.; Viallefont-Robinet, F.; Bouvet, M. Revisiting Pseudo Invariant Calibration Sites (PICS) over sand deserts for vicarious calibration of optical imagers at 20 km and 100 km scales. Remote Sens. 2019, 11, 1166. [Google Scholar] [CrossRef]
  4. Bouvet, M. Radiometric comparison of multispectral imagers over a pseudo-invariant calibration site using a reference radiometric model. Remote Sens. Environ. 2014, 140, 141–154. [Google Scholar] [CrossRef]
  5. Henry, P.; Chander, G.; Fougnie, B.; Thomas, C.; Xiong, X. Assessment of Spectral Band Impact on Intercalibration Over Desert Sites Using Simulation Based on EO-1 Hyperion Data. IEEE Trans. Geosci. Remote Sens. 2013, 51, 1297–1308. [Google Scholar] [CrossRef]
  6. Govaerts, Y.M. Sand dune ridge alignment effects on surface BRF over the Libya-4 CEOS calibration site. Sensors 2015, 15, 3453–3470. [Google Scholar] [CrossRef]
  7. Nicodemus, F.E.; Richmond, J.C.; Hsia, J.J. Geometrical Considerations and Nomenclature for Reflectance; Final Report National Bureau of Standards; Inst. for Basic Standards: Washington, DC, USA, 1977.
  8. Fourest, S.; Briottet, X.; Lier, P.; Valorge, C. Satellite Imagery—From Acquisition Principles to Processing of Optical Images for Observing the Earth; Cépaduès Editions: Toulouse, France, 2012; p. 189. [Google Scholar]
  9. White, K.; Walden, J.; Gurney, S.D. Spectral properties, iron oxide content and provenance of Namib dune sands. Geomorphology 2006, 86, 219–229. [Google Scholar] [CrossRef]
  10. Bialek, A.; Greenwell, C.L.; Lamare, M.; Meygret, A.; Marcq, S.; Lacherade, S.; Woolliams, E.; Berthelot, B.; Bouvet, M.; King, M.; et al. New radiometric calibration site located at Gobabeb, Namib desert. In Proceedings of the IEEE International Geoscience and Remote Sensing Symposium (IGARSS), Beijing, China, 10–15 July 2016; pp. 6094–6097. [Google Scholar]
  11. Radiometric Calibration Network Portal. Available online: https://www.radcalnet.org (accessed on 21 October 2019).
  12. Ong, C.; Caccetta, M.; Lau, I.C.; Ong, L.; Middleton, E. Compositional characterization of the Pinnacles vicarious calibration site. In Proceedings of the IEEE International Geoscience and Remote Sensing Symposium (IGARSS), Fort Worth, TX, USA, 23–28 July 2017; pp. 3059–3062. [Google Scholar]
  13. Ben Dor, E.; Ong, C.; Lau, I.C. Reflectance measurements of soils in the laboratory: standards and protocols. Geoderma 2015, 245, 112–124. [Google Scholar] [CrossRef]
  14. Gellman, D.; Biggar, S.F.; Dinguirard, M.C.; Henry, P.J.; Moran, M.S.; Thome, K.J.; Slater, P.N. Review of SPOT-1 and -2 calibrations at White Sands from launch to the present. SPIE 1993, 1938, 118–125. [Google Scholar]
  15. Czapla-Myers, J.; Mc Corkel, J.; Anderson, N.; Biggar, S. Earth observing satellite intercomparison using the radiometric calibration test site at railroad Valley. J. Appl. Remote Sens. 2017, 12, 012004. [Google Scholar] [CrossRef]
  16. Boucher, Y.; Cosnefroy, H.; Petit, D.; Serrot, G.; Briottet, X. Comparison of Measured and Modeled BRDF of Natural Targets. In Proceedings of the SPIE Annual International Symposium AeroSense’99, Orlando, FL, USA, 5–9 April 1999; Volume 3699. [Google Scholar]
  17. Maignan, F.; Bréon, F.M.; Lacaze, R. Bidirectional reflectance of Earth targets: Analytical modeling and validation against a large data set of satellite measurements with emphasis on the Hot Spot. Remote Sens. Environ. 2004, 90, 210–220. [Google Scholar] [CrossRef]
  18. Roujean, J.L.; Leroy, M.; Deschamps, P.Y. A bidirectional reflectance model of the Earth’s surface for the correction of remote sensing data. J. Geophys. Res. 1992, 97, 455–468. [Google Scholar] [CrossRef]
  19. Rahman, H.; Pinty, B.; Verstraete, M.M. Coupled Surface-Atmosphere Reflectance (CSAR) Model 2. Semiempirical Surface Model Usable with NOAA Advanced Very High Resolution Radiometer Data. J. Geophys. Res. 1993, 98, 791–801. [Google Scholar] [CrossRef]
  20. Snyder, W.C.; Wan, Z. BRDF models to predict spectral reflectance and emissivity in the thermal intrared. IEEE Trans. Geosci. Remote Sens. 1998, 36, 214–225. [Google Scholar] [CrossRef]
  21. Press, W.E.; Teukolsky, S.A.; Vetterling, W.T.; Flannery, B.P. Downhill Simplex method in multidimensions. In Numerical Recipies in C: The Art of Scientific Computing, 2nd ed.; Cambridge University Press: New York, NY, USA, 1995; pp. 305–309. ISBN 0-521-43108-5. [Google Scholar]
  22. von Schönermark, M.; Geiger, B.; Röser, H.P. Reflection Properties of Vegetation and Soil; Wissenschaft und Technik Verlag: Berlin, Germany, 2004; pp. 259–286. ISBN 3-89685-565-4. [Google Scholar]
  23. Cierniewsky, J.; Karnieli, A. Virtual surfaces simulating the bidirectional reflectance of semiarid soils. Int. J. Remote Sens. 2003, 24, 1469–1486. [Google Scholar] [CrossRef]
  24. Coburn, C.; Gordon, S.; Logie, J. Temporal dynamics of sand dune bidirectional reflectance characteristics for absolute radiometric calibration of optical remote sensing data. Appl. Remote Sens. 2017, 12, 012006. [Google Scholar] [CrossRef]
  25. Suomalainen, J.; Hakala, T.; Peltoniemi, J.I.; Puttonen, E. Polarised multiangular reflectance measurements using the Finnish Geodetic Institute Field Goniospectrometer. Sensors 2009, 9, 3891–3907. [Google Scholar] [CrossRef]
  26. Peltoniemi, J.I.; Piironen, J.; Näränen, J.; Suomalainen, J.; Kuittinen, R.; Markelin, L.; Honkavaara, E. Bidirectional reflectance spectrometry of gravel at the Sjökulla test field. ISPRS J. Photogramm. Remote Sens. 2007, 62, 434–446. [Google Scholar] [CrossRef]
  27. Rosjen, P.P.J.; Bartholomeus, H.M.; Clevers, J.G.P.W. Effects of soil moisture content on reflectance anisotropy—Laboratory goniometer measurements and RAHMAN model inversions. Remote Sens. Environ. 2015, 170, 229–238. [Google Scholar] [CrossRef]
  28. Sun, Z.; Lv, Y.; Tong, Z. Effects of particle size on bidirectional reflectance factor measurements from particulate surface. Opt. Express 2016, 24, 612–634. [Google Scholar] [CrossRef]
  29. Zhang, H.; Voss, K.J. Bidirectional reflectance study on dry, wet, and submerged particulate layers: Effects of pore liquid refractive index and translucent particle concentrations. Appl. Opt. 2006, 45, 8753–8763. [Google Scholar] [CrossRef] [PubMed]
  30. Chen, Z.C.; Zhang, B.; Zhang, H. Vicarious Calibration of Beijing-1 Multispectral Imagers. Remote Sens. 2014, 6, 1432–1450. [Google Scholar] [CrossRef] [Green Version]
  31. Baldridge, A.M.; Hook, S.J.; Grove, C.I.; Rivera, G. The ASTER Spectral Library Version 2.0. Remote Sens. Environ. 2009, 113, 711–715. [Google Scholar] [CrossRef]
  32. Kokaly, R.F.; Clark, R.N.; Swayze, G.A.; Livo, K.E.; Hoefen, T.M.; Pearson, N.C.; Wise, R.A.; Benzel, W.M.; Lowers, H.A.; Driscoll, R.L.; et al. USGS Spectral Library Version 7: U.S. Geological Survey Data Series; US Geological Survey: Reston, VA, USA, 2017.
  33. Hueni, A.; Damm, A.; Kneubuehler, M.; Schläpfer, D.; Schaepman, M. Field and Airborne Spectroscopy Cross-Validation-Some Considerations. IEEE J. Sel. Top. Appl. Earth Obs. Remote Sens. 2017, 10, 1117–1135. [Google Scholar] [CrossRef]
  34. White, K.; Bullard, J.E. Abrasion control on dune color: Muleshoe Dunes, SW USA. Geomorphology 2009, 105, 59–66. [Google Scholar] [CrossRef]
  35. Bullard, J.E.; White, K. Quantifying iron oxide coatings on dune sands using spectrometric measurements: an example from the Simpson-Strzelecki desert, Australia. J. Geophys. Res. 2002, 107, ECV-5. [Google Scholar] [CrossRef]
  36. Miesch, C.; Cabot, F.; Briottet, X.; Henry, P.J. Assimilation of satellite data over Saharian desert for inercalibration of optical satellite sensors. In Sensors, Systems, and Next-Generation Satellites V; SPIE: Toulouse, France, 12 December 2001; Volume 4550. [Google Scholar]
  37. Okin, G.S.; Painter, T. Effect of grain size on remotely sensed spectral reflectance of sandy desert surfaces. Remote Sens. Environ. 2004, 89, 272–280. [Google Scholar] [CrossRef]
  38. Baranoski, G.V.G.; Kimmel, B.W.; Chen, T.F.; Miranda, E.; Yim, D. Effects of sand grain shape on the spectral signature of sandy landscapes in the visible domain. In Proceedings of the IEEE International Geoscience and Remote Sensing Symposium—IGARSS, Melbourne, Australia, 21–26 July 2013. [Google Scholar]
  39. Doctor, K.Z.; Bachmann, C.M.; Gray, D.J.; Montes, M.J.; Fusina, R.A. Wavelength dependence of the bidirectional reflectance distribution function (BRDF) of beach sands. Appl. Opt. 2015, 54, 243–255. [Google Scholar] [CrossRef]
Figure 1. Measurement devices: (a) ONERA BCRF measurement device named “Banc de BRDF grands échantillons”; (b) 1 geometry BCRF measurement set up using a contact probe.
Remotesensing 11 02446 g001
Figure 2. Examples of sand samples: (a) Namibia_RadCalNet; (b) Arabia_PICSAND1_SPL5.
Remotesensing 11 02446 g002
Figure 3. Measurements discrepancy for the three positions compared to one measurement (pos0) uncertainty for Arabia_PICSAND1_SPL5.
Remotesensing 11 02446 g003
Figure 4. Spectral variation of BCRF for the Namibia_RadCalNet sample for the three positions.
Remotesensing 11 02446 g004
Figure 5. Algeria5_PICSCEOS BCRF discrepancy between samples compared to one measurement uncertainty.
Remotesensing 11 02446 g005
Figure 6. Arabia_PICSAND1 BCRF discrepancy between samples compared to one measurement uncertainty.
Remotesensing 11 02446 g006
Figure 7. Spectral variation of BCRF for the Australian Pinnacles Desert sand samples.
Remotesensing 11 02446 g007
Figure 8. Spectral comparison between various sites.
Remotesensing 11 02446 g008
Figure 9. Spectral variation of BCRF for some of the small sand samples.
Remotesensing 11 02446 g009
Figure 10. Spectral variation of BCRF for the Australian Internal Soil Standard (ISS) samples.
Remotesensing 11 02446 g010
Figure 11. BCRF for the minimum (10°) and the maximum (60°) solar zenith angles, in the principal plane, for Algerian samples: (a) Algeria3;(b) Algeria4; (c) Algeria5 sample 1; (d) Algeria5 sample 2; (e) Algeria5 sample 3.
Remotesensing 11 02446 g011
Figure 12. BCRF for the minimum (10°) and the maximum (60°) solar zenith angles, in the principal plane, for Arabian samples: (a) sample 1; (b) sample 2; (c) sample 3; (d) sample 4; (e) sample 5; (f) sample 6.
Remotesensing 11 02446 g012aRemotesensing 11 02446 g012b
Figure 13. BCRF for the minimum (10°) and the maximum (60°) solar zenith angles, in the principal plane, for: (a) Libya; (b) Morocco.
Remotesensing 11 02446 g013
Figure 14. BCRF for the minimum (10°) and the maximum (60°) solar zenith angles, in the principal plane, for Namibian sites near Gobabeb: (a) dunes; (b) RadCalNet.
Remotesensing 11 02446 g014
Figure 15. BCRF for the minimum (10°) and the maximum (60°) solar zenith angles, in the principal plane, for Nigerian site near Niamey.
Remotesensing 11 02446 g015
Figure 16. Arabia_PICSAND1 _SPL1 residual RMSD between the measured BCRF in the six POLDER wavelengths plus two wavelengths in the SWIR (1600 and 2200 nm) for the three rotating positions, and the four fitted BRDF models.
Remotesensing 11 02446 g016
Figure 17. Arabia_PICSAND1_SPL5 measured (cross) and modeled (dot) BCRF for SZA = 10 and VZA = 60°, wavelength = 670 (in blue) and 875 nm (in red).
Remotesensing 11 02446 g017
Figure 18. Grain size distribution for the Arabia_PICSAND_SPL5 sample.
Remotesensing 11 02446 g018
Figure 19. Polar diagram of the BCRF measured with BBGE for the Arabia_PICSAND1_SPL5 sand sample (position at 0°) and for an illumination angle (SZA) of 40°.
Remotesensing 11 02446 g019
Figure 20. Normalized BCRF for Algeria4 (a) and Libya Erg Ubari (b) in the principal plane.
Remotesensing 11 02446 g020
Table 1. Illustration of various kinds of reflectance (extracted from [8]).
Incidence (In Blue)\Reflection (In Red)DirectionalConicalHemispherical
Directional Remotesensing 11 02446 i001 Remotesensing 11 02446 i002 Remotesensing 11 02446 i003
Conical Remotesensing 11 02446 i004 Remotesensing 11 02446 i005 Remotesensing 11 02446 i006
Hemispherical Remotesensing 11 02446 i007 Remotesensing 11 02446 i008 Remotesensing 11 02446 i009
Table 2. Overview of the sand samples. Samples coming from a PICS of the CEOS list appear in the green cells. Samples coming from a site identified as a potential PICS by [3] appear in the purple cells and are referred to as PICSAND (the name of the database). Samples close to a PICS or a PICSAND site appear in the orange cells.
Sample IDProviderLatitude/LongitudeSite NearbyMeasurement
ONERA_Algeria3_PICSCEOSONERA29.34 N/7.33 EAlgeria3BCRF
ONERA_Algeria4_PICSCEOSONERA29.84 N/5.78 EAlgeria4BCRF
ONERA-Bristow_Algeria5_PICSCEOS_SPL1C. Bristow30.5783 N/2.3468 EAlgeria5BCRF
ONERA-Bristow_Algeria5_PICSCEOS_SPL2C. Bristow30.5920 N/2.1012 EAlgeria5BCRF
ONERA-Bristow_Algeria5_PICSCEOS_SPL3C. Bristow30.7344 N/2.7814 EAlgeria5BCRF
ONERA-ESA_Arabia_PICSAND1_SPL1M. Kheireddine29.4823 N/41.1445 EArabia_PICSAND1BCRF
ONERA-ESA_Arabia_PICSAND1_SPL2M. Kheireddine29.4791 N/41.1401 EArabia_PICSAND1BCRF
ONERA-ESA_Arabia_PICSAND1_SPL3M. Kheireddine29.4404 N/41.1710 EArabia_PICSAND1BCRF
ONERA-ESA_Arabia_PICSAND1_SPL4M. Kheireddine29.4403 N/41.1708 EArabia_PICSAND1BCRF
ONERA-ESA_Arabia_PICSAND1_SPL5M. Kheireddine29.4394 N/41.1700 EArabia_PICSAND1BCRF
ONERA-ESA_Arabia_PICSAND1_SPL6M. Kheireddine29.33475 N/41.3207 EArabia_PICSAND1BCRF
ONERA-White_Namibia_LUD1K. White-26.6849 N/15.2071 ENamibia_PICSAND11 geometry BCRF
ONERA-White_Namibia_LUD3K. White−26.7245 N/15.3104 ENamibia_PICSAND11 geometry BCRF
ONERA-White_Namibia_SOSS2K. White−24.7234 N/15.3174 ENamibia_PICSAND11 geometry BCRF
ONERA-White_Namibia_SOSS10K. White−24.4578 N/15.7765 ENamibia_PICSAND11 geometry BCRF
ONERA_Namibia_Gobabeb_DunesL. Poutier−23.5699 N/15.0434 E BCRF
ONERA-CNES_Namibia_RadCalNetS. Marq BCRF
ONERA-Lau_Australia_PIN01I. Lau−30.5900 N/115.15675 E 1 geometry BCRF
ONERA-Lau_Australia_PIN02I. Lau−30.5846 N/115.1496 E 1 geometry BCRF
ONERA-Lau_Australia_PIN03I. Lau−30.5844 N/115.1492 E 1 geometry BCRF
ONERA-Lau_Australia_PIN04I. Lau−30.5824 N/115.1468 E 1 geometry BCRF
ONERA-Lau_Australia_PIN05I. Lau−30.5810 N/115.1452 E 1 geometry BCRF
ONERA-Lau_Australia_PIN06I. Lau−30.5829 N/115.1472 E 1 geometry BCRF
ONERA-Lau_Australia_Lucky_BayI. Lau−33.9877 N/122.2308 E 1 geometry BCRF
ONERA-Lau_Australia_Wylie_BayI. Lau−33.8247 N/121.9975 E 1 geometry BCRF
ONERA-Schaepman_Libya_Erg_UbariM. Schaepman BCRF
ONERA-Bristow_Libya_Fezzan_FezzC. Bristow 1 geometry BCRF
ONERA-Bristow_Morocco_Erg_ChebbiC. Bristow BCRF
ONERA_Niger_NiameyFrench Defence Forces BCRF
ONERA-Thome_USA_Railroad_ValleyK. Thome 1 geometry BCRF
ONERA-Thome_USA_White_SandsK. Thome 1 geometry BCRF
Table 3. List of the BRDF models and their characteristics.
Model NameNumber of Fitting ParametersParameter DependencyReference
Ross–Li–Maignan3linear[17]
Roujean3linear[18]
RPV4nonlinear[19]
Snyder7nonlinear[20]
Table 4. Mineralogy of sample ONERA-ESA_ArabiaPICS2_PICSAND_SPL5.
PhasesWeight %Error (Weight %)
Quartz873
3
5
3
Potassium feldspar (microcline and orthoses)10
Kaolinite2
Spinel (chromite on the diffractogram)1
Illite and micasIn traces
UlvospinelIn traces
Plagioclase (albite on the diffractogram)In traces
Table 5. Diameter corresponding to the maximum grain size distribution for the various samples.
SampleDiameter of the Maximum of Grain Size Histogram (µm)
ONERA-Thome_USA_Rail_Road_Valley50.8
ONERA_Namibia_RadCalNet113.8
ONERA_Algeria4_PICSCEOS127.7
ONERA-Bristow_Algeria5_PICSCEOS_SPL3143.3
ONERA-White_Namibia_LUD1143.3
ONERA-Thome_USA_White_Sands143.3
ONERA-ESA_Arabia_PICSAND1_SPL6160.8
ONERA_Algeria3_PICSCEOS180.4
ONERA-White_Namibia_LUD3180.4
ONERA_Namibia_Gobabeb_Dunes202.4
ONERA-Lau_Australia_Wylie_Bay202.4
ONERA-Bristow_Algeria5_PICSCEOS_SPL1227.1
ONERA-Bristow_Algeria5_PICSCEOS_SPL2227.1
ONERA-ESA_Arabia_PICSAND1_SPL4227.1
ONERA-White_Namibia_SOSS2227.1
ONERA-White_Namibia_SOSS10227.1
ONERA-Bristow_Morocco_Erg_Chebbi227.1
ONERA-ESA_Arabia_PICSAND1_SPL1254.8
ONERA-ESA_Arabia_PICSAND1_SPL2254.8
ONERA-ESA_Arabia_PICSAND1_SPL3254.8
ONERA-ESA_Arabia_PICSAND1_SPL5254.8
ONERA_Niger_Niamey254.8
ONERA-Lau_Australia_PIN002285.9
ONERA-Schaepman_Libya_Erg_Ubari320.8
ONERA-Bristow_Libya_Fezzan_Fezz403.8
ONERA-Lau_Australia_PIN005403.8
Table 6. Characteristics of the datasets with spectro-directional measurements. The measured quantities are either BCRF or HCRF (Hemispherical Conical Reflectance Factor).
PI/ReferenceCountrySite CharacteristicsMeas. ConditionMeasured QuantitySpectral Range (nm)Directional Range
ONERA [22]FranceAlgier/NarbonnelaboratoryBCRF520–910 SZA [0,60]
VZA [0–90] (10° step)
VAA [0–180] (10° step)
Cierniewski-Karnieli [23]IsraelNegev desertlaboratoryHCRF/BCRF relative to nadir450, 550, 650, 850, 1650principal plane
Coburn [24]USAAlgodones Dunesin situHCRF/BCRF400–900 SZA [Diurnal set]
VZA [0,60] (10° step) and [0,30] (5° step)
VAA [0,360] (10° step)
Peltoniemi [25,26]Finlandbeach, football, car parkin situHCRF/BCRF350–2500 SZA (sun)
VZA [0°–62°]
VAA [0°–180°]
Roosjen [27]Netherlandssand, sandy loamlaboratoryBCRF350–2499 SZA [30]
Principal plane: VZA [0–65] (5° step); VAA [0–180] (180° step)
Other azimuth angles: VZA [0–60] (15° step); VAA [0–180] (30° step).
Additional measurements around the hotspot position.
Sun [28]ChinaXianjiamu Sumu/3 grain sizeslaboratoryBCRF400–2500SZA [40,60]
VZA [0–60] (10° step)
VAA [180–360] (15° step)
Zhang/Voss [29]USAsand beach + White sandslaboratoryBCRF475, 658 SZA [0,5,15,25,35,45,55,65]; VZA [min 5–max 65] (5–15° step); VAA [min ±5–max ±180] (5–15° step)
Zhang [30]ChinaDunhuang sitein situBCRF relative to nadir399–2386 SZA [0,60] deg; VZA [0–70] (14° step); relative azimuth angles from 0° to 150° at steps of 30°
Table 7. Characteristics of the datasets with spectral only measurements. The measured quantities are either BCRF or DHRF (Directional Hemispherical Reflectance Factor).
PI/ReferenceCountryCharacteristicsMeas. ConditionMeasured QuantitySpectral Domain (nm)
ASTER [31] in situDHRF400–14011
USGS [32]USA in situBCRF350–2500
Hueni [33]Swisssand (bright, coarse, fine, dark)in situBCRF350–2500
NPL [10]Namibiadifferent soil colorsin situBCRF380–2500
White, Bullard [34]USAMuleshoe Dunesin situBCRF400–2500

