Discovering Potential Settlement Areas around Archaeological Tells Using the Integration between Historic Topographic Maps, Optical, and Radar Data in the Northern Nile Delta, Egypt

 , ,
, ,
Abstract
:
1. Introduction
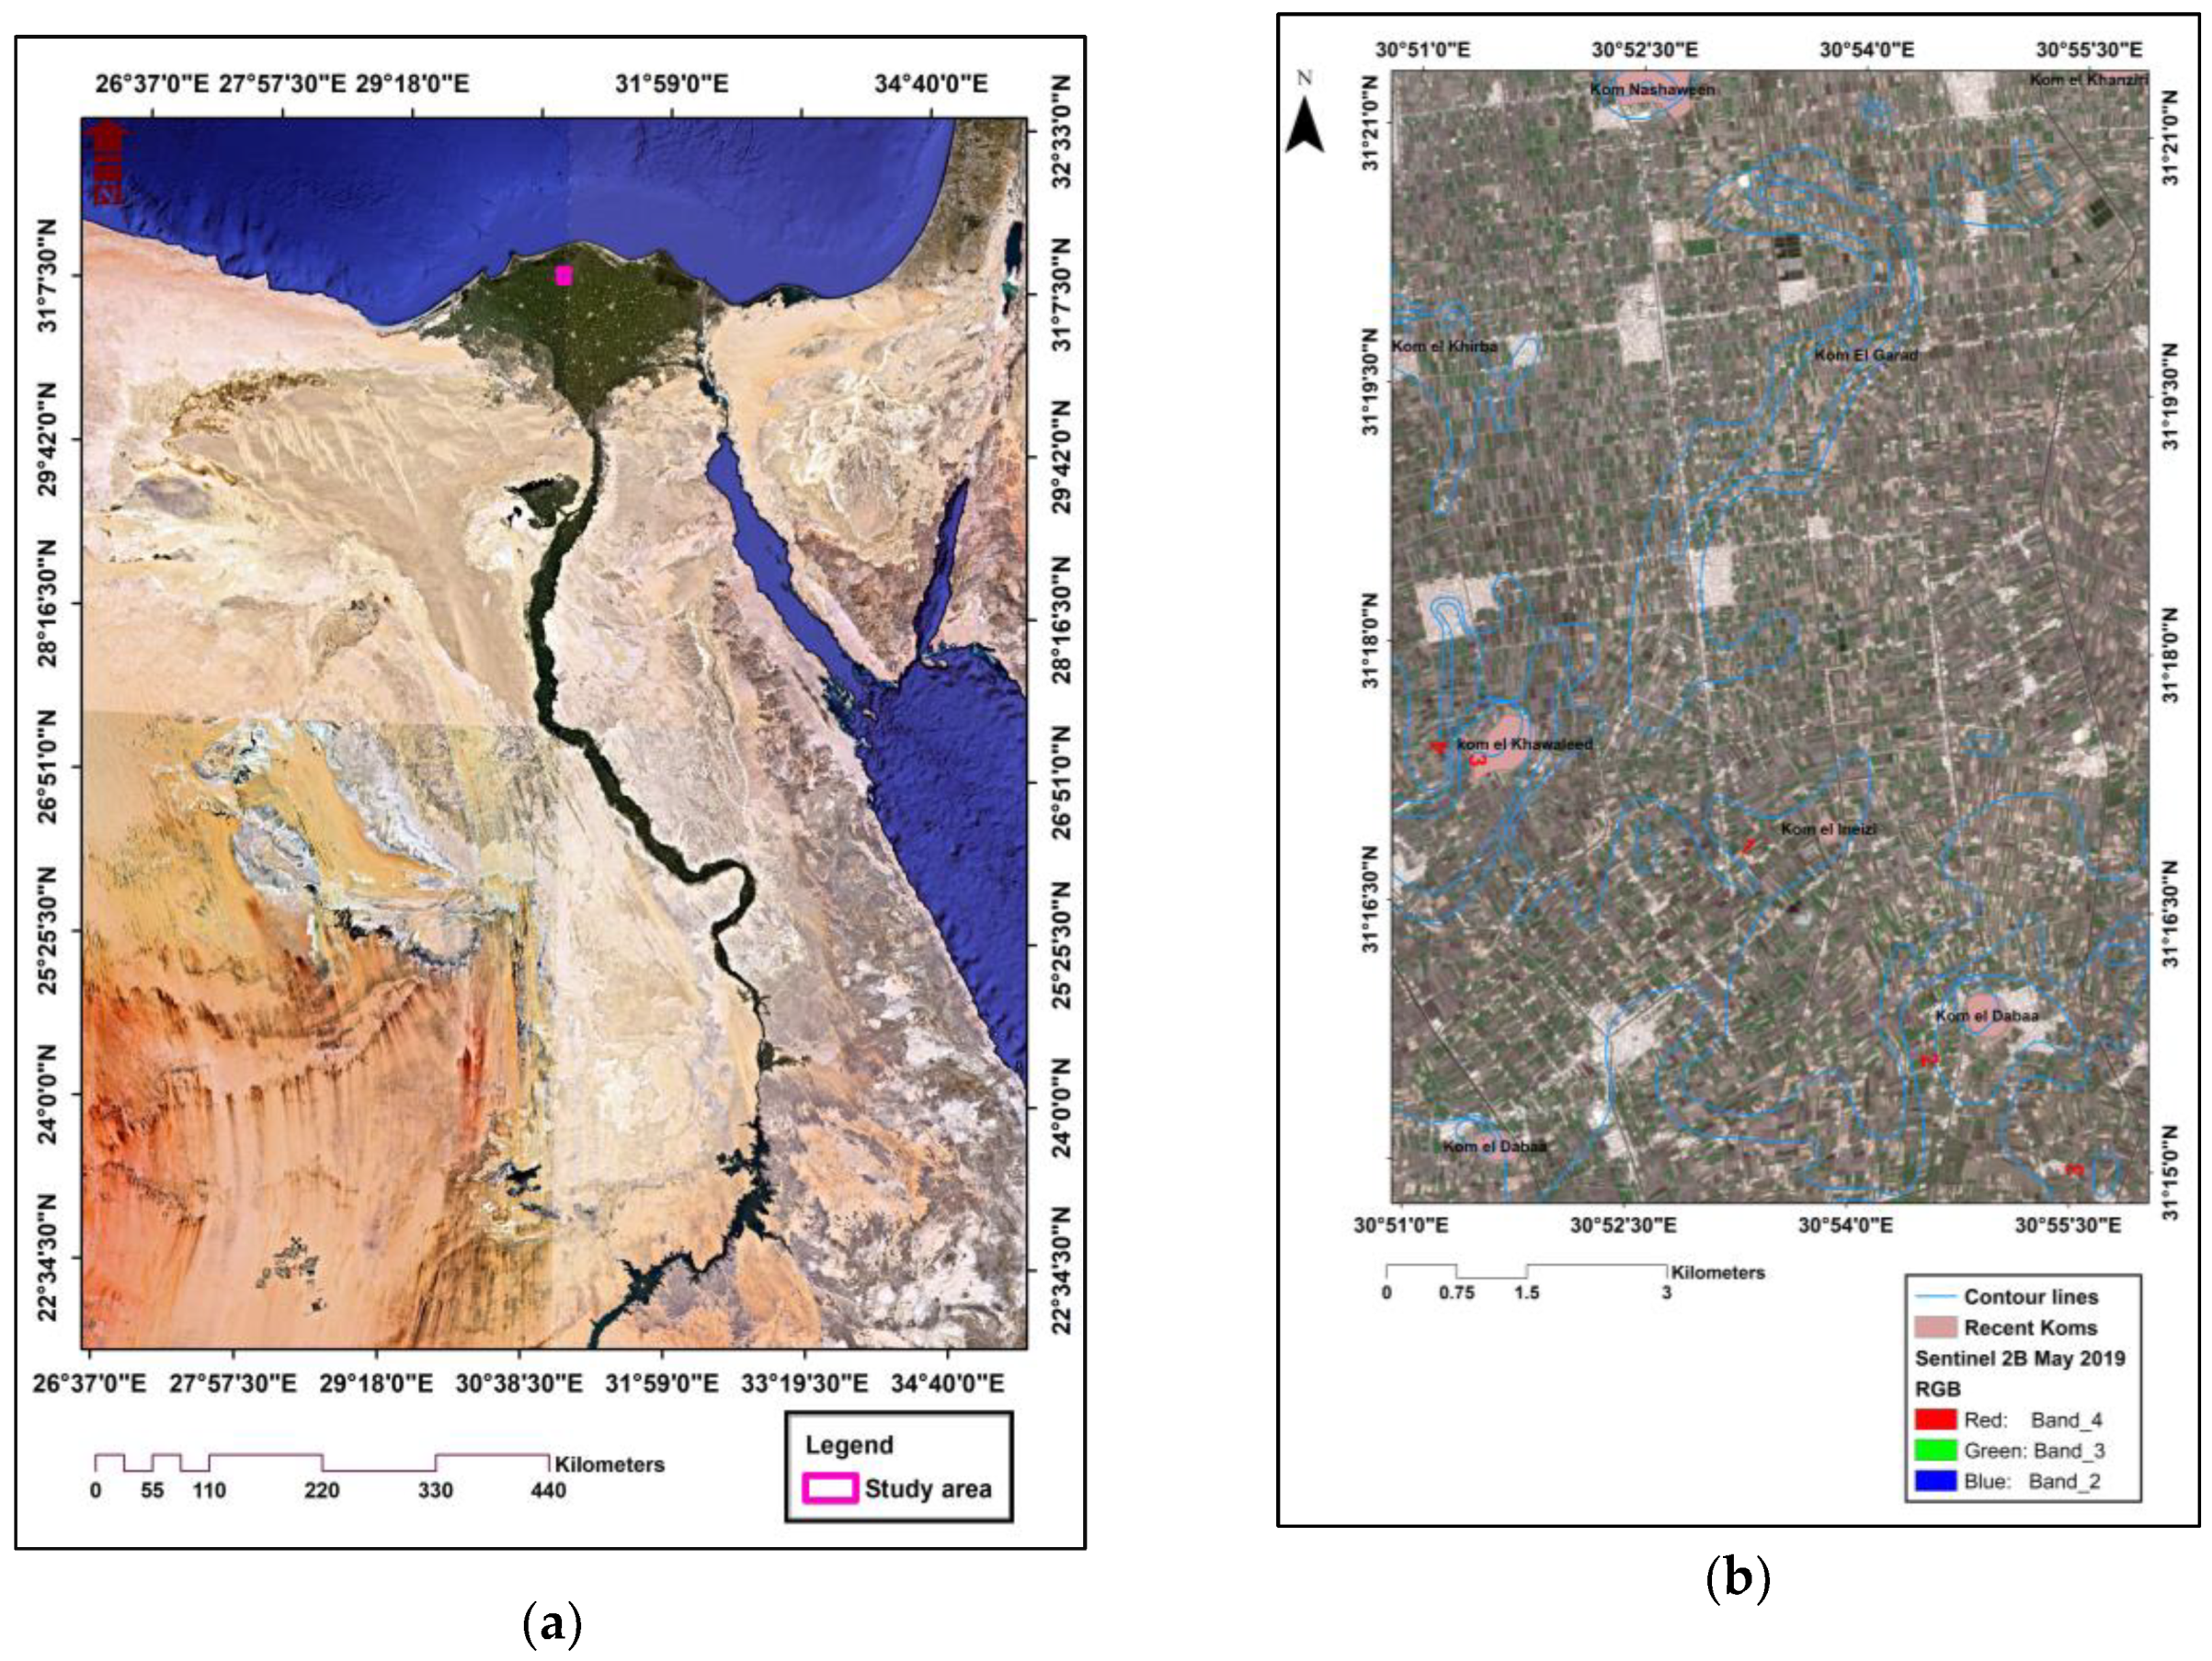
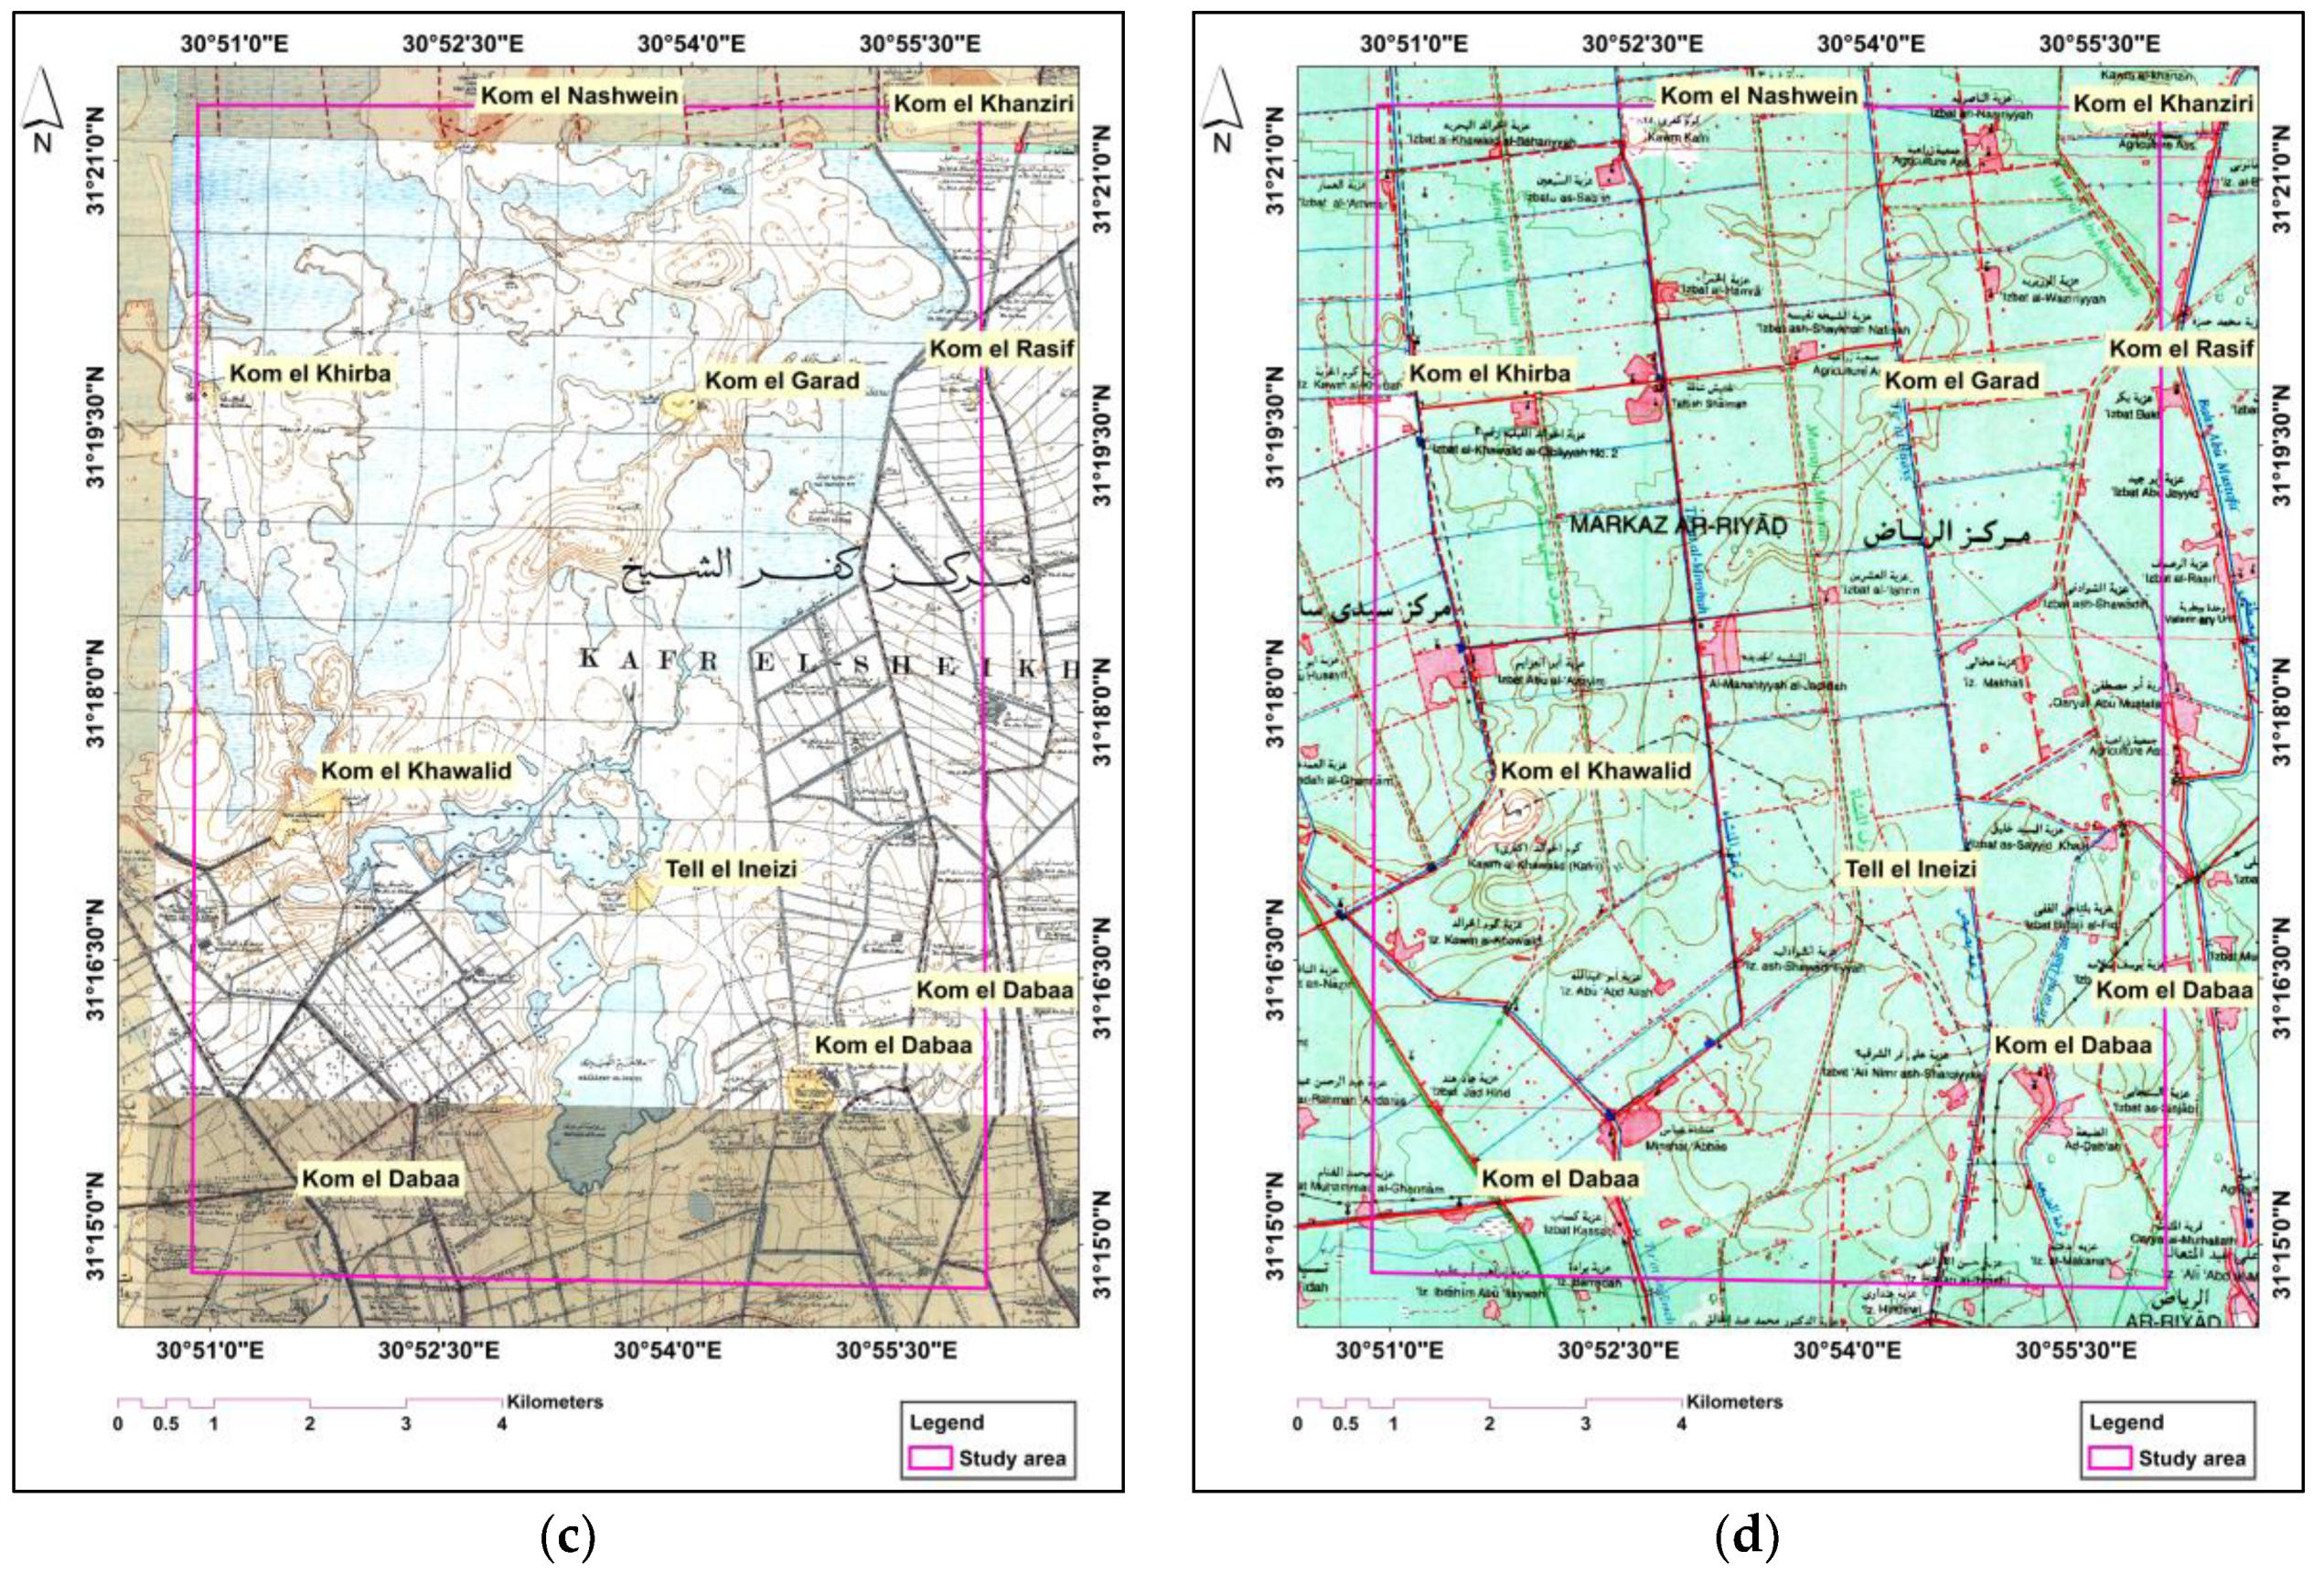
Study Area
2. Materials and Methods
2.1. Materials
2.2. Methods
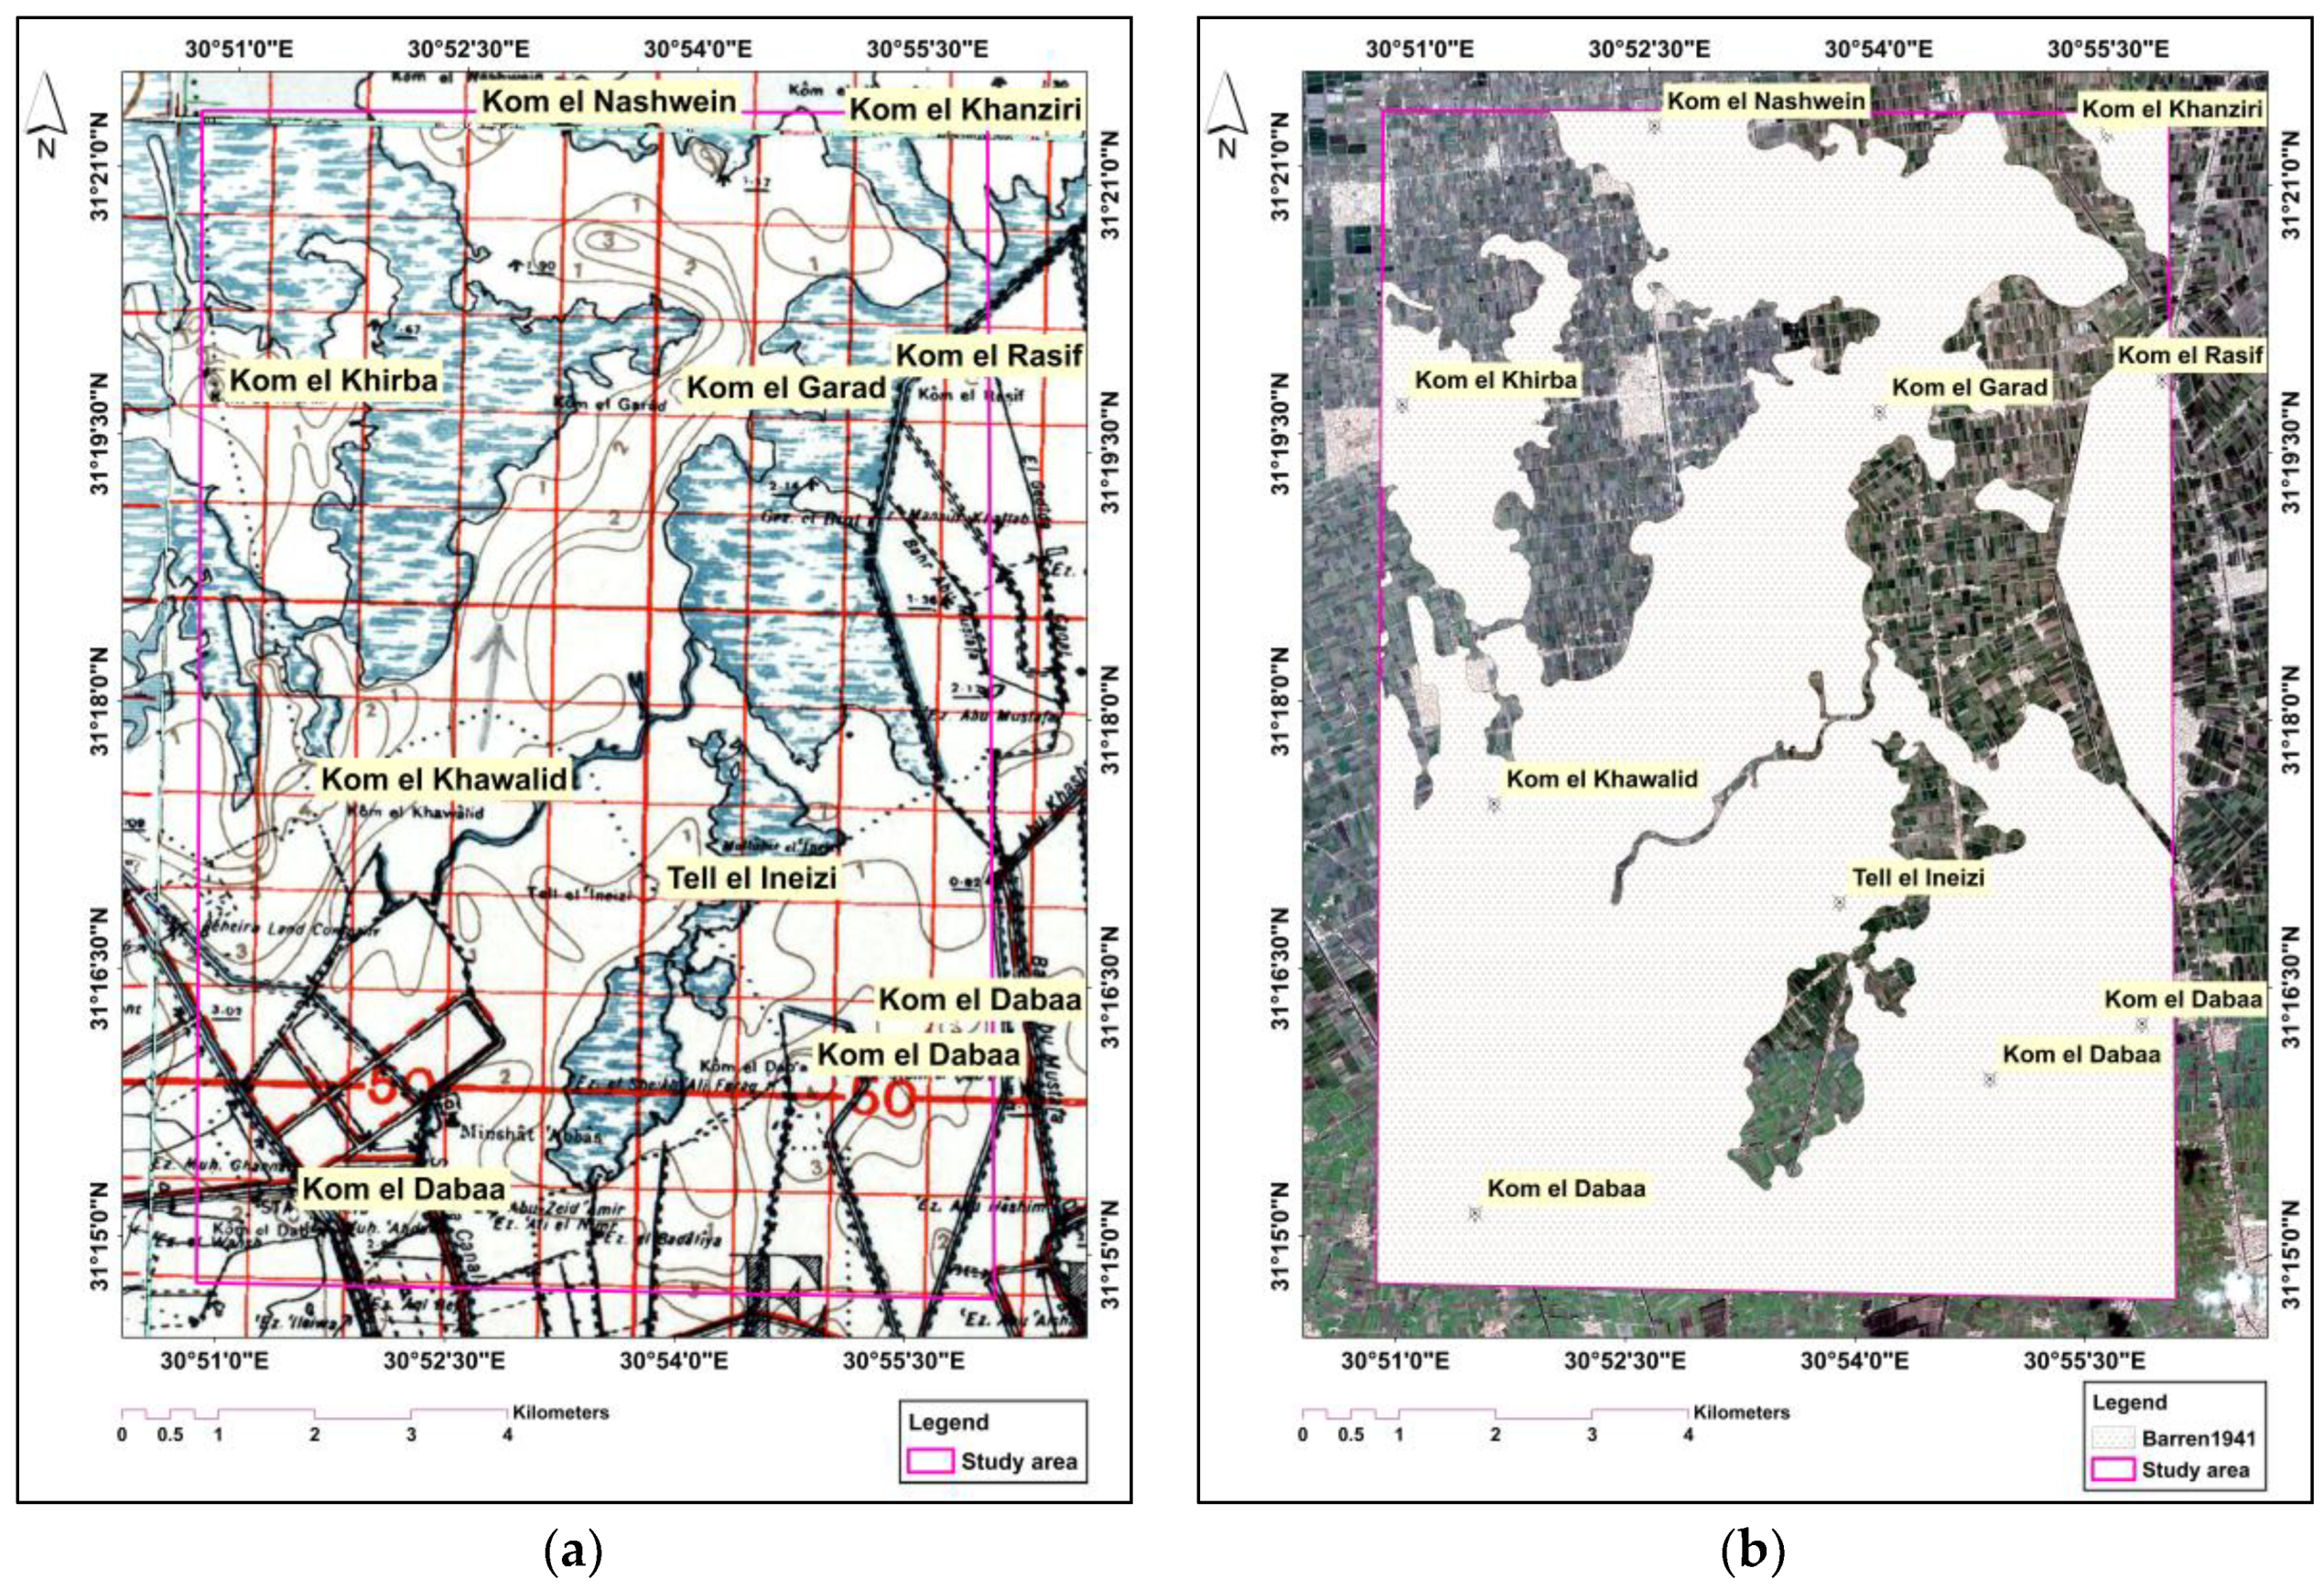
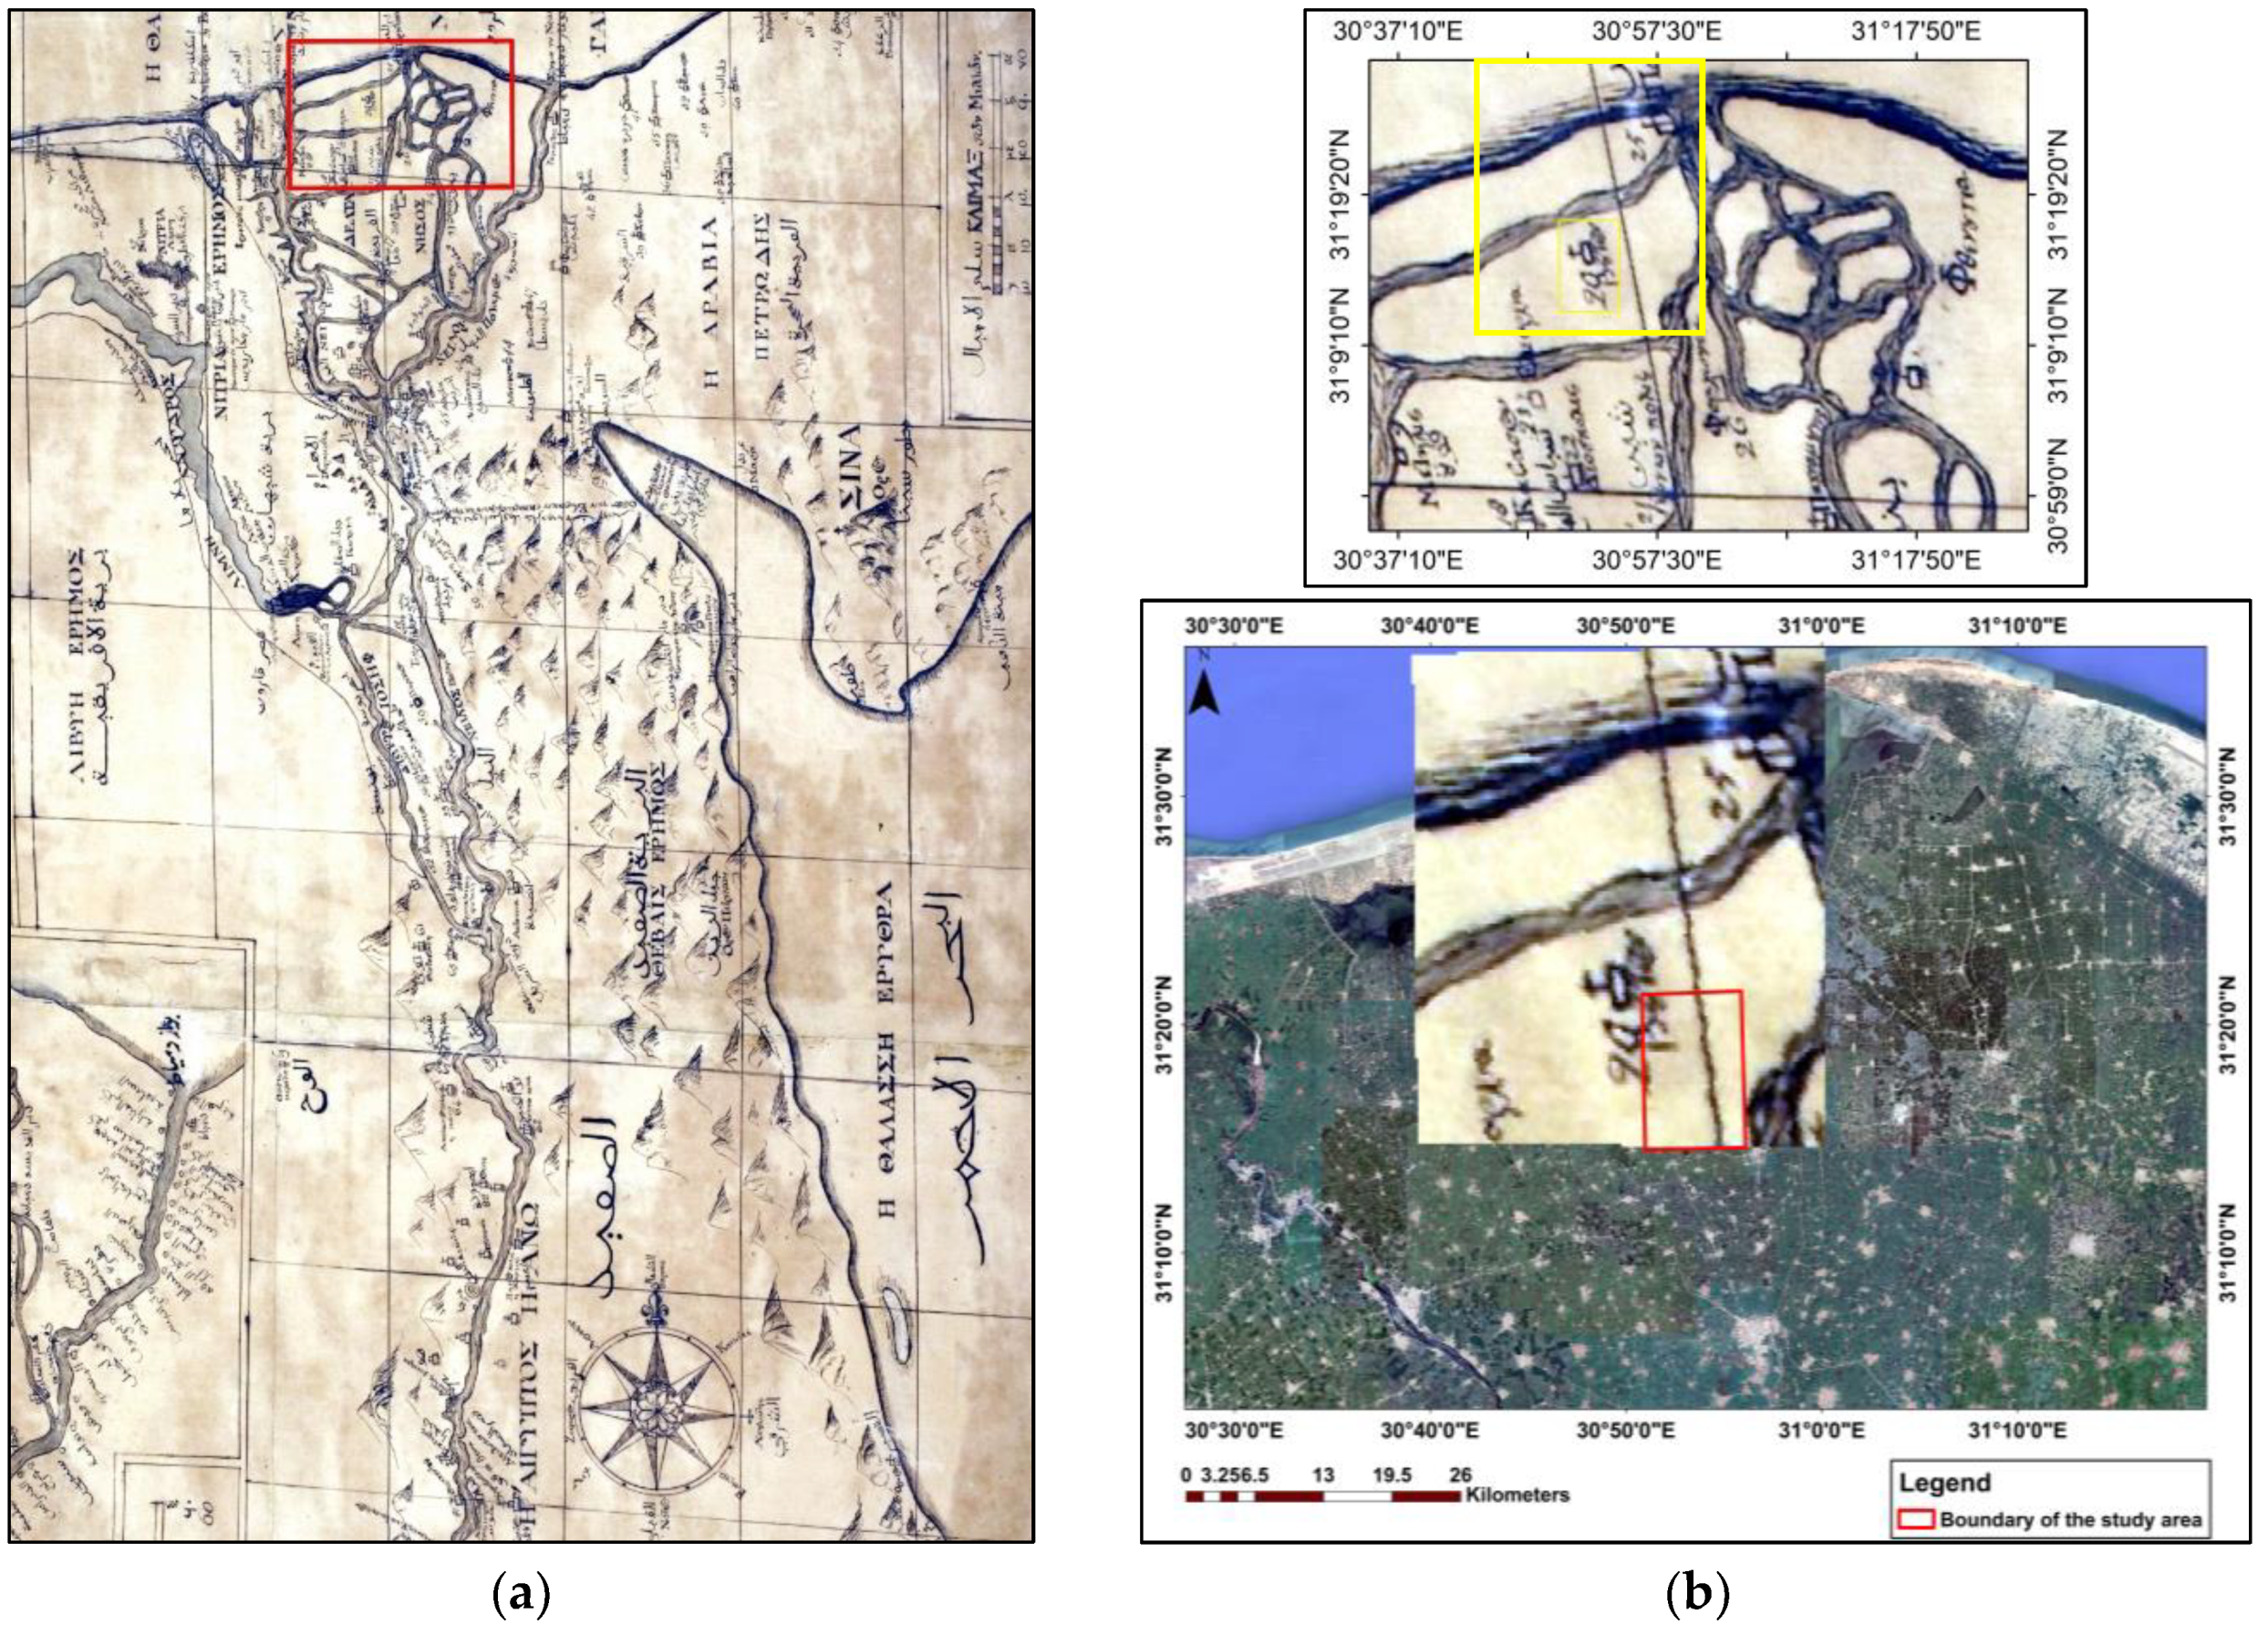
2.2.1. Digitizing the Topographical Maps
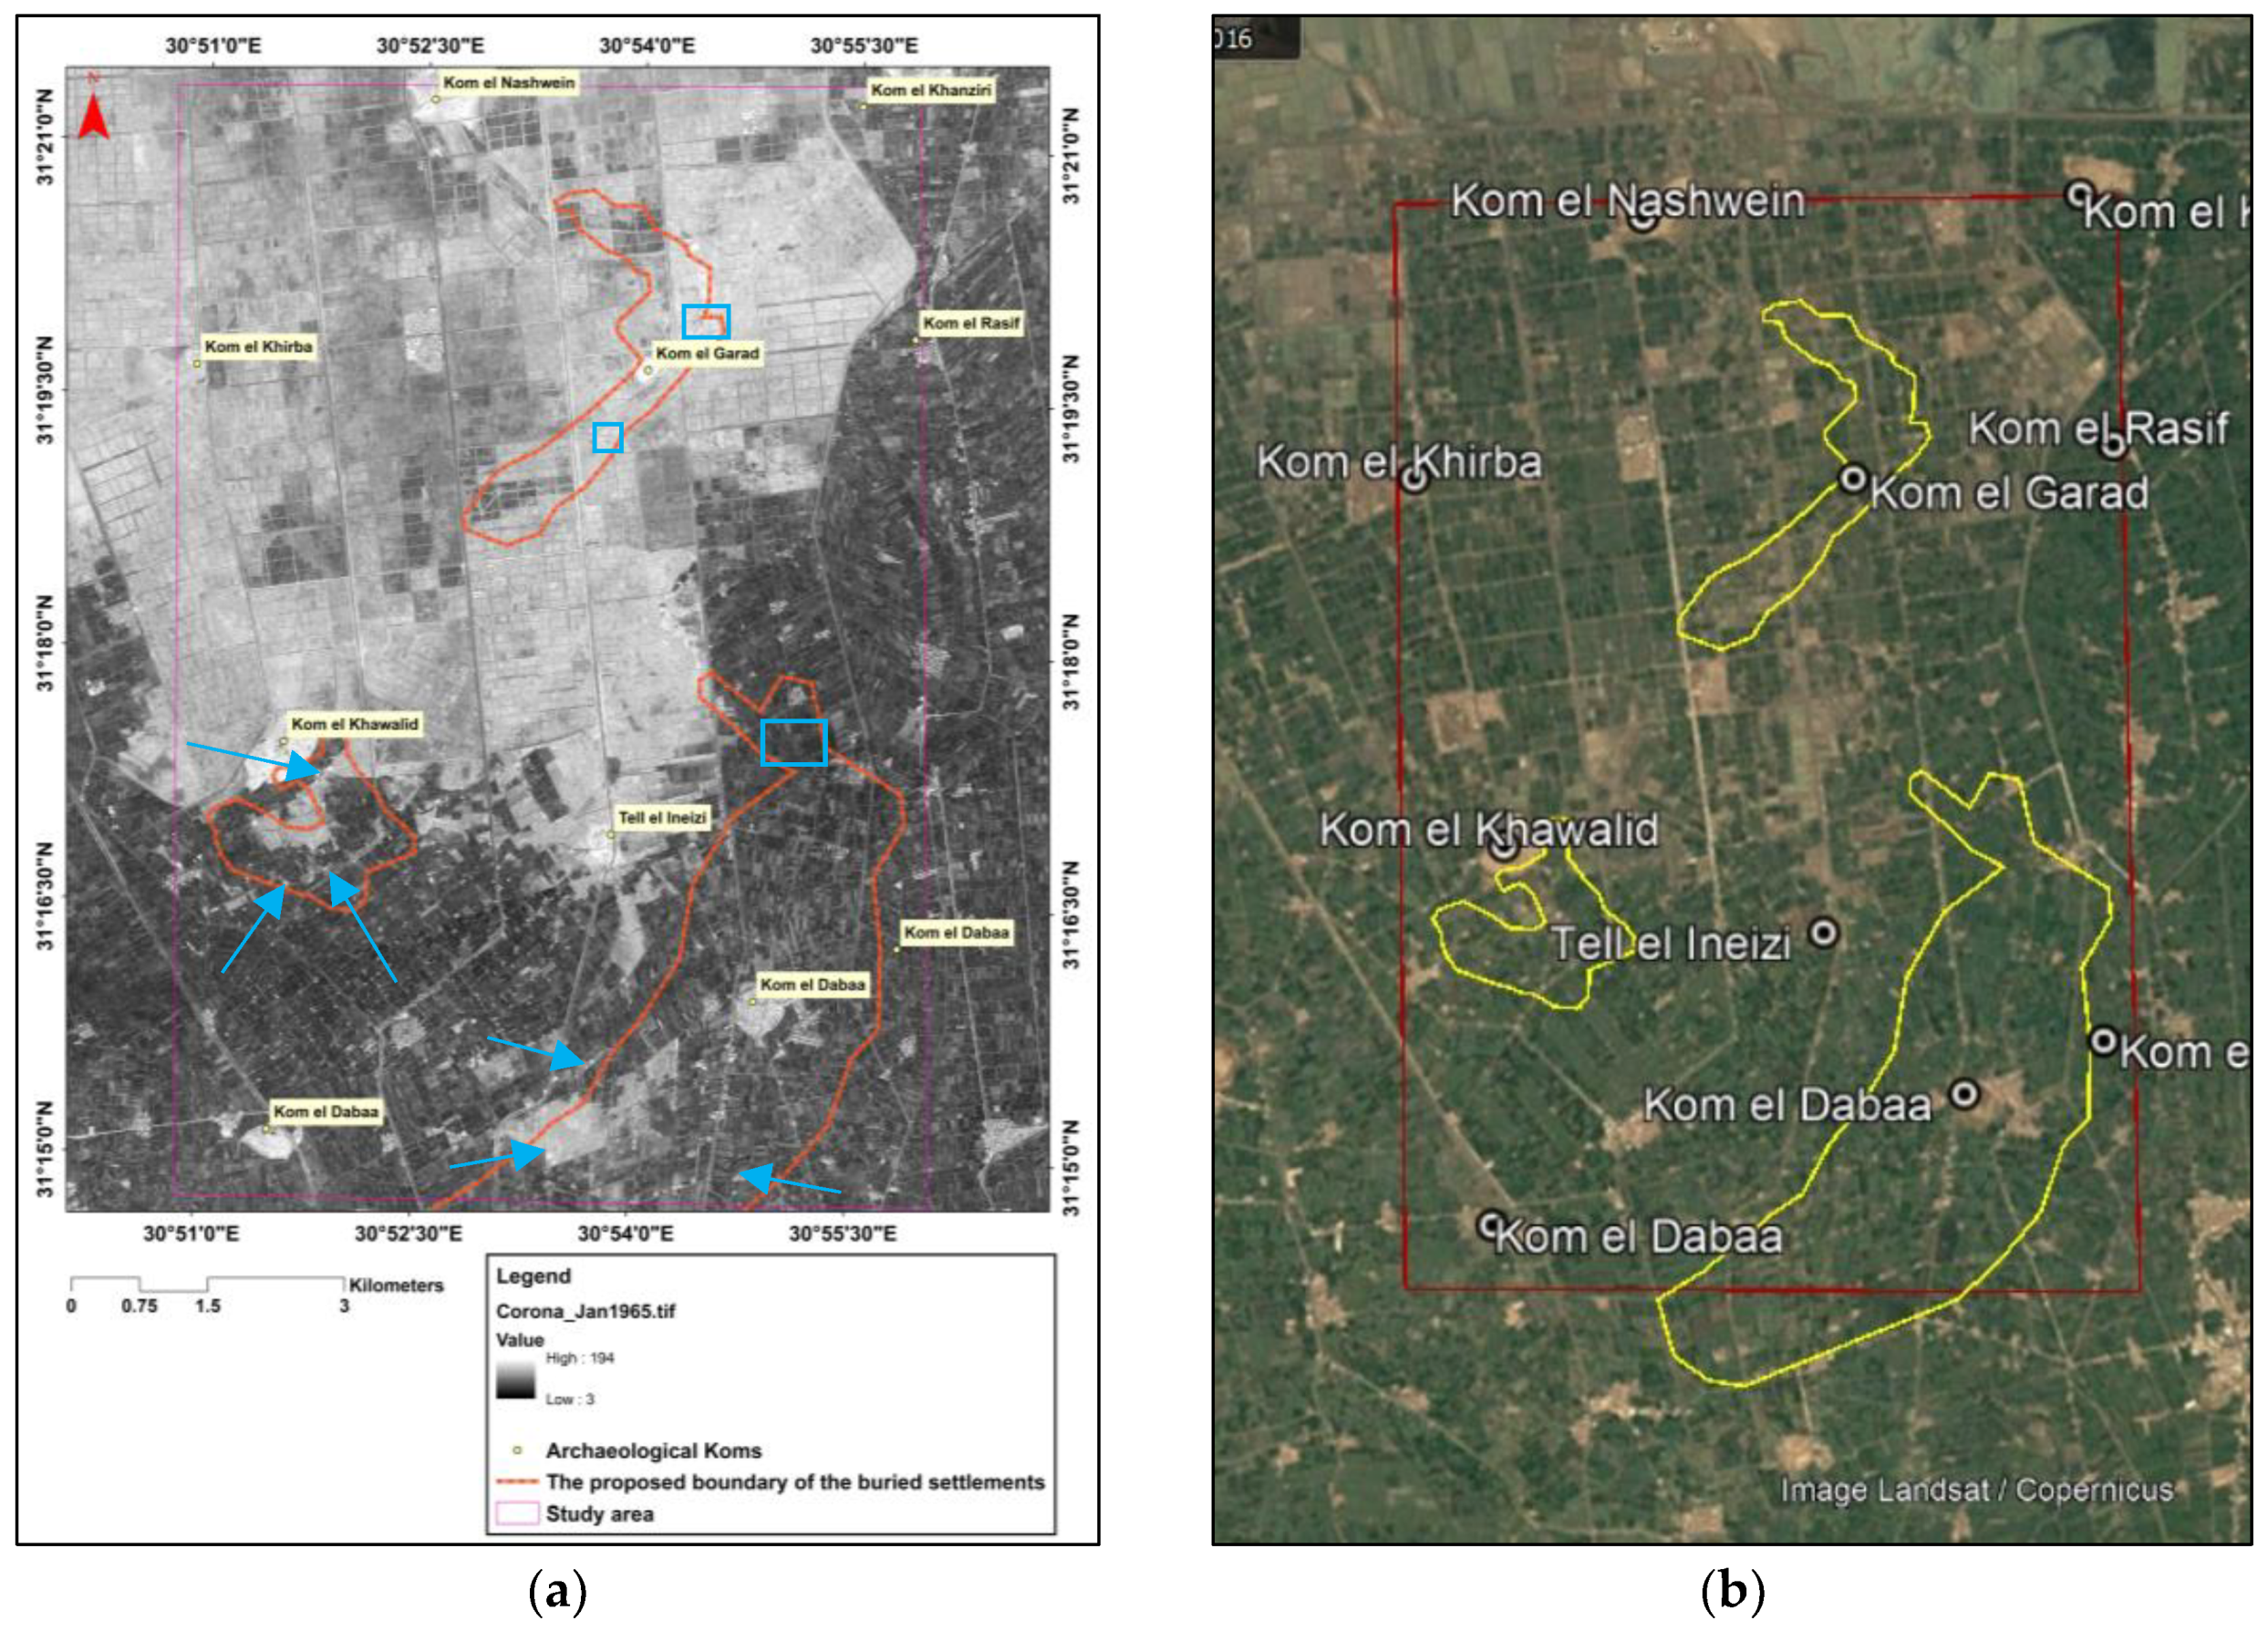
2.2.2. Preparing the Corona Data
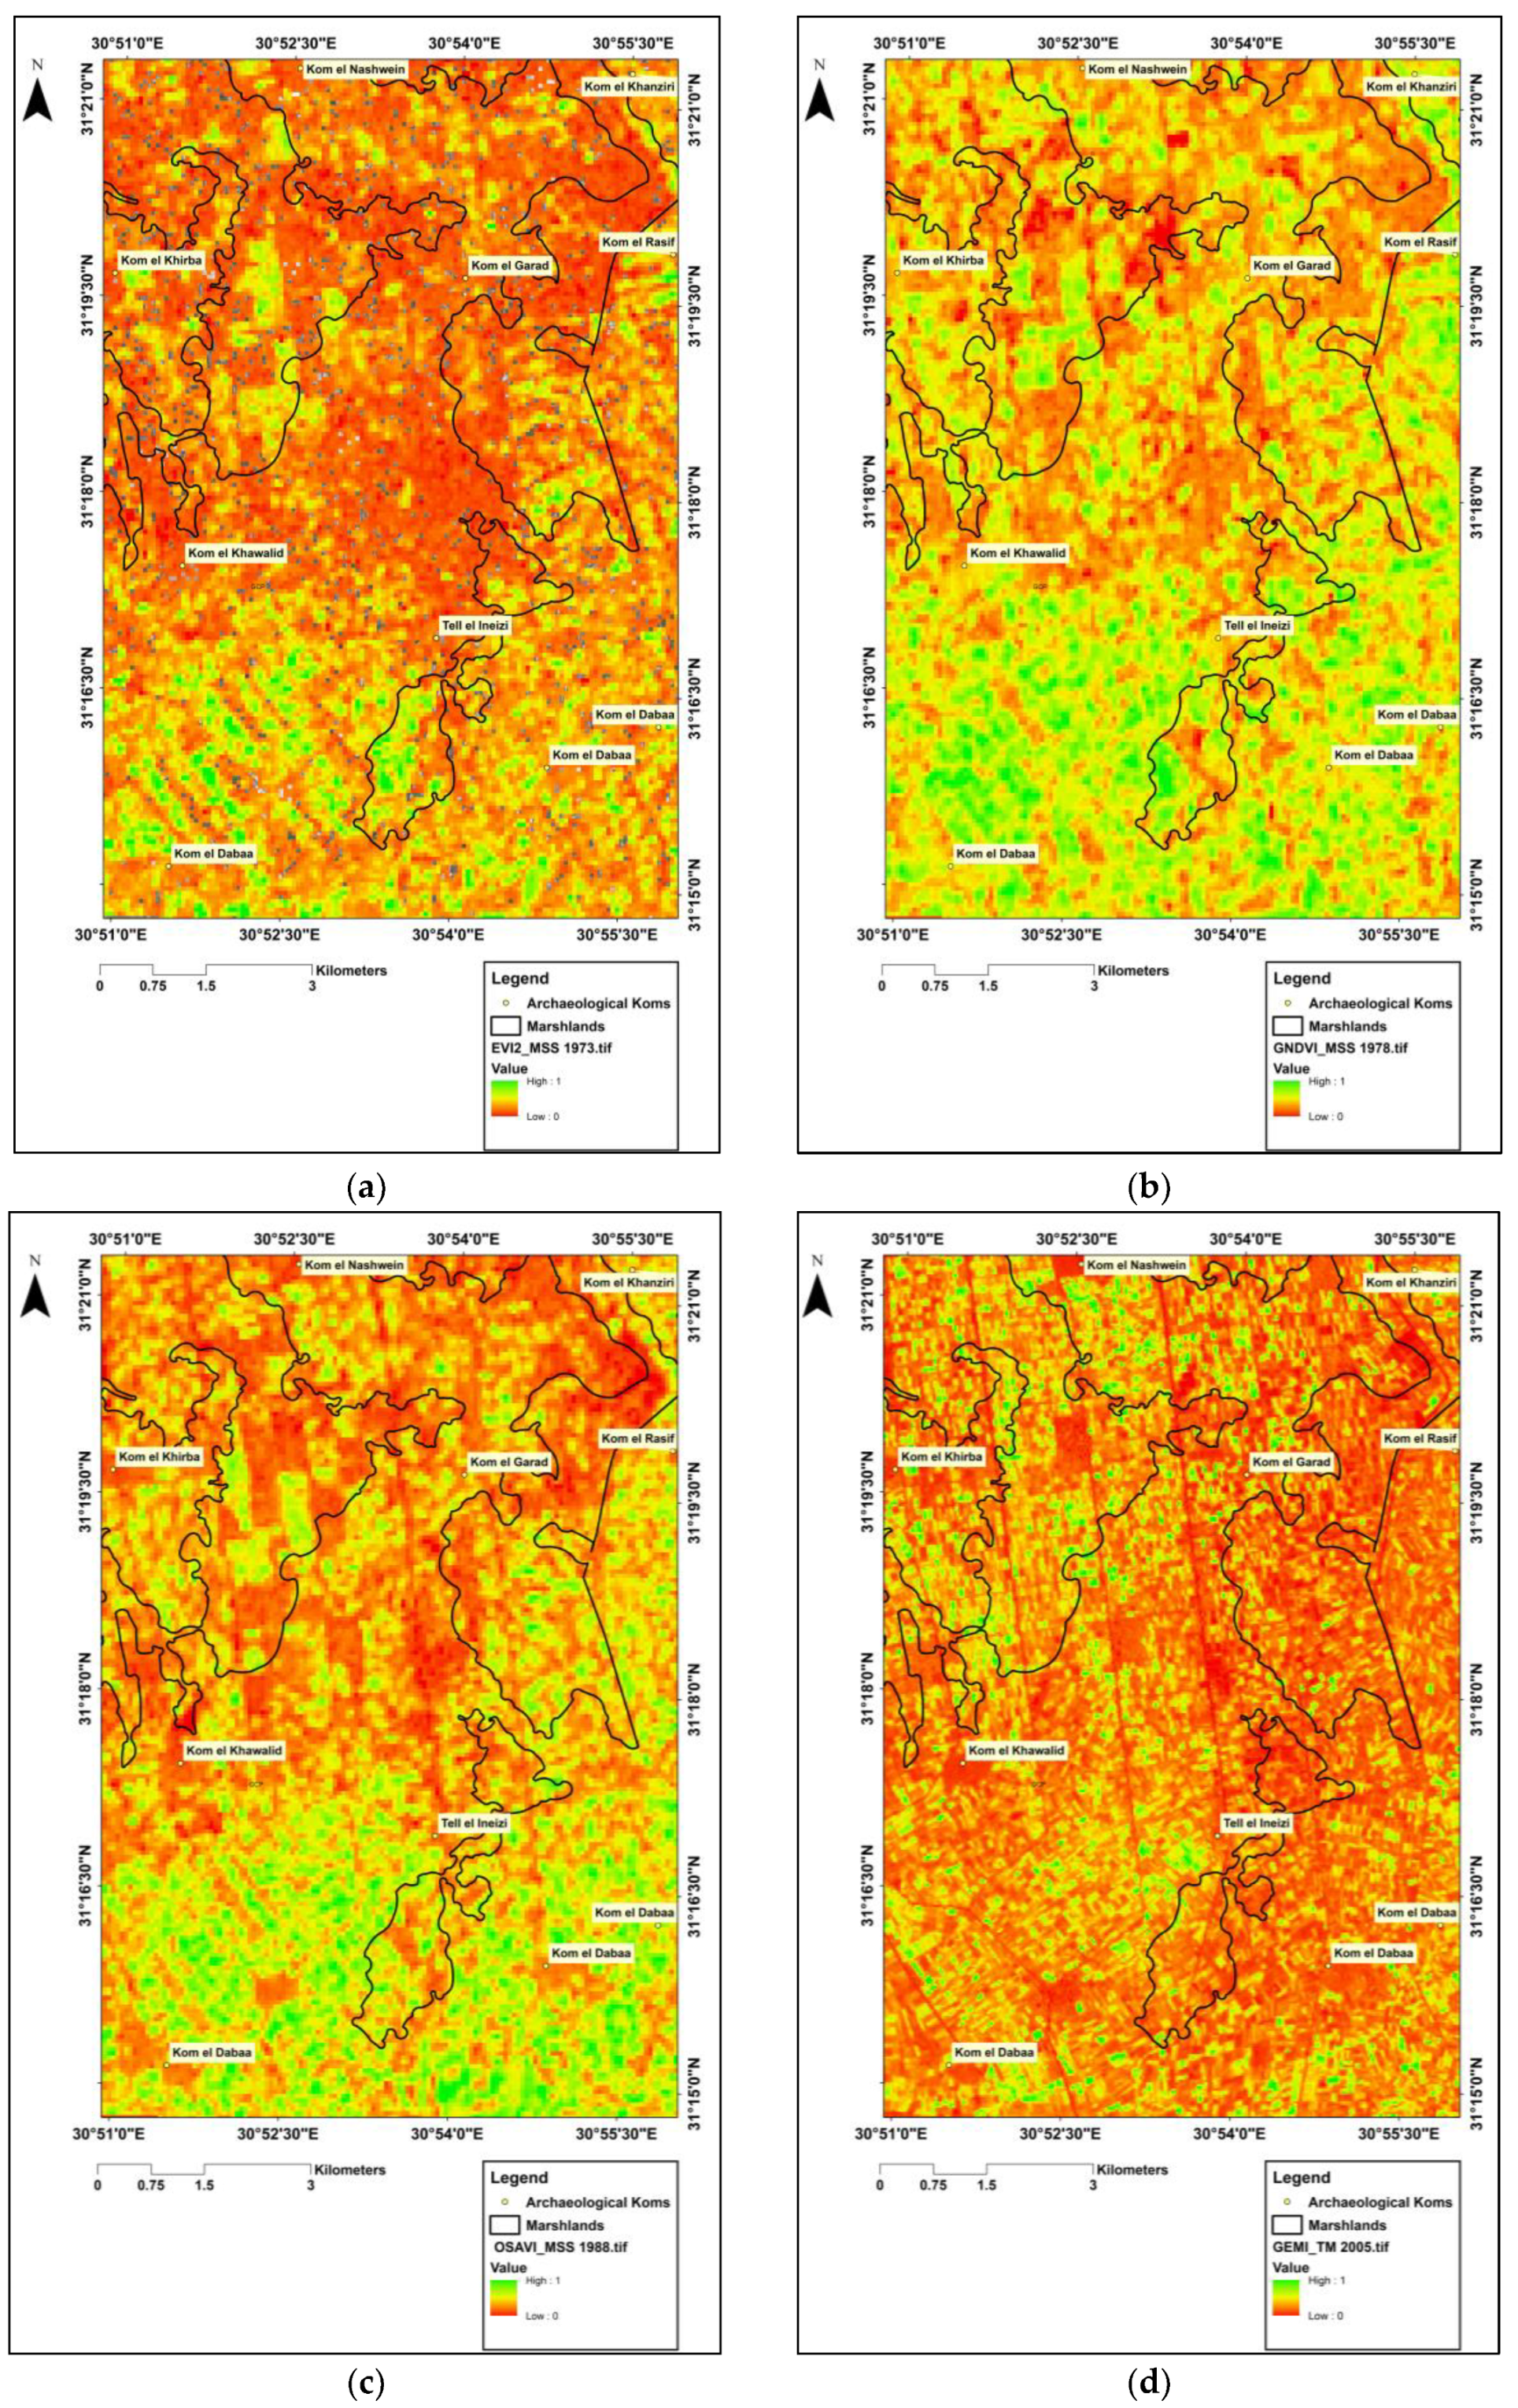
2.2.3. Band Indices
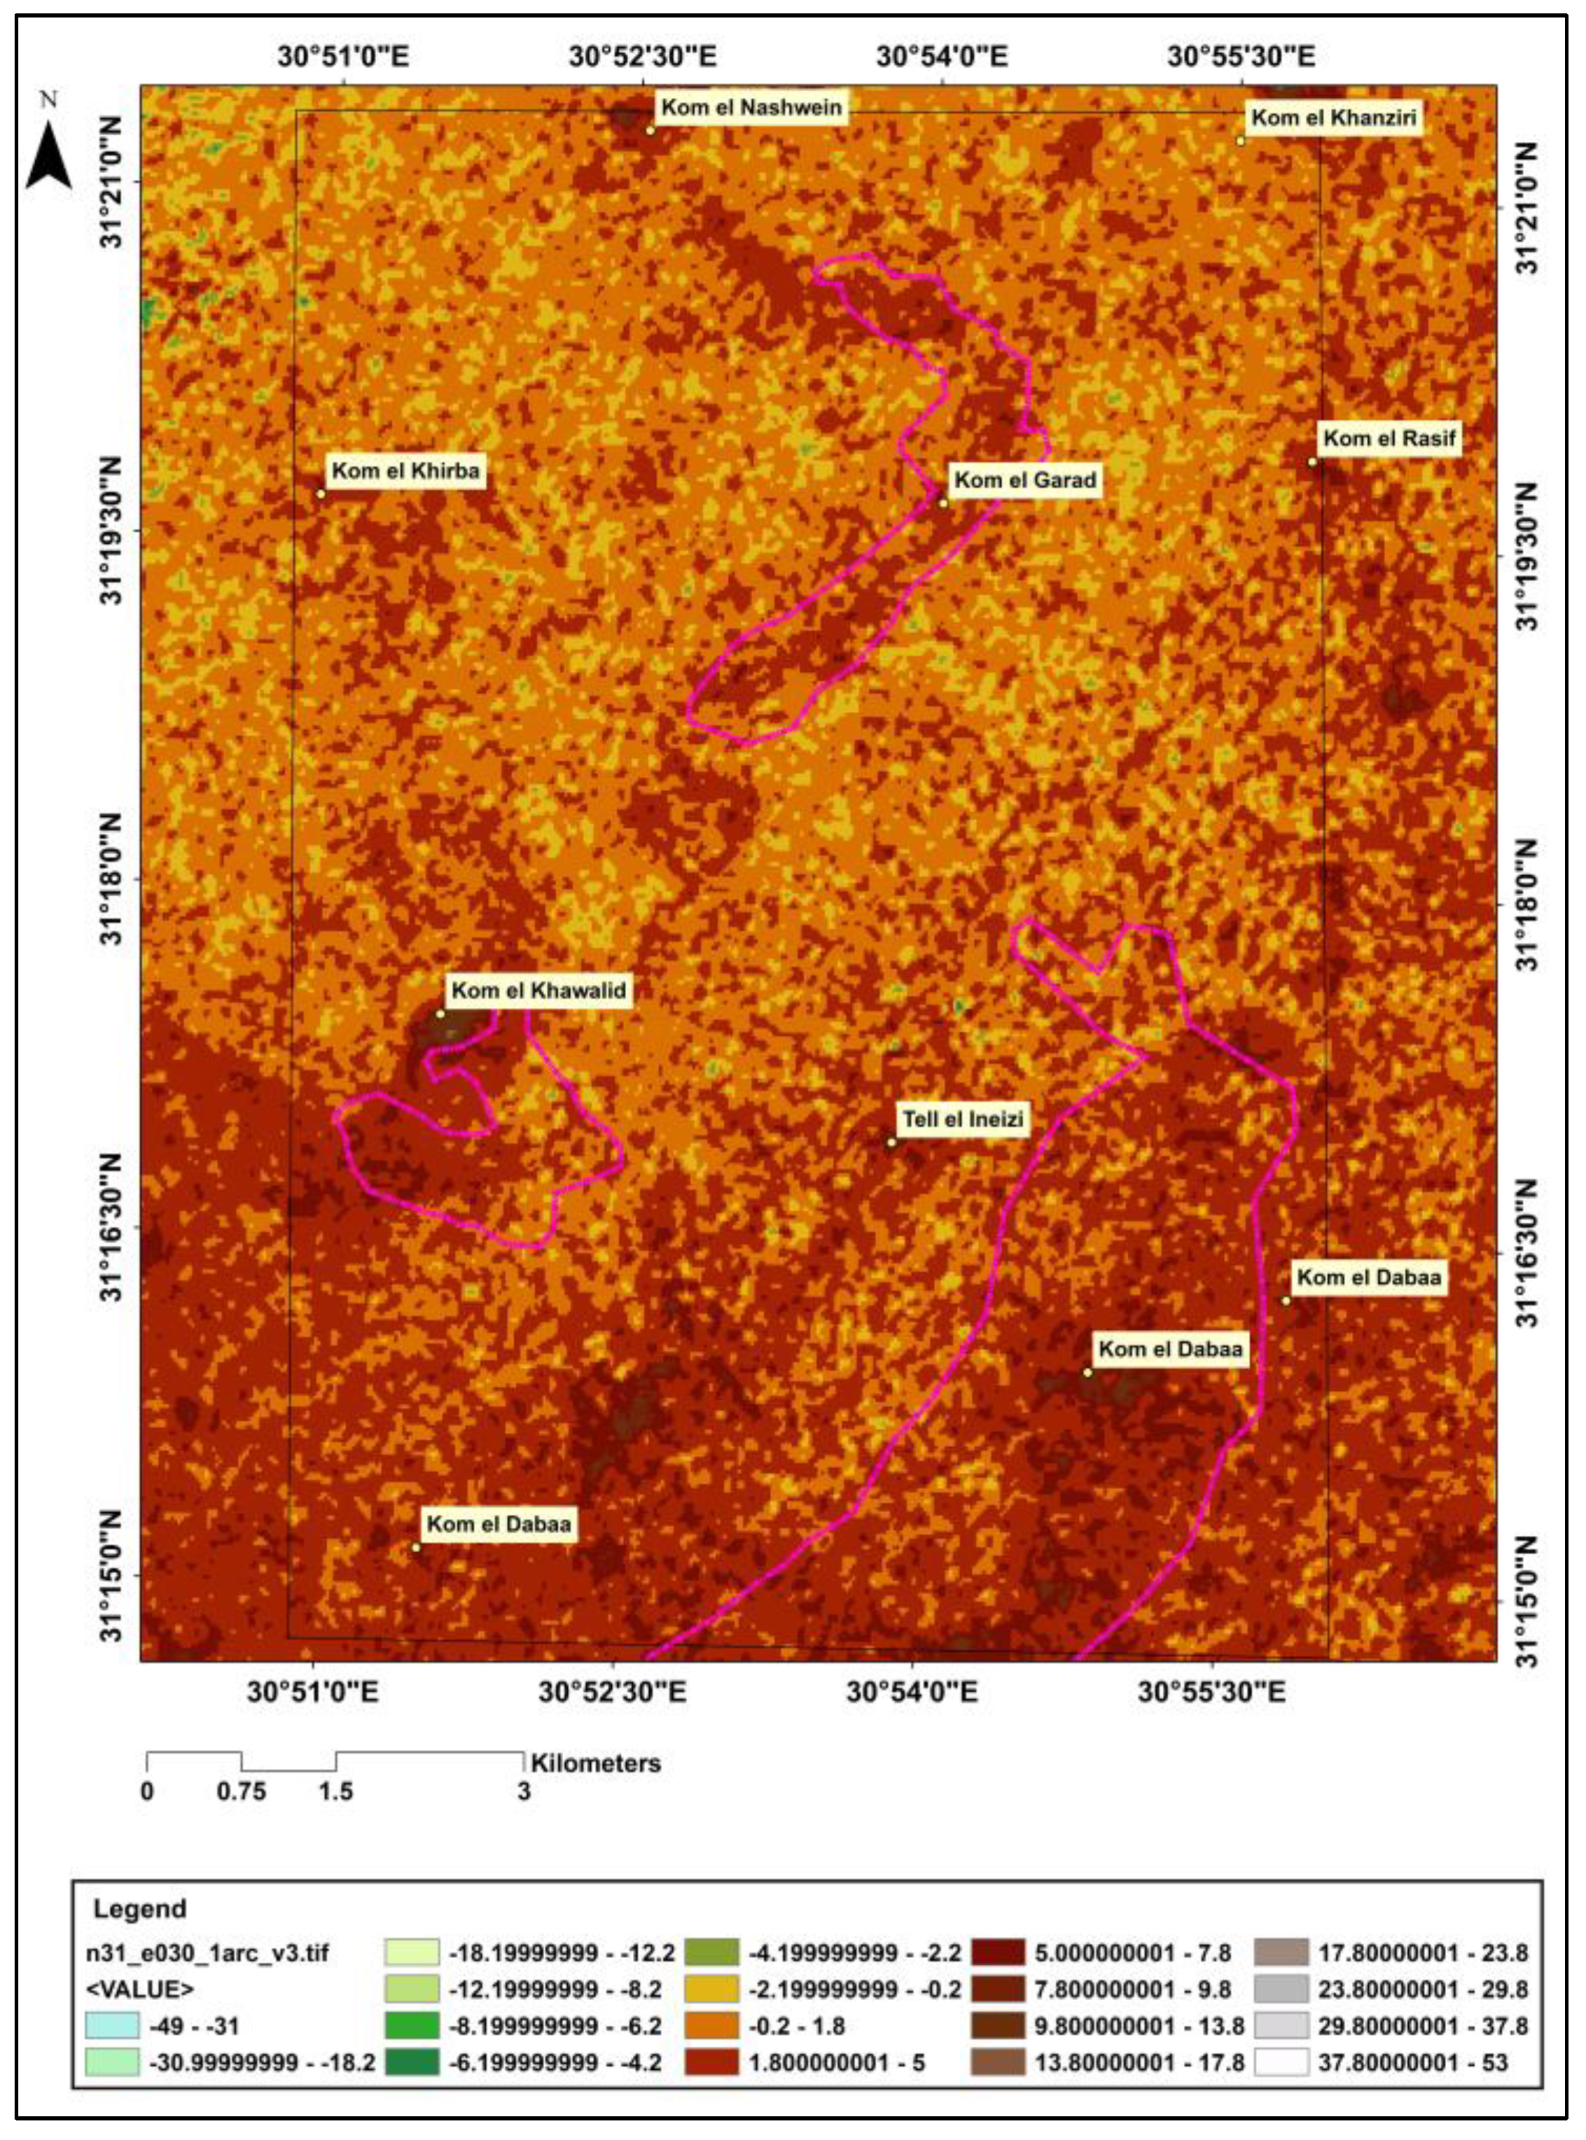
2.2.4. Preparing the Radar SRTM Data
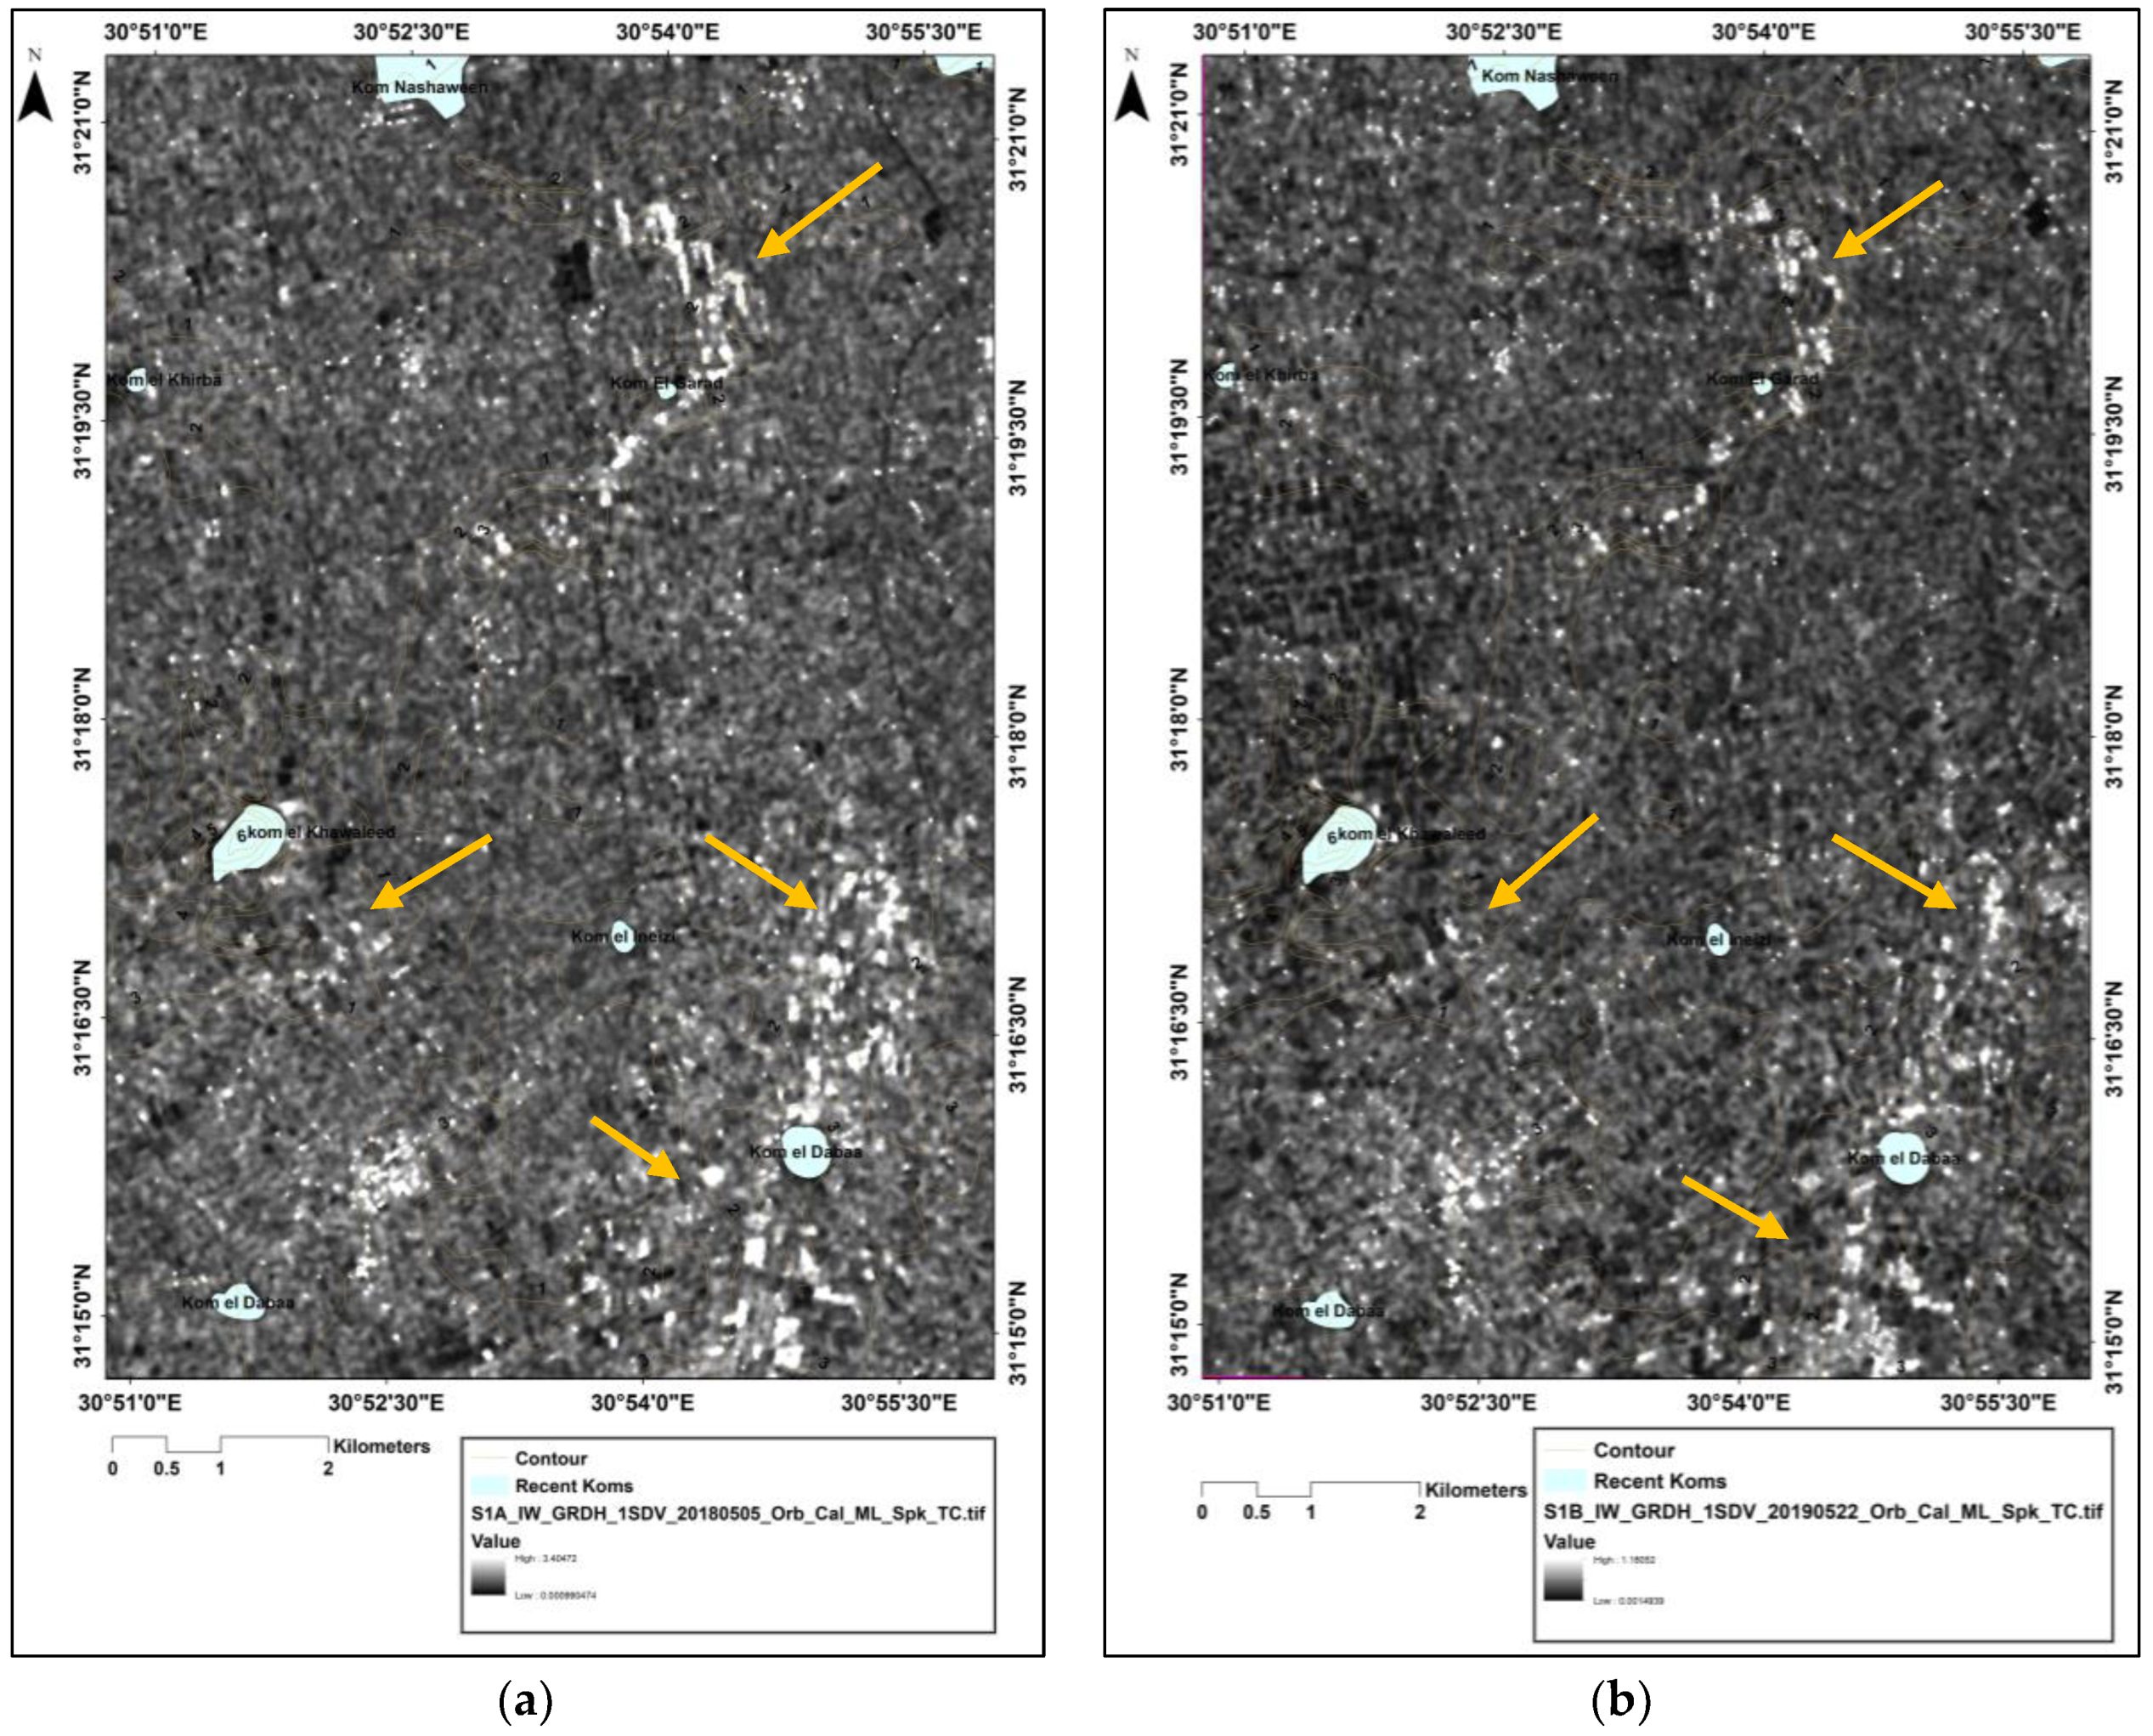
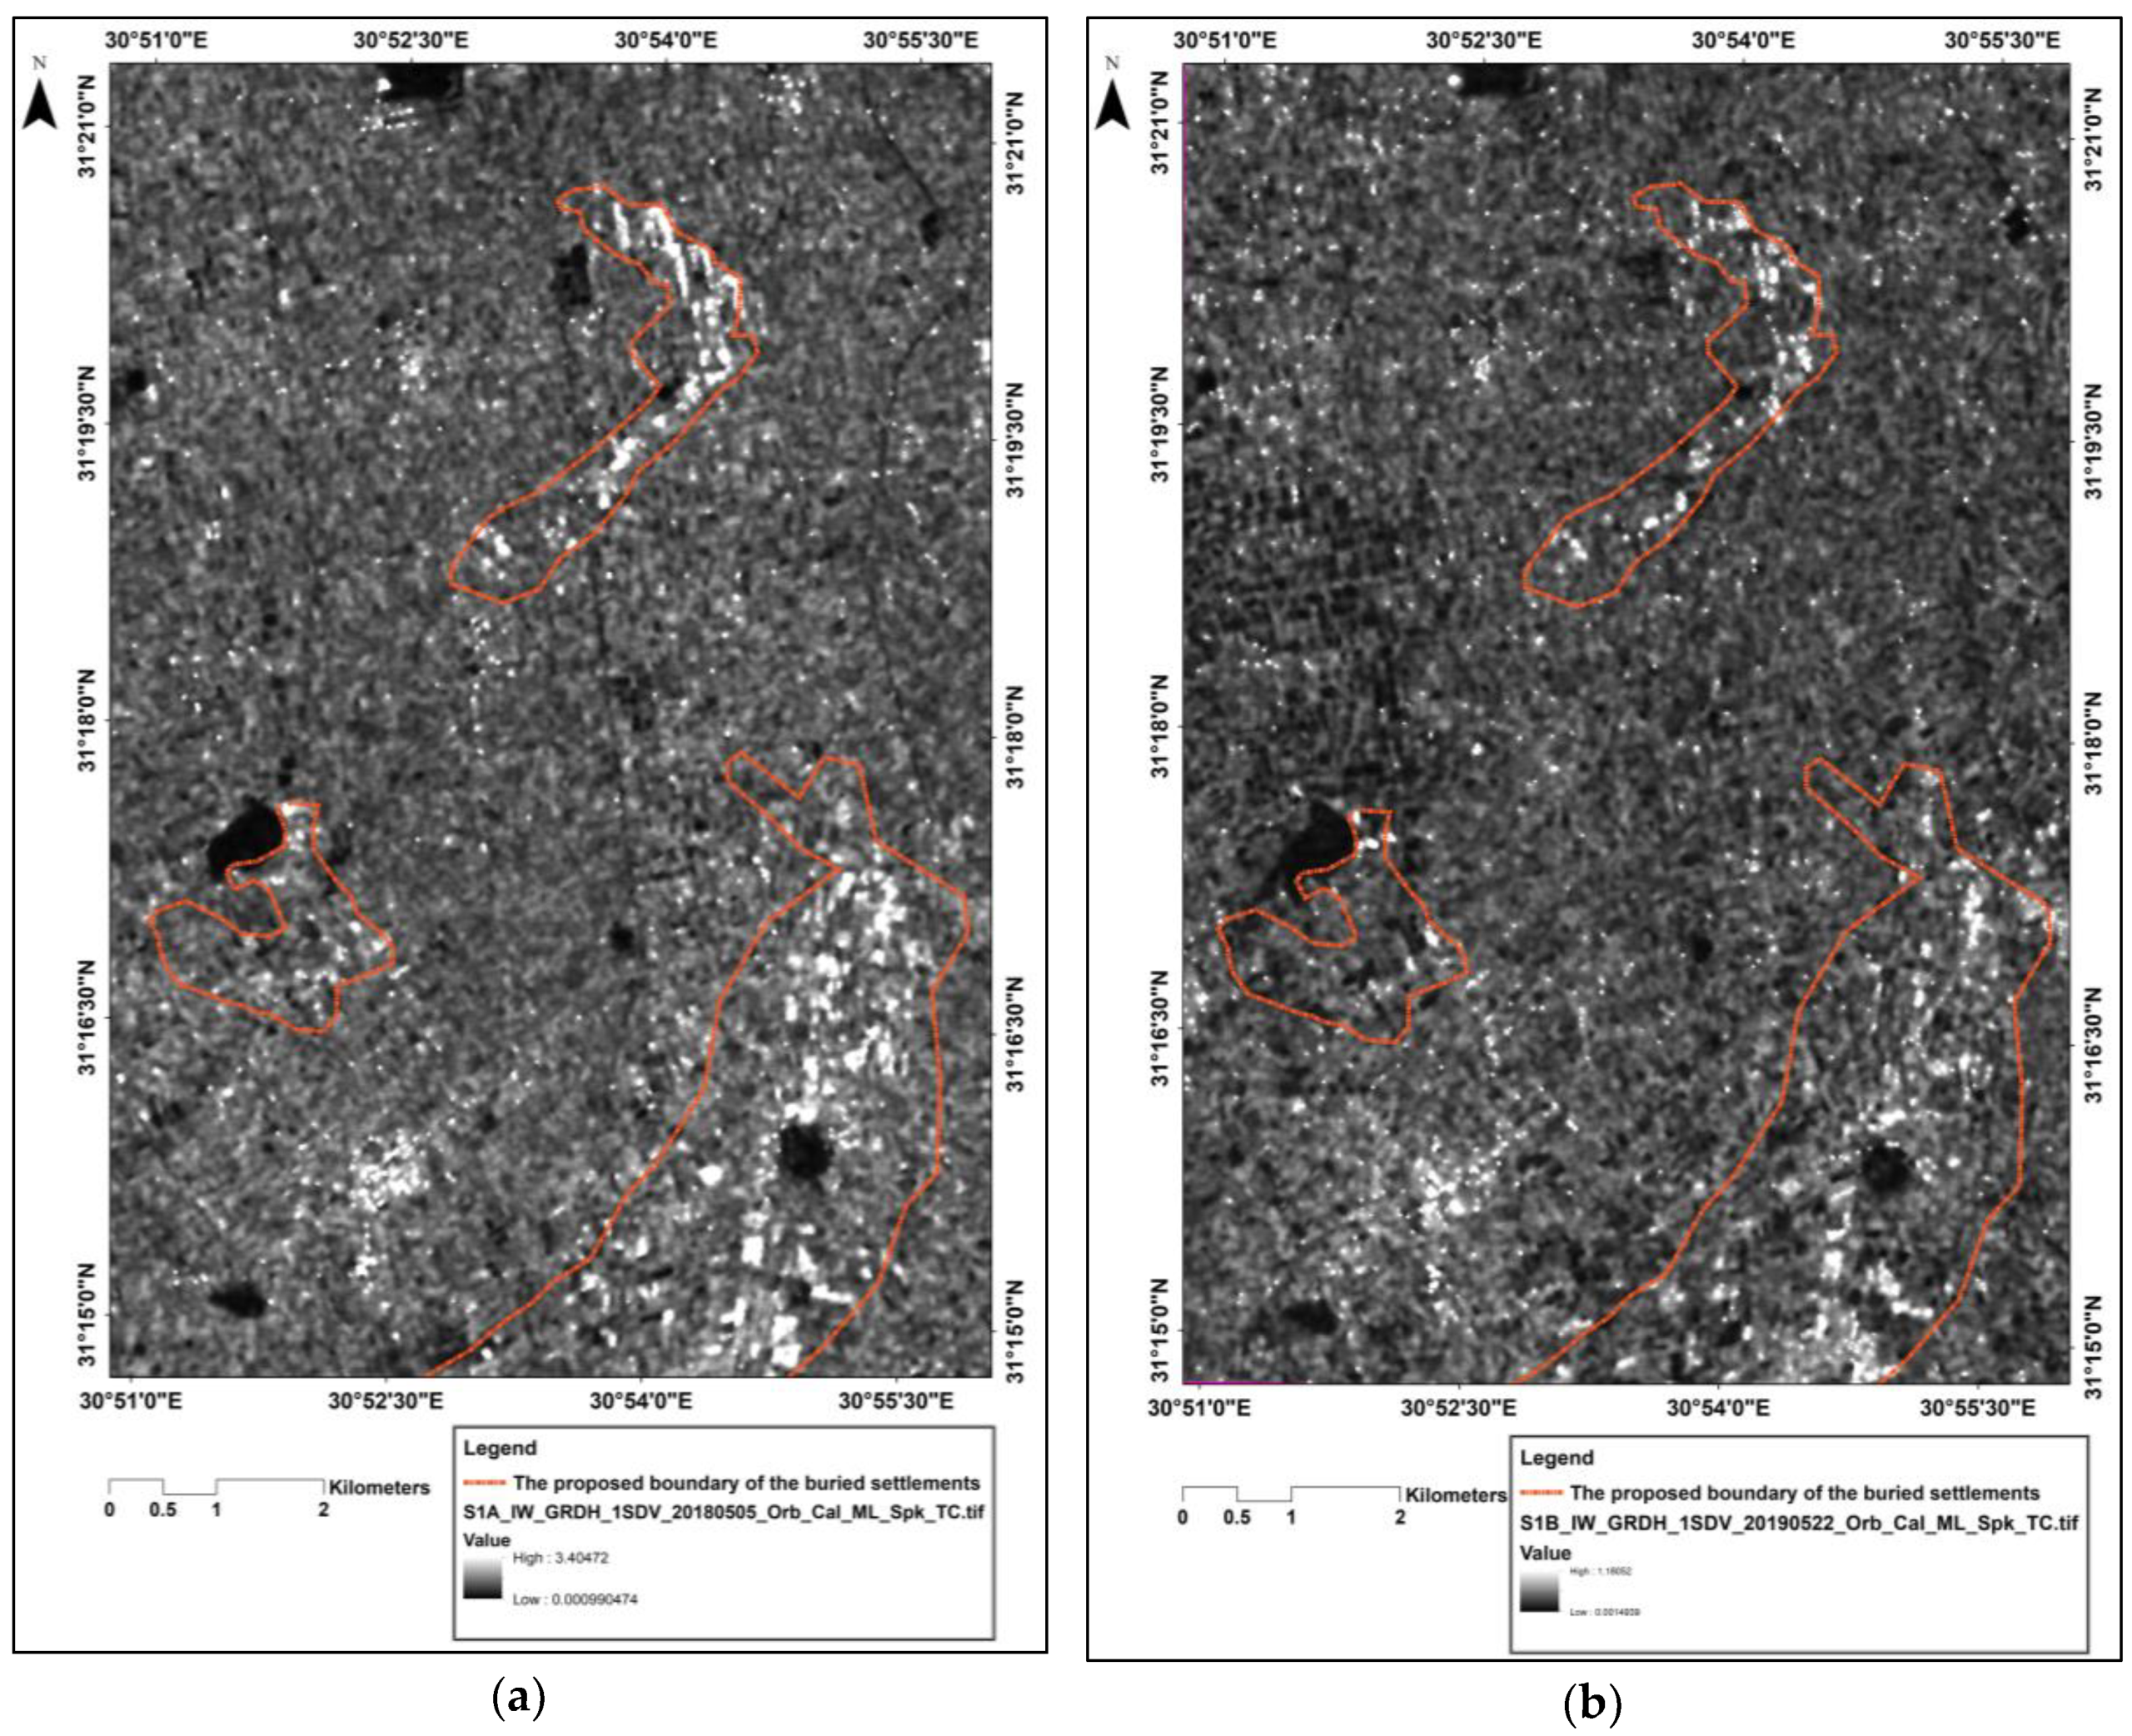
2.2.5. Sentinel1 Processing
3. Results
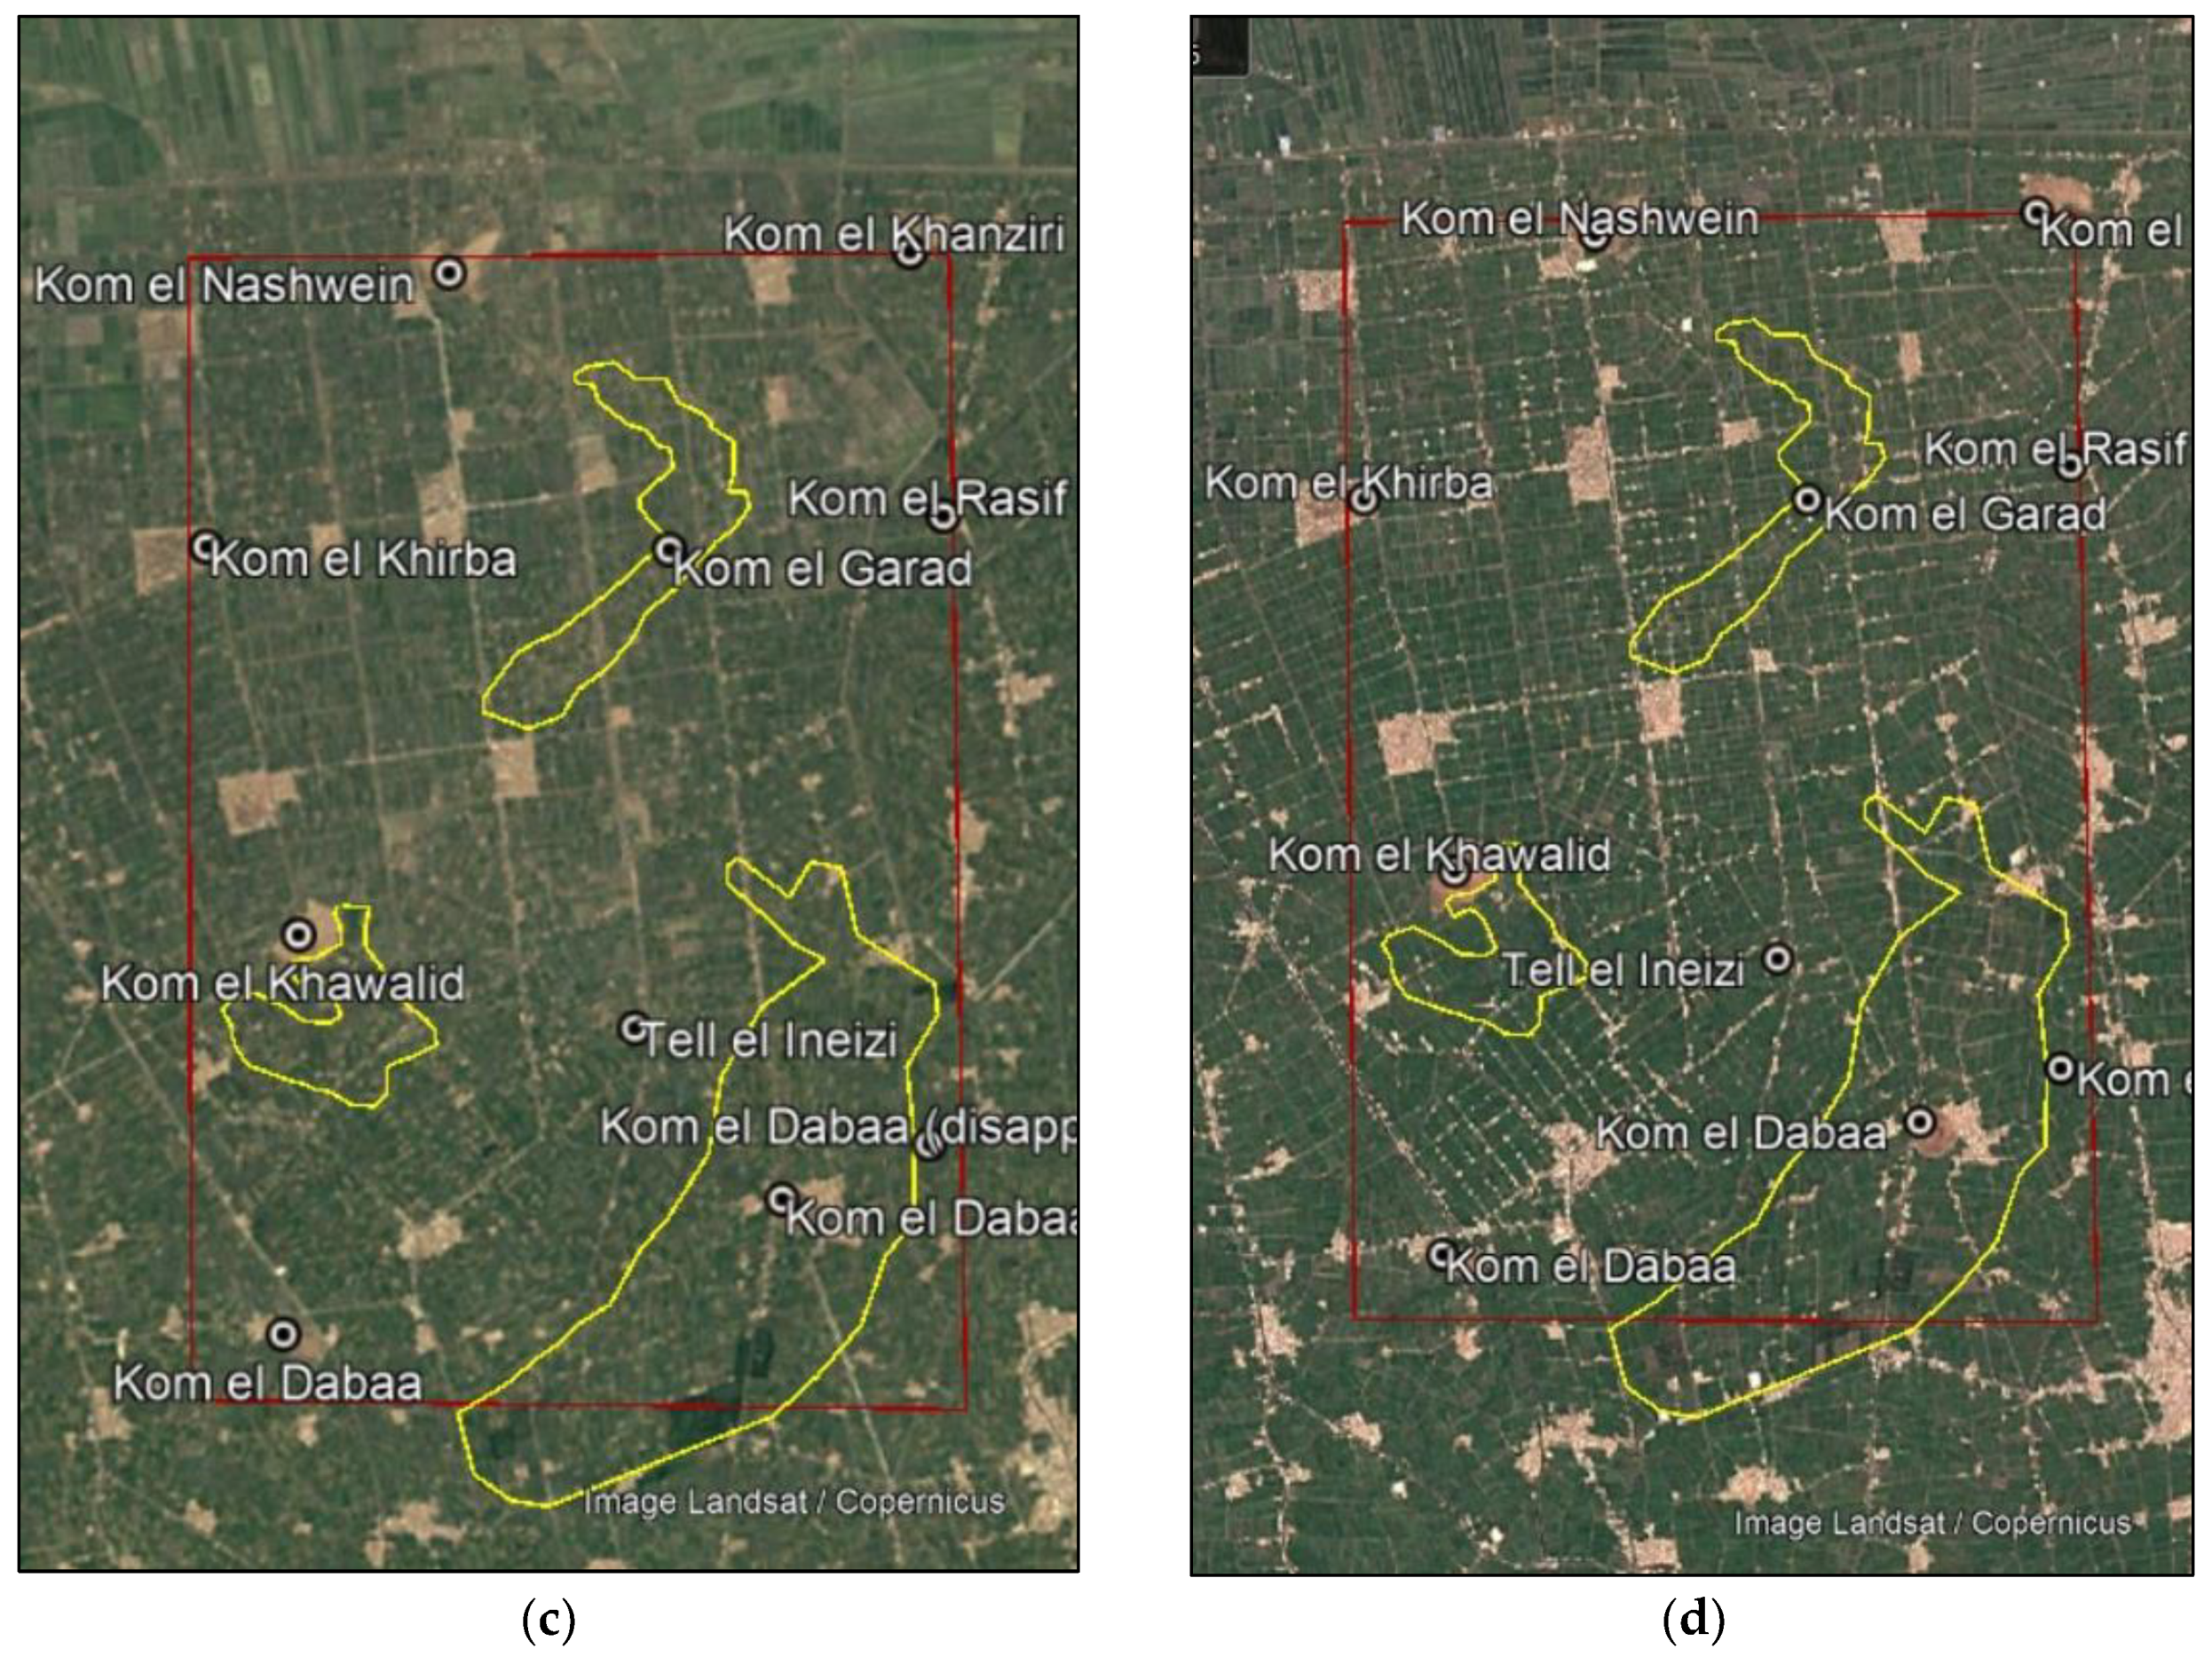
3.1. Detect Changes in Land Use/Landcover
3.2. Detection of the Ancient Marshlands by Remote Sensing Indices
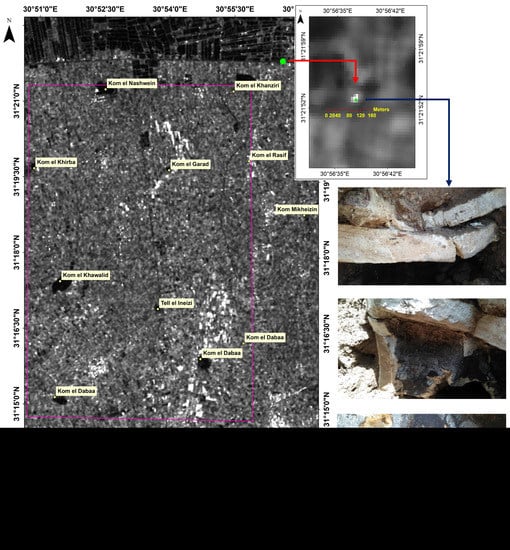
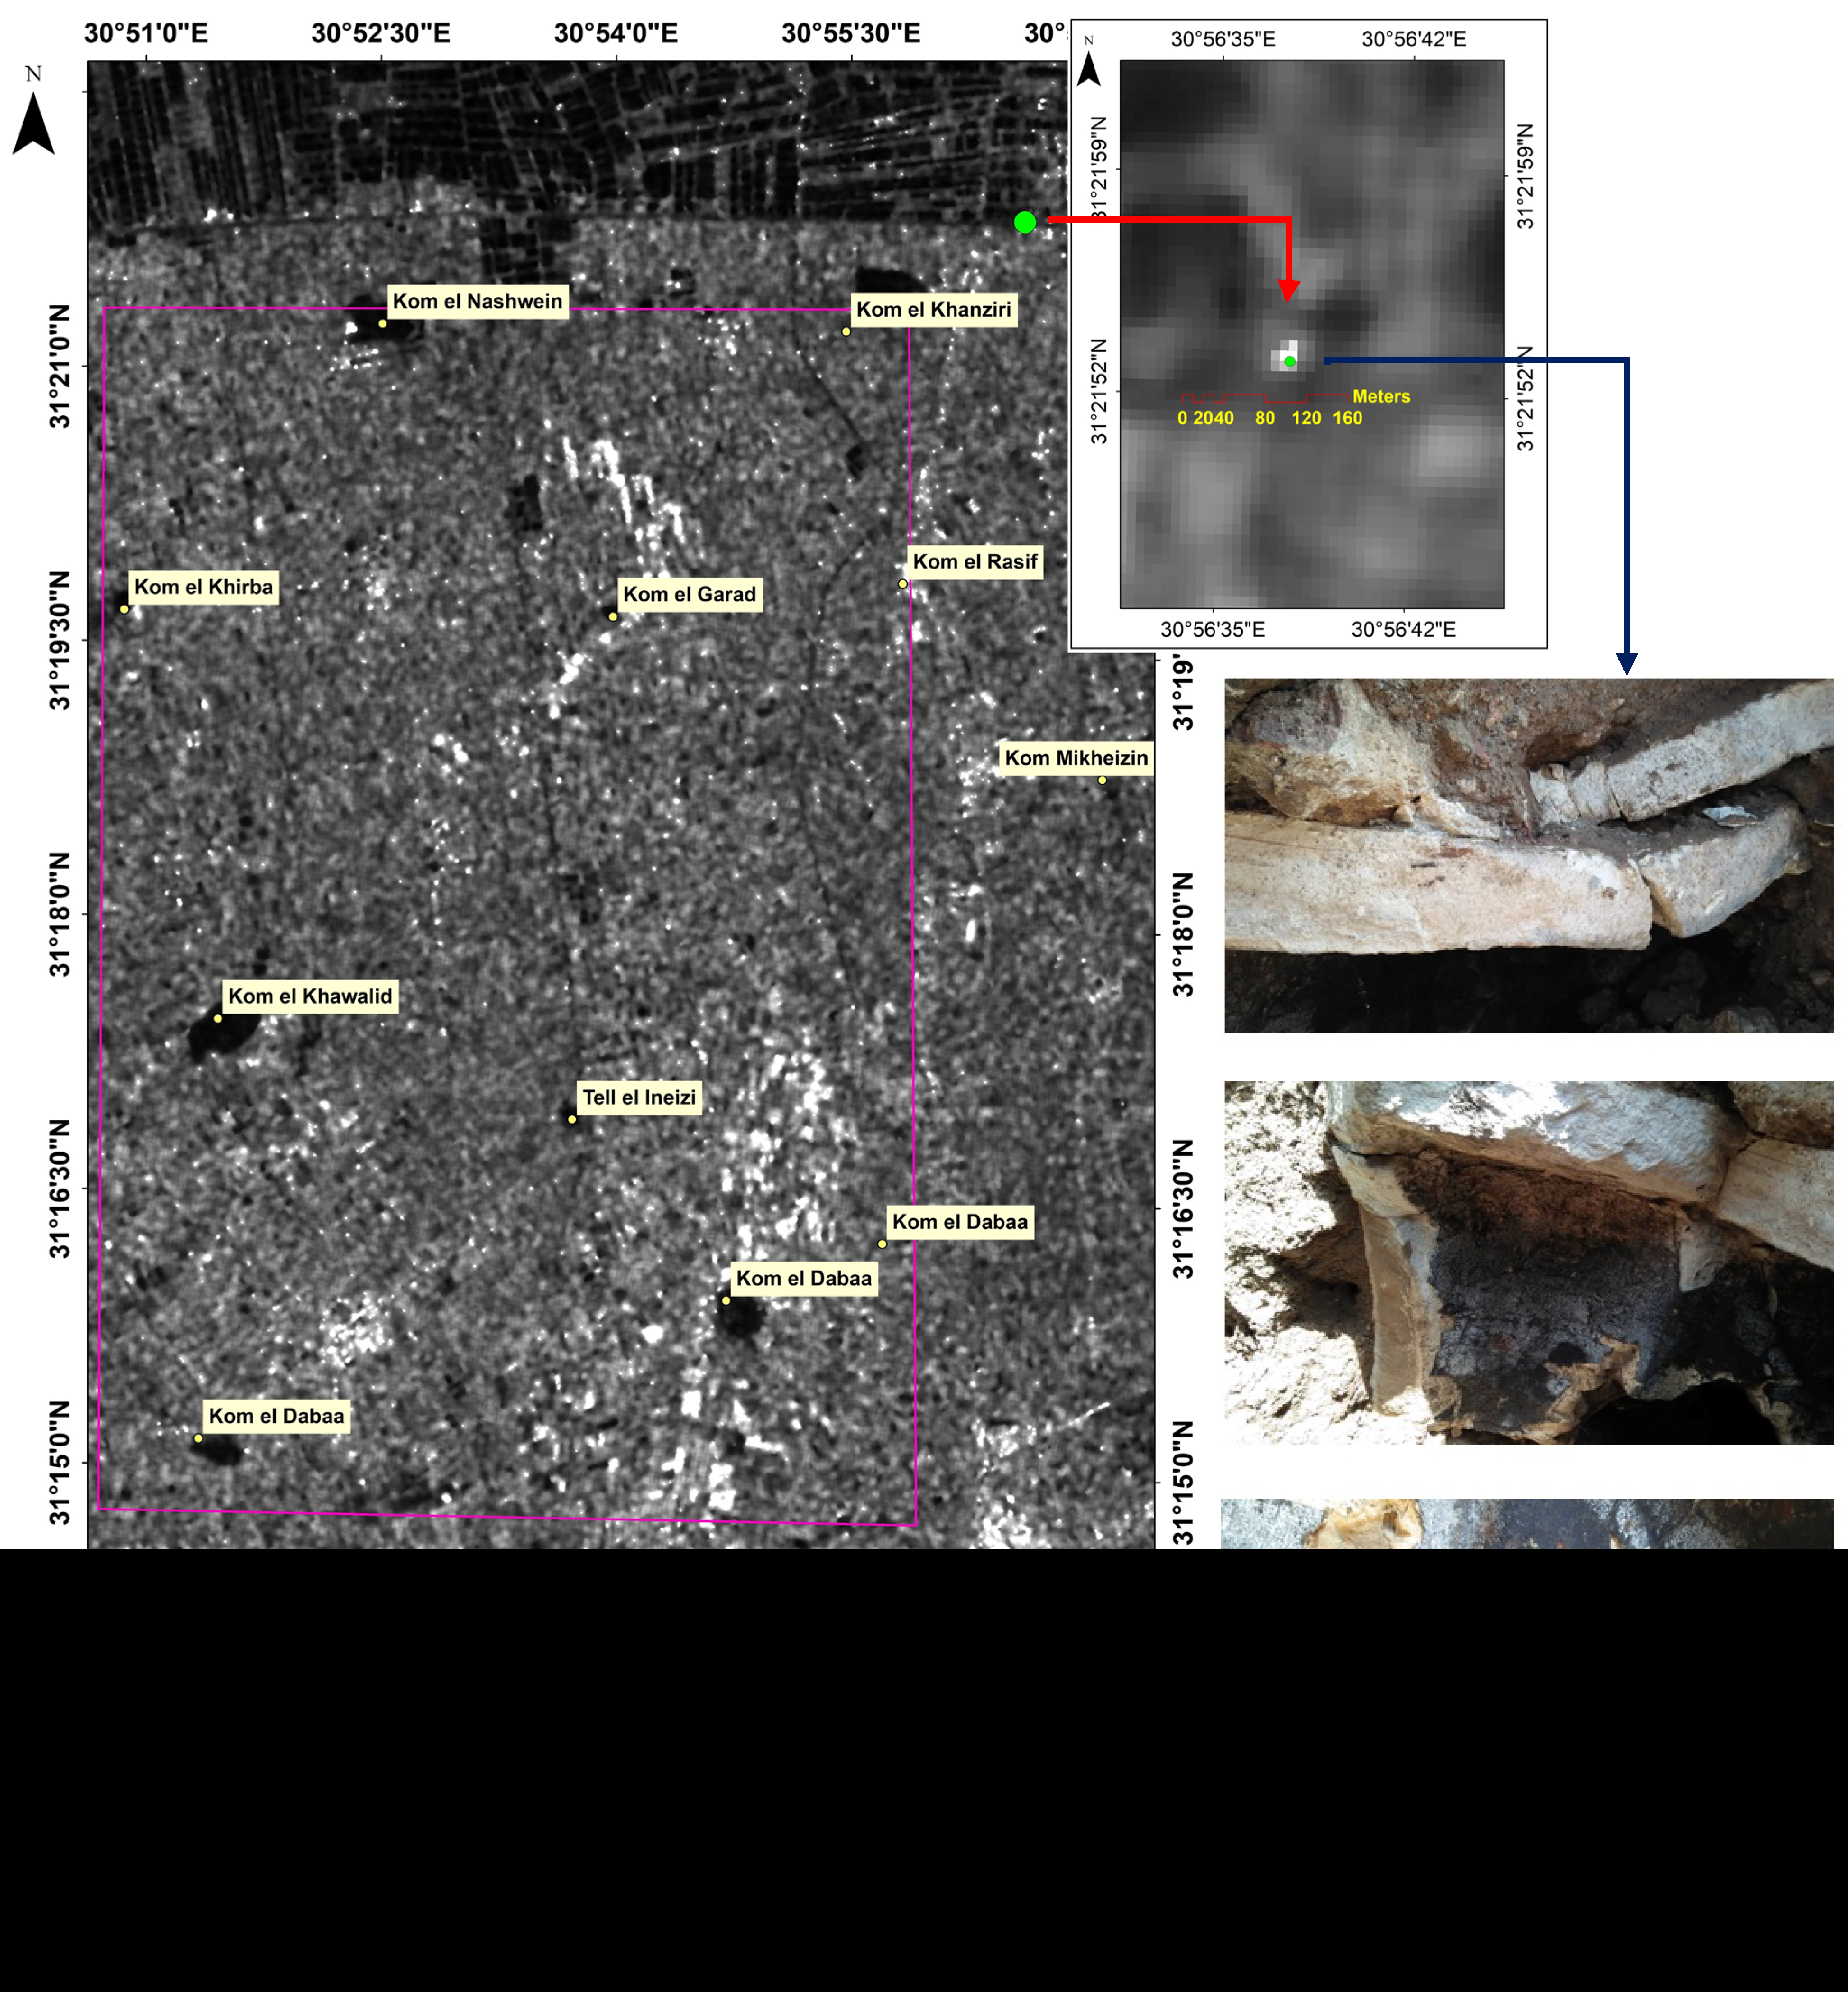
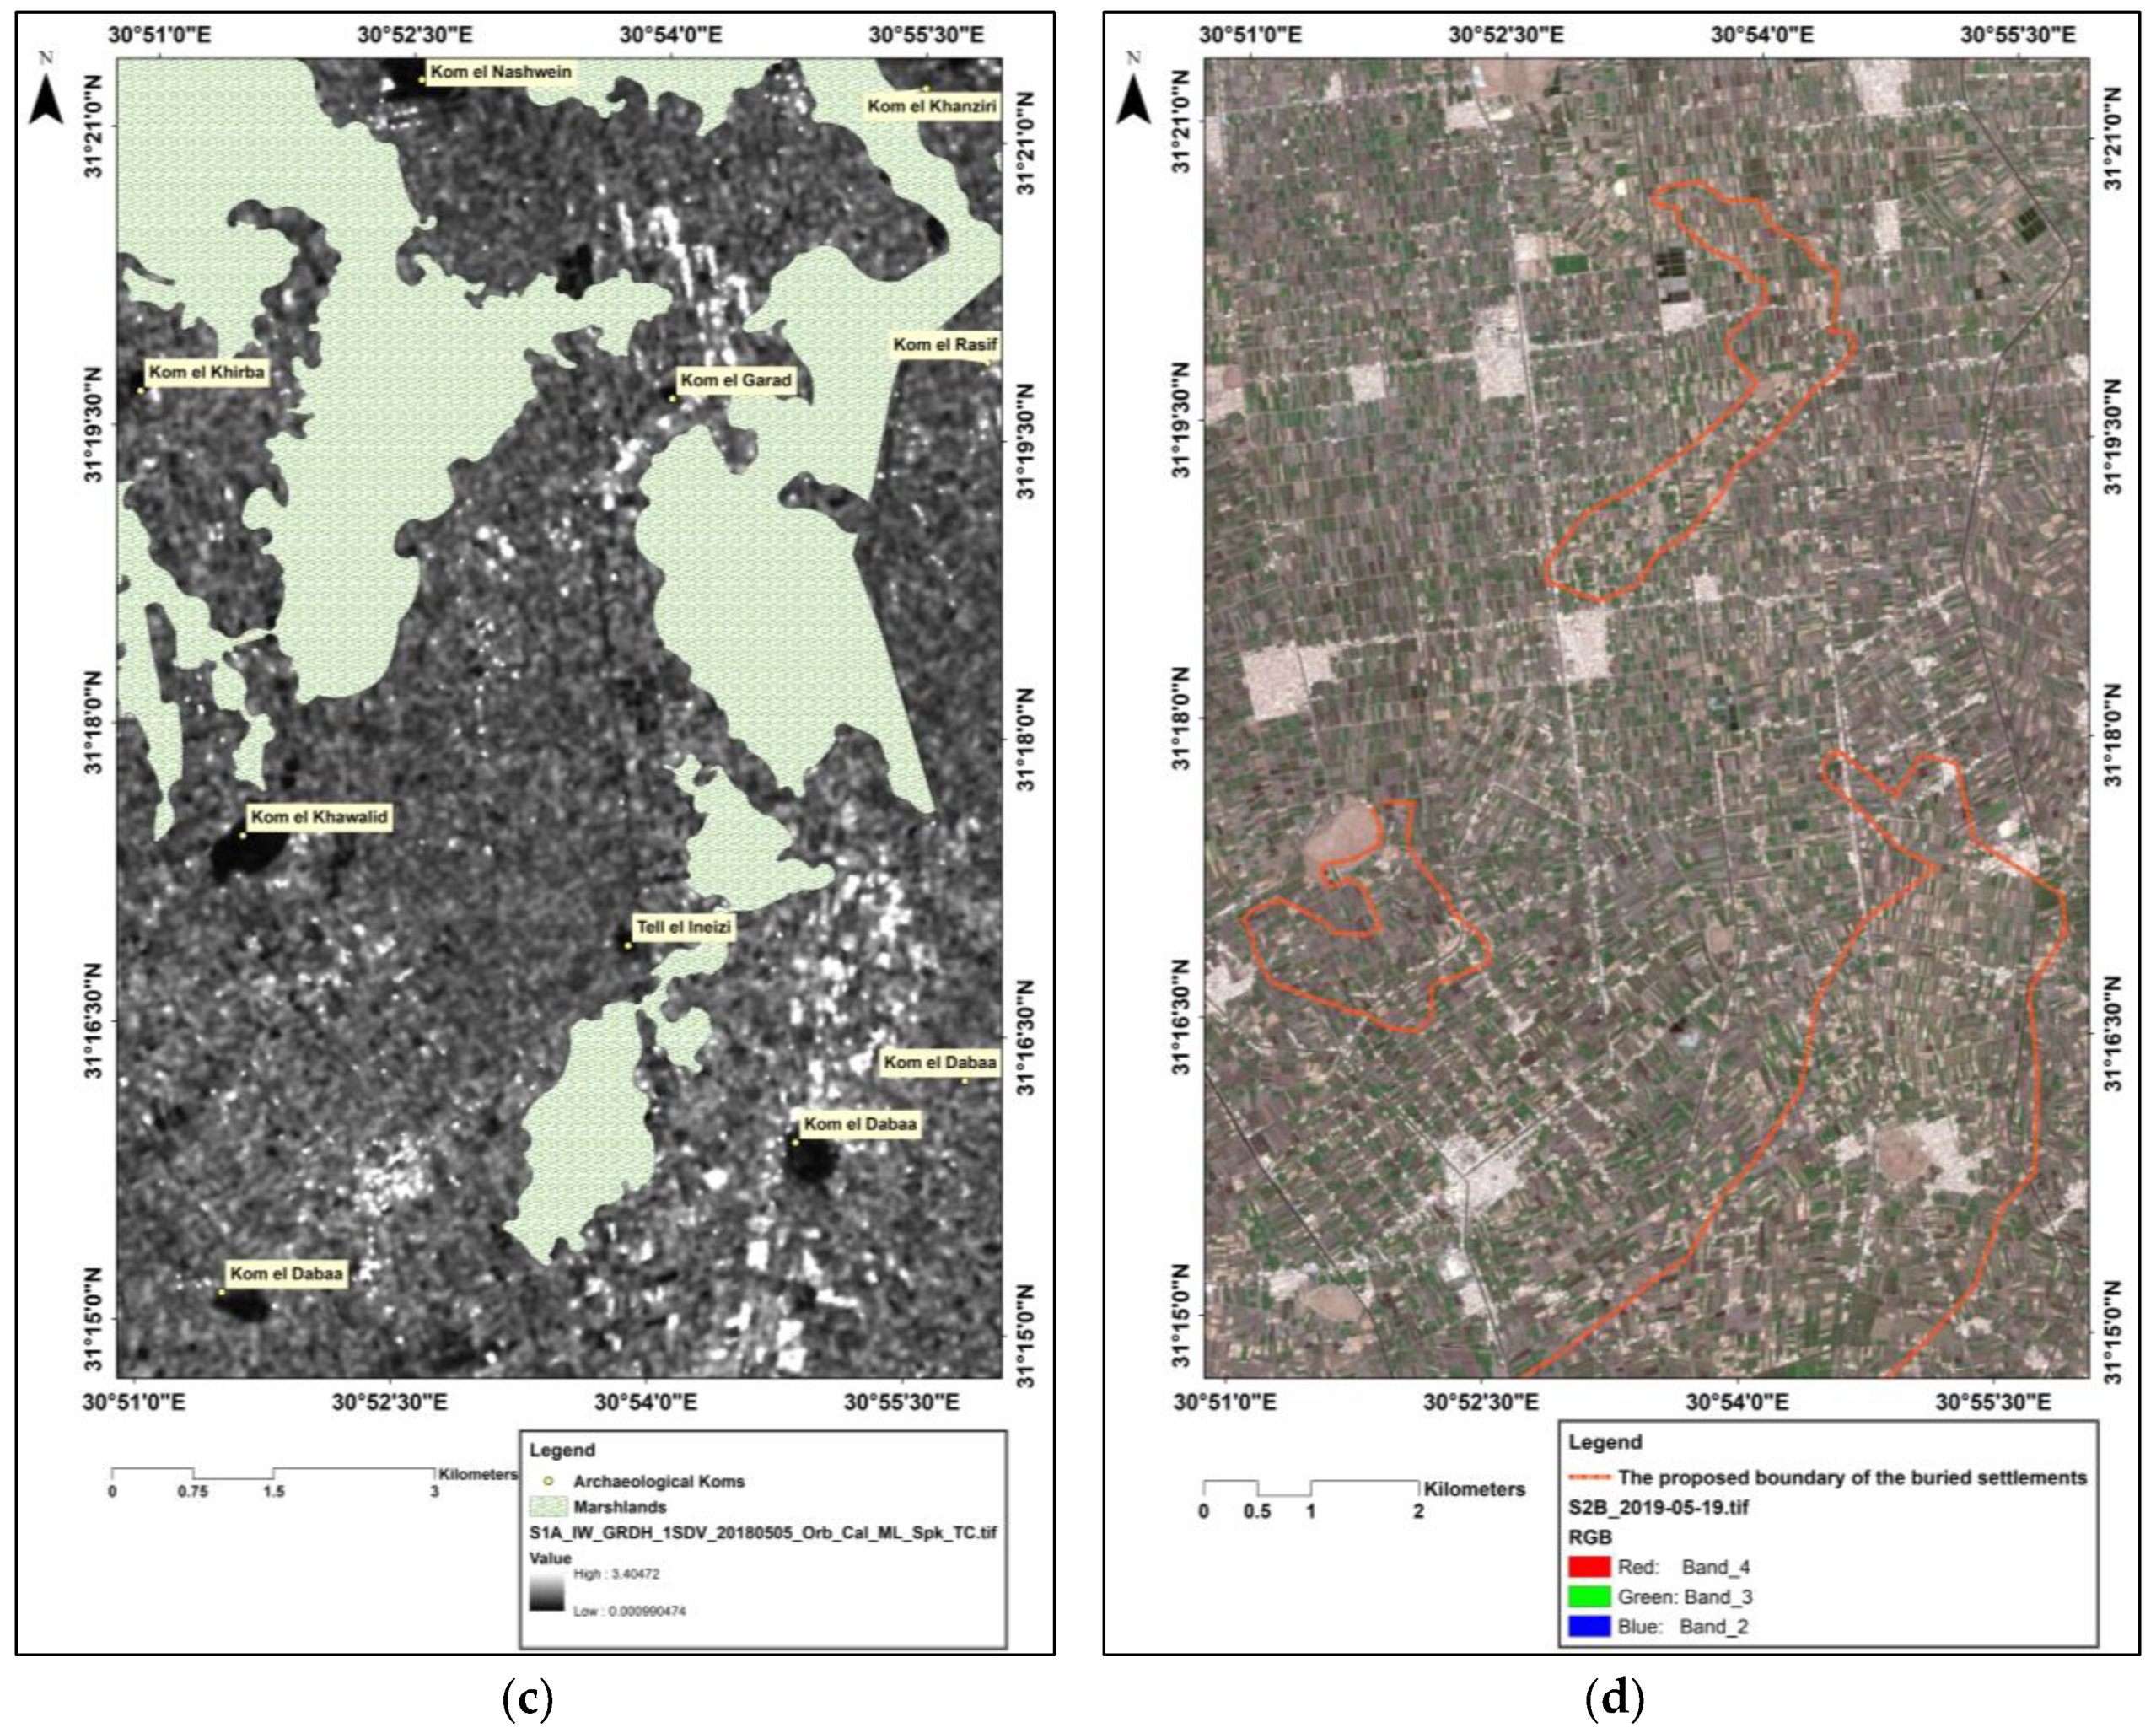
3.3. The Results of the Sentinel-1 (C-Band)
4. Discussions
5. Conclusions
Author Contributions
Funding
Acknowledgments
Conflicts of Interest
References
- Bard, K.A. The Egyptian Predynastic: A review of the evidence. J. Field Archaeol. 1994, 21, 265–288. [Google Scholar] [CrossRef]
- Lippiello, L.E. Landscapes of Ancient Egyptian Religion: Rock Art as Indicator for Formal Ritual Spaces during the Formative Stage of the Egyptian State; Yale University: New Haven, CT, USA, 2012. [Google Scholar]
- Bard, K.A. The geography of excavated Pre-dynastic sites and the rise of complex society. J. Am. Res. Cent. Egypt 1987, 24, 81–93. [Google Scholar] [CrossRef]
- Kaelin, O. Gods in Ancient Egypt. In The Oxford Research Encyclopedia of Religion; (oxfordre.com/religion); Oxford University Press: Oxford, UK, 2016; Available online: https://oxfordre.com/religion/abstract/10.1093/acrefore/9780199340378.001.0001/acrefore-9780199340378-e-244 (accessed on 14 December 2019). [CrossRef]
- Stanley, D.J.; Warne, A.G. Nile Delta: Recent geological evolution and human impact. Science 1993, 260, 628–634. [Google Scholar] [CrossRef] [PubMed]
- Stanley, D.J.; Warne, A.G. Sea level and initiation of Predynastic culture in the Nile delta. Nature 1993, 363, 435. [Google Scholar] [CrossRef]
- Arbouille, D.; Stanley, D.J. Late Quaternary evolution of the Burullus lagoon region, north-central Nile delta, Egypt. Mar. Geol. 1991, 99, 45–66. [Google Scholar] [CrossRef]
- Zimerle, B.K. Before the Pyramids: The Origins of Egyptian Civilization; Teeter, E., Ed.; Oriental Institute of the University of Chicago: Chicago, IL, USA, 2011; pp. 1–288. [Google Scholar]
- El Beialy, S.Y.; Edwards, K.J.; El-Mahmoudi, A.S. Geophysical and palynological investigations of the Tell El Dabaa archaeological site, Nile Delta, Egypt. Antiquity 2001, 75, 735–744. [Google Scholar] [CrossRef]
- Lange-Athinodorou, E. Palaces of the Ancient Mind: The Textual Record versus Archaeological Evidence. 2018, pp. 39–63. Available online: https://www.academia.edu/36185472/Palaces_of_the_Ancient_Mind_the_textual_record_versus_archaeological_evidence (accessed on 14 December 2019).
- Mączyńska, A. The Nile Delta as a Centre of Cultural Interactions Between Upper Egypt and the Southern Levant in the 4th Millennium BC; Poznań Archaeological Museum: Poznań, Poland, 2014; pp. 1–320. [Google Scholar]
- Steindorff, G.; Steele, K.C. When Egypt Ruled the East; University of Chicago Press: Chicago, IL, USA, 2014; pp. 1–304. [Google Scholar]
- Geller, J. From prehistory to history: Beer in Egypt. In The Followers of Horus (Egyptian Studies Association Publication 2); Oxbow: Oxford, UK, 1992; pp. 19–26. [Google Scholar]
- Chyla, J. How Can Remote Sensing Help in Detecting the Threats to Archaeological Sites in Upper Egypt? Geosciences 2017, 7, 97. [Google Scholar] [CrossRef] [Green Version]
- Sparavigna, A.C. The Satellite Archaeological Survey of Egypt. 2011. arXiv 2011, arXiv:1105.6315. Available online: https://docs.google.com/document/d/19nFCK6zqeNFnGPub1y7ttwi57lYDQ6VrDuATrfi5T3k/edit (accessed on 14 December 2019).
- Lasaponara, R.; Masini, N. Satellite synthetic aperture radar in archaeology and cultural landscape: An overview. Archaeol. Prospect. 2013, 20, 71–78. [Google Scholar] [CrossRef]
- Elfadaly, A.; Lasaponara, R. On the Use of Satellite Imagery and GIS Tools to Detect and Characterize the Urbanization around Heritage Sites: The Case Studies of the Catacombs of Mustafa Kamel in Alexandria, Egypt and the Aragonese Castle in Baia, Italy. Sustainability 2019, 11, 2110. [Google Scholar] [CrossRef] [Green Version]
- Elfadaly, A.; Attia, W.; Lasaponara, R. Monitoring the Environmental Risks Around Medinet Habu and Ramesseum Temple at West Luxor, Egypt, Using Remote Sensing and GIS Techniques. J. Archaeol. Method Theory 2018, 25, 587–610. [Google Scholar] [CrossRef]
- Elfadaly, A.; Attia, W.; Qelichi, M.M.; Murgante, B.; Lasaponara, R. Management of Cultural Heritage Sites Using Remote Sensing Indices and Spatial Analysis Techniques. Surv. Geophys. 2018, 39, 1347–1377. [Google Scholar] [CrossRef]
- Elfadaly, A.; Lasaponara, R.; Murgante, B.; Qelichi, M.M. Cultural Heritage Management Using Analysis of Satellite Images and Advanced GIS Techniques at East Luxor, Egypt and Kangavar, Iran (A Comparison Case Study). In Proceedings of the International Conference on Computational Science and Its Applications, Trieste, Italy, 19 July 2017; Springer: Cham, Germany, 2017; pp. 152–168. [Google Scholar] [CrossRef]
- Elfadaly, A.; Wafa, O.; Abouarab, M.A.; Guida, A.; Spanu, P.G.; Lasaponara, R. Geo-Environmental Estimation of Land Use Changes and Its Effects on Egyptian Temples at Luxor City. ISPRS Int. J. Geo-Inf. 2017, 6, 378. [Google Scholar] [CrossRef] [Green Version]
- Lasaponara, R.; Murgante, B.; Elfadaly, A.; Qelichi, M.M.; Shahraki, S.Z.; Wafa, O.; Attia, W. Spatial open data for monitoring risks and preserving archaeological areas and landscape: Case studies at Kom el Shoqafa, Egypt and Shush, Iran. Sustainability 2017, 9, 572. [Google Scholar] [CrossRef] [Green Version]
- Lasaponara, R.; Elfadaly, A.; Attia, W. Low cost space technologies for operational change detection monitoring around the archaeological area of Esna-Egypt. In Proceedings of the International Conference on Computational Science and Its Applications, Beijing, China, 4–7 July 2016; Springer: Cham, Germany, 2016; pp. 611–621. [Google Scholar] [CrossRef]
- Chen, F.; Masini, N.; Yang, R.; Milillo, P.; Feng, D.; Lasaponara, R. A space view of radar archaeological marks: First applications of COSMO-SkyMed X-band data. Remote Sens. 2015, 7, 24–50. [Google Scholar] [CrossRef] [Green Version]
- Tapete, D.; Cigna, F. Urban remote sensing in areas of conflict: TerraSAR-X and Sentinel-1 change detection in the Middle East. In Fourth International Conference on Remote Sensing and Geoinformation of the Environment (RSCy2016); International Society for Optics and Photonics (Paphos, Cyprus): Paphos, Cyprus, 2016; Volume 9688, p. 968821. [Google Scholar]
- Chen, F.; Lasaponara, R.; Masini, N. An overview of satellite synthetic aperture radar remote sensing in archaeology: From site detection to monitoring. J. Cult. Herit. 2017, 23, 5–11. [Google Scholar] [CrossRef]
- Tapete, D. Remote sensing and geosciences for archaeology. Geosci. J. 2018, 8, 41. [Google Scholar] [CrossRef] [Green Version]
- Lange, E.; Ullmann, T.; Baumhauer, R. Remote Sensing in the Nile Delta: Spatio-tempoRal Analysis of BuBastis/Tell Basta. Ägypten und Levante/Egypt and the Levant. Ägypten und Levante 2016, 26, 377–392. [Google Scholar] [CrossRef]
- Trampier, J. Ancient Towns and New Methods: A GIS and Remote Sensing—Guided Archaeological Survey in the Western Nile Delta; The Division of the Humanities at the University of Chicago: Chicago, IL, USA, 2009; Available online: https://knowledge.uchicago.edu/record/115 (accessed on 14 December 2019). [CrossRef]
- Branting, S.; Trampier, J. Geospatial data and theory in archaeology: A view from CAMEL. Space-Archaeol. Final Front. 2007, 272–289. [Google Scholar]
- Trampier, J.R. The Dynamic Landscape of the Western Nile Delta from the New Kingdom to the Late Roman Periods; The University of Chicago: Chicago, IL, USA, 2010; Available online: https://www.academia.edu/352345/The_Dynamic_Landscape_of_the_Western_Nile_Delta_from_the_New_Kingdom_to_the_Late_Roman_Periods (accessed on 14 December 2019).
- Parcak, S. Satellite remote sensing methods for monitoring archaeological tells in the Middle East. J. Field Archaeol. 2007, 32, 65–81. [Google Scholar] [CrossRef]
- Parcak, S.H. Satellite Remote Sensing for Archaeology; Routledge: London, UK, 2009. [Google Scholar] [CrossRef]
- Parcak, S.; Mumford, G.; Childs, C. Using open access satellite data alongside ground based remote sensing: An assessment, with case studies from Egypt’s Delta. Geosciences 2017, 7, 94. [Google Scholar] [CrossRef] [Green Version]
- Edwards, K.J.; Butzer, K.W. Early Hydraulic Civilization in Egypt: A Study in Cultural Ecology. J. Hist. Geogr. 1976, 6, 236. [Google Scholar]
- Ozulu, İ.M.; Süel, M.; Tombuş, F.E.; Coşar, M. The Importance of Maps at the Archaeological Excavations Works. In Proceedings of the FIG Working Week, Rome, Italy, 6–10 May 2012. [Google Scholar]
- Campana, S. Archaeological site detection and mapping: Some thoughts on differing scales of detail and archaeological ‘non-visibility’. In Seeing the Unseen. Geophysics and Landscape Archaeology; CRC Press: Boca Raton, FL, USA, 2008; pp. 31–52. [Google Scholar]
- Petrie, C.; Orengo, H.; Green, A.; Walker, J.; Garcia, A.; Conesa, F.; Knox, J.; Singh, R. Mapping Archaeology While Mapping an Empire: Using Historical Maps to Reconstruct Ancient Settlement Landscapes in Modern India and Pakistan. Geosciences 2019, 9, 11. [Google Scholar] [CrossRef] [Green Version]
- Scianna, A.; Villa, B. GIS applications in archaeology. Archeol. Calcolatori 2011, 22, 337–363. [Google Scholar]
- Wahab, H.S.A.; Stanley, D.J. Clay mineralogy and the recent evolution of the north-central Nile delta, Egypt. J. Coast. Res. 1991, 7, 317–329. [Google Scholar]
- Karyabwite, D.R. Water Sharing in the Nile River Valley; UNEP/DEWA/Grid: Geneva, Switzerland, 2000; Available online: http://nile.riverawarenesskit.org/english/nrak/Resources/Document_centre/UNEP_Water_Sharing_in_the_Nile_River_Valley_2000.pdf (accessed on 14 December 2019).
- Gaber, H.M.; Bahnassy, M.H.; Suliman, A.S.; El-Bana, T.A. Agroecological assessment of land resources in Northern Nile Delta: A case study in Kafr El-Shikh governorate. J. Agric. Sci. Mansoura Univ. 2003, 28, 7485–7502. [Google Scholar]
- USGS Home Page. Available online: https://earthexplorer.usgs.gov/ (accessed on 27 June 2019).
- ESA Home Page. Available online: https://scihub.copernicus.eu/ (accessed on 27 June 2019).
- Topographic Maps of Egypt. Available online: http://legacy.lib.utexas.edu/maps/ams/egypt/ (accessed on 14 September 2019).
- Band Designations for the Landsat Satellites. Available online: https://www.usgs.gov/faqs/what-are-band-designations-landsat-satellites?qt-news_science_products=0#qt-news_science_products (accessed on 27 June 2019).
- Pinty, B.; Verstraete, M.M. GEMI: A non-linear index to monitor global vegetation from satellites. Vegetatio 1992, 101, 15–20. [Google Scholar] [CrossRef]
- Mondal, P. Quantifying surface gradients with a 2-band Enhanced Vegetation Index (EVI2). Ecol. Indic. 2011, 11, 918–924. [Google Scholar] [CrossRef]
- Gitelson, A.A. Wide dynamic range vegetation index for remote quantification of biophysical characteristics of vegetation. J. Plant Physiol. 2004, 161, 165–173. [Google Scholar] [CrossRef] [Green Version]
- Steven, M.D. The sensitivity of the OSAVI vegetation index to observational parameters. Remote Sens. Environ. 1998, 63, 49–60. [Google Scholar] [CrossRef]
- All Data Products in the Sentinel1. Available online: https://sentinel.esa.int/web/sentinel/missions/sentinel-1/data-products (accessed on 27 June 2019).
- User Guides for Sentinel-1-SAR Level-1. Available online: https://sentinel.esa.int/web/sentinel/user-guides/sentinel-1-sar/product-types-processing-levels/level-1 (accessed on 27 June 2019).
- Fletcher, K. SENTINEL 1: ESA’s Radar Observatory Mission for GMES Operational Services; European Space Agency: Paris, France, 2012. [Google Scholar]
- Mancon, S.; Guarnieri, A.M.; Tebaldini, S. Sentinel-1 precise orbit calibration and validation. In Proceedings of the Fringe 2015: Advances in the Science and Applications of SAR Interferometry and Sentinel-1 InSAR Workshop, Frascati, Italy, 23–27 March 2015; pp. 1–4. [Google Scholar]
- Twele, A.; Cao, W.; Plank, S.; Martinis, S. Sentinel-1-based flood mapping: A fully automated processing chain. Int. J. Remote Sens. 2016, 37, 2990–3004. [Google Scholar] [CrossRef]
- Level-1 Radiometric Calibration. Available online: https://sentinels.copernicus.eu/web/sentinel/radiometric-calibration-of-level-1-products (accessed on 27 June 2019).
- Veloso, A.; Mermoz, S.; Bouvet, A.; Le Toan, T.; Planells, M.; Dejoux, J.F.; Ceschia, E. Understanding the temporal behavior of crops using Sentinel-1 and Sentinel-2-like data for agricultural applications. Remote Sens. Environ. 2017, 199, 415–426. [Google Scholar] [CrossRef]
- Liu, C. Analysis of Sentinel-1 SAR Data for Mapping Standing Water in the Twente Region; University of Twente: Enschede, The Netherlands, 2016. [Google Scholar]
- Weiß, T. SAR Pre-processing Documentation. 2018. Available online: https://buildmedia.readthedocs.org/media/pdf/multiply-sar-pre-processing/get_to_version_0.4/multiply-sar-pre-processing.pdf (accessed on 14 December 2019).
- Abdurahman Bayanudin, A.; Heru Jatmiko, R. Orthorectification of Sentinel-1 SAR (Synthetic Aperture Radar) Data in Some Parts of South-eastern Sulawesi Using Sentinel-1 Toolbox. In Proceedings of the IOP Conference Series: Earth and Environmental Science, Yogyakarta, Indonesia, 17–19 October 2016; Volume 47, p. 012007. [Google Scholar]
- Adriansen, H.K. Land reclamation in Egypt: A study of life in the new lands. Geoforum 2009, 40, 664–674. [Google Scholar] [CrossRef] [Green Version]
- Small, D.; Schubert, A. Guide to ASAR geocoding. In ESA-ESRIN Technical Note RSL-ASAR-GC-AD; University of Zürich: Zürich, Switzerland, 2008; Volume 1, p. 36. [Google Scholar]
- The Season of Wheat Harvesting in Egypt. Available online: https://ww.dailynewssegypt.com/2016/05/11/egypt-welcomes-season-wheat-harvesting/ (accessed on 16 September 2019).
- Dewidar, K.H.; Al Rehili, B. Assessment of vegetation indices for estimating plant coverage and plant density in the Northern Sarawat Mountains, Saudi Arabia. Merit Res. J. Agric. Sci. Soil Sci. 2013, 1, 19–32. [Google Scholar]
- Statuto, D.; Cillis, G.; Picuno, P. Using historical maps within a GIS to analyze two centuries of rural landscape changes in Southern Italy. Land 2017, 6, 65. [Google Scholar] [CrossRef] [Green Version]
- Xu, N.; Tian, J.; Tian, Q.; Xu, K.; Tang, S. Analysis of Vegetation Red Edge with Different Illuminated/Shaded Canopy Proportions and to Construct Normalized Difference Canopy Shadow Index. Remote Sens. 2019, 11, 1192. [Google Scholar] [CrossRef] [Green Version]
- Tapete, D.; Cigna, F. Trends and perspectives of space-borne SAR remote sensing for archaeological landscape and cultural heritage applications. J. Archaeol. Sci. Rep. 2017, 14, 716–726. [Google Scholar] [CrossRef] [Green Version]
- Holz, R.K. Man-made landforms in the Nile Delta. Geogr. Rev. 1969, 59, 253–269. [Google Scholar] [CrossRef]
- Smith, W. Dictionary of Greek and Roman Geography London. 1857. Available online: https://archive.org/details/dictionarygreek01smitgoog/page/n4 (accessed on 14 December 2019).
- Le Quien, M. Oriens Christianus. In Quatuor Patriarchatus Digestus: Quo Exhibentur Ecclesiae, Patriarchae, Caeterique Praesules Totius Orientis. Ecclesiam Maronitarum, Patriarchatum Hierosolymitanum, [et] Quotquot fuerunt Ritus Latini tam Patriarchae quam inferiores Praesules in quatuor Patriarchatus [et] in Oriente universo, complectens; Tomus Tertius; ex typographia regia: Paris, France, 1740; Volume 3, pp. 539–540. [Google Scholar]
- Worp, K.A. A checklist of bishops in Byzantine Egypt (AD 325-c. 750). Zeitschrift für Papyrologie und Epigraphik 1994, 100, 283–318. [Google Scholar]
- Dumont, H.J.; El-Shabrawy, G.M. Lake Borullus of the Nile Delta: A short history and an uncertain future. AMBIO: A J. Hum. Environ. 2007, 36, 677–683. [Google Scholar] [CrossRef]
- Mourad, S.A. From Hellenism to Christianity and Islam: The Origin of the Palm Tree Story concerning Mary and Jesus in the Gospel of Pseudo-Matthew and the Qur’an’. Oriens Christ. 2002, 86, 206–216. [Google Scholar]
- Ecclesiastical Map of Egypt with Names in Greek and Arabic. Available online: http://www.bl.uk/manuscripts/FullDisplay.aspx?ref=Add_MS_5662 (accessed on 22 November 2019).
- Hayes, W.C. Most Ancient Egypt; University of Chicago Press: Chicago, FL, USA, 1965; pp. 1–160. Available online: https://oi.uchicago.edu/sites/oi.uchicago.edu/files/uploads/shared/docs/most_ancient.pdf (accessed on 14 December 2019).
- Ginau, A.; Schiestl, R.; Wunderlich, J. Integrative geoarchaeological research on settlement patterns in the dynamic landscape of the northwestern Nile delta. Q. Int. 2019, 511, 51–67. [Google Scholar] [CrossRef]
- Wilson, P. Human and Deltaic Environments in the Northern Egypt in Late Antiquity. Late Antique Archaeol. 2018, 13, 42–62. [Google Scholar]
- Maisels, C.K. Early Civilizations of the Old World: The Formative Histories of Egypt, the Levant, Mesopotamia, India and China; Routledge: London, UK, 2003; pp. 1–504. [Google Scholar] [CrossRef]
- Hassan, F.A. The dynamics of a riverine civilization: A geoarchaeological perspective on the Nile Valley, Egypt. World Archaeol. 1997, 29, 51–74. [Google Scholar] [CrossRef]
- Bard, K.A.; Fattovich, R.; Ward, C. Sea port to punt: New evidence from Marsâ Gawâsîs, Red Sea (Egypt). BAR INT. SER. 2007, 1661, 143. [Google Scholar]
- Bard, K.A. An Introduction to the Archaeology of Ancient Egypt, 2nd ed.; John Wiley & Sons: Hoboken, NJ, USA, 2015; pp. 1–480. [Google Scholar]
- Alan, K.B.; Eugene Rogan. Egyptian agriculture in historical perspective. In Agriculture in Egypt from Pharaonic to Modern Times; (Proceedings of the British Academy 96, Oxford 1999); University of Oxford: Oxford, UK, 1999; p. xxviii + 427. ISBN 0–19–726183–3. [Google Scholar] [CrossRef]
- Mourad, A.L. Rise of the Hyksos: Egypt and the Levant from the Middle Kingdom to the early Second Intermediate Period. Ph.D. Thesis, Macquarie University, Sydney, Australia, 2014. [Google Scholar]
- Bronn, J.A. Foreign rulers of the Nile: A reassessment of the cultural contribution of the Hyksos in Egypt. Ph.D. Thesis, University of Stellenbosch, Stellenbosch, South Africa, 2006; pp. 1–127. [Google Scholar]
- Maspero, G. Manual of Egyptian Archaeology and Guide to the Study of Antiquities in Egypt: For the Use of Students and Travellers; H. Grevel and Company: Putnam, NY, USA, 1895; Available online: https://archive.org/details/manualofegyptian00maspuoft/page/n6 (accessed on 14 December 2019).
- Rawlinson, G. History of Ancient Egypt; G. P. Putnam’s Sons: New York, NY, USA; T. Fisher Unwin: London, UK; John, B. Alden: New York, NY, USA, 1886; Volume 2. [Google Scholar]
- ESA Earth Observation Missions. Available online: https://earth.esa.int/web/guest/missions/esa-eo-missions (accessed on 16 September 2019).


| Raw Data | Sensor | Scale/Resolution | Acquisition Date | Source |
|---|---|---|---|---|
| Topographic Maps | _ _ _ _ | _ 1:100000 1:25000 1:50000 | 1722 1941 1950 1997 | British Library Board American War Office Egyptian General Survey Authority |
| Optical Data | Corona J-1 (KH-4A) Landsat MSS Landsat MSS Landsat MSS Landsat TM | 2.75 m 60 m 60 m 60 m 30 m | Jan 1965 May 1973 May 1978 May 1987 May 2005 | USGS (Earth Explorer) |
| Radar data | SRTM Sentinel 1A Sentinel 1B | 1-ARC Second Global 30 m Level-1 GRD (IW) 20x22 m Level-1 GRD (IW) 20x22 m | Sep 2014 May 2018 May 2019 | USGS ESA (data scientific hub) |
| Landsat MSS 1–3 | Landsat MSS 4–5 | Wavelength (Micrometers) | Resolution (m) |
|---|---|---|---|
| Band 4—Blue | Band 1—Blue | 0.5–0.6 | 60 |
| Band 5—Green | Band 2—Green | 0.6–0.7 | 60 |
| Band 6—Red | Band 3—Red | 0.7–0.8 | 60 |
| Band 7—Near Infrared (NIR) | Band 4—Near Infrared (NIR) | 0.8–1.1 | 60 |
| Landsat Thematic Mapper (TM4, 5) Bands | Wavelength (Micrometers) | Resolution (m) |
|---|---|---|
| Band 1 | 0.45–0.52 | 30 |
| Band 2-Green | 0.52–0.60 | 30 |
| Band 3-Red | 0.63–0.69 | 30 |
| Band 4-Near Infrared (NIR) | 0.76–0.90 | 30 |
| Band 5-Shortwave Infrared (SWIR) 1 | 1.55–1.75 | 30 |
| Band 7-Shortwave Infrared (SWIR) 2 | 2.08–2.35 | 30 |
© 2019 by the authors. Licensee MDPI, Basel, Switzerland. This article is an open access article distributed under the terms and conditions of the Creative Commons Attribution (CC BY) license (http://creativecommons.org/licenses/by/4.0/).
Share and Cite
Elfadaly, A.; A. R. Abouarab, M.; M. El Shabrawy, R.R.; Mostafa, W.; Wilson, P.; Morhange, C.; Silverstein, J.; Lasaponara, R. Discovering Potential Settlement Areas around Archaeological Tells Using the Integration between Historic Topographic Maps, Optical, and Radar Data in the Northern Nile Delta, Egypt. Remote Sens. 2019, 11, 3039. https://0-doi-org.brum.beds.ac.uk/10.3390/rs11243039
Elfadaly A, A. R. Abouarab M, M. El Shabrawy RR, Mostafa W, Wilson P, Morhange C, Silverstein J, Lasaponara R. Discovering Potential Settlement Areas around Archaeological Tells Using the Integration between Historic Topographic Maps, Optical, and Radar Data in the Northern Nile Delta, Egypt. Remote Sensing. 2019; 11(24):3039. https://0-doi-org.brum.beds.ac.uk/10.3390/rs11243039
Chicago/Turabian StyleElfadaly, Abdelaziz, Mohamed A. R. Abouarab, Radwa R. M. El Shabrawy, Wael Mostafa, Penelope Wilson, Christophe Morhange, Jay Silverstein, and Rosa Lasaponara. 2019. "Discovering Potential Settlement Areas around Archaeological Tells Using the Integration between Historic Topographic Maps, Optical, and Radar Data in the Northern Nile Delta, Egypt" Remote Sensing 11, no. 24: 3039. https://0-doi-org.brum.beds.ac.uk/10.3390/rs11243039