Evaluating Thermal Attribute Mapping Strategies for Oblique Airborne Photogrammetric System AOS-Tx8


1
Institute of Photogrammetry and Remote Sensing, Technische Universität Dresden, 01069 Dresden, Germany
2
Institute of Geoinformation and Surveying, Hochschule Anhalt, 06846 Dessau-Roßlau, Germany
*
Author to whom correspondence should be addressed.
Remote Sens. 2020, 12(1), 112; https://0-doi-org.brum.beds.ac.uk/10.3390/rs12010112
Submission received: 15 November 2019
/
Revised: 20 December 2019
/
Accepted: 25 December 2019
/
Published: 30 December 2019
(This article belongs to the Special Issue Point Cloud Processing in Remote Sensing)
Abstract
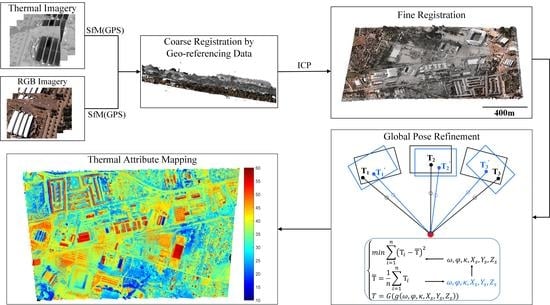
:Thermal imagery is widely used in various fields of remote sensing. In this study, a novel processing scheme is developed to process the data acquired by the oblique airborne photogrammetric system AOS-Tx8 consisting of four thermal cameras and four RGB cameras with the goal of large-scale area thermal attribute mapping. In order to merge 3D RGB data and 3D thermal data, registration is conducted in four steps: First, thermal and RGB point clouds are generated independently by applying structure from motion (SfM) photogrammetry to both the thermal and RGB imagery. Next, a coarse point cloud registration is performed by the support of georeferencing data (global positioning system, GPS). Subsequently, a fine point cloud registration is conducted by octree-based iterative closest point (ICP). Finally, three different texture mapping strategies are compared. Experimental results showed that the global image pose refinement outperforms the other two strategies at registration accuracy between thermal imagery and RGB point cloud. Potential building thermal leakages in large areas can be fast detected in the generated texture mapping results. Furthermore, a combination of the proposed workflow and the oblique airborne system allows for a detailed thermal analysis of building roofs and facades.
1. Introduction
Driven by the fast development of uncooled microbolometer detector arrays, uncooled thermal cameras are widely used in applications such as building insulation inspection [1,2], forest fire protection [3], power equipment monitoring [4], flow surface velocimetry [5], gender recognition [6], night vision [7], precision agriculture [8], soil moisture deficit detection [9], and groundwater discharge evaluation [10].
Considering that 2D thermal cameras have limited spatial resolution and a narrow field of view (FOV), each image usually only covers a small part of the scene. Direct applications of 2D thermal images suffer from the absence of 3D details and the disconnection from real 3D structures. Furthermore, manual identification of the locations of thousands of images is a hinder for further applications. Therefore, most of the state-of-the-art research focuses on mapping a large number of thermal images to a 3D model [11]. On the one hand, 3D models (e.g., point clouds) provide high-level and large-scale geometric details for interpretation. On the other hand, thermal attributes provide an additional feature (i.e., radiant temperature) for 3D models, which is useful for classification and object recognition [12]. Therefore, the fusion of thermal imagery with existing 3D models is attracting more and more attention in recent years.
In this work, an oblique airborne photogrammetric system called AOS-Tx8 was used for large-scale area thermal attribute mapping [13]. Considering that RGB imagery has a much higher resolution and more image texture than thermal imagery, point clouds generated from RGB imagery are taken as 3D reference geometry, while thermal images provide temperature information for thermal attribute mapping. Thus, the first problem for this workflow lies in the unknown registration relation between thermal images and the targeted 3D point cloud. After registration, neighboring thermal images are usually registered with varying geometric and radiometric accuracies. Thus, redundancy and discrepancies have to be processed in a proper way when assigning thermal attributes to a point cloud. Therefore, the main challenges in airborne thermal attribute mapping mainly manifest in two aspects: geometric registration and thermal attribute mapping strategy.
1.1. Related Work
Existing thermal 2D-3D fusion works are classified into three categories according to the type of the reference 3D model: laser scanning point cloud, photogrammetric point cloud, and polyhedral model.
1.1.1. Laser Scanning Point Cloud
Alba et al. [14] presented a “bi-camera” system, which couples a thermal camera and an RGB camera, to generate 3D thermal data for the analysis of anomalies in building structures. Terrestrial laser scanning is utilized to acquire 3D reference building models. The relative orientation of the RGB camera and the thermal camera is fixed. The registration between the “bi-camera” system and the 3D reference model is conducted by manually identifying several homologous points.
Borrmann et al. [15] presented an automated system to perform thermal 3D mapping using a mobile robot called Irma3D. A laser scanner, an RGB camera, and a thermal camera are arranged on the mobile platform. For the purpose of registering thermal images, RGB images and point clouds are registered into the same coordinate system and several tie points, which are identifiable in both the images and in the laser scanner point clouds, should be detected during calibration. For the RGB camera calibration, a printed chessboard is chosen, while for the thermal camera, some light bulbs arranged in a grid board are used. Furthermore, these two calibration boards are mounted on tripods, which makes them easy to be detected in the point cloud data.
González-Aguilera et al. [16] introduced an approach for the registration of thermal images and point clouds acquired by terrestrial laser scanners. In this work, the registration is implemented in an image-to-image manner. Firstly, the acquired 3D point cloud is transformed into a 2D range image. Afterwards, the registration is conducted between the generated range image and a thermal image using the Harris feature detector and a hierarchical matching strategy. Finally, the pose of the thermal image is computed based on a robust image spatial resection. This work uses only a single thermal image for building surface temperature mapping.
1.1.2. Photogrammetric Point Cloud
Ham and Golparvar-Fard [17] designed a special kind of thermal camera, which provides the opportunity to acquire a pair-wise thermal image and an RGB image at the same time. First, the captured RGB images are processed by structure from motion (SfM) tools to acquire image pose information. Then, the exterior orientation parameters of thermal images are calculated according to the fixed relative pose of the thermal camera with respect to the RGB camera. Dense 3D thermal point clouds are then generated using multiple view stereovision (MVS) algorithms. This method is limited to the use of special camera which could capture thermal images and RGB images simultaneously.
Javadnejad [18] used an unmanned aerial vehicle (UAV)-based RGB-thermal co-capturing image system to perform thermal attribute mapping for buildings. First, RGB images are utilized to generate 3D point clouds. Then, with respect to the generated 3D point cloud, the exterior orientation parameters of thermal images are estimated by a boresight transformation. Finally, for each point, the mean temperature of the overlapping images is chosen.
Vidas and Moghadam [19] designed a hand-hold 3D thermography device called HeatWave to detect and visualize hot and cold spots for water pump systems and air conditioning control systems. The device consists of a thermal camera, a range sensor, and an RGB camera. All of these cameras are installed with fixed distances and orientations on an ergonomic handle. For each target point, this system incorporated information from multiple views to reduce systematic errors caused by thermal reflection and object occlusion. Vidas et al. [20] extended this low-cost handheld device system to generate and visualize 3D temperature models in real time. A risk-averse neighborhood weighting mechanism is conducted to alleviate the misalignment problems during surface temperature assignment.
Yang et al. [21] fused RGB images and thermal images to reconstruct 3D thermal models using two smartphones. All of the used sensors (two smartphone RGB sensors and one FLIR low-cost thermal sensor) are installed on a theodolite. The registration is implemented by prior fixed relative pose and normalized cross correlation. Finally, VisualSFM software and OpenMVS are employed to generate 3D thermal models.
Maes et al. [22] compared three different alignment procedures (i.e., camera pre-calibration, correction of thermal imagery for small changes in air temperature, and improved estimation of the initial image position by making use of the alignment of RGB images) for UAV-based thermal imagery. Experiments showed that utilizing the initial thermal camera position knowledge calculated from RGB imagery alignment effectively improved the alignments. Air temperature correction had small positive impacts, while camera pre-calibration had a very limited effect.
Recently, Lin et al., [23] merged terrestrial thermal imagery and point clouds obtained from RGB imagery for the inspection of building insulation. Without the requirements of georeferencing data and prior relative pose knowledge, registration is implemented by coarse point cloud registration, fine matching of image pairs, and global image pose refinement. Furthermore, a quantitative temperature evaluation is conducted. Experiments showed that a high geometric accuracy and a good radiometric accuracy with root-mean-square error (RMSE) lower than 1.5 °C can be achieved.
1.1.3. Polyhedral Model
For the purpose of registering thermal image sequences to the given 3D polyhedral models, Hoegner and Stilla [24] investigated a relative orientation method using Nistér’s five-point algorithm and image triplets for terrestrial thermal image texture mapping of building facades.
Hoegner and Stilla [25] computed the image pose parameters of thermal image sequence by tracking scale-invariant feature transform (SIFT) features based on cross-correlation. Then, orientation parameters are further refined by a bundle adjustment approach taking the reference building model into consideration. Afterwards, textures from different times, but almost the same viewing angle, are used to analyze the dynamic processes of building facades.
Hoegner and Stilla [26] summarized and compared two workflows: 3D-2D registration (aligning thermal image sequences to the given 3D models) and 3D-3D registration (matching thermal point clouds to RGB point clouds). Results showed that standard deviations of exterior orientation parameters achieved by 3D-2D registration are larger than those achieved by 3D-3D registration. Furthermore, the authors stated that texture extraction results are very sensitive to the errors in the image viewing angle computation.
Focusing on the quality assessment of building textures extracted from oblique airborne thermal imagery, Iwaszczuk and Stilla [27] took several criteria (e.g., resolution, occlusion, and matching accuracy) into consideration for quality assessment. Recently, considering that direct georeferencing is not accurate enough for precise texture extraction, Iwaszczuk and Stilla [28] presented a line-based 3D-2D registration approach. Specifically, the uncertainties of the reference 3D building models and the uncertainties of the extracted image features are both considered during the registration procedure.
1.2. Contributions and Paper Structure
In general, most of the existing thermal 2D-3D fusion works focus on building insulation inspection and are limited to small-scale thermal analysis (e.g., single building). The work of thermal investigation for large-scale areas is still lacking. In this work, an oblique airborne thermal camera system is used to fill this gap. The main goals and contributions of the work presented here include:
- Potential thermal leakage detection: The oblique airborne photogrammetric system used in this study provides a solution to automatically detect potential thermal leakages for large-scale areas. Specifically, RGB cameras from different perspectives provide accurate and detailed 3D reference models, while thermal cameras give the evidence for existing temperature anomalies, which represent the potential thermal leakages.
- Building facade information retrieval: With the help of multiple RGB and thermal cameras providing information from different points of view, both the rooftop and facade information can be acquired during the measurements. Thus, the oblique airborne system used in this study provides a new insight into the building condition (e.g., solar energy utilization).
- Registration and thermal attribute mapping: A novel workflow is proposed to process the data collected by an integrated RGB and thermal airborne camera system. Firstly, the registration between thermal imagery and RGB photogrammetric point clouds is conducted by a coarse point cloud registration supported by global positioning system (GPS) data and a fine point cloud registration based on iterative closest point (ICP). Then, in order to achieve great photogrammetric consistency of thermal attribute mapping results, three different strategies including texture selection based on thermal radiant characteristics [29], mean temperature computation of overlapping images [18], and global image pose refinement [23] are compared and tested on three different areas (built-up area, water area, bare soil). Relative registration accuracy between sensors rather than absolute geometric accuracy is used to evaluate the texture mapping results.
The structure for the rest parts of this paper is as follows. In Section 2, the oblique airborne thermal camera system AOS-Tx8 is described. In Section 3, camera calibration is first briefly illustrated in Section 3.1. Next, the point cloud generation procedure is described in Section 3.2.1. Point cloud registration is shown in Section 3.2.2. Then, several thermal attribute mapping strategies are explained in Section 3.2.3. Geometric accuracy evaluation of relative registration between sensors is illustrated in Section 3.3. Thermal attribute mapping results achieved by different strategies are compared and discussed in Section 4. Section 5 gives conclusions.
2. Description of AOS-Tx8
An oblique airborne system, namely, AOS-Tx8 consisting of four RGB cameras (Baumer VCXG-53c) and four uncooled thermal cameras (FLIR A65sc) was developed for use on helicopters [13]. The detailed information of the used cameras is shown in Table 1.
The four RGB cameras and the four thermal cameras are assembled in the block configuration shown in Figure 1. The overlap of the thermal cameras in static configuration is around 12%. Since the opening angle of the RGB cameras is larger, the overlap of the RGB cameras is correspondingly higher. Considering that the synchronization of the RGB cameras is not transferable for thermal cameras due to the different firmware used, the whole system is operated with the frame rate of 5 Hz. A survey at a height of approximately 400 m was carried out with AOS-Tx8 on 2 July 2018. Under such a circumstance, the ground sampling distance (GSD) for the RGB camera was about 0.08 m, while the GSD for the thermal camera was around 0.30 m. The aim of the campaign was to fuse spatially low-resolved 3D thermal data with the 3D RGB data of higher spatial resolution. The dimensions of AOS-Tx8 are 330 × 420 × 320 mm (height × width × length) and the weight is 11.6 kg; hence, it can also be integrated into small aircrafts. More details of the hardware system used can be found in [13].
3. Methodology
3.1. Camera Calibration
In terms of radiometric calibration, as the sensor materials used in uncooled thermal cameras are not as mature and uniform as the silicon used in RGB cameras, non-uniformity severely degrades the image quality. For the purpose of accurate object temperature retrieval, a shutter-based radiometric calibration approach (FLIR GEV software) was used to perform non-uniformity correction (NUC). This shutter-based correction method uses the camera shutter as an alternative blackbody and every acquired thermal image is calibrated according to the shutter temperature. Furthermore, the method requires the shutter to be closed once at intervals of 90–120 s, then the shutter temperature is updated and taken as the new reference for calibration. As shutter closure takes about 1.5 s every time and no data can be captured during this time, the pilot operator manually controls the trigger to avoid data gaps. According to the work [30], FLIR GEV software has a maximum deviation of up to ±5 °C in temperature measurement under a challenging ambient environment (i.e., the maximum rate of change in sensor temperature is more than 1.0 °C/min). Although shutterless approaches [30,31] could provide more accurate radiometric calibration results (e.g., 2 °C deviation in [30]) in some circumstances (e.g., uniform changing ambient temperature simulated by the climate chamber), shutterless methods usually require at least one real-time recorded sensor temperature (e.g., focal plane array, FPA temperature) as input. Furthermore, shutterless correction approaches are less robust than shutter-based methods when confronted with non-uniform ambient temperature changes [31], which is the normal case for airborne surveys. Due to the lack of real-time FPA temperature as input and the concern of algorithm robustness in this study, we used the traditional shutter-based compensation approach (FLIR GEV software) for radiometric calibration.
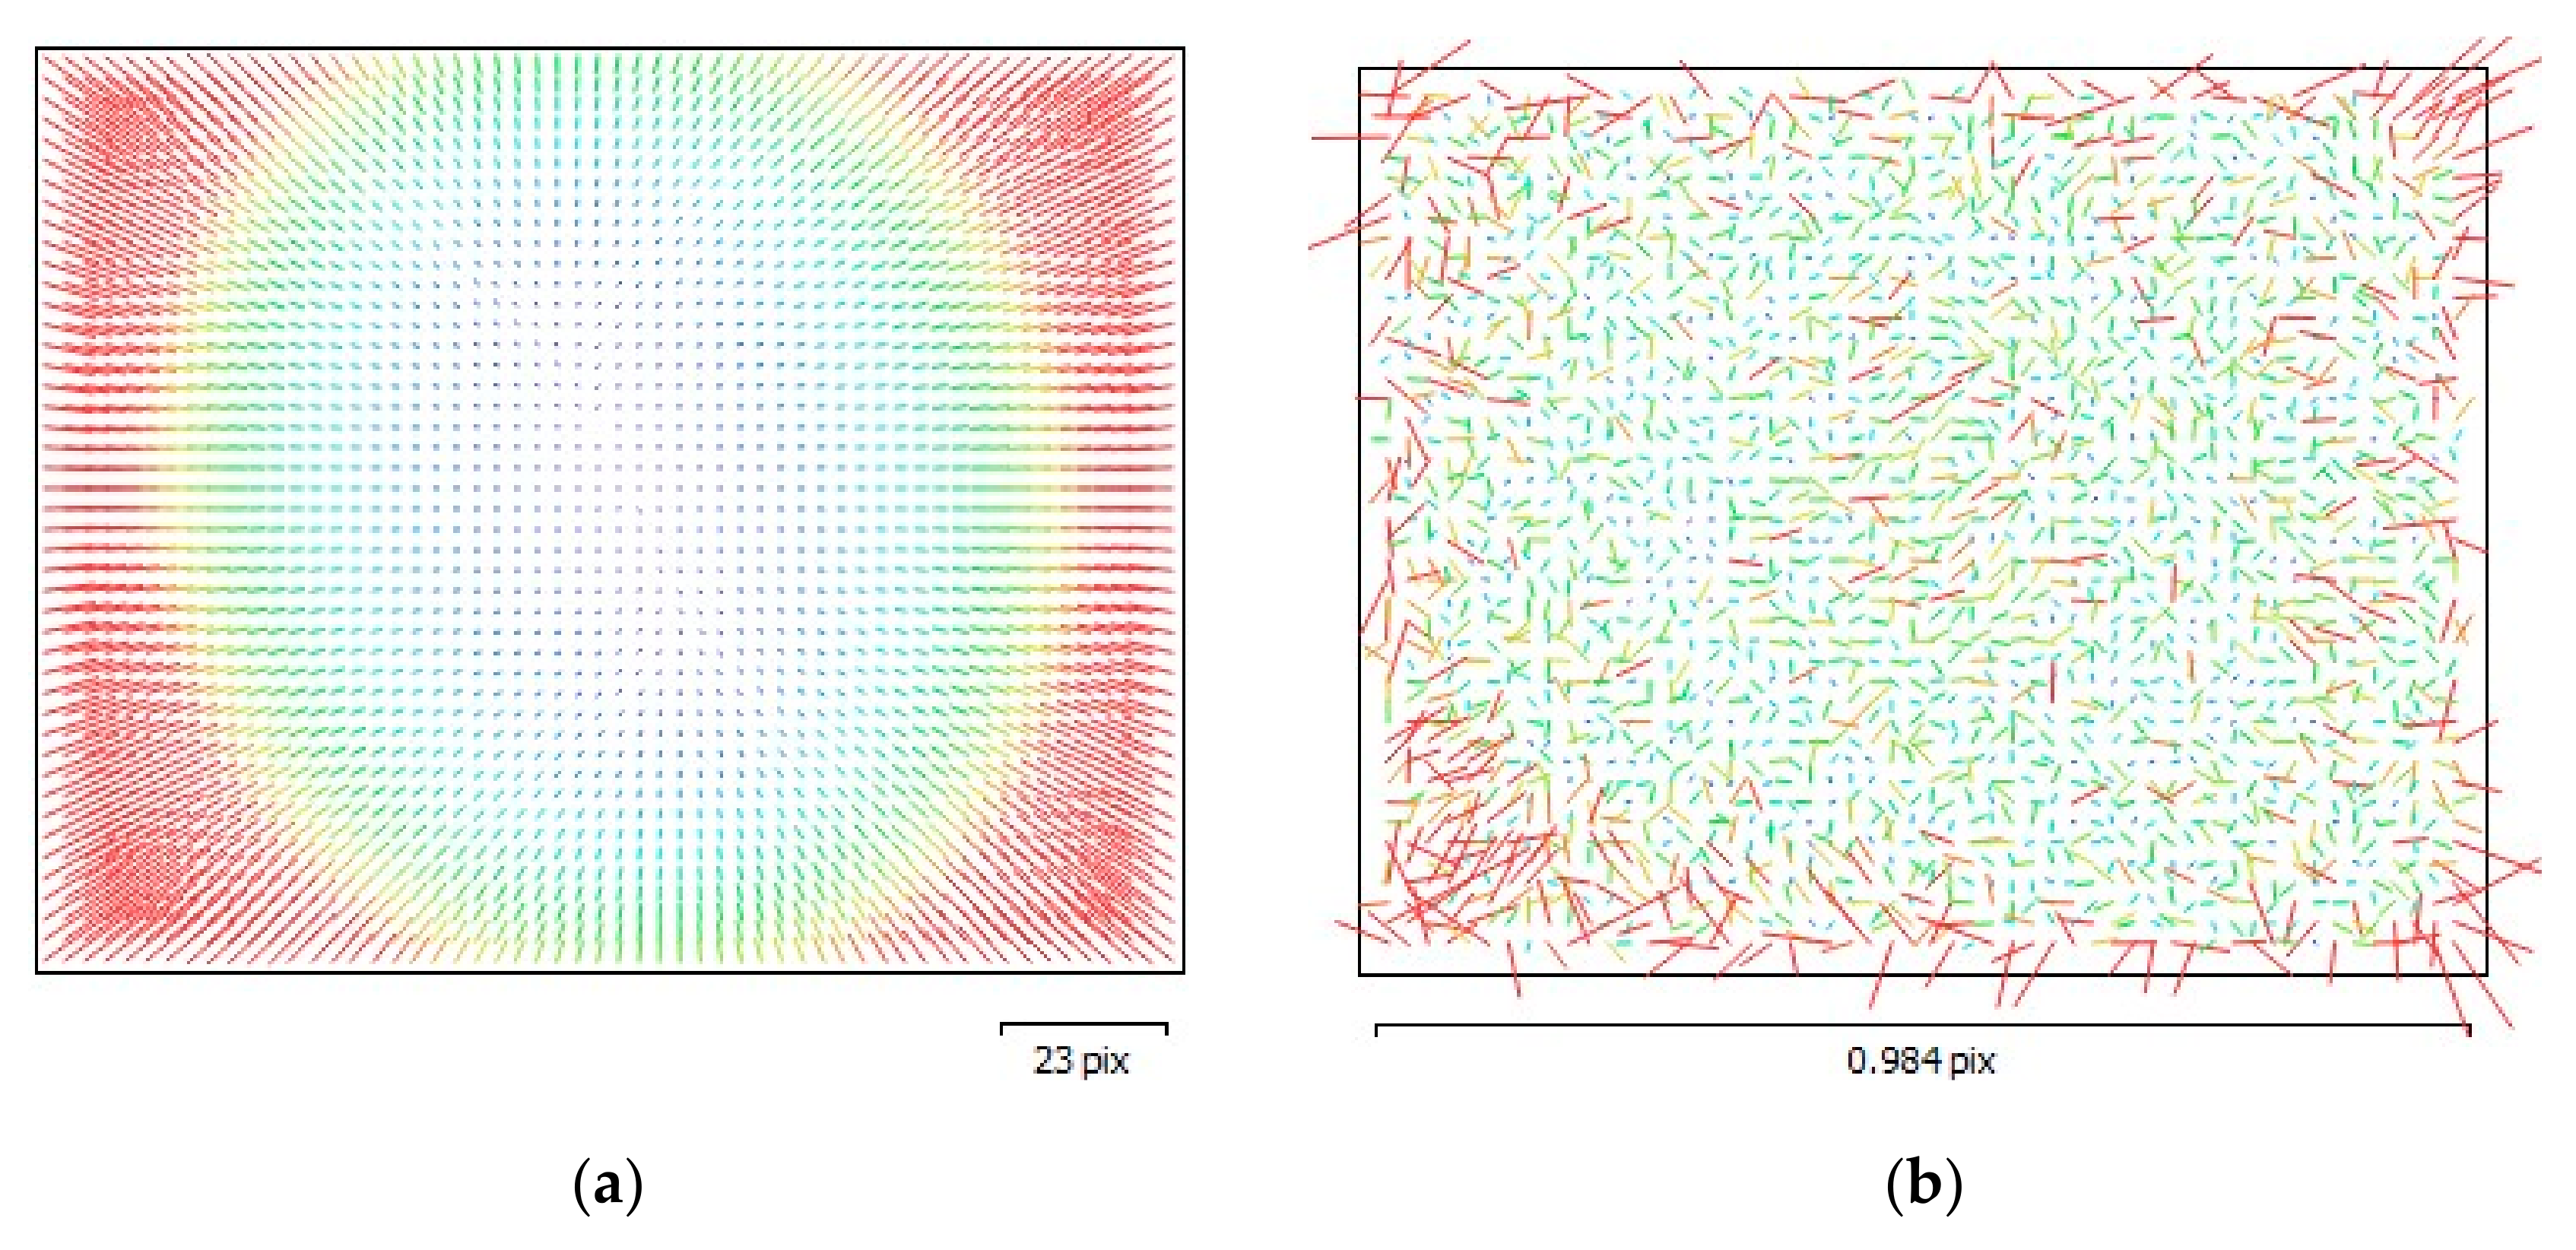
Geometric calibration was conducted during the point cloud generation procedure (Section 3.2.1) using the SfM tool, Agisoft PhotoScan®. An extended Brown distortion model [32] was selected for the used thermal camera, which is shown in Equation (1). Table 2 lists all the determined interior orientation parameters and their corresponding a posteriori standard deviations. Figure 2 compares the average re-projection error results achieved by the geometric model with and without the adopted distortion model. As shown in Figure 2b, when the adopted distortion model was added to the geometric model, the average re-projection error of all the pixels decreased to about 0.5 pixel, which corresponded to 0.2 m X-Y plane error when the average altitude was 354 m. All of the estimated interior orientations were kept fixed during the 3D thermal attribute mapping workflow (Section 3.2.3).
where is the projection center , represents elements of rotation matrix , which equals to , refers to the object point, is the radial distance, is the focal length, is the principle point, represent the distortion parameters.
3.2. Registration and Texture Mapping
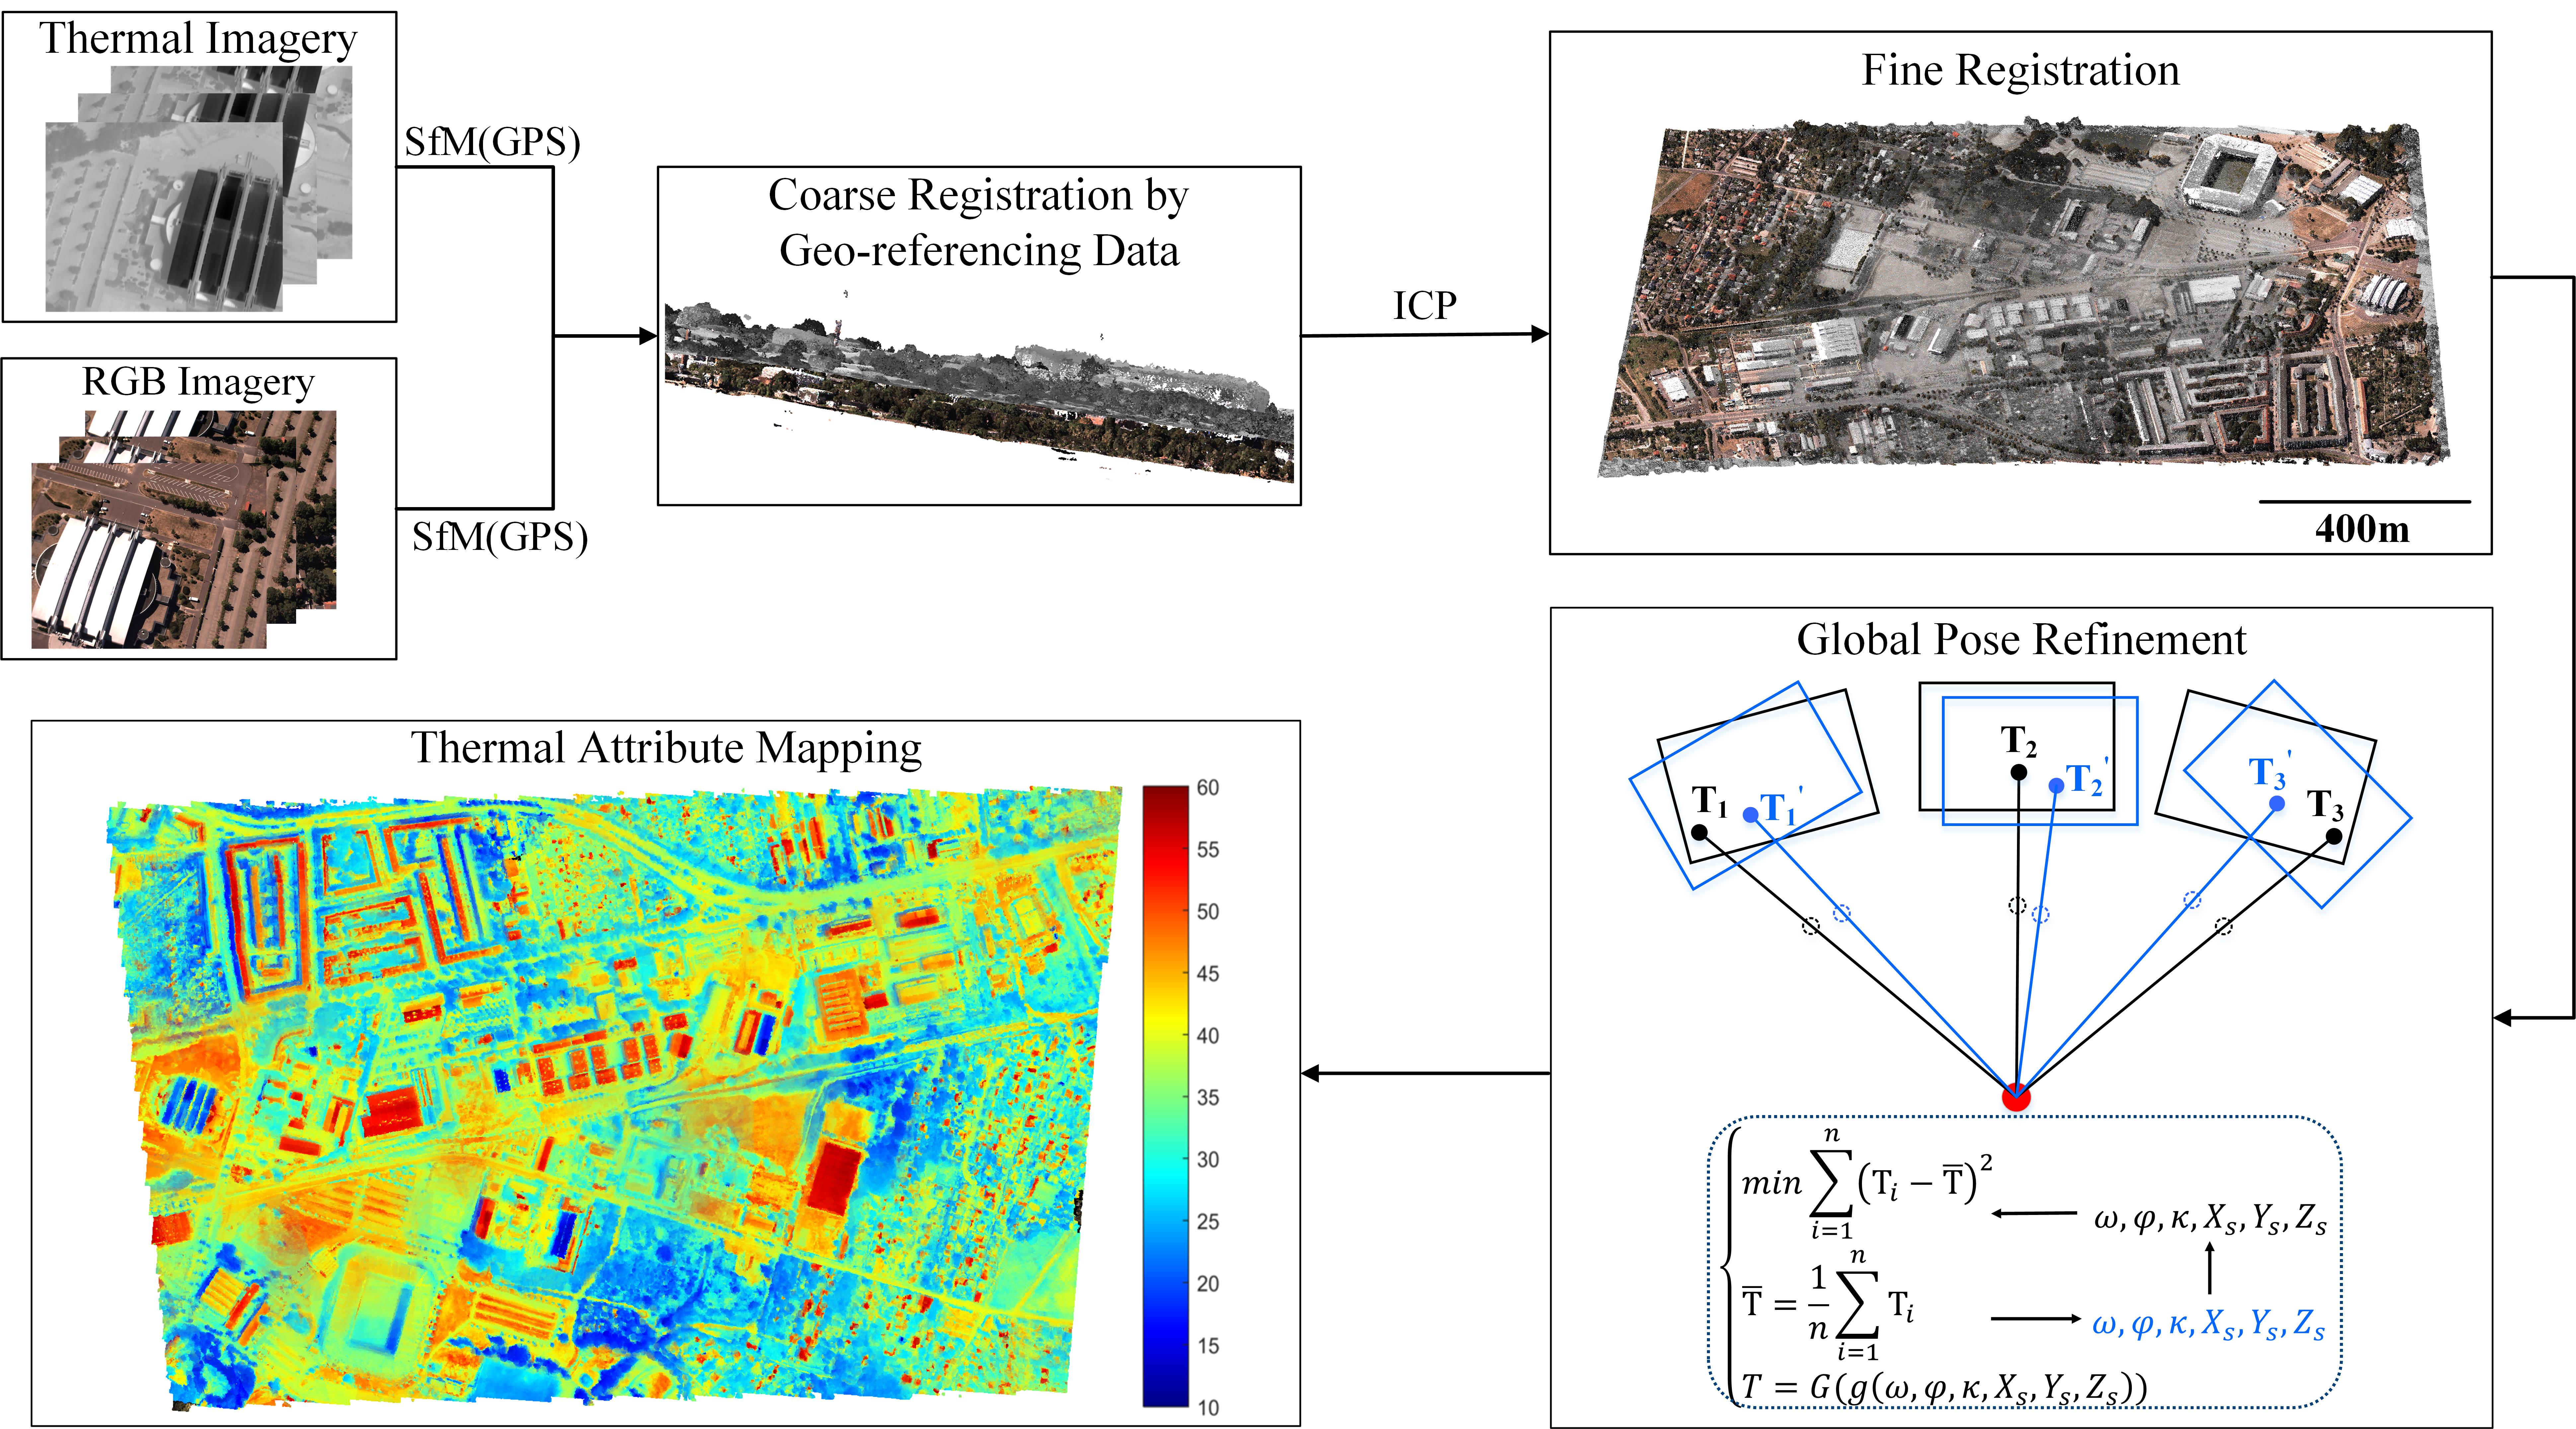
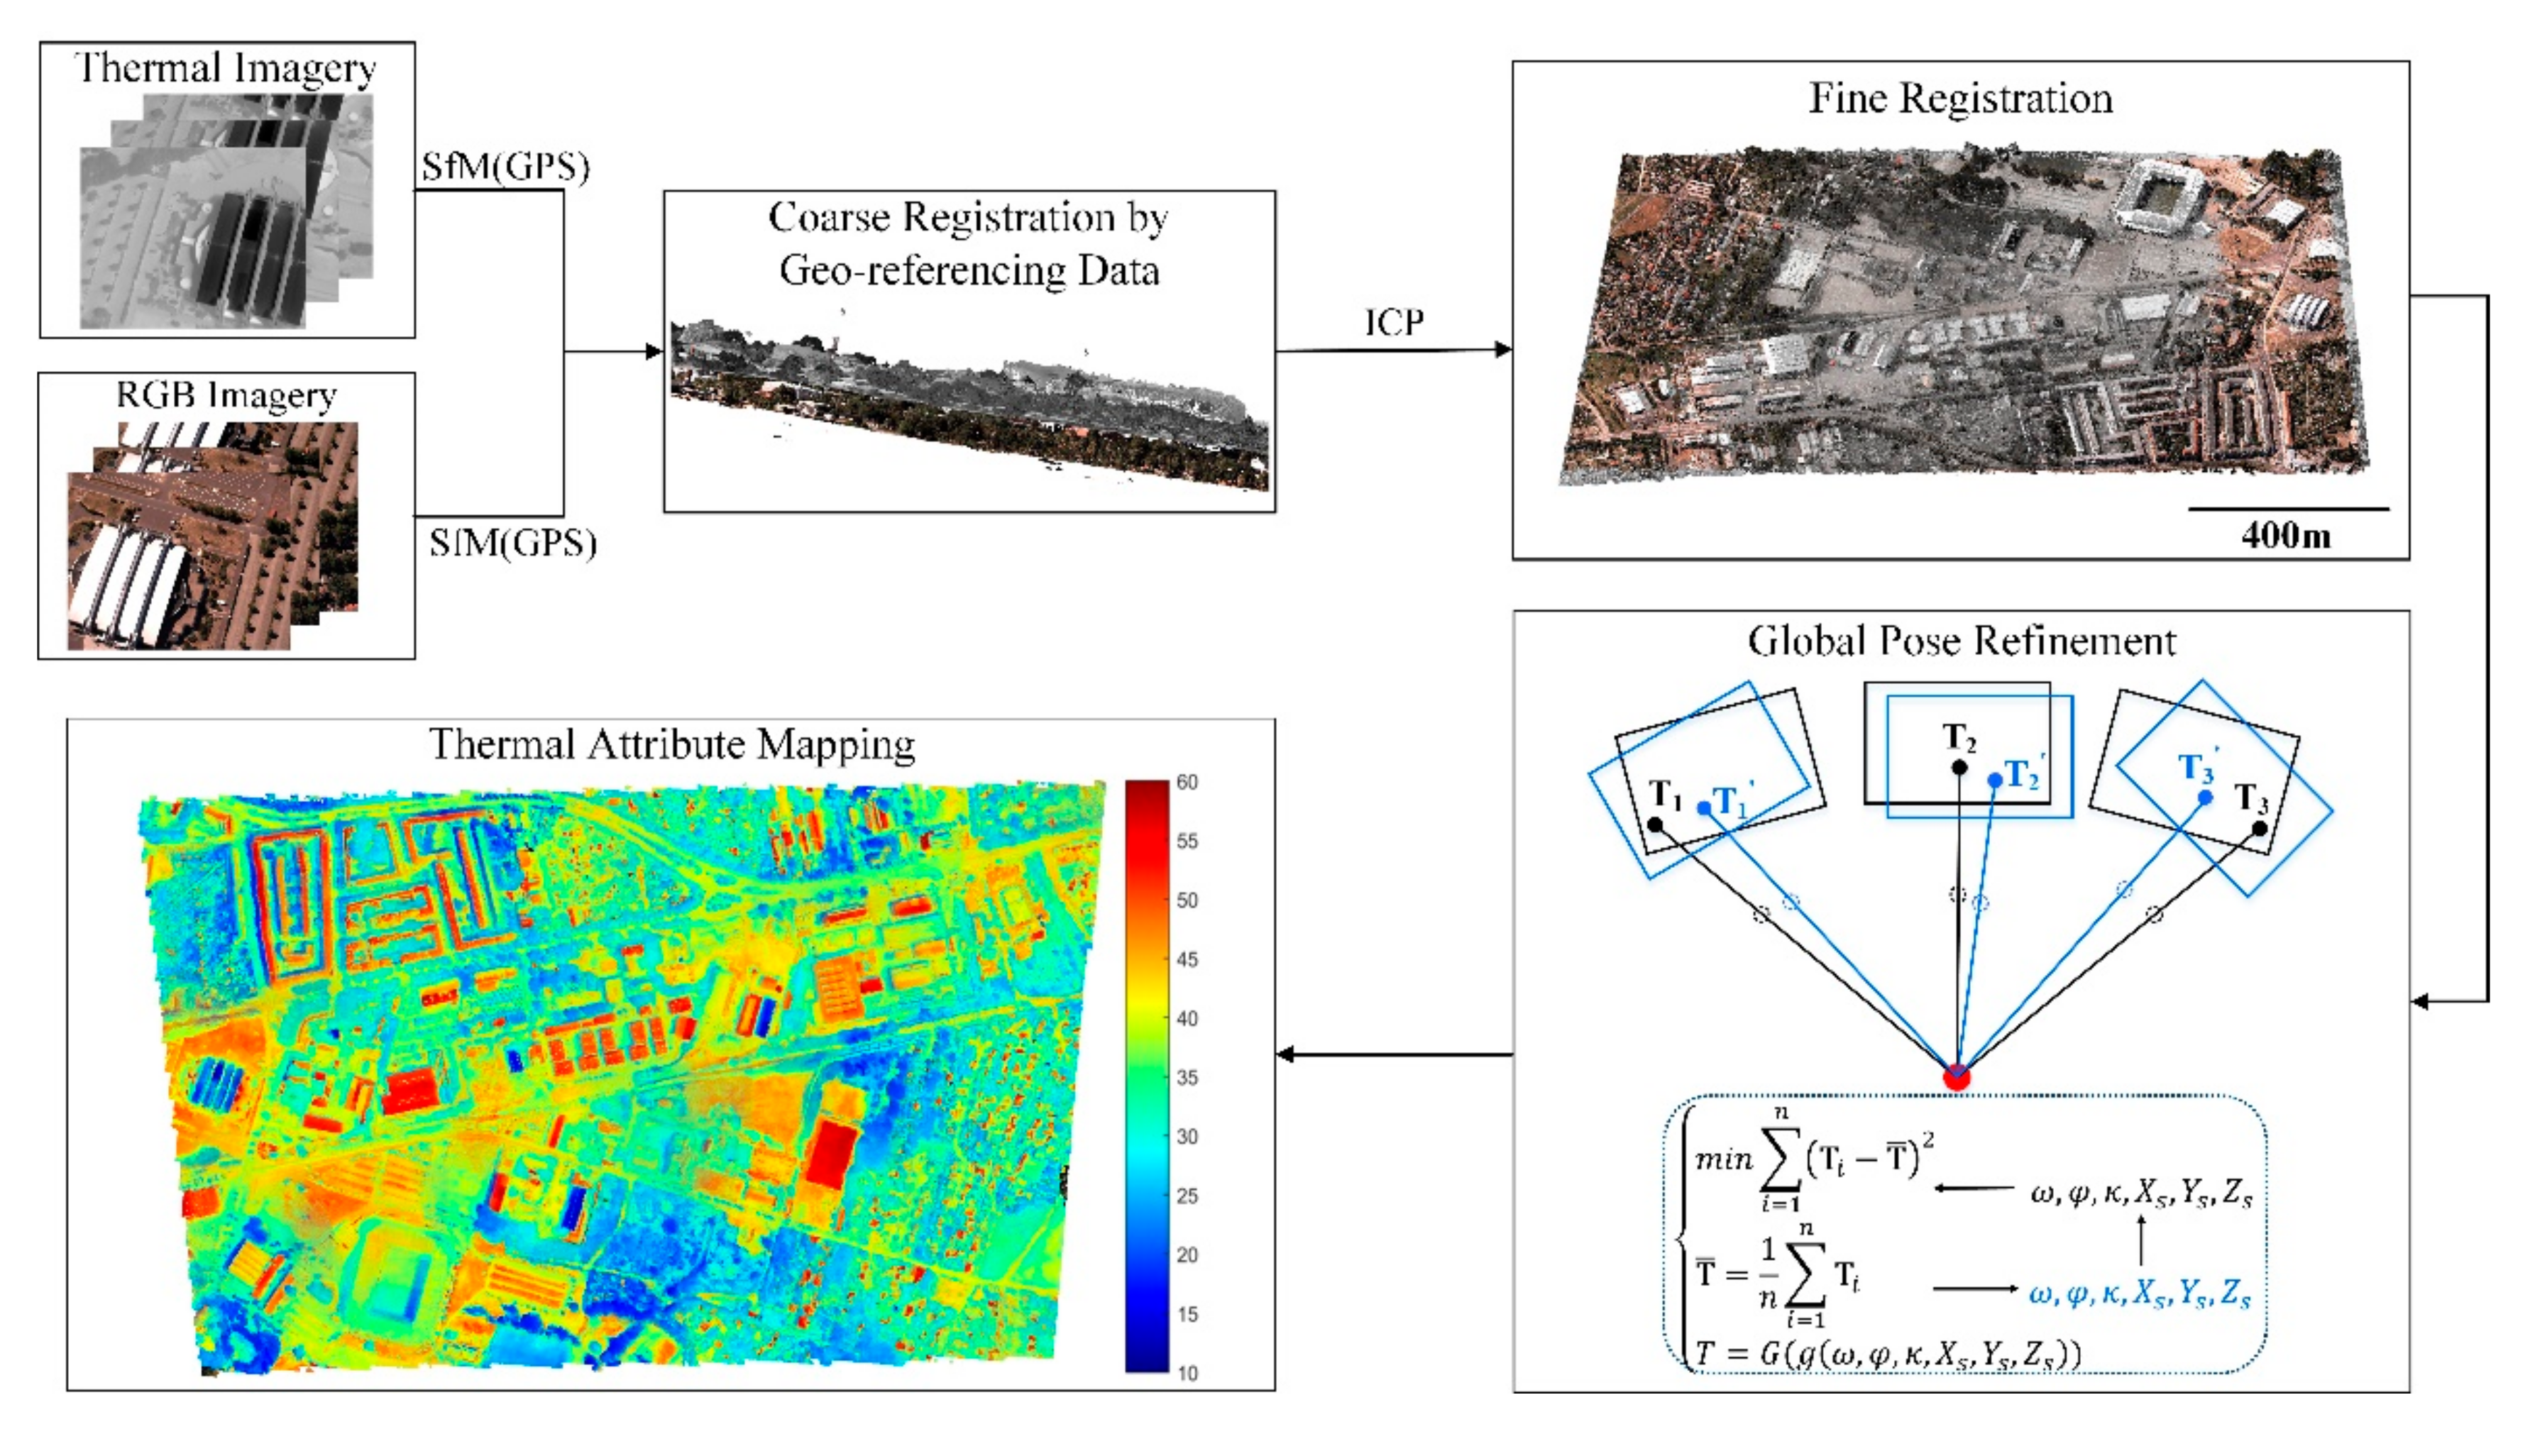
The implemented registration and texture mapping workflow is shown in Figure 3.
The main task in the generation of thermal point cloud attributes was precise geometric registration between a dense 3D point cloud derived from the RGB imagery and the thermal images. As shown in Figure 3, another 3D point cloud was first generated from the thermal image sequence for that purpose. Next, georeferencing data (e.g., GPS) was used to implement a coarse point cloud registration. Subsequently, iterative closest point (ICP) was conducted to perform fine point cloud registration between the two point-clouds derived from RGB and thermal imagery. Finally, a global pose refinement approach was applied to further improve the registration accuracy and photogrammetric consistency of thermal attribute mapping results.
3.2.1. Point Cloud Generation
With the aid of the SfM tool, Agisoft PhotoScan®, two 3D-point clouds can be generated from RGB images and thermal images, respectively. Maes et al. [22] stated that airborne thermal imagery alignment is often problematic in ecosystems with complex structures, such as forests. In this approach, this issue was relieved by using the oblique airborne thermal camera system. Multiple thermal cameras (four in this study) from different perspectives with a fixed relative pose are able to significantly increase the vertical and horizontal overlap, which is helpful in improving the number of tie points in the SfM procedure [1,23]. In addition, similar to the existing publications [23,33,34], a Wallis filter was applied to enhance the image contrast before point cloud generation. These filtered images were used to improve the quality of the generated thermal point clouds, while temperature images used for thermal attribute mapping were acquired after the radiometric calibration procedure (Section 3.1).
3.2.2. Registration
Precise registration between thermal imagery and RGB point clouds was implemented in two steps: coarse point cloud registration and fine point cloud registration. Considering that georeferencing data (e.g., GPS) was available during the flight, thermal point clouds and RGB point clouds can be roughly registered. Inertial measurement unit (IMU) data was not available in this study and there were still some deviations between these two point-clouds. Thus, a further fine registration had to be done for thermal attribute mapping. Considering that these heterogeneous point clouds had different accuracies and point densities, an octree-based point cloud compression algorithm was first applied to subsample the RGB point cloud to make these two point-clouds with the same point density (in the implementation of [35]). Then, a point-to-point ICP was applied to produce accurate registration information using coarse registration results as initialization. Random sampling with a maximum number of 50 iterations was implemented for the ICP used in this study.
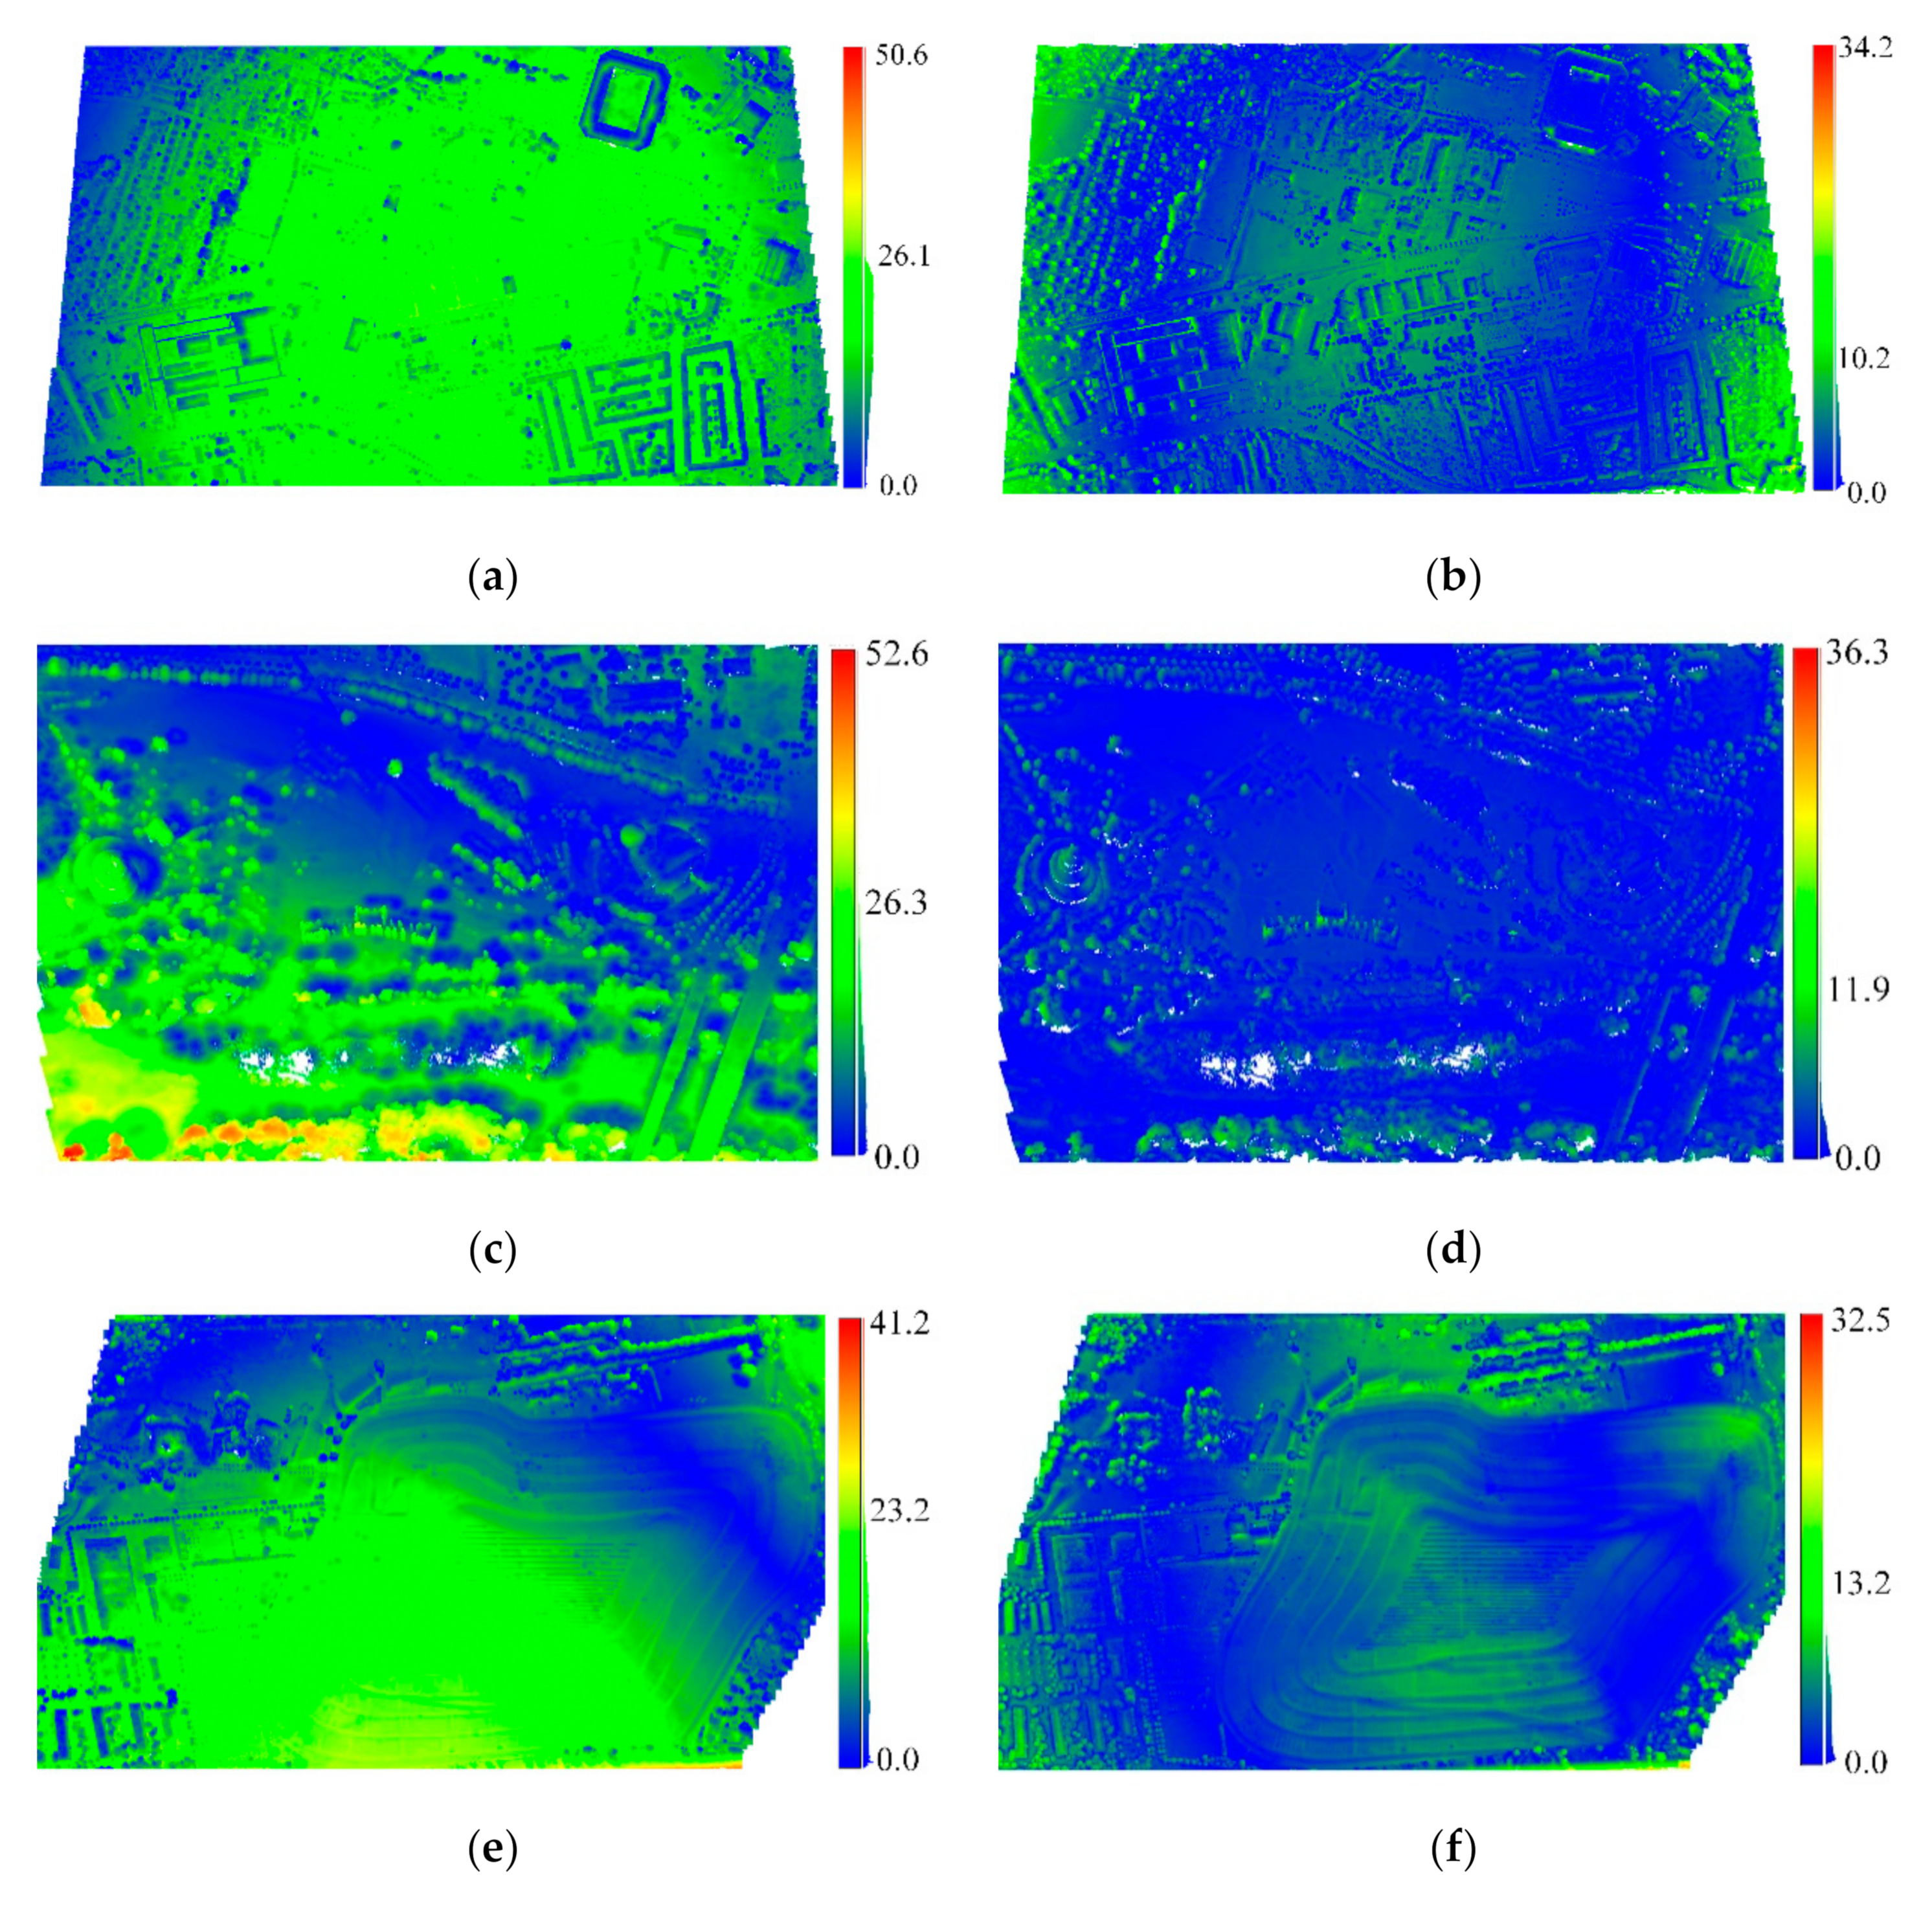
For the purpose of evaluating the accuracy of the registration results, cloud-to-cloud (C2C) distance [36] was used in this study. For all of the three example areas, the C2C distance maps between the RGB point cloud and the thermal point cloud achieved by coarse registration and fine registration were compared (Figure 4). Furthermore, for all the three example areas, the average and the standard deviation of C2C distances of these two point-clouds achieved by coarse registration and fine registration were compared and shown in Table 3.
3.2.3. Thermal Texture Mapping
Fine registration provided the geometric basis to map thermal imagery onto the targeted RGB point cloud; however, redundancies and discrepancies in overlapping thermal images had to be properly handled during the texture mapping procedure. Three different strategies are illustrated and compared in this section.
Strategy 1: A possible thermal attribute mapping approach is to select the image based on thermal radiant characteristics [29], i.e., to pick up the image which achieves the highest score according to Equation (2). According to the thermal radiant characteristics, the ideal thermal image texture is taken from nadir view. This is mainly due to two reasons. Firstly, nadir view removes the undesired noise coming from the reflection of other objects rather than the radiation of the targeted object, because reflection is largely dependent on the object incident angle shown in Figure 5. Secondly, for nearly all practical surfaces, the emissivity keeps almost constant from the normal direction 0° to 40°, while the emissivity would change and different materials behave differently when confronted with larger angles [37]. Therefore, the texture coming from nadir view is preferred according to Equation (2).
where is the radiant power emitted by object point and received by image in Figure 5, refers to the object incident angle, represents the mage viewing angle, is the distance from object to image.
Strategy 2: Given the condition that most of the thermal images are precisely registered before thermal attribute mapping, a simple averaging of temperature values obtained from overlapping candidate images is an alternative option [18], which is shown in Equation (3). Several weighted averaging algorithms with the weight depending on the distance from object to image, object incident angle, and image viewing angle were also tested. Considering that all of these weighted averaging algorithms led to almost the same results as the simple averaging in this study, these variants were omitted in the discussion.
where is the average temperature of object point i, represents the temperature of object point i on image j, is the number of candidate images for object point i.
Strategy 3: Both of the above strategies assume that a precise registration is given and no further image pose refinement is considered in the thermal attribute mapping procedure; however, small misalignments in overlapping images are hard to remove. Thus, another possible approach is to further refine the exterior orientation parameters of the candidate thermal images with respect to the targeted RGB point clouds. As shown in Figure 6, the core idea is to perform a global image pose refinement by minimizing the temperature disagreements calculated from overlapping thermal images for the same object points [23].
The global objective is illustrated in Equation (4).
where is the captured object point number for image Ii, and the number of all the thermal images participated in texture mapping is nI. refers to the exterior orientation parameters of the image . The average temperature of each object point is taken as a criterion, while is expressed as a composition of a collinear equation shown in Equation (1) and temperature retrieval on thermal images using a bilinear interpolation.
As the global objective shown in Equation (4) was designed as a non-linear least-squares form, it can be optimized by a Gauss-Newton approach. Interior orientation parameters determined in Section 3.1 were kept constant all the time and only exterior orientation parameters were adjusted in this procedure. The detailed optimization workflow is described in [23]. After optimization, a simple averaging was applied to obtain thermal attribute mapping results based on the refined exterior orientation parameters. All of the thermal attribute mapping algorithms were implemented using C++ code exploiting the Open3D library [38] and the point cloud library [35].
3.3. Evaluation
In order to perform quantitative geometric evaluation of registration between thermal imagery and RGB point clouds (i.e., relative geometric accuracy between sensors), several check points were manually selected in original RGB point clouds and the corresponding thermal attribute mapping point clouds, respectively. Then, as shown in Equation (5), the Euclidean distance d, which represents the geometric misalignment for each check point, was utilized. The root-mean-square error (RMSE) for all the check points was used for geometric accuracy evaluation.
where is the coordinate of check point on RGB point cloud, is the coordinate of check point on thermal texture mapping point cloud, is the geometric misalignment of check point Ci, is the number of the check points C.
In order to guarantee the reliability of geometric evaluation, all of the selected check points were located at the boundaries of different objects, which ensured them distinguishable both in RGB color and temperature scalar. On the other hand, quantitative temperature evaluation was lacking in this study because the independent reference data, which might, for instance, be taken by a thermometer or a pyrometer gun, were not available during oblique airborne data acquisition.
4. Results and Discussion
In the texture mapping procedure, 773, 327, and 712 thermal images were involved for building area, river ecosystem, and soil area, respectively. Texture mapping results achieved by strategy 1 (thermal radiant characteristics) are shown in Figure 7. The main problem of strategy 1 was the frequent occurrence of seams and radiometric inconsistencies in texture mapping results (e.g., areas in black boxes in Figure 7). Such inconsistencies were mainly caused by radiometric differences of the images from different perspectives. In general, this strategy, which used only the texture from one image for each point, cannot ensure high photogrammetric consistency in the whole texture mapping results.
Texture mapping results using strategy 2 (simple averaging) are shown in Figure 8. Although strategy 2 achieved better radiometric consistency when compared with strategy 1, a drawback was the blur effects in the texture mapping results (e.g., at the border of the buildings). This was caused by small radiometric discrepancies as well as remaining errors in geometric alignment of neighboring thermal images.
The texture mapping results using strategy 3 (global image pose refinement) are shown in Figure 9. For the purpose of geometric alignment evaluation, check points C1–C6 shown in Figure 9 were used. The geometric misalignment of thermal texture mapping results achieved by strategy 1, strategy 2, and strategy 3 are listed in Table 4a–c. RMSE values achieved by different strategies for all the data are compared in Table 4d.
The comparisons of enlarged areas between the texture mapping results achieved by strategy 2 and strategy 3 are shown in Figure 10.
As shown in Figure 10 (particularly Figure 10a,b), strategy 3 outperformed strategy 2, because the blur effects caused by radiometric discrepancies and geometric misalignments were largely alleviated by the global image pose refinement approach.
As shown in Table 4a–d, the lowest RMSE values for building area, river ecosystem, and soil area (2.6 m, 2.1 m, and 3.4 m, respectively) were achieved by strategy 3, which meant that strategy 3 performed better than strategy 1 and strategy 2 from the geometric accuracy perspective. The reason was that the global image pose refinement approach used in strategy 3 further improved the geometric registration information during the thermal texture mapping procedure, while strategy 1 and strategy 2 both assumed that the provided registration information was accurate and no optimization was implemented in the texture mapping procedure. The difference between strategy 1 and strategy 2 was that strategy 1 chose one specific image to texture each object point according to thermal radiant characteristics, while strategy 2 believed that most of the images were well-registered and used the average temperature of overlapping images.
The main advantage of the oblique airborne photogrammetric system AOS-Tx8 is the fast and rough detection of potential building thermal leakages for large areas. An example of potential thermal leakage in building area is shown in Figure 11. As shown in Figure 11b, the left building roof seemed to have a potential thermal leakage, because large temperature differences between adjacent areas showed the existing thermal anomaly. Figure 11a shows that the whole brown roof was probably made up of the same material. Thus, the proposed approach provides a fast and rough detection of building thermal leakages for large-scale areas. In practice, for the purpose of detection of thermal leakages, a field survey is usually required to check all of the potential locations, thus avoiding faulty judgements caused by emissivity difference.
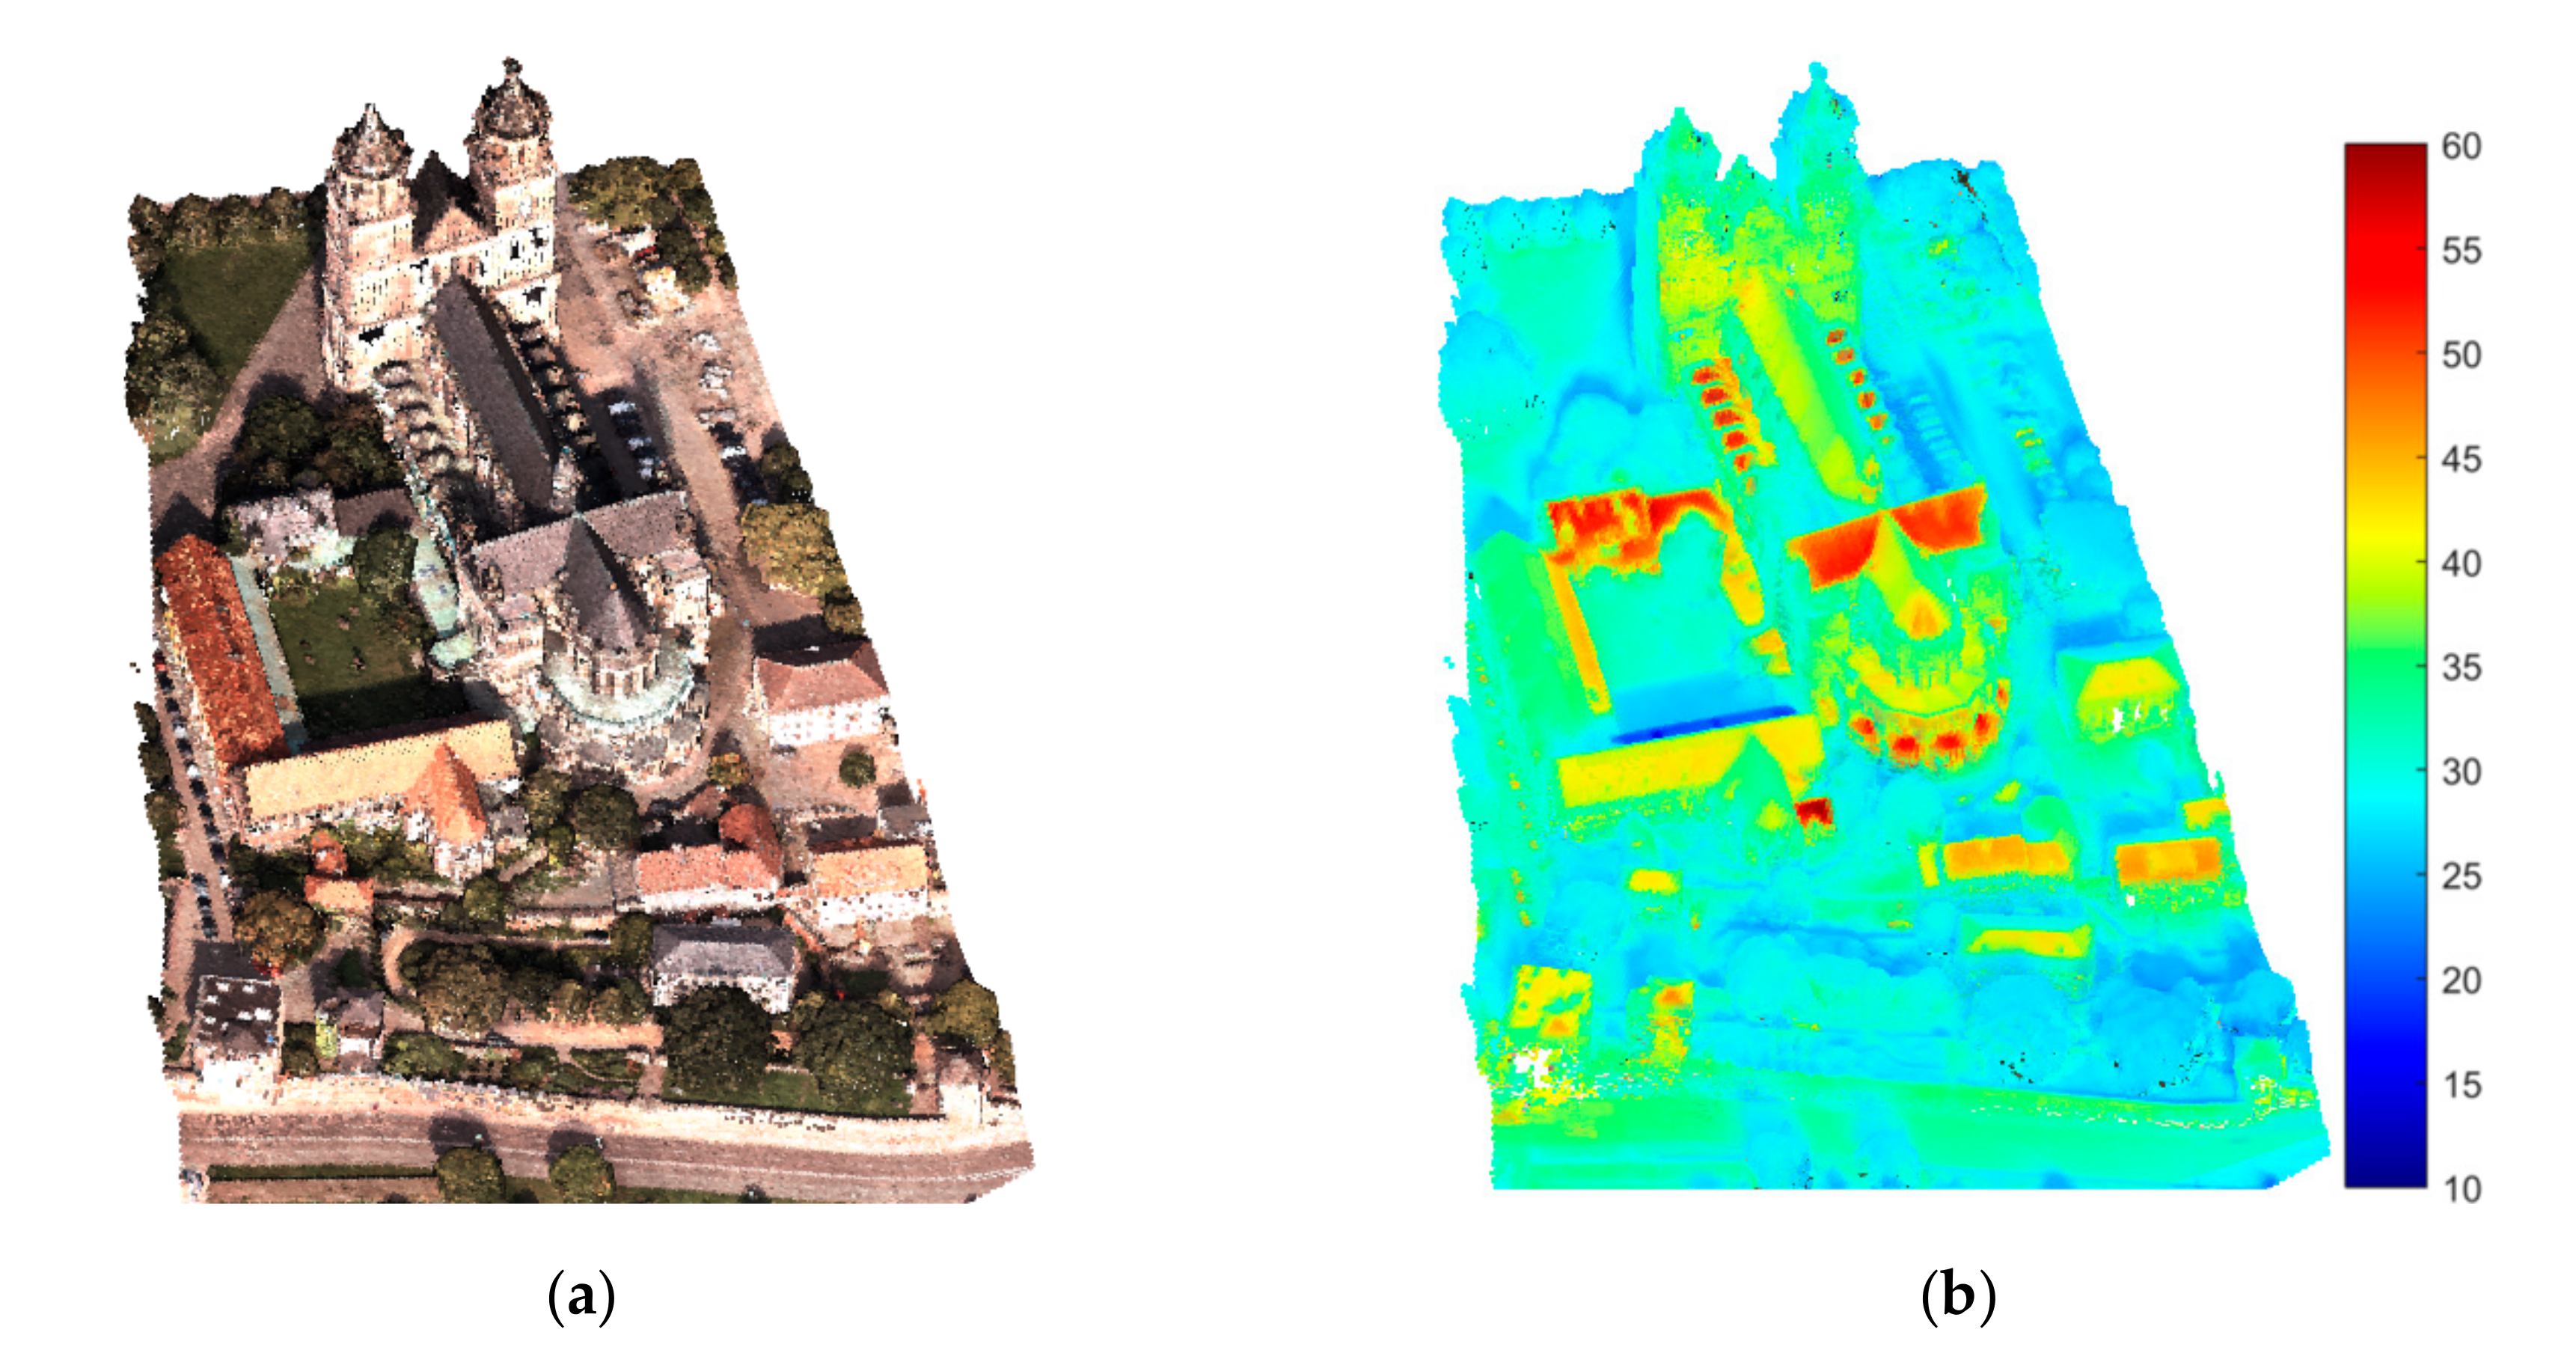
Furthermore, another benefit of the system used in the study is that not only the rooftops, but also the building facades, can be captured during the measurements, which is shown in Figure 12. The roof and facade areas with a significantly high temperature heated by direct sunlight implied the opportunity to use solar energy. Thus, a combination of the oblique airborne system AOS-Tx8 and the proposed thermal texture mapping approach provides a new insight into building conditions in the derivation of urban parameters.
In general, the examples of the thermal attribute mapping results showed the potential of the oblique airborne thermal–RGB cameras system. In this study, point cloud registration rather than image matching was utilized for registration between thermal imagery and RGB point clouds. In fact, when RGB cameras and thermal cameras have fixed relative poses and are synchronized, the corresponding thermal–RGB image pairs can also be precisely registered using multimodal image matching (e.g., radiation-invariant feature transform, RIFT in [23]), taking fixed transformation as initialization. An advantage of our method is that it avoids matching hundreds of image pairs, which is not computationally efficient. The developed techniques are not limited to the specific 4 + 4 camera system used in this study, but can be employed arbitrarily with other RGB–thermal camera configurations.
5. Conclusions
An oblique airborne thermal attribute mapping approach is proposed to generate 3D models with thermal attributes in this work. High-resolution RGB imagery is used for 3D reference model generation, while thermal cameras provide thermal attributes for texture mapping. Registration between thermal imagery and RGB point clouds is implemented via point cloud registration. Three different thermal attribute mapping strategies are compared for different kinds of areas. Experimental results showed that the global image pose refinement outperforms the other two strategies (i.e., thermal radiant characteristics and simple averaging) and could achieve geometrically and radiometrically consistent texture mapping results. This paper focuses on the evaluation of relative registration accuracy between sensors rather than absolute accuracy. Ground control points and ground thermal targets need to be provided in case of absolute geometric and radiometric accuracy evaluation.
Future work includes kinetic temperature computation and point cloud classification using thermal attributes in addition to RGB and geometric information. The calculated temperatures in this study refer to radiant temperature rather than kinetic temperature. In fact, kinetic temperature represents true object temperature, which is largely dependent on the material type. These material types (such as concrete, brick, and glass) can be obtained from a classification procedure on the basis of the geometry and attribute data. The thermal attribute, which acts as an additional feature for point clouds, is very helpful to improve classification results. Thus, these two problems are correlated and may require a recursive procedure.
Author Contributions
Conceptualization, L.B., C.U., and H.-G.M.; methodology, D.L.; software, D.L.; writing—original draft, D.L.; writing—review and editing, L.B., C.U., H.-G.M., and D.L. All authors have read and agreed to the published version of the manuscript.
Funding
This research was funded by the China Scholarship Council (grant number: 201603170234).
Acknowledgments
The authors would like to thank anonymous reviewers and members of the editorial team for the comments and contributions.
Conflicts of Interest
The authors declare no conflicts of interest.
References
- Westfeld, P.; Mader, D.; Maas, H.-G. Generation of TIR-attributed 3d point clouds from UAV-based thermal imagery. Photogramm. Fernerkund. Geoinf. 2015, 5, 381–393. [Google Scholar] [CrossRef]
- Brooke, C. Thermal Imaging for the Archaeological Investigation of Historic Buildings. Remote Sens. 2018, 10, 1401. [Google Scholar] [CrossRef] [Green Version]
- Ambrosia, V.G.; Wegener, S.S.; Sullivan, D.V.; Buechel, S.W.; Dunagan, S.E.; Brass, J.A.; Stoneburner, J.; Schoenung, S.M. Demonstrating UAV-acquired real-time thermal data over fires. Photogramm. Eng. Remote Sens. 2003, 69, 391–402. [Google Scholar] [CrossRef]
- Friman, O.; Follo, P.; Ahlberg, J.; Sjökvist, S. Methods for large-scale monitoring of district heating systems using airborne thermography. IEEE Trans. Geosci. Remote Sens. 2014, 52, 5175–5182. [Google Scholar] [CrossRef] [Green Version]
- Lin, D.; Grundmann, J.; Eltner, A. Evaluating Image Tracking Approaches for Surface Velocimetry with Thermal Tracers. Water Resour. Res. 2019, 55, 3122–3136. [Google Scholar] [CrossRef]
- Nguyen, D.T.; Kim, K.W.; Hong, H.G.; Koo, J.H.; Kim, M.C.; Park, K.R. Gender recognition from human-body images using visible-light and thermal camera videos based on a convolutional neural network for image feature extraction. Sensors 2017, 17, 637. [Google Scholar] [CrossRef] [Green Version]
- Liu, Z.; Blasch, E.; Xue, Z.; Zhao, J.; Laganiere, R.; Wu, W. Objective assessment of multiresolution image fusion algorithms for context enhancement in night vision: A comparative study. IEEE Trans. Pattern Anal. Mach. Intell. 2012, 34, 94–109. [Google Scholar] [CrossRef]
- Khanal, S.; Fulton, J.; Shearer, S. An overview of current and potential applications of thermal remote sensing in precision agriculture. Comput. Electron. Agric. 2017, 139, 22–32. [Google Scholar] [CrossRef]
- Smith, H.K.; Clarkson, G.J.; Taylor, G.; Thompson, A.J.; Clarkson, J.; Rajpoot, N.M. Automatic detection of regions in spinach canopies responding to soil moisture deficit using combined visible and thermal imagery. PLoS ONE 2014, 9, e97612. [Google Scholar]
- Hare, D.K.; Briggs, M.A.; Rosenberry, D.O.; Boutt, D.F.; Lane, J.W. A comparison of thermal infrared to fiber-optic distributed temperature sensing for evaluation of groundwater discharge to surface water. J. Hydrol. 2015, 530, 153–166. [Google Scholar] [CrossRef] [Green Version]
- Cho, Y.K.; Ham, Y.; Golpavar-Fard, M. 3D as-is building energy modeling and diagnosis: A review of the state-of-the-art. Adv. Eng. Inform. 2015, 29, 184–195. [Google Scholar] [CrossRef]
- Lin, D.; Dong, Z.; Zhang, X.; Maas, H.-G. Unsupervised window extraction from photogrammetric point clouds with thermal attributes. ISPRS Ann. Photogramm. Remote Sens. Spat. Inf. Sci. 2019, 4, 45–51. [Google Scholar] [CrossRef] [Green Version]
- Bannehr, L.; Pohl, H.; Ulrich, C.; Hermann, K. AOS-Tx8, ein neues Thermal- und RGB Oblique Kamera System. In Proceedings of the Photogrammetrie, Laserscanning, Optische 3D-Messtechnik, Beiträge der Oldenburger 3D-Tage, Oldenburger, Germany, 31 January–1 February 2018; pp. 1–9. [Google Scholar]
- Alba, M.I.; Barazzetti, L.; Scaioni, M.; Rosina, E.; Previtali, M. Mapping infrared data on terrestrial laser scanning 3D models of buildings. Remote Sens. 2011, 3, 1847–1870. [Google Scholar] [CrossRef] [Green Version]
- Borrmann, D.; Nüchter, A.; Ðakulović, M.; Maurović, I.; Petrović, I.; Osmanković, D.; Velagić, J. A mobile robot based system for fully automated thermal 3D mapping. Adv. Eng. Inform. 2014, 28, 425–440. [Google Scholar] [CrossRef]
- González-Aguilera, D.; Rodríguez-Gonzálvez, P.; Armesto, J.; Lagüela, S. Novel approach to 3D thermography and energy efficiency evaluation. Energy Build. 2012, 54, 436–443. [Google Scholar] [CrossRef]
- Ham, Y.; Golparvar-Fard, M. An automated vision-based method for rapid 3D energy performance modeling of existing buildings using thermal and digital imagery. Adv. Eng. Inform. 2013, 27, 395–409. [Google Scholar] [CrossRef]
- Javadnejad, F. Small Unmanned Aircraft Systems (UAS) for Engineering Inspections and Geospatial Mapping. Ph.D. Thesis, Oregon State University, Corvallis, OR, USA, November 2017. [Google Scholar]
- Vidas, S.; Moghadam, P. HeatWave: A handheld 3D thermography system for energy auditing. Energy Build. 2013, 66, 445–460. [Google Scholar] [CrossRef] [Green Version]
- Vidas, S.; Moghadam, P.; Sridharan, S. Real-time mobile 3D temperature mapping. IEEE Sens. J. 2015, 15, 1145–1152. [Google Scholar] [CrossRef]
- Yang, M.D.; Su, T.C.; Lin, H.Y. Fusion of Infrared Thermal Image and Visible Image for 3D Thermal Model Reconstruction Using Smartphone Sensors. Sensors 2018, 18, 2003. [Google Scholar] [CrossRef] [Green Version]
- Maes, W.H.; Huete, A.R.; Steppe, K. Optimizing the processing of UAV-based thermal imagery. Remote Sens. 2017, 9, 476. [Google Scholar] [CrossRef] [Green Version]
- Lin, D.; Jarzabek-Rychard, M.; Tong, X.; Maas, H.-G. Fusion of thermal imagery with point clouds for building façade thermal attribute mapping. ISPRS J. Photogramm. Remote Sens. 2019, 151, 162–175. [Google Scholar] [CrossRef]
- Hoegner, L.; Stilla, U. Thermal leakage detection on building facades using infrared textures generated by mobile mapping. In Proceedings of the IEEE Joint Urban Remote Sensing Event, Shanghai, China, 20–22 May 2009; pp. 1–6. [Google Scholar]
- Hoegner, L.; Stilla, U. Building facade object detection from terrestrial thermal infrared image sequences combining different views. ISPRS Ann. Photogramm. Remote Sens. Spat. Inf. Sci. 2015, 2, 55. [Google Scholar] [CrossRef] [Green Version]
- Hoegner, L.; Stilla, U. Mobile thermal mapping for matching of infrared images with 3D building models and 3D point clouds. Quant. InfraRed Thermgr. J. 2018, 15, 252–270. [Google Scholar] [CrossRef]
- Iwaszczuk, D.; Stilla, U. Quality assessment of building textures extracted from oblique airborne thermal imagery. ISPRS Ann. Photogramm. Remote Sens. Spat. Inf. Sci. 2016, 3, 3–8. [Google Scholar] [CrossRef]
- Iwaszczuk, D.; Stilla, U. Camera pose refinement by matching uncertain 3D building models with thermal infrared image sequences for high quality texture extraction. ISPRS J. Photogramm. Remote Sens. 2017, 132, 33–47. [Google Scholar] [CrossRef]
- Lin, D.; Jarzabek-Rychard, M.; Schneider, D.; Maas, H.-G. Thermal texture selection and correction for building facade inspection based on thermal radiant characteristics. ISPRS Int. Arch. Photogramm. Remote Sens. Spat. Inf. Sci. 2018, 42, 585–591. [Google Scholar] [CrossRef] [Green Version]
- Lin, D.; Maas, H.-G.; Westfeld, P.; Budzier, H.; Gerlach, G. An advanced radiometric calibration approach for uncooled thermal cameras. Photogramm. Rec. 2018, 33, 30–48. [Google Scholar] [CrossRef]
- Tempelhahn, A.; Budzier, H.; Krause, V.; Gerlach, G. Shutter-less calibration of uncooled infrared cameras. J. Sens. Sens. Syst. 2016, 5, 9–16. [Google Scholar] [CrossRef] [Green Version]
- El-Hakim, S. A real-time system for object measurement with CCD cameras. ISPRS Int. Arch. Photogramm. Remote Sens. Spat. Inf. Sci. 1986, 26, 363–373. [Google Scholar]
- Ribeiro-Gomes, K.; Hernández-López, D.; Ortega, J.F.; Ballesteros, R.; Poblete, T.; Moreno, M.A. Uncooled thermal camera calibration and optimization of the photogrammetry process for UAV applications in agriculture. Sensors 2017, 17, 2173. [Google Scholar] [CrossRef]
- Conte, P.; Girelli, V.A.; Mandanici, E. Structure from Motion for aerial thermal imagery at city scale: Pre-processing, camera calibration, accuracy assessment. ISPRS J. Photogramm. Remote Sens. 2018, 146, 320–333. [Google Scholar] [CrossRef]
- Rusu, R.B.; Cousins, S. 3D is here: Point cloud library (pcl). In Proceedings of the IEEE International Conference on Robotics and Automation, Shanghai, China, 9–13 May 2011; pp. 1–4. [Google Scholar] [CrossRef] [Green Version]
- Lague, D.; Brodu, N.; Leroux, J. Accurate 3D comparison of complex topography with terrestrial laser scanner: Application to the Rangitikei canyon (NZ). ISPRS J. Photogramm. Remote Sens. 2013, 82, 10–26. [Google Scholar] [CrossRef] [Green Version]
- Vollmer, M.; Möllmann, K.P. Infrared Thermal Imaging: Fundamentals, Research and Applications; John Wiley and Sons: Brandenburg, Germany, 2017; p. 612. [Google Scholar]
- Zhou, Q.Y.; Park, J.; Koltun, V. Open3D: A modern library for 3D data pro cessing. arXiv 2018, arXiv:1801.09847. [Google Scholar]
Figure 1.
The AOS-Tx8 block configuration. (a) Picture of the four RGB cameras and four thermal cameras and (b) picture of the whole system.
Figure 1.
The AOS-Tx8 block configuration. (a) Picture of the four RGB cameras and four thermal cameras and (b) picture of the whole system.
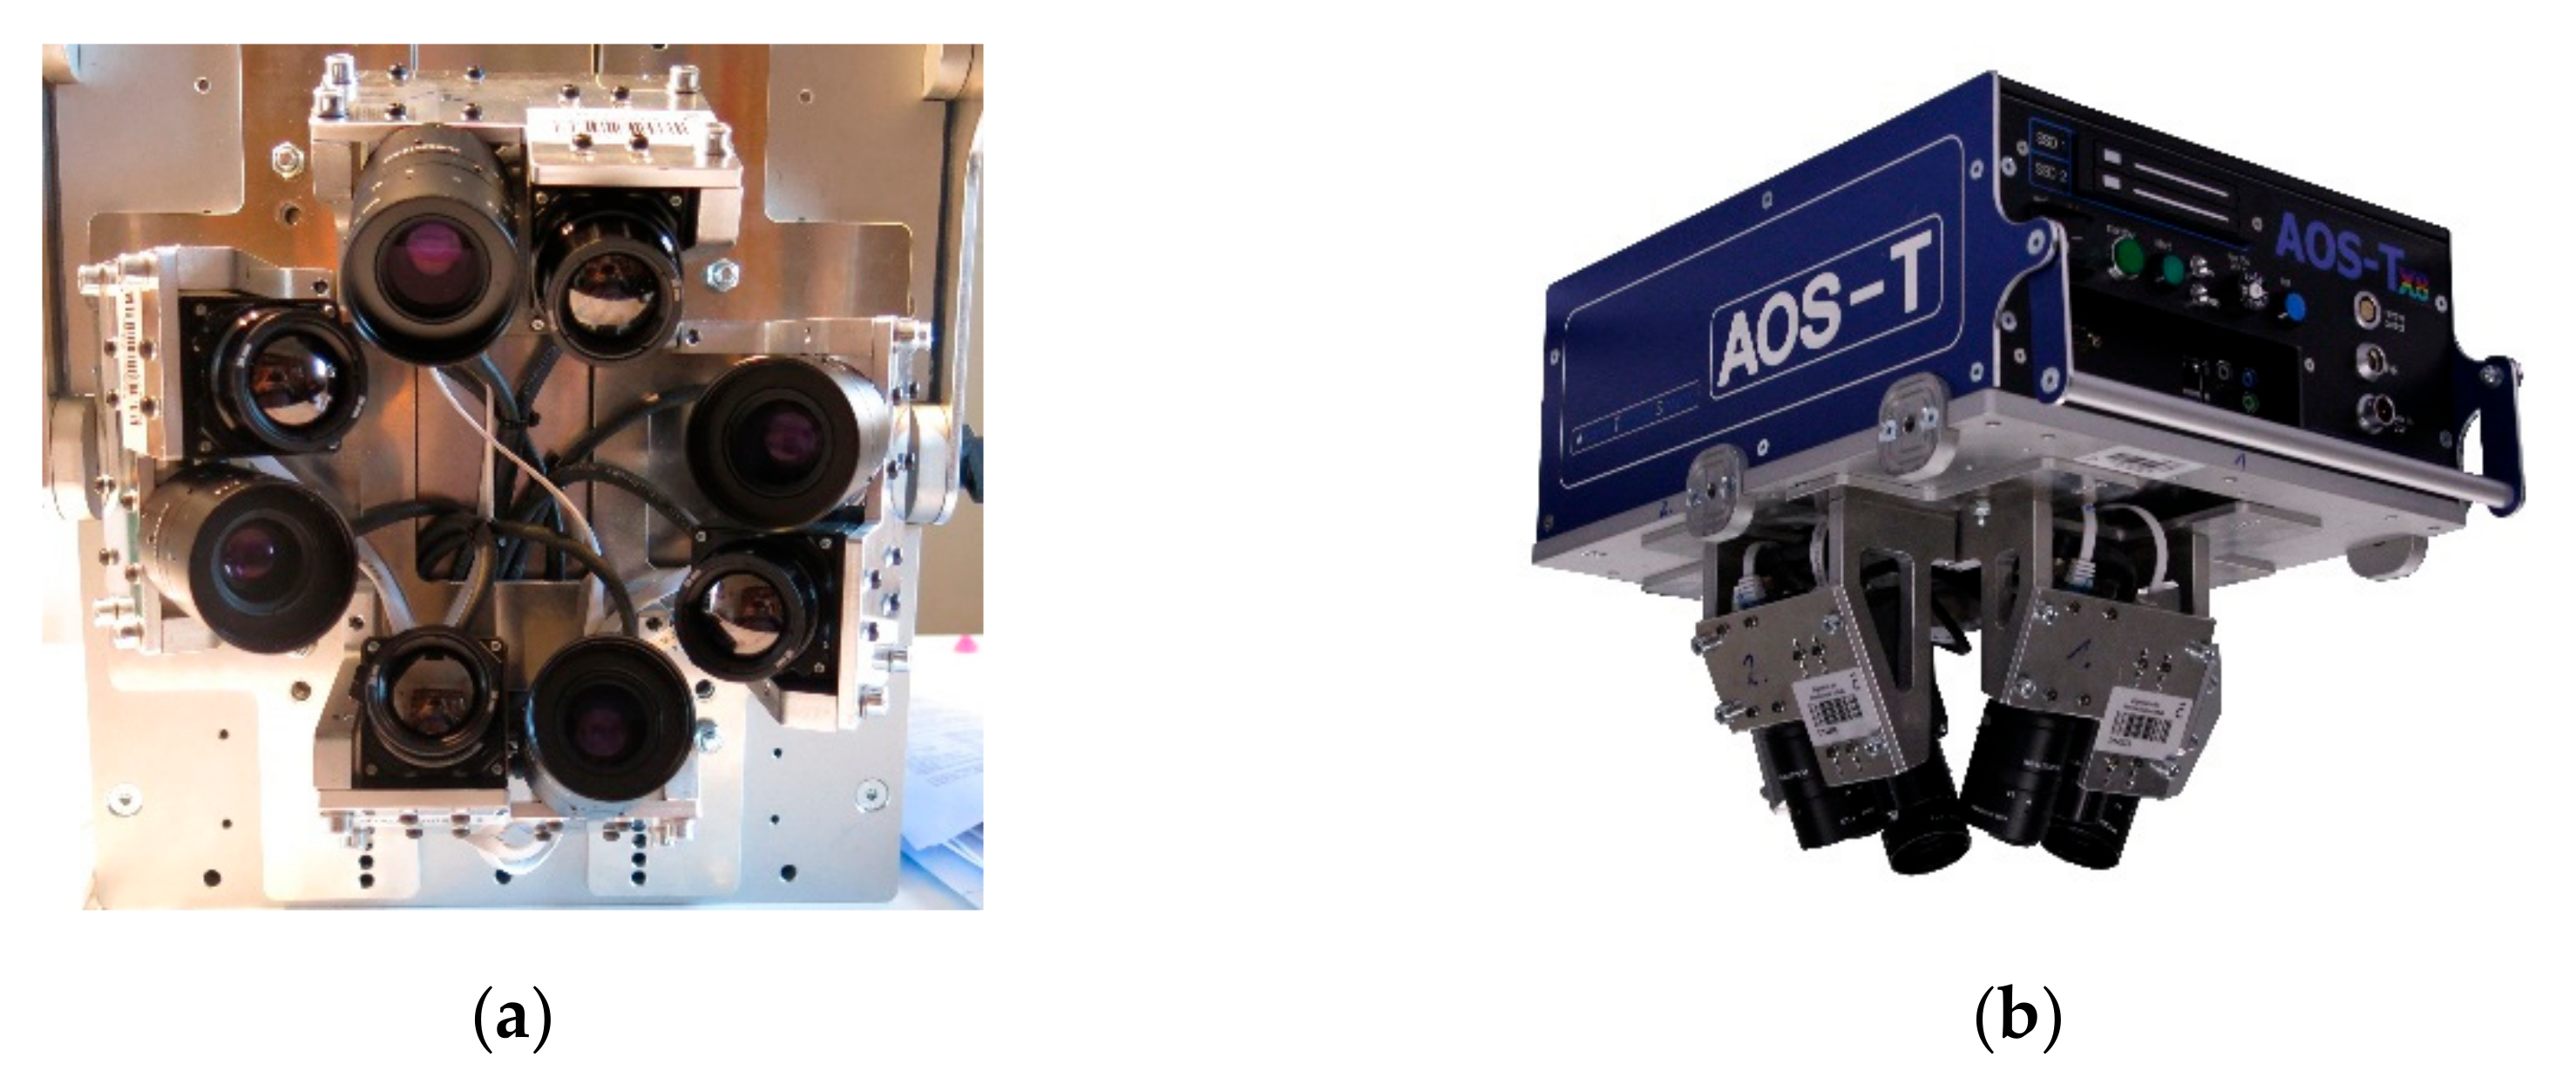
Figure 2.
Average re-projection error in pixels (a) without the distortion model and (b) with the adopted distortion model.
Figure 2.
Average re-projection error in pixels (a) without the distortion model and (b) with the adopted distortion model.

Figure 3.
Registration workflow.

Figure 4.
Cloud-to-cloud (C2C) distance (m) maps achieved by coarse registration for (a) building area, (c) river ecosystem, and (e) soil area and fine registration for (b) building area, (d) river ecosystem, and (f) soil area.
Figure 4.
Cloud-to-cloud (C2C) distance (m) maps achieved by coarse registration for (a) building area, (c) river ecosystem, and (e) soil area and fine registration for (b) building area, (d) river ecosystem, and (f) soil area.

Figure 5.
Illustration for thermal radiant characteristics.
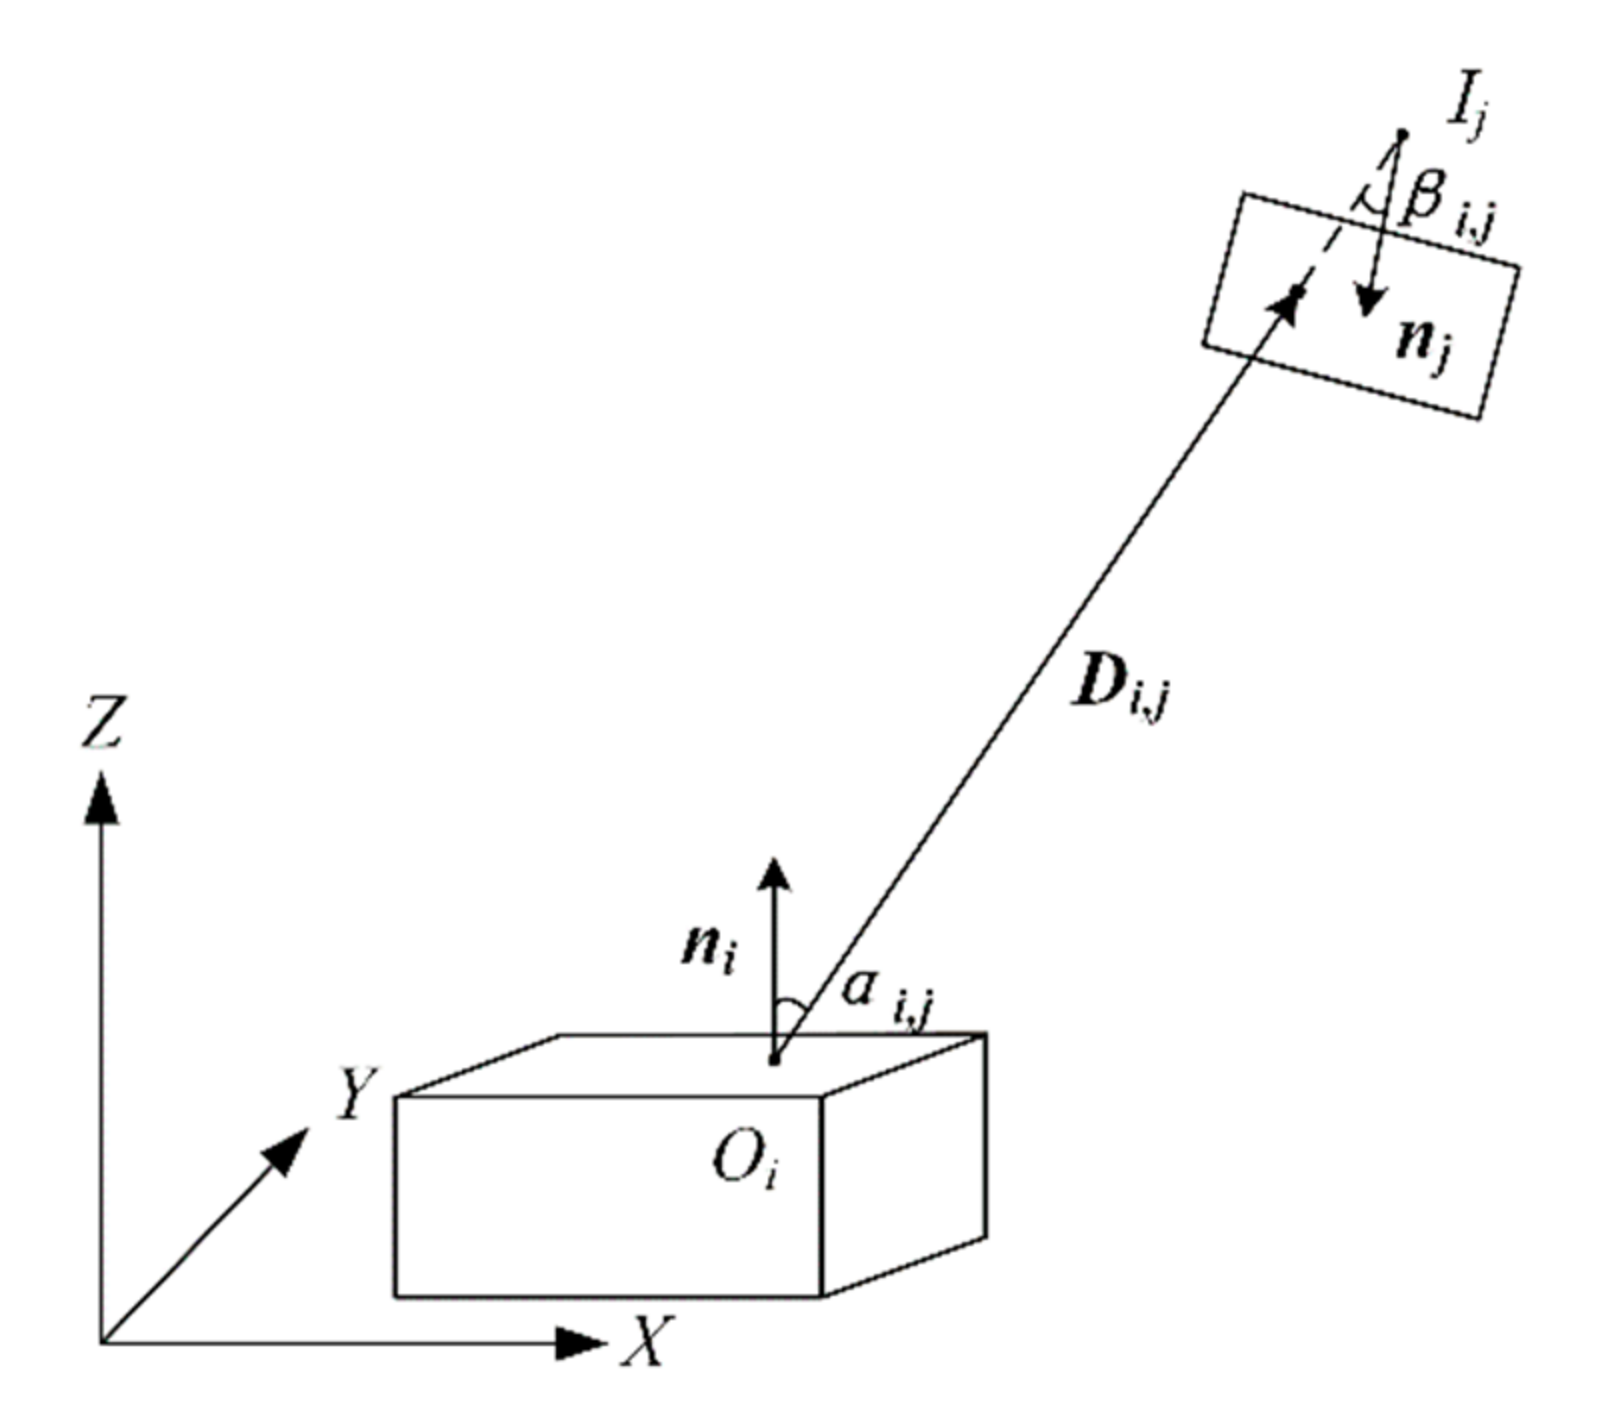
Figure 6.
Illustration for global pose refinement. Black box indicates the original image pose and blue box indicates the refined image pose after one-time iteration. T refers to temperature calculated from thermal imagery.
Figure 6.
Illustration for global pose refinement. Black box indicates the original image pose and blue box indicates the refined image pose after one-time iteration. T refers to temperature calculated from thermal imagery.
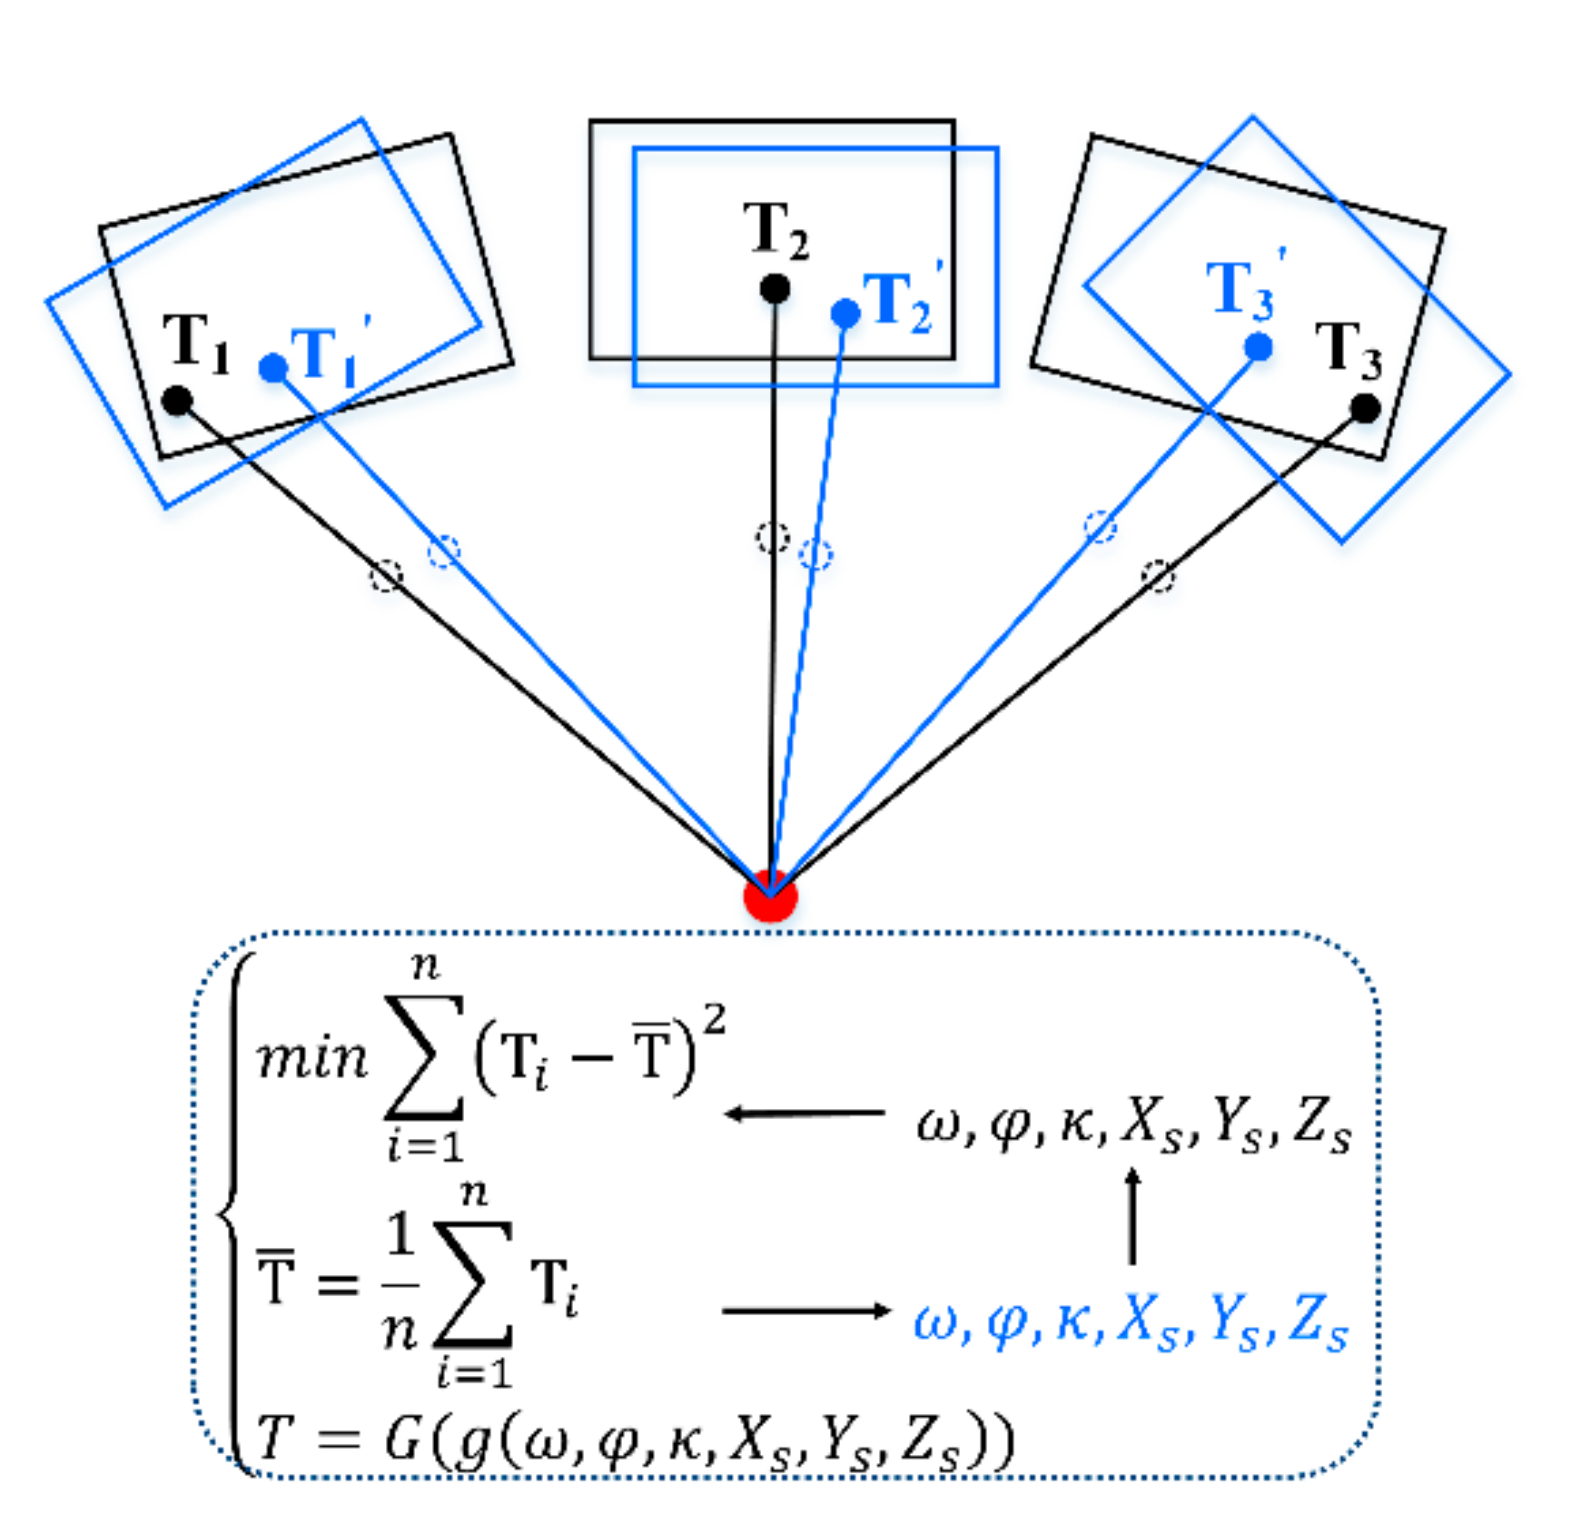
Figure 7.
Thermal texture mapping results (°C) using strategy 1 for (a) building area, (b) river ecosystem, and (c) soil area.
Figure 7.
Thermal texture mapping results (°C) using strategy 1 for (a) building area, (b) river ecosystem, and (c) soil area.
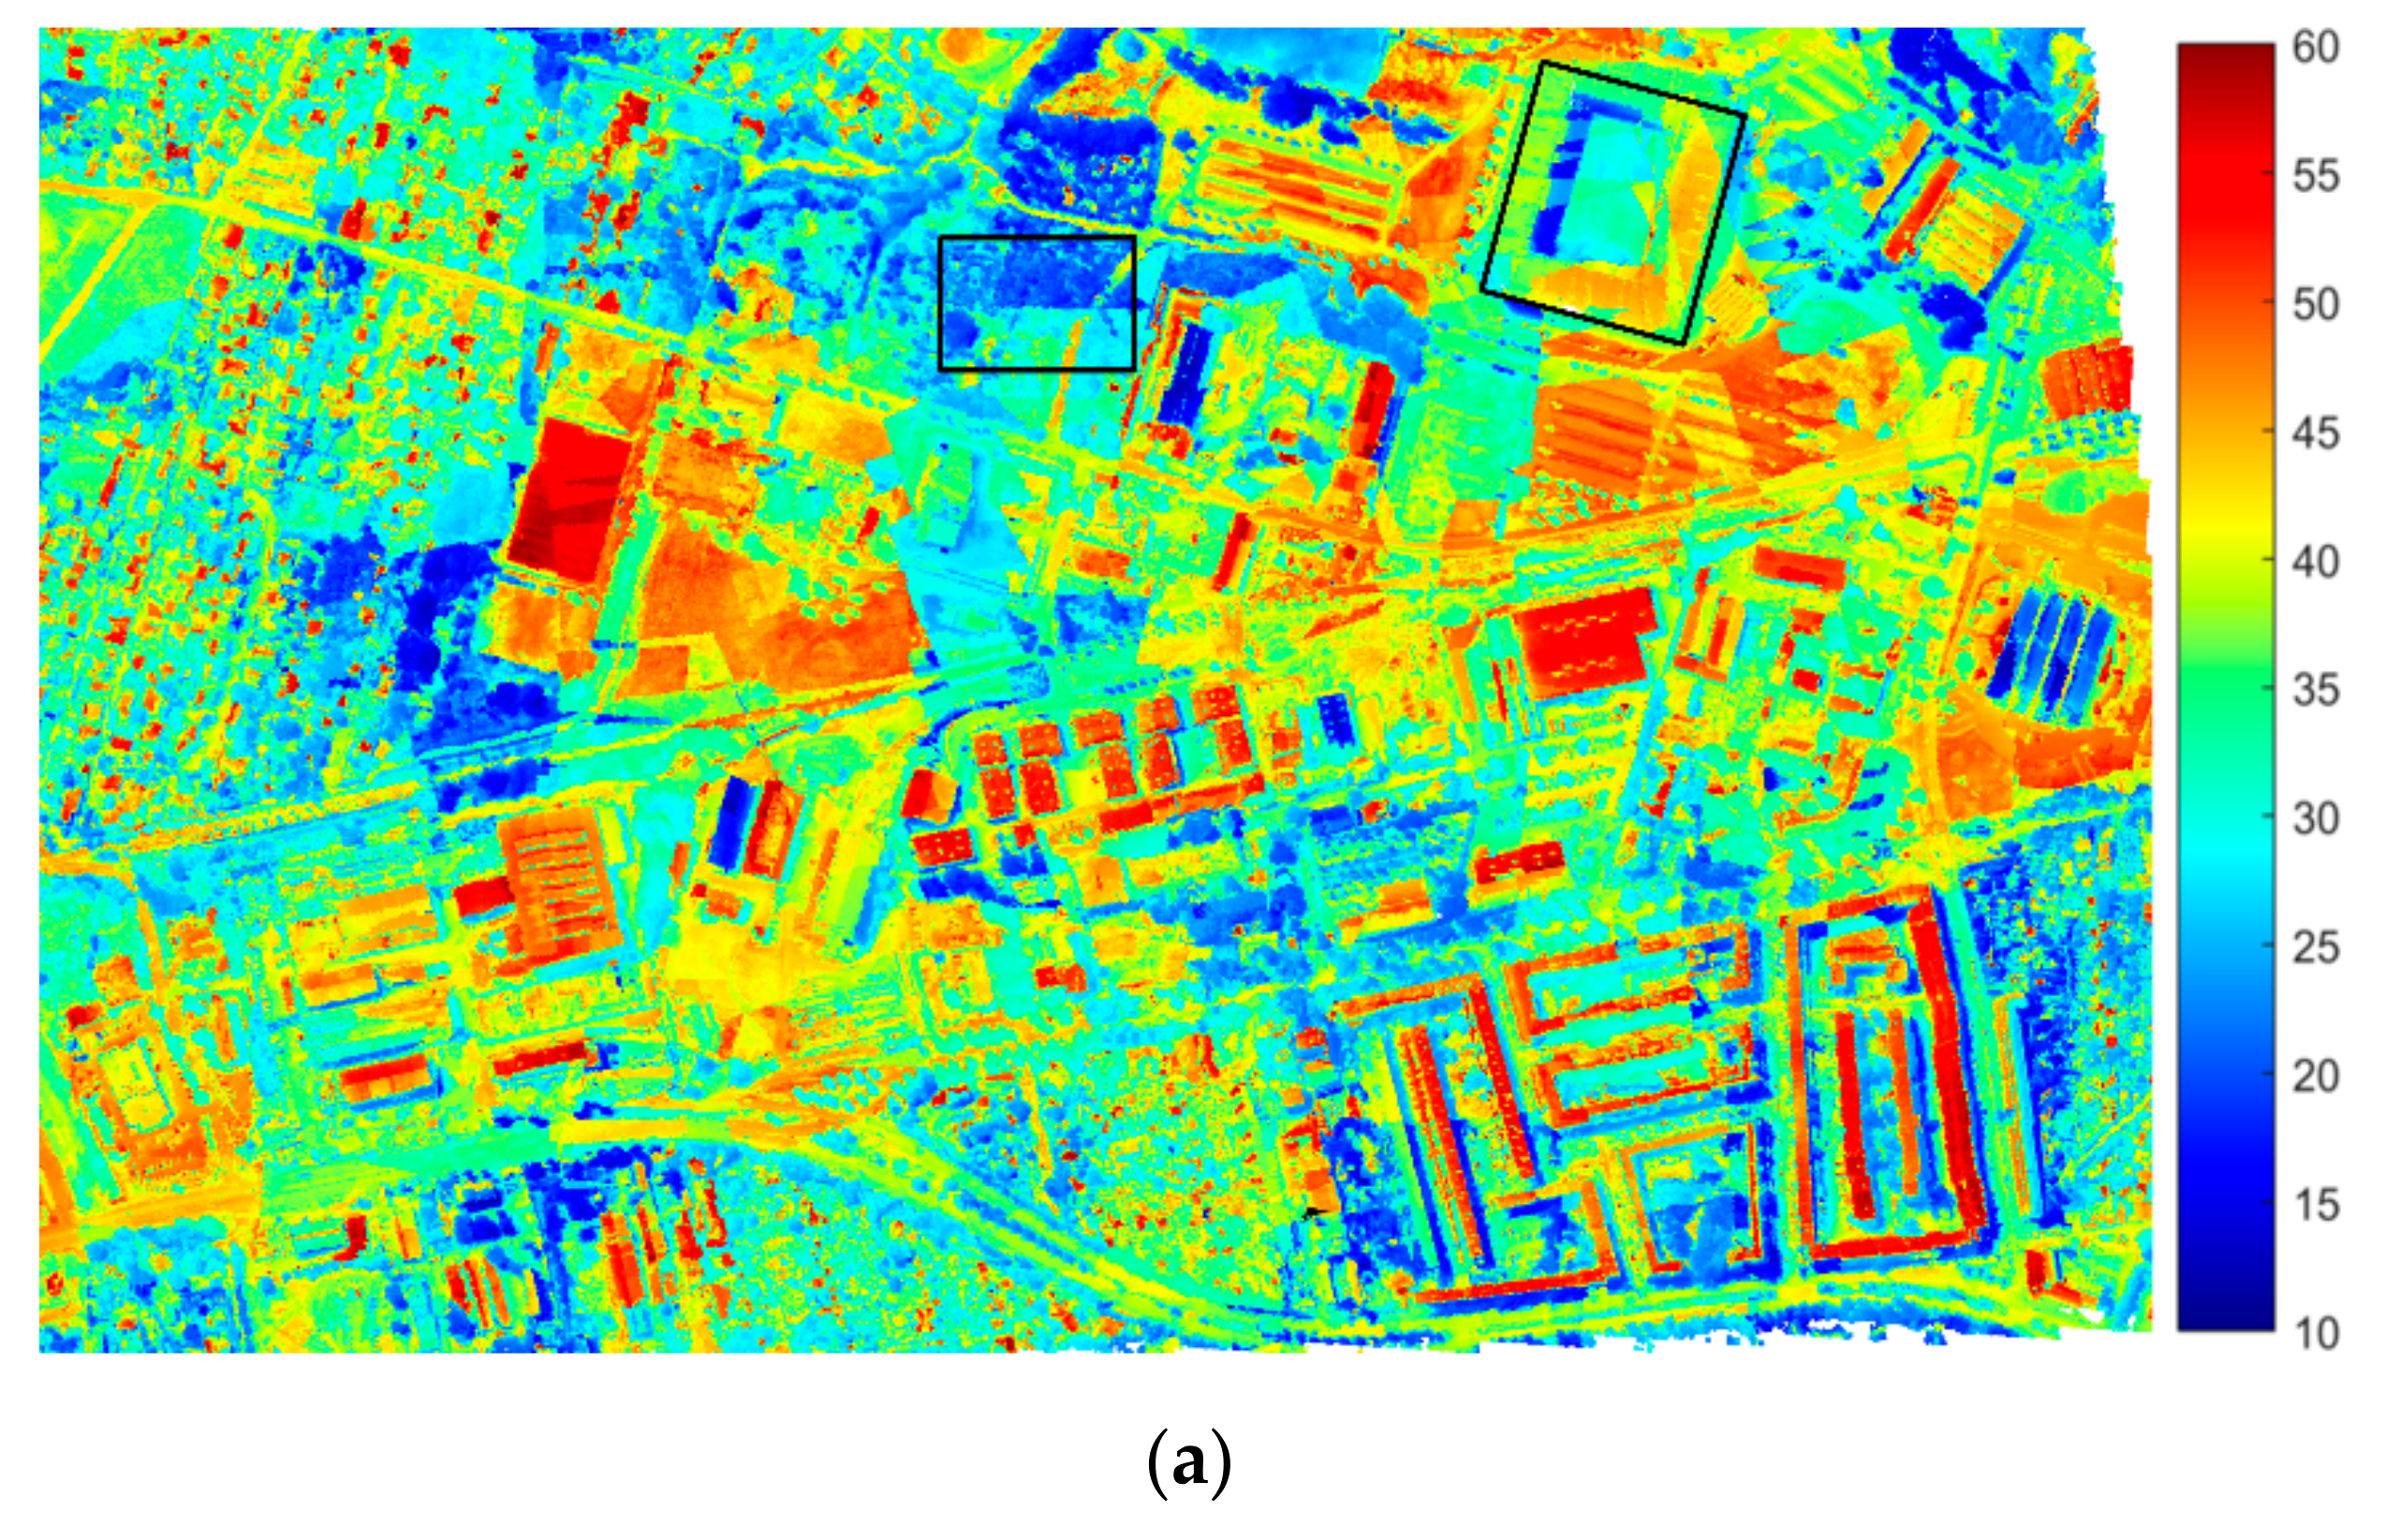
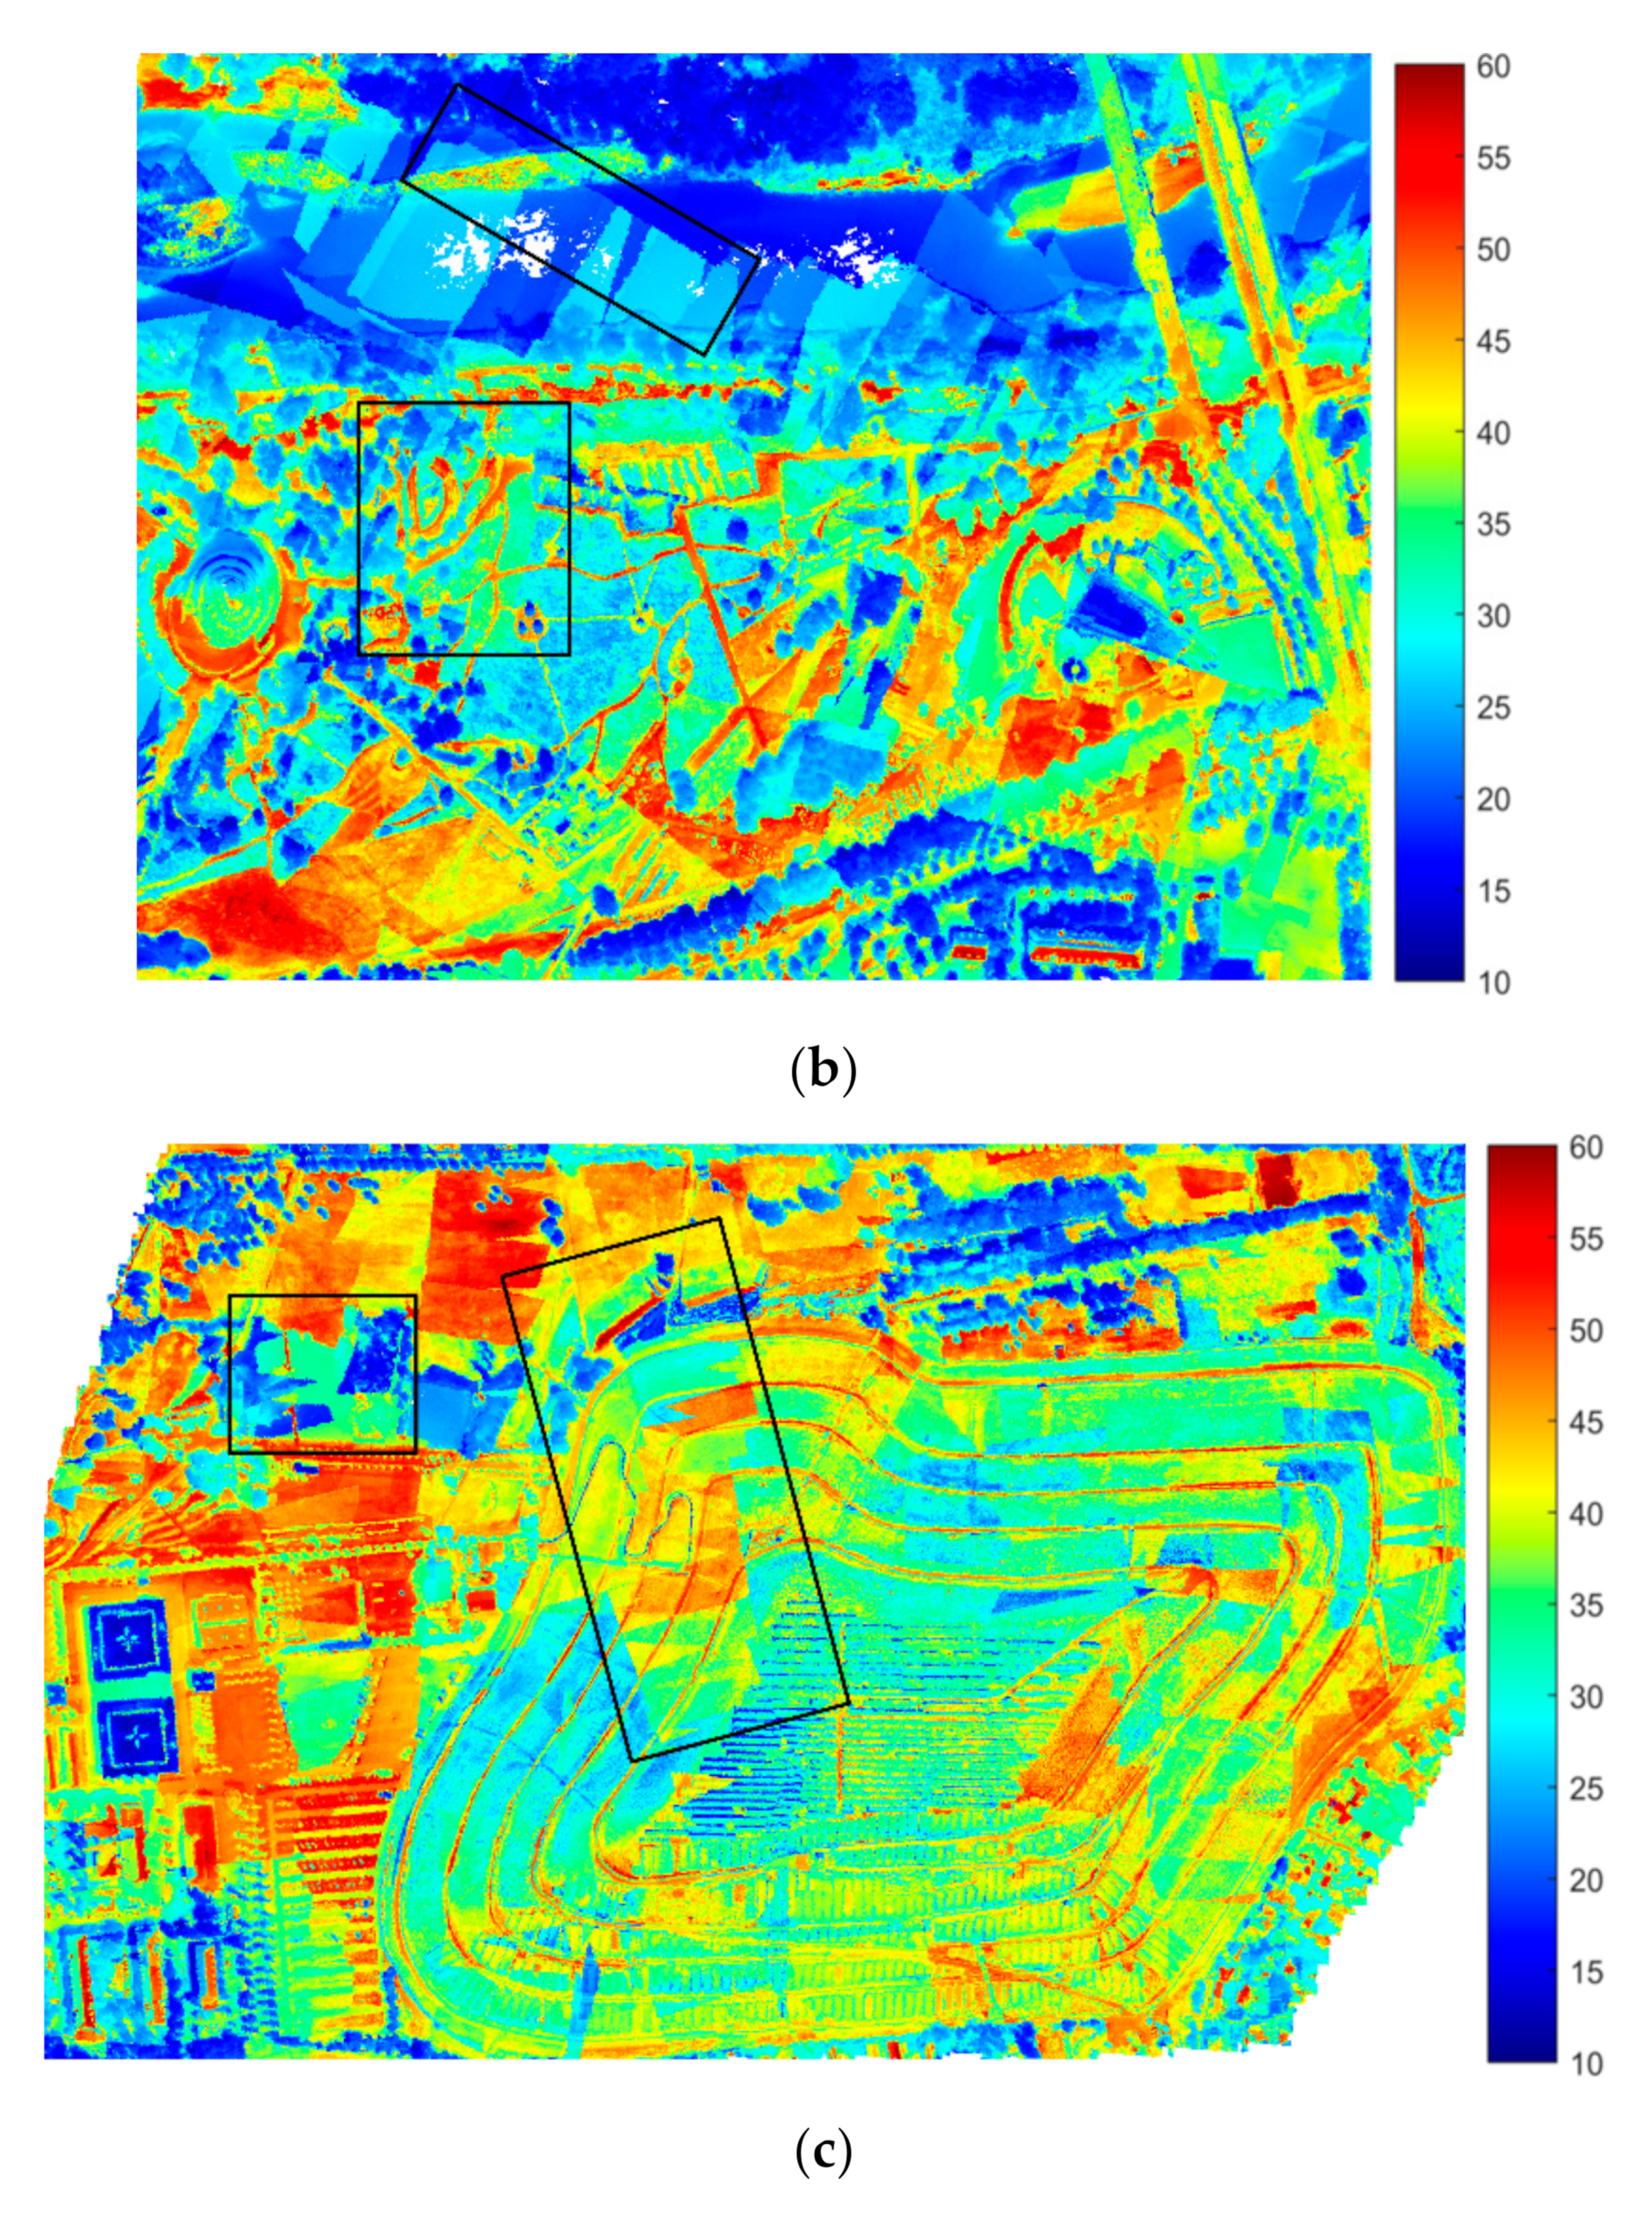
Figure 8.
Thermal texture mapping results (°C) using strategy 2 for (a) building area, (b) river ecosystem, and (c) soil area.
Figure 8.
Thermal texture mapping results (°C) using strategy 2 for (a) building area, (b) river ecosystem, and (c) soil area.


Figure 9.
Thermal texture mapping results (°C) using strategy 3 for (a) building area, (b) river ecosystem, and (c) soil area.
Figure 9.
Thermal texture mapping results (°C) using strategy 3 for (a) building area, (b) river ecosystem, and (c) soil area.
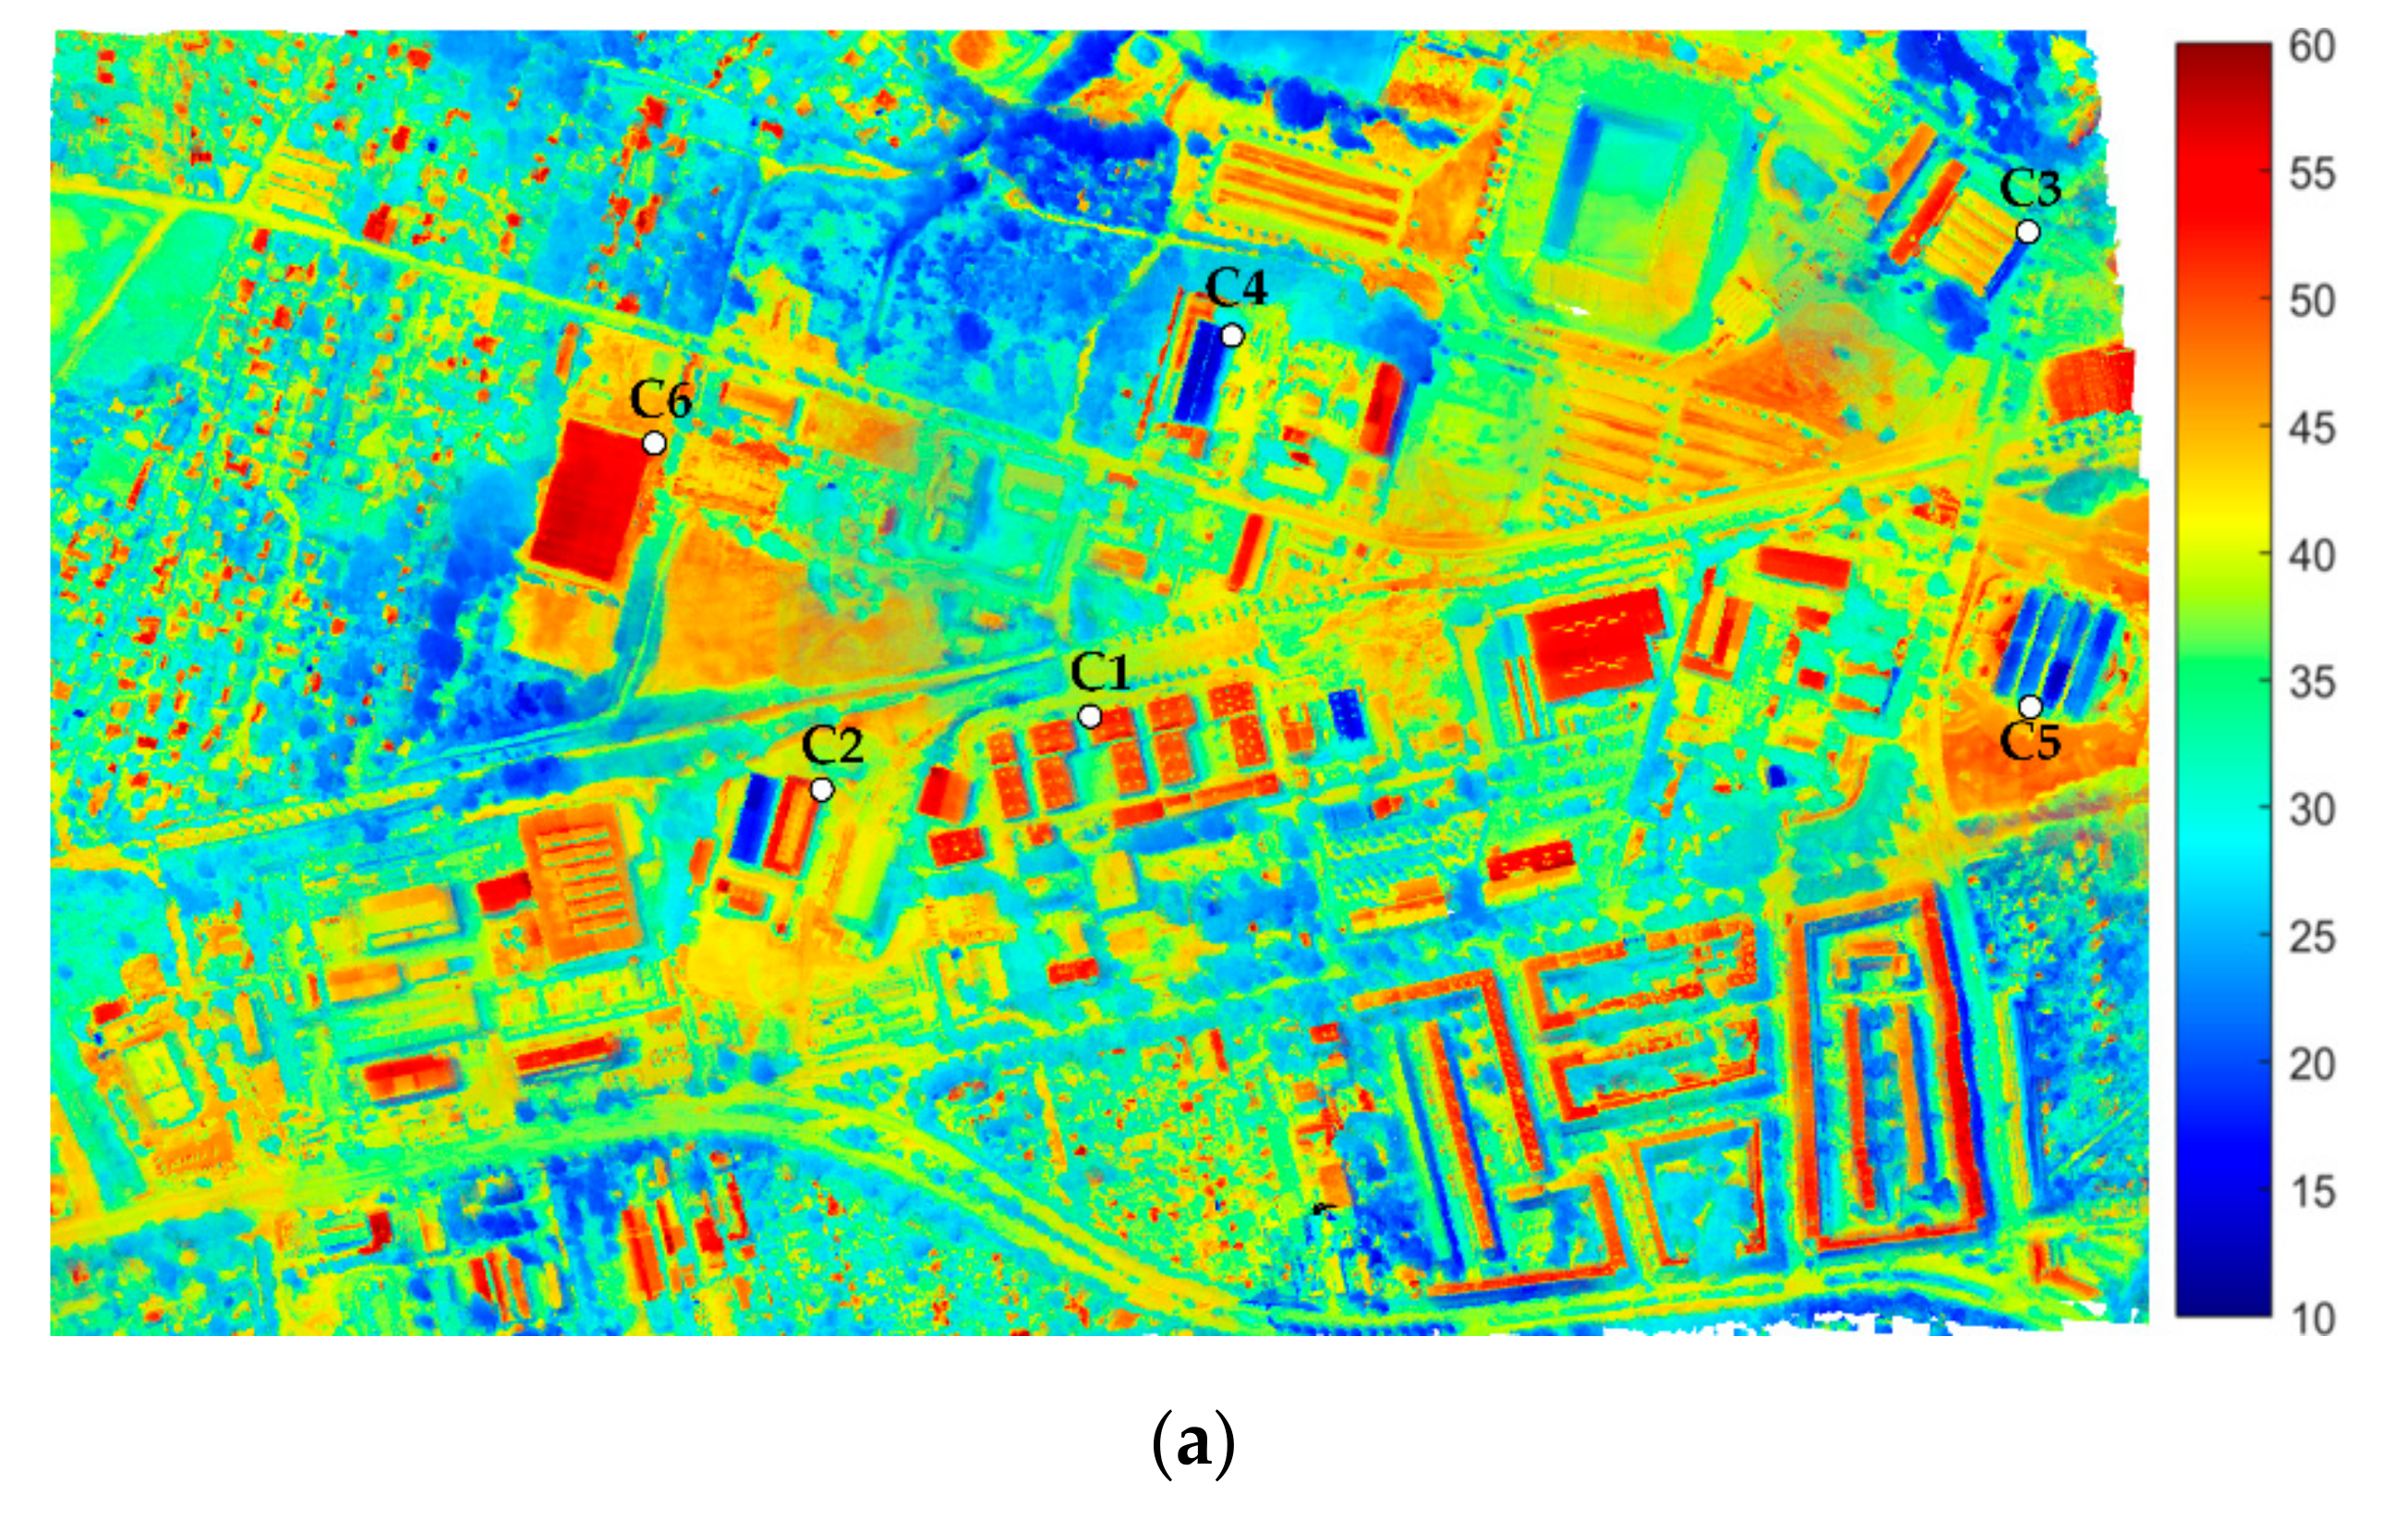
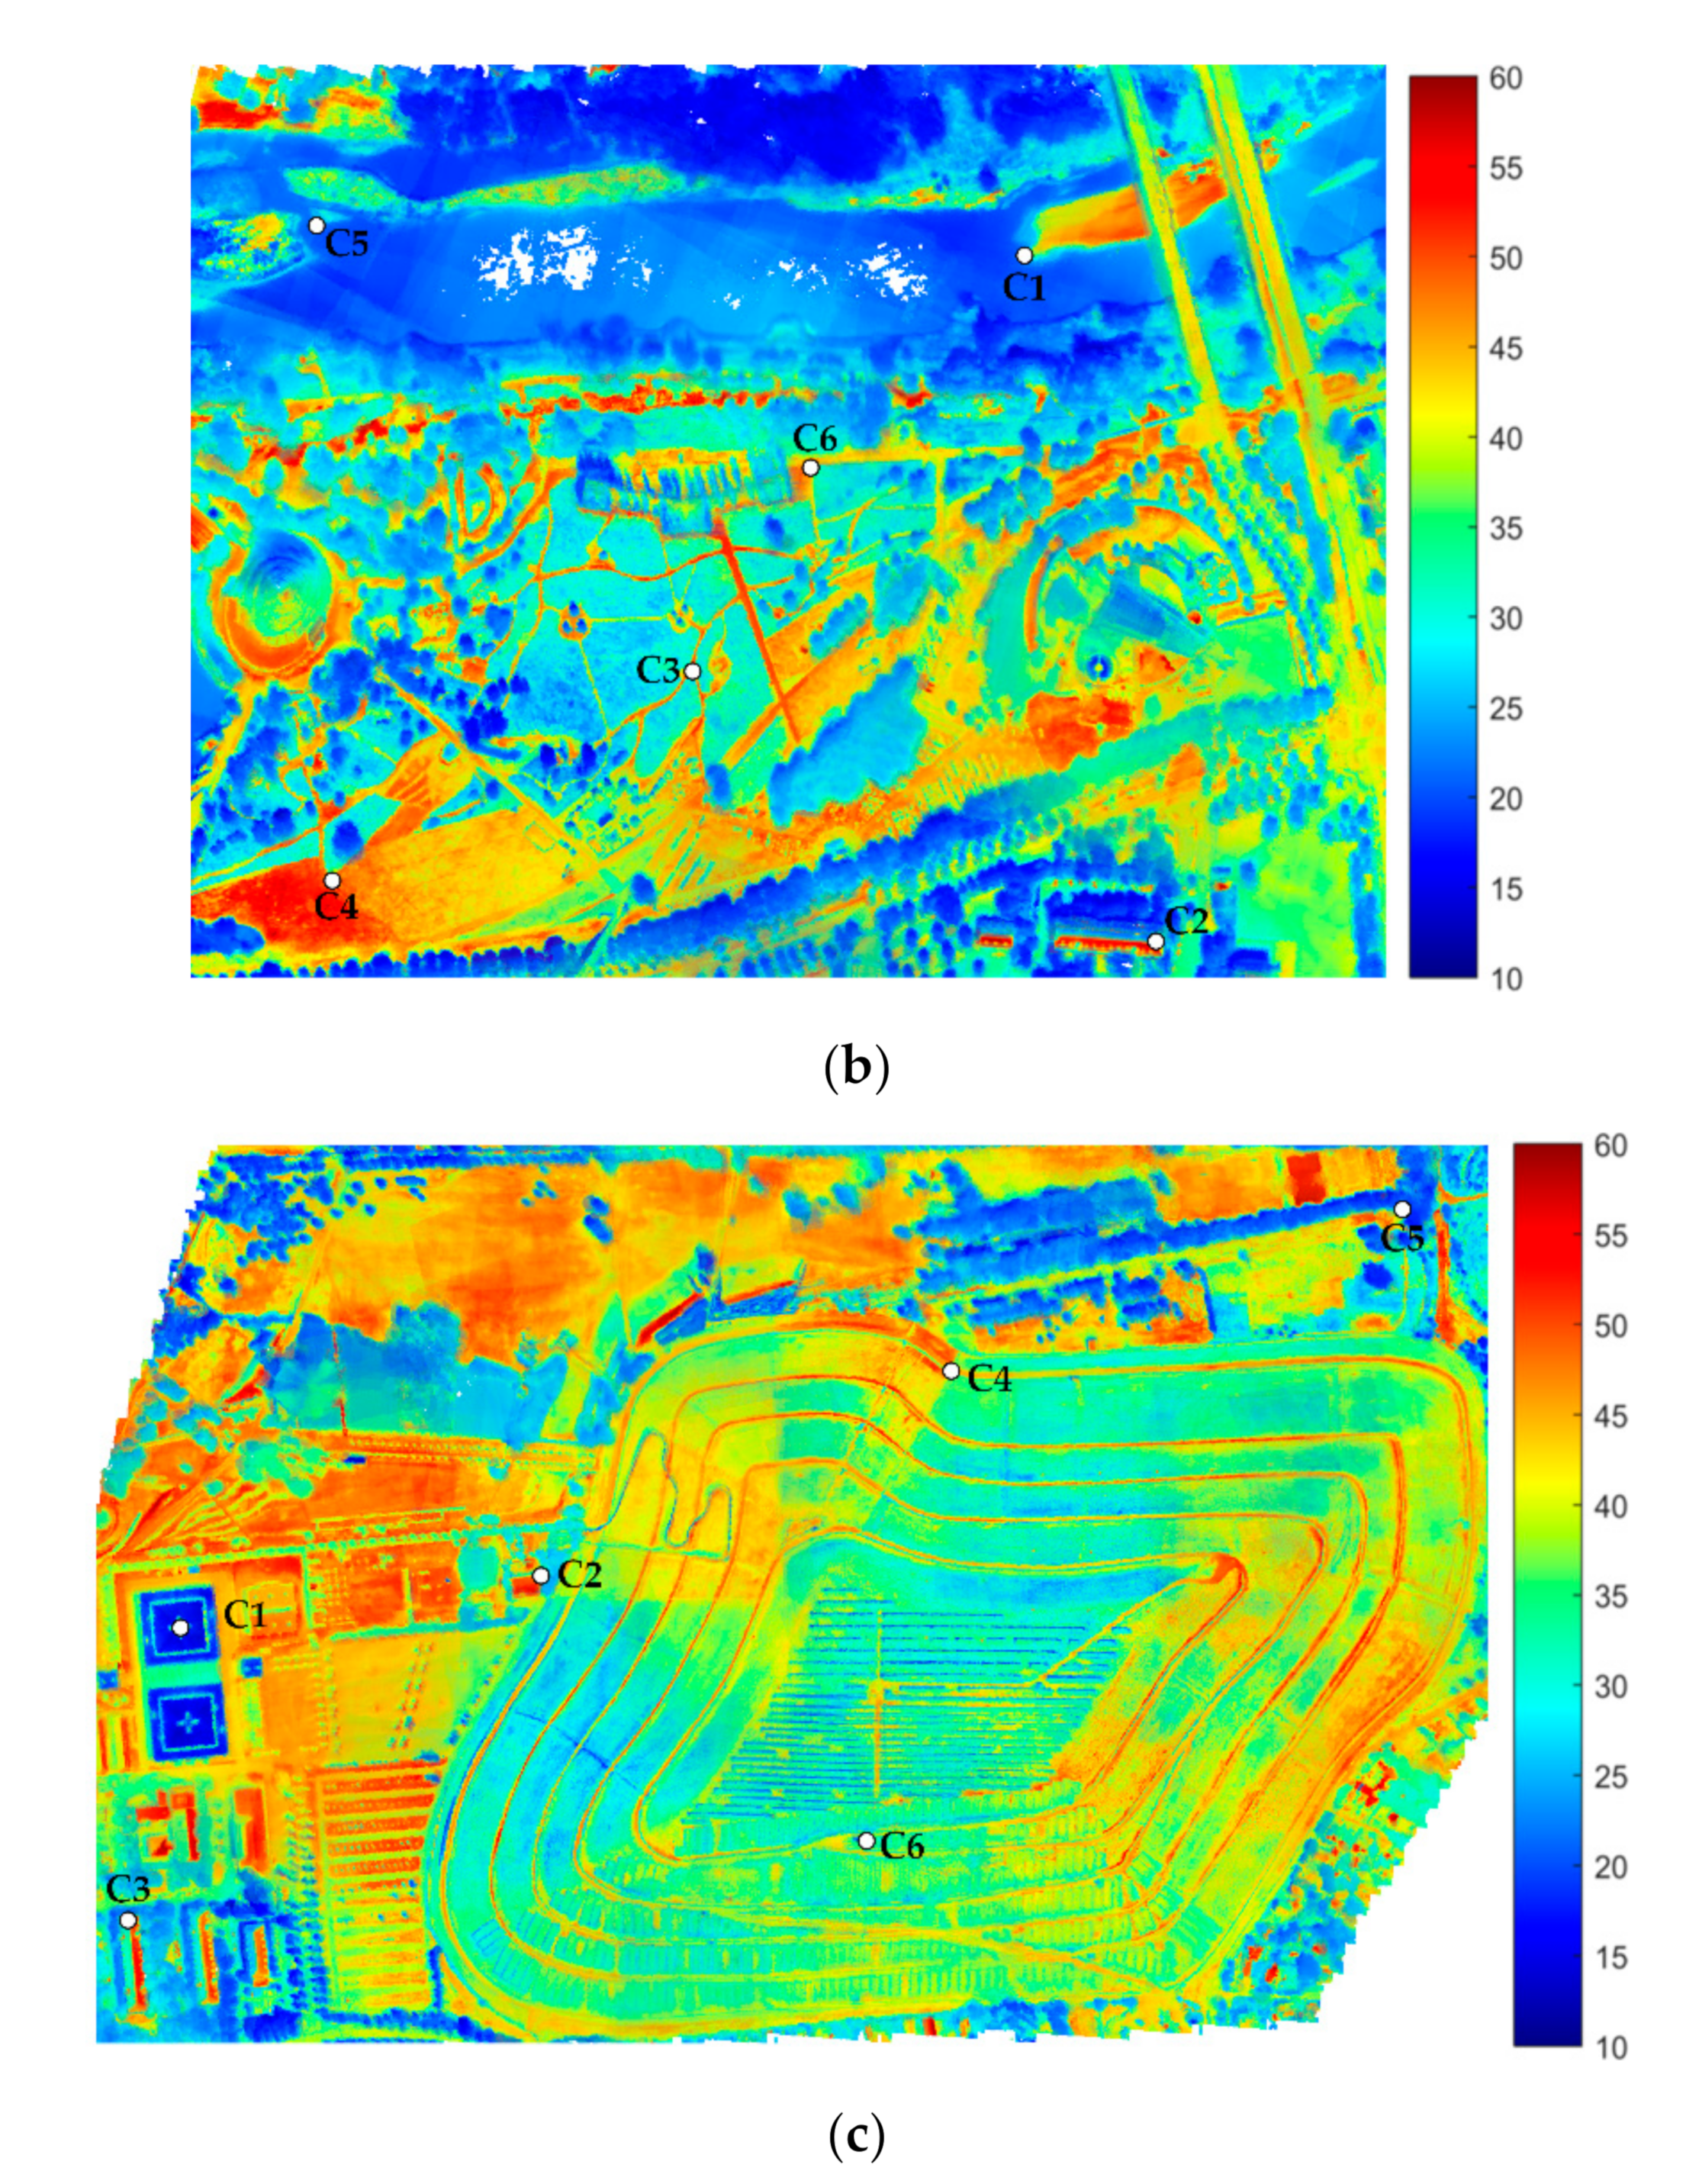
Figure 10.
Comparisons of enlarged areas. Texture mapping results using strategy 2 for (a) building area, (c) river ecosystem, and (e) soil area; texture mapping results using strategy 3 for (b) building area, (d) river ecosystem, and (f) soil area.
Figure 10.
Comparisons of enlarged areas. Texture mapping results using strategy 2 for (a) building area, (c) river ecosystem, and (e) soil area; texture mapping results using strategy 3 for (b) building area, (d) river ecosystem, and (f) soil area.


Figure 11.
Potential building thermal leakage: (a) represents the reference RGB point cloud and (b) refers to the thermal texture mapping result (°C).
Figure 11.
Potential building thermal leakage: (a) represents the reference RGB point cloud and (b) refers to the thermal texture mapping result (°C).

Figure 12.
Thermal texture mapping for a church area: (a) represents the reference RGB point cloud and (b) refers to the thermal texture mapping result (°C).
Figure 12.
Thermal texture mapping for a church area: (a) represents the reference RGB point cloud and (b) refers to the thermal texture mapping result (°C).


Table 1.
Specifications of the used RGB and thermal cameras for AOS-Tx8.
| Specifications | Baumer VCXG-53c | FLIR A65sc |
|---|---|---|
| Megapixel | 5.308 (2592 × 2048) | 0.328 (640 × 512) |
| Frame rate (Hz) | 23 | 30 |
| Detector pitch (μm) | 4.8 | 17 |
| Field of View, FOV (°) | 28.8 | 25 |
| Focal length (mm) | 25 | 25 |
| Measuring range | RGB (24 bit) | From −25 °C to 135 °C |
| Dimension (mm) | 40 × 29 × 29 | 106 × 40 × 43 |
Table 2.
Thermal camera geometric calibration parameters with their standard deviations .
| c (px) | x0 (px) | y0 (px) | K1 | K2 | K3 | P1 | P2 | B1 | B2 | |
|---|---|---|---|---|---|---|---|---|---|---|
| 1500.64 | 335.10 | 254.76 | 4.62 × 10⁻⁴ | 4.14 × 10⁻⁶ | 1.52 × 10⁻⁸ | 1.26 × 10⁻⁴ | 1.11 × 10⁻⁴ | 3.85 × 10⁻³ | 1.65 | |
| 0.44 | 0.13 | 0.31 | 1.01 × 10⁻⁶ | 2.16 × 10⁻⁸ | 3.15 × 10⁻¹⁰ | 2.37 × 10⁻⁶ | 6.93 × 10⁻⁶ | 5.38 × 10⁻⁵ | 2.28 × 10⁻⁵ |
Table 3.
Average and standard deviation of C2C distance (m) of the two point-clouds. Mean refers to the average C2C distance and Std. represents the standard deviation of C2C distance.
Table 3.
Average and standard deviation of C2C distance (m) of the two point-clouds. Mean refers to the average C2C distance and Std. represents the standard deviation of C2C distance.
| Test Area | Coarse Registration (Mean/Std.) (m) | Fine Registration (Mean/Std.) (m) |
|---|---|---|
| Building area | 15.7/6.3 | 4.1/2.9 |
| River ecosystem | 11.1/8.7 | 2.1/1.7 |
| Soil area | 10.5/6.6 | 4.2/3.0 |
Table 4.
(a) Geometric misalignment d for check points in building area (m). (b) Geometric misalignment d for check points in river ecosystem (m). (c) Geometric misalignment d for check points in soil area (m). (d) RMSE for building area, river ecosystem, and soil area (m).
Table 4.
(a) Geometric misalignment d for check points in building area (m). (b) Geometric misalignment d for check points in river ecosystem (m). (c) Geometric misalignment d for check points in soil area (m). (d) RMSE for building area, river ecosystem, and soil area (m).
| (a) | ||||||
| Point Index | C1 | C2 | C3 | C4 | C5 | C6 |
| Strategy 1 | 3.6 | 4.5 | 4.1 | 4.6 | 3.9 | 3.5 |
| Strategy 2 | 3.5 | 4.3 | 4.2 | 3.6 | 3.6 | 3.4 |
| Strategy 3 | 2.6 | 2.8 | 2.9 | 2.5 | 2.8 | 2.0 |
| (b) | ||||||
| Point Index | C1 | C2 | C3 | C4 | C5 | C6 |
| Strategy 1 | 2.8 | 3.0 | 1.9 | 2.2 | 2.1 | 2.4 |
| Strategy 2 | 2.6 | 2.5 | 2.1 | 1.8 | 2.0 | 2.3 |
| Strategy 3 | 2.3 | 2.5 | 1.8 | 1.7 | 1.9 | 2.1 |
| (c) | ||||||
| Point Index | C1 | C2 | C3 | C4 | C5 | C6 |
| Strategy 1 | 3.8 | 4.2 | 3.4 | 4.7 | 4.6 | 3.7 |
| Strategy 2 | 3.3 | 4.2 | 3.8 | 4.4 | 4.4 | 3.1 |
| Strategy 3 | 2.4 | 3.5 | 3.4 | 4.3 | 3.9 | 3.0 |
| (d) | ||||||
| RMSE | Building Area | River Ecosystem | Soil Area | |||
| Strategy 1 | 4.1 | 2.4 | 4.1 | |||
| Strategy 2 | 3.8 | 2.2 | 3.9 | |||
| Strategy 3 | 2.6 | 2.1 | 3.4 | |||
© 2019 by the authors. Licensee MDPI, Basel, Switzerland. This article is an open access article distributed under the terms and conditions of the Creative Commons Attribution (CC BY) license (http://creativecommons.org/licenses/by/4.0/).
Share and Cite
MDPI and ACS Style
Lin, D.; Bannehr, L.; Ulrich, C.; Maas, H.-G. Evaluating Thermal Attribute Mapping Strategies for Oblique Airborne Photogrammetric System AOS-Tx8. Remote Sens. 2020, 12, 112. https://0-doi-org.brum.beds.ac.uk/10.3390/rs12010112
AMA Style
Lin D, Bannehr L, Ulrich C, Maas H-G. Evaluating Thermal Attribute Mapping Strategies for Oblique Airborne Photogrammetric System AOS-Tx8. Remote Sensing. 2020; 12(1):112. https://0-doi-org.brum.beds.ac.uk/10.3390/rs12010112
Chicago/Turabian StyleLin, Dong, Lutz Bannehr, Christoph Ulrich, and Hans-Gerd Maas. 2020. "Evaluating Thermal Attribute Mapping Strategies for Oblique Airborne Photogrammetric System AOS-Tx8" Remote Sensing 12, no. 1: 112. https://0-doi-org.brum.beds.ac.uk/10.3390/rs12010112
Note that from the first issue of 2016, this journal uses article numbers instead of page numbers. See further details here.