The Impact of the Control Measures during the COVID-19 Outbreak on Air Pollution in China

 ,
,  , and
, and
Abstract
:1. Introduction
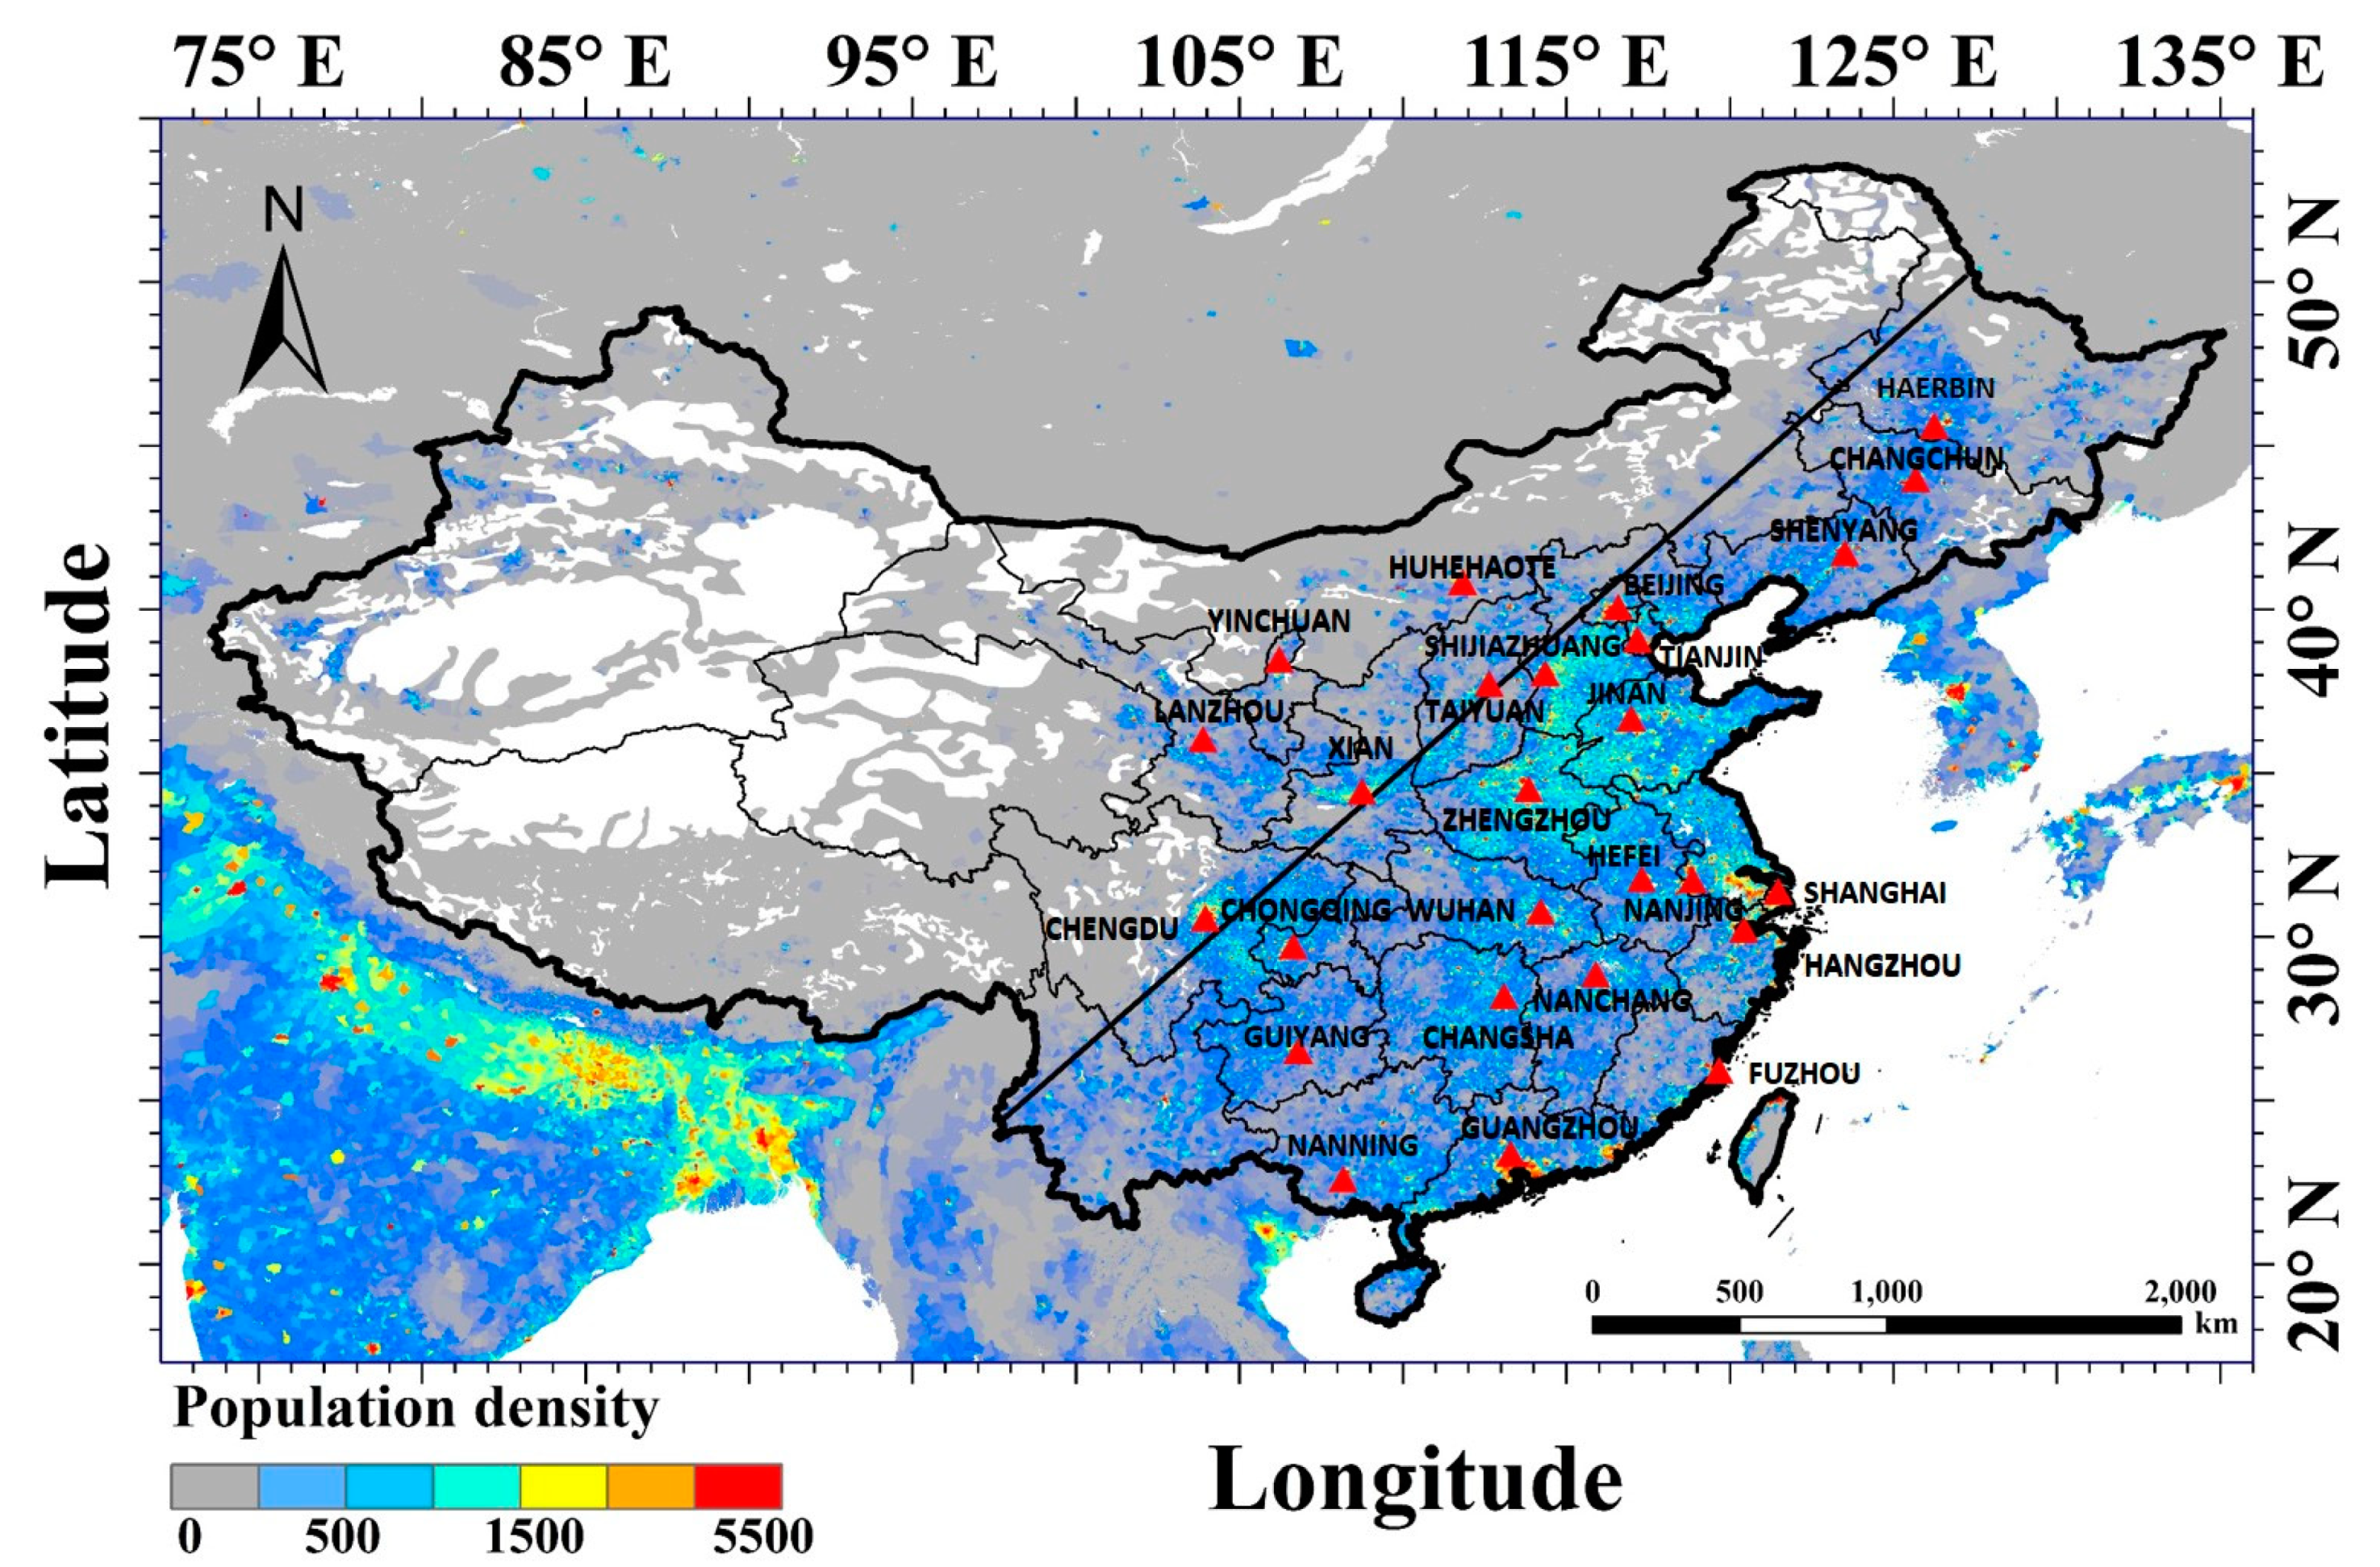
2. Study Area
3. Data Description
3.1. Ground-Based Data
3.2. Satellite Data
3.2.1. TROPOMI Data
3.2.2. MODIS Data
4. Results
4.1. Satellite Observations
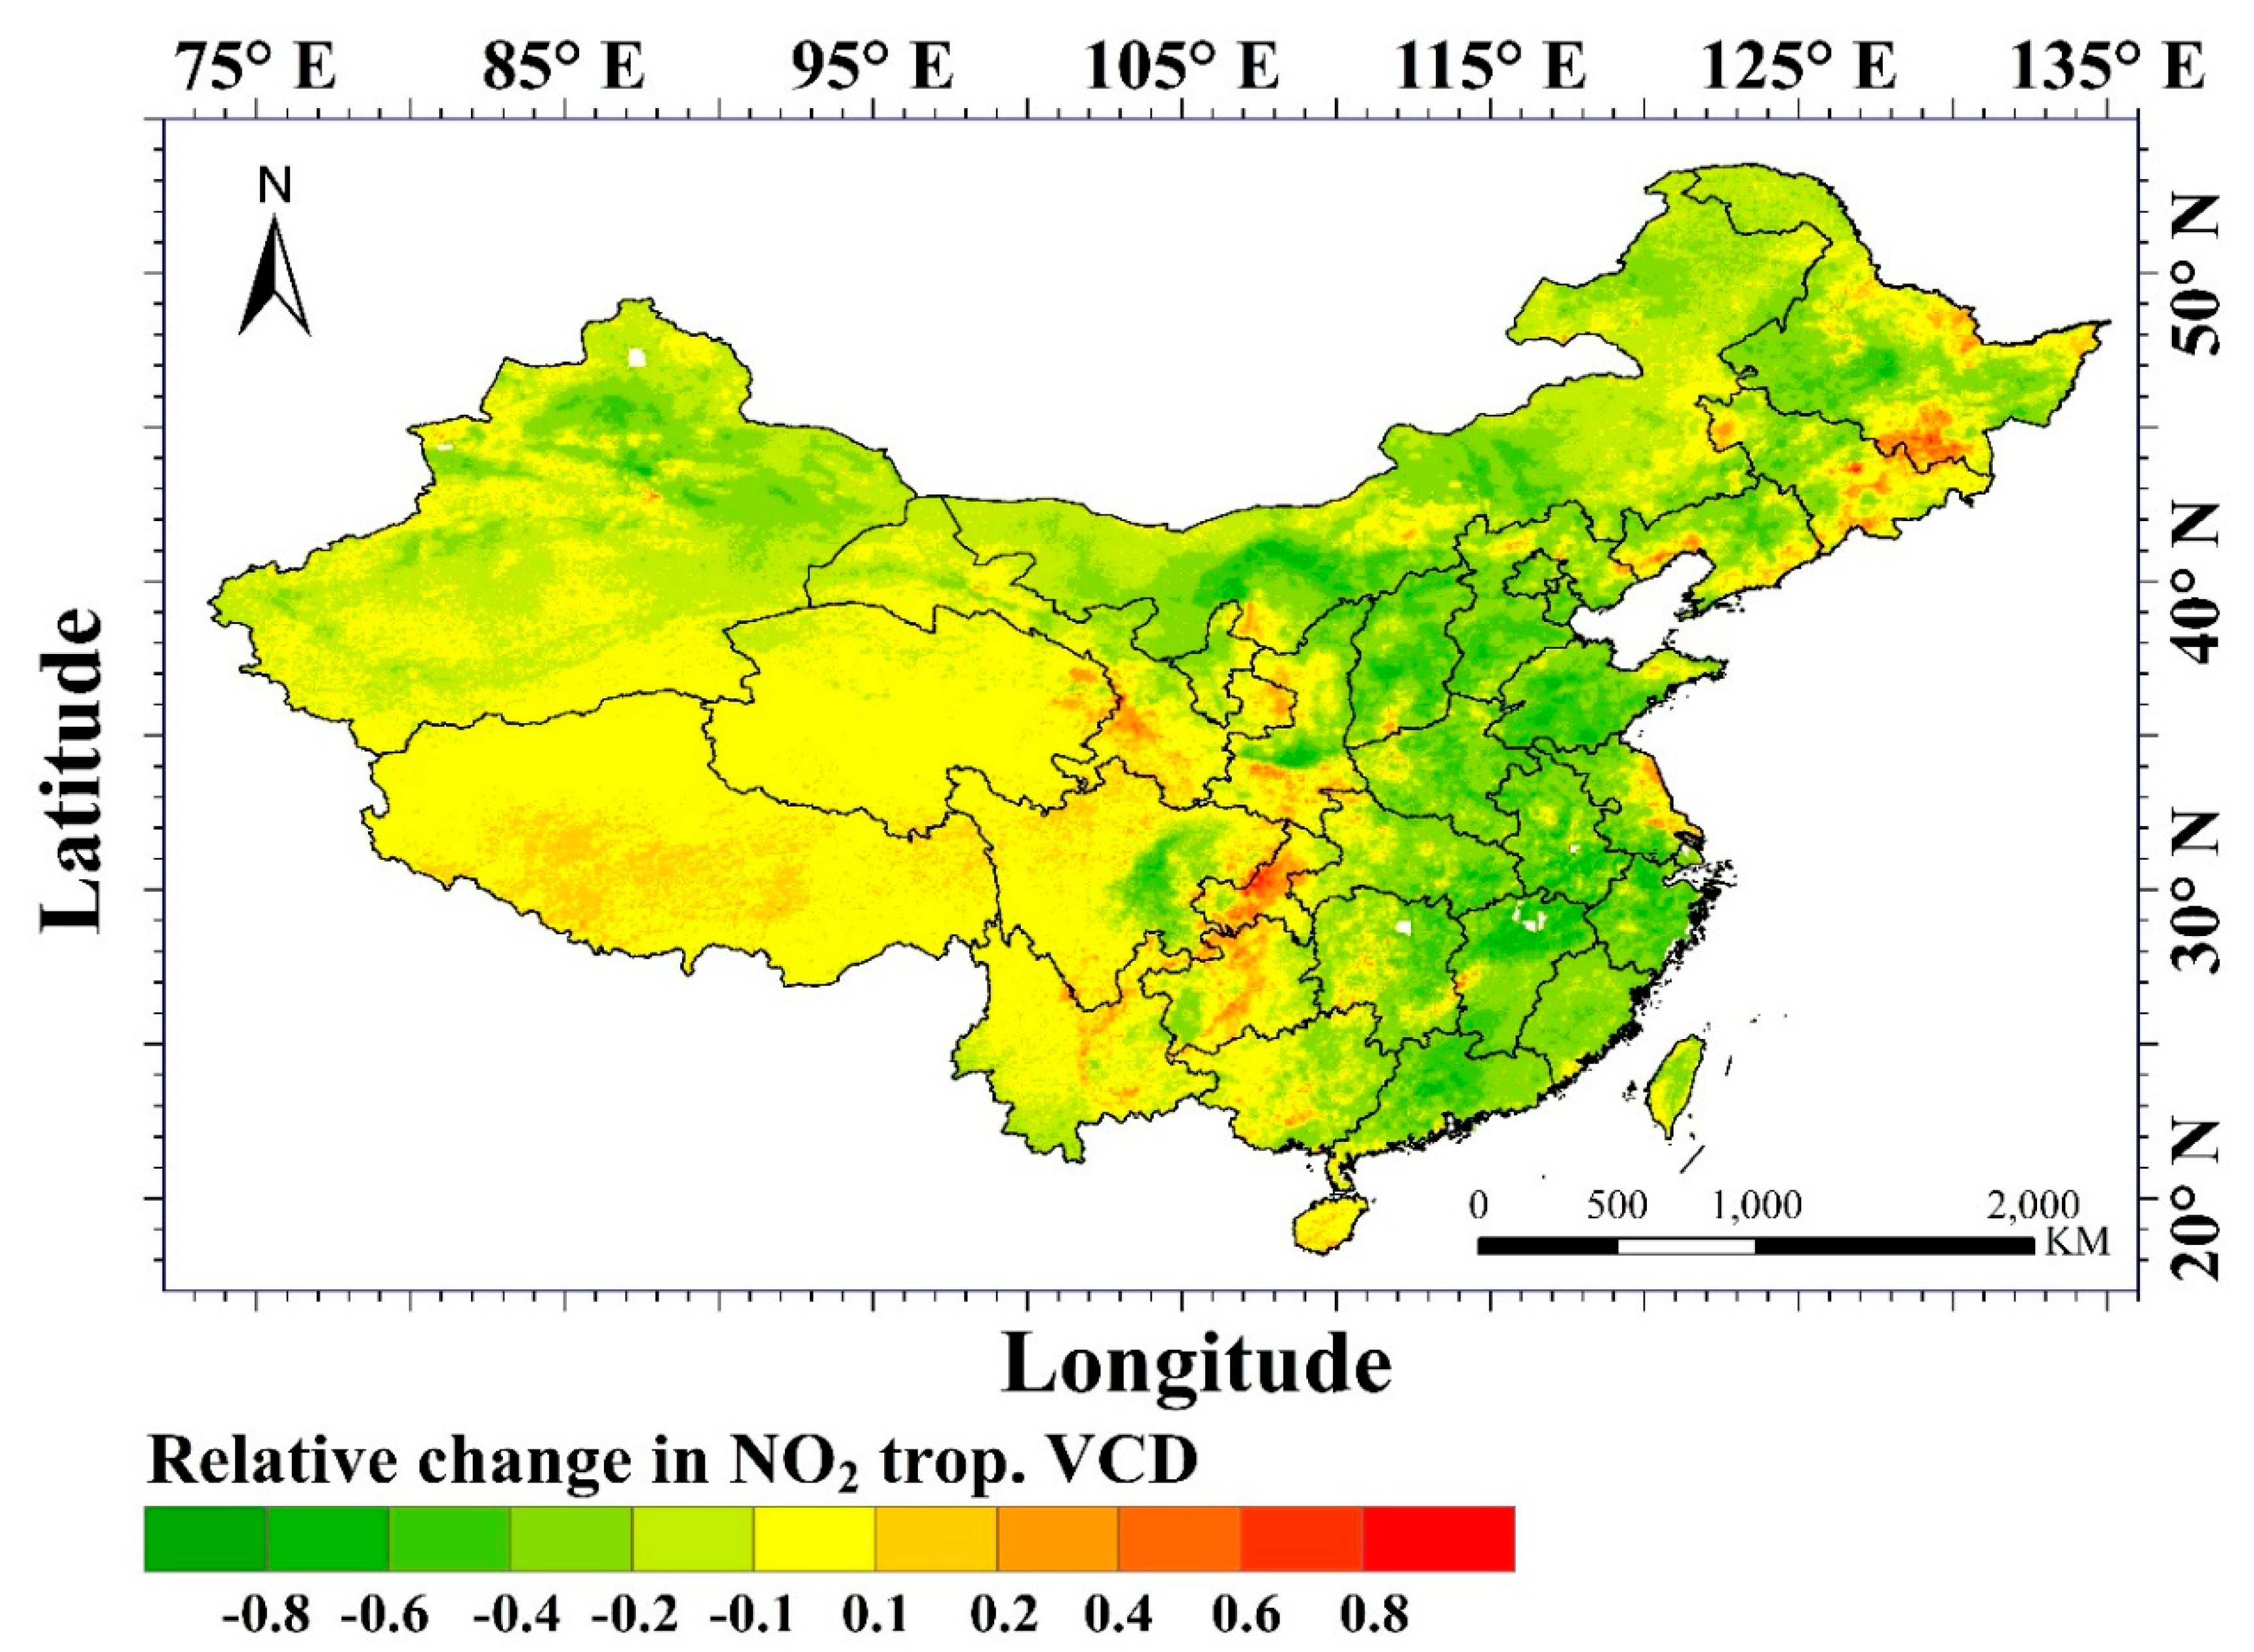
4.1.1. NO2
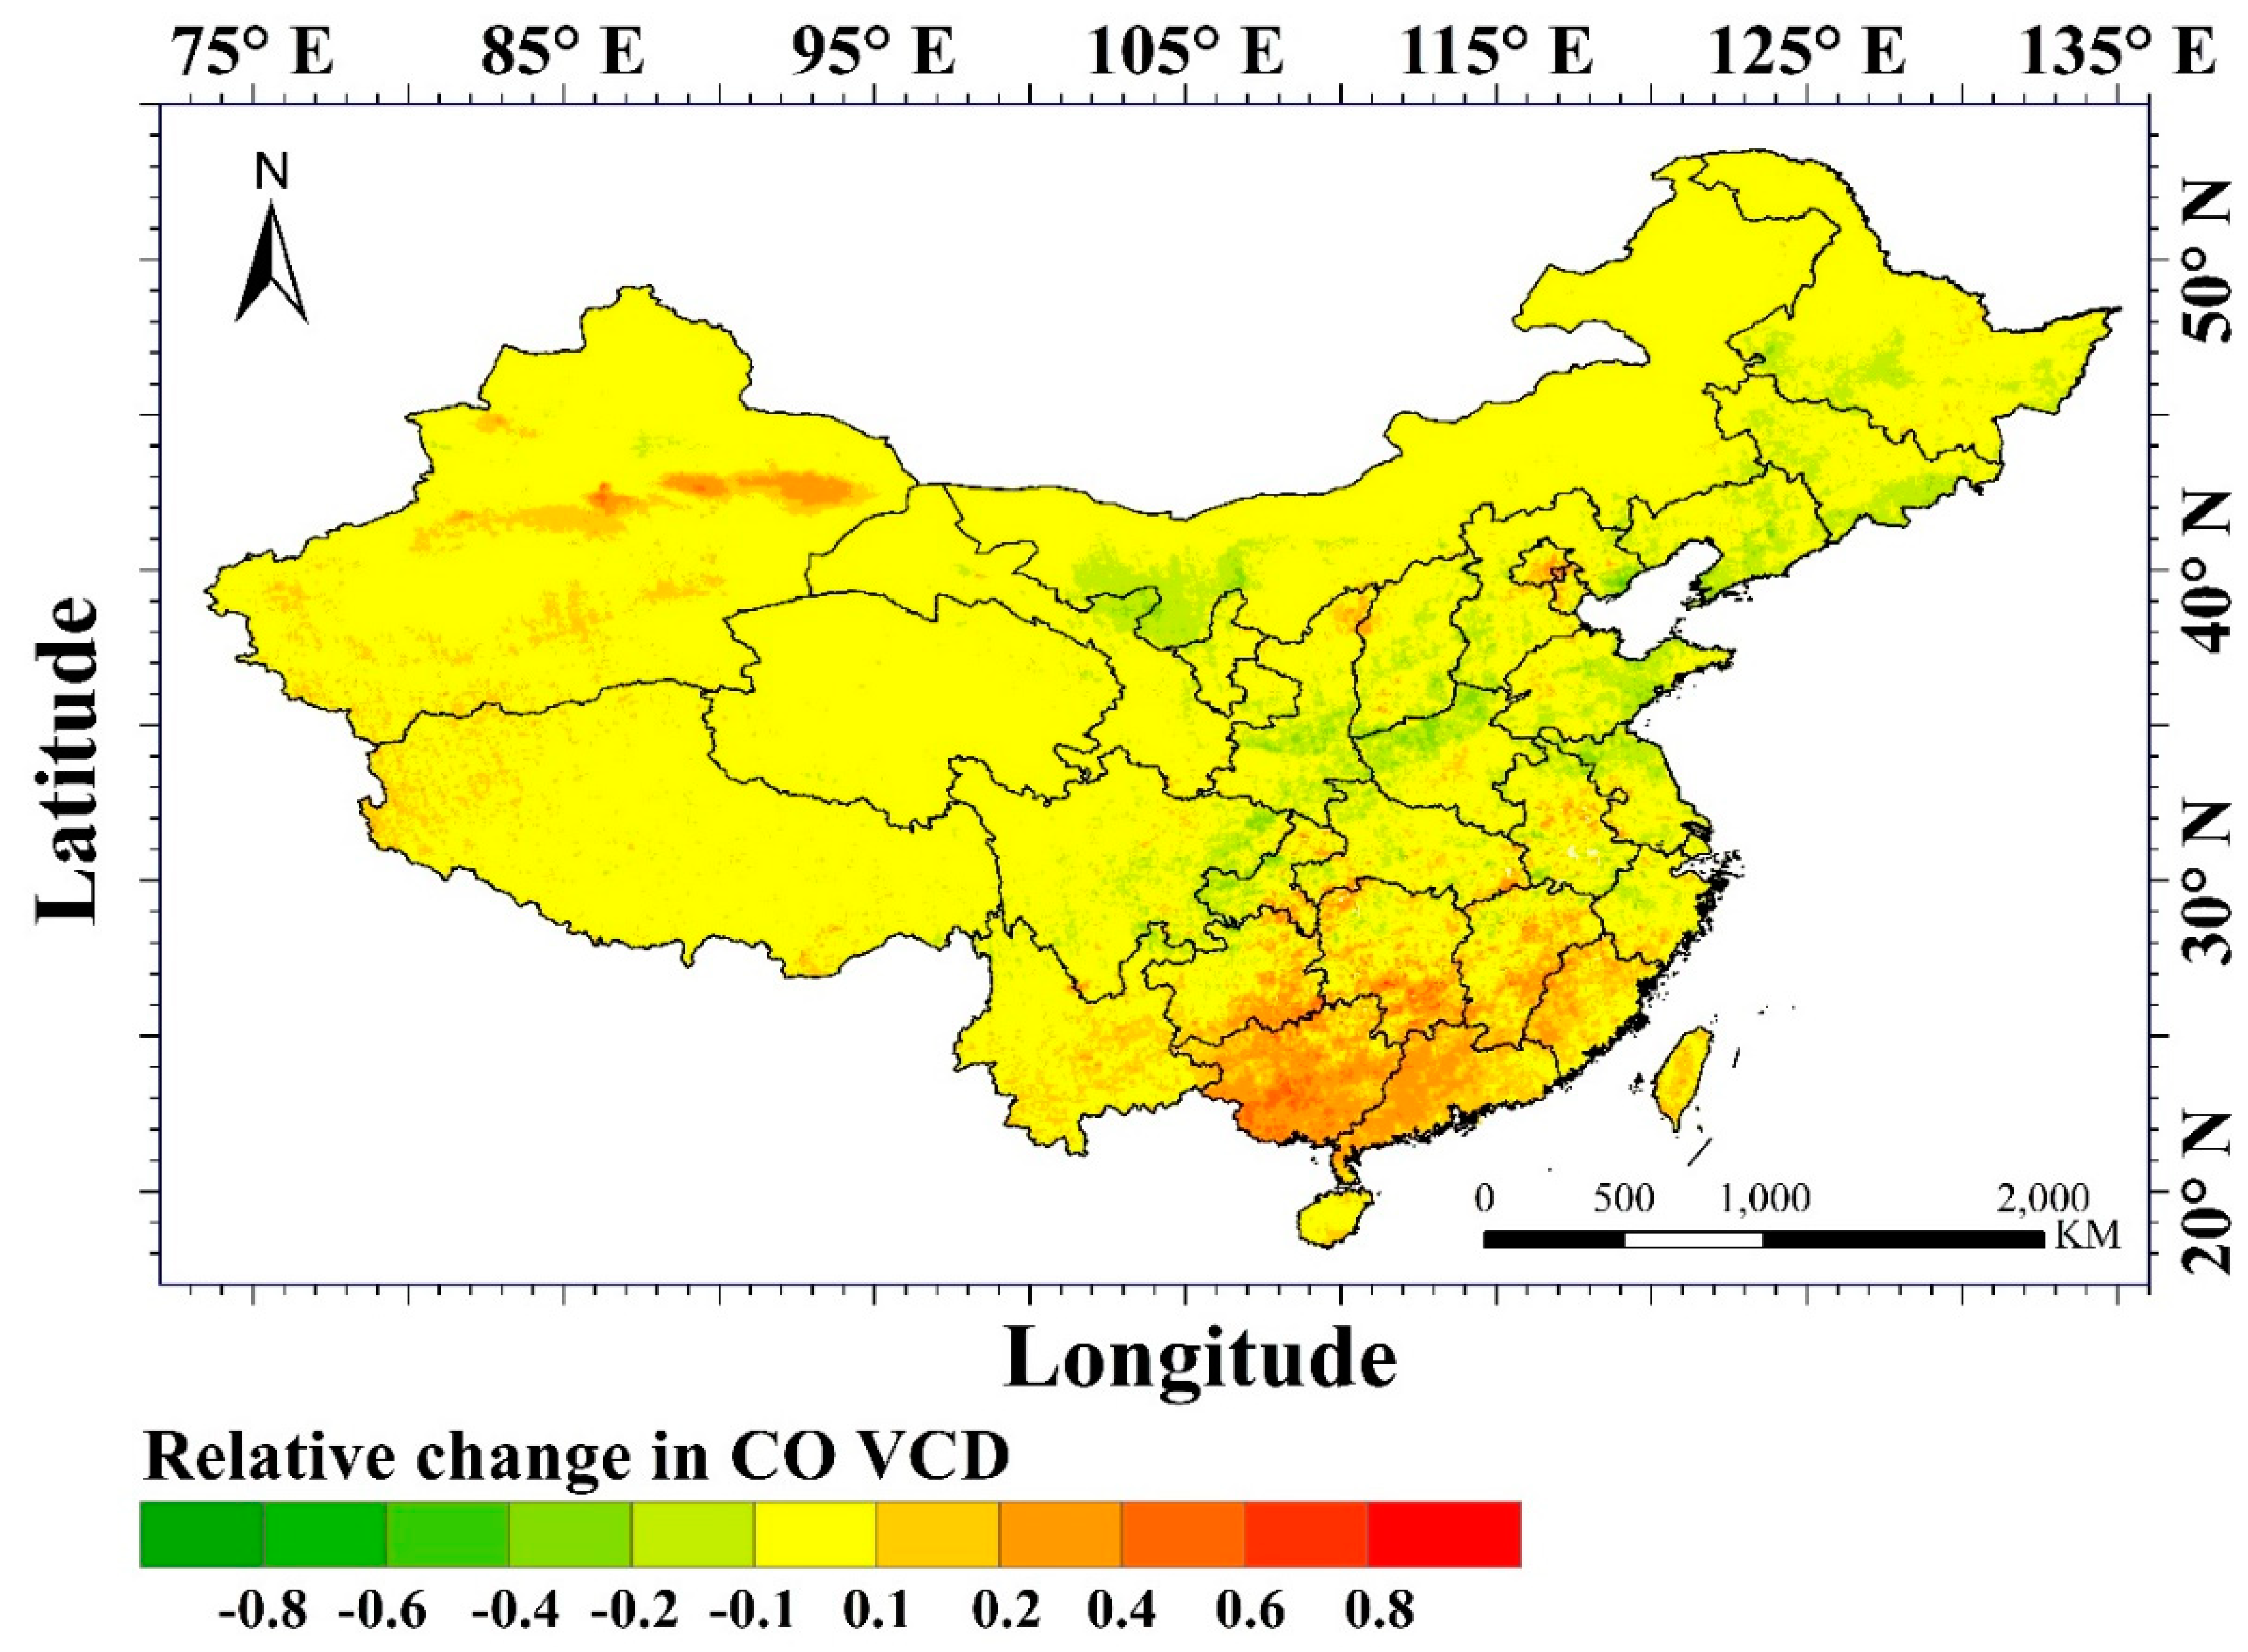
4.1.2. SO2 and CO
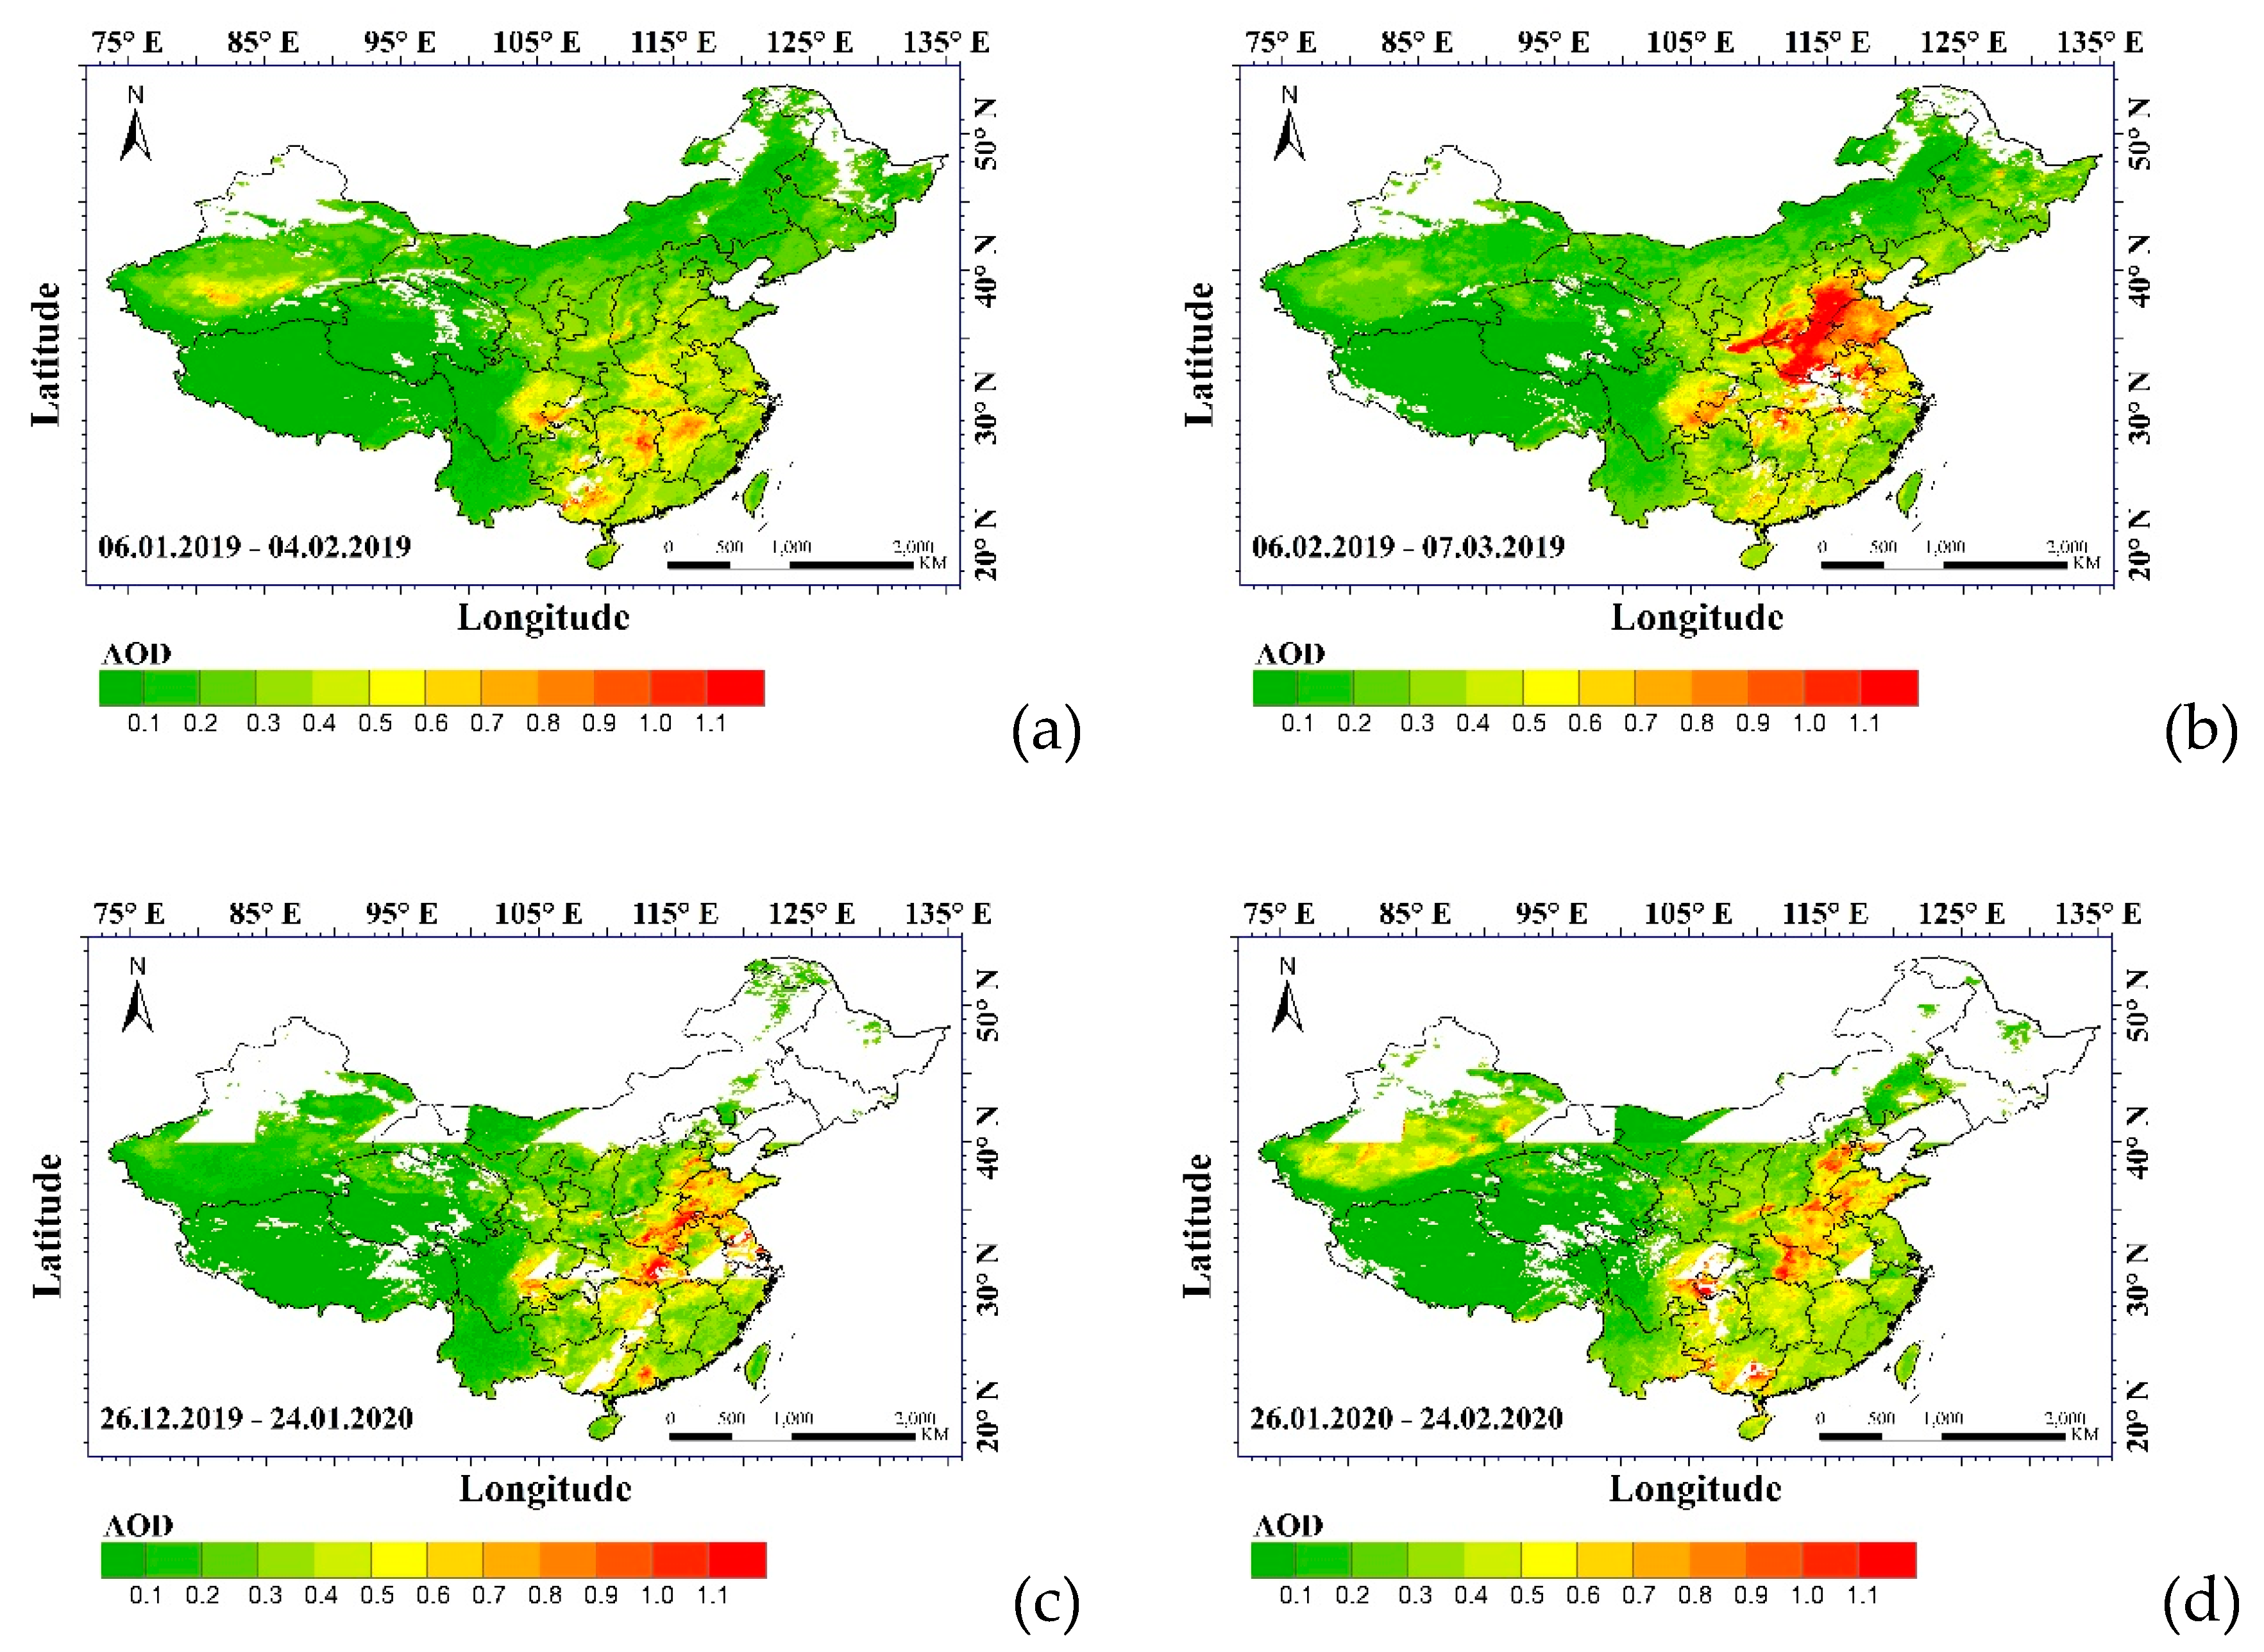
4.1.3. AOD
4.2. Ground-Based Observations
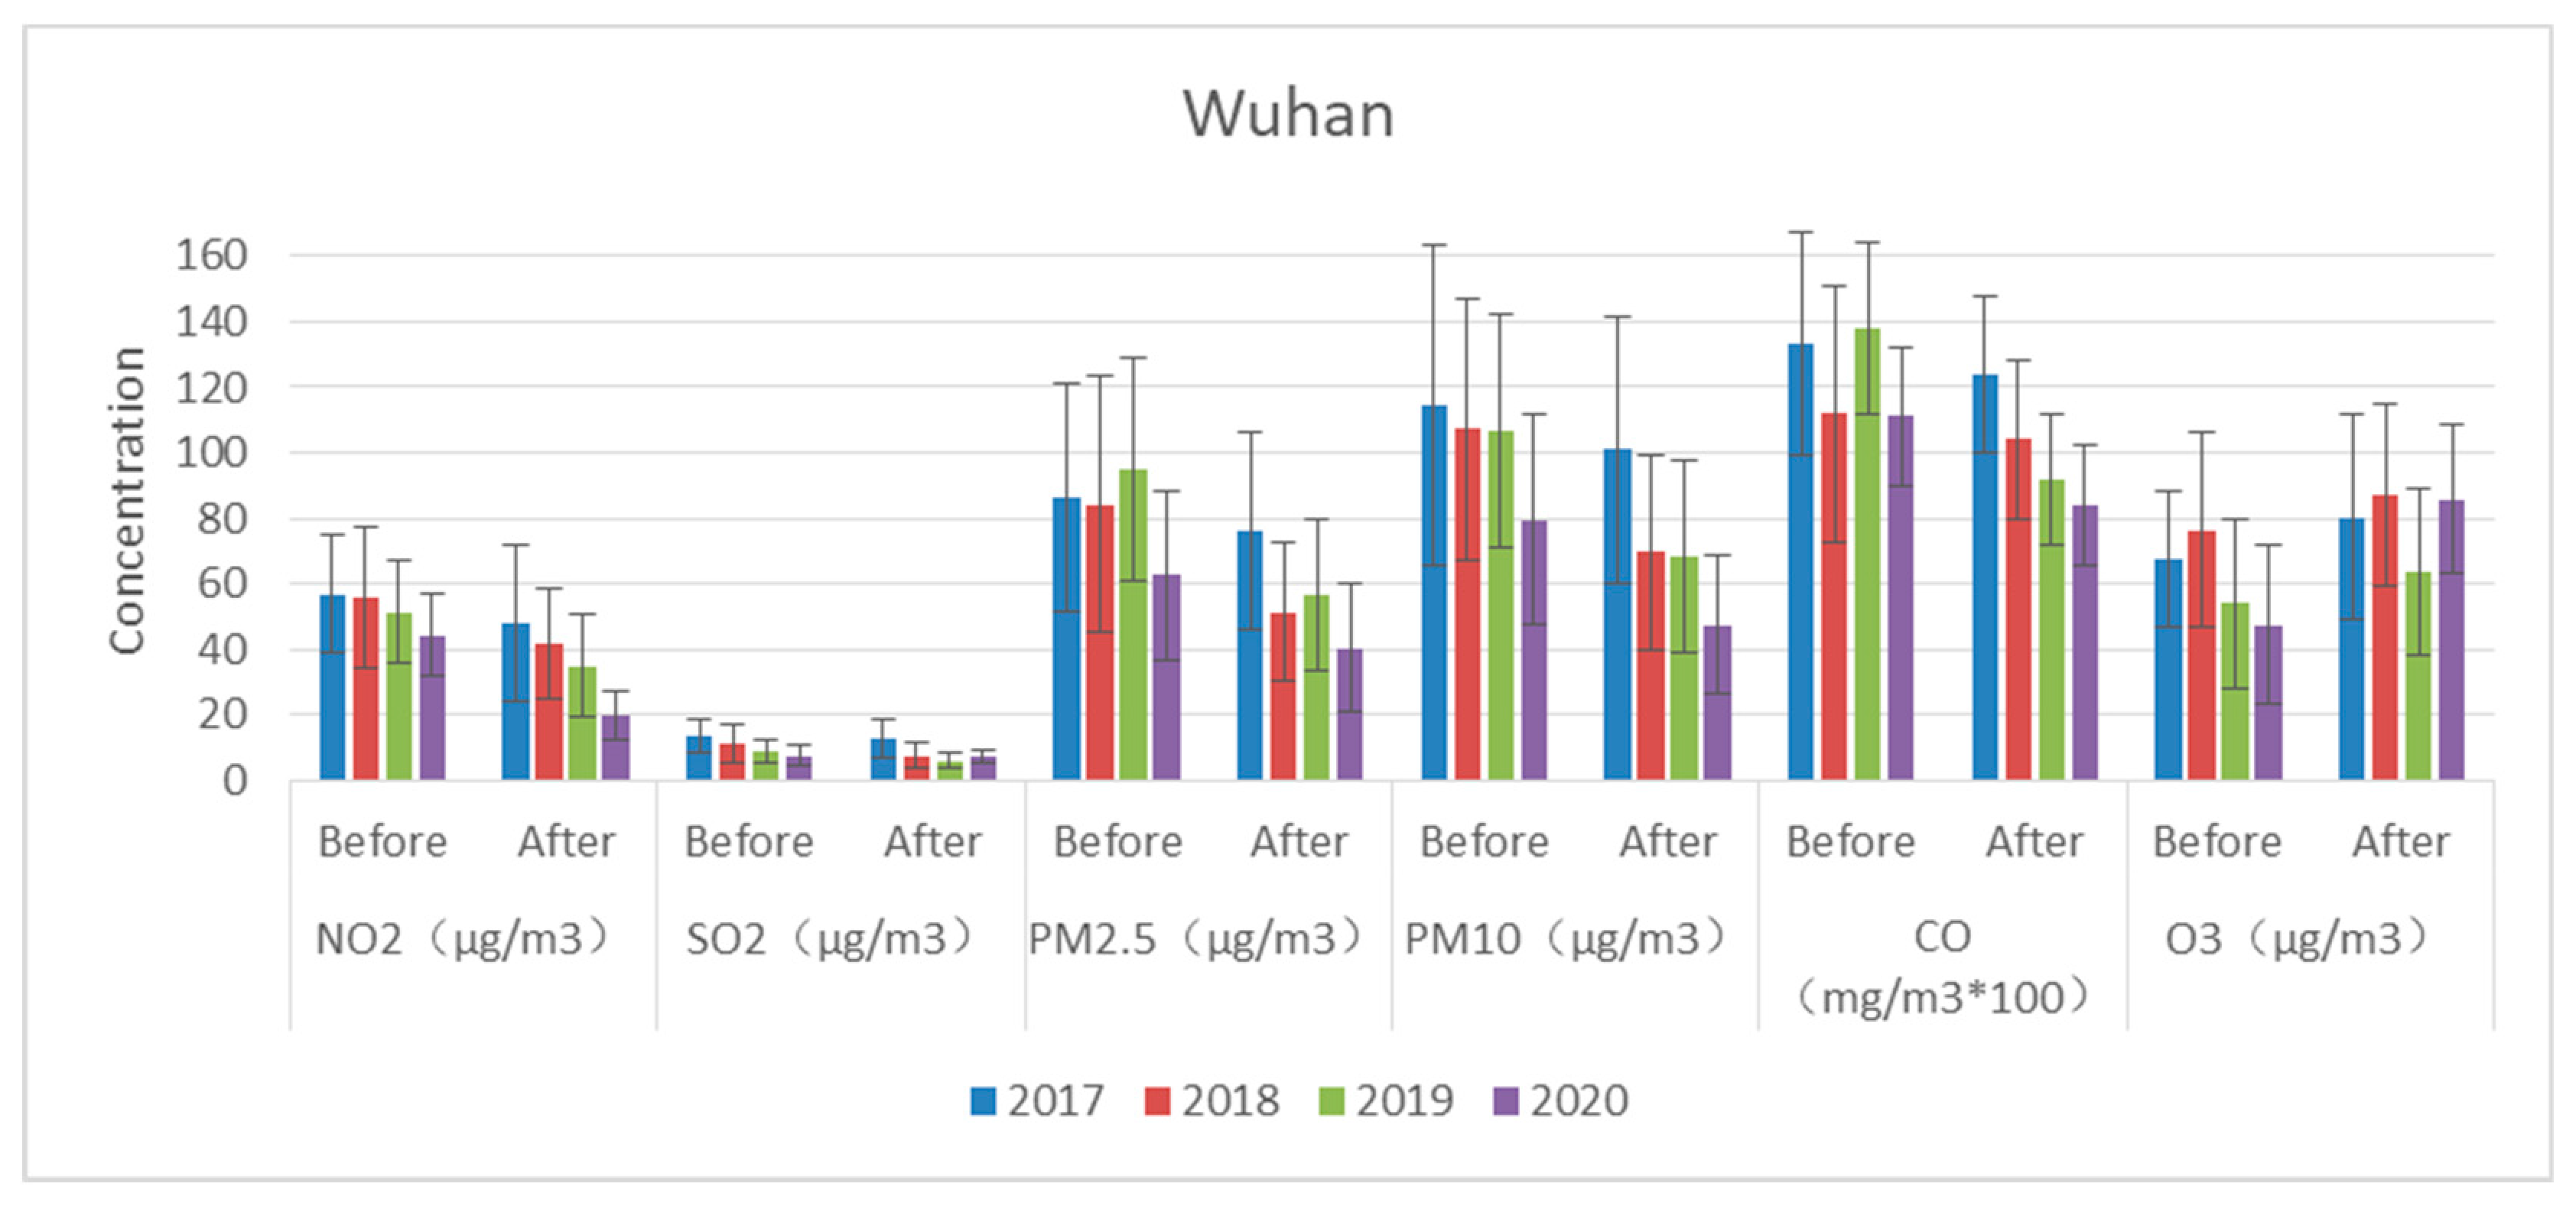
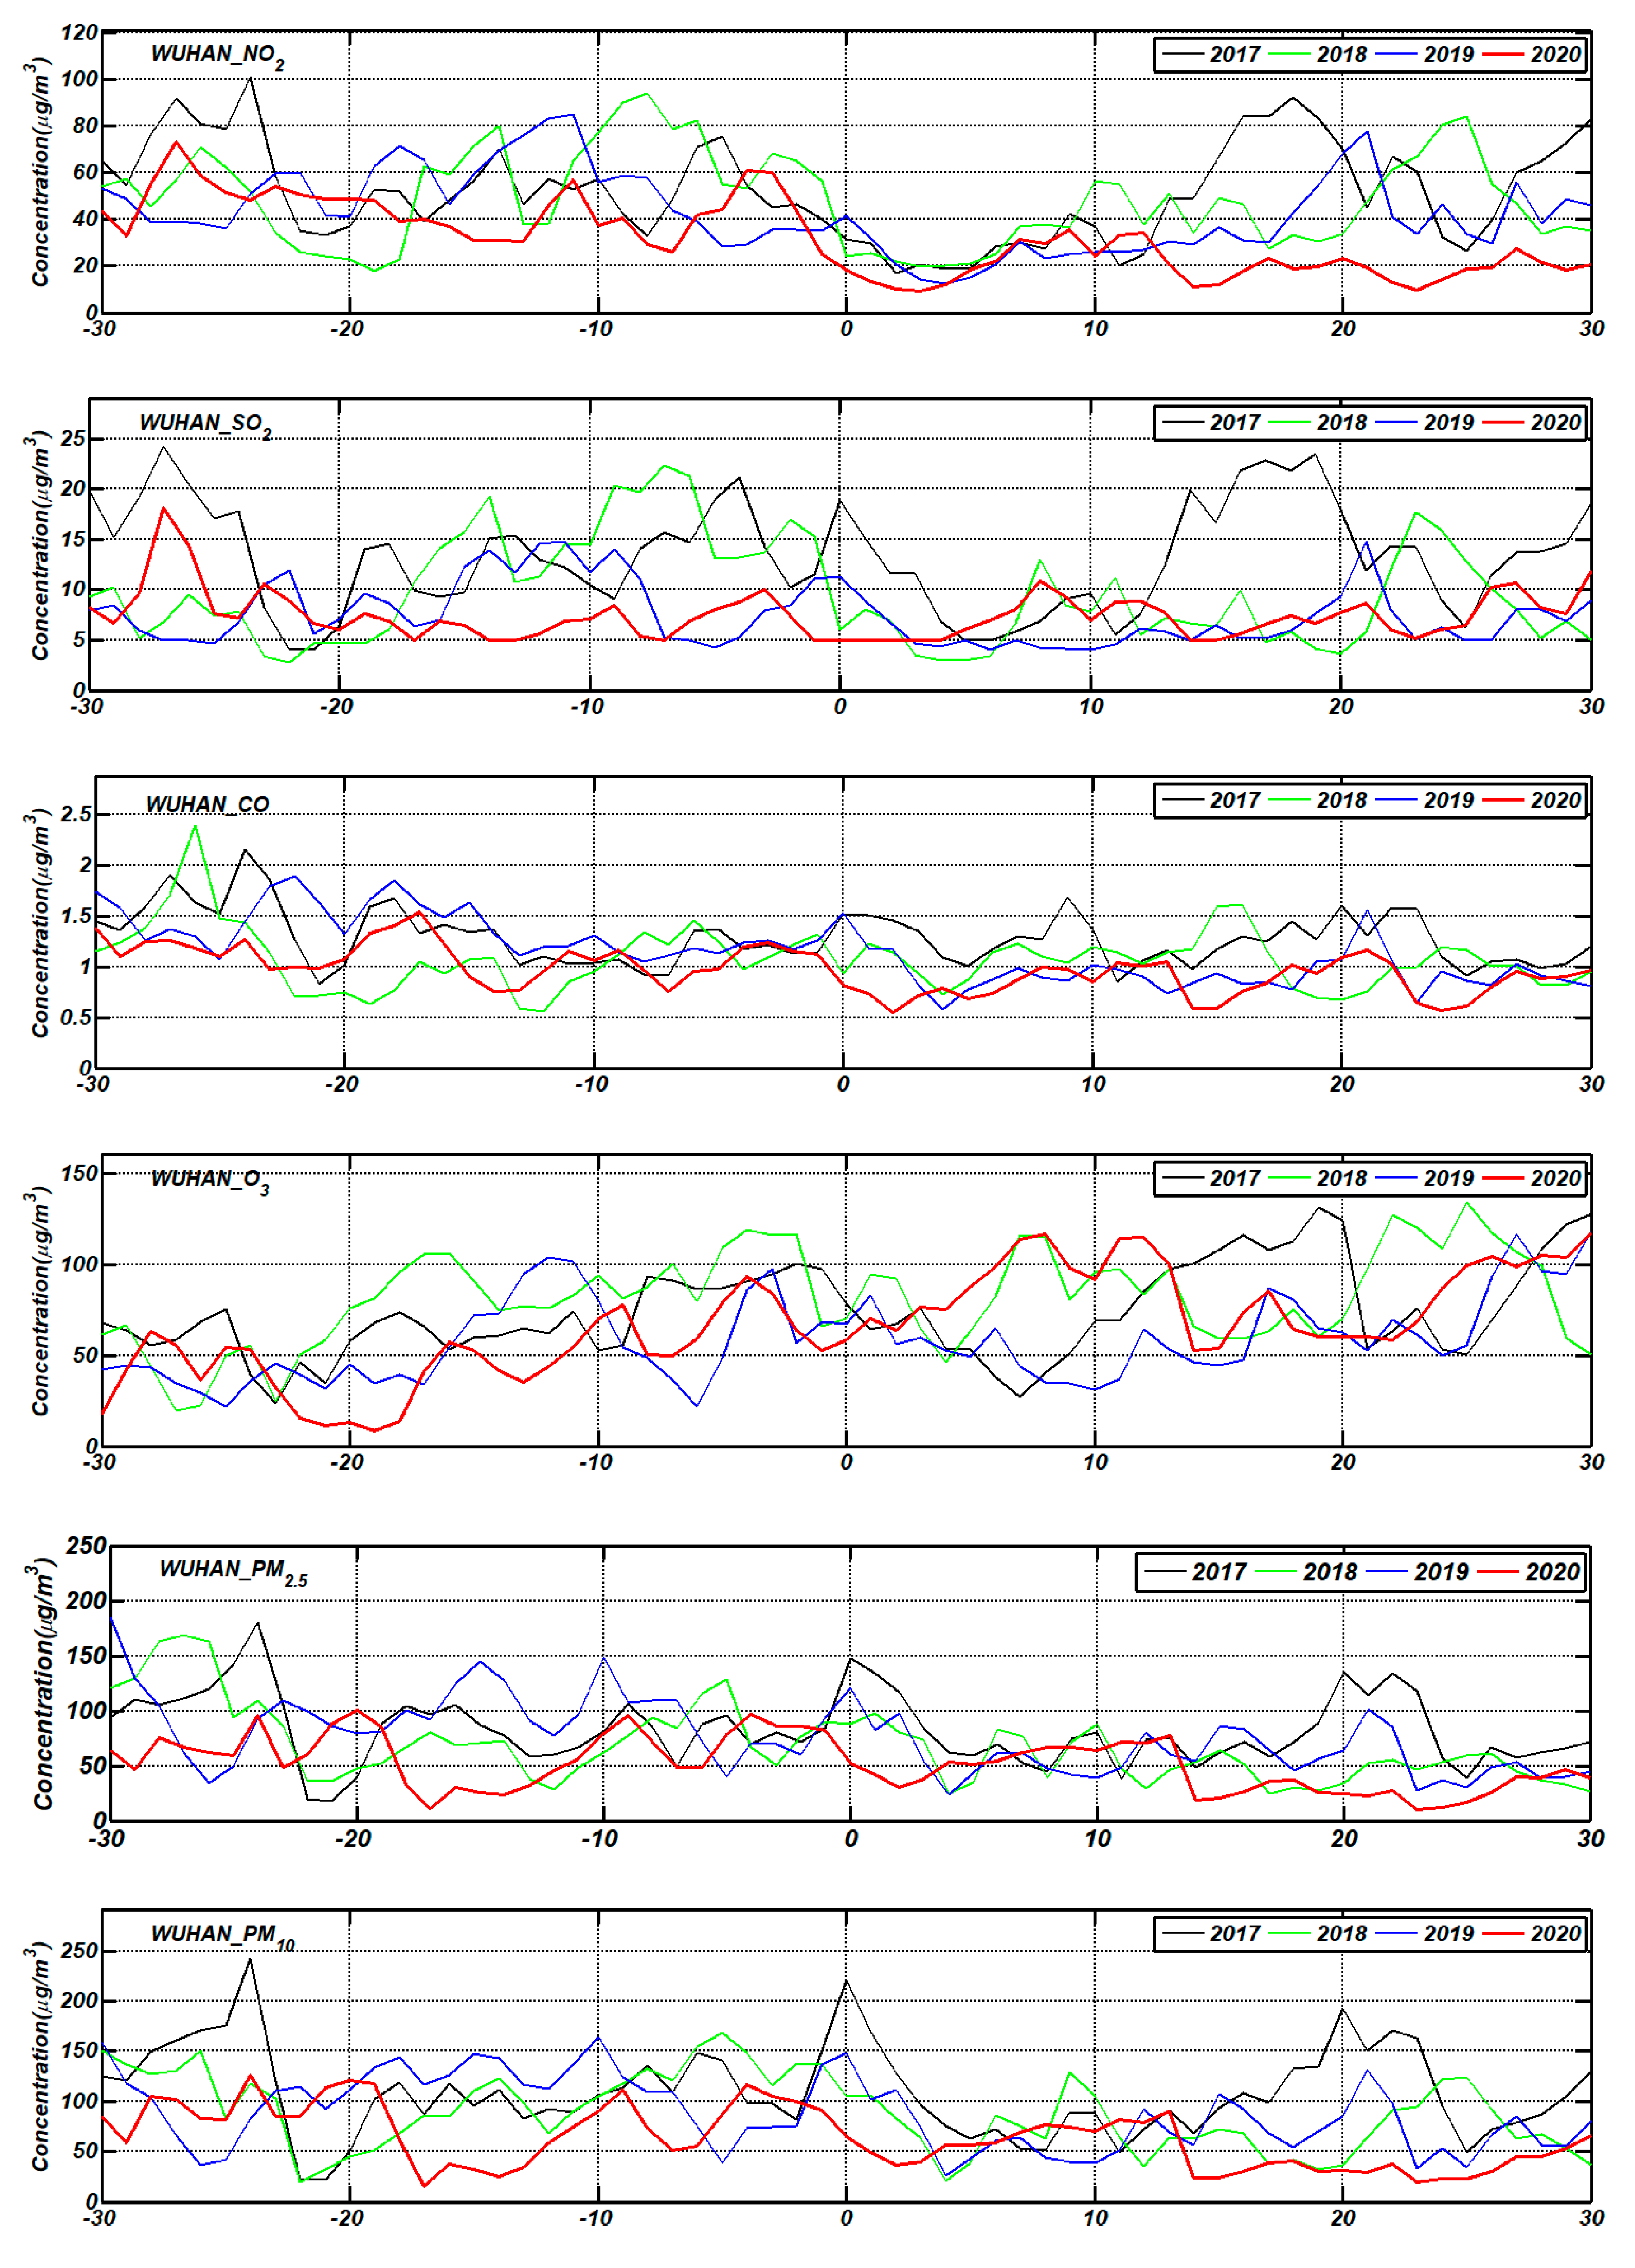
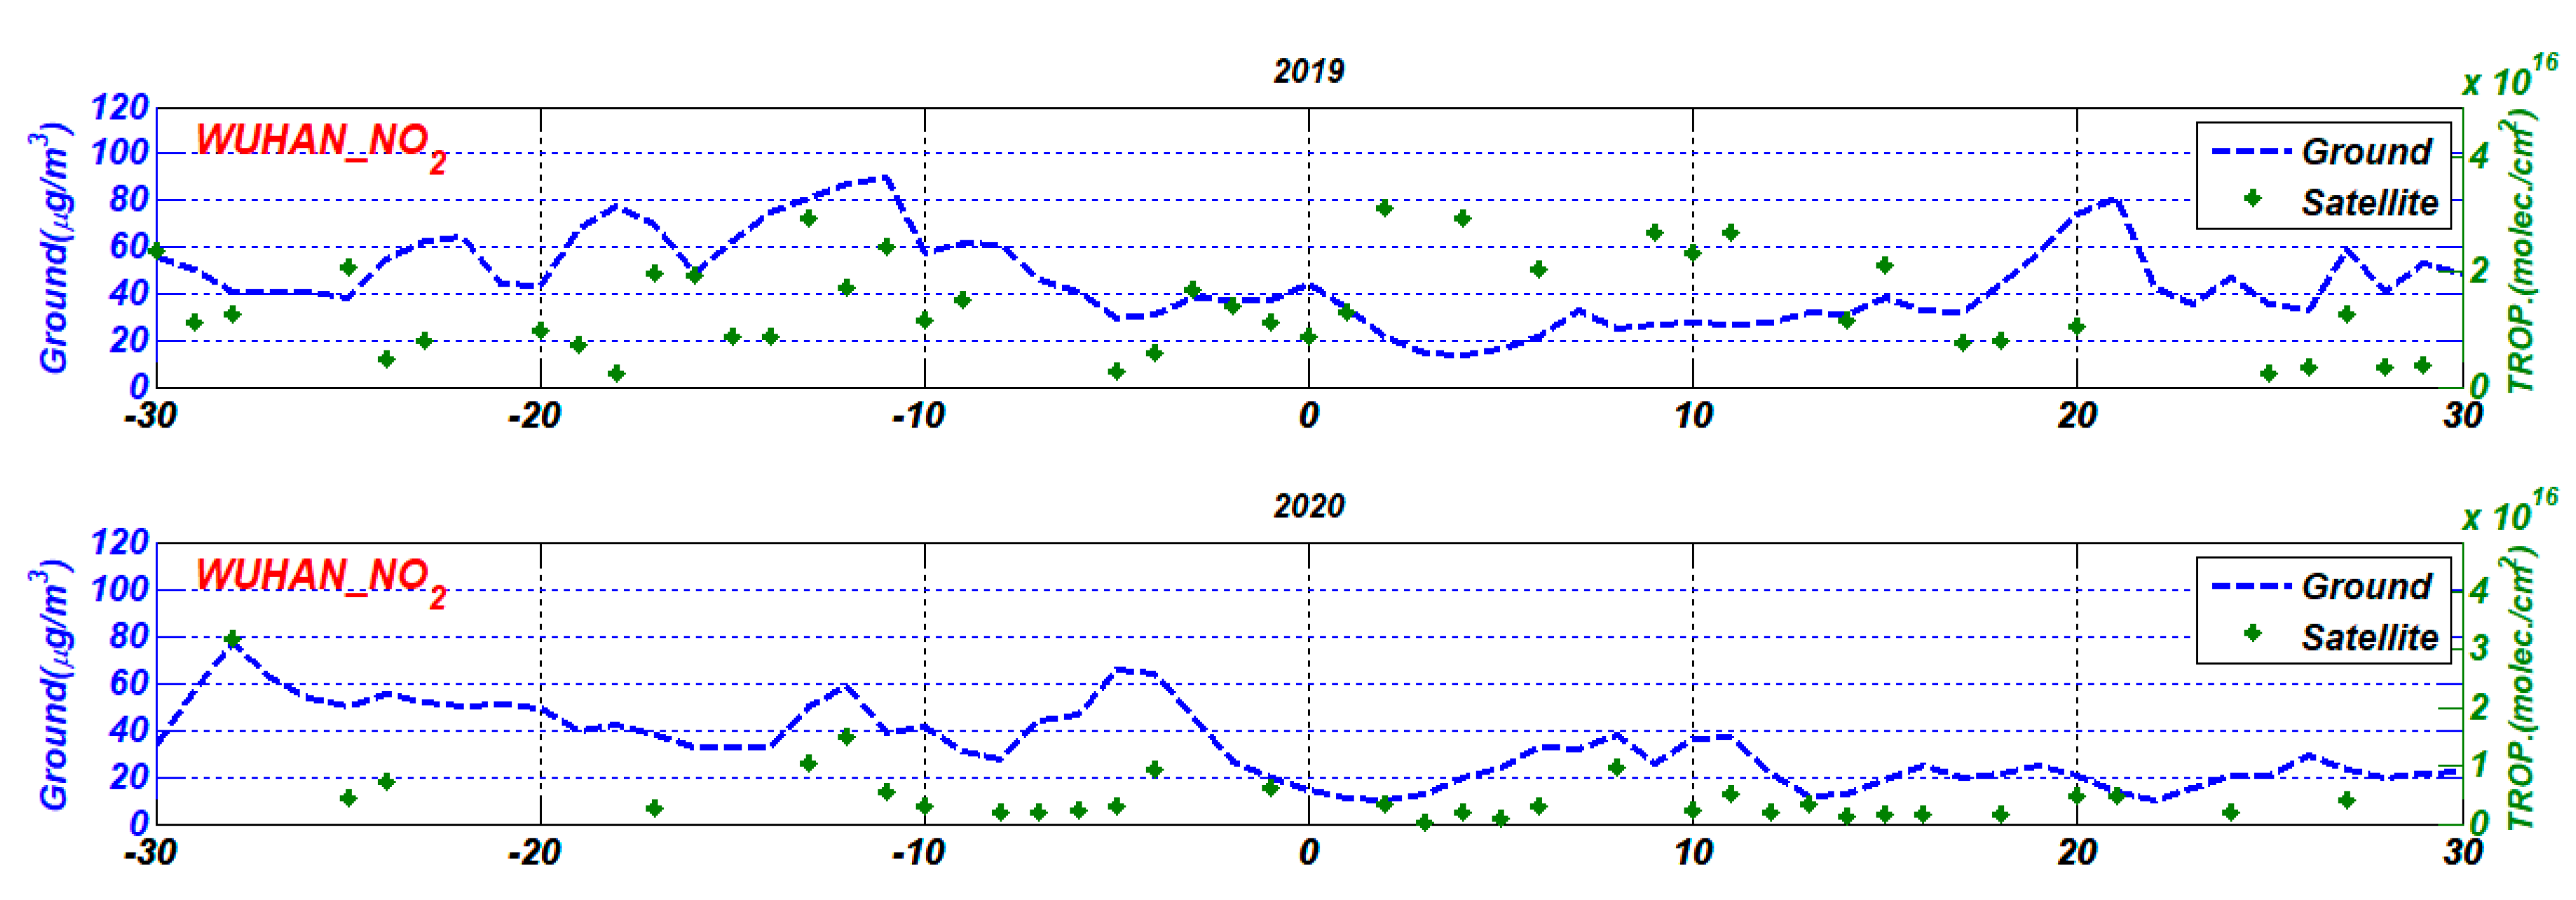
4.2.1. Wuhan
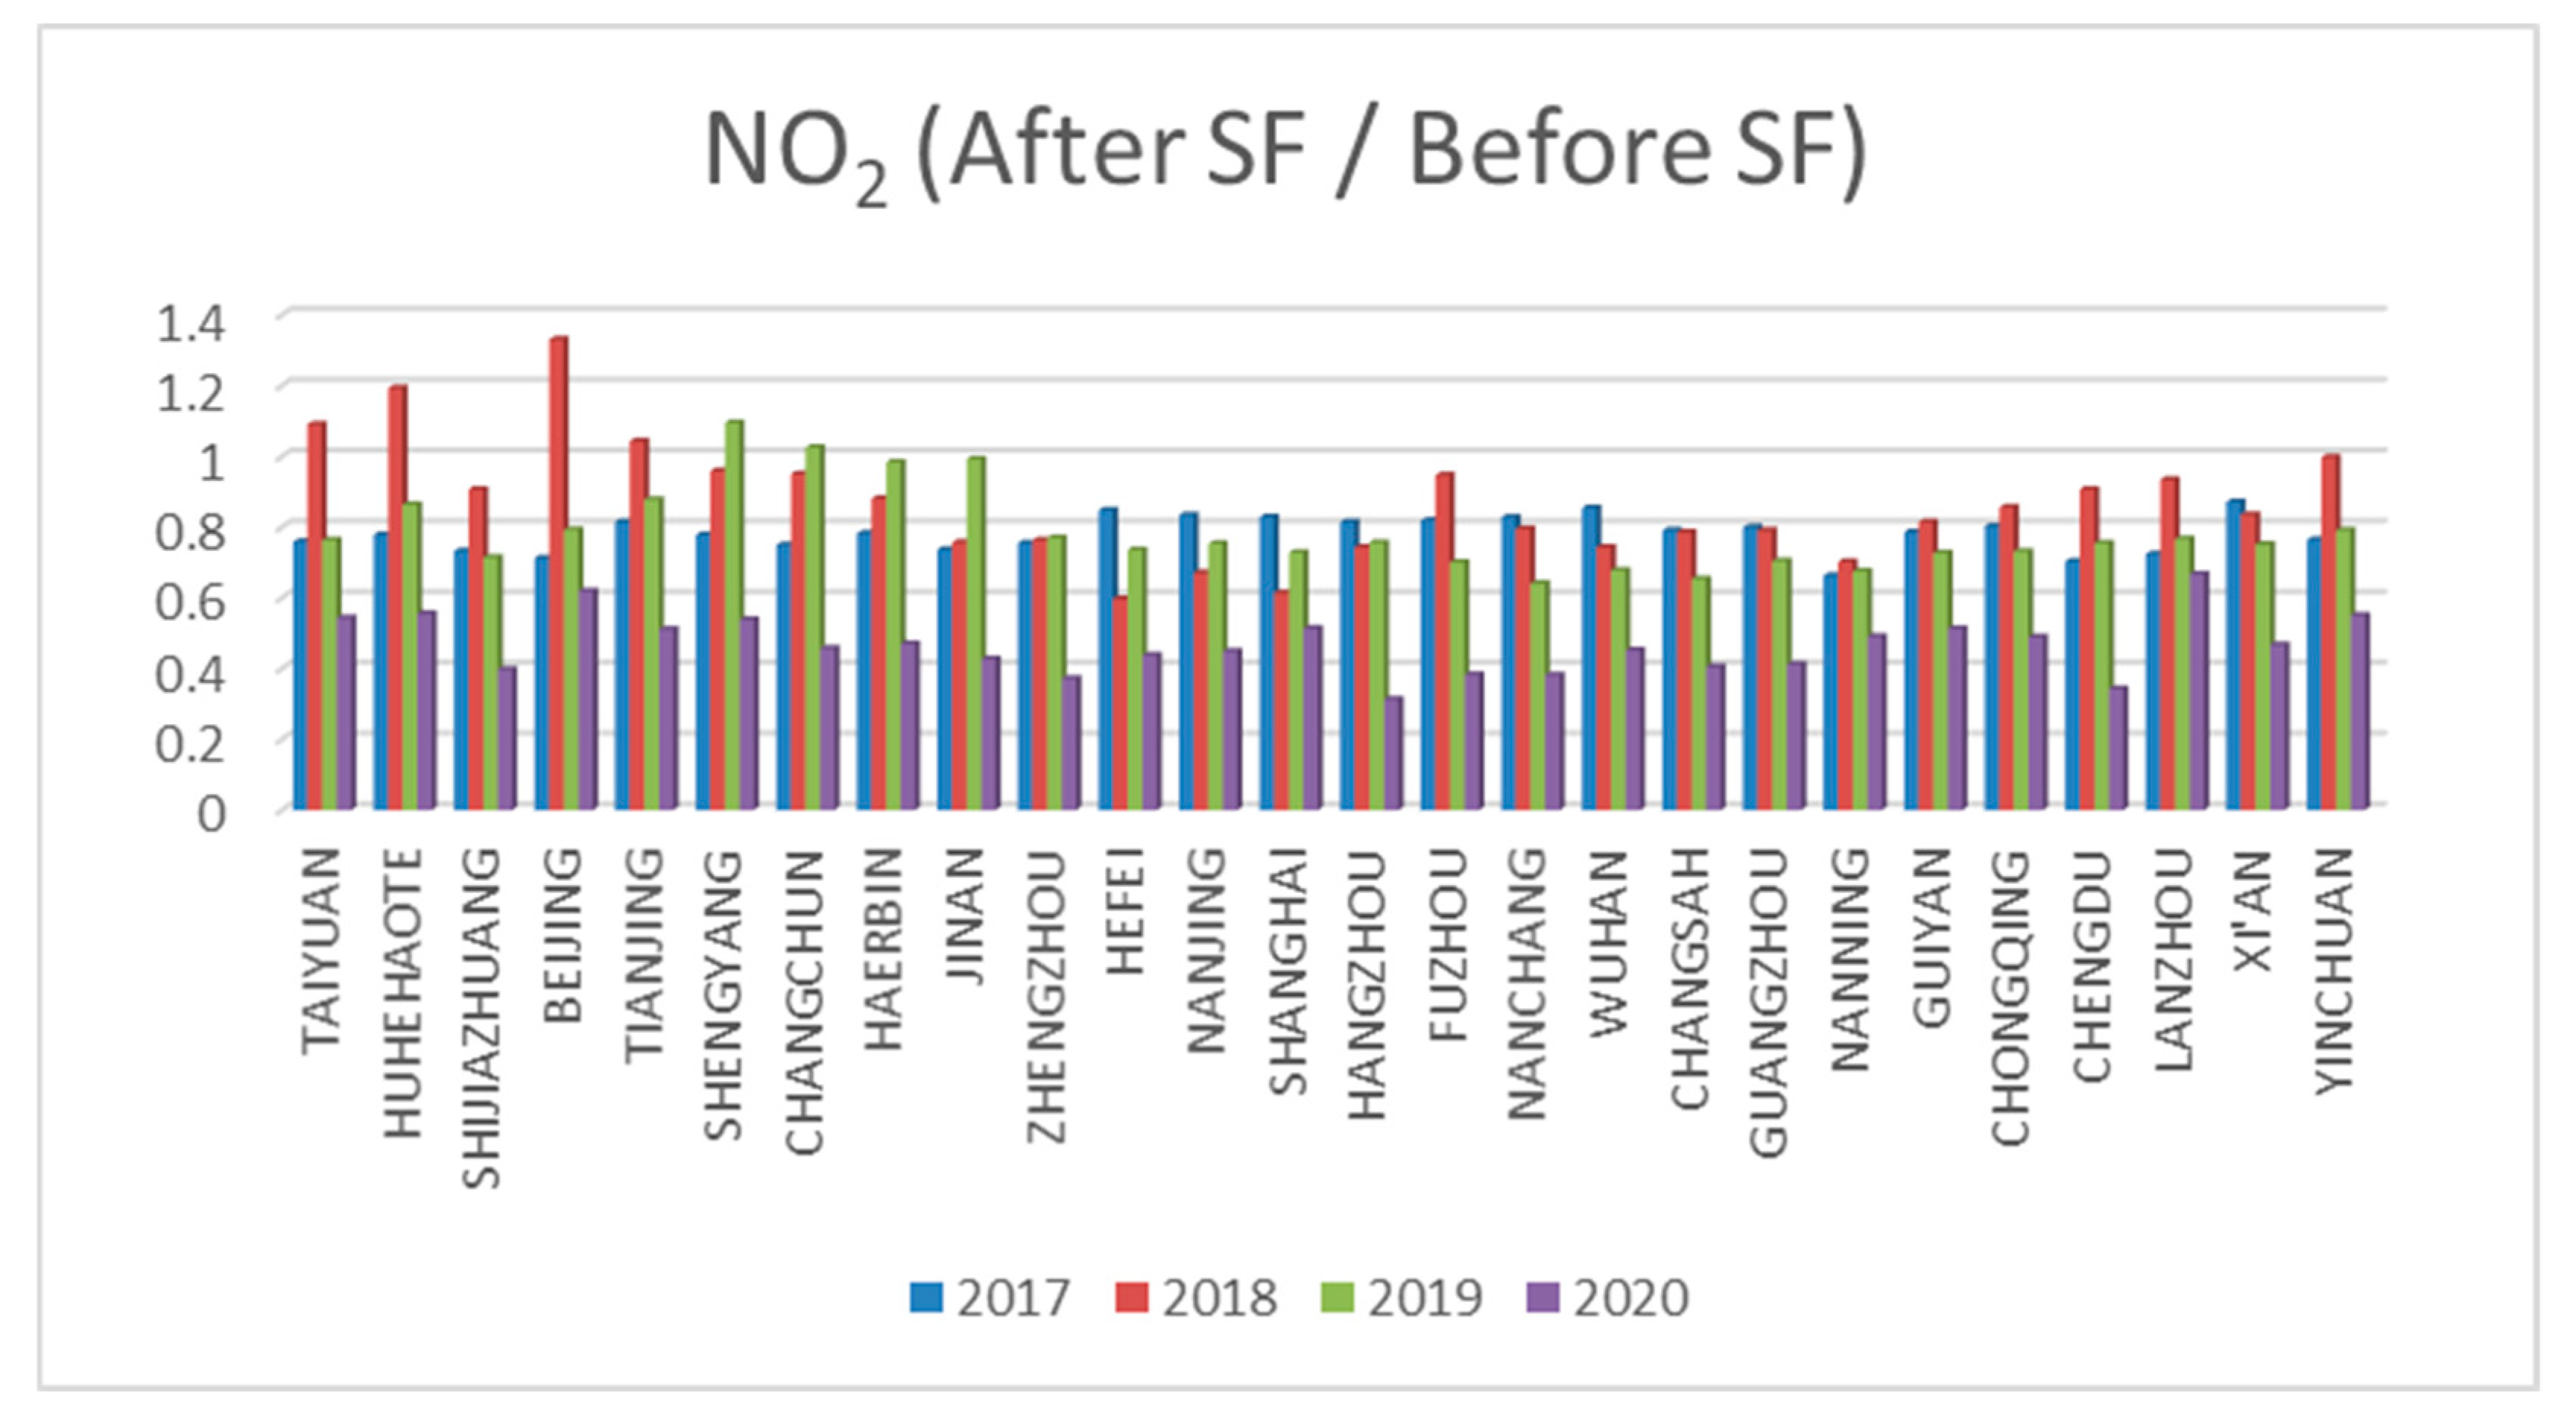
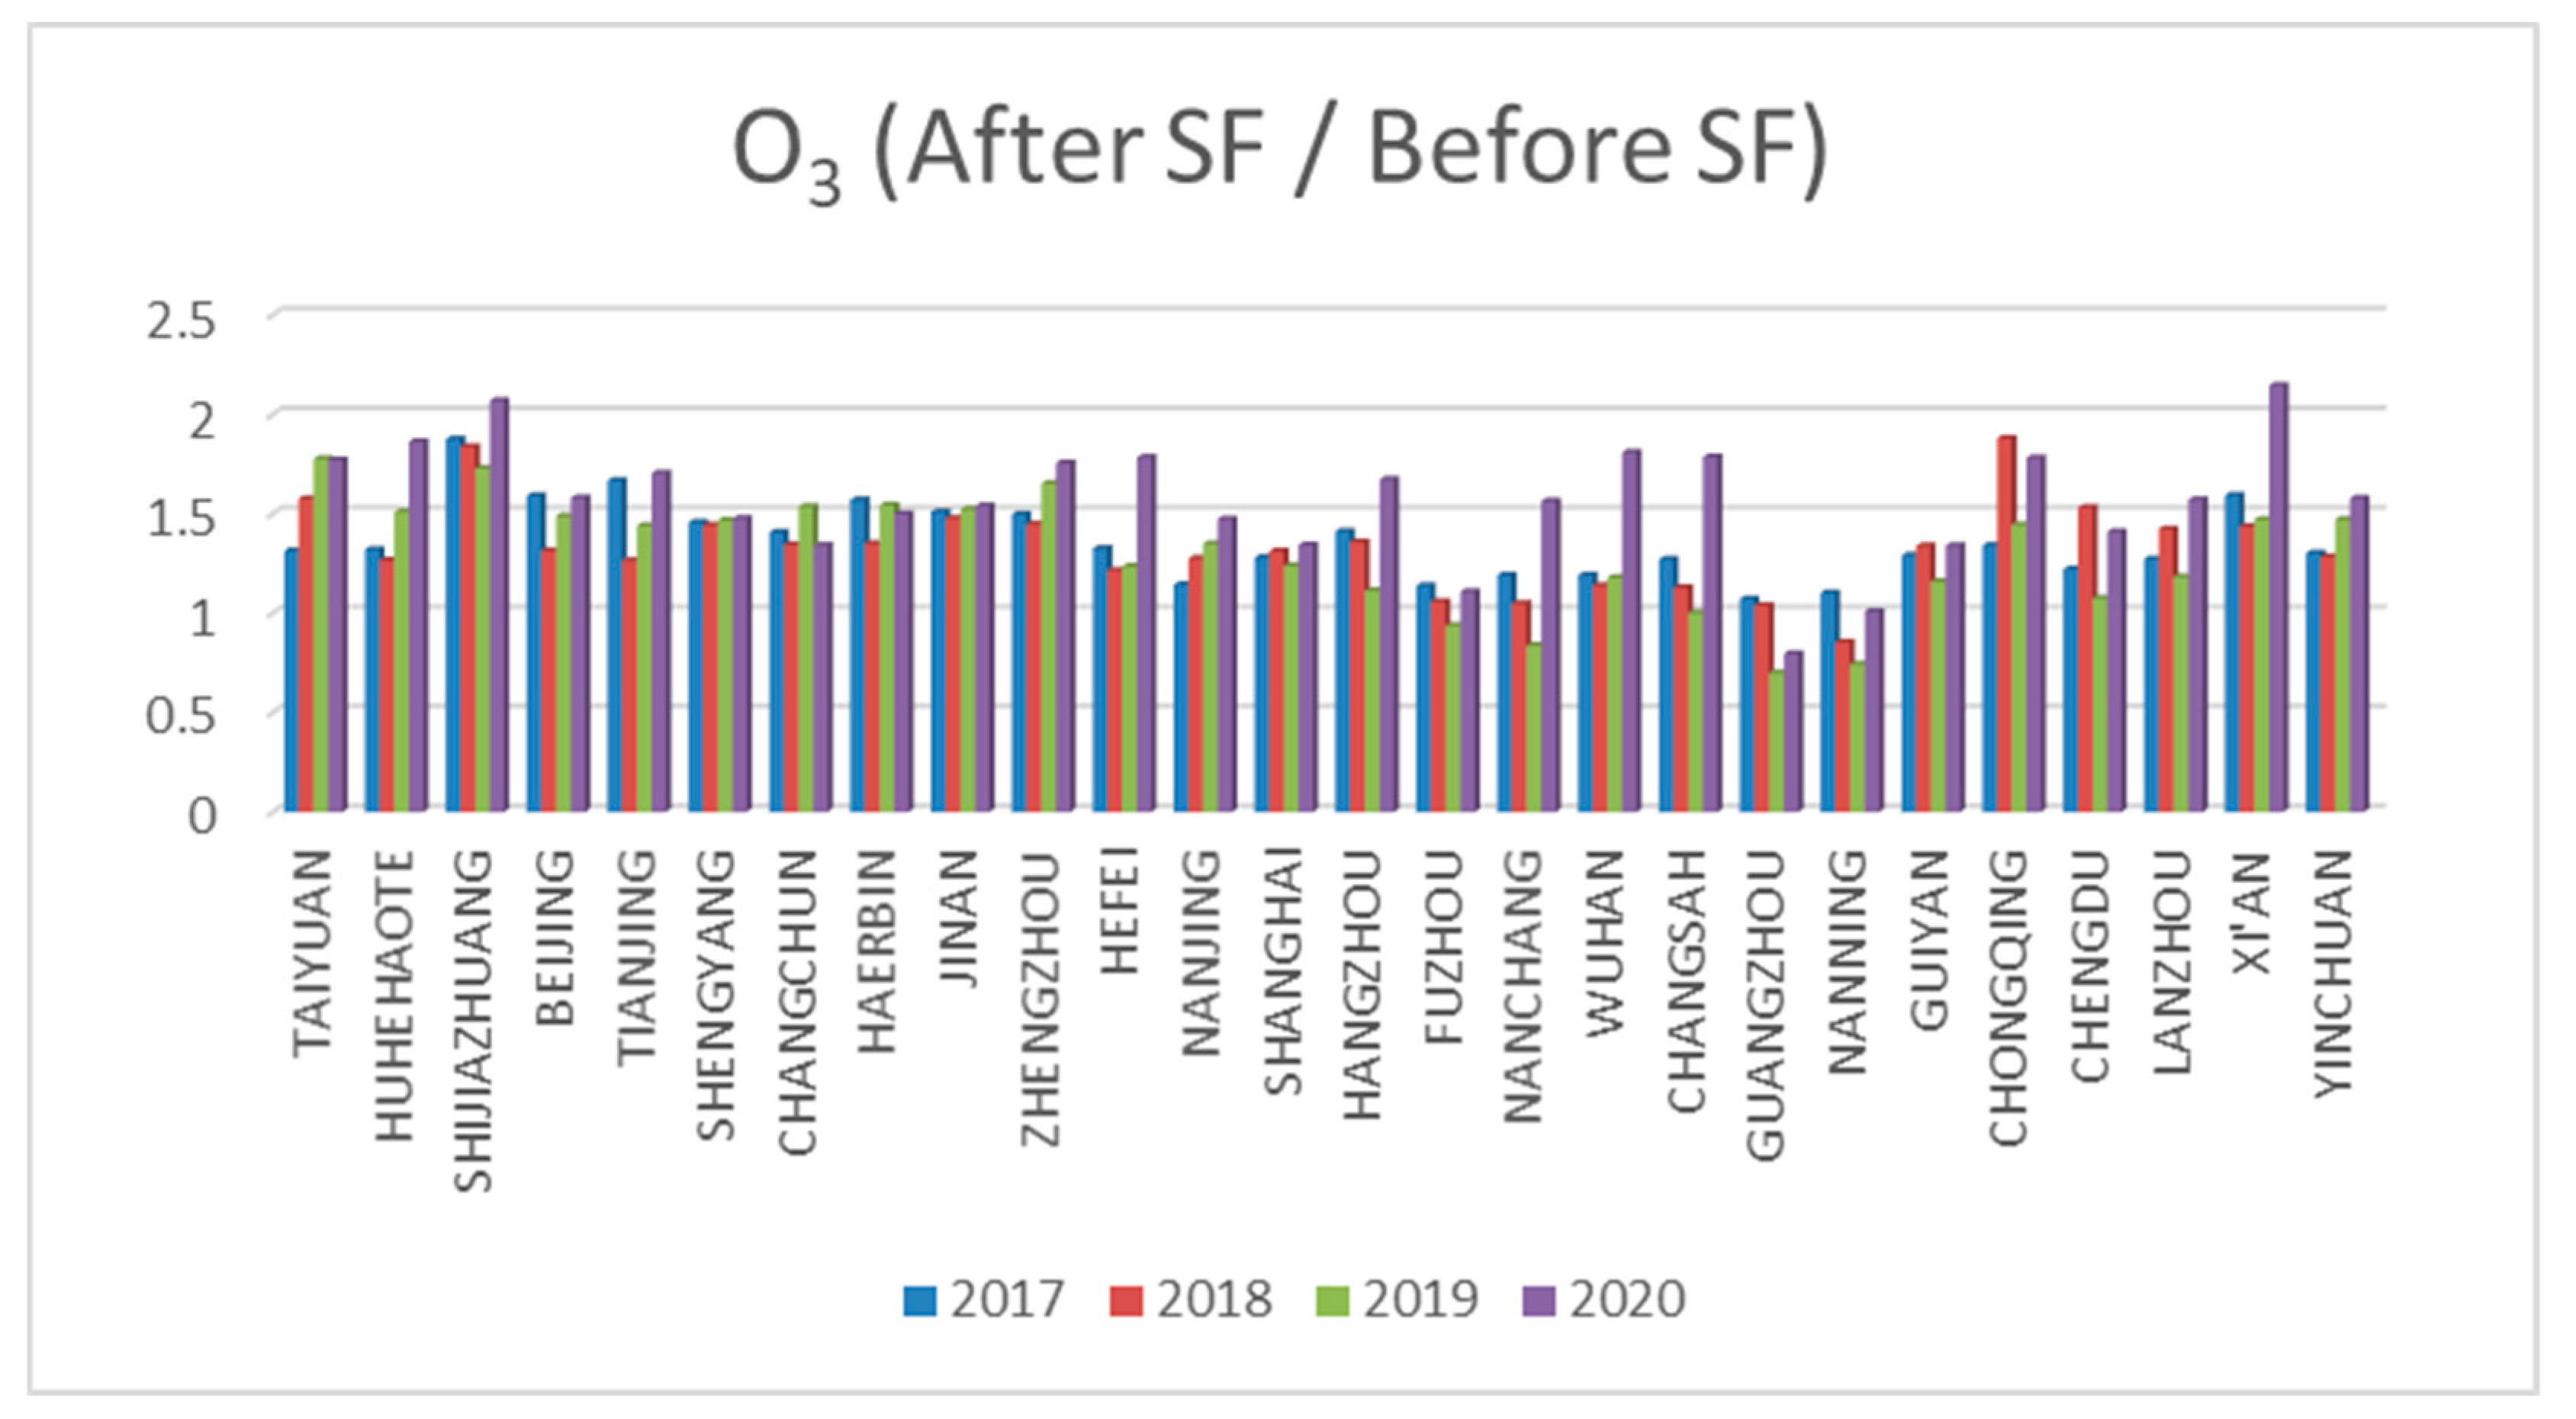
4.2.2. Comparison between Different Cities
5. Discussion
6. Conclusions
Supplementary Materials
Author Contributions
Funding
Acknowledgments
Conflicts of Interest
References
- China’s per Capita GDP Makes a Breakthrough. Available online: https://www.shine.cn/biz/economy/2001170057/ (accessed on 17 January 2020).
- van der, A.R.; Mijling, B.; Ding, J.; Koukouli, M.; Liu, F.; Li, Q.; Mao, H.; Theys, N. Cleaning up the air: Effectiveness of air quality policy for SO2 and NOx emissions in China. Atmos. Chem. Phys. 2017, 17, 1775–1789. [Google Scholar] [CrossRef] [Green Version]
- Sogacheva, L.; Rodriguez, E.; Kolmonen, P.; Virtanen, T.; Saponaro, G.; de Leeuw, G.; Georgoulias, A.; Alexandri, G.; Kourtidis, K.; van der, A.R. Spatial and seasonal variations of aerosols over China from two decades of multi-satellite observations—Part 2: AOD time series for 1995–2017 combined from ATSR ADV and MODIS C6.1 and AOD tendency estimations. Atmos. Chem. Phys. 2018, 18, 16631–16652. [Google Scholar] [CrossRef] [Green Version]
- de Leeuw, G.; Sogacheva, L.; Rodriguez, E.; Kourtidis, K.; Georgoulias, A.; Alexandri, G.; Amiridis, V.; Proestakis, E.; Marinou, E.; Xue, Y.; et al. Two decades of satellite observations of AOD over mainland China using ATSR-2, AATSR and MODIS/Terra: Data set evaluation and large-scale patterns. Atmos. Chem. Phys. 2018, 18, 1573–1592. [Google Scholar] [CrossRef] [Green Version]
- Sogacheva, L.; de Leeuw, G.; Rodriguez, E.; Kolmonen, P.; Georgoulias, A.; Alexandri, G.; Kourtidis, K.; Proestakis, E.; Marinou, E.; Amiridis, V.; et al. Spatial and seasonal variations of aerosols over China from two decades of multi-satellite observations—Part 1: ATSR (1995–2011) and MODIS C6.1 (2000–2017). Atmos. Chem. Phys. 2018, 18, 11389–11407. [Google Scholar] [CrossRef] [Green Version]
- Fontes, T.; Li, P.; Barros, N.; Zhao, P. Trends of PM2.5 concentrations in China: A long term approach. J. Environ. Manag. 2017, 196, 719–732. [Google Scholar] [CrossRef]
- Zhai, S.; Jacob, D.; Wang, X.; Shen, L.; Ke, L.; Zhang, Y.; Gui, K.; Zhao, T.; Liao, H. Fine particulate matter (PM2.5) trends in China, 2013–2018: Separating contributions from anthropogenic emissions and meteorology. Atmos. Chem. Phys. 2019, 19, 11031–11041. [Google Scholar] [CrossRef] [Green Version]
- Silver, B.; Reddington, C.; Arnold, S.; Spracklen, D. Substantial changes in air pollution across China during 2015 to 2017. Environ. Res. Lett. 2018, 13. [Google Scholar] [CrossRef]
- Guo, H.; Gu, X.; Ma, G.; Shi, S.; Wang, W.; Zuo, X.; Zhang, X. Spatial and temporal variations of air quality and six air pollutants in China during 2015–2017. Sci. Rep. 2019, 9, 15201. [Google Scholar] [CrossRef] [Green Version]
- Okuda, T.; Matsuura, S.; Yamaguchi, D.; Umemura, T.; Hanada, E.; Orihara, H.; Tanaka, S.; He, K.; Ma, Y.; Cheng, Y.; et al. The impact of the pollution control measures for the 2008 Beijing Olympic Games on the chemical composition of aerosols. Atmos. Environ. 2011, 45, 2789–2794. [Google Scholar] [CrossRef]
- Xu, H.M.; Tao, J.; Ho, S.S.H.; Ho, K.F.; Cao, J.J.; Li, N.; Chow, J.C.; Wang, G.H.; Han, Y.M.; Zhang, R.J.; et al. Characteristics of fine particulate non-polar organic compounds in Guangzhou during the 16th Asian Games: Effectiveness of air pollution controls. Atmos. Environ. 2013, 76, 94–101. [Google Scholar] [CrossRef]
- Ding, J.; van der A., R.; Mijling, B.; Levelt, P.; Hao, N. NOx emission estimates during the 2014 Youth Olympic Games in Nanjing. Atmos. Chem. Phys. Discuss. 2015, 15, 6337–6372. [Google Scholar] [CrossRef] [Green Version]
- Chen, C.; Sun, Y.L.; Xu, W.Q.; Du, W.; Zhou, L.B.; Han, T.T.; Wang, Q.Q.; Fu, P.Q.; Wang, Z.F.; Gao, Z.Q.; et al. Characteristics and sources of submicron aerosols above the urban canopy (260 m) in Beijing, China, during the 2014 APEC summit. Atmos. Chem. Phys. 2015, 15, 12879–12895. [Google Scholar] [CrossRef] [Green Version]
- Zhao, J.; Du, W.; Zhang, Y.J.; Wang, Q.Q.; Chen, C.; Xu, W.Q.; Han, T.T.; Wang, Y.Y.; Fu, P.Q.; Wang, Z.F.; et al. Insights into aerosol chemistry during the 2015 China Victory Day parade: Results from simultaneous measurements at ground level and 260 m in Beijing. Atmos. Chem. Phys. 2017, 17, 3215–3232. [Google Scholar] [CrossRef] [Green Version]
- Wang, C.; Huang, X.-F.; Zhu, Q.; Cao, L.-M.; Zhang, B.; He, L.-Y. Differentiating local and regional sources of Chinese urban air pollution based on the effect of the Spring Festival. Atmos. Chem. Phys. 2017, 17, 9103–9114. [Google Scholar] [CrossRef] [Green Version]
- Yao, L.; Wang, D.F.; Fu, Q.Y.; Qiao, L.P.; Wang, H.L.; Li, L.; Sun, W.W.; Li, Q.; Wang, L.; Yang, X.; et al. The effects of firework regulation on air quality and public health during the Chinese Spring Festival from 2013 to 2017 in a Chinese megacity. Environ. Int. 2019, 126, 96–106. [Google Scholar] [CrossRef]
- Feng, J.L.; Yu, H.; Su, X.F.; Liu, S.H.; Li, Y.; Pan, Y.P.; Sun, J.H. Chemical composition and source apportionment of PM2.5 during Chinese Spring Festival at Xinxiang, a heavily polluted city in North China: Fireworks and health risks. Atmos. Res. 2016, 182, 176–188. [Google Scholar] [CrossRef]
- Tang, M.; Ji, D.; Gao, W.-K.; Yu, Z.-W.; Chen, K.; Cao, W. Characteristics of air quality in Tianjin during the Spring Festival period of 2015. Atmos. Ocean. Sci. Lett. 2016, 9, 15–21. [Google Scholar] [CrossRef]
- Simmons, G.; Reeves, J.D.; Rennekamp, A.J.; Amberg, S.M.; Piefer, A.J.; Bates, P. Characterization of severe acute respiratory syndrome-associated coronavirus (SARS-CoV) spike glycoprotein-mediated viral entry. Proc. Natl. Acad. Sci. USA 2004, 101, 4240–4245. [Google Scholar] [CrossRef] [Green Version]
- de Groot, R.J.; Baker, S.C.; Baric, R.S.; Brown, C.S.; Drosten, C.; Enjuanes, L.; Fouchier, R.A.M.; Galiano, M.; Gorbalenya, A.E.; Memish, Z.A.; et al. Middle East Respiratory Syndrome Coronavirus (MERS-CoV): Announcement of the Coronavirus Study Group. J. Virol. 2013, 87, 7790–7792. [Google Scholar] [CrossRef] [Green Version]
- Airborne Nitrogen Dioxide Plummets Over China. Available online: https://earthobservatory.nasa.gov/images/146362/airborne-nitrogen-dioxide-plummets-over-china (accessed on 2 March 2020).
- Watch the Footprint of Coronavirus Spread Across Countries. Available online: https://www.nytimes.com/interactive/2020/climate/coronavirus-pollution.html (accessed on 17 March 2020).
- COVID-19: Nitrogen Dioxide Over China. Available online: https://earth.esa.int/web/guest/news/-/article/covid-19-nitrogen-dioxide-over-china (accessed on 19 March 2020).
- Clean Air above Italy and China. Available online: https://www.delta.tudelft.nl/article/cleaner-air-above-italy-and-china (accessed on 19 March 2020).
- Hu, H.Y. The Distribution of Population in China, With Statistics and Maps. J. Geogr. Sci. 1935, 2, 191–192. [Google Scholar]
- Zheng, Z.; Yang, Z.; Wu, Z.; Marinello, F. Spatial Variation of NO2 and Its Impact Factors in China: An Application of Sentinel-5P Products. Remote Sens. 2019, 11, 1939. [Google Scholar] [CrossRef] [Green Version]
- Liu, Z.R.; Gao, W.K.; Yu, Y.C.; Hu, B.; Xin, J.Y.; Sun, Y.; Wang, L.L.; Wang, G.H.; Bi, X.H.; Zhang, G.H.; et al. Characteristics of PM2.5 mass concentrations and chemical species in urban and background areas of China: Emerging results from the CARE-China network. Atmos. Chem. Phys. 2018, 18, 8849–8871. [Google Scholar] [CrossRef] [Green Version]
- Ambient Air Quality Standards (GB3095-2012); Ministry of Environmental Protection of the People’s Republic of China (MEE): Beijing, China, 2012.
- Xue, Y.; Li, Y.; Guang, J.; Tugui, A.; She, L.; Qin, K.; Fan, C.; Che, Y.; Xie, Y.; Wen, Y.; et al. Hourly PM2.5 Estimation over Central and Eastern China Based on Himawari-8 Data. Remote Sens. 2020, 12, 855. [Google Scholar] [CrossRef] [Green Version]
- Fan, H.; Zhao, C.F.; Yang, Y.K. A comprehensive analysis of the spatio-temporal variation of urban air pollution in China during 2014–2018. Atmos. Environ. 2020, 220, 117066. [Google Scholar] [CrossRef]
- Lunar Phase. Available online: https://en.wikipedia.org/wiki/Lunar_phase (accessed on 12 May 2020).
- Coronavirus Detected in Wuhan in Late December: China. Available online: https://economictimes.indiatimes.com/news/international/world-news/coronavirus-detected-in-wuhan-in-late-december-china/articleshow/75028126.cms?utm_source=contentofinterest&utm_medium=text&utm_campaign=cppst (accessed on 7 April 2020).
- Gorelick, N.; Hancher, M.; Dixon, M.; Ilyushchenko, S.; Thau, D.; Moore, R. Google Earth Engine: Planetary-scale geospatial analysis for everyone. Remote Sens. Environ. 2017, 202, 18–27. [Google Scholar] [CrossRef]
- Kneissl, T.; van Gasselt, S.; Neukum, G. Map-projection-independent crater size-frequency determination in GIS environments-New software tool for ArcGIS. Planet. Space Sci. 2011, 59, 1243–1254. [Google Scholar] [CrossRef]
- Veefkind, J.P.; Aben, I.; McMullan, K.; Förster, H.; de Vries, J.; Otter, G.; Claas, J.; Eskes, H.J.; de Haan, J.F.; Kleipool, Q.; et al. TROPOMI on the ESA Sentinel-5 Precursor: A GMES mission for global observations of the atmospheric composition for climate, air quality and ozone layer applications. Remote Sens. Environ. 2012, 120, 70–83. [Google Scholar] [CrossRef]
- Salomonson, V.; Magner, T.; Barnes, W.; Montgomery, H.; Ostrow, H. Moderate Resolution Imaging Spectrometer A Progress Report (April 1989). In Proceedings of the IGARSS ’89 and Canadian Symposium on Remote Sensing, 12th, Vancouver, BC, Canada, 10–14 July 1989; pp. 2917–2921. [Google Scholar]
- Lyapustin, A.; Wang, Y.; Laszlo, I.; Kahn, R.; Korkin, S.; Remer, L.; Levy, R.; Reid, J.S. Multiangle implementation of atmospheric correction (MAIAC): 2. Aerosol algorithm. J. Geophys. Res.-Atmos. 2011, 116. [Google Scholar] [CrossRef]
- Lyapustin, A.; Wang, Y.J.; Korkin, S.; Huang, D. MODIS Collection 6 MAIAC algorithm. Atmos. Meas. Tech. 2018, 11, 5741–5765. [Google Scholar] [CrossRef] [Green Version]
- Mhawish, A.; Banerjee, T.; Sorek-Hamer, M.; Lyapustin, A.; Broday, D.M.; Chatfield, R. Comparison and evaluation of MODIS Multi-angle Implementation of Atmospheric Correction (MAIAC) aerosol product over South Asia. Remote Sens. Environ. 2019, 224, 12–28. [Google Scholar] [CrossRef]
- She, L.; Zhang, H.; Wang, W.; Wang, Y.; Shi, Y. Evaluation of the Multi-Angle Implementation of Atmospheric Correction (MAIAC) Aerosol Algorithm for Himawari-8 Data. Remote Sens. 2019, 11, 2771. [Google Scholar] [CrossRef] [Green Version]
- Zhang, Z.Y.; Wu, W.L.; Fan, M.; Wei, J.; Tan, Y.H.; Wang, Q. Evaluation of MAIAC aerosol retrievals over China. Atmos. Environ. 2019, 202, 8–16. [Google Scholar] [CrossRef]
- Li, Y.; Xue, Y.; Guang, J.; She, L.; Fan, C.; Chen, G. Ground-Level PM2.5 Concentration Estimation from Satellite Data in the Beijing Area Using a Specific Particle Swarm Extinction Mass Conversion Algorithm. Remote Sens. 2018, 10, 1906. [Google Scholar] [CrossRef] [Green Version]
- Liang, F.C.; Xiao, Q.Y.; Wang, Y.J.; Lyapustin, A.; Li, G.X.; Gu, D.F.; Pan, X.C.; Liu, Y. MAIAC-based long-term spatiotemporal trends of PM2.5 in Beijing, China. Sci. Total Environ. 2018, 616, 1589–1598. [Google Scholar] [CrossRef] [PubMed]
- Krotkov, N.A.; McLinden, C.A.; Li, C.; Lamsal, L.N.; Celarier, E.A.; Marchenko, S.V.; Swartz, W.H.; Bucsela, E.J.; Joiner, J.; Duncan, B.N.; et al. Aura OMI observations of regional SO2 and NO2 pollution changes from 2005 to 2015. Atmos. Chem. Phys. 2016, 16, 4605–4629. [Google Scholar] [CrossRef] [Green Version]
- Zhao, Y.; Nielsen, C.P.; McElroy, M.B.; Zhang, L.; Zhang, J. CO emissions in China: Uncertainties and implications of improved energy efficiency and emission control. Atmos. Environ. 2012, 49, 103–113. [Google Scholar] [CrossRef]
- Schneising, O.; Buchwitz, M.; Reuter, M.; Bovensmann, H.; Burrows, J.; Borsdorff, T.; Deutscher, N.; Feist, D.; Griffith, D.; Hase, F.; et al. A scientific algorithm to simultaneously retrieve carbon monoxide and methane from TROPOMI onboard Sentinel-5 Precursor. Atmos. Meas. Tech. 2019, 12, 6771–6802. [Google Scholar] [CrossRef] [Green Version]
- Zhang, Y.; Li, Z. Remote sensing of atmospheric fine particulate matter (PM2.5) mass concentration near the ground from satellite observation. Remote Sens. Environ. 2015, 160, 252–262. [Google Scholar] [CrossRef]
- Zhang, K.N.; de Leeuw, G.; Yang, Z.Q.; Chen, X.F.; Su, X.L.; Jiao, J.S. Estimating Spatio-Temporal Variations of PM2.5 Concentrations Using VIIRS-Derived AOD in the Guanzhong Basin, China. Remote Sens. 2019, 11, 2679. [Google Scholar] [CrossRef] [Green Version]
- Xin, J.; Gong, C.; Liu, Z.; Cong, Z.; Gao, W.; Tao, S.; Pan, Y.; Sun, Y.; Ji, D.; Wang, L.; et al. The observation-based relationships between PM 2.5 and AOD over China: The functions of PM2.5 & AOD over China. J. Geophys. Res. Atmos. 2016, 121, 716. [Google Scholar] [CrossRef]
- Proestakis, E.; Amiridis, V.; Marinou, E.; Georgoulias, A.; Solomos, S.; Kazadzis, S.; Chimot, J.; Che, H.; Alexandri, G.; Binietoglou, I.; et al. Nine-year spatial and temporal evolution of desert dust aerosols over South and East Asia as revealed by CALIOP. Atmos. Chem. Phys. 2018, 18, 1337–1362. [Google Scholar] [CrossRef] [Green Version]
- Liu, P.; Ye, C.; Xue, C.; Zhang, C.; Mu, Y.; Sun, X. Formation mechanisms of atmospheric nitrate and sulfate during the winter haze pollution periods in Beijing: Gas-phase, heterogeneous and aqueous-phase chemistry. Atmos. Chem. Phys. 2020, 20, 4153–4165. [Google Scholar] [CrossRef] [Green Version]
- Wang, Y.; Yu, M.; Wang, Y.; Tang, G.; Song, T.; Zhou, P.; Liu, Z.; Hu, B.; Ji, D.; Wang, L.; et al. Rapid formation of intense haze episodes via aerosol–boundary layer feedback in Beijing. Atmos. Chem. Phys. 2020, 20, 45–53. [Google Scholar] [CrossRef] [Green Version]
- Monks, P.S.; Archibald, A.T.; Colette, A.; Cooper, O.; Coyle, M.; Derwent, R.; Fowler, D.; Granier, C.; Law, K.S.; Mills, G.E.; et al. Tropospheric ozone and its precursors from the urban to the global scale from air quality to short-lived climate forcer. Atmos. Chem. Phys. 2015, 15, 8889–8973. [Google Scholar] [CrossRef] [Green Version]
- Xie, S.; Wang, S.; Dao, X.; Zheng, H.; Hong, G.; Zhang, X. Analysis of Air Quality in Beijing-Tianjin-Hebei and Surrounding Areas During the Spring Festival of 2018. Environ. Monit. China 2019, 35, 1–11. [Google Scholar]
- Xiao, C.; Chang, M.; Guo, P.; Gu, M.; Li, Y. Analysis of air quality characteristics of Beijing–Tianjin–Hebei and its surrounding air pollution transport channel cities in China. J. Environ. Sci. 2019, 87, 213–227. [Google Scholar] [CrossRef]
- Zhang, X.; Zhang, Q.; Hong, C.; Zheng, Y.; Geng, G.; Tong, D.; Zhang, Y.; Zhang, X. Enhancement of PM 2.5 Concentrations by Aerosol-Meteorology Interactions Over China. J. Geophys. Res. Atmos. 2017, 1179–1194. [Google Scholar] [CrossRef]
- Wang, H.; Jianghao, L.; Yue, P.; Meng, Z.; Huizheng, C.; Xiaoye, Z. The impacts of the meteorology features on PM2.5 levels during a severe haze episode in central-east China. Atmos. Environ. 2018, 197, 177–189. [Google Scholar] [CrossRef]
- Ning, G.; Wang, S.; Ma, M.; Ni, C.; Shang, Z.; Wang, J.; Li, J. Characteristics of air pollution in different zones of Sichuan Basin, China. Sci. Total Environ. 2018, 612, 975–984. [Google Scholar] [CrossRef]
- Zhang, L.; Guo, X.; Zhao, T.; Gong, S.; Xu, X.; Li, Y.; Luo, L.; Gui, K.; Wang, H.; Zheng, Y.; et al. A modelling study of the terrain effects on haze pollution in the Sichuan Basin. Atmos. Environ. 2019, 196, 77–85. [Google Scholar] [CrossRef]
- Cai, W.; Ke, L.; Liao, H.; Wang, H.; Wu, L. Weather conditions conducive to Beijing severe haze more frequent under climate change. Nat. Clim. Chang. 2017, 7, 257–262. [Google Scholar] [CrossRef]
- Zhong, J.; Zhang, X.; Yunsheng, D.; Wang, Y.; Liu, C.; Wang, J.; Zhang, Y.; Che, H. Feedback effects of boundary-layer meteorological factors on cumulative explosive growth of PM2.5 during winter heavy pollution episodes in Beijing from 2013 to 2016. Atmos. Chem. Phys. 2018, 18, 247–258. [Google Scholar] [CrossRef] [Green Version]
- Brasseur, G.P.; Xie, Y.; Petersen, A.K.; Bouarar, I.; Flemming, J.; Gauss, M.; Jiang, F.; Kouznetsov, R.; Kranenburg, R.; Mijling, B.; et al. Ensemble forecasts of air quality in eastern China—Part 1: Model description and implementation of the MarcoPolo-Panda prediction system, version 1. Geosci. Model Dev. 2019, 12, 33–67. [Google Scholar] [CrossRef] [Green Version]
- Gu, J.B.; Chen, L.F.; Yu, C.; Li, S.S.; Tao, J.H.; Fan, M.; Xiong, X.Z.; Wang, Z.F.; Shang, H.Z.; Su, L. Ground-Level NO2 Concentrations over China Inferred from the Satellite OMI and CMAQ Model Simulations. Remote Sens. 2017, 9, 519. [Google Scholar] [CrossRef] [Green Version]
- Wang, Y.Q.; Zhang, X.Y.; Sun, J.Y.; Zhang, X.C.; Che, H.Z.; Li, Y. Spatial and temporal variations of the concentrations of PM10, PM2.5 and PM1 in China. Atmos. Chem. Phys. 2015, 15, 13585–13598. [Google Scholar] [CrossRef] [Green Version]
- Li, Z.; Guo, J.; Ding, A.; Liao, H.; Liu, J.; Sun, Y.; Wang, T.; Xue, H.; Zhang, H.; Zhu, B. Aerosol and boundary-layer interactions and impact on air quality. Natl. Sci. Rev. 2017, 4, 810–833. [Google Scholar] [CrossRef]
- Theys, N.; De Smedt, I.; Yu, H.; Danckaert, T.; van Gent, J.; Hormann, C.; Wagner, T.; Hedelt, P.; Bauer, H.; Romahn, F.; et al. Sulfur dioxide retrievals from TROPOMI onboard Sentinel-5 Precursor: Algorithm theoretical basis. Atmos. Meas. Tech. 2017, 10, 119–153. [Google Scholar] [CrossRef] [Green Version]
- Ma, Y.; Zhang, M.; Jin, S.; Gong, W.; Chen, N.; Chen, Z.; Yinbao, J.; Shi, Y. Long-Term Investigation of Aerosol Optical and Radiative Characteristics in a Typical Megacity of Central China During Winter Haze Periods. J. Geophys. Res. Atmos. 2019, 124, 12093–12106. [Google Scholar] [CrossRef]
- Ding, J.; van der, A.R.; Mijling, B.; Levelt, P. Space-based NOx emission estimates over remote regions improved in DECSO. Atmos. Meas. Tech. 2017, 10, 925–938. [Google Scholar] [CrossRef] [Green Version]


| Year | Start (−30d) | Spring Festival | End (+30d) | Extend (+60d) |
|---|---|---|---|---|
| 2017 | 29 December 2016 | 28 January | 27 February | / |
| 2018 | 17 January | 16 February | 18 March | / |
| 2019 | 6 January | 5 February | 7 March | 6 April |
| 2020 | 26 December 2019 | 25 January | 24 February | 25 March |
© 2020 by the authors. Licensee MDPI, Basel, Switzerland. This article is an open access article distributed under the terms and conditions of the Creative Commons Attribution (CC BY) license (http://creativecommons.org/licenses/by/4.0/).
Share and Cite
Fan, C.; Li, Y.; Guang, J.; Li, Z.; Elnashar, A.; Allam, M.; de Leeuw, G. The Impact of the Control Measures during the COVID-19 Outbreak on Air Pollution in China. Remote Sens. 2020, 12, 1613. https://0-doi-org.brum.beds.ac.uk/10.3390/rs12101613
Fan C, Li Y, Guang J, Li Z, Elnashar A, Allam M, de Leeuw G. The Impact of the Control Measures during the COVID-19 Outbreak on Air Pollution in China. Remote Sensing. 2020; 12(10):1613. https://0-doi-org.brum.beds.ac.uk/10.3390/rs12101613
Chicago/Turabian StyleFan, Cheng, Ying Li, Jie Guang, Zhengqiang Li, Abdelrazek Elnashar, Mona Allam, and Gerrit de Leeuw. 2020. "The Impact of the Control Measures during the COVID-19 Outbreak on Air Pollution in China" Remote Sensing 12, no. 10: 1613. https://0-doi-org.brum.beds.ac.uk/10.3390/rs12101613