Multi-Scale and Occlusion Aware Network for Vehicle Detection and Segmentation on UAV Aerial Images


School of Control Science and Engineering, Shandong University, Jinan 250061, China
*
Author to whom correspondence should be addressed.
Remote Sens. 2020, 12(11), 1760; https://0-doi-org.brum.beds.ac.uk/10.3390/rs12111760
Submission received: 24 April 2020
/
Revised: 26 May 2020
/
Accepted: 27 May 2020
/
Published: 29 May 2020
(This article belongs to the Special Issue GeoAI: Integration of Artificial Intelligence, Machine Learning and Deep Learning with Remote Sensing)
Abstract
:With the advantage of high maneuverability, Unmanned Aerial Vehicles (UAVs) have been widely deployed in vehicle monitoring and controlling. However, processing the images captured by UAV for the extracting vehicle information is hindered by some challenges including arbitrary orientations, huge scale variations and partial occlusion. In seeking to address these challenges, we propose a novel Multi-Scale and Occlusion Aware Network (MSOA-Net) for UAV based vehicle segmentation, which consists of two parts including a Multi-Scale Feature Adaptive Fusion Network (MSFAF-Net) and a Regional Attention based Triple Head Network (RATH-Net). In MSFAF-Net, a self-adaptive feature fusion module is proposed, which can adaptively aggregate hierarchical feature maps from multiple levels to help Feature Pyramid Network (FPN) deal with the scale change of vehicles. The RATH-Net with a self-attention mechanism is proposed to guide the location-sensitive sub-networks to enhance the vehicle of interest and suppress background noise caused by occlusions. In this study, we release a large comprehensive UAV based vehicle segmentation dataset (UVSD), which is the first public dataset for UAV based vehicle detection and segmentation. Experiments are conducted on the challenging UVSD dataset. Experimental results show that the proposed method is efficient in detecting and segmenting vehicles, and outperforms the compared state-of-the-art works.
1. Introduction
With the advantage of high maneuverability, Unmanned Aerial Vehicles (UAVs) have been widely used in traffic monitoring and controlling [1]. For some UAV based systems, detection of vehicles is often the first challenging process [2]. Compared with common scenarios, processing images captured by UAV for accurate and robust vehicle detection is hindered by multitude of challenges. The main challenges are analyzed as follows.
- Arbitrary orientations: Vehicles in images captured by UAV often appear with arbitrary orientations due to the viewpoint change and height change.
- Huge scale variations: With a wide range of cruising altitudes of UAV, the scale of captured vehicles changes greatly.
- Partial occlusion: With similar structure and colors in some scenarios, it is hard to separate vehicles that are crowded or partial occluded with each other.
These differences between images captured by UAV and the images in regular datasets (e.g., Pascal VOC [3] and Microsoft COCO [4]), make it challenging to detect and segment objects in images captured by UAV.
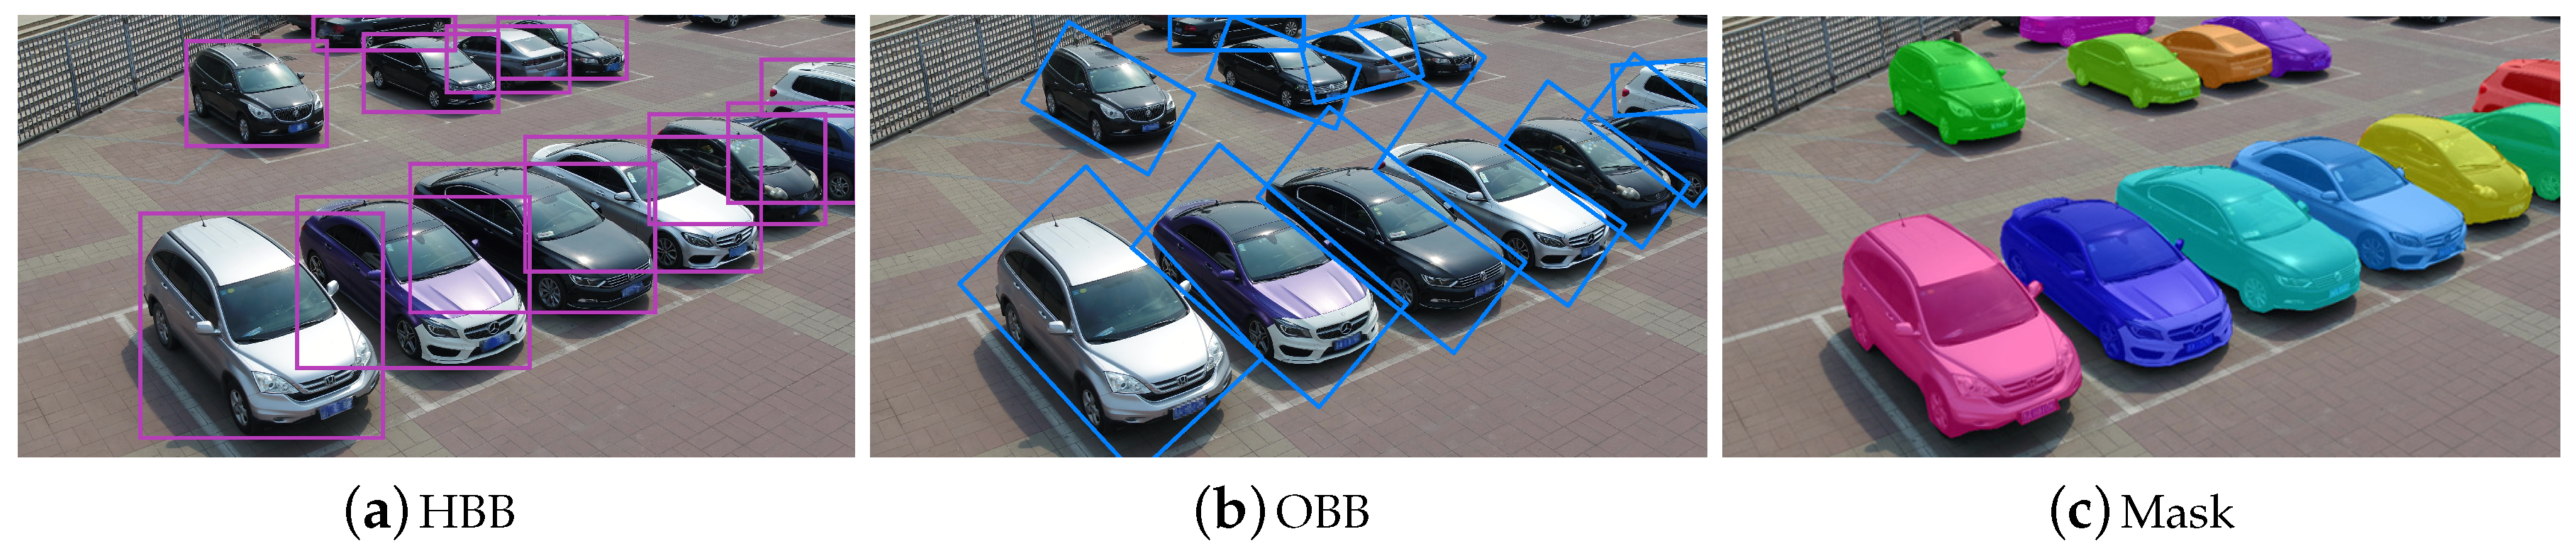
Previous detection methods are mostly based on horizontal bounding box (HBB), including Faster region-based convolutional networks (Faster R-CNN) [5], Grid R-CNN [6], Light-Head R-CNN [7], You Only Look Once (YOLO) [8], Fully Convolutional One-Stage Object Detection (FCOS) [9], etc. These HBB methods usually contain a lot of background pixels when detecting vehicles with arbitrary orientations, which is shown in Figure 1a.
To better detect objects with arbitrary orientations, some orientated bounding box (OBB) based detection methods have been proposed, including Rotational Region Convolutional Neural Network (R2CNN) [10], Rotation Region Proposal Network (RRPN) [11], Rotation Dense Feature Pyramid Networks (R-DFPN) [12], Faster R-CNN trained on OBB (FR-O) [13], etc. These methods can partly reduce background pixels comparing with HBB based methods. Although the OBB based method has better performance when detecting oriented objects in remote sensing images, they still have some background pixels when detecting vehicles captured by UAV at low-altitude, which is shown in Figure 1b.
Based on these analyses, we argue that a mask segmentation process can overcome the problems of HBB or OBB based methods to detect vehicles with arbitrary orientations. The comparison results of HBB, OBB and mask based method is shown in Figure 1. The HBB and OBB based methods contain a large proportion of background pixels, whereas the mask based methods just contain the region of vehicles. Segmentation can provide accurate vehicle regions for subsequent vision-based tasks in traffic monitoring systems, such as vehicle re-identification (ReID). Vehicle segmentation can improve re-identification performance by solving the problem of cluttered background [14]. Beyond that, after obtaining the mask of the vehicle, the OBB of the vehicle can be obtained by using the minimum enclosing rectangle method [15]. Yet, because of the gap between segmentation for vehicles captured by UAV and segmentation for general objects, some new models need to be developed for addressing the special problems for UAV-captured vehicles, including huge scale variations and partial occlusion. Accordingly, we propose a novel Multi-Scale and Occlusion Aware Network (MSOA-Net) for UAV based vehicle segmentation, which consists of two parts including a Multi-Scale Feature Adaptive Fusion Network (MSFAF-Net) and Regional Attention based Triple Head Network (RATH-Net).
The MSFAF-Net is proposed to better deal with the large scale change of vehicles. An effective way to cope with scale change of vehicles is to utilize the multi-scale features of middle layers from backbone network. Some methods have proposed to deal with the features at different scales; FPN [16] proposes a top-down pathway to enrich the semantic information of shallow layers; PANet [17] design a bottom-up pathway to shorten the information path between lower layers and topmost features; MFPN [18] inherits all the merits of the different FPNs by assembling the three kinds of FPNs including top-down FPN, bottom-up FPN and fusing-splitting FPN; yet, these models cannot get self-adaptive weights according to the importance of features at different scales. Distinguished from these methods, we design a self-adaptive feature fusion module to measure the importance of features at different scales by learned weight vector and aggregate these features by self-adaptive weights. After that, we use the features after aggregating to enhance the original features of FPN. In this manner, we shorten the information path between features from different levels and get multi-scale features with a small semantic gap in features from different levels.
The RATH-Net is proposed to handle background noise caused by occlusion. From the perspective of UAV at low altitudes, occlusion happens very often, which is challenging to handle because of similar structures and colors. Traditional approaches aim at merely narrowing the gap between the predicted bounding box or mask and its designated ground-truth [5,19,20]. In this paper, we propose an effective way to suppress occlusion. We design a Regional Attention Module (RAM) to guide the regression branch and the mask branch to pay more attention to the current vehicle (foreground) and suppress occlusion caused by other vehicles (background) of similar structure or color.
As a result of lacking standardized public dataset, we release a public dataset called UAV based vehicle segmentation dataset (UVSD) with 5874 images and 98,600 vehicles, which is the first public detection and segmentation dataset for UAV-captured vehicles with different attitudes, different altitudes and occlusions. Experiments are conducted on the challenging UVSD dataset. The results show that the proposed MSOA-Net is efficient in detecting and segmenting vehicles, and outperforms the-state-of-the-art compared methods.
The main contributions of this paper are summarized as follows.
- The innovative MSOA-Net segmentation structure is proposed for addressing the special problems for UAV based vehicle detection and segmentation.
- The multi-scale feature adaptive fusion network is proposed to adaptively integrate the low-level location information and high-level semantic information to better deal with scale change.
- The regional attention based triple head network is proposed to better focus on the region of interest, reducing the influence of occlusions.
- The new large comprehensive dataset called UVSD is released, which is the first public detection and segmentation dataset for UAV-captured vehicles.
This paper is organized as follows. Section 2 gives a brief introduction to the related work. In Section 3, the released dataset is detailedly described. Section 4 presents the detailed descriptions of MSOA-Net. Section 5 shows the evaluation and comparison results, and Section 6 further discusses the experimental results. In the end, Section 7 gives the final conclusion and future work.
2. Related Work
In this section, we first briefly review the generic object instance segmentation methods. Then, we introduce some UAV-based datasets.
2.1. Generic Object Instance Segmentation
Object instance segmentation methods are to locate and segment accurate regions of objects, which can be divided into two groups including two-stage instance segmentation and one-stage instance segmentation. Mask R-CNN [19] follows the idea of a two-stage object detection method, and adds a mask prediction branch on the basis of Faster R-CNN [5]. Based on Mask R-CNN, PANet [17] introduces a bottom-up path augmentation structure to make full use of shallow network features for instance segmentation; Mask Scoring R-CNN [21] adds a new branch to score the mask to predict a more accurate mask. These two-stage methods usually can achieve more accurate performance than one-stage methods.
One-stage instance segmentation method is mainly inspired by one-stage detector. TensorMask [22] uses a dense sliding window method to segment each pixel instance by a preset number and size of sliding windows. You Only Look At CoefficienTs (YOLACT) [23] divides the instance segmentation task into two parallel sub-tasks: one branch generates a series of prototype masks; the other branch predicts the corresponding mask coefficients of each instance. Segmenting Objects by Locations (SOLO) [24] transforms the segmentation problem into the classification problem by predicting the instance category of each pixel. In this way, the instance segmentation can be implemented directly under the supervision of the instance mask annotation without bounding box regression. In polar coordinate system [25], formulates the instance segmentation problem as predicting contour of instance through instance center classification and dense distance regression. CenterMask [26] adds a head network for mask generation to the one stage object detection algorithm (FCOS [9]) to complete the instance segmentation task. EmbedMask [27] calculates embeddings for each proposal and pixel, and finally determines whether the pixel belongs to the object within the proposal according to the embeddings distance between the pixel and the proposal. Although these methods have the advantage of high speed over the two-stage method, they often fail to achieve the accuracy of the two-stage method.
However, those algorithms are designed for general object, not directly for vehicle segmentation in the UAV aerial images.
2.2. UAV-Based Datasets
With the increasing application of UAV platform in various industries [28], more and more UAV-based datasets have been proposed in computer vision field. Bozcan et al. [29] build a multimodal UAV dataset called AU-AIR for low altitude traffic surveillance. It has multimodal sensor data collected in real outdoor environment. Hsieh et al. [30] propose a car parking lot dataset called CARPK for car detection and counting, which contains 89,777 cars collected by UAVs from different parking lots. Robicquet et al. [31] propose a large dataset called Stanford Drone dataset for trajectory forecasting and multi-target tracking, which consists of more than 19,000 targets collected by drone platform from university campus scenes and sidewalks on busy streets. Mueller et al. [32] propose a video dataset called UAV123, which is used for target tracking. The dataset contains 123 video sequences and more than 110,000 frames captured by low-altitude UAV. Du et al. [33] propose a benchmark based on UAV for object detection and tracking, which contains about 80,000 images with bounding box annotations. Barekatain et al. [34] establish a video dataset called Okutama-Action dataset, which can be used for pedestrian detection, spatiotemporal action detection and multi person tracking. It consists of a 43 min sequence with full annotation and 12 action categories. Li et al. [35] construct the drone tracking dataset, which contains 70 video sequences with manual annotation. Some of the videos were recorded by UAV on the university campus, and others were collected from YouTube. Zhu et al. [2] propose a large-scale visual object detection and tracking benchmark dataset called VisDrone2018. It consists of 263 videos and 10,209 images collected by the UAV platform in different cities of China.
These datasets are for different computer vision tasks including detection, tracking, counting, etc. Yet as far as we can find in the literature, there is no reported UAV-based vehicle segmentation related dataset.
3. Dataset Description
In this study, we build and release a new large-scale dataset called UAV based vehicle segmentation dataset (UVSD). The UVSD has been released in https://github.com/liuchunsense/UVSD. UVSD contains 5874 images with 98,600 instances with high quality instance-level semantic annotations. To ensure high quality, the annotation process was performed iteratively with a three-level quality check, overall taking about two man-hours per image. The vehicle samples and marked vehicle samples in our dataset are shown in Figure 2. Images in the first row are vehicle samples, and images in the second row are labeled vehicles.
3.1. Dataset Properties
Compared with other representative datasets for instance segmentation, the main features of UVSD are as follows:
- The proposed dataset is extremely challenging. The vehicle instances in UVSD have the characteristics of viewpoint changes, huge scale variations, partial occlusion, densely distribution, illumination variations, etc.
- There are many images with dense vehicles (more than 150 vehicles per image) in UVSD. Therefore, the UVSD also can be used for other vision-based tasks, e.g., vehicle counting.
- In addition to visual data and pixel-level instance annotations, UVSD includes other format annotations (i.e., pixel-level semantic, OBB and HBB annotations). UVSD also can be used for semantic segmentation task, HBB and OBB based vehicle detection tasks.
3.2. Dataset Collection
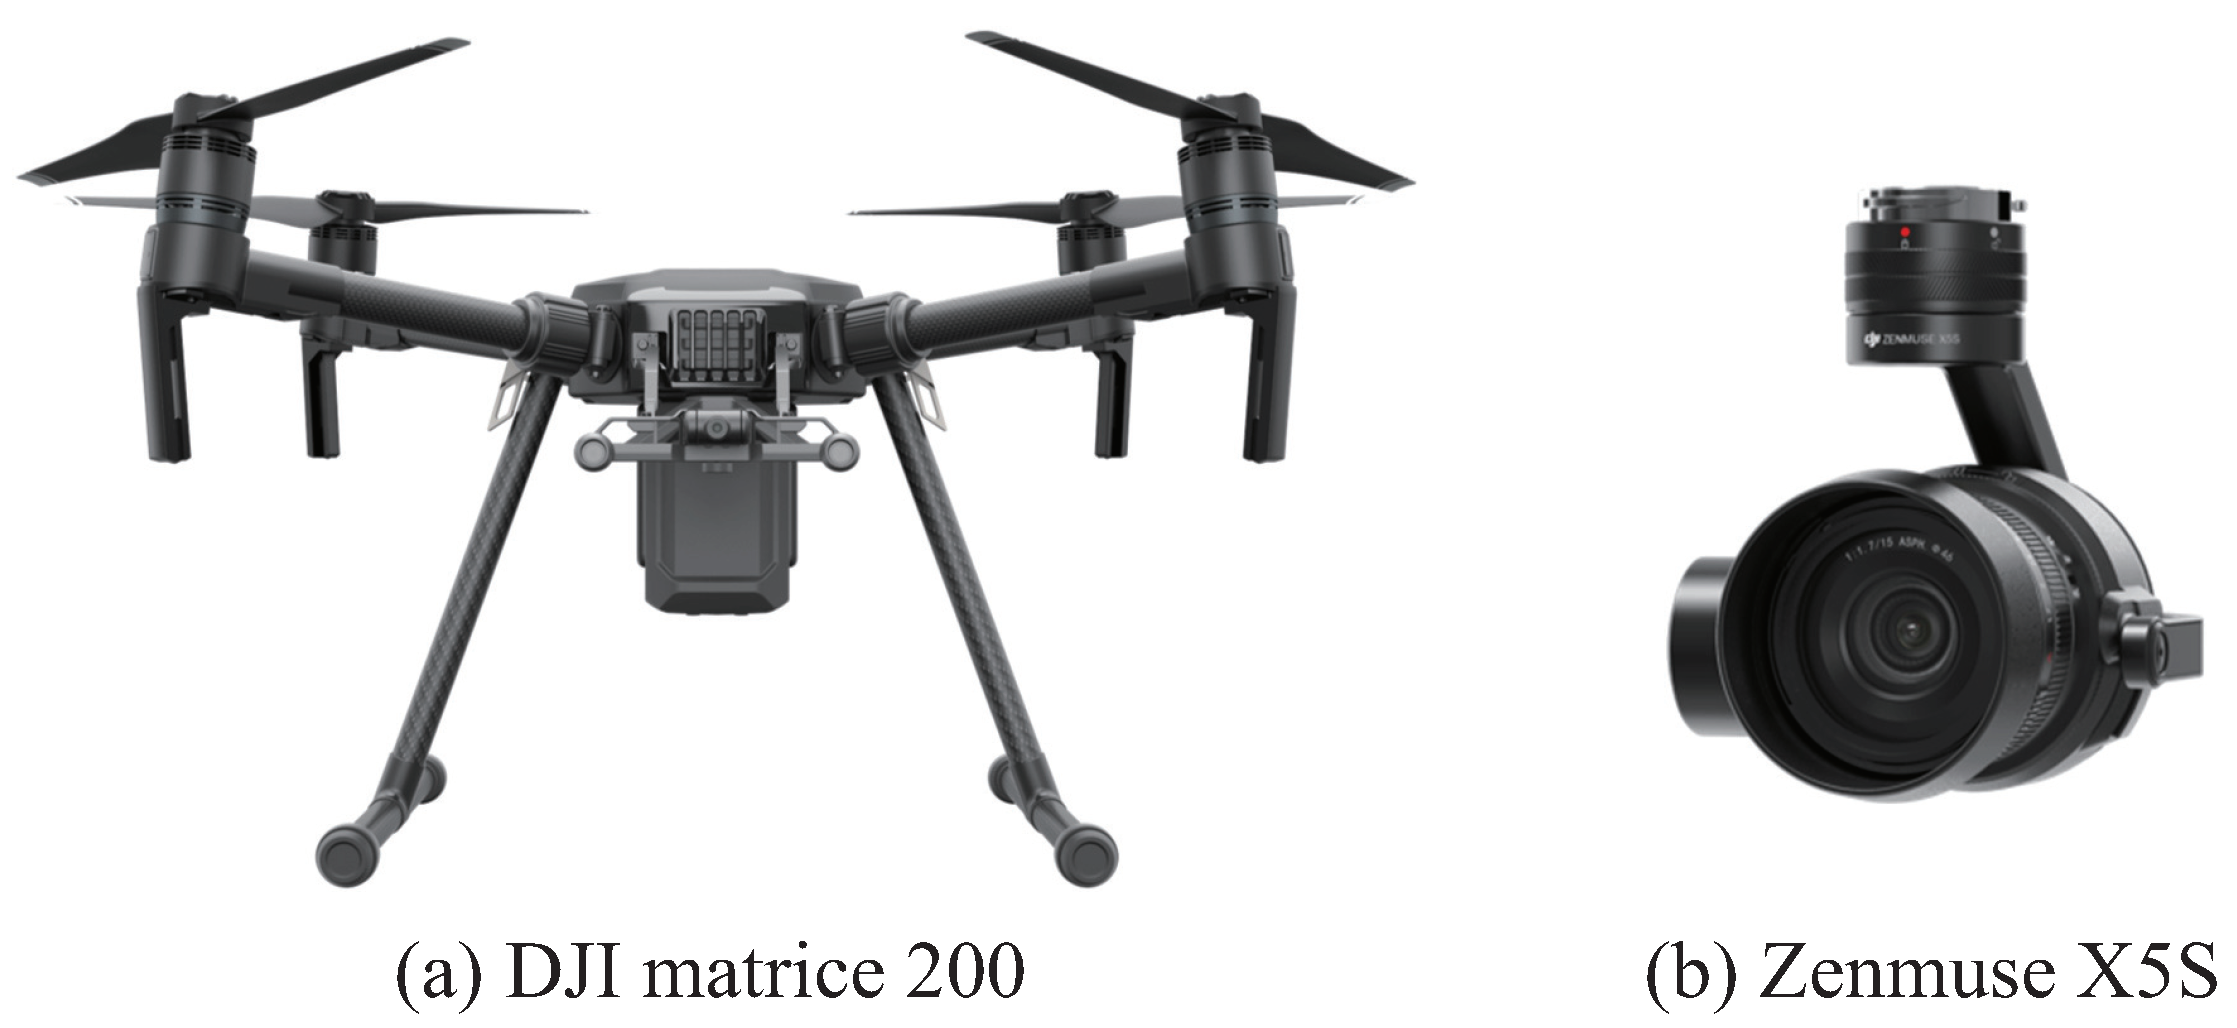
In UVSD, 4374 images are captured over urban roads, residential areas, parking lots, highways and campus in Jinan, China. The airborne platform used in this research is a DJI matrice 200 quadcopter integrated with a zenmuse X5S gimbal and camera. The on-board camera can record the videos with a resolution up to pixels at 30 frames per second. The airborne platform is shown in Figure 3. The images in Figure 3 are from the homepage of DJI matrice 200 [36].
To collect images covering vehicles of various scales and aspect ratios, UAV images were captured at different flight heights ranging from 10 m to 150 m. At the same time, we constantly adjust the relative angles between the UAV and the vehicle to obtain images at different orientations, containing vehicles with a wide variety of scales, orientations and shapes.
In order to make the images in the dataset contain as many different scenarios as possible, we carefully select 1500 images from the VisDrone [2] dataset. VisDrone is a large-scale benchmark with annotated bounding boxes collected using various drone platforms. We try to choose images under different scenarios with various weather and lighting conditions, to complement the images we shoot. Note that the original Visdrone dataset does not contain instance-level semantic annotations, we manually label vehicle masks in these images.
3.3. Annotation Principles
In our dataset, labeling a mask of a vehicle needs 34 points on average, which takes at least 17 times more time and energy than that of labeling a bounding box with two points.
When marking a vehicle, the contour edge of the target is accurately standardized by dense and continuous point connections, and then a `.JSON’ format file is obtained. The `.JSON’ files mainly include category name, label form, image size, image data and coordinates of each label point.
To ensure the correctness of annotation data, we set some rules for labeling, verification and refinements. The labeling principles are as follows.
- All clearly visible vehicles that appear in an image need to be labeled using the same software.
- If the truncation rate of a vehicle exceeds 80%, this vehicle does not need to be labeled and tested.
- If a vehicle partly appears in an image, we label the mask inside the image and estimate the truncation ratio based on the region inside the image.
- Images should be zoomed in, when necessary, to obtain annotations with refined boundaries.
- For each vehicle, we use as many mark points as possible to get the fine edges of the vehicle.
- Each picture after annotation needs to be reviewed twice by different members of the verification team.
- In order to protect the privacy of residents, the privacy areas such as human faces are blurred, and all image metadata, including device information and GPS locations, are removed.
4. Proposed Method
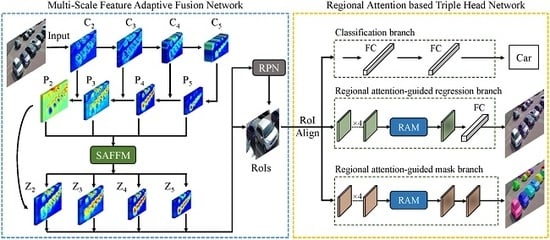
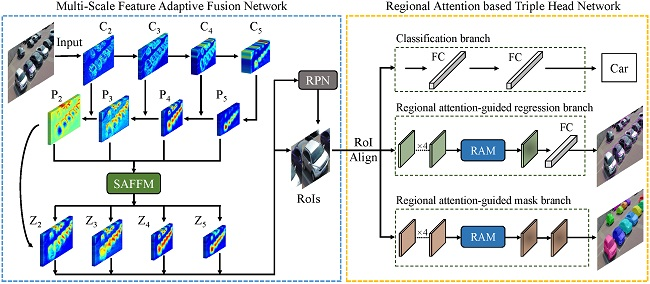
We propose a novel deep neural network structure, called Multi-Scale and Occlusion Aware Network (MSOA-Net), for UAV-based vehicle detection and segmentation. MSOA-Net mainly consists of two parts: Multi-Scale Feature Adaptive Fusion Network (MSFAF-Net) and Regional Attention based Triple Head Network (RATH-Net). The workflow chart of the proposed method is shown in Figure 4.
As shown in Figure 4, our MSOA-Net is a two-stage instance segmentation method based on Mask R-CNN [19]. Firstly, given an input image, a multi-scale feature adaptive fusion network adaptively aggregates semantic features at different scales using self-adaptive feature fusion module. A set of rectangular vehicle proposals at various scales are generated on the fused multi-scale feature maps using Region Proposal Network (RPN) [5], respectively. Secondly, after the RoIAlign [19] operation for each proposal, the aligned features are sent to sub-networks including classification branch, regional attention guided regression branch and regional attention-guided mask branch, with functions of classification, bounding-box regression and mask generating respectively. After these processes, the detection and segmentation results are gotten. The detailed descriptions of the multi-scale feature adaptive fusion network and regional attention based triple head network are as follows.
4.1. Multi-Scale Feature Adaptive Fusion Network
It is generally regarded that high-level features in backbones are with more semantic information while the low-level features contain more fine details [37,38,39]. Hence, we need to fuse features from multiple layers to make full use of the advantages of features from different levels. FPN [16] designs a top-down pathway to combine multi-scale features. The sequential manner has a long path from low-level structure to topmost features [17]. In addition, FPN fuses multi-scale features via a simple summation ignoring the different importance of different scales [40]. To address these problems, we design a Self-Adaptive Feature Fusion Module (SAFFM) to select the desired features from different scales and integrate these features to enhance the original features of FPN. In this manner, we can more efficiently combine low-level representations with high-level semantic features.
The structure of multi-scale feature adaptive fusion network is shown in the left of Figure 4. The ResNet [41] is used as the backbone network to extract the features of the input image. The feed-forward computation of ResNet is implemented through a bottom-top pathway. In order to build a feature pyramid with multi-scale feature maps, we use the ResNet activations of each stage’s last residual, which is denoted as conv2 (), conv3 (), conv4 () and conv5 (). The conv1 () is not included in the pyramid process. In the top-down pathway, the feature maps are upsampled by a factor of 2. Lateral connections merge the upsampled map with the corresponding bottom-up map. After these processes, the generated feature maps are denoted as .
The multi-level features are rescaled into the same size of , donating as .
where, is usually a bilinear interpolation or adaptive average pooling operation for resolution matching. Then these features are sent to the SAFFM which is described as follows.
4.1.1. Self-Adaptive Feature Fusion Module
The Self-Adaptive Feature Fusion Module (SAFFM) is designed to measure the importance of features at different scales and integrate features at different scales according to the learned weights.
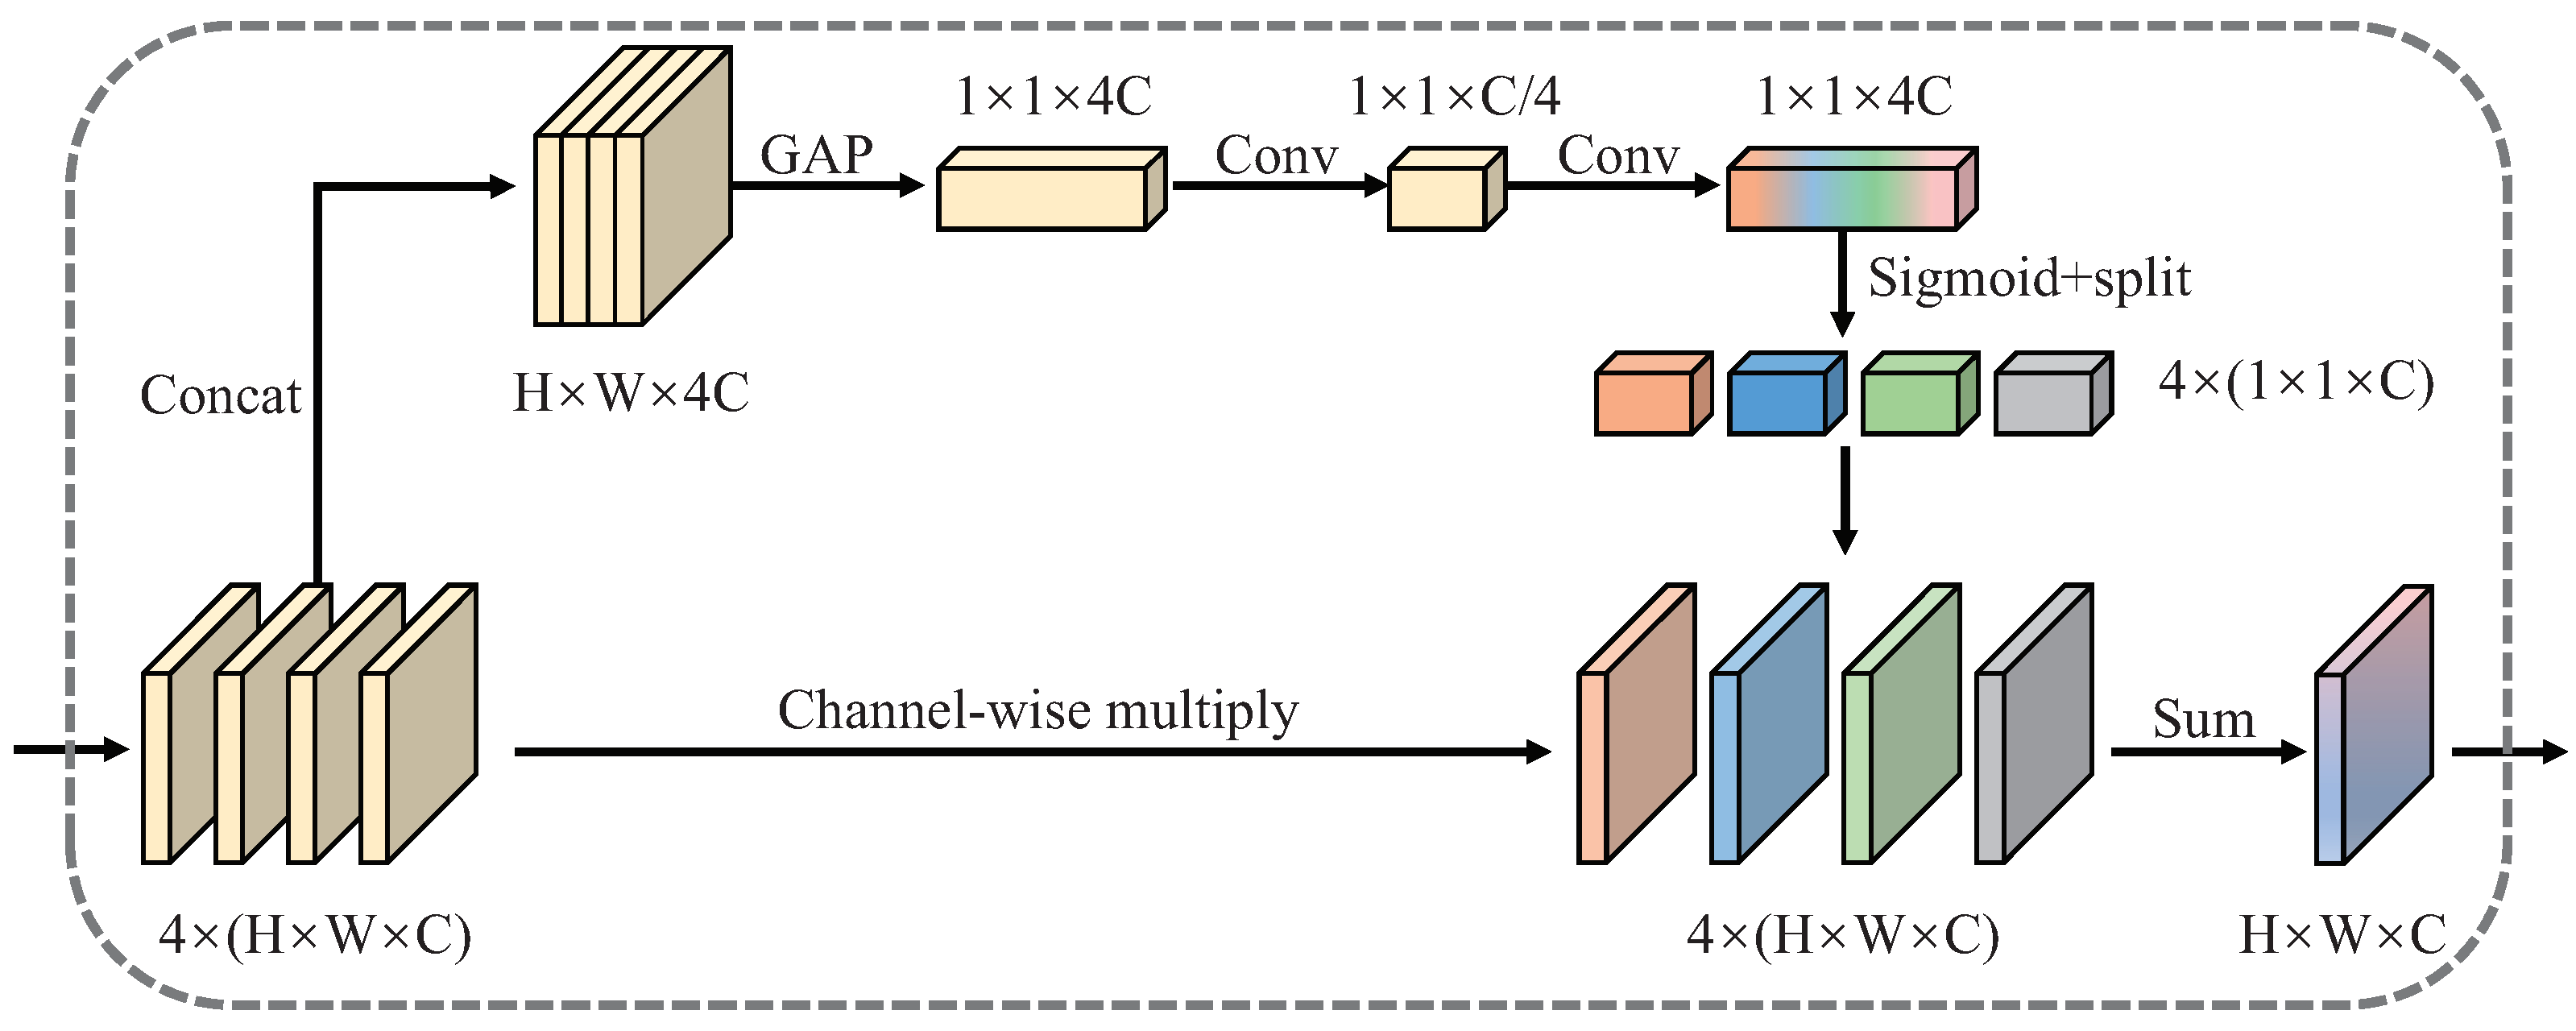
The structure of SAFFM is shown in Figure 5.
Formally, given feature maps , we first aggregate them via concatenation:
where, represents concat operation along channel dimension, . Then, the Global Average Pooling (GAP) function is performed on to get global information as . Thus the j-th channel of is calculated by:
where, represents the pixel value at position of the j-th channel of .
We add convolutional layers and introduce a gating mechanism to further capture channel-wise dependencies between different scale features. We use a sigmoid function to generate channel-focus weights:
where, denotes the sigmoid function, refers to the rectifier linearity unit (ReLU), and are parameterized as two convolutional layers, .
Then we split the channel-focus weights S for each scale features donated as . After that, we combine the channel-focus weights of features at each scale and the rescaled features use channel-wise multiplication. Last, the element-wise summation operation is used to integrate features after re-weight and get the immediate features .
where, ⊙ refer to channel-wise multiplication. The obtained features I are then rescaled to same size as respectively which are donated as . Then we use to strengthen the original features , and then get the final output .
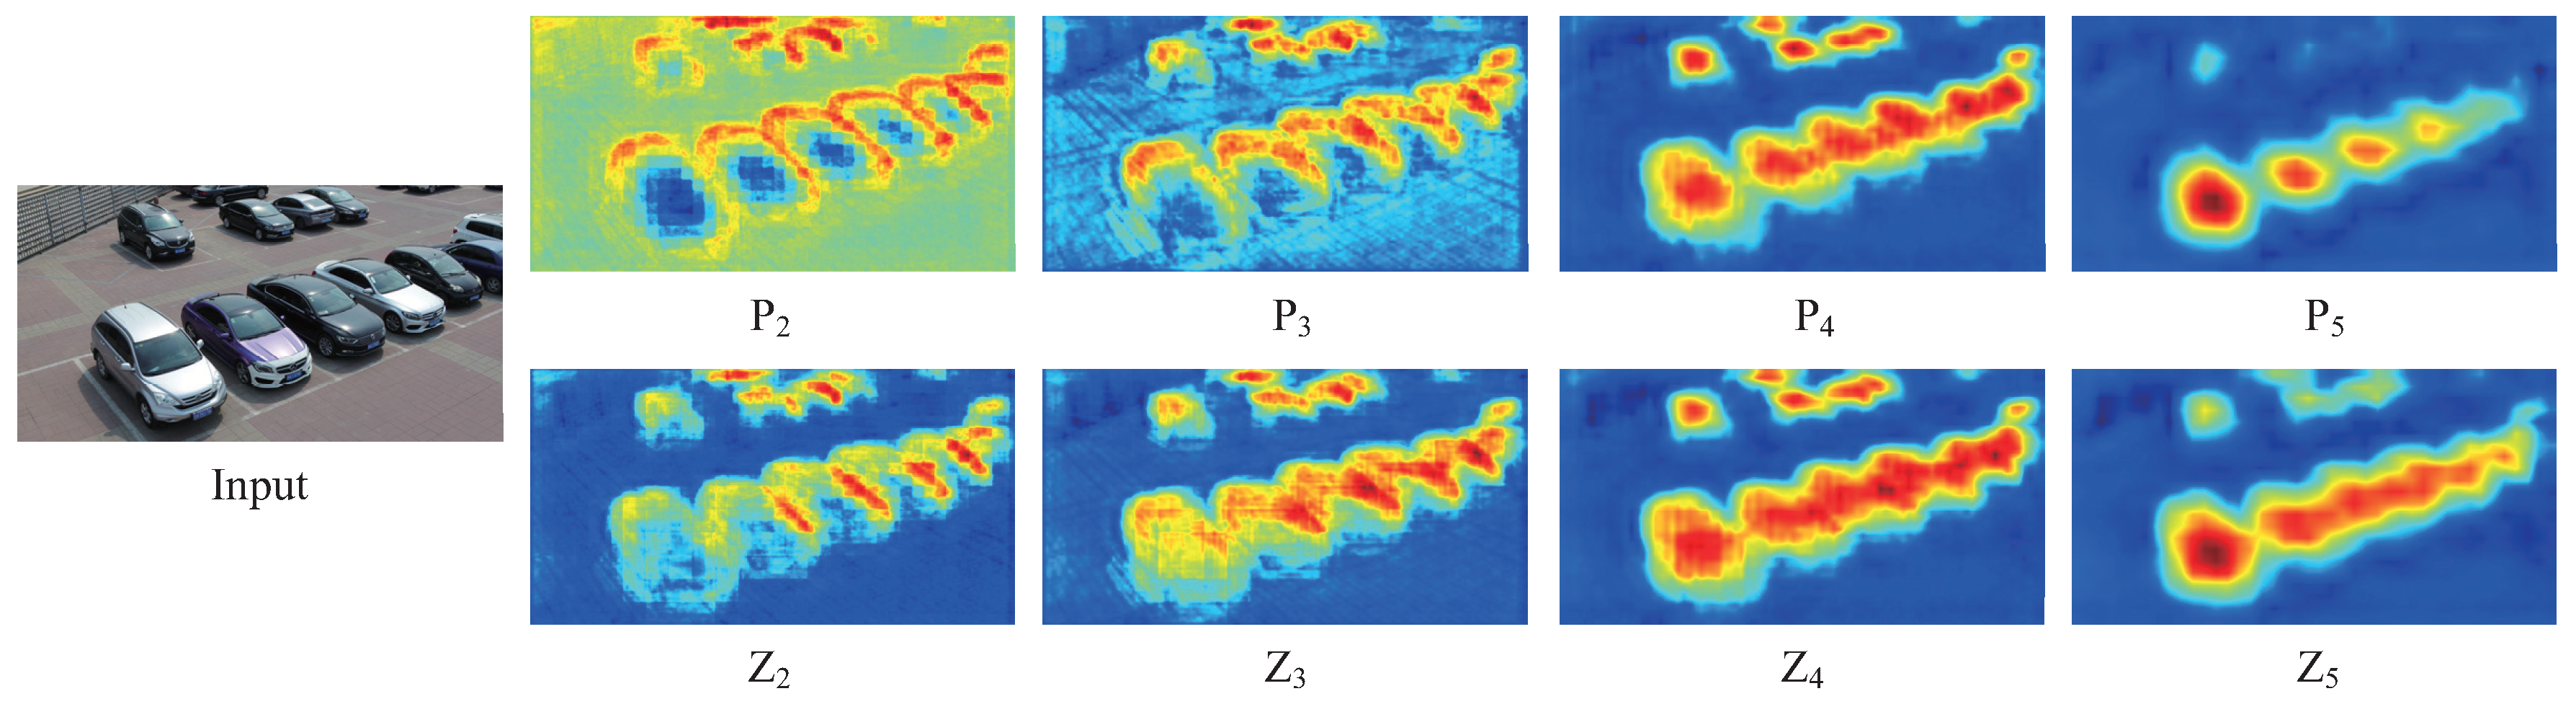
As a result, we can get the final multi-scale feature maps . The comparison between feature maps and is shown in Figure 6. From Figure 6, we can see that the feature maps contain richer discriminable information than , especially at low-levels and high level , which proves the effectiveness of our method.
4.1.2. Region Proposal Network
The Region Proposal Network (RPN) is used to process the multi-scale feature maps to generate region proposals. Similar to Mask R-CNN, we set the areas of anchors in multi-scale feature maps . The aspect ratios of anchors in each layer are set to . These feature maps of anchors are sent to RPN to generate region proposals. After non-maximum suppression (NMS) processing, the region proposals with high scores are screened and we can get the regions of interest (RoIs).
When RoIs are generated, RoIs will be allocated on different layers of feature maps according to its scale. Formally, large RoI will be allocated to the coarser-resolution feature maps such as ; small RoIs will be allocated to the finer-resolution feature maps such as . In this work, we use the same allocation strategy as FPN [16]. The allocation strategy can be described as:
where, l is the level of feature maps that should be selected, is a constant set to 4, w and h are the width and height of the RoI, respectively.
4.2. Regional Attention Based Triple Head Network
When a vehicle is occluded by other vehicles, the RoI of the vehicle will contain some features of the vehicles which occlude the target one, which will cause interference when locating the target vehicle. In order to reduce the influence of occlusion on the bounding box regression and segmentation tasks which are location-sensitive, we design the Regional Attention based Triple Head Network (RATH-Net).
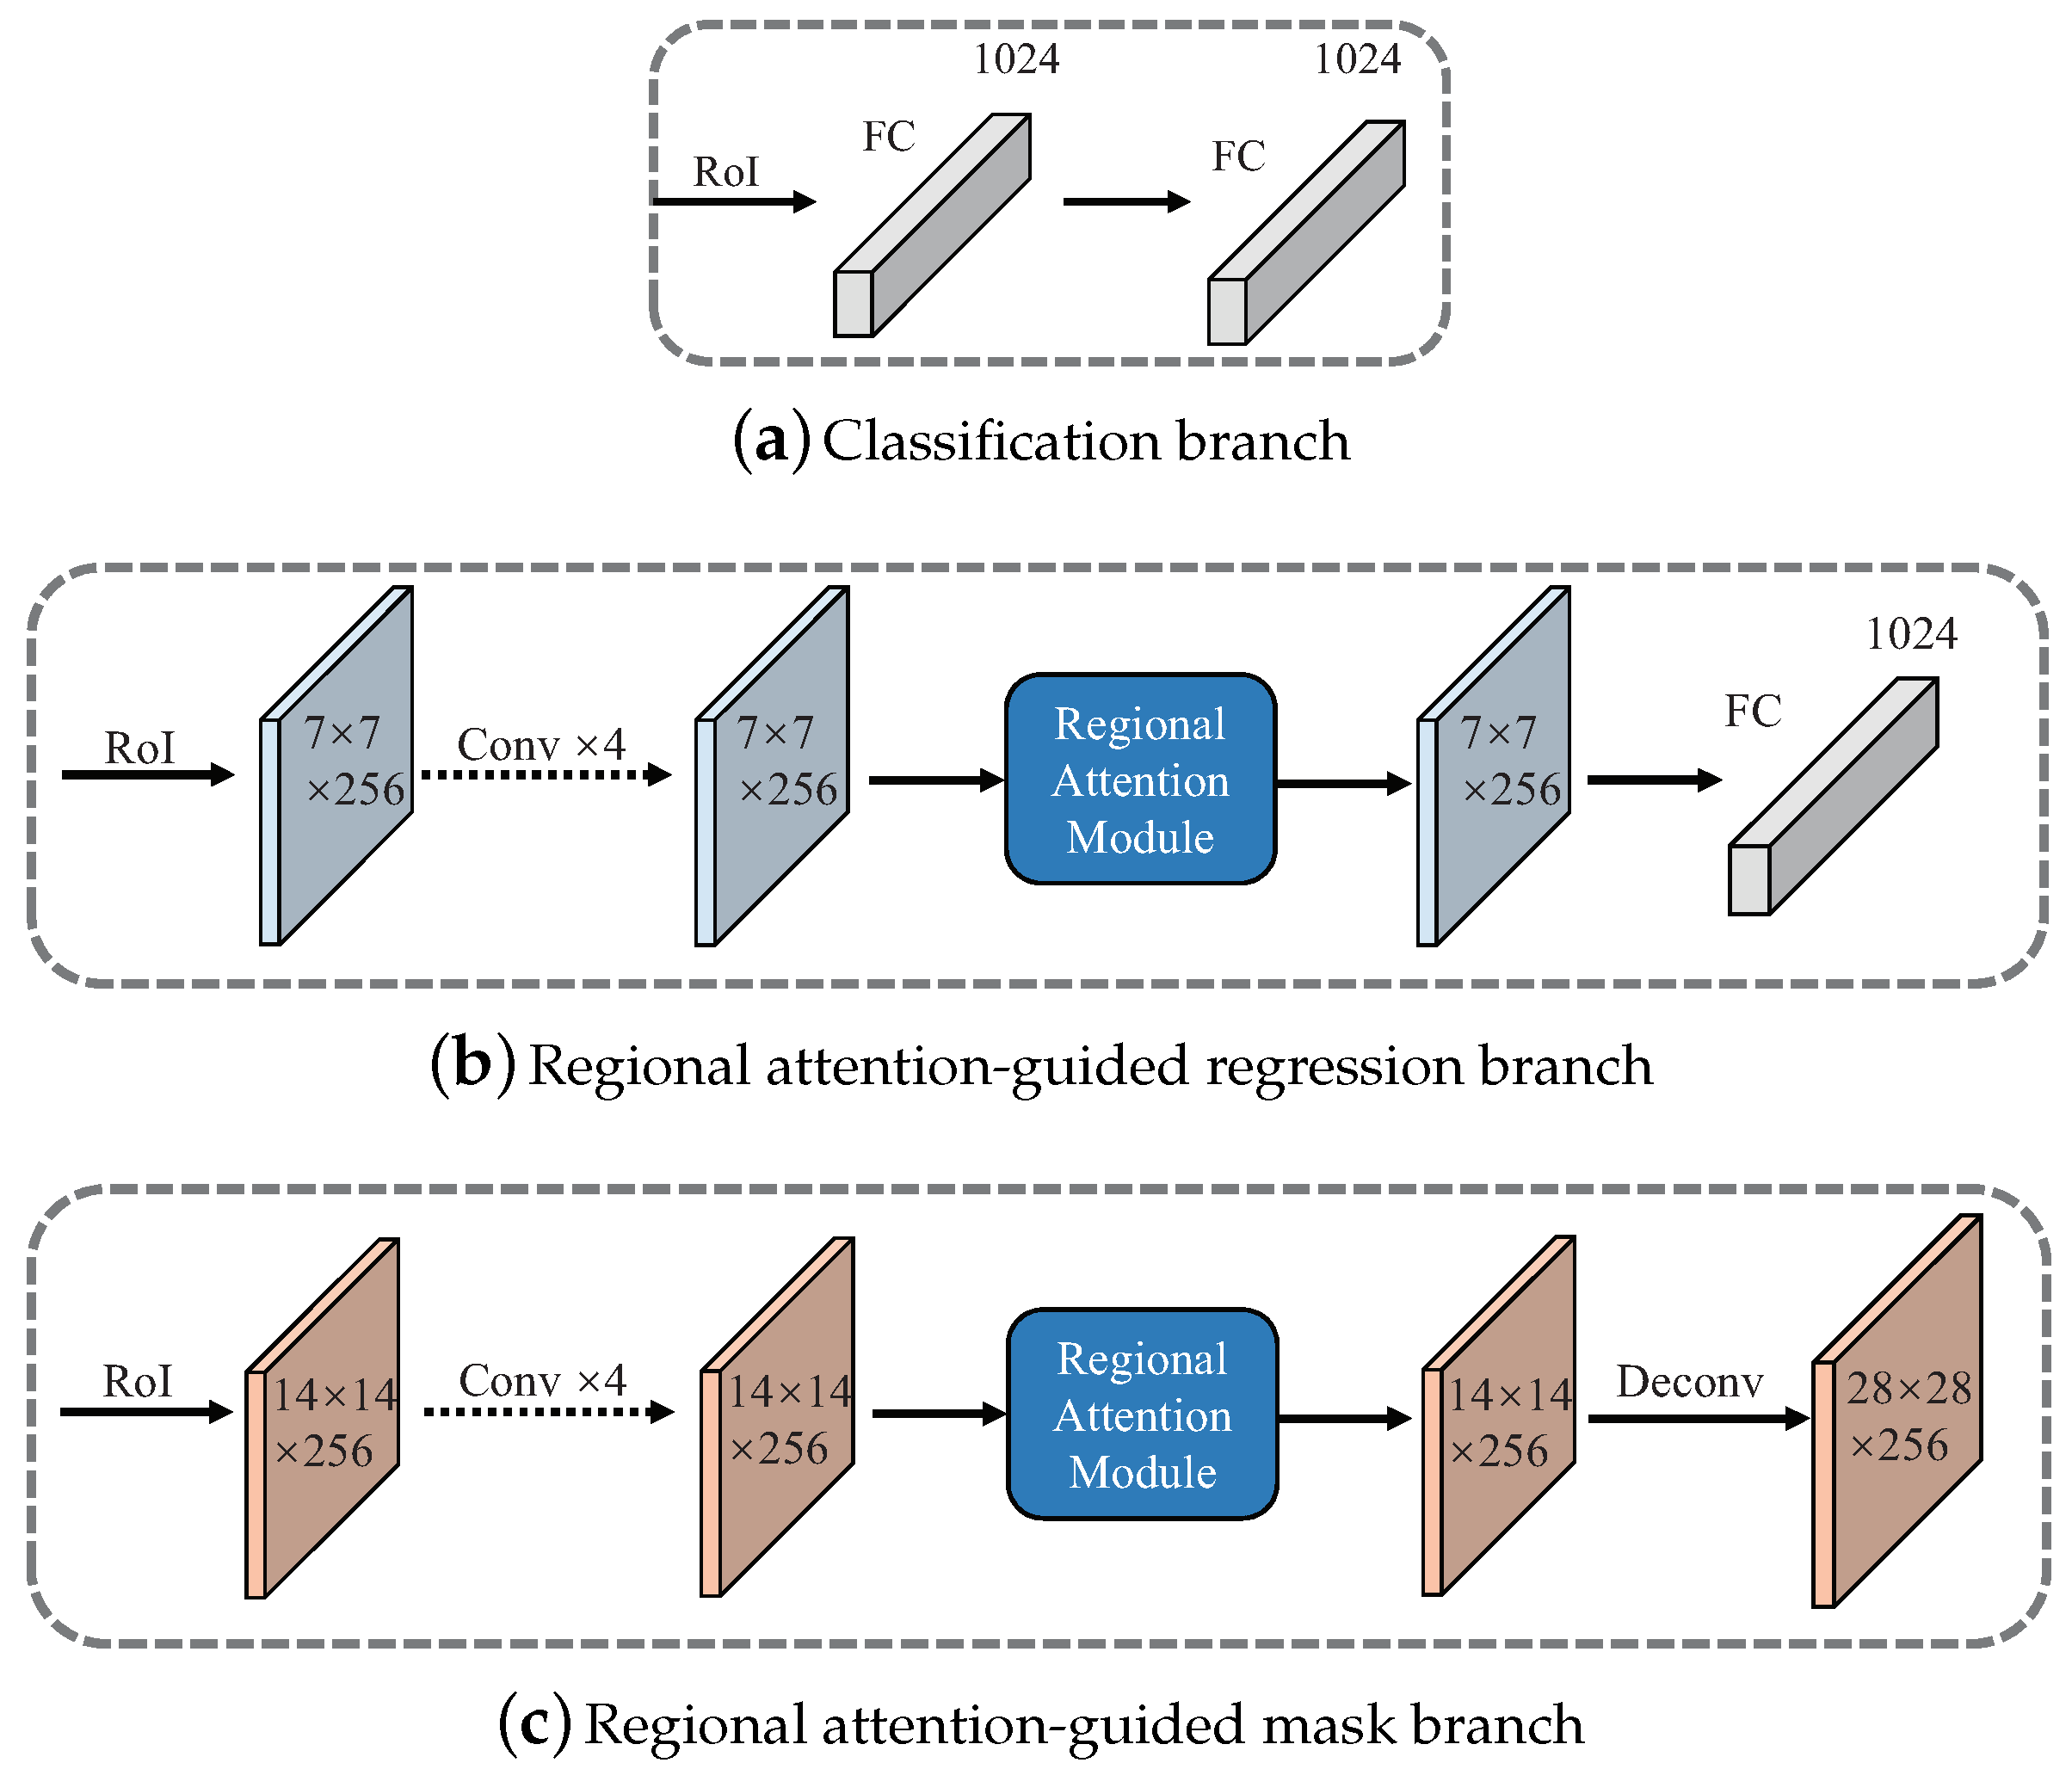
As shown in the right of Figure 4, RoIs firstly go through a RoIAlign [19] layer to do normalization resulting the fixed sizes. Then these RoIs with fixed sizes are sent to sub-net of head network respectively. Distinguished from the head network of Mask R-CNN [19], the proposed RATH-Net has three sub-networks working independently, including a classification branch, a regional attention-guided regression branch, and a regional attention-guided mask branch. The RAM and three branches of RATH-Net are described as follows.
4.2.1. Regional Attention Module
Attention mechanism has to play an increasingly important role in the computer vision field. Inspired by the self-attention mechanism [42,43,44], we design a Regional Attention Module (RAM) to spotlight meaningful pixels and suppress the background noise caused by occlusion.
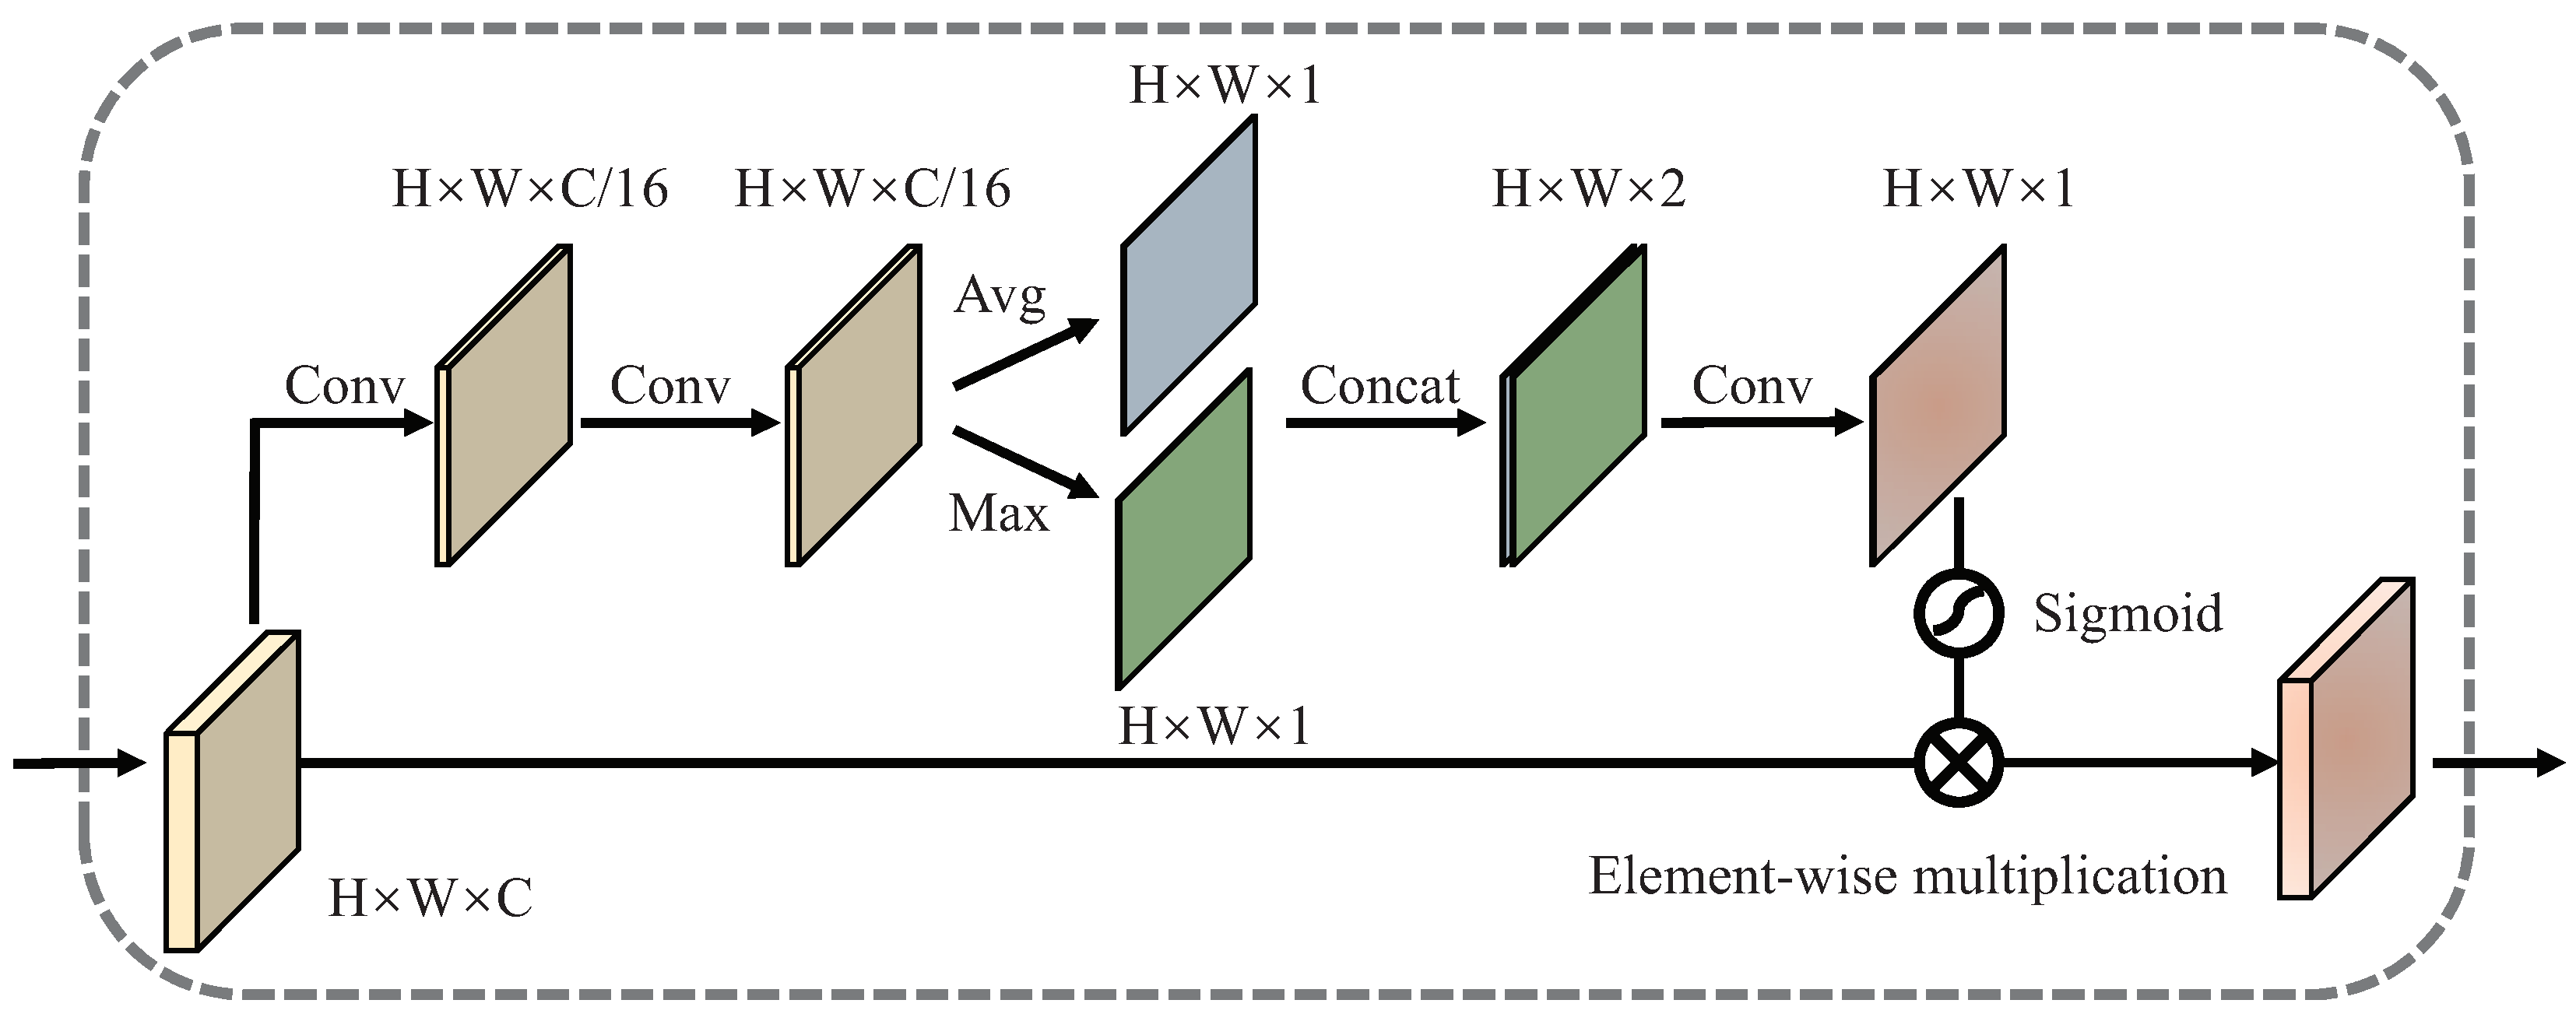
The structure of RAM is shown in Figure 7. Formally, given a feature map , the RAM first uses a convolutional layer to compress the feature map across the channel dimension. Then, a dilated convolutional layer is applied to utilize contextual information and get the feature maps . The computation process is summarized as follows.
where, represents a convolution operation, denotes a dilated convolution operation with a dilatation rate of 4.
Average pooling and max pooling operations are used to aggregate spatial information. We apply average pooling and max pooling operations respectively along the channel axis of to get , . After that, and are aggregated via concatenation. Then it is followed by a 3×3 convolutional layer and is normalized by the sigmoid function. The regional attention map is computed as:
where, denotes the sigmoid function, indicates a convolution operation with the filter size of , represents concatenate operation. Finally, the regional attention guided feature map is computed as:
where, ⊗ denotes element-wise multiplication.
4.2.2. Classification Branch
The classification branch is designed to classify and output probabilities for all object classes and the background class. As shown in Figure 8a, the classification branch mainly consists of two fully connected layers, with a 1024 dimension in each layer. Each RoI goes through these two connected fully connected layers, outputting probabilities p. The loss function for the classification head is the cross-entropy loss. For each RoI, the classification loss is defined as,
where, has classes, and a is the ground-truth class. p is computed by a softmax over the outputting of a fully connected layer.
4.2.3. Regional Attention-Guided Regression Branch
The regional attention-guided regression branch is designed to regress the detection regions and outputs parameterized coordinates of bounding boxes with the guide of RAM. The RAM module is described in Section 4.2.1.
As shown in Figure 8b, after RoI features are extracted by RoIAlign [19] with resolution, those features are fed into four convolutional layers and RAM sequentially. Then, a fully-connected layer is used to output predicted tuple. Like other common bounding box regression methods do [45], we define the bounding box regression loss over a tuple of true bounding-box regression targets for class , and a predicted tuple for class a.
and,
where, are the parameterized center coordinates, w and h are the parameterized width and height respectively.
4.2.4. Regional Attention-Guided Mask Branch
The regional attention-guided mask branch is used to predict a mask for each RoI with the guide of RAM. The RAM module is described in Section 4.2.1.
As we can see in Figure 8c, once features inside the predicted RoIs are extracted by RoIAlign layer with the size of , those features are fed into four convolutional layers and RAM sequentially. Then, a deconvolution upsamples the feature maps to resolution. After a per-pixel sigmoid, the loss function for the mask-head is the cross-entropy between the segmentation result and the corresponding ground-truth. For an RoI associated with ground-truth class a, is only defined on the a-th mask.
where, is the size of the mask, is the binary ground-truth mask and M is the estimated a-th mask.
In the end, we define the multi-task loss function on each RoI as,
where, , , are the weighted parameters that can be adjusted to various training requirements, revealing the emphasis between the object classification task, bounding box regression task and mask segmentation task in the current model.
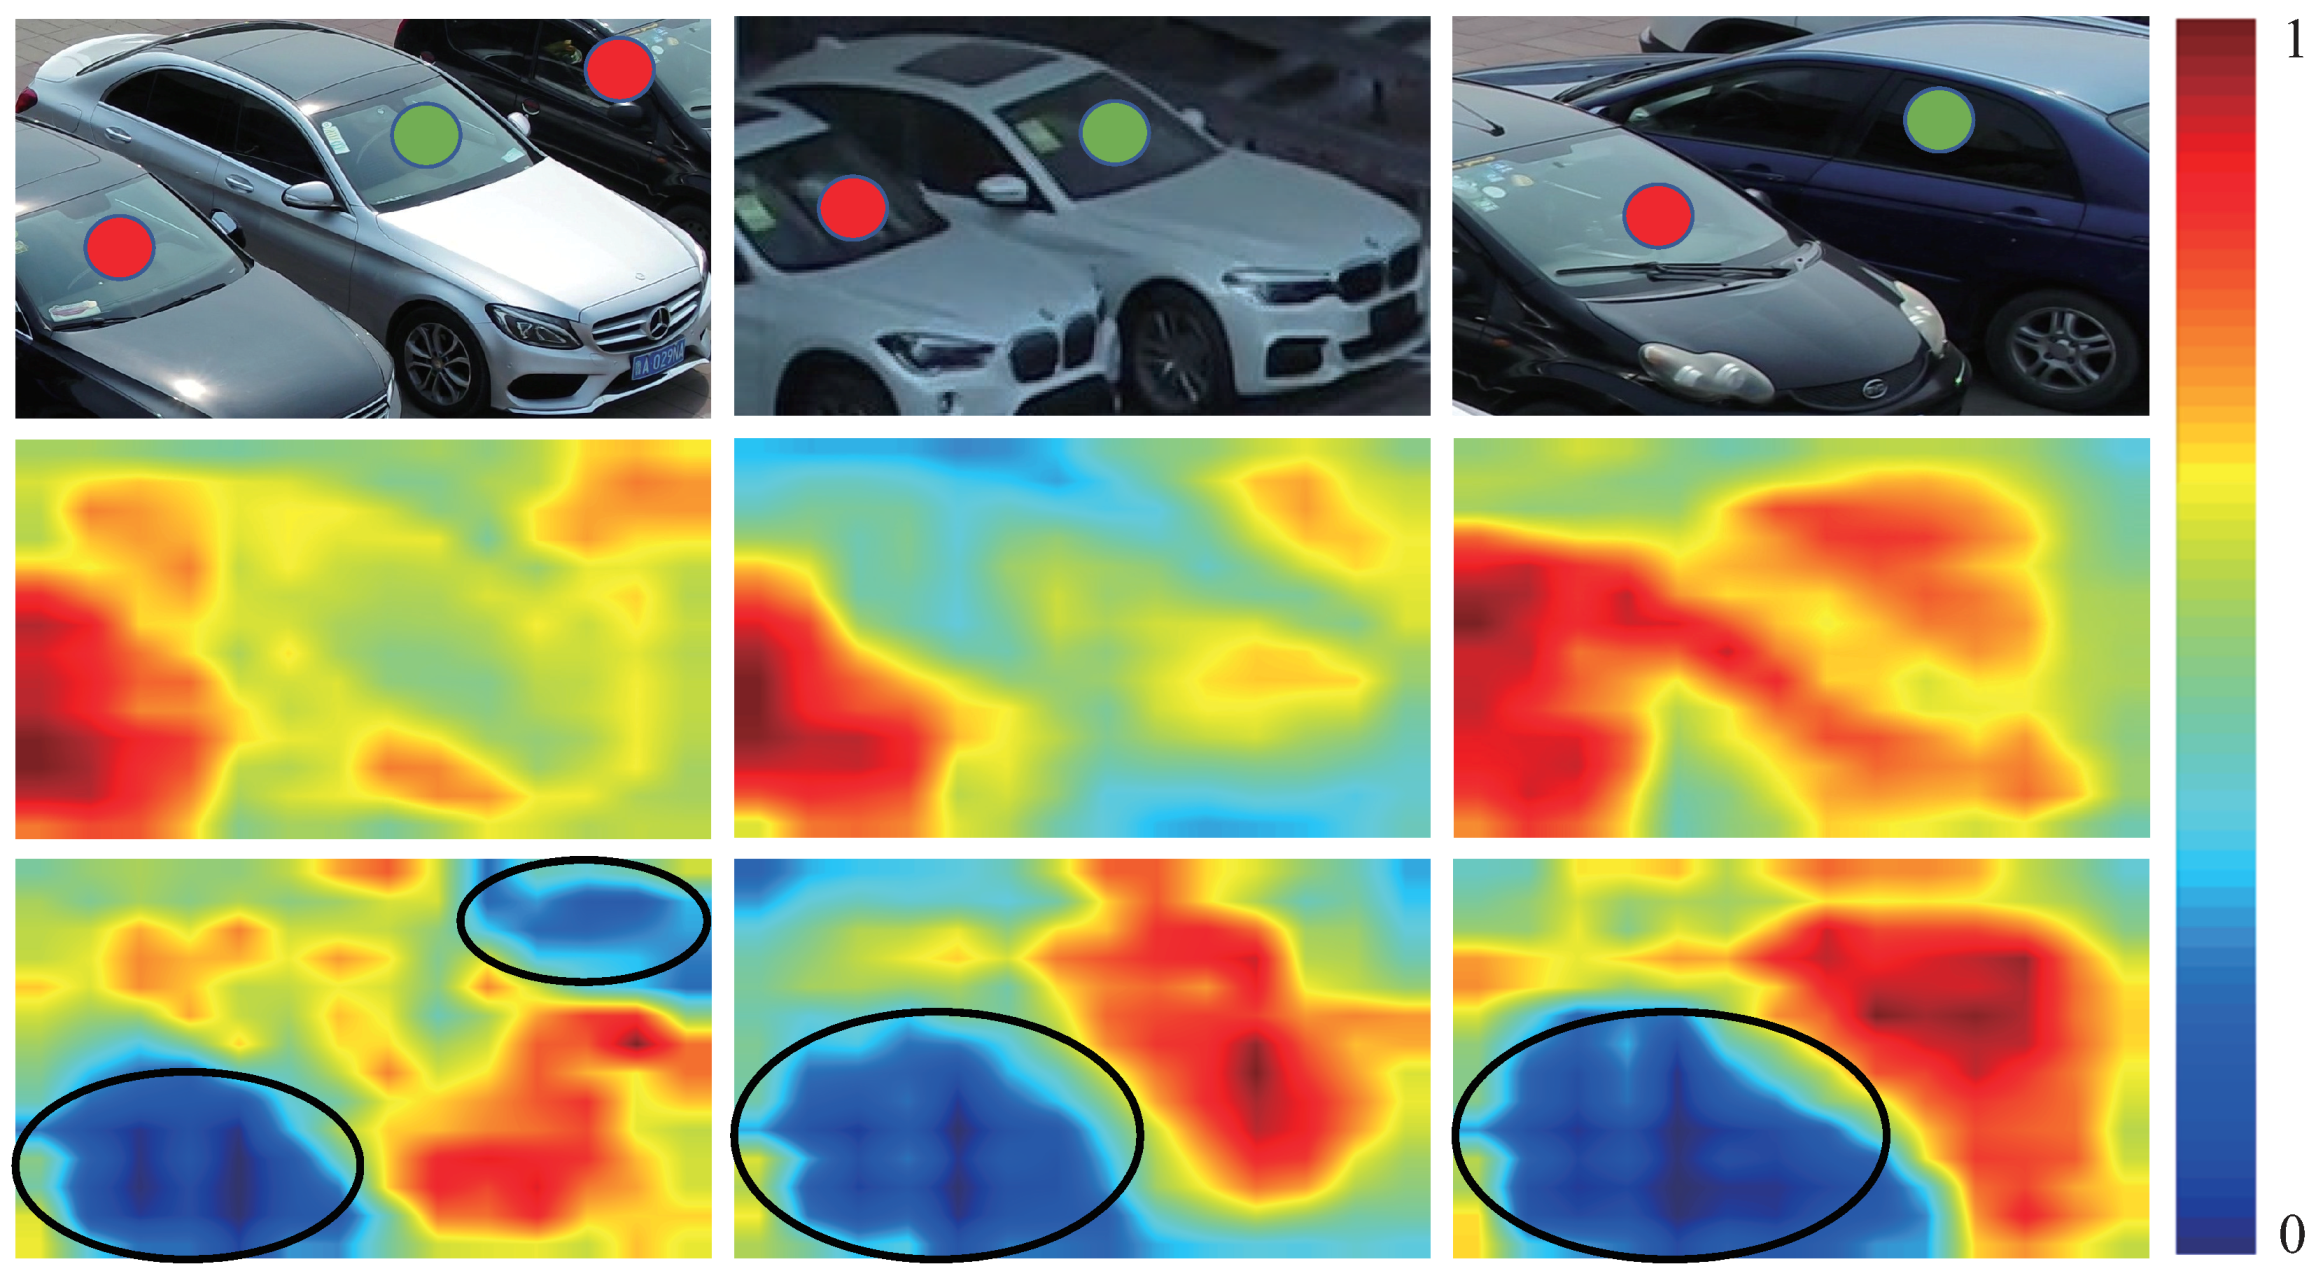
After dealing with three branches, the proposed RATH-Net can get detection and segmentation results. In Figure 9, we list some comparison results to show the advantage of our proposed RATH-Net. From Figure 9, we can see that original networks tend to focus more on meaningless vehicles (marked with a red circle). After the attention mechanism is introduced, the network pays more attention to the current foreground vehicle (marked with a green circle) and significantly suppresses the noise generated by the irrelevant vehicle.
5. Experiments
5.1. Dataset and Evaluation Metrics
The established UVSD dataset is used to evaluate our method. UVSD contains 5874 images and 98,600 vehicles, which is described in detail in Section 3. In our experiments, there are 3564 images for training, 585 images for validation and 1725 images for testing. The original vehicle samples and their marked samples in the UVSD dataset are shown in Figure 2.
The proposed MSOA-Net can perform both detection and segmentation. The evaluation methods for both detection and segmentation are needed. The different definitions of Intersection over Union (IoU) are the main differences between detection evaluation metrics and segmentation evaluation metrics.
IoU for bounding box based vehicle detection is defined as,
where, is the predicted bounding box, and is the ground-truth bounding box.
Different from the IoU definition in vehicle detection, the IoU in vehicle segmentation is performed over masks instead of boxes. The IoU for segmentation is to quantify the overlapping percentage between the ground-truth mask and prediction mask. Mask IoU is defined as,
where, is the predicted mask, is the ground-truth mask, means the number of pixels common between the ground-truth mask and the predicted mask, means the total number of pixels that present across both masks.
Precision and recall are used to evaluate our method. These parameters are calculated according to different IoU definitions of detection or segmentation. Precision is used to measure the prediction results, and recall is used to measure the quality of positive predictions. The precision and recall are defined as,
and,
where, indicates the true positive number, indicates the false positive number and indicates the false negative number. The average precision (AP) is used to measure the performance of an algorithm. AP is defined as,
where, R and P represent recall and precision, respectively, means the curve made up of P and R.
For the vehicle detection and segmentation problem, there is only one category. Hence, AP is equivalent to mean average precision (mAP). Here, AP denotes the AP value when the threshold of IoU is 0.50. In other words, if , the corresponding object is considered as a correct detection. According to the evaluation criteria in Microsoft COCO dataset [4], AP is the mean average at thresholds from 0.50 to 0.95 by steps of size 0.05. In this study, we use the same evaluation metrics of Microsoft COCO dataset. AP denotes the AP value performed on the detection task, and AP denotes the AP value performed on the segmentation task. The AP, AP and AP are the AP values of vehicles with small sizes (area < ), middle sizes ( < area < ) and large sizes (area > ). In this paper, the area of vehicle is measured as the number of pixels in the labeled segmentation mask.
5.2. Experimental Setup
Our method is coded with python based on PyTorch [46]. The main configuration of our platform is with an Intel i7-6800K CPU, 32 GB DDR4, NVIDIA TITAN-Xp graphics cards.
The backbone network architecture used in this study is ResNet-50 [41]. Without changing the aspect ratio, all the original images in the UVSD dataset are rescaled to or (where , ). If the length or width of the resized image is not a multiple of 32, we will fill the image until both sides are multiples of 32. The implementation details are described as follows. (1) Due to the limitation of the GPU memory, the batch size is set to 2. (2) Our net is trained on a single GPU for 24 epochs in total. (3) The initial learning rate is 0.0025 and is decreased by 0.1 at epoch 16 and 22. (4) We use a weight decay of 0.0001 and a momentum of 0.9. (5) The ratios of the weighted parameters are : : = 1 : 1 : 2. (6) No data augmentation is performed.
5.3. Evaluation of Our Segmentation Task
This experiment is designed to compare the performance of our method on segmentation and detection tasks, for the purpose of proving the hypothesis that compared with the detection methods, our method can effectively segment vehicles with arbitrary orientations and reject background.
To measure the performance of both the detection and segmentation tasks using the same criteria, we introduce a hybrid IoU . The is defined as,
where, is the predicted bounding box or mask; is the ground-truth of the object region. Similar to the definition of AP and AP in Section 5.1, AP represents the mAP value based on , which can measure detection performance and segmentation performance in the meantime; AP and AP denote the AP value when the threshold of IoU is 0.50 and 0.75 respectively; AP, AP and AP are the AP values of vehicles with small sizes, middle sizes and large sizes.
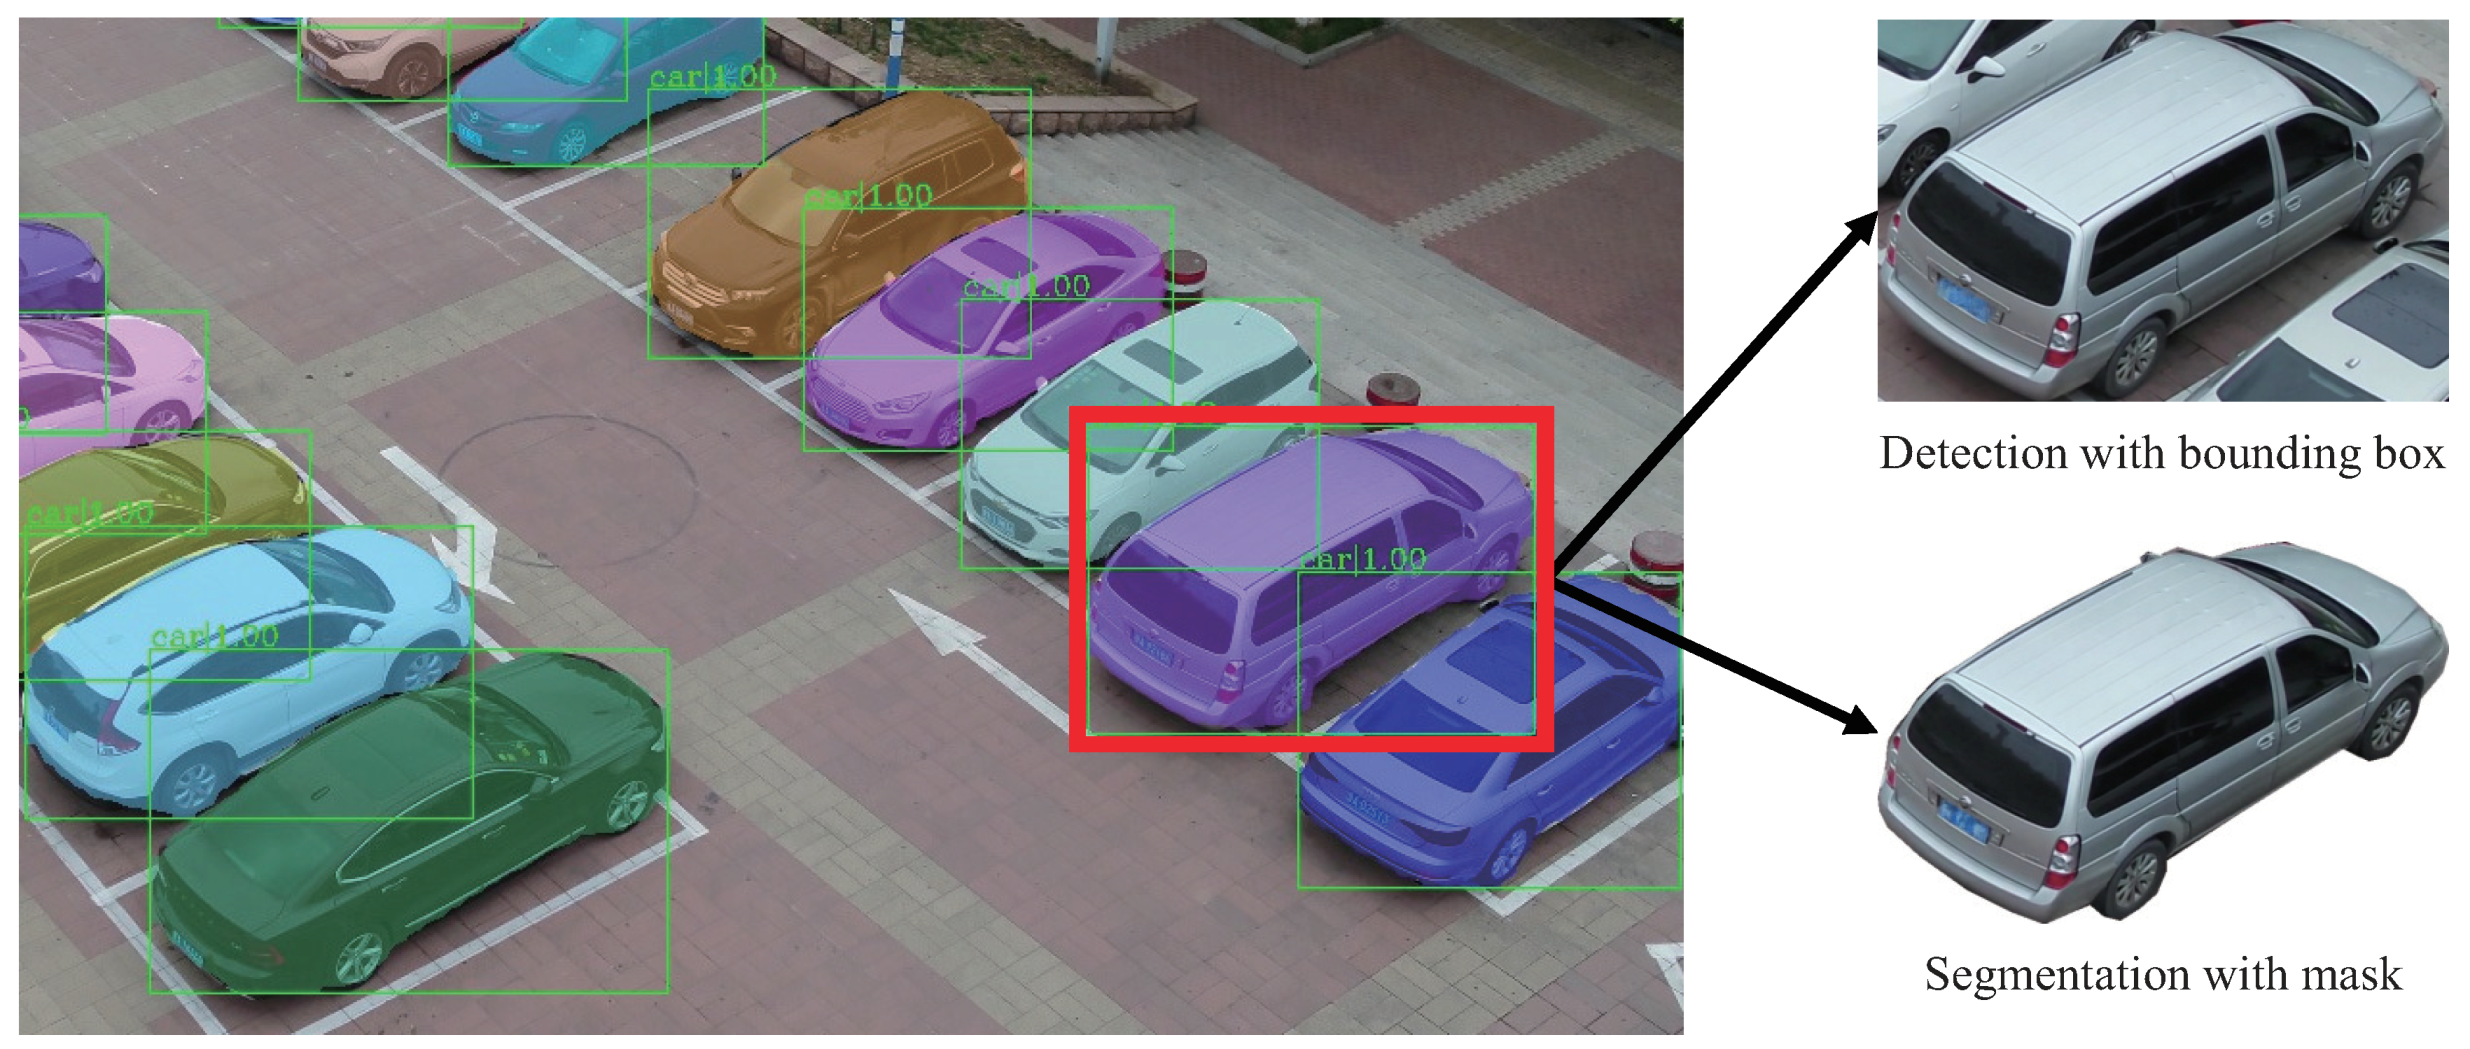
Table 1 shows the test results of our method using . It can be seen that the detection task only achieves 24.7% AP, which means that the bounding boxes of detection contain a large number of background pixels. The segmentation task can achieve 52.3% improvement under the AP indicator compared with detection task. Hence, the detection method can not accurately extract regions of vehicles with arbitrary orientations, and our segmentation method can extract vehicles more accurately. Figure 10 shows a comparison example of our vehicle segmentation and detection. In statistics, the average ratio of segmented masks and detection bounding boxes is in UVSD dataset.
5.4. Comparison with State-of-the-Art Methods
We compare the proposed method with state-of-the-art instance segmentation methods to evaluate that our method has a good segmentation and detection performance. The methods for comparison include YOLACT [23], YOLACT++ [47], EmbedMask [27], PolarMask [25], CenterMask [26], Mask R-CNN [19], Mask Scoring R-CNN (MS R-CNN) [21] and PANet [17]. For fair comparison, all compared methods use the same ResNet-50-FPN as backbone and trained 24 epochs on the training set of UVSD without data augmentation. Other parameters strictly remain the same as the default settings.
The vehicle segmentation and detection results on the test set of UVSD dataset are presented in Table 2. The best result is highlighted in bold.
From the results in Table 2, it can be seen that our method achieves the best results under different measures.
For segmentation task, our method achieves least 2.3% AP better than the other methods. With fixed and , our method achieves at least 1.0% AP and 2.1% AP, respectively better than the other methods. For vehicles at different scales, our method at least obtains 2.6% AP, 2.4% AP, 1.3% AP improvement on the small, medium and large scale vehicles, respectively compared with other methods.
For detection task, our method achieves at least 3.2% AP better than the other methods. With fixed and , our method achieves at least 0.2% AP and 2.8% AP respectively better than the other methods. For vehicles at different scales, our method at least obtains 3.0% AP, 3.5% AP, 2.2% AP improvement on the small, medium and large scale vehicles, respectively compared with other methods.
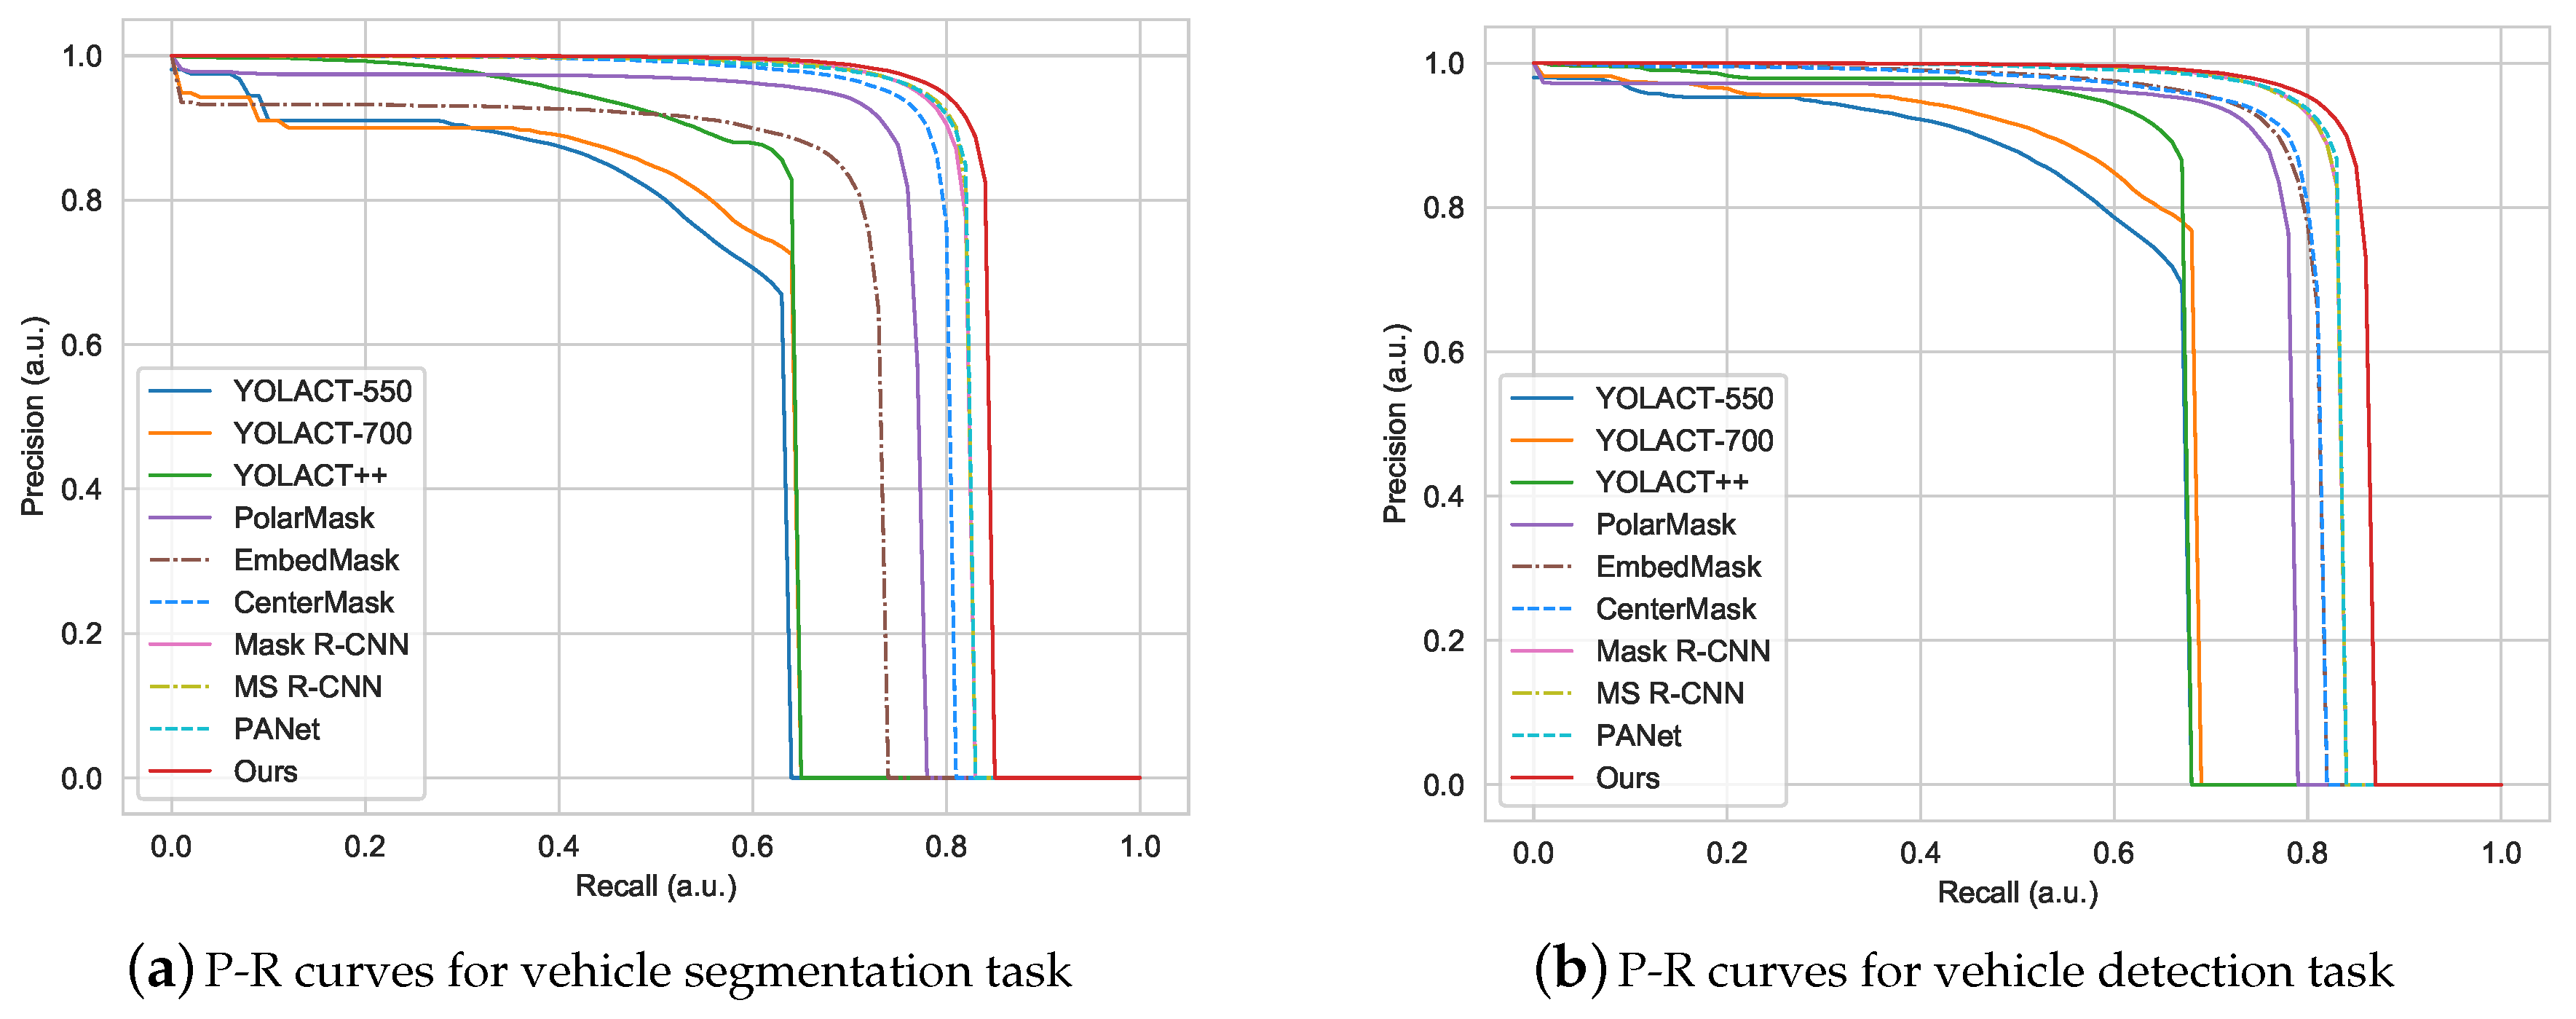
With fixed and , different recall and precision values can be obtained by changing the confidence score thresholds for segmentation and detection. The P-R curves of different methods for vehicle segmentation are plotted in Figure 11a. The P-R curves of different methods for vehicle detection are plotted in Figure 11b. The curve of our proposed method has a larger area than that of other methods in the segmentation task and the detection task. When the recall is specified, the precision of MSOA-Net is higher than other compared methods. When the precision value is given, the recall of MSOA-Net is higher than other compared methods. Hence, it can be concluded that the proposed MSOA-Net has better performance than other compared methods.
In our proposed method, MSFAF-Net aggregates multi-scale features by self-adaptive weights to enhance FPN which can better deal with huge scale changes; RATH-Net uses the regional attention module that we designed to guide the location-sensitive sub-networks to spotlight meaningful pixels and suppress background noise caused by occlusions. These reasons contribute to the result that our algorithm achieves better performance compared with general object segmentation methods on the UVSD dataset.
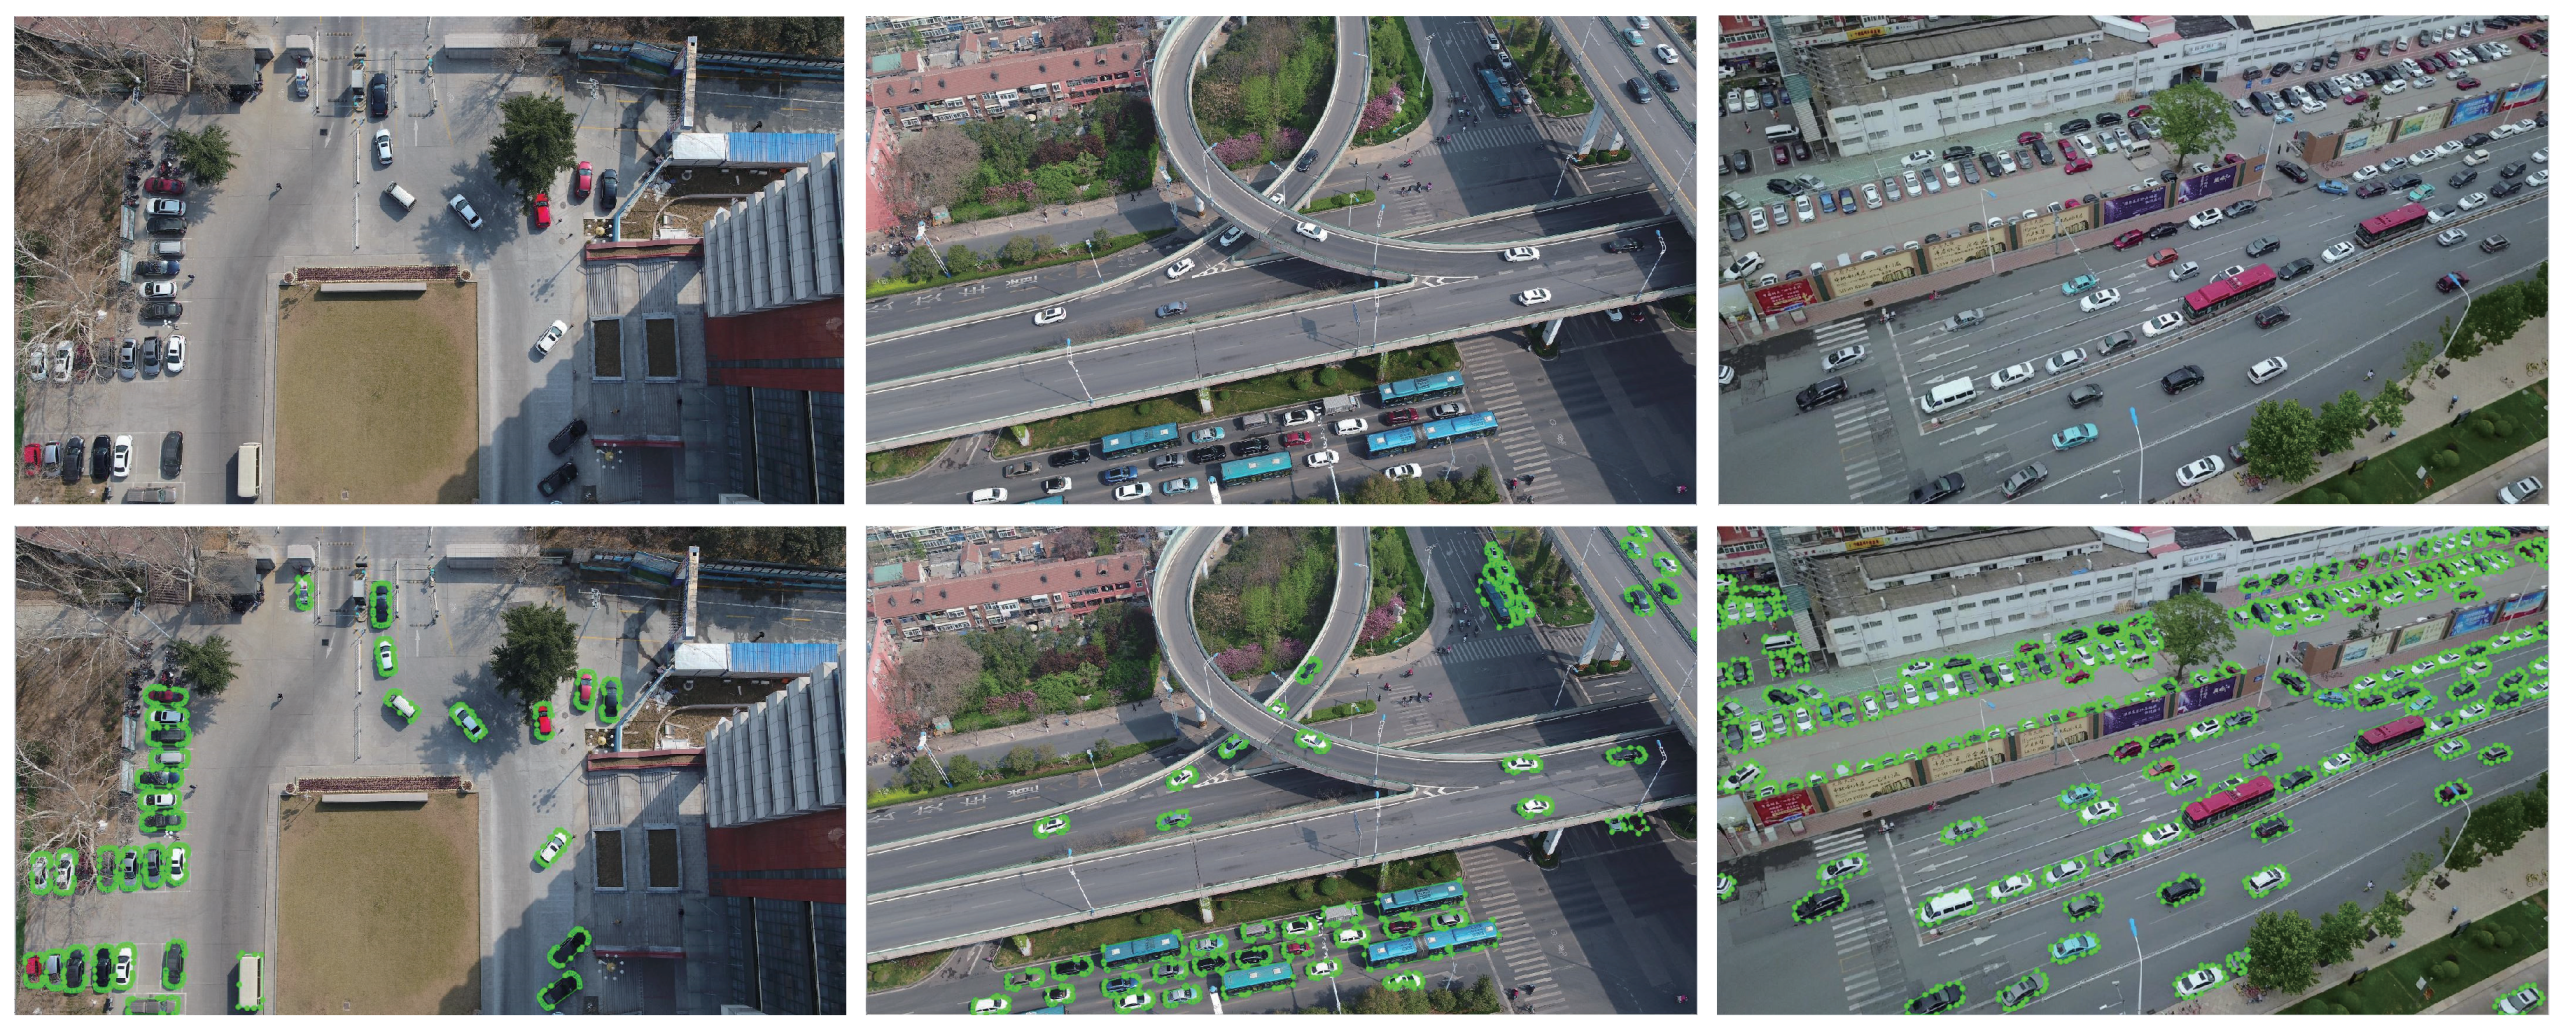
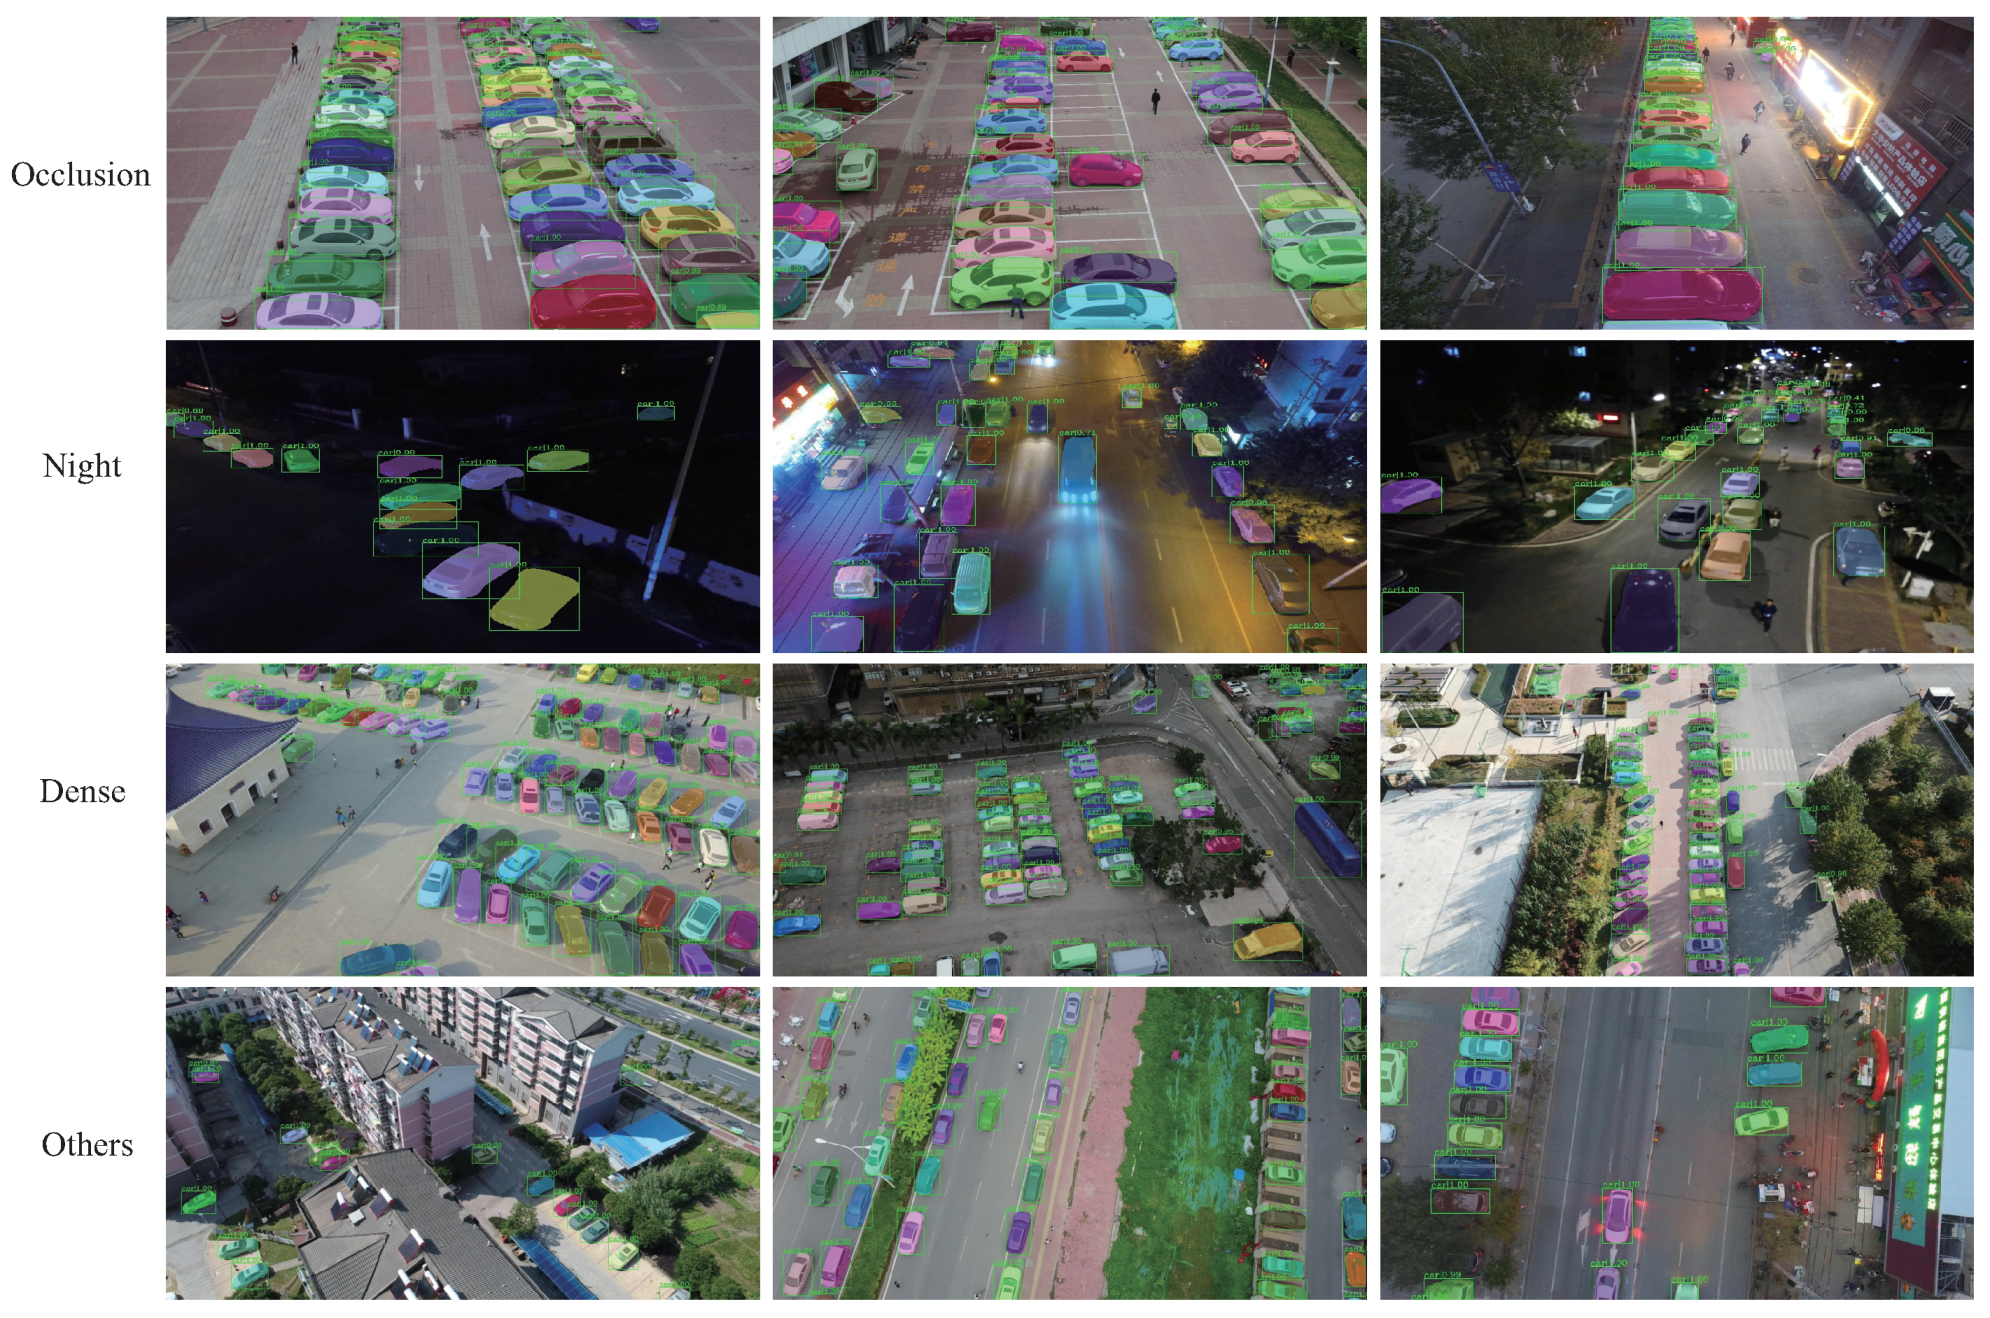
In Figure 12, we show some detection and segmentation results of our method on the images with different scenarios, which show that our methods can achieve good performance on different scenarios with occlusion, night, dense and others.
6. Discussion
6.1. Ablation Study
In this subsection, we evaluate the impact of each component of the proposed MSOA-Net on performance.
We perform an ablation study to identify the contributions of the proposed Multi-Scale Feature Adaptive Fusion Network (MSFAF-Net) and Regional Attention based Triple Head Network (RATH-Net) over the UVSD dataset. Among them, RATH-Net is divided into two parts including Triple-Head Network (TH-Net) and Regional Attention Module (RAM).
All models trained on the training set of UVSD and were evaluated on the testing set of UVSD. We use AP and AP as the indicator of model performance. To ensure the fairness and accuracy of the experiment, all parameters that do not involve improvement are strictly consistent. In addition, we fix the random seeds in the program to eliminate the randomness of the result. Table 3 summarizes the experimental results of the ablation study on the UVSD dataset. A detailed comparison is given in the following.
Baseline setup. Mask R-CNN [19] without other components is used as the baseline of the ablation experiments. ResNet-50-FPN is used as the backbone network in all experiments. As Table 3 shows, the baseline gets 74.3% AP and 74.7% AP performance in our implementation.
Effect of MSFAF-Net. As discussed in Section 4.1, the MSFAF-Net is designed to better handle large scale variations in aerial images. Through the experimental results in Table 3, we can observe that the use of MSFAF-Net can help FPN achieve 0.5% AP and 0.6% AP improvement. Results in small, medium and large scales are consistently improved. The improvement of vehicles with small scale is significant. Results on small scale achieve 1.0% AP and 1.6% AP improvement. To further prove the effectiveness of our method, we compared our method with PAFPN [17] which adds a bottom-up pathway to enhance FPN. As shown in Table 4, we can see that apart from the AP indicator, our method performs better than PAFPN. These results prove that our method can help FPN better cope with scale changes.
Effect of RATH-Net. In this part, we consider the impact of the two proposed components included in RATH-Net, respectively.
TH-Net is the multi-task head network that we re-design without regional attention network. Table 3 shows TH-Net gains 1.4% AP and 1.8% AP improvement. This means the subnets that work independently in the head network can perform multi-task better than the shared convolutional layers. Table 5 summarizes TH-Net performance with different ratios of weighted parameters. Compared with setting the same weights for each task, increasing the segmentation task weight can significantly improve the algorithm performance. Therefore, the ratio of the weighted parameters , and of the multi-task loss is to set to 1:1:2.
RAM module adopts self-attention mechanism that can guide the head network focus on the region of interest which can effectively reduce the effect of occlusion. As can be seen from Table 3, RAM yields 0.8% AP and 1.1% AP improvement. This proves regional attention module can boost network performance in the segmentation task and detection task by suppressing the effects of occlusion.
6.2. Failure Cases
Although our algorithm has achieved the-state-of-the-art performance in the UVSD dataset, there are still some failure cases.
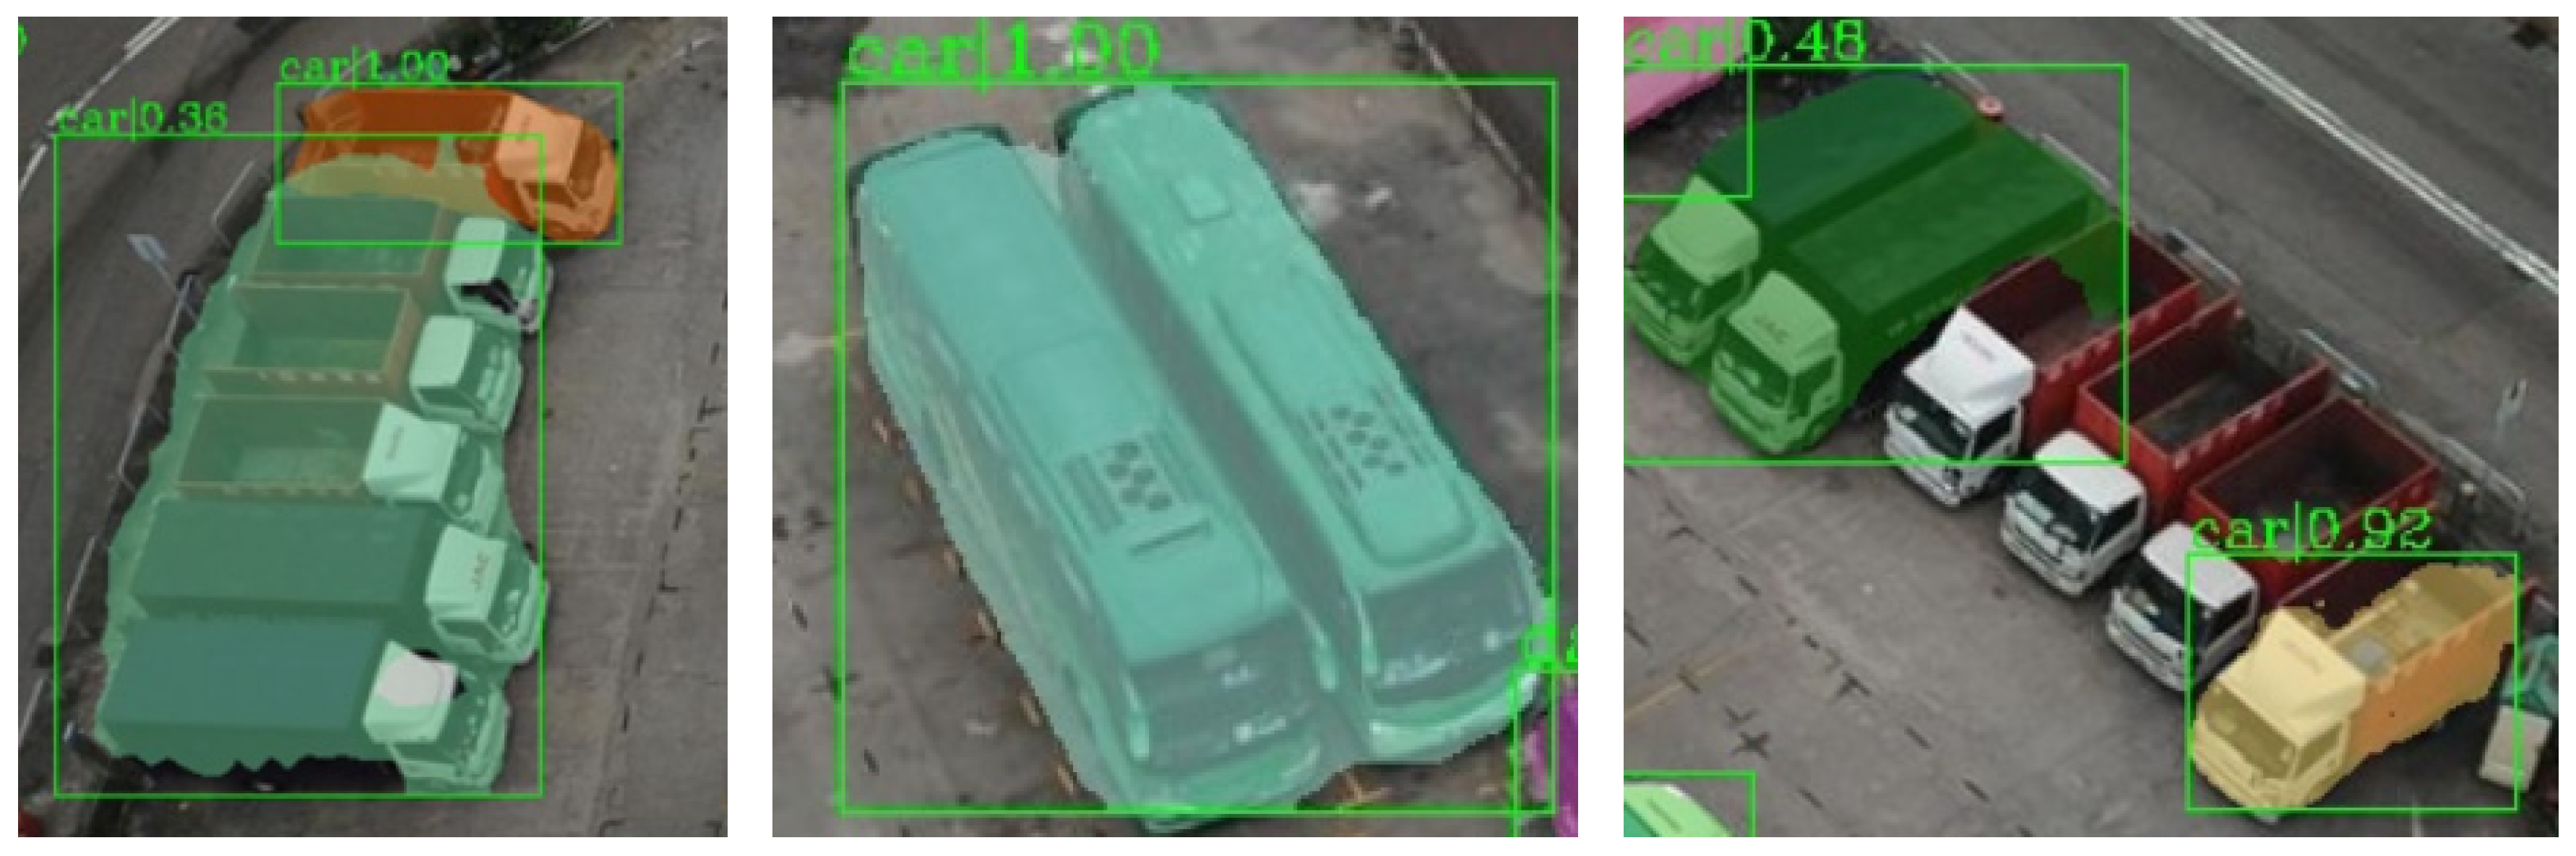
In Figure 13, we list some typical failure predictions of our method. As shown in Figure 13, our method misses some vehicles and mistakenly treats the detected closely adjacent vehicles as a whole. One possible reason for this case is that these vehicles such as trucks and buses rarely appear in the training set of UVSD. In the meantime, these crowded vehicles have similar appearance features. If more training samples are provided, the detection and segmentation can still be performed hopefully.
In the future research, we will try different tricks to solve this problem such as data augmentation [48,49] and online hard sample mining [50]. In addition, we annotate all vehicles as the same category in the UVSD dataset. We will update the dataset to provide more detailed vehicle categories in future work. After that, we can adjust the training strategy or loss functions according to the difference in the number of different types of vehicles [51].
7. Conclusions
In this research, a new vehicle segmentation method called Multi-Scale and Occlusion Aware Network (MSOA-Net) is proposed to better deal with the problems when detecting vehicles with arbitrary orientations, huge scale variations and occlusion in UAV aerial images. Firstly, we design a multi-scale feature adaptive fusion network that can adaptively integrate multiple scales features to help FPN better deal with huge scale variations. Secondly, we propose a regional attention based head network to reduce the effects of occlusion in vehicle segmentation and regression tasks. To promote the development of drone-based computer vision, we release the public UVSD dataset for vehicle segmentation and detection, which is the first public instance segmentation dataset for UAV-captured vehicles. Experiments are conducted on the challenging UVSD dataset with different attitudes, different altitudes and occlusions. The results show that the proposed method is efficient in detecting and segmenting vehicles, and outperforms the compared methods. In the future, we aim to further improve the generalization ability of our method and increase the dataset to contain more scenarios. We hope our proposed algorithm and dataset can inspire more researchers to work on computer vision tasks based on drones.
Author Contributions
Data curation, W.Z. and C.L.; investigation, F.C. and Y.S.; methodology, W.Z. and C.L.; writing—original draft, W.Z. and C.L.; writing—review and editing, F.C. and Y.S. All authors have read and agreed to the published version of the manuscript.
Funding
This work was supported by the National Key R&D Program of China (2018YFB1305300), the National Nature Science Foundation of China (61703240, 61673244), and the Key R&D projects of Shandong province of China (2019JZZY010130, 2018CXGC0907).
Conflicts of Interest
The authors declare no conflict of interest.
References
- Kanistras, K.; Martins, G.; Rutherford, M.J.; Valavanis, K.P. A survey of unmanned aerial vehicles (UAVs) for traffic monitoring. In Proceedings of the International Conference on Unmanned Aircraft Systems (ICUAS), Atlanta, GA, USA, 28–31 May 2013; pp. 221–234. [Google Scholar]
- Zhu, P.; Wen, L.; Bian, X.; Ling, H.; Hu, Q. Vision meets drones: A challenge. arXiv 2018, arXiv:1804.07437. [Google Scholar]
- Everingham, M.; Van Gool, L.; Williams, C.K.; Winn, J.; Zisserman, A. The Pascal Visual Object Classes (VOC) challenge. Int. J. Comput. Vis. 2010, 88, 303–338. [Google Scholar] [CrossRef] [Green Version]
- Lin, T.Y.; Maire, M.; Belongie, S.; Hays, J.; Perona, P.; Ramanan, D.; Dollár, P.; Zitnick, C.L. Microsoft coco: Common objects in context. In Proceedings of the European Conference on Computer Vision (ECCV), Zurich, Switzerland, 6–12 September 2014; pp. 740–755. [Google Scholar]
- Ren, S.; He, K.; Girshick, R.; Sun, J. Faster r-cnn: Towards real-time object detection with region proposal networks. In Proceedings of the Advances in Neural Information Processing Systems (NeurIPS), Vancouver, BC, Canada, 8–14 December 2015; pp. 91–99. [Google Scholar]
- Lu, X.; Li, B.; Yue, Y.; Li, Q.; Yan, J. Grid R-CNN. In Proceedings of the IEEE Conference on Computer Vision and Pattern Recognition (CVPR), Long Beach, CA, USA, 16–20 June 2019; pp. 7363–7372. [Google Scholar]
- Li, Z.; Peng, C.; Yu, G.; Zhang, X.; Deng, Y.; Sun, J. Light-Head R-CNN: In Defense of Two-Stage Object Detector. arXiv 2017, arXiv:1711.07264. [Google Scholar]
- Redmon, J.; Divvala, S.; Girshick, R.; Farhadi, A. You only look once: Unified, real-time object detection. In Proceedings of the IEEE conference on computer vision and pattern recognition (CVPR), Las Vegas, NV, USA, 27–30 June 2016; pp. 779–788. [Google Scholar]
- Tian, Z.; Shen, C.; Chen, H.; He, T. Fcos: Fully convolutional one-stage object detection. In Proceedings of the IEEE International Conference on Computer Vision (ICCV), Seoul, Korea, 27 October–2 November 2019; pp. 9626–9635. [Google Scholar]
- Jiang, Y.; Zhu, X.; Wang, X.; Yang, S.; Li, W.; Wang, H.; Fu, P.; Luo, Z. R2cnn: Rotational region cnn for orientation robust scene text detection. arXiv 2017, arXiv:1706.09579. [Google Scholar]
- Ma, J.; Shao, W.; Ye, H.; Wang, L.; Wang, H.; Zheng, Y.; Xue, X. Arbitrary-oriented scene text detection via rotation proposals. IEEE Trans. Multimed. 2018, 20, 3111–3122. [Google Scholar] [CrossRef] [Green Version]
- Yang, X.; Sun, H.; Fu, K.; Yang, J.; Sun, X.; Yan, M.; Guo, Z. Automatic Ship Detection in Remote Sensing Images from Google Earth of Complex Scenes Based on Multiscale Rotation Dense Feature Pyramid Networks. Remote Sens. 2018, 10, 132. [Google Scholar] [CrossRef] [Green Version]
- Xia, G.; Bai, X.; Ding, J.; Zhu, Z.; Belongie, S.J.; Luo, J.; Datcu, M.; Pelillo, M.; Zhang, L. DOTA: A Large-Scale Dataset for Object Detection in Aerial Images. In Proceedings of the IEEE Conference on Computer Vision and Pattern Recognition (CVPR), Salt Lake City, UT, USA, 18–22 June 2018; pp. 3974–3983. [Google Scholar]
- Wang, P.; Jiao, B.; Yang, L.; Yang, Y.; Zhang, S.; Wei, W.; Zhang, Y. Vehicle Re-Identification in Aerial Imagery: Dataset and Approach. In Proceedings of the IEEE International Conference on Computer Vision (ICCV), Seoul, Korea, 27 October–2 November 2019; pp. 460–469. [Google Scholar]
- Wang, J.; Ding, J.; Guo, H.; Cheng, W.; Pan, T.; Yang, W. Mask OBB: A Semantic Attention-Based Mask Oriented Bounding Box Representation for Multi-Category Object Detection in Aerial Images. Remote Sens. 2019, 11, 2930. [Google Scholar] [CrossRef] [Green Version]
- Lin, T.Y.; Dollár, P.; Girshick, R.; He, K.; Hariharan, B.; Belongie, S. Feature pyramid networks for object detection. In Proceedings of the IEEE Conference on Computer Vision and Pattern Recognition (CVPR), Honolulu, HI, USA, 21–26 July 2017; pp. 2117–2125. [Google Scholar]
- Liu, S.; Qi, L.; Qin, H.; Shi, J.; Jia, J. Path aggregation network for instance segmentation. In Proceedings of the IEEE Conference on Computer Vision and Pattern Recognition (CVPR), Salt Lake City, UT, USA, 18–22 June 2018; pp. 8759–8768. [Google Scholar]
- Liang, T.; Wang, Y.; Zhao, Q.; Zhang, H.; Tang, Z.; Ling, H. MFPN: A Novel Mixture Feature Pyramid Network of Multiple Architectures for Object Detection. arXiv 2019, arXiv:1912.09748. [Google Scholar]
- He, K.; Gkioxari, G.; Dollár, P.; Girshick, R. Mask r-cnn. In Proceedings of the IEEE international conference on computer vision (ICCV), Venice, Italy, 22–29 October 2017; pp. 2961–2969. [Google Scholar]
- Liu, C.; Guo, Y.; Li, S.; Chang, F. ACFBased Region Proposal Extraction for YOLOv3 Network Towards High-Performance Cyclist Detection in High Resolution Images. Sensors 2019, 19, 2671. [Google Scholar] [CrossRef] [Green Version]
- Huang, Z.; Huang, L.; Gong, Y.; Huang, C.; Wang, X. Mask scoring r-cnn. In Proceedings of the IEEE Conference on Computer Vision and Pattern Recognition (CVPR), Long Beach, CA, USA, 16–20 June 2019; pp. 6409–6418. [Google Scholar]
- Chen, X.; Girshick, R.B.; He, K.; Dollár, P. TensorMask: A Foundation for Dense Object Segmentation. In Proceedings of the IEEE International Conference on Computer Vision (ICCV), Seoul, Korea, 27 October–2 November 2019; pp. 2061–2069. [Google Scholar]
- Bolya, D.; Zhou, C.; Xiao, F.; Lee, Y.J. YOLACT: Real-time instance segmentation. In Proceedings of the IEEE International Conference on Computer Vision (ICCV), Seoul, Korea, 27 October–2 November 2019; pp. 9157–9166. [Google Scholar]
- Wang, X.; Kong, T.; Shen, C.; Jiang, Y.; Li, L. SOLO: Segmenting Objects by Locations. arXiv 2019, arXiv:1912.04488. [Google Scholar]
- Xie, E.; Sun, P.; Song, X.; Wang, W.; Liu, X.; Liang, D.; Shen, C.; Luo, P. PolarMask: Single Shot Instance Segmentation with Polar Representation. arXiv 2019, arXiv:1909.13226. [Google Scholar]
- Lee, Y.; Park, J. CenterMask: Real-Time Anchor-Free Instance Segmentation. arXiv 2019, arXiv:1911.06667. [Google Scholar]
- Ying, H.; Huang, Z.; Liu, S.; Shao, T.; Zhou, K. EmbedMask: Embedding Coupling for One-stage Instance Segmentation. arXiv 2019, arXiv:1912.01954. [Google Scholar]
- Miyoshi, G.T.; Arruda, M.S.; Osco, L.P.; Marcato Junior, J.; Gonçalves, D.N.; Imai, N.N.; Tommaselli, A.M.G.; Honkavaara, E.; Gonçalves, W.N. A Novel Deep Learning Method to Identify Single Tree Species in UAV-Based Hyperspectral Images. Remote Sens. 2020, 12, 1294. [Google Scholar] [CrossRef] [Green Version]
- Bozcan, I.; Kayacan, E. AU-AIR: A Multi-modal Unmanned Aerial Vehicle Dataset for Low Altitude Traffic Surveillance. arXiv 2020, arXiv:2001.11737. [Google Scholar]
- Hsieh, M.R.; Lin, Y.L.; Hsu, W.H. Drone-based object counting by spatially regularized regional proposal network. In Proceedings of the IEEE International Conference on Computer Vision (ICCV), Venice, Italy, 22–29 October 2017; pp. 4145–4153. [Google Scholar]
- Robicquet, A.; Sadeghian, A.; Alahi, A.; Savarese, S. Learning social etiquette: Human trajectory understanding in crowded scenes. In Proceedings of the European Conference on Computer Vision (ECCV), Amsterdam, The Netherlands, 8–16 October 2016; pp. 549–565. [Google Scholar]
- Mueller, M.; Smith, N.; Ghanem, B. A benchmark and simulator for uav tracking. In Proceedings of the European Conference on Computer Vision (ECCV), Amsterdam, The Netherlands, 8–16 October 2016; pp. 445–461. [Google Scholar]
- Du, D.; Qi, Y.; Yu, H.; Yang, Y.; Duan, K.; Li, G.; Zhang, W.; Huang, Q.; Tian, Q. The unmanned aerial vehicle benchmark: Object detection and tracking. In Proceedings of the European Conference on Computer Vision (ECCV), Munich, Germany, 8–14 September 2018; pp. 375–391. [Google Scholar]
- Barekatain, M.; Martí, M.; Shih, H.; Murray, S.; Nakayama, K.; Matsuo, Y.; Prendinger, H. Okutama-Action: An Aerial View Video Dataset for Concurrent Human Action Detection. In Proceedings of the IEEE Conference on Computer Vision and Pattern Recognition Workshops, Honolulu, HI, USA, 21–26 July 2017; pp. 2153–2160. [Google Scholar]
- Li, S.; Yeung, D.Y. Visual object tracking for unmanned aerial vehicles: A benchmark and new motion models. In Proceedings of the Thirty-First AAAI Conference on Artificial Intelligence, San Francisco, CA, USA, 4–9 February 2017; pp. 4140–4146. [Google Scholar]
- DJI Matrice 200. Available online: https://www.dji.com/be/matrice-200-series (accessed on 21 May 2020).
- Yang, X.; Yang, J.; Yan, J.; Zhang, Y.; Zhang, T.; Guo, Z.; Sun, X.; Fu, K. SCRDet: Towards More Robust Detection for Small, Cluttered and Rotated Objects. In Proceedings of the IEEE International Conference on Computer Vision (ICCV), Seoul, Korea, 27 October–2 November 2019; pp. 8231–8240. [Google Scholar]
- Wang, P.; Sun, X.; Diao, W.; Fu, K. FMSSD: Feature-Merged Single-Shot Detection for Multiscale Objects in Large-Scale Remote Sensing Imagery. IEEE Trans. Geosci. Remote Sens. 2020, 58, 3377–3390. [Google Scholar] [CrossRef]
- Liu, C.; Chang, F. Hybrid Cascade Structure for License Plate Detection in Large Visual Surveillance Scenes. IEEE Trans. Intell. Transp. Syst. 2019, 20, 2122–2135. [Google Scholar] [CrossRef]
- Qiu, H.; Li, H.; Wu, Q.; Meng, F.; Ngan, K.N.; Shi, H. A2RMNet: Adaptively Aspect Ratio Multi-Scale Network for Object Detection in Remote Sensing Images. Remote Sens. 2019, 11, 1594. [Google Scholar] [CrossRef] [Green Version]
- He, K.; Zhang, X.; Ren, S.; Sun, J. Deep residual learning for image recognition. In Proceedings of the IEEE Conference on Computer Vision and Pattern Recognition (CVPR), Las Vegas, NV, USA, 26 June–1 July 2016; pp. 770–778. [Google Scholar]
- Jie, H.; Li, S.; Gang, S. Squeeze-and-Excitation Networks. In Proceedings of the IEEE Conference on Computer Vision and Pattern Recognition (CVPR), Salt Lake City, UT, USA, 18–22 June 2018; pp. 7132–7141. [Google Scholar]
- Wang, X.; Girshick, R.; Gupta, A.; He, K. Non-local Neural Networks. In Proceedings of the IEEE Conference on Computer Vision and Pattern Recognition (CVPR), Salt Lake City, UT, USA, 18–22 June 2018; pp. 7794–7803. [Google Scholar]
- Woo, S.; Park, J.; Lee, J.Y.; Kweon, I.S. CBAM: Convolutional Block Attention Module. In Proceedings of the European Conference on Computer Vision (ECCV), Munich, Germany, 8–14 September 2018; pp. 3–19. [Google Scholar]
- Girshick, R. Fast r-cnn. In Proceedings of the IEEE International Conference on Computer Vision (ICCV), Santiago, Chile, 13–15 December 2015; pp. 1440–1448. [Google Scholar]
- Paszke, A.; Gross, S.; Massa, F.; Lerer, A.; Bradbury, J.; Chanan, G.; Killeen, T.; Lin, Z.; Gimelshein, N.; Antiga, L.; et al. PyTorch: An imperative style, high-performance deep learning library. In Proceedings of the Advances in Neural Information Processing Systems (NeurIPS), Vancouver, BC, Canada, 8–14 December 2019; pp. 8024–8035. [Google Scholar]
- Bolya, D.; Zhou, C.; Xiao, F.; Lee, Y.J. YOLACT++: Better Real-time Instance Segmentation. arXiv 2019, arXiv:1912.06218. [Google Scholar]
- Milz, S.; Rüdiger, T.; Süss, S. Aerial GANeration: Towards Realistic Data Augmentation Using Conditional GANs. In Proceedings of the European Conference on Computer Vision (ECCV), Munich, Germany, 8–14 September 2018; pp. 59–72. [Google Scholar]
- Hong, S.; Kang, S.; Cho, D. Patch-Level Augmentation for Object Detection in Aerial Images. In Proceedings of the IEEE International Conference on Computer Vision (ICCV), Seoul, Korea, 27 October–2 November 2019; pp. 127–134. [Google Scholar]
- Shrivastava, A.; Gupta, A.; Girshick, R. Training region-based object detectors with online hard example mining. In Proceedings of the IEEE Conference on Computer Vision and Pattern Recognition (CVPR), Las Vegas, NV, USA, 27–30 June 2016; pp. 761–769. [Google Scholar]
- Fu, K.; Chen, Z.; Zhang, Y.; Sun, X. Enhanced Feature Representation in Detection for Optical Remote Sensing Images. Remote Sens. 2019, 11, 2095. [Google Scholar] [CrossRef] [Green Version]
Figure 1.
Schematic diagram of different methods. (a) Horizontal bounding box (HBB) based method. (b) Orientated bounding box (OBB) based method. (c) Our mask based segmentation method.
Figure 1.
Schematic diagram of different methods. (a) Horizontal bounding box (HBB) based method. (b) Orientated bounding box (OBB) based method. (c) Our mask based segmentation method.

Figure 2.
The original vehicle samples and their marked samples in the Unmanned Aerial Vehicle (UAV) based vehicle segmentation dataset (UVSD) dataset.
Figure 2.
The original vehicle samples and their marked samples in the Unmanned Aerial Vehicle (UAV) based vehicle segmentation dataset (UVSD) dataset.

Figure 3.
Airborne platform. (a) DJI matrice 200 quadcopter. (b) Zenmuse X5S gimbal and camera.

Figure 4.
Workflow chart of the proposed Multi-Scale and Occlusion Aware Network (MSOA-Net). The MSOA-Net consists of two parts: Multi-scale feature adaptive fusion network and Regional attention based triple head network. SAFFM is the proposed Self-Adaptive Feature Fusion Module, which is described in Section 4.1.1. RPN is the Region Proposal Network, which is described in Section 4.1.2. RAM is the proposed Regional Attention Module, which is described in Section 4.2.1.

Figure 5.
The network structure diagram of the Self-Adaptive Feature Fusion Module (SAFFM).

Figure 6.
Visualization of features. The first row feature maps are the outputs of Feature Pyramid Network (FPN). The second row feature maps are the outputs of Multi-Scale Feature Adaptive Fusion Network (MSFAF-Net). As we can see from the figures, the feature maps contain richer discriminable information than , especially at low-levels and high level .

Figure 7.
The network structure diagram of the Regional Attention Module (RAM).

Figure 8.
The structure of the Regional Attention based Triple Head Network. (a) The structure of classification branch. (b) The structure of regional attention-guided regression branch. (c) The structure of regional attention-guided mask branch.
Figure 8.
The structure of the Regional Attention based Triple Head Network. (a) The structure of classification branch. (b) The structure of regional attention-guided regression branch. (c) The structure of regional attention-guided mask branch.

Figure 9.
Comparison of the heat maps of regions of interest (RoIs) produced by different methods. First row: RoIs produced by region proposal network. Second row: Heat maps of RoIs produced by our network without attention module. Third row: Heat maps of RoIs produced by our network with attention module. The green circle marks the vehicle to be detected (foreground), and the red circle marks the vehicle that is not concerned (background).

Figure 10.
Comparison of our vehicle segmentation and detection. For this vehicle, approximately region in the bounding box is from the background, whereas the region in the mask contains almost no background.
Figure 10.
Comparison of our vehicle segmentation and detection. For this vehicle, approximately region in the bounding box is from the background, whereas the region in the mask contains almost no background.

Figure 11.
The Precision and Recall (P-R) curves of different methods on the UVSD dataset.

Figure 12.
Some detection and segmentation results of our method on the images with different scenarios including occlusion, night, density and others. First row: Detection and segmentation results in occluded scenes. Second row: Detection and segmentation results in night scenes. Third row: Detection and segmentation results in dense scenes. Fourth row: Detection and segmentation results in other scenes.

Figure 13.
Some typical failure predictions of our method.


Table 1.
Comparison of our vehicle detection and segmentation with hybrid IoU indicator. AP represents the mAP value based on . Subscripts 50 and 75 indicate that the threshold value of hybrid IoU is set to 0.50 and 0.75, respectively. Subscripts S, M and L refer to small, medium and large vehicles, respectively. The bold numbers represent the best results.
| Method | AP | AP | AP | AP | AP | AP |
|---|---|---|---|---|---|---|
| Ours (detection) | 24.7 | 82.4 | 4.9 | 16.8 | 26.0 | 26.7 |
| Ours (segmentation) | 77.0 | 91.5 | 83.3 | 32.8 | 65.4 | 93.1 |
Table 2.
Comparisons with state-of-the-art methods over the test set of UVSD. AP and AP denote mAP of bounding box and mAP of mask, respectively. Subscripts 50 and 75 indicate that the threshold value of IoU is set to 0.50 and 0.75, respectively. Subscripts S, M and L refer to small, medium and large vehicles, respectively.
| Method | AP | AP | AP | AP | AP | AP | AP | AP | AP | AP | AP | AP |
|---|---|---|---|---|---|---|---|---|---|---|---|---|
| YOLACT-550 [23] | 50.3 | 74.6 | 55.1 | 5.3 | 38.3 | 69.7 | 53.4 | 81.1 | 61.0 | 14.4 | 43.9 | 68.8 |
| YOLACT-700 [23] | 51.5 | 73.4 | 56.4 | 6.1 | 41.5 | 69.8 | 55.3 | 78.6 | 63.5 | 14.9 | 45.8 | 71.3 |
| YOLACT++ [47] | 55.7 | 72.2 | 61.6 | 2.1 | 37.5 | 78.0 | 55.5 | 74.8 | 65.5 | 5.0 | 43.4 | 74.8 |
| EmbedMask [27] | 62.0 | 88.1 | 66.9 | 20.0 | 54.3 | 76.6 | 72.3 | 92.1 | 79.0 | 29.2 | 61.7 | 88.6 |
| PolarMask [25] | 64.8 | 87.5 | 74.1 | 15.0 | 55.2 | 83.8 | 67.7 | 89.2 | 75.1 | 20.4 | 57.2 | 86.7 |
| CenterMask [26] | 72.7 | 88.1 | 78.9 | 23.3 | 59.5 | 91.8 | 71.7 | 88.9 | 79.1 | 27.4 | 60.6 | 88.6 |
| Mask R-CNN [19] | 74.3 | 90.4 | 81.2 | 28.7 | 62.8 | 90.9 | 74.7 | 91.4 | 82.2 | 33.4 | 64.5 | 89.5 |
| MS R-CNN [21] | 74.4 | 90.2 | 81.2 | 28.9 | 63.0 | 90.5 | 74.9 | 91.4 | 82.3 | 33.9 | 64.5 | 89.8 |
| PANet [17] | 74.7 | 90.5 | 81.2 | 30.2 | 61.5 | 91.8 | 75.0 | 90.6 | 82.3 | 35.6 | 63.5 | 90.3 |
| Ours | 77.0 | 91.5 | 83.3 | 32.8 | 65.4 | 93.1 | 78.2 | 92.3 | 85.1 | 38.6 | 68.0 | 92.5 |
Table 3.
Ablation study of each component in our proposed method on UVSD. MSFAF-Net is the multi-scale feature adaptive fusion network. TH-Net is the triple-head network. RAM is the regional attention module. AP and AP denote mAP of bounding box and mAP of mask, respectively. Subscripts S, M and L refer to small, medium and large vehicles, respectively. The bold numbers represent the best results.
| Baseline | MSFAF-Net | TH-Net | RAM | AP | AP | AP | AP | AP | AP | AP | AP |
|---|---|---|---|---|---|---|---|---|---|---|---|
| ✓ | 74.3 | 28.7 | 62.8 | 90.9 | 74.7 | 33.4 | 64.5 | 89.5 | |||
| ✓ | ✓ | 74.8 | 29.7 | 63.1 | 91.4 | 75.3 | 35.0 | 64.7 | 90.3 | ||
| ✓ | ✓ | ✓ | 76.2 | 31.8 | 64.6 | 92.7 | 77.1 | 37.5 | 66.8 | 92.2 | |
| ✓ | ✓ | ✓ | ✓ | 77.0 | 32.8 | 65.4 | 93.1 | 78.2 | 38.6 | 68.0 | 92.5 |
Table 4.
Comparisons between different FPN structure on UVSD. AP and AP denote mAP of bounding box and mAP of mask, respectively. Subscripts S, M and L refer to small, medium and large vehicles, respectively. The bold numbers represent the best results.
Table 4.
Comparisons between different FPN structure on UVSD. AP and AP denote mAP of bounding box and mAP of mask, respectively. Subscripts S, M and L refer to small, medium and large vehicles, respectively. The bold numbers represent the best results.
| Method | AP | AP | AP | AP | AP | AP | AP | AP |
|---|---|---|---|---|---|---|---|---|
| FPN [16] | 74.3 | 28.7 | 62.8 | 90.9 | 74.7 | 33.4 | 64.5 | 89.5 |
| PAFPN [17] | 74.5 | 29.3 | 63.2 | 91.0 | 74.8 | 34.1 | 64.5 | 89.7 |
| MSFAF-Net | 74.8 | 29.7 | 63.1 | 91.4 | 75.3 | 35.0 | 64.7 | 90.3 |
Table 5.
Performance evaluation with different ratios of weighted parameters. AP and AP denote mAP of bounding box and mAP of mask, respectively. The bold numbers represent the best results.
Table 5.
Performance evaluation with different ratios of weighted parameters. AP and AP denote mAP of bounding box and mAP of mask, respectively. The bold numbers represent the best results.
| Ratios of Weighted Parameters | AP | AP |
|---|---|---|
| : : = 2 : 2 : 1 | 75.5 | 77.0 |
| : : = 1 : 2 : 2 | 75.9 | 76.9 |
| : : = 1 : 1 : 1 | 76.0 | 77.0 |
| : : = 1 : 1 : 2 | 76.2 | 77.1 |
© 2020 by the authors. Licensee MDPI, Basel, Switzerland. This article is an open access article distributed under the terms and conditions of the Creative Commons Attribution (CC BY) license (http://creativecommons.org/licenses/by/4.0/).
Share and Cite
MDPI and ACS Style
Zhang, W.; Liu, C.; Chang, F.; Song, Y. Multi-Scale and Occlusion Aware Network for Vehicle Detection and Segmentation on UAV Aerial Images. Remote Sens. 2020, 12, 1760. https://0-doi-org.brum.beds.ac.uk/10.3390/rs12111760
AMA Style
Zhang W, Liu C, Chang F, Song Y. Multi-Scale and Occlusion Aware Network for Vehicle Detection and Segmentation on UAV Aerial Images. Remote Sensing. 2020; 12(11):1760. https://0-doi-org.brum.beds.ac.uk/10.3390/rs12111760
Chicago/Turabian StyleZhang, Wang, Chunsheng Liu, Faliang Chang, and Ye Song. 2020. "Multi-Scale and Occlusion Aware Network for Vehicle Detection and Segmentation on UAV Aerial Images" Remote Sensing 12, no. 11: 1760. https://0-doi-org.brum.beds.ac.uk/10.3390/rs12111760
Note that from the first issue of 2016, this journal uses article numbers instead of page numbers. See further details here.