Article

Fusion Approach for Remotely-Sensed Mapping of Agriculture (FARMA): A Scalable Open Source Method for Land Cover Monitoring Using Data Fusion

1
Earth System Science Interdisciplinary Center (ESSIC), University of Maryland, College Park, MD 20742, USA
2
Biospheric Sciences, NASA Goddard Space Flight Center, Greenbelt, MD 20771, USA
3
Computational and Information Sciences and Technology Office, NASA Goddard Space Flight Center, Greenbelt, MD 20771, USA
4
Department of Geography, Miami University, Oxford, OH 45056, USA
5
Department of Geography and Earth Sciences, Aberystwyth University, Aberystwyth SY23 3FL, UK
*
Author to whom correspondence should be addressed.
Remote Sens. 2020, 12(20), 3459; https://0-doi-org.brum.beds.ac.uk/10.3390/rs12203459
Submission received: 4 September 2020 / Revised: 6 October 2020 / Accepted: 18 October 2020 / Published: 21 October 2020

Abstract

:
The increasing availability of very-high resolution (VHR; <2 m) imagery has the potential to enable agricultural monitoring at increased resolution and cadence, particularly when used in combination with widely available moderate-resolution imagery. However, scaling limitations exist at the regional level due to big data volumes and processing constraints. Here, we demonstrate the Fusion Approach for Remotely-Sensed Mapping of Agriculture (FARMA), using a suite of open source software capable of efficiently characterizing time-series field-scale statistics across large geographical areas at VHR resolution. We provide distinct implementation examples in Vietnam and Senegal to demonstrate the approach using WorldView VHR optical, Sentinel-1 Synthetic Aperture Radar, and Sentinel-2 and Sentinel-3 optical imagery. This distributed software is open source and entirely scalable, enabling large area mapping even with modest computing power. FARMA provides the ability to extract and monitor sub-hectare fields with multisensor raster signals, which previously could only be achieved at scale with large computational resources. Implementing FARMA could enhance predictive yield models by delineating boundaries and tracking productivity of smallholder fields, enabling more precise food security observations in low and lower-middle income countries.

Graphical Abstract

1. Introduction

An effective means of monitoring agriculture in sub-hectare (smallholder) fields is critical for maintaining global food security, to ensure that it can meet the challenges of a changing climate and population increases [1,2]. By 2050, global populations are expected to increase by 2.25 billion to a total of 9 billion, which will drive a 60% increase in demand [3] on agricultural resources, including food and derived products such as materials and biofuels [4]. Agriculture is particularly sensitive to changes in climate, but failures to keep local temperatures from increasing by more than 2 C are expected to result in losses in aggregate production of wheat, rice, and maize in both tropical and temperate regions [5]. Conversely, the successful implementation of crop-level adaptations, including appropriate planting date, fertilizer use, irrigation, and cultivar adjustment, may lead to an increase in some yields by as much as 15% [5]. To successfully monitor changes in yield and implement positive crop-level adaptations requires an effective method of future agriculture monitoring.
However, a need for current accurate agriculture monitoring already exists. In sub-Saharan Africa, insufficient food security has been observed for decades in this region, yet it continues to persist. In 2017, 23.2% (236.5 million) of the population in sub-Saharan Africa faced undernourishment, reducing only slightly from 24.3% (176.7 million) in 2005. In contrast, <2.5% of the population of North America and Europe faced food insecurity and undernourishment during the same period [6]. Mapping and monitoring agriculture is crucial for understanding people’s access to food, particularly in regions where crops provide food calories for as much as 90% of the population (e.g., South Asia) [7] from crop fields <5 ha in size. Smallholder farmers in Southeast Asia, particularly in the Mekong River region, are increasingly concerned about the role of climate change in disrupting livelihoods and require field-level policies for management and technological intervention [8].
Remote sensing is an unparalleled tool for achieving agriculture mapping and monitoring across landscape scales and a number of initiatives, such as the Group on Earth Observations Global Agricultural Monitoring (GEOGLAM), use this technology at the forefront of their ability to assess yields, production, crop types, and potential risks to agriculture. This has predominantly been achieved by low (>250 m) to moderate (>10–250 m) resolution optical imagery due to data availability from MODIS and Landsat [9,10,11], which have been successfully used for retrieving maps across large geographical areas [12]. Cloud cover is a persistent issue in this imagery [13] and thus temporal resolution is compromised by insufficient data while the coarse spatial resolution of these sensors in comparison to smallholder agricultural crops is detrimental to achieving detailed mapping.
Sensors with denser temporal archives, such as radar instruments which are not susceptible to cloud cover, have increased the temporal resolution of some analyses across large geographical areas. Early use of SAR for this landscape-scale mapping of agriculture utilized sensors with coarse spatial resolution (150 m) [14] in comparison to currently available sensors, thus limiting the analysis of local scale detail. This has improved with the increased availability of higher-resolution imagery, such as ESA’s Sentinel-1 and Sentinel-2 sensors, which are routinely and publicly available in cloud-based processing platforms such as the Google Earth Engine [15] and Amazon Web Services. This access to finer spatial resolution remote sensing data has facilitated the generation of high spatial resolution maps and the retrieval of temporal trend information at the Mekong Delta scale [16,17]. While numerous studies have used Sentinel-1 to map rice production [14,16,18,19,20], these approaches have not been able to achieve the spatial detail required for the management of field-level policies, which are afforded by commercial VHR at <2 m resolution. Thus, the routine use of VHR imagery for agriculture monitoring has been limited by two primary controlling factors. First, VHR imagery is predominantly only available from commercial outlets thus is not readily available for acquisition, while consistent cloud free data can be costly and potentially non-existent. Secondly, more VHR pixels result in higher data volumes, which require increased digital processing capacity thus limiting its use, particularly at the landscape scale. The scarcity of commercial VHR data and high entrance of costs in the public domain prevents it from being as readily available in common open access cloud computing environments as with other commonly used open source datasets. Consequently, the use of VHR data in agriculture mapping is underrepresented, despite the additional increases in spatial detail it can provide and examples of its use have been limited to small study areas [21,22,23,24,25] or focused upon specialized techniques such as image preprocessing or segmentation [26,27,28]. This has remained true for sensors, such as RapidEye, which were specifically designed for acquiring VHR imagery with high cadence of observations to enable field, regional and global-scale monitoring of agriculture, but which has only been partially realized with individual studies yet to provide viable long-term monitoring frameworks [29,30,31,32,33,34].
Data fusion approaches, whereby datasets of different type (modality) and resolution are combined, can maximize the utility of VHR imagery. Using VHR in combination with either lower resolution or more temporally frequent imagery enables the benefits of different sources to be used in tandem, thus maximizing the benefit of each dataset and reducing its limitations [35,36]. Many data fusion approaches exist to maximize the benefits of different sources of imagery for agriculture mapping using a range of methods [16,35,37,38,39], including the use of object-oriented approaches that utilize advanced machine learning and deep learning algorithms [40]. However, few have been developed that can efficiently merge VHR data with moderate resolution data on a regional scale or larger [41], or are not limited to a single specific application, such as land cover classification. This commonly results in object-based approaches whereby VHR data is used to derive detailed image objects that are representative of land cover parcels and coarser spatial resolution imagery is used for spectral analysis [42,43]. Such an approach was used by McCarty et al. [44] to extract smallholder crops to generate maps of phenology amplitude at 10 m resolution. Over 2700 VHR scenes were used to generate a wall-to-wall segmentation of the Tigray region in Ethiopia using a framework that utilized a large distributed computing network, of up to 30 virtual machines. While scalable, the repetition of such an approach requires access to similar architecture.
A substantial barrier to the more mainstream inclusion of VHR in agriculture mapping is therefore a suitable framework which easily facilitates the fusion of VHR data with other remotely sensed data. Raster-based formats that enable the large processing and analysis of data efficiently, such as the Geographic Object-Based Image Analysis (GEOBIA) outlined by Clewley et al. [45], rely on raster data that require that all input imagery uses the same spatial resolution and grid. This becomes problematic when trying to combine data based on a VHR segmentation, as other datasets must be forced to match this resolution, to the detriment of data quality and data volume. A review of multi-source remote sensing data fusion approaches [35] outlines the existing major methods (e.g., pan-sharpening) but does not list specific frameworks through which data analysis can be conducted. Indeed, the advantages of object-based analysis for combining data are outlined, but the practical components of achieving this with large volumes of data across large geographic areas are not evaluated. Proprietary software, such as Trimble’s eCognition (formerly Definiens eCognition; https://geospatial.trimble.com/products-and-solutions/ecognition) and more recently ESRI’s ArcMap (https://desktop.arcgis.com/en/arcmap/), do provide mature and capable means of conducting object-based analysis with multi-resolution data, yet these software packages are economically expensive to acquire and cannot be easily scaled without using additional costly computational resources.
Therefore, the overarching goal of this effort was to create a method of fusing VHR imagery with both multispectral and Synthetic Aperture Radar (SAR) remotely sensed data. Our objective was to create an open source, scalable, and efficient framework that could use VHR-derived objects for intricate and detailed mapping across large geographical scales, and efficiently fuse it with commonly available time-series remotely sensed imagery for multi-year analysis. Our motivation was driven by the requirement for a method to analyze small-scale (1 ha) agricultural fields, but which could be suitable to use for any application, using image objects of any size and input remote sensing data of any spatial resolution. Data fusion through this framework enables objects identifiable with VHR to be observed temporally with moderate resolution sensors.

2. Materials and Methods

2.1. Software and Libraries

The Fusion Approach for Remotely-Sensed Mapping of Agriculture (FARMA) framework relies upon objects (groups of pixels/polygons) that store image statistics for each object within an attribute table, where each row is a unique object ID and each column is a given attribute. This relies upon a suite of open source software, used together to form an automated python workflow. To create, store, and analyze the objects, the following packages are used.
  • RSGISLib
  • KEA
  • Pandas/GeoPandas
  • GeoPackage
  • Docker/Singularity

2.1.1. Remote Sensing and GIS Library (RSGISLib)

The Remote Sensing and GIS Library (RSGISLib; www.rsgislib.org) is a python library containing over 400 general purpose and specialized algorithms for processing raster and vector format remote sensing data [46]. These include zonal statistics, change detection, image segmentation, and object-based classification across 19 modules. This modular hierarchy enables commands to be used within a workflow that is easily integrated within a Python script. RSGISLib typically provides low-level functions, which can be combined by a user to create a complete algorithm/workflow, enabling flexible use of the software to repurpose commands for numerous different tasks. RSGISLib uses a number of common existing dependencies (e.g., GDAL (www.gdal.org)), which are used both within RSGISLib and as standalone libraries in the FARMA workflow. RSGISLib is therefore the core software on which FARMA is derived, through the use of existing commands linked via additional Python and specific newly created processes. RSGISLib was installed using the Aberystwyth University Earth Observation and Ecosystems Dynamics (AU EOED) research group Docker image: https://hub.docker.com/r/petebunting/au-eoed.

2.1.2. KEA

The KEA file format [47] (https://bitbucket.org/chchrsc/kealib/) is a HDF5-based image file format with a GDAL driver capable of storing header information, GCPs, and a raster attribute table (RAT) within a single file. We use it for its functionality to support raster attribute tables (RAT) and zlib-based compression, including on the RAT, which yields small file sizes. The KEA library (kealib) is released under the Massachusetts Institute of Technology/X Window System (MIT-X) license.

2.1.3. Pandas/GeoPandas

Pandas (https://pandas.pydata.org) is a python library that provides a dataframe environment well suited for reading, analyzing, and writing tabular data from common file formats including comma-separated values, JSON and SQL. GeoPandas (https://geopandas.org) extends the functionality of Pandas to allow spatial operations within common vector datasets such as GeoPackages. Within GeoPandas, file access and geometric operations are performed by Fiona and Shapely, respectively.

2.1.4. GeoPackage

A GeoPackage (GPKG; http://www.geopackage.org) is an open standards-based format implemented as a SQLite database container. It was defined by the Open Geospatial Consortium (OGC) in 2014 and can support both vector and raster data within multiple layers per file. GeoPackage is compatible with all commonly used GIS software and has advantages over existing formats (e.g., ESRI Shapefiles) including unlimited size and the ability to read data when compressed.

2.1.5. Docker/Singularity

Docker is designed to create, deploy, and run applications and software through the use of containers. These containers allow software and libraries to be packaged and distributed with all required dependencies and libraries. This allows the deployment of a single package that has cross-platform functionality. By using the system on which it is running, containers can be smaller in size but operate with increased performances over alternative virtual machines. The Docker container used for this method can be found here: https://hub.docker.com/r/petebunting/au-eoed and contains all the software packages required. Docker is not designed to be used on distributed computing systems as it requires root permissions. Singularity https://sylabs.io/docs/ provides the same functionality as Docker in such cases. The primary benefit of this is that the FARMA framework can be implemented independent of the user’s computing platform.

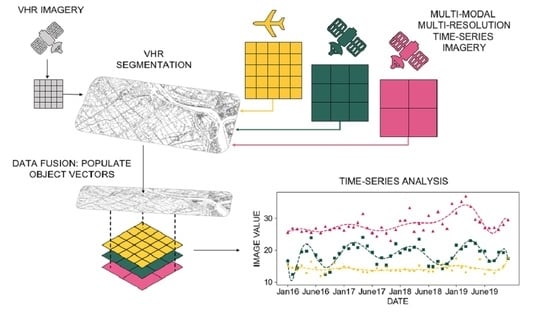
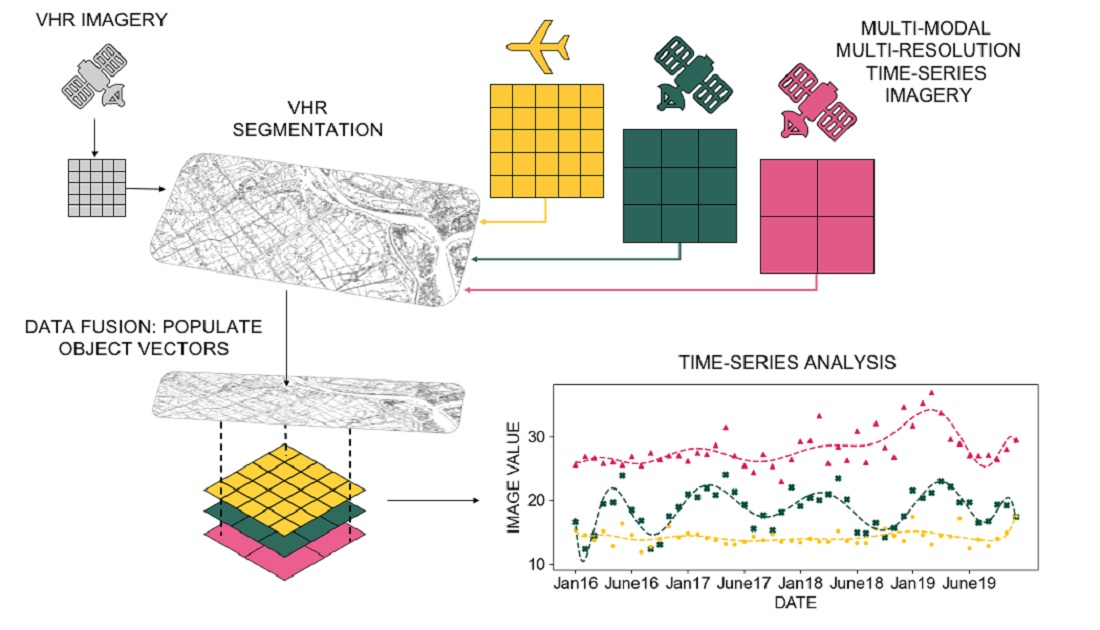
2.2. Fusion Approach for Remotely-Sensed Mapping of Agriculture (FARMA)

2.2.1. Image Segmentation
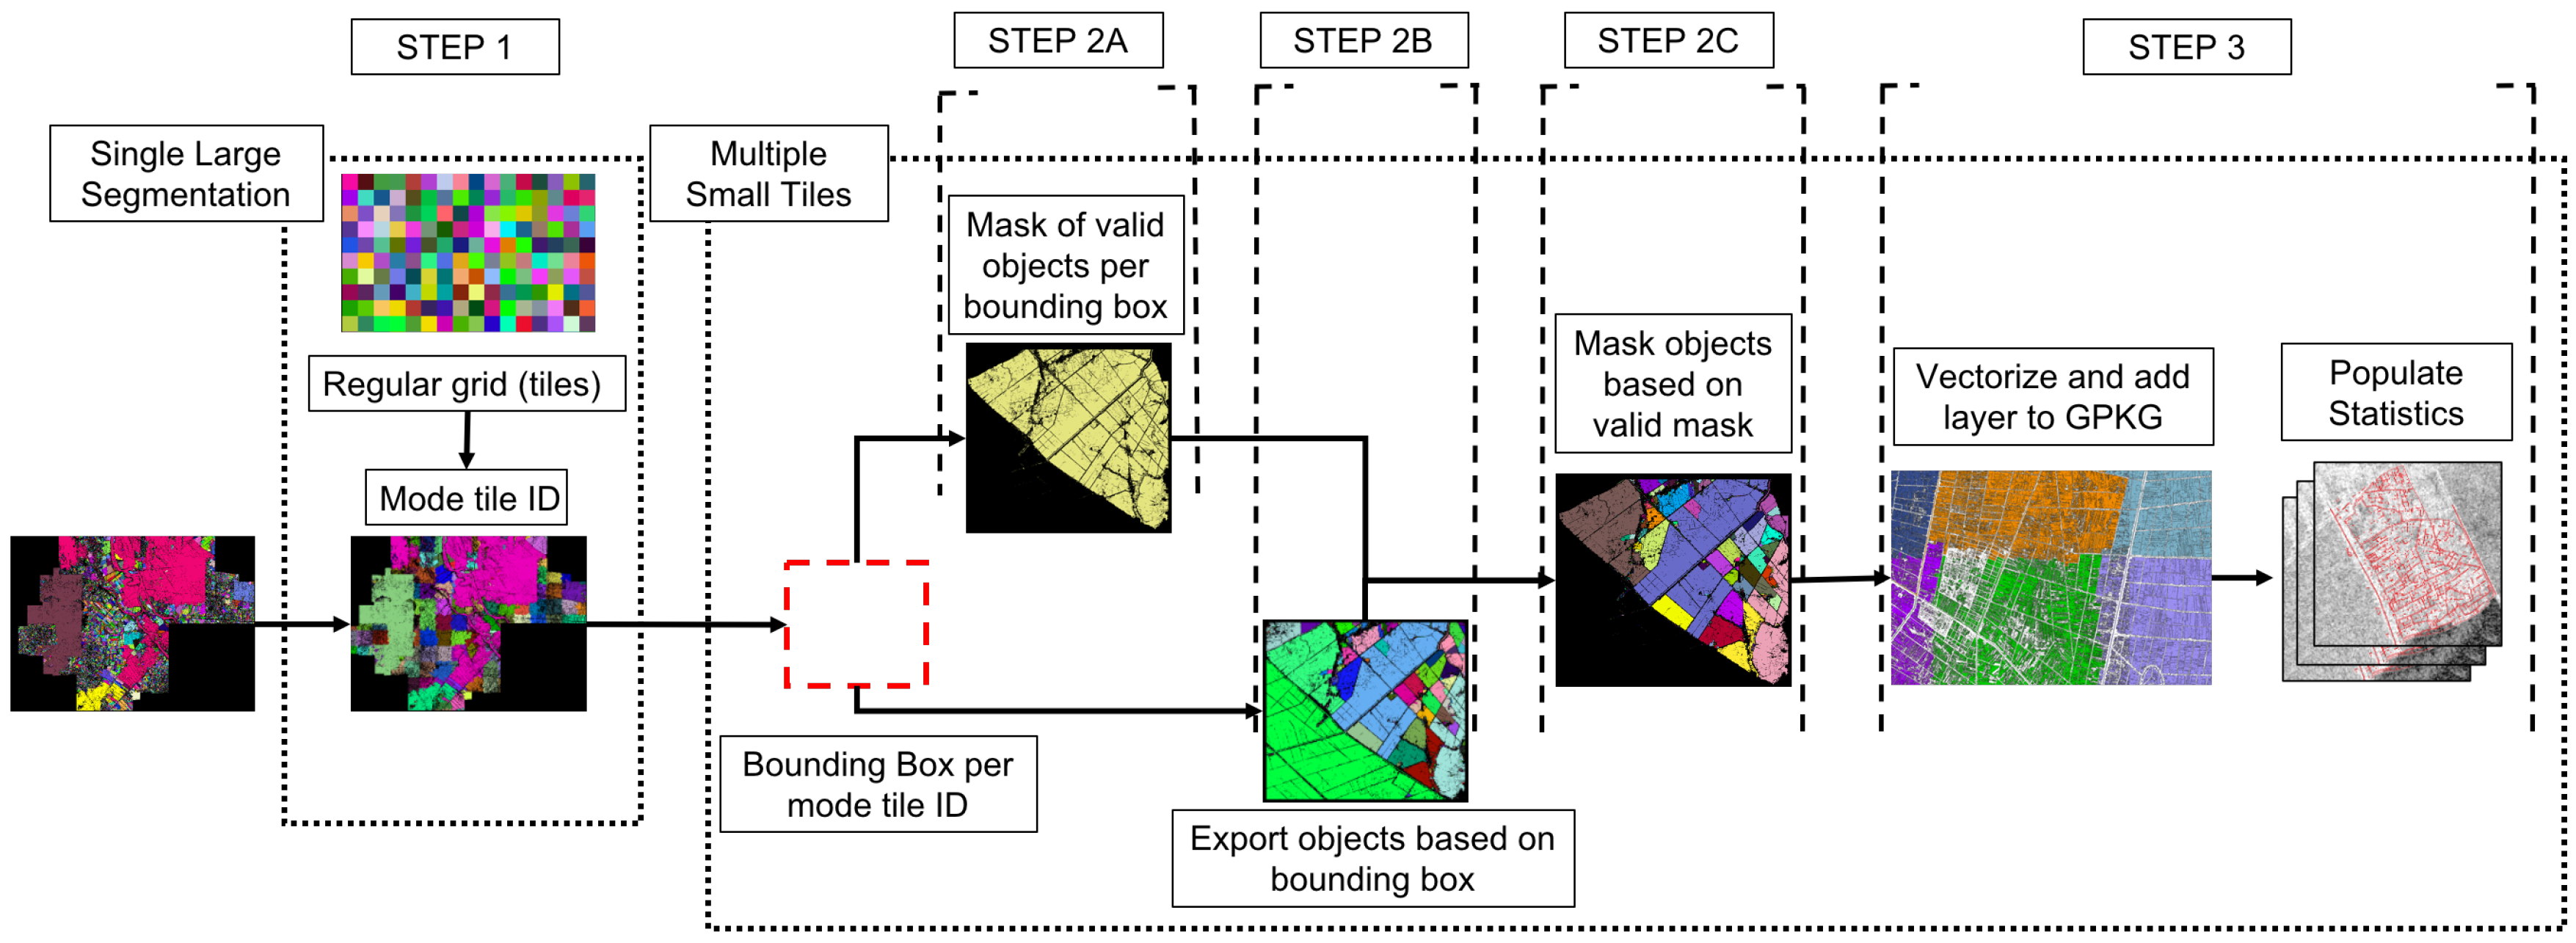
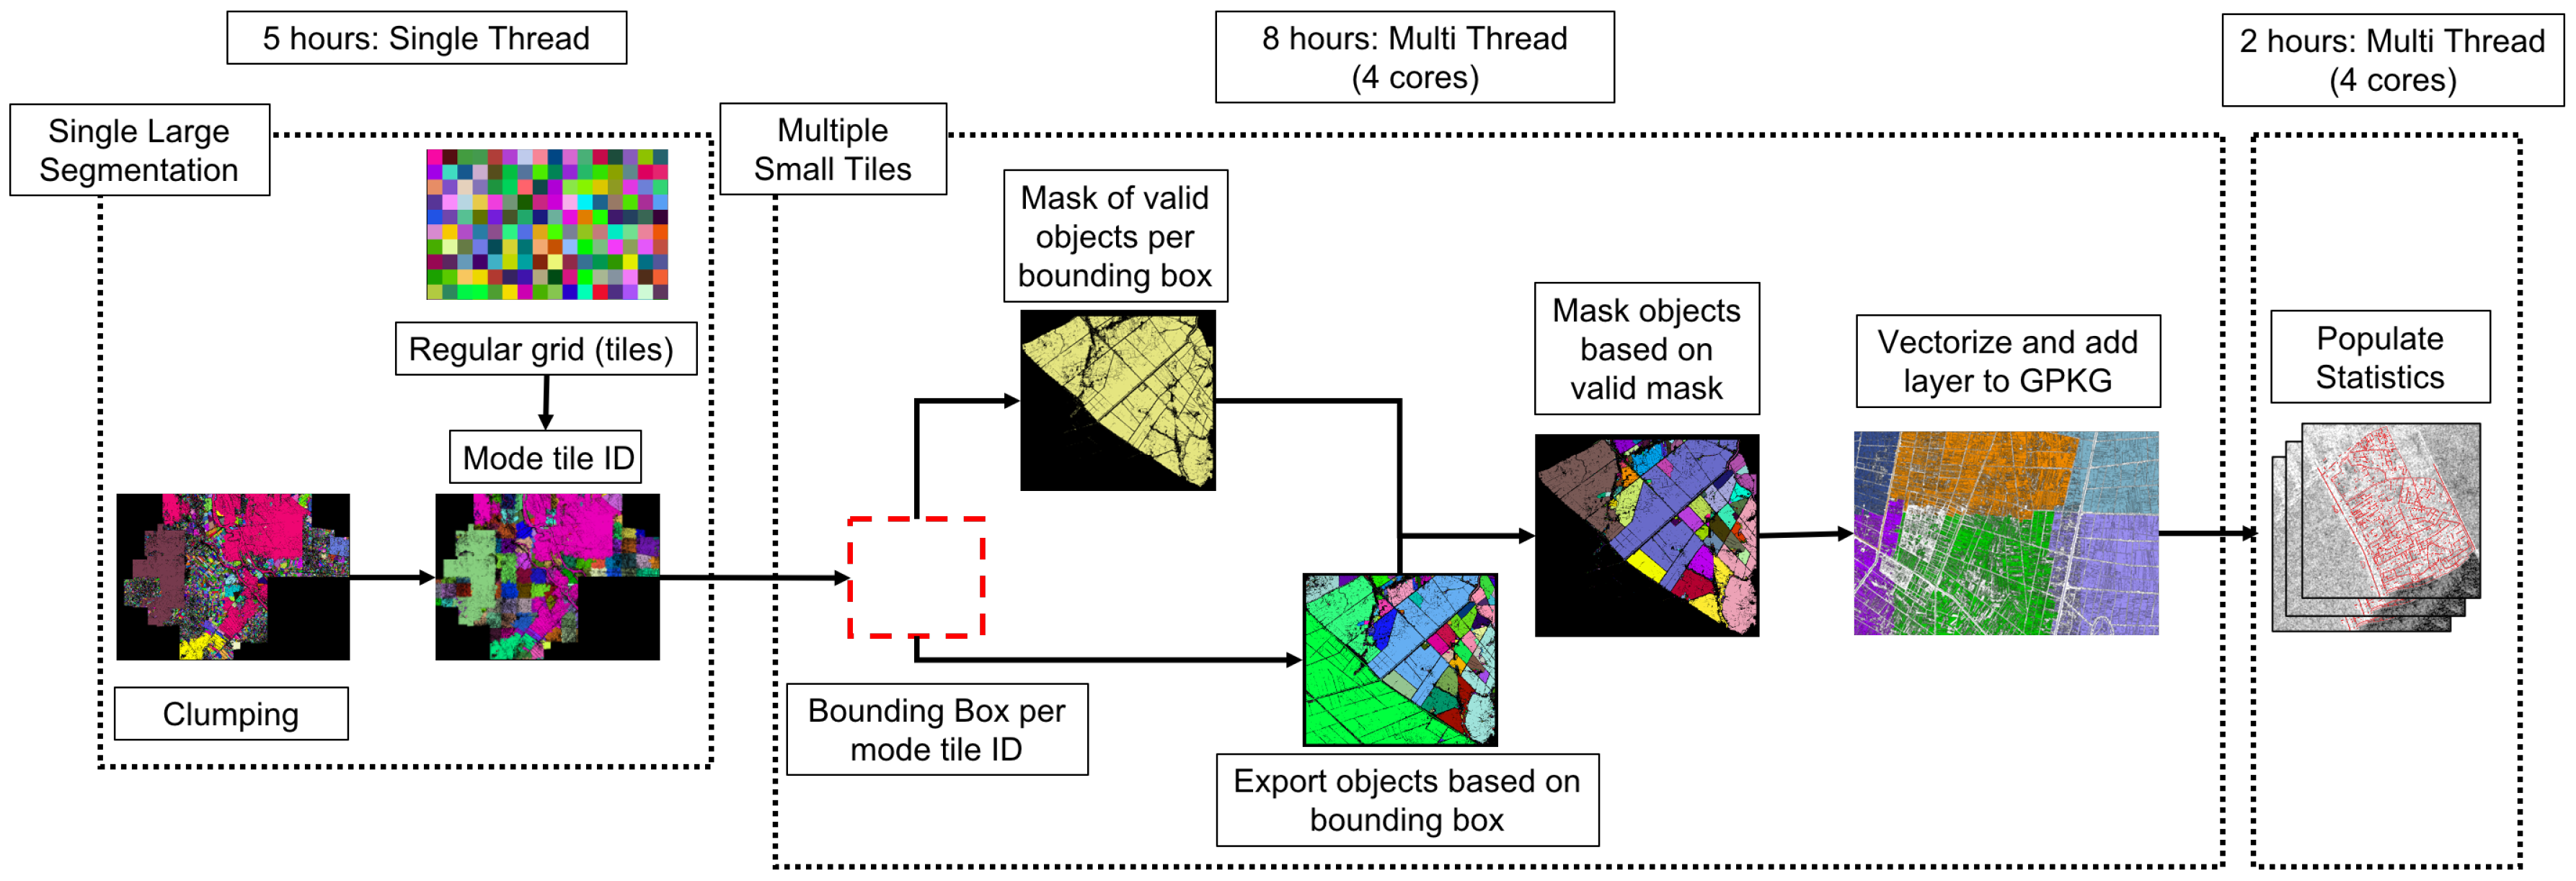
FARMA facilitates data fusion through the population of descriptive statistics from remotely sensed imagery into image objects derived from an independent source. Specifically, FARMA is capable of fusing large-scale detailed VHR-derived objects with high- (10 m), moderate- (30 m), and low-resolution (>250 m) remotely sensed imagery across large geographic domains efficiently. FARMA does not segment imagery; therefore, an external segmentation is required which can be derived from any source using any data, as long as it is provided in a rasterized format. Vector format segmentations can be rasterized prior to being used within the FARMA workflow. In two of the examples provided, we used our Agriculture Kernel Otsu Multi-thresh Segmentation (AKOMS) method [48], which applies a dilation and erosion to pixels at specified kernel sizes followed by multi-level histogram thresholding to segment agriculture fields into objects. This generates a binary image of pixel clusters which were clumped using RSGISLib, converting each individual cluster into a uniquely labeled object. A Shepherd [49] k-means segmentation with iterative elimination of objects below a user defined threshold, available within RSGISLib, was provided as an third example. Post clumping, very small (pixel scale) and very large (>10,000 ha) image objects were removed to eliminate the processing of erroneous features. These objects were a consequence of the segmentation process, which was independent of FARMA.

2.2.2. Image Tiling

The image objects were tiled to reduce demands on computing memory and enable the use of distributed computing environments, where available. The workflow is broken down into the following steps and provided diagrammatically in Figure 1. For reference all processing was carried out on an Apple MacBook Pro with 3.5 GHz Intel Core i7 processor with 16 GB of RAM.
Step 1: Initially a coarse regular grid, at the same dimensions and underlying resolution as the segmentation, was created using RSGISLib. The grid cells can be of any size as required by the user and can be tailored depending upon the computing resources available. Each grid cell had a unique value assigned to it. Each object in the segmentation is then populated with the mode value of the spatially associated (underlying) cell, thus providing a new segmentation composed of mode-object-tiles with soft boundaries between mode-object-tile edges. The minimum and maximum extent of each mode-object-tile is then populated into the RAT using an RSGISLib function and a blank image based on these boundaries is created, in preparation for the extraction of each mode-object-tile.
Step 2: (A) Each object in the mode-object-tiled image, within the bounds of each associated blank image, is exported, creating a mask of the objects in that tile. (B) Simultaneously, the initial segmentation is cut by the tile extent (defined by minimum and maximum extent populated in step 1), creating individual tiles with objects cut with hard boundaries. (C) The mask from step 2A is then used to extract the individual segments (tiled-segments) from step 2B, where each segment has its own unique ID. Each object is then relabeled so that each tile contains objects starting with an ID of 1, where 0 is “nodata”. This yields multiple tiles composed of intact image objects.

2.2.3. Image Statistics

Step 3: Each tile of objects is then vectorized to a GeoPackage file (one GeoPackage per tile, containing one layer), creating a number of vector format tiles containing polygons of unique objects. Using functions within RSGISLib, image statistics from independent remote sensing data are populated into the polygons, using descriptive statistics (e.g., mean). Each image band is added to the GeoPackage layer as a unique column in the attribute table. The function in RSGISLib populates the pixel value if the pixel centroid is within the object (polygon) bounds. If the image pixel is larger than the polygon, the pixel value is sampled based upon the polygon centroid. To increase efficiency, each vector is read into memory before statistics are populated, reducing the I/O of the data. Any dataset at any resolution can be populated into the polygons, provided it is in raster format and of the same projection. Analysis can be conducted on the populated polygons, either through the use of Pandas/Geopandas or by populating the statistics back into the associated raster format RAT, which can produce smaller file sizes and enable the data to be read/written in blocks to increase computational efficiency.

3. Example Studies

Here, we provide examples of the FARMA method for two regions of interest, each with a different approach to observing changes at the field scale. Northern Senegal: (1) broad multi-year photosynthetic trends with Sentinel-3 imagery and (2) annual growing and harvesting cycles with Sentinel-2 imagery; the Mekong Delta, Vietnam: (3) annual rice harvesting cycles with Sentinel-1 imagery. Each is based on a VHR WorldView-derived segmentation, demonstrating that FARMA can use multiple remote sensing modalities and resolutions to efficiently characterize agricultural processes at the field–scale. Examples of two of these processes include (i) the number of rice harvests per year derived from SAR and (ii) field-scale phenology mapped with moderate resolution optical time-series imagery. The examples we provide are to demonstrate the flexibility of the FARMA workflow to use a range of remotely sensed imagery to satisfy a range of applications, but are not focused on the specific processes at each location. Thus, an accuracy assessment is not provided as the results are examples synonymous with expectations of object time-series reflectance or backscatter.

3.1. Remote Sensing Imagery

In the examples we provide three different sources of remotely sensed data that vary significantly in either sensor-type or resolution, which are processed through FARMA. This demonstrates that our approach is flexible and can ingest information across a range of remote sensing data types, imaging modes and temporal periods.

3.1.1. WorldView

Commercial VHR MAXAR WorldView (WV) imagery was collected by the National Geospatial Intelligence Agency (NGA) under the NextView license agreement. These data are available to government and non-profit organizations, under this license, that perform research that benefits U.S. government interests [50]. We collected WV-1 0.5 m panchromatic imagery and WV-2 and -3 panchromatic (0.3–0.5 m resolution) and multispectral imagery (1.3–2 m resolution) for segmentation and field object identification from NGA’s data archives. We leveraged VHR resolution to define field boundaries and separate individual fields as objects when most fields were sub-hectare and not resolvable with Sentinel-1 or other high/moderate resolution sensors. VHR imagery were processed to top of atmosphere reflectance, orthorectified and resampled where necessary to 0.5 m resolution, using our enhanced very-high resolution (EVHR) products application programming interface (API) [51].

3.1.2. Sentinel-1 Time-Series

Sentinel-1 imagery is collected via two satellites as part of the European Space Agency (ESA) Copernicus constellation. Sentinel-1A and Sentinel-1B acquire SAR imagery every 6 days with a 12 day spacecraft repeat time. Sentinel-1 is a C–band (5.5 cm wavelength) SAR capable of capturing imagery irrespective of cloud cover and atmospheric conditions. The Sentinel-1 imagery catalog has been ingested into the Google Earth Engine Cloud Computing platform, where the imagery has undergone thermal noise removal and radiometric and terrain correction, available in log scale decibel (dB) units of backscatter. For agricultural regions where topography is generally minimized, these preprocessing steps are sufficient. For the following example, 2018 Sentinel-1 imagery was acquired over a region of interest (ROI) using both ascending and descending paths. Imagery within the ROI was converted from decibel to linear units and averaged into monthly time steps, to avoid calculating the geometric mean of the data. The mean image values were multiplied by a factor of 100,000 and downloaded as a 12 band image in integer format and resampled to the local UTM zone using a bilinear interpolation. Each band of the image represents one month of data.

3.1.3. Sentinel-3 Time-Series

Sentinel–3 is a constellation of two platforms operated by ESA, designed to measure sea surface topography, sea and land surface temperature, and ocean and land surface color. It carries numerous instruments, one of which is the Ocean and Land Color Instrument (OLCI) which is a push-broom spectrometer with 21 bands and an image resolution of 300 m, ranging from the visible to the near-infrared (400–1020 nm). Monthly (2017–2019) median Normalized Difference Vegetation Index (NDVI) imagery was downloaded from Google Earth Engine at a resolution of 300 m for the years 2017, 2018 and 2019, providing 3 years of data across 36 image bands. The image was reprojected to UTM, using a nearest-neighbor resampling method. The use of NDVI is sensitive to changes in photosynthetic cover and negates the requirement for atmospheric correction, which is currently not available as a standard Sentinel-3 product.

3.1.4. Sentinel-2 Time-Series

Sentinel–2 is an ESA constellation of two satellites. Each carries a multispectral imager (MSI) that records 13 bands from visible through shortwave-infrared portions of the electromagnetic spectrum (442–2202 nm). Image bands are available in 10 m, 20 m and 60 m dependent upon the wavelength across a 290 km field of view. The repeat orbit period across both satellites is 5 days at the equator providing frequent coverage in regions heavily impacted by cloud cover. The imagery is open access and is available on the Google Earth Engine platform. We created greenest-pixel composites for each month of 2018. The greenest-pixel composite uses the pixel, in a time-series stack of imagery, from the image which has the highest NDVI pixel value. Each month was exported at 10 m resolution as a band in a 12-band image. The image was reprojected to the local UTM zone using a nearest-neighboring resampling method.

3.2. Senegal River Valley

Over the past 30 years, West Africa’s (WA) population has more than doubled, growing by 2.7% annually. By 2030, 490 million people are expected to live in the WA Sudanian and Sahelian region [52]. The majority of rural residents in the region, which account for 45% of the population [53], are directly involved in agriculture, which is the leading cause of land cover change in West Africa and specifically within Senegal [54]. An increasing population in this environment must face the challenges of meeting both food security and producing crops and goods for export, in order to meet the increased burden of a growing population upon the economy. Rural areas, such as the peanut basin, are the source of primary smallholder staple crops such as maize and millet, with larger industrial crops that produce exportable goods more prevalent in northern Senegal. Specifically, the Senegal River Valley is an important source of valuable cash crops in the region [55] and sugarcane has emerged as one of the principal yields during the past 40 years [56], primarily driven by large agrobusiness for in-country processing and export. However, this relies heavily upon irrigation to provide water in an otherwise arid environment where precipitation has decreased over the past half-century [57]. As such, accurate maps of commercial crop extent and duration are critical for managing resources in the region and predicting yields which underpin the national economy. Here, we provide two examples of fusing a VHR resolution WV-3 segmentation with (1) low resolution Sentinel-3 (300 m) imagery and (2) high-resolution Sentinel-2 (10 m) imagery, to understand agricultural cycles in a region of northern Senegal (Figure 2).

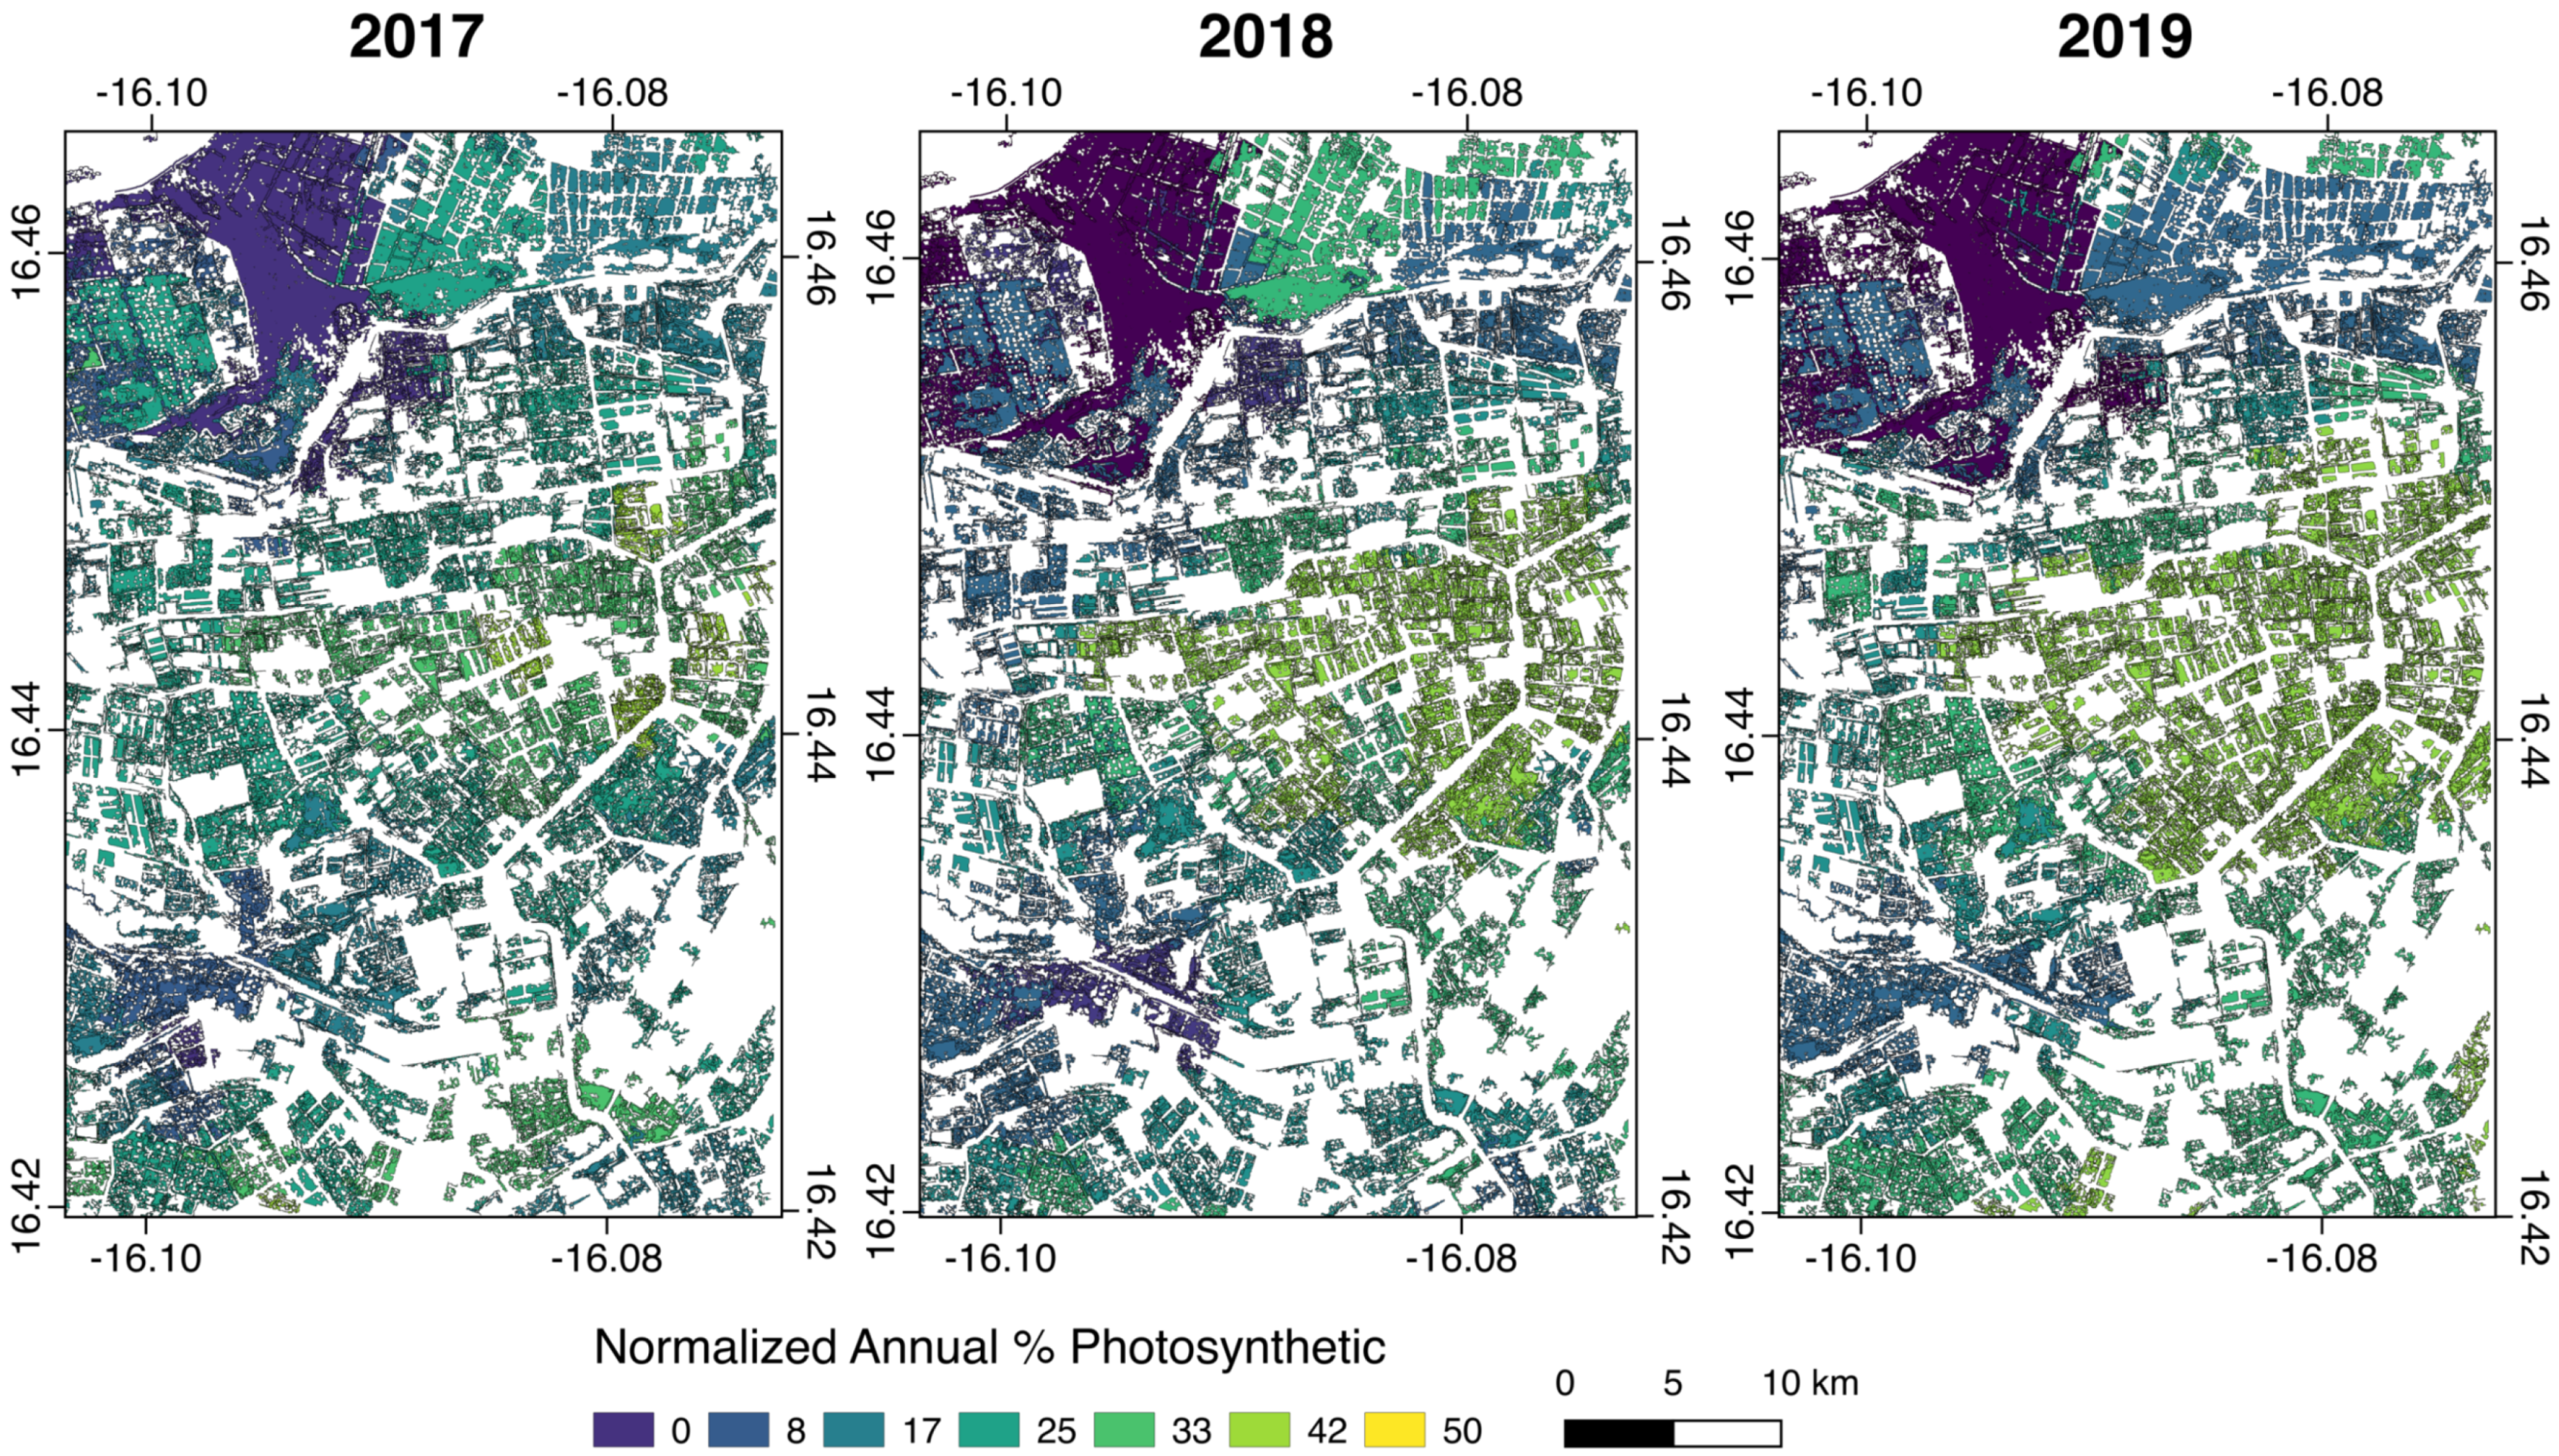
3.2.1. Senegal Study Site A: Broad Scale Photosynthetic Cover Mapping

Broad patterns within agricultural areas can be used to analyze regional trends that occur across multiple growing seasons. Coarse spatial resolution imagery is useful for this as it typically covers broad geographic areas with small data volumes. A disadvantage of this approach however is not being able to retrieve information for a specific field, or cluster of fields if required. A combination of VHR derived field objects and low-resolution imagery enables this, by providing knowledge on regional trends but within a local-scale setting. For input into FARMA, pan-sharpened 0.5 m resolution WorlView–3 imagery, acquired December 2016 was segmented using the AKOMS method, described above. A total of 20,697,179 image objects were processed, once objects below 0.125 ha were removed, covering a total area of 33,913 ha. The FARMA workflow was then used to grid the segmentation into tiles, each 10,000 × 10,000 pixels in size, creating 35 tiles of data from an image of 31,049 × 119,224 pixels. The Sentinel-3 median NDVI 36-band imagery was populated into each object using the mean pixel value, creating 36 attribute columns representing monthly NDVI, for each of the 35 GeoPackage files. Using Geopandas, the attributes were read from the geopackage and a greenness threshold was set on an NDVI value of 0.1, assigning a value of 1 to objects that met that criteria. For each year, this information was summed and divided by the total number of months and finally multiplied by 100. This provided a new column which represented the quantity of time that an object was green over the time period of 1 year, expressed as a %.
The percentage annual photosynthetic cover was successfully mapped for each object across 3 years of Sentinel-3 imagery (Figure 3). Each object represented the quantity of time that had a photosynthetic cover greater than 0.1 and differences were observed between each year. For the region in Figure 3 specifically, this was observed to be an increase in duration of photosynthetic cover for 2018 over 2017, and 2019 over 2018. Some fields in this region were observed to have had a photosynthetic cover for as much as 50% of the year, represented by warm colors. The reason for this is not known but is interpreted to be connected to factors that either prolong a growing season or promote multiple harvests. Such factors could include favorable growing conditions or the early availability of irrigation. Areas of non-photosynthetic cover had a low duration %, represented by blue colors in Figure 3.
This was achieved using the FARMA workflow in an estimated time of 13.5 h using four computing cores. The initial clumping of the segmentation and creation of tiled objects was completed within 2 h. The conversion to vector format of the 20.5 million objects took 11 h and was the most time-intensive step. The population of the Sentinel-3 pixels into the objects took 40 min to complete.

3.2.2. Senegal Study Site B: High-Resolution Agriculture Monitoring

While the method has demonstrated an ability to map photosynthetic cover in the Senegal River Valley using coarse resolution (300 m) spectrometer imagery, more detailed field-scale information could be retrieved when using higher-resolution data. VHR–derived objects combined with high-resolution time-series imagery would allow agriculture to be mapped on a field-by-field basis, unveiling not only its distribution but the occurrence of the peak and fallow seasons and the number of harvests per year. To assess this, a cloud-free WV-3 multispectral image was acquired for May 2017 over an agricultural region of northern Senegal (Figure 2) at 2 m spatial resolution. Prior to use within FARMA, the image was segmented using the Shepherd [49] algorithm available in RSGISLib. The segmentation was run with a minimum object size of 4000 pixels, based on a qualitative assessment of the objects to best represent the agriculture fields in the imagery. This 4000-pixel threshold is equivalent to 1.6 ha in the imagery, providing a total of 13,372 objects covering an area of 46,686 ha. Sentinel-2 monthly Greenest-pixel NDVI composites, as described above, were populated into the image objects using the mean, following the steps within the FARMA workflow. The FARMA end-to-end processing time took 2 h, using a single computing core.
Each image object was populated with monthly mean NDVI for the year 2018. This information was used to retrieve the month in which the peak NDVI value occurred, on a per-object basis (Figure 4A). Within the agricultural field objects this occurred almost uniformly in the months of May and June, while non-agricultural objects peaked in months later in the year (September–December). The peak NDVI value for each object was also mapped (Figure 4B), and the agricultural fields were observed to contain values much larger than the surrounding objects. This suggests that the peak production occurs at a time when vegetation does not naturally flourish and underpins the importance of irrigation in the region. Such information on a year-by-year basis can be used to record temporal changes in peak production, which has a subsequent impact upon yield prediction. Furthermore, some fields were observed to have a low maximum NDVI value, despite being adjacent to high-NDVI fields. The cause of this is not known but may be used to infer fields that are not under cultivation, have become unproductive or have been impacted by potential irrigation shortages during a given agricultural cycle.
As each object contained NDVI information over the course of a year, the temporal signature of different land cover types could also be investigated. As shown in Figure 5A, the agriculture fields show a distinct increase in NDVI during the peak growing season. This is accompanied by a second smaller peak during the fall months. This pattern was the same for a large number of the agricultural fields. Fields which were not used (Figure 5B) showed a consistently low NDVI, with only a small increase interpreted to be due to natural vegetation cover (e.g., grass cover) with seasonal changes in precipitation. Objects which were consistently vegetated (Figure 5C) over the year demonstrated a high NDVI value for the majority of the months, but fluctuations were also evident. The change in trend cannot be attributed to a single driver, but the vegetation sampled was located on a river meander. Decreases in the NDVI signal could therefore be due to a decrease in productivity in dry months or flooding during the wet season. In each case the trend in NDVI was successfully retrieved at monthly intervals over the period of one year.

3.3. Mekong Delta, Vietnam

Vietnam is the world’s second largest exporter of rice [58], with increased output driven by economic reform and market liberalization during the 1980s, which saw the country move towards modernized farming practices, including the use of new rice varieties, irrigation, pesticides, and fertilizers [59]. This modernization has enabled the Mekong Delta to become one of the world’s most intensively cultivated regions for rice production and one of the few locations worldwide that practice triple cropping rice agriculture [60]. Thus, the Mekong Delta provides a large geographical region where rapid changes occur over short temporal periods to test the ability of FARMA to achieve detailed large-scale monitoring. Cloud cover in the region inhibits the use of optical data to monitor these trends, therefore we provide an approach using VHR and radar imagery to fuse a fine-scale segmentation of the region with dense time-series data to monitor rice harvesting. Sentinel-1 data are well suited for this task as it is uninhibited by cloud cover and it is sensitive to differences in plant structure associated with the growing and harvesting of rice. Flooded ponds without rice act as a specular reflector and will result in little backscatter being received by the sensor while the C-band wavelength is sensitive to herbaceous vegetation, such as rice, with backscatter increasing as the rice grows and the biomass increases [17,20,61,62]. Our focus study region is on the provinces of An Giang and Đõng Tháp but extends into other provinces of Vietnam and neighboring Cambodia, dictated by the availability of WorldView imagery (Figure 6).
The fields and field boundaries in this region are often below the size of moderate- and coarse-resolution data, thus accurate segments representing sub-hectare fields are challenging to derive without the use of VHR imagery. Prior to use within FARMA, 88 WorldView images (1 m) covering the period December 2009–February 2019 were mosaicked and segmented using the AKOMS method described above and clumped in RSGISLib to create 2,123,808 objects. This was reduced down to 78,953 by removing objects that were below 1000 m 2 (0.1 ha) and further down to 78,946 with the removal of objects above 100,000,000 m 2 (10,000 ha). Remaining objects covered an area of 394,608 ha across a total image size of 116,500 × 111,000 pixels. Prior to clumping, a binary image derived from thresholds set on Sentinel-1 backscatter imagery was used to mask out pixels that had values outside of the range expected for agriculture (e.g., very bright targets such as urban areas). The segmentation was ingested into FARMA and gridded into tiles of 10,000 × 10,000 pixels and processed according to Section 2.2.2, resulting in 129 GPKG polygonized objects. Time-series Sentinel-1 imagery, as described above, was populated into the objects, yielding 12 attribute columns each representing monthly averaged backscatter values.
The approach was able to successfully characterize time-series backscatter for the rice fields over the period of a year, revealing the growing and harvesting cycles that occurred. This cycle was compared directly with the Sentinel-1 imagery (Figure 7) so that the trend could be corroborated with the remotely sensed signal. For the location shown, three distinct peaks were observed in the time-series record, which is in concurrence with the triple harvesting practices in the region. Peak Sentinel-1 backscatter was detected in February, June and October, followed by large immediate decreases in backscatter. This is synonymous with the harvesting of rice as the highest backscatter was observed as the rice achieved peak biomass, before a minimum backscatter was observed as the rice was removed, leaving a specular reflecting water surface at the next time step. This information was retrieved for all of the image objects across the entire 394,608 ha area, demonstrating that FARMA can provide dense time-series information on a per-field basis across very large geographical areas.
The processing of this example, which represents the largest geographical area of all of the study sites provided, took approximately 15 h on an Apple MacBook Pro with 3.5 GHz Intel Core i7 processor and 16 GB of RAM, using 4 cores for multiprocessing. The most time-intensive step was the creation of the individual tiles, from extracting them from the single segmentation to the creation of single vector format tiles (GPKGs). This stage took 8 h using 4 cores but the processing time of each tile varied considerably. Approximately 75% of tiles took ≤5 min each to run while 96% were completed within 30 min each. A second time intensive step was the segmentation into a KEA format RAT and initial tiling of the segmentation in raster format. Due to insufficient RAM, a tiled single-thread version of the command was used but this would require less time if sufficient RAM or if the multi-thread tiled version of the command was used. The clumping took 4 h and the creation of the tiled raster image took an additional 1 h on the 1 m imagery. The population of the zonal statistics took 2 h using 4 cores. The timed process did not include the initial image segmentation nor the acquisition of the data used in the analysis (e.g., Sentinel-1 backscatter), as these are independent of the FARMA workflow. An overview of the processing steps with associated run time is given in Figure 8.

4. Discussion

The FARMA method has been demonstrated to be capable of fusing VHR imagery with other raster-based sources of information to achieve scalable results for agriculture mapping and monitoring. The method, which uses zonal statistics across tiled vector format segmentations, was efficient at processing VHR resolution objects across large geographical domains using modest computing resources. This is a pioneering method for multi-resolution data fusion for land cover mapping and monitoring. As demonstrations of this, we derived maps of photosynthetic cover expressed as a function of time, peak production (NDVI) period and value, signatures from agriculture and non–agriculture for categorizing land cover types and time-series trends in agricultural cycles. These results were obtained using three separate examples in Senegal and Vietnam that represented different environmental settings and agricultural types. Multi-spectral (2 m) and pan-sharpened (0.5 m, 1 m) VHR imagery was used to derive segmentations on which the object image analysis was conducted and auxiliary data from Sentinel-1, -2 and -3 satellites were used to derive information on the agricultural productivity, on a multi-year basis where required.
This framework provides a novel means for comprehensive agricultural monitoring and is situated as a practical solution to persistent limitations (e.g., computing resources, data volume) in field-scale mapping across large geographical areas. Accurate sub-hectare field mapping and monitoring, provided by FARMA, is critical for assessing food security, both locally in rural subsistence farming and globally across industrial food producing regions [7,48,63]. This is pertinent in West Africa and the Mekong Delta respectively, where different practices at varying scales underpin vital food security and national economies, yet where the risk of malnourishment also persists [6]. Climate change and population increase pose additional future challenges on the agricultural sector to meet increasing demands [5], but potential benefits can be made under these scenarios if appropriate and well informed land management decisions are made [8]. However, these must be relevant at the field-scale level, which has not been possible thus far due to the ongoing under-representation of knowledge at this scale across regional domains [16]. A method of accurately characterizing sub-hectare fields, as presented with FARMA, is the foundation on which effective decisions can be made.
The goal of this work was not specifically to understand agricultural practices as the study sites provided, but to demonstrate that FARMA is an efficient and flexible workflow capable of retrieving such information. FARMA has been able to demonstrate that the method is insensitive to different modalities and resolutions and is thus a tangible method for all agricultural and land cover analysis.

4.1. Comparison to Other Methods

The FARMA method is comparable to a number of existing methods [44,64,65,66] although it has demonstrated important increases in performance, particularly in terms of processing time and is developed by some of the same authors as these currently available methods. However, an important distinction is that the method presented in this study is object-based and the majority of existing examples rely on pixel-based techniques. FARMA is therefore more readily comparable with existing GEOBIA approaches from Clewley et al. [45], Trimble eCognition, and ESRI’s ArcMap. FARMA offers considerable advantages over proprietary software by being open source and fully scalable without the requirement for software licenses. The GEOBIA method of Clewley et al. [45] is built upon the same underlying architecture as FARMA (e.g., RSGISLib, GDAL etc) and offers many of the same benefits in terms of scalability, yet it is not suited for multi-resolution analysis due its reliance upon raster grids.
We therefore consider the primary advantages of FARMA to be fourfold:
  • FARMA provides an efficient and scalable method for the fusion of multi-resolution data. High- and moderate-resolution time-series imagery was populated into the VHR derived objects, but the segmentation and imagery used for analysis can be any combination of sizes. Furthermore, multiple resolution pixel values can be populated into the same image object, allowing a user to analyze multiple raster datasets per object at their native resolution. In addition, the system is fully open source and does not require proprietary software at any stage of the process.
  • It has the ability to tile the imagery so that smaller portions of data can be processed more efficiently even with modest computing resources. However, within a large distributed computing environment, this enables the advantage of splitting the data volume across a large number of CPUs. The run time subsequently becomes trivial as all tiles can be run simultaneously. A primary advantage of FARMA is that the tile size is entirely customizable, so a user can trade tile size for number of tiles, depending on the computing architecture available. FARMA can be fully operated on a single thread or it can be distributed across as many CPUs as possible.
  • It is able to tile polygons without creating artificial boundaries between them. While the benefit of processing large data volumes as individual tiled datasets is known, this has not been readily demonstrated with image objects which do not conform to neat tile boundaries. FARMA enables objects to be assigned to a tile using a mode value, subsequently enabling a segmentation to be tiled using soft tile boundaries. Furthermore, by creating these tiles as vector datasets, this has the benefit of enabling zonal statistics to be populated into objects irrespective of spatial resolution while being processed in parallel.
  • FARMA reads each vector layer into memory before calculating and assigning zonal statistics. While this may pose an issue for very large vectors (>10,000 ha), typically not associated with agriculture fields, this has the benefit of reducing the vector I/O and thus is more computationally efficient. This contributes to the framework being fully scalable.

4.2. Performance

FARMA was demonstrated across three examples, each different in the size of the geographical area mapped, the number of objects contained in each segmentation and the resolution from which the segmentation was derived. Senegal B had the lowest run time, completing within 2 h on a single computer core. It covered the second largest area (46,686 ha), but with the lowest number of objects (13,327), derived from the lowest resolution imagery (2 m) and with the largest minimum object size (1.6 ha). The Senegal A and Vietnam examples had similar run times of 13.5 and 15 h, respectively, but were based on two very different segmentations, while Vietnam also used a modified version of FARMA (tiled clumping) due to the large segmentation size. The Vietnam example (394,608 ha) covers a larger area than Senegal A (33,913 ha) but Senegal A contained a far larger number of objects (20.5 million) from higher resolution imagery (0.5 m) in comparison to Vietnam (79,953 objects; 1 m imagery). We infer that the number of objects and object complexity drove the processing time for Senegal A while the large area, greater number of individual tiles and increased object-size drove the processing time for Vietnam. The run time of the examples is therefore dictated by a combination of the size, number, and complexity (number of nodes) of the objects and the number of tiles used. Consequently, comparing the processing times to provide recommendations for using FARMA is challenging and all of these parameters should be carefully considered, in addition to the computing resources available. However, polygonizing the objects was a relative computationally intensive step in all examples, demonstrated by 11 of the 13.5 h run time for Senegal A assigned to polygonizing the 20.5 million objects. If possible, we therefore recommend the removal of objects that are not of interest, such as those in the Vietnam example that were greater than 10,000 ha. Nevertheless, the run time of FARMA was efficient considering the tasks that were achieved. Furthermore, the most intensive steps are required to be run just once, requiring an initial investment of time but which yields low investments of time thereafter. In all instances the population of the independent imagery took a small amount of time (maximum 2 h; Vietnam), thus FARMA could be used as an efficient monitoring system whereby new information is regularly ingested without the requirement to reprocess the objects. As FARMA ingests externally created segmentations it is important to note that segmenting VHR imagery across large geographical domains is a nontrivial and compute intensive task. While this has no bearing on the performance of FARMA, the additional time and resources required to achieve a segmentation should be considered.

4.3. Framework Expansion

FARMA is based on a series of algorithms in the RSGISLib [46] Python module, arranged in such a way to retrieve efficient zonal statistics in tiled vectors, accessed, and analyzed using additional Python packages (e.g., GeoPandas). FARMA, therefore, has a modular nature that allows other packages to replace or be incorporated alongside existing ones. This allows new algorithms and workflows to be built on top of the current framework and does not constrain FARMA to one specific task or method. The FARMA workflow is completed with the population of remotely–sensed data into the image objects. As this data is accessible using pandas/numpy, it can be readily used with a wide range of Python modules and existing workflows, thus FARMA provides the user with the freedom to conduct any analysis they wish. Such analysis includes time-series trend monitoring as provided above, but can also include crop type classifications using machine learning algorithms within the SciKit-Learn [67] package, analysis of changes in crop structure (e.g., canopy height), crop biomass and yield estimation, and crop nitrogen mapping and monitoring, if the input remote sensing data are available to achieve this. In this regard, the examples here are only a very small selection of potential possibilities that could be readily achieved. Furthermore, FARMA is not limited to agricultural applications and as such, a segmentation of any land cover type could be processed using the same steps, thus the application is independent of the method and can be broadened to a range of uses.

4.4. Data Processing Considerations and Limitations

FARMA was designed for efficient processing, but is still limited by the computing resources available. FARMA can be used on a single-thread system but will not be at its most efficient due to the increased I/O when using a large number of tiles. The benefit of FARMA is therefore maximized when processing very large datasets across a large number of nodes. All analyses presented here were run on an Apple MacBook Pro (3.5 GHz Intel Core i7 processor and 16 GB of RAM) thus processing limitations are not expected to be detrimental if large computing clusters are not available. The initial stage of assigning objects to tiles must currently all be run on a single thread. In cases where the input imagery is extremely large, this could cause errors associated with degraded performance and insufficient RAM. For our largest example, the Mekong Delta, this ran in approximately 1 h on an image with 116,500 × 111,000 pixels at 1 m resolution. We envisage limitations in performance may occur with an image at this resolution at an image size of 1 × 1 or greater. To avoid such a bottleneck, the segmentation could be first divided into smaller images to run the initial single-thread step. Once tiled, all individual tiles could be combined into one workflow and run across multiple CPUs. Another second potential source of degraded performance was found to be the presence of very large continuous objects (>4500 ha; 60 min+ processing time each). These can cause a single tile to be very large as it is assigned a mode tile value but can spread across multiple tile space. However, the large objects encountered in this work were a function of the segmentation, which is independent of the FARMA method and were resolved by removing very large (e.g., rivers, >10,000 ha) and very small objects (e.g., single pixel noise), which were not meaningful at the field-scale.
We are confident that FARMA is a complete and capable method of conducting dense time-series analysis of agriculture over large geographical domains. However, there are several potential limitations that exist. Firstly, FARMA is solely object-based and while this provides a number of advantages, there is currently no means of achieving pixel-based analysis if it is required. Furthermore, FARMA is reliant upon an external high–quality input segmentation, but one that cannot adequately resolve field boundaries or target objects will yield unsatisfactory results. This includes field boundaries that may change over time due to changes in cultivation practices and tillage. Similarly, users must acknowledge the limitations of what can be interpreted when combining a segmentation and time-series imagery of vastly different resolutions. In Senegal Study A we merged a VHR-derived segmentation with 300 m pixel Sentinel-3 imagery. While this demonstrates the ability of FARMA to combine different remote sensing data to generate landscape scale analysis, it must be acknowledged that several fields fall within one pixel and thus caution must be taken when interpreting these results at fine scales. Lastly, FARMA has no graphical user interface (GUI) so is reliant upon the user having knowledge of the Python scripting language. As the software is available through Docker, FARMA is appropriate for those with beginner-to-intermediate knowledge of Python.

5. Conclusions

We provide a framework for efficiently fusing VHR image objects with other remotely sensed data for the purpose of efficient agriculture mapping and monitoring. The Fusion Approach for Remotely-Sensed Mapping of Agriculture (FARMA) is an open source Python-based framework that can tile large very-high resolution-derived segmentations into smaller images for use within a distributed computing environment. Soft boundaries prevent the splitting up of objects, which are subsequently vectorized and populated with statistics from independent imagery using an efficient zonal statistics approach. To demonstrate FARMA, we provide three examples from Senegal and Vietnam, where image objects derived from VHR imagery of agriculture are populated with time-series Sentinel-1, Sentinel-2 or Sentinel-3 data. In each case, we demonstrate the use of FARMA for retrieving information on time-series changes in agricultural land cover. This approach is fully scalable and can be easily modified, placing it as a tangible method for large-scale systematic analysis for regional scale very-high resolution agriculture mapping and monitoring.

Author Contributions

Conceptualization, N.T., C.S.R.N., and M.L.C.; methodology, N.T., C.S.R.N., M.L.C., and P.B.; software, N.T., P.B., and C.S.R.N.; formal analysis, N.T.; investigation, N.T., C.S.R.N., M.L.C., and J.L.M.; resources, P.B., C.S.R.N., and M.L.C.; data curation, N.T. and C.N.; writing—original draft preparation, N.T., C.S.R.N., and M.L.C.; writing—review and editing, N.T., M.L.C., C.S.R.N., J.L.M., and P.B.; project administration, J.L.M. and C.N.; funding acquisition, J.L.M., C.S.R.N., and M.L.C. All authors have read and agreed to the published version of the manuscript.

Funding

This research was funded by NASA’s Land Cover Land Use Change Program under grant number NNH16ZDA001N-LCLUC.

Acknowledgments

MAXAR data were provided by NASA’s Commercial Archive Data for NASA investigators (cad4nasa.gsfc.nasa.gov) under the National Geospatial-Intelligence Agency’s NextView license agreement.

Conflicts of Interest

The authors declare no conflict of interest.

References

  1. Mendelsohn, R. The impact of climate change on agriculture in developing countries. J. Nat. Resour. Policy Res. 2008, 1, 5–19. [Google Scholar] [CrossRef] [Green Version]
  2. Fritz, S.; See, L.; McCallum, I.; You, L.; Bun, A.; Moltchanova, E.; Duerauer, M.; Albrecht, F.; Schill, C.; Perger, C. Mapping global cropland and field size. Glob. Chang. Biol. 2015, 21, 1980–1992. [Google Scholar] [CrossRef] [PubMed]
  3. Alexandratos, N.; Bruinsma, J. World agriculture towards 2030/2050: The 2012 revision. Agric. Food Policy 2012. [Google Scholar] [CrossRef]
  4. Haberl, H.; Erb, K.H.; Krausmann, F.; Bondeau, A.; Lauk, C.; Müller, C.; Plutzar, C.; Steinberger, J.K. Global bioenergy potentials from agricultural land in 2050: Sensitivity to climate change, diets and yields. Biomass Bioenergy 2011, 35, 4753–4769. [Google Scholar] [CrossRef] [PubMed] [Green Version]
  5. Challinor, A.J.; Watson, J.; Lobell, D.B.; Howden, S.M.; Smith, D.R.; Chhetri, N. A meta-analysis of crop yield under climate change and adaptation. Nat. Clim. Chang. 2014, 4, 287–291. [Google Scholar] [CrossRef]
  6. World Health Organization. The State of Food Security and Nutrition in the World 2018: Building Climate Resilience for Food Security and Nutrition; Food & Agriculture Organization: Rome, Italy, 2018. [Google Scholar]
  7. Samberg, L.H.; Gerber, J.S.; Ramankutty, N.; Herrero, M.; West, P.C. Subnational distribution of average farm size and smallholder contributions to global food production. Environ. Res. Lett. 2016, 11, 124010. [Google Scholar] [CrossRef]
  8. Connor, M.; Annalyn, H.; Quilloy, R.; Van Nguyen, H.; Gummert, M.; Sander, B.O. When climate change is not psychologically distant–Factors influencing the acceptance of sustainable farming practices in the Mekong river Delta of Vietnam. World Dev. Perspect. 2020, 100204. [Google Scholar] [CrossRef]
  9. Xiao, X.; Boles, S.; Liu, J.; Zhuang, D.; Frolking, S.; Li, C.; Salas, W.; Moore, B., III. Mapping paddy rice agriculture in southern China using multi-temporal MODIS images. Remote Sens. Environ. 2005, 95, 480–492. [Google Scholar] [CrossRef]
  10. Yin, H.; Prishchepov, A.V.; Kuemmerle, T.; Bleyhl, B.; Buchner, J.; Radeloff, V.C. Mapping agricultural land abandonment from spatial and temporal segmentation of Landsat time series. Remote Sens. Environ. 2018, 210, 12–24. [Google Scholar] [CrossRef]
  11. Jain, M.; Mondal, P.; DeFries, R.S.; Small, C.; Galford, G.L. Mapping cropping intensity of smallholder farms: A comparison of methods using multiple sensors. Remote Sens. Environ. 2013, 134, 210–223. [Google Scholar] [CrossRef] [Green Version]
  12. Xiao, X.; Boles, S.; Frolking, S.; Li, C.; Babu, J.Y.; Salas, W.; Moore, B., III. Mapping paddy rice agriculture in South and Southeast Asia using multi-temporal MODIS images. Remote Sens. Environ. 2006, 100, 95–113. [Google Scholar] [CrossRef]
  13. Whitcraft, A.K.; Vermote, E.F.; Becker-Reshef, I.; Justice, C.O. Cloud cover throughout the agricultural growing season: Impacts on passive optical earth observations. Remote Sens. Environ. 2015, 156, 438–447. [Google Scholar] [CrossRef]
  14. Nguyen, D.B.; Clauss, K.; Cao, S.; Naeimi, V.; Kuenzer, C.; Wagner, W. Mapping rice seasonality in the Mekong Delta with multi-year Envisat ASAR WSM data. Remote Sens. 2015, 7, 15868–15893. [Google Scholar] [CrossRef] [Green Version]
  15. Gorelick, N.; Hancher, M.; Dixon, M.; Ilyushchenko, S.; Thau, D.; Moore, R. Google Earth Engine: Planetary-scale geospatial analysis for everyone. Remote Sens. Environ. 2017, 202, 18–27. [Google Scholar] [CrossRef]
  16. Torbick, N.; Chowdhury, D.; Salas, W.; Qi, J. Monitoring rice agriculture across myanmar using time series Sentinel-1 assisted by Landsat-8 and PALSAR-2. Remote Sens. 2017, 9, 119. [Google Scholar] [CrossRef] [Green Version]
  17. Clauss, K.; Ottinger, M.; Leinenkugel, P.; Kuenzer, C. Estimating rice production in the Mekong Delta, Vietnam, utilizing time series of Sentinel-1 SAR data. Int. J. Appl. Earth Obs. Geoinf. 2018, 73, 574–585. [Google Scholar] [CrossRef]
  18. Singha, M.; Dong, J.; Zhang, G.; Xiao, X. High resolution paddy rice maps in cloud-prone Bangladesh and Northeast India using Sentinel-1 data. Sci. Data 2019, 6, 1–10. [Google Scholar] [CrossRef]
  19. Bazzi, H.; Baghdadi, N.; El Hajj, M.; Zribi, M.; Minh, D.H.T.; Ndikumana, E.; Courault, D.; Belhouchette, H. Mapping paddy rice using Sentinel-1 SAR time series in Camargue, France. Remote Sens. 2019, 11, 887. [Google Scholar] [CrossRef] [Green Version]
  20. Clauss, K.; Ottinger, M.; Künzer, C. Mapping rice areas with Sentinel-1 time series and superpixel segmentation. Int. J. Remote Sens. 2018, 39, 1399–1420. [Google Scholar] [CrossRef] [Green Version]
  21. Chuang, Y.C.M.; Shiu, Y.S. A comparative analysis of machine learning with WorldView-2 pan-sharpened imagery for tea crop mapping. Sensors 2016, 16, 594. [Google Scholar] [CrossRef] [Green Version]
  22. Hively, W.D.; Lamb, B.T.; Daughtry, C.S.T.; Shermeyer, J.; McCarty, G.W.; Quemada, M. Mapping crop residue and tillage intensity using WorldView-3 satellite shortwave infrared residue indices. Remote Sens. 2018, 10, 1657. [Google Scholar] [CrossRef] [Green Version]
  23. Robson, A.; Rahman, M.M.; Muir, J. Using worldview satellite imagery to map yield in Avocado (Persea americana): A case study in Bundaberg, Australia. Remote Sens. 2017, 9, 1223. [Google Scholar] [CrossRef] [Green Version]
  24. Xie, B.; Zhang, H.K.; Xue, J. Deep convolutional neural network for mapping smallholder agriculture using high spatial resolution satellite image. Sensors 2019, 19, 2398. [Google Scholar] [CrossRef] [PubMed] [Green Version]
  25. Zhao, J.; Zhong, Y.; Hu, X.; Wei, L.; Zhang, L. A robust spectral-spatial approach to identifying heterogeneous crops using remote sensing imagery with high spectral and spatial resolutions. Remote Sens. Environ. 2020, 239, 111605. [Google Scholar] [CrossRef]
  26. Cucho-Padin, G.; Loayza, H.; Palacios, S.; Balcazar, M.; Carbajal, M.; Quiroz, R. Development of low-cost remote sensing tools and methods for supporting smallholder agriculture. Appl. Geomat. 2020, 12, 247–263. [Google Scholar] [CrossRef] [Green Version]
  27. Stratoulias, D.; Tolpekin, V.; De By, R.A.; Zurita-Milla, R.; Retsios, V.; Bijker, W.; Hasan, M.A.; Vermote, E. A workflow for automated satellite image processing: From raw vhsr data to object-based spectral information for smallholder agriculture. Remote Sens. 2017, 9, 1048. [Google Scholar] [CrossRef] [PubMed] [Green Version]
  28. Du, Z.; Yang, J.; Ou, C.; Zhang, T. Smallholder crop area mapped with a semantic segmentation deep learning method. Remote Sens. 2019, 11, 888. [Google Scholar] [CrossRef] [Green Version]
  29. Shang, J.; Liu, J.; Ma, B.; Zhao, T.; Jiao, X.; Geng, X.; Huffman, T.; Kovacs, J.M.; Walters, D. Mapping spatial variability of crop growth conditions using RapidEye data in Northern Ontario, Canada. Remote Sens. Environ. 2015, 168, 113–125. [Google Scholar] [CrossRef]
  30. Shang, J.; Liu, J.; Huffman, T.C.; Qian, B.; Pattey, E.; Wang, J.; Zhao, T.; Geng, X.; Kroetsch, D.; Dong, T. Estimating plant area index for monitoring crop growth dynamics using Landsat-8 and RapidEye images. J. Appl. Remote Sens. 2014, 8, 85196. [Google Scholar] [CrossRef] [Green Version]
  31. Kim, H.O.; Yeom, J.M. Effect of red-edge and texture features for object-based paddy rice crop classification using RapidEye multi-spectral satellite image data. Int. J. Remote Sens. 2014, 35, 7046–7068. [Google Scholar] [CrossRef]
  32. Tewes, A.; Thonfeld, F.; Schmidt, M.; Oomen, R.J.; Zhu, X.; Dubovyk, O.; Menz, G.; Schellberg, J. Using RapidEye and MODIS data fusion to monitor vegetation dynamics in semi-arid rangelands in South Africa. Remote Sens. 2015, 7, 6510–6534. [Google Scholar] [CrossRef] [Green Version]
  33. Crnojević, V.; Lugonja, P.; Brkljač, B.N.; Brunet, B. Classification of small agricultural fields using combined Landsat-8 and RapidEye imagery: Case study of northern Serbia. J. Appl. Remote Sens. 2014, 8, 83512. [Google Scholar] [CrossRef] [Green Version]
  34. Jin, Z.; Azzari, G.; Burke, M.; Aston, S.; Lobell, D.B. Mapping smallholder yield heterogeneity at multiple scales in Eastern Africa. Remote Sens. 2017, 9, 931. [Google Scholar] [CrossRef] [Green Version]
  35. Zhang, J. Multi-source remote sensing data fusion: Status and trends. Int. J. Image Data Fusion 2010, 1, 5–24. [Google Scholar] [CrossRef] [Green Version]
  36. Ozdogan, M.; Yang, Y.; Allez, G.; Cervantes, C. Remote sensing of irrigated agriculture: Opportunities and challenges. Remote Sens. 2010, 2, 2274–2304. [Google Scholar] [CrossRef] [Green Version]
  37. Li, H.; Manjunath, B.S.; Mitra, S.K. Multisensor image fusion using the wavelet transform. Graph. Models Image Process. 1995, 57, 235–245. [Google Scholar] [CrossRef]
  38. Torbick, N.; Salas, W.; Xiao, X.; Ingraham, P.; Fearon, M.; Biradar, C.; Zhao, D.; Liu, Y.; Li, P.; Zhao, Y. Integrating SAR and optical imagery for regional mapping of paddy rice attributes in the Poyang Lake Watershed, China. Can. J. Remote Sens. 2011, 37, 17–26. [Google Scholar] [CrossRef] [Green Version]
  39. Torbick, N.; Salas, W.; Chowdhury, D.; Ingraham, P.; Trinh, M. Mapping rice greenhouse gas emissions in the Red River Delta, Vietnam. Carbon Manag. 2017, 8, 99–108. [Google Scholar] [CrossRef]
  40. Gbodjo, Y.J.E.; Ienco, D.; Leroux, L.; Interdonato, R.; Gaetano, R.; Ndao, B. Object-based multi-temporal and multi-source land cover mapping leveraging hierarchical class relationships. Remote Sens. 2020, 12, 2814. [Google Scholar] [CrossRef]
  41. Houborg, R.; McCabe, M.F. A cubesat enabled spatio-temporal enhancement method (cestem) utilizing planet, landsat and modis data. Remote Sens. Environ. 2018, 209, 211–226. [Google Scholar] [CrossRef]
  42. Liu, J.; Shi, L.; Zhang, C.; Yang, J.; Zhu, D.; Yang, J. A variable multi-scale segmentation method for spatial pattern analysis using multispectral WorldView-2 images. Sens. Lett. 2013, 11, 1055–1061. [Google Scholar] [CrossRef]
  43. Persello, C.; Tolpekin, V.A.; Bergado, J.R.; de By, R.A. Delineation of agricultural fields in smallholder farms from satellite images using fully convolutional networks and combinatorial grouping. Remote Sens. Environ. 2019, 231, 111253. [Google Scholar] [CrossRef] [PubMed]
  44. McCarty, J.L.; Neigh, C.S.R.; Carroll, M.L.; Wooten, M.R. Extracting smallholder cropped area in Tigray, Ethiopia with wall-to-wall sub-meter WorldView and moderate resolution Landsat 8 imagery. Remote Sens. Environ. 2017, 202, 142–151. [Google Scholar] [CrossRef]
  45. Clewley, D.; Bunting, P.; Shepherd, J.; Gillingham, S.; Flood, N.; Dymond, J.; Lucas, R.; Armston, J.; Moghaddam, M. A python-based open source system for geographic object-based image analysis (GEOBIA) utilizing raster attribute tables. Remote Sens. 2014, 6, 6111–6135. [Google Scholar] [CrossRef] [Green Version]
  46. Bunting, P.; Clewley, D.; Lucas, R.M.; Gillingham, S. The Remote Sensing and GIS Software Library (RSGISLib). Comput. Geosci. 2014, 62, 216–226. [Google Scholar] [CrossRef]
  47. Bunting, P.; Gillingham, S. The KEA image file format. Comput. Geosci. 2013, 57, 54–58. [Google Scholar] [CrossRef]
  48. Neigh, C.S.R.; Carroll, M.L.; Wooten, M.R.; McCarty, J.L.; Powell, B.F.; Husak, G.J.; Enenkel, M.; Hain, C.R. Smallholder crop area mapped with wall-to-wall WorldView sub-meter panchromatic image texture: A test case for Tigray, Ethiopia. Remote Sens. Environ. 2018, 212, 8–20. [Google Scholar] [CrossRef]
  49. Shepherd, J.D.; Bunting, P.; Dymond, J.R. Operational large-scale segmentation of imagery based on iterative elimination. Remote Sens. 2019, 11, 658. [Google Scholar] [CrossRef] [Green Version]
  50. Neigh, C.S.R.; Masek, J.G.; Nickeson, J.E. High-Resolution Satellite Data Open for Government Research. Eos Trans. Am. Geophys. Union 2013, 94, 121–123. [Google Scholar] [CrossRef] [Green Version]
  51. Neigh, C.S.R.; Carroll, M.L.; Montesano, P.M.; Slayback, D.A.; Wooten, M.R.; Lyapustin, A.I.; Shean, D.E.; Alexandrov, O.; Macander, M.J.; Tucker, C.J. An API for Spaceborne Sub-Meter Resolution Products for Earth Science. In Proceedings of the IGARSS 2019 IEEE International Geoscience and Remote Sensing Symposium, Yokohama, Japan, 28 July–2 August 2019; pp. 5397–5400. [Google Scholar]
  52. Staatz, J.; Hollinger, F. West African Food Systems and Changing Consumer DEMANDS; OECD: Paris, France, 2016. [Google Scholar]
  53. Allen, T.; Heinrigs, P. Emerging Opportunities in the West African Food Economy; OECD: Paris, France, 2016. [Google Scholar]
  54. Perez, C.; Jones, E.M.; Kristjanson, P.; Cramer, L.; Thornton, P.K.; Förch, W.; Barahona, C.A. How resilient are farming households and communities to a changing climate in Africa? A gender-based perspective. Glob. Environ. Chang. 2015, 34, 95–107. [Google Scholar] [CrossRef] [Green Version]
  55. Diagne, M.; Demont, M.; Seck, P.A.; Diaw, A. Self-sufficiency policy and irrigated rice productivity in the Senegal River Valley. Food Secur. 2013, 5, 55–68. [Google Scholar] [CrossRef]
  56. De Graaff, J.; Kessler, A.; Nibbering, J.W. Agriculture and food security in selected countries in Sub-Saharan Africa: Diversity in trends and opportunities. Food Secur. 2011, 3, 195–213. [Google Scholar] [CrossRef] [Green Version]
  57. Djaman, K.; Balde, A.B.; Rudnick, D.R.; Ndiaye, O.; Irmak, S. Long-term trend analysis in climate variables and agricultural adaptation strategies to climate change in the Senegal River Basin. Int. J. Climatol. 2017, 37, 2873–2888. [Google Scholar] [CrossRef]
  58. Dorosh, P.A.; Wailes, E.J.; Pandey, S.; Byerlee, D.; Dawe, D.; Dobermann, A.; Mohanty, S. The international rice trade: Structure, conduct, and performance. In The Rice in the Global Economy: Strategic Research and Policy Issues for Food Security; Pandey, S., Byerlee, D., Dawe, D., Dobermann, A., Mohanty, S., Rozelle, S., Hardy, B., Eds.; International Rice Research Institute: LosBaños, Philippines, 2010; pp. 359–378. [Google Scholar]
  59. Hazell, P.B.R. Asia’s Green Revolution: Past achievements and future challenges. In Rice in the Global Economy: Strategic Research and Policy Issues for Food Security; International Rice Research Institute: LosBaños, Philippines, 2010; pp. 61–92. [Google Scholar]
  60. Dawe, D.; Pandey, S.; Nelson, A. Emerging trends and spatial patterns of rice production. In Rice in the Global Economy: Strategic Research and Policy Issues for Food Security; International Rice Research Institute (IRRI): LosBaños, Philippines, 2010. [Google Scholar]
  61. Lasko, K.; Vadrevu, K.P.; Tran, V.T.; Justice, C. Mapping double and single crop paddy rice with Sentinel-1A at varying spatial scales and polarizations in Hanoi, Vietnam. IEEE J. Sel. Top. Appl. Earth Obs. Remote Sens. 2018, 11, 498–512. [Google Scholar] [CrossRef] [PubMed]
  62. Nguyen, D.B.; Gruber, A.; Wagner, W. Mapping rice extent and cropping scheme in the Mekong Delta using Sentinel-1A data. Remote Sens. Lett. 2016, 7, 1209–1218. [Google Scholar] [CrossRef]
  63. Jin, Z.; Azzari, G.; You, C.; Di Tommaso, S.; Aston, S.; Burke, M.; Lobell, D.B. Smallholder maize area and yield mapping at national scales with Google Earth Engine. Remote Sens. Environ. 2019, 228, 115–128. [Google Scholar] [CrossRef]
  64. Ehlers, M. Spectral characteristics preserving image fusion based on Fourier domain filtering. In Remote Sensing for Environmental Monitoring, GIS Applications, and Geology IV; International Society for Optics and Photonics: Maspalomas, Canary Islands, Spain, 2004; Volume 5574, pp. 1–13. [Google Scholar]
  65. Gašparović, M.; Rumora, L.; Miler, M.; Medak, D. Effect of fusing Sentinel-2 and WorldView-4 imagery on the various vegetation indices. J. Appl. Remote Sens. 2019, 13, 36503. [Google Scholar] [CrossRef]
  66. Gibril, M.B.A.; Bakar, S.A.; Yao, K.; Idrees, M.O.; Pradhan, B. Fusion of RADARSAT-2 and multispectral optical remote sensing data for LULC extraction in a tropical agricultural area. Geocarto Int. 2017, 32, 735–748. [Google Scholar] [CrossRef]
  67. Pedregosa, F.; Varoquaux, G.; Gramfort, A.; Michel, V.; Thirion, B.; Grisel, O.; Blondel, M.; Prettenhofer, P.; Weiss, R.; Dubourg, V. Scikit-learn: Machine learning in Python. J. Mach. Learn. Res. 2011, 12, 2825–2830. [Google Scholar]
Figure 1. Fusion Approach for Remotely-Sensed Mapping of Agriculture (FARMA) workflow. Initially, an external segmentation is required prior to use within the FARMA approach. Step one includes the initial clumping and tiling of the raster segmentation which runs predominantly on a single core. Step two onwards, which includes the processing of individual tiles and population of zonal statistics, can be run in parallel across a distributed computing environment.
Remotesensing 12 03459 g001
Figure 2. Overview map with locations and examples for two segmentations used for examples Senegal A and Senegal B.
Remotesensing 12 03459 g002
Figure 3. Normalized Annual % Photosynthetic for 2017, 2018, and 2019 derived from Sentinel-3 imagery. This demonstrates that the method can determine broad agricultural trends at the field-scale using coarse spatial resolution imagery. An increase in time that the fields contained photosynthetic cover was observed from 2017 to 2019 although the physical cause behind this was not determined.
Remotesensing 12 03459 g003
Figure 4. Peak-NDVI occurrence (A) and associated peak-NDVI value (B) for an agricultural region in Senegal on a field-by-field basis. This demonstrates the height of the growing season in May/June where NDVI values were substantially larger than the surrounding land cover. Surrounding low NDVI values that peak in the winter months infer that the agriculture is artificially managed to produce yields at certain times of the year, likely via irrigation.
Remotesensing 12 03459 g004
Figure 5. Time-series trend in monthly Normalized Difference Vegetation Index (NDVI) for land cover in Senegal. Agricultural fields (A) demonstrate a typical trend indicative of 1 primary harvest per year. Objects with a low peak NDVI (B) demonstrate a small undulating trend associated with low seasonal increases in natural vegetation. Persistently objects (C) show a trend of mostly high NDVI values throughout the year with seasonal oscillations. Top and middle true color images are representative examples of target objects due to the unavailability of high-quality/seasonal imagery in Google Earth. Bottom true color image is the precise location in Google Earth. Here, FARMA demonstrates that beyond mapping distribution alone, time-series information can be derived at the field-scale.
Remotesensing 12 03459 g005
Figure 6. Mekong Delta study site overview showing the extent of the segmentation and inset of the segments in detail. Blank tiles in the segmentation are very single large single segments that were removed (>10,000 ha). (A) Overview map of the study site location. (B) 129 individual segment tiles containing polygons each populated with monthly S1 backscatter. (C) Zoom-in of one of the segment tiles showing the individual polygons, derived from the AKOMS segmentation method.
Remotesensing 12 03459 g006
Figure 7. Monthly Sentinel–1 backscatter for a single field in the Mekong Delta. The time-series backscatter values (red dots) were fitted with a Fourier series 1 term with offset to highlight three peaks in backscatter synonymous with the triple harvesting of rice in the region. Comparison to the Sentinel-1 imagery corroborates this trend.
Remotesensing 12 03459 g007
Figure 8. The run time of each step within FARMA, demonstrating the most time-intensive stages of the workflow for 1 m data for the Mekong Delta, Vietnam.
Remotesensing 12 03459 g008
Publisher’s Note: MDPI stays neutral with regard to jurisdictional claims in published maps and institutional affiliations.

