Water Quality Anomalies following the 2017 Hurricanes in Southwestern Puerto Rico: Absorption of Colored Detrital and Dissolved Material


Abstract
:
1. Introduction
2. Materials and Methods
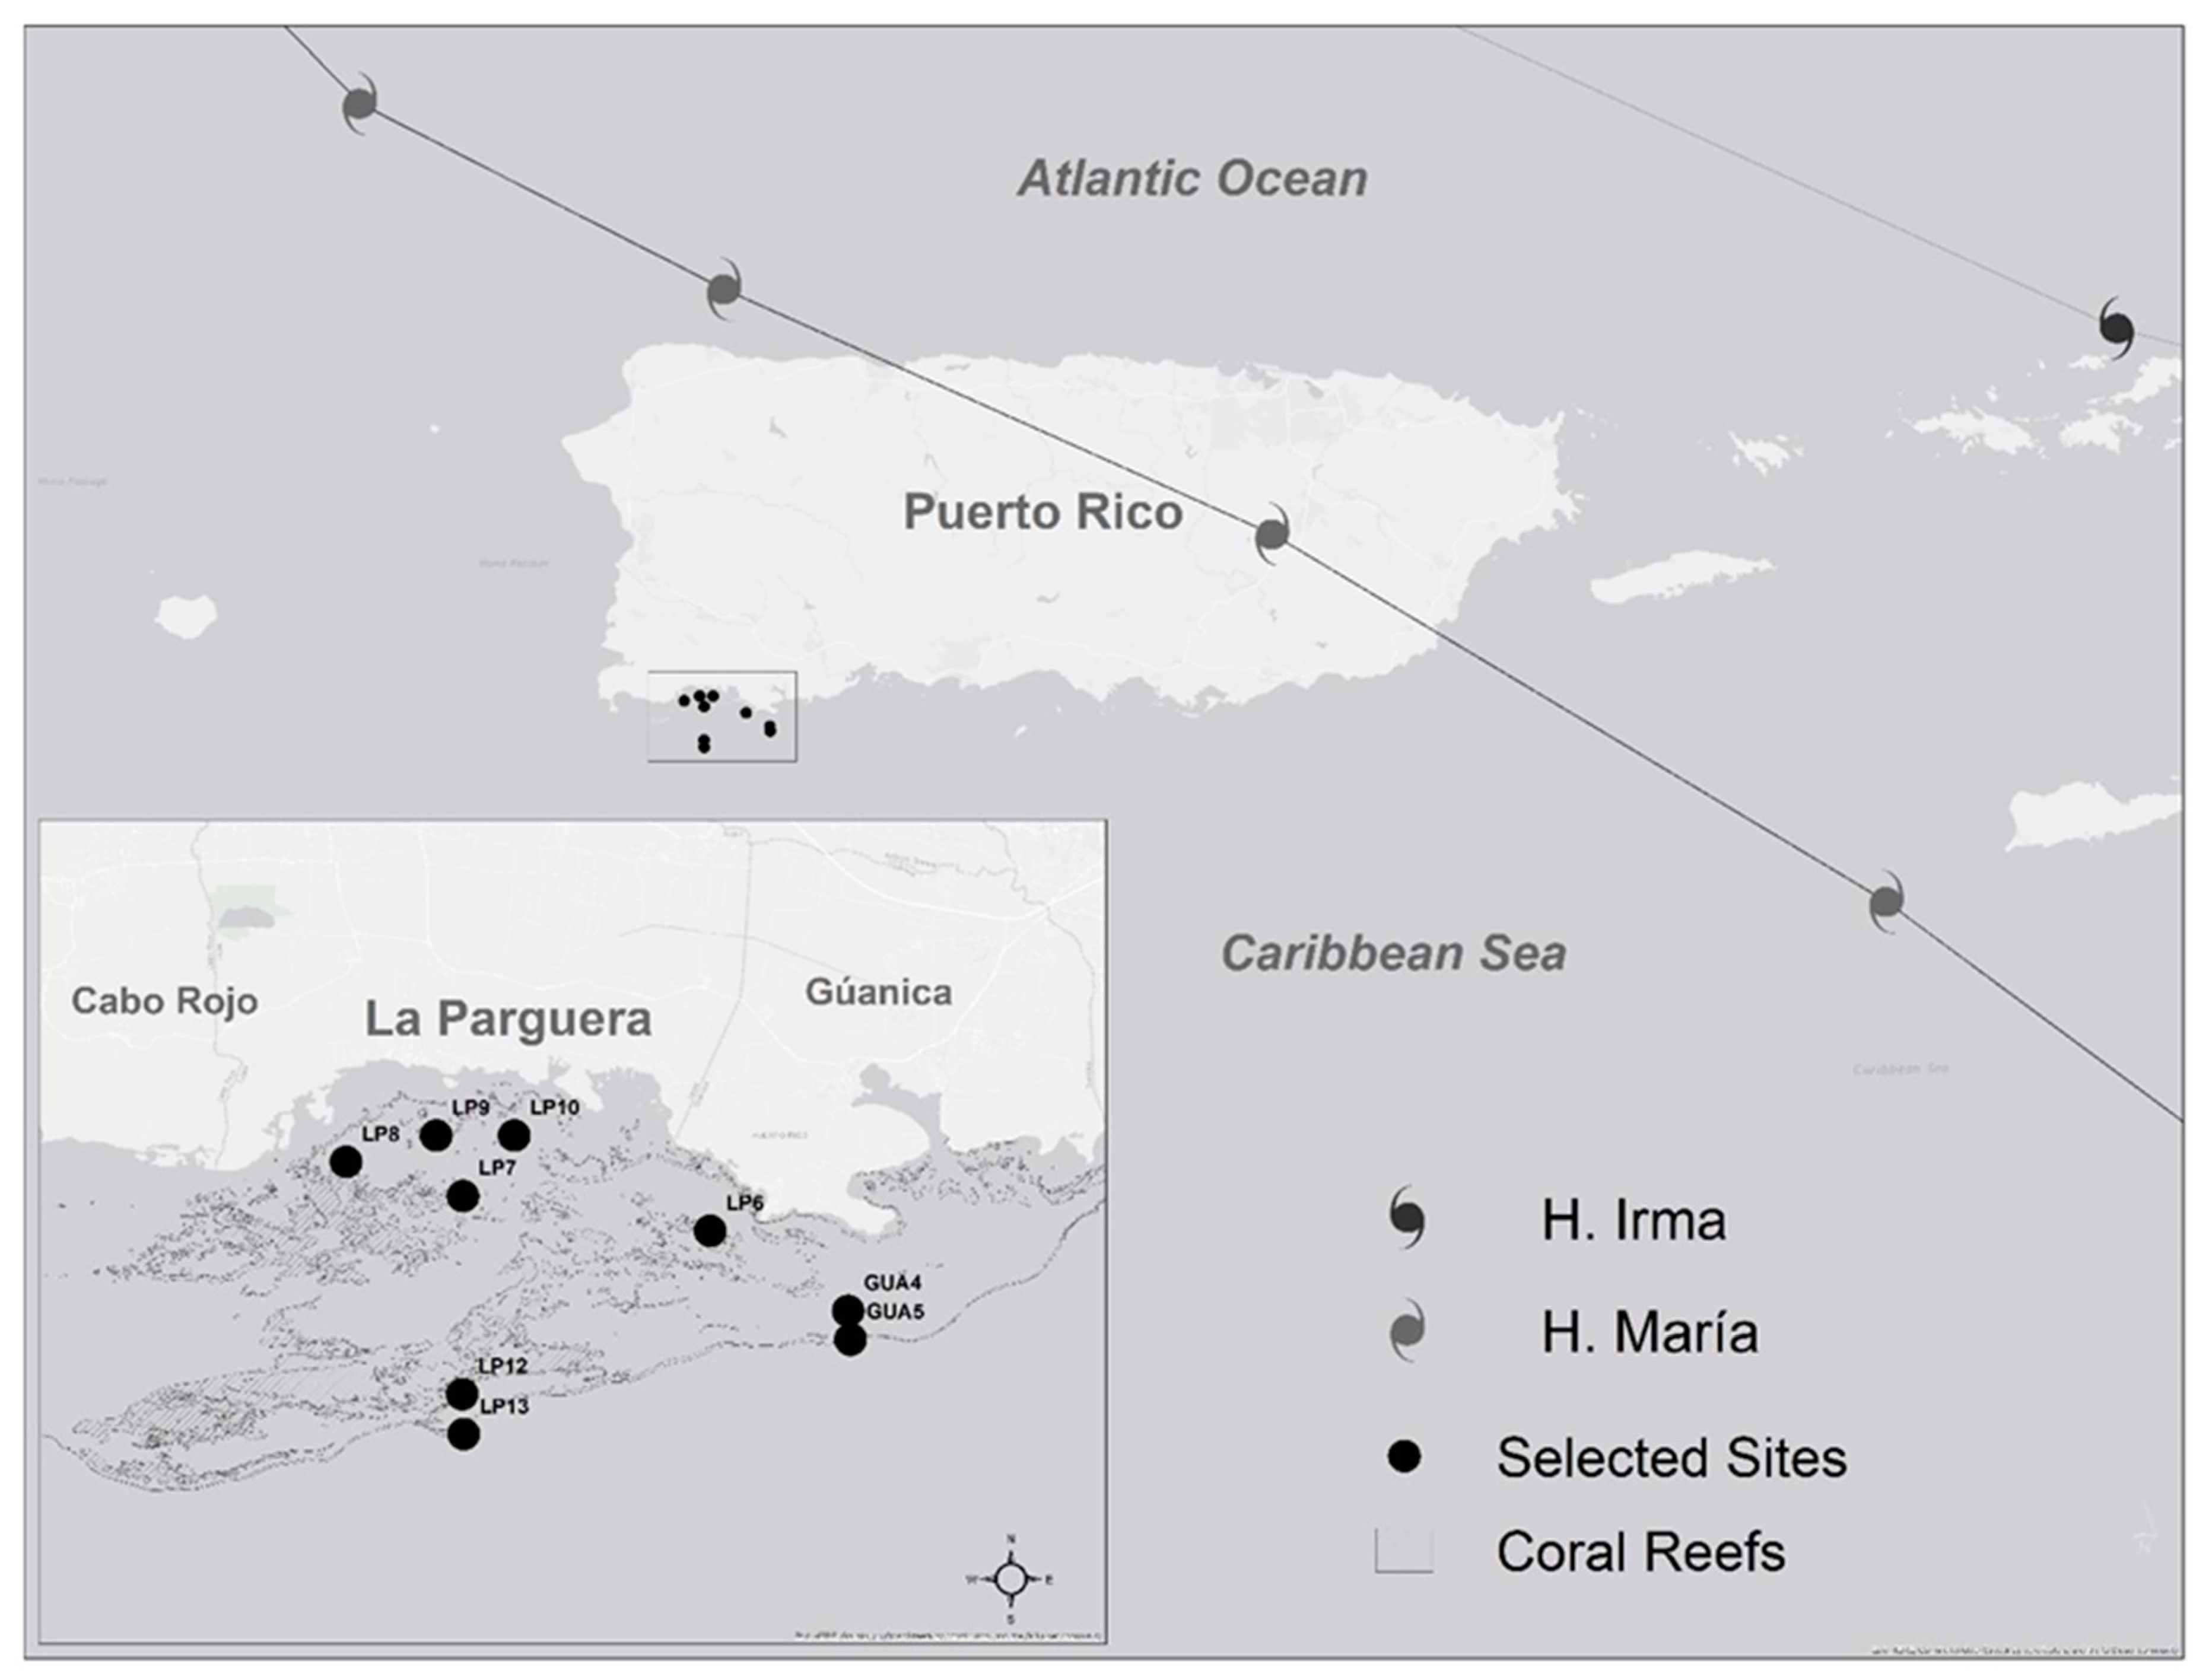
2.1. Study Site
2.2. Satellite Data
2.3. Water Quality Measurements—Field and Laboratory Analysis
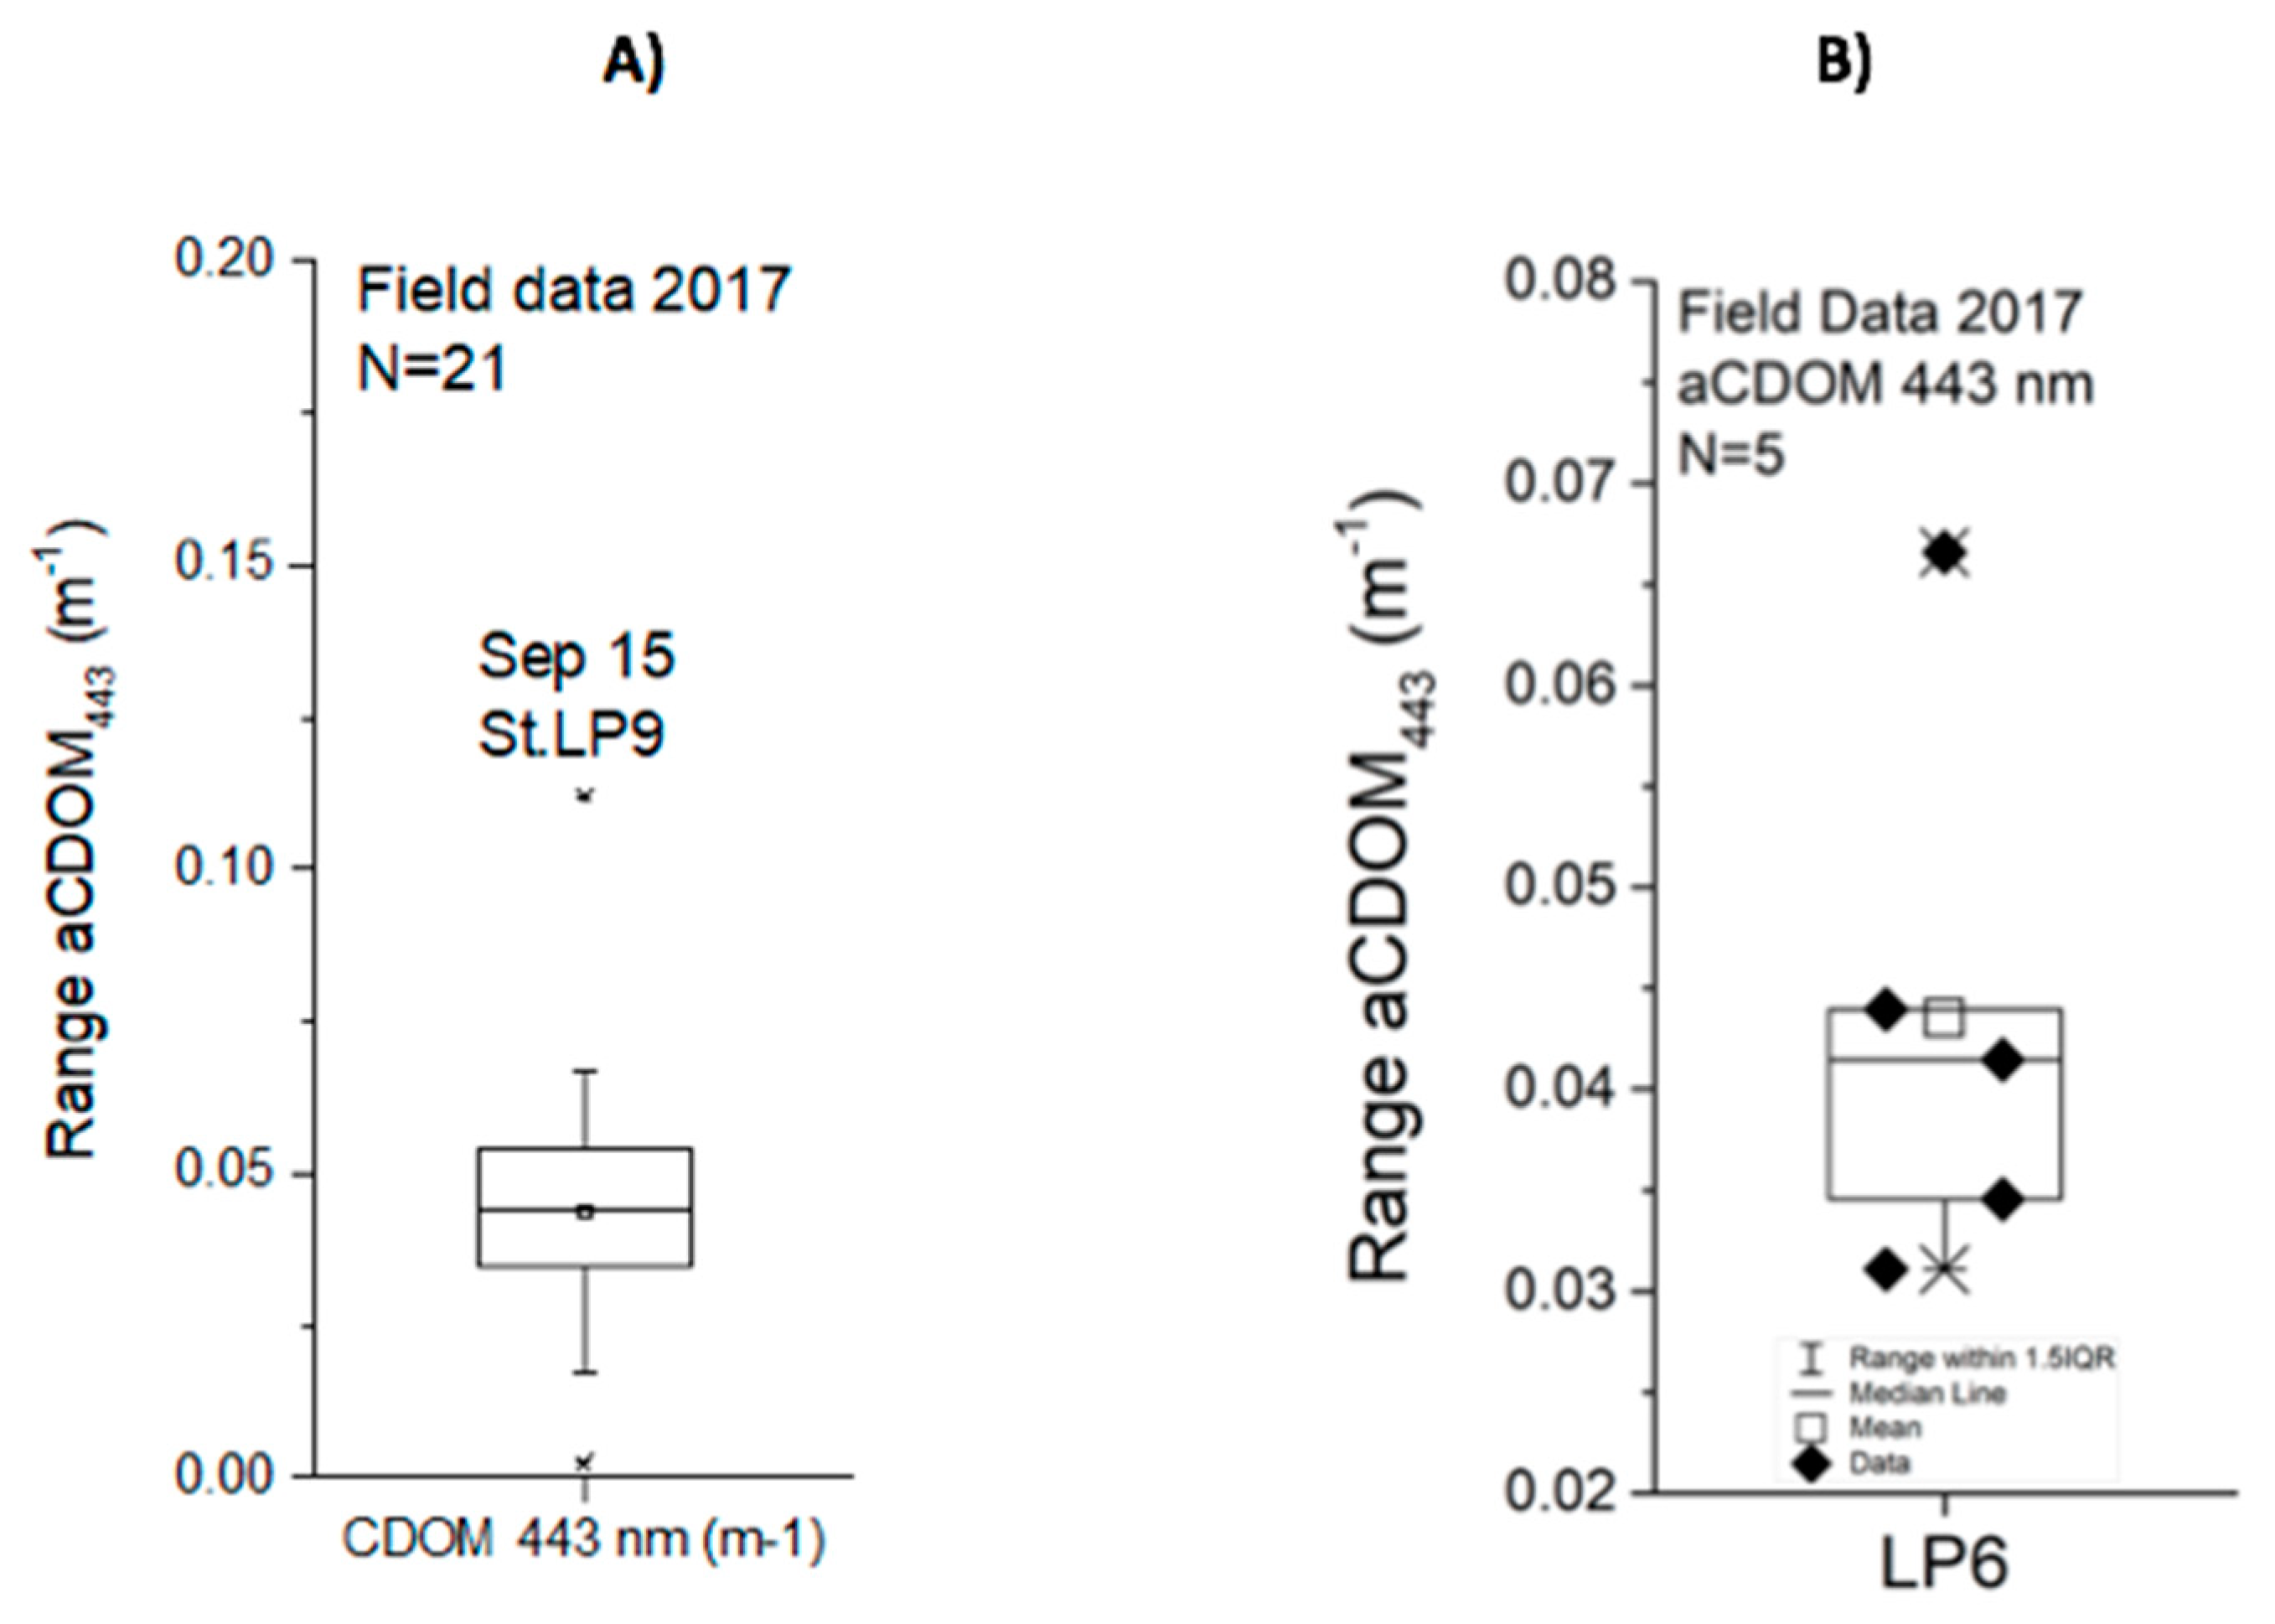
2.3.1. aCDOM
2.3.2. Satlantic HyperPro
2.4. Statistical Analysis
3. Results
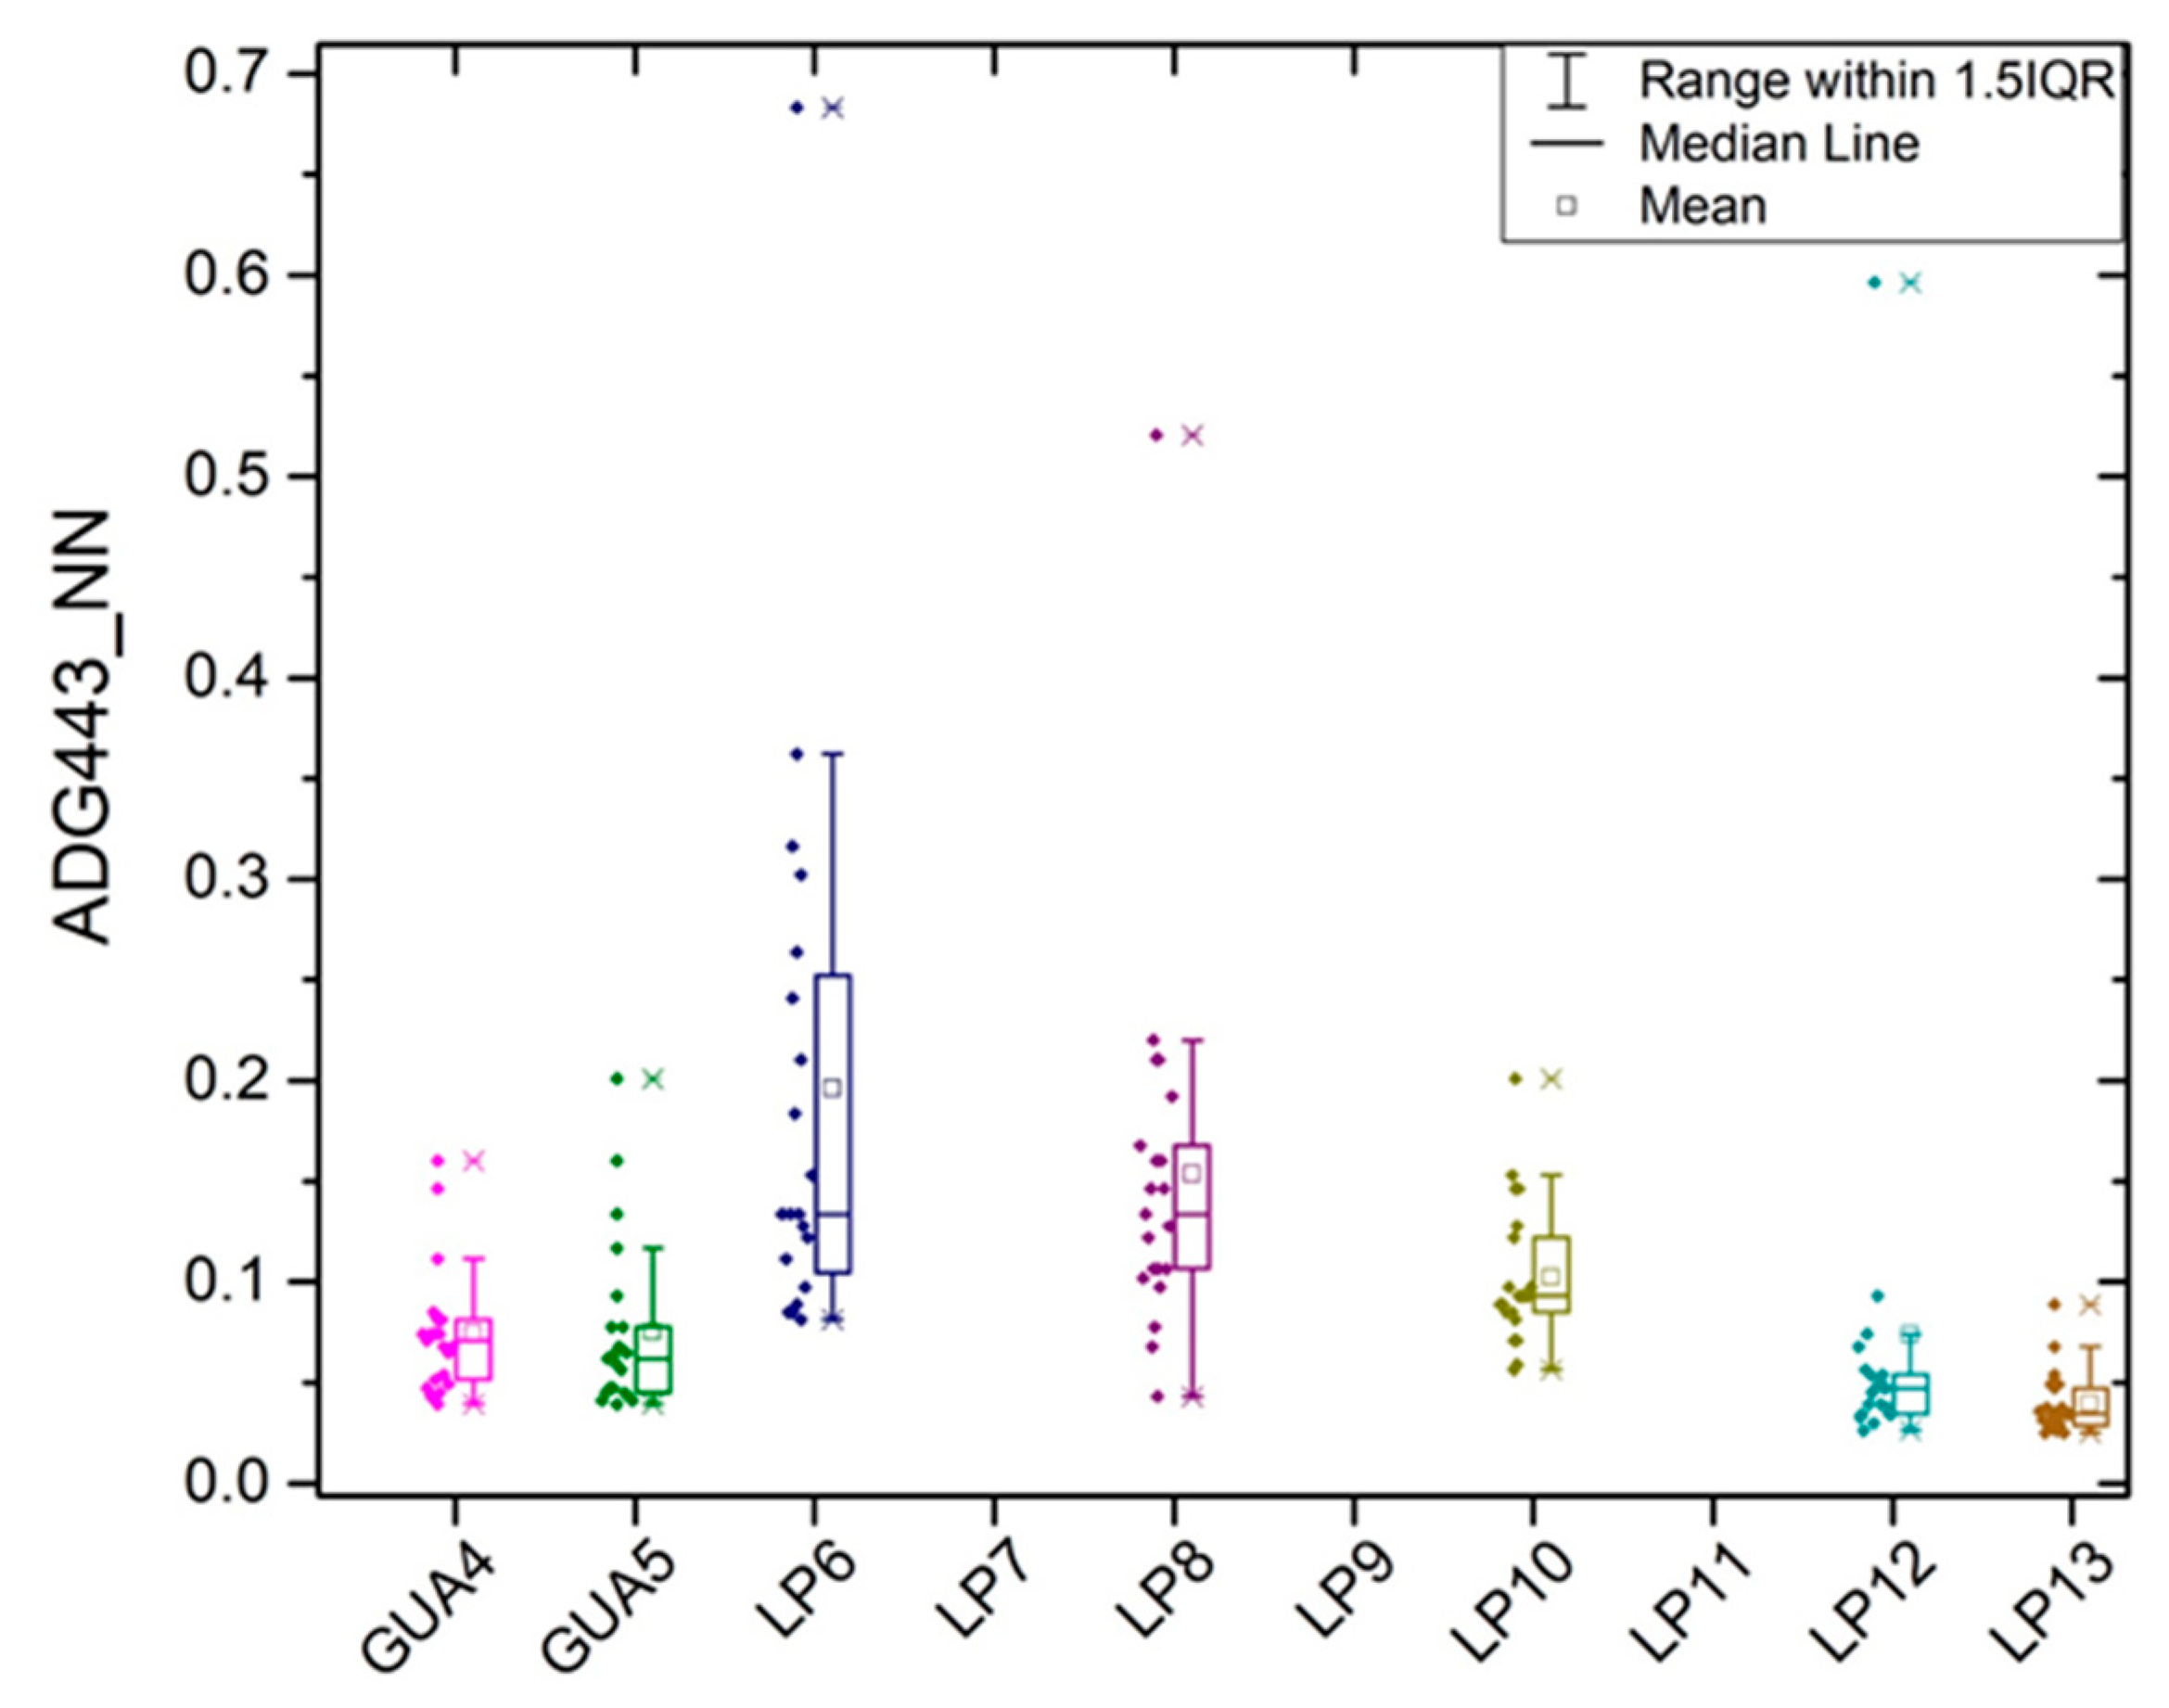
3.1. Satellite Data (ADG443_NN) and In Situ Data (aCDOM443)
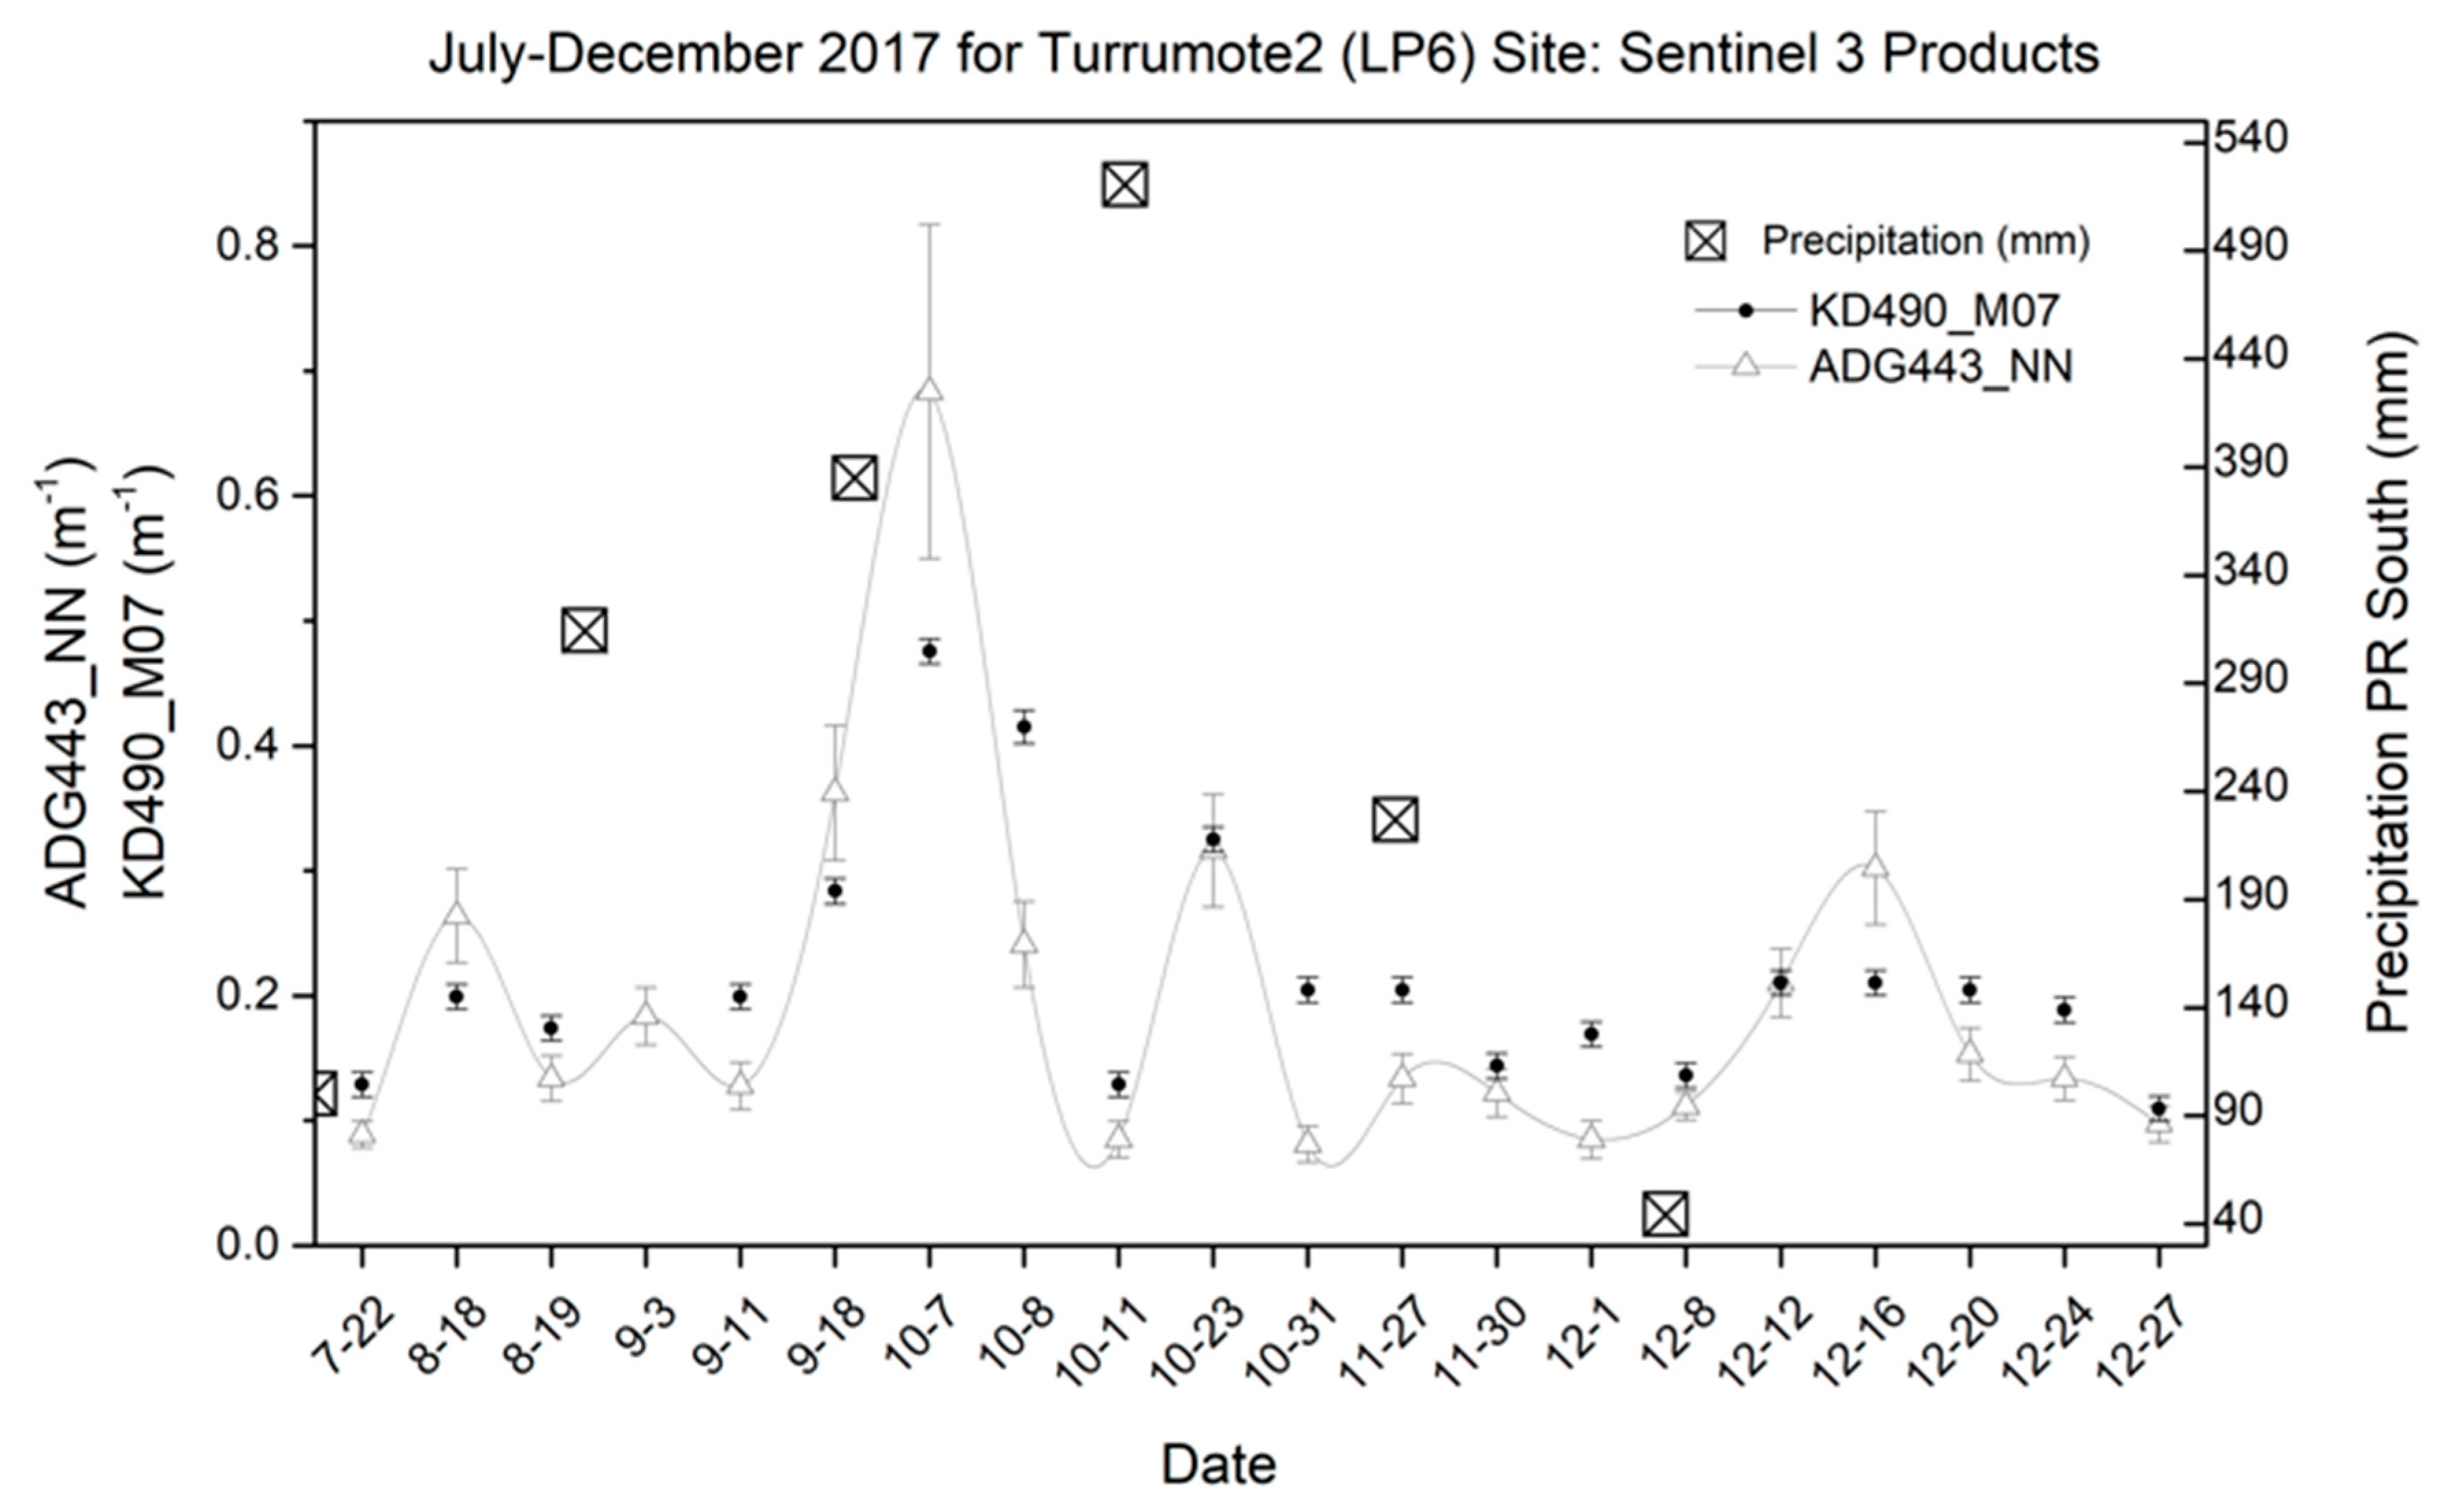
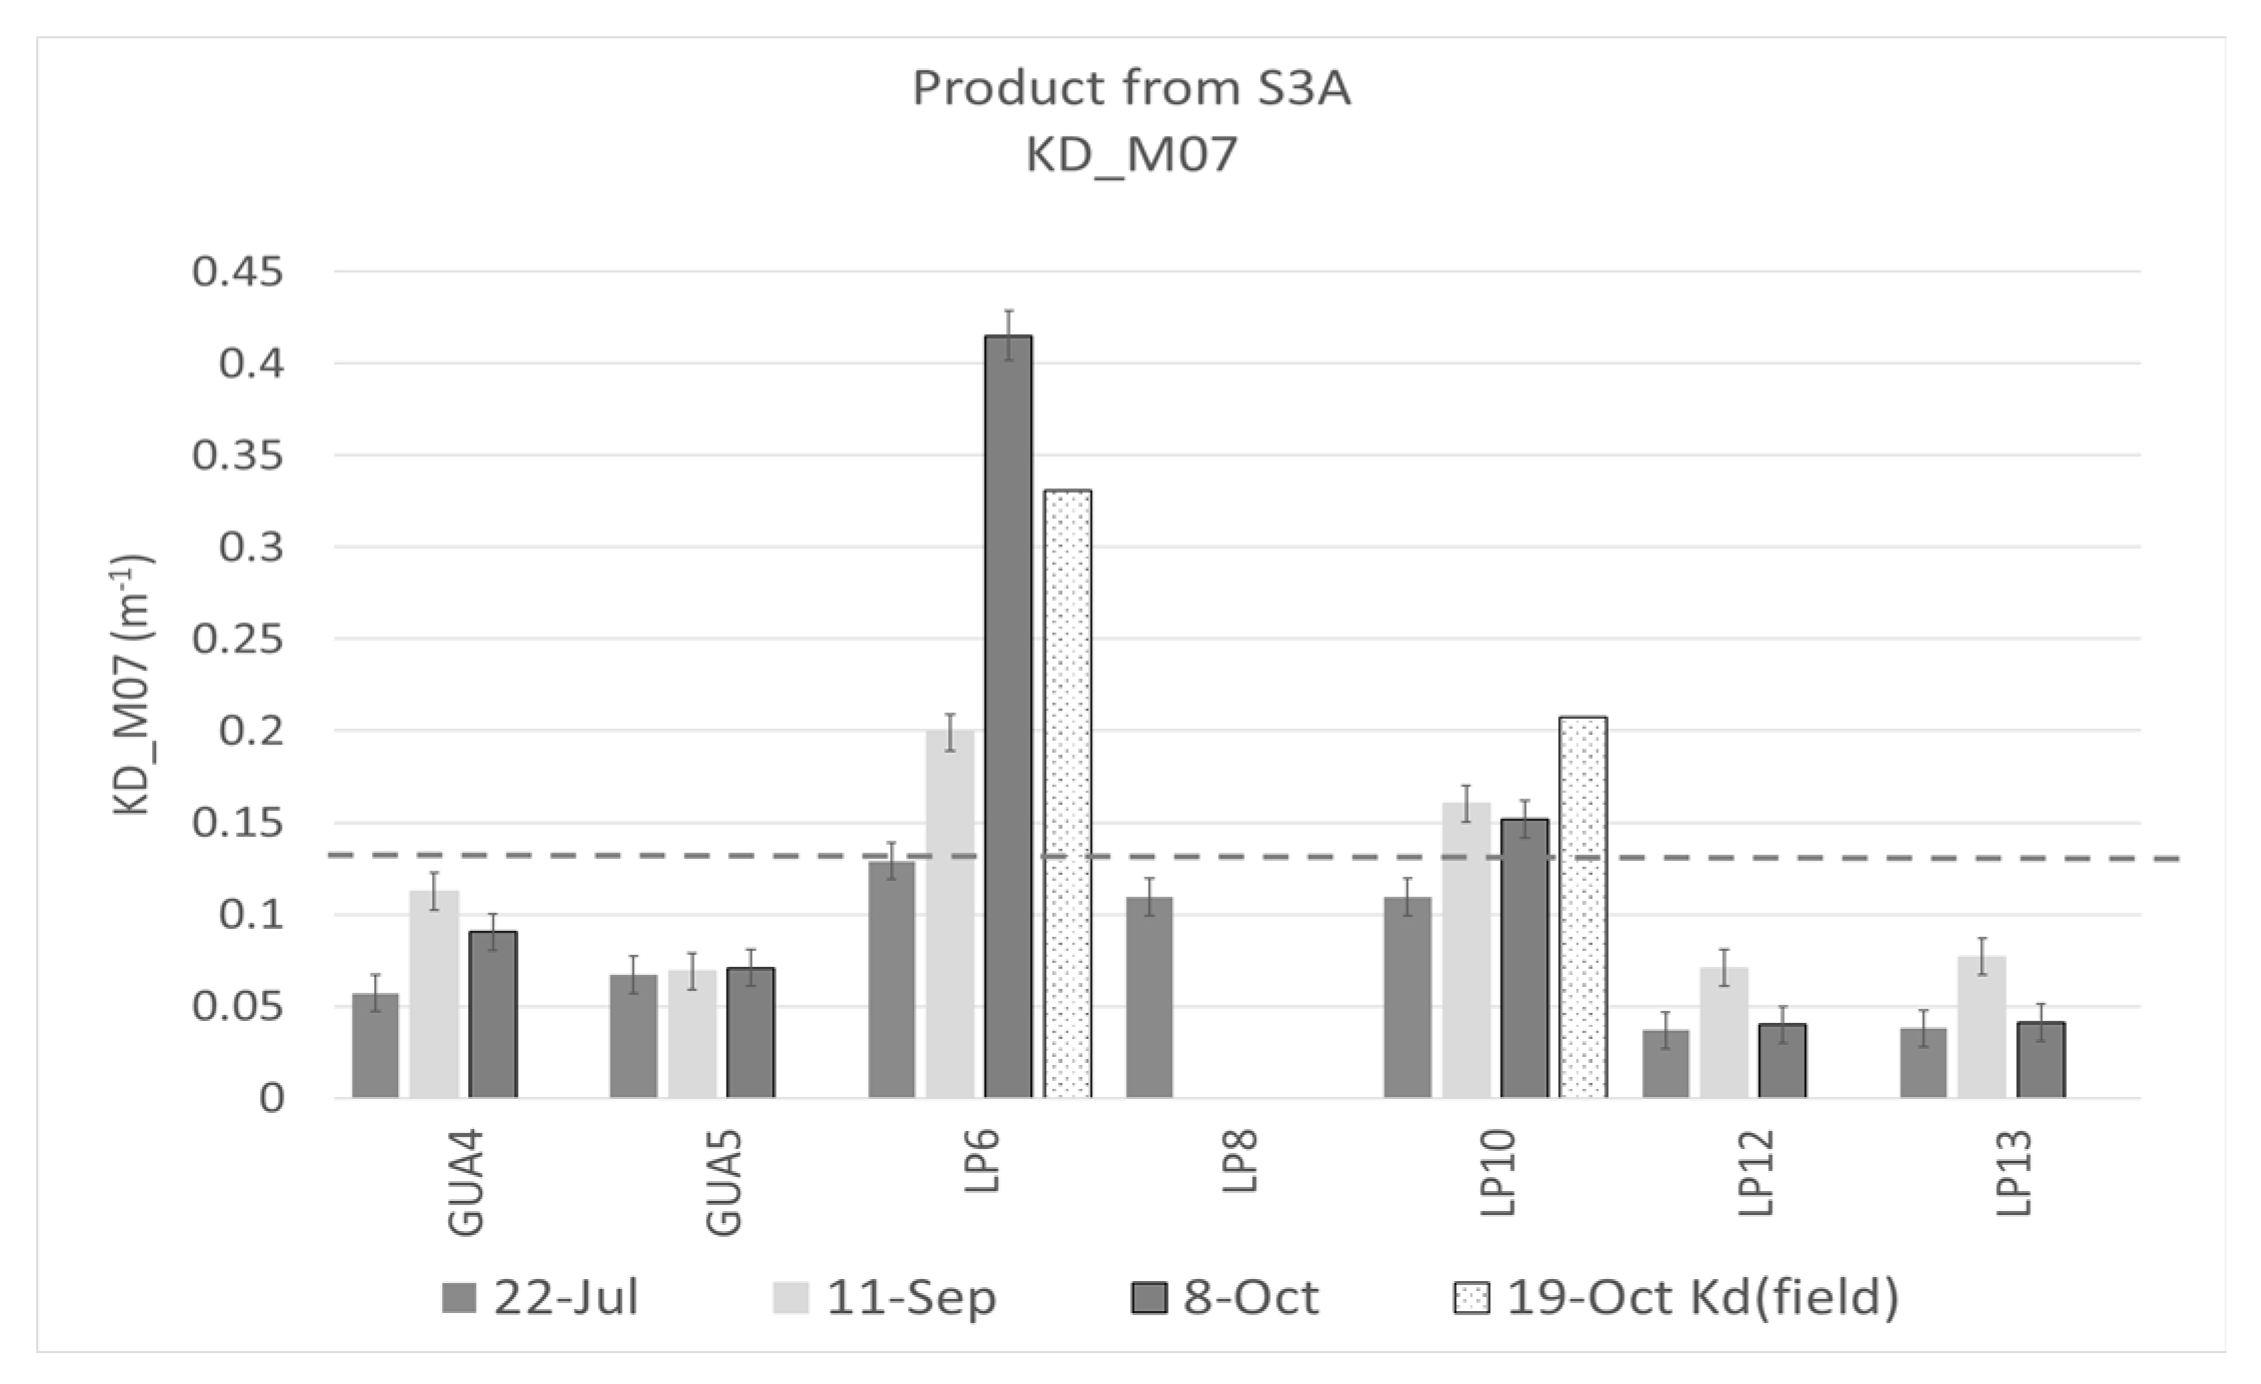
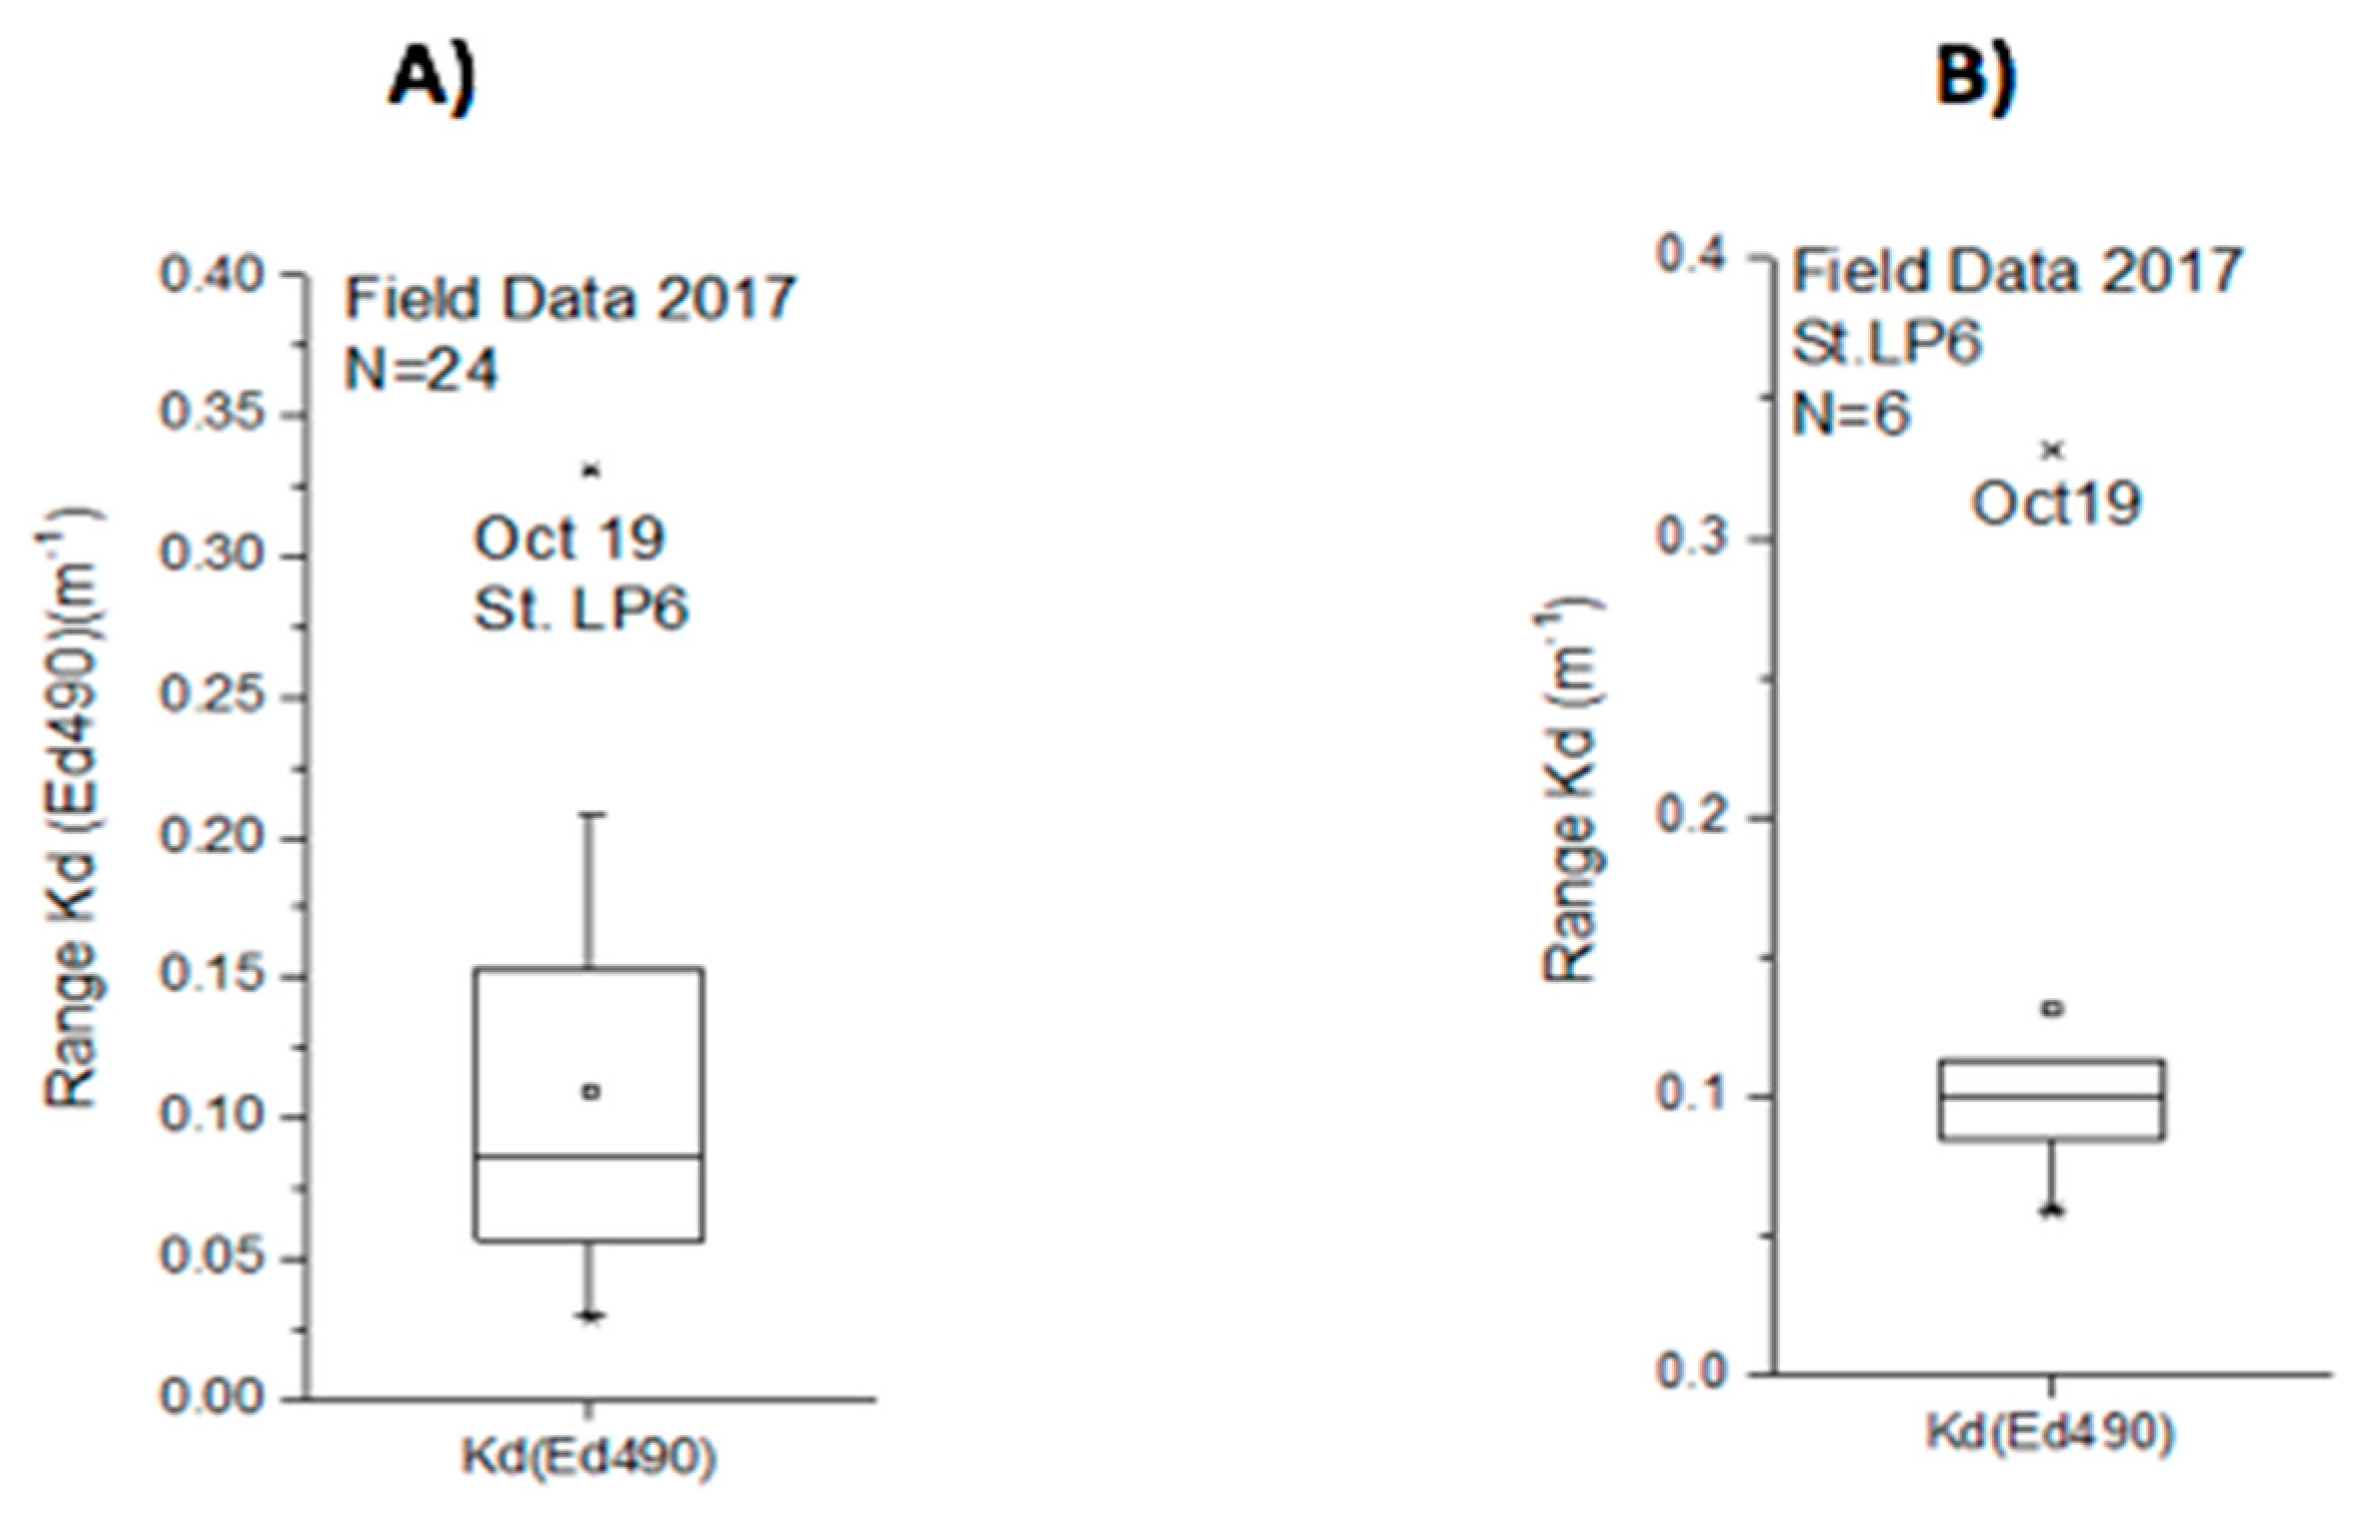
3.2. Kd490 and Correlation with ADG443/aCDOM443
4. Discussion
5. Conclusions
Author Contributions
Funding
Acknowledgments
Conflicts of Interest
References
- Pasch, R.J.; Penny, A.B.; Berg, R. National Hurricane Center (NHC) Tropical Cyclone Report Hurricane María (AL152017) 2019. Available online: https://www.nhc.noaa.gov/data/tcr/AL152017_Maria.pdf (accessed on 2 October 2019).
- Ramos-Scharrón, C.E.; Arima, E. Hurricane María’s precipitation signature in Puerto Rico: A conceivable presage of rains to come. Sci. Rep. 2019, 9, 15612. [Google Scholar] [CrossRef] [PubMed]
- Cangialosi, J.P.; Latto, A.S.; Berg, R. National Hurricane Center (NHC) Tropical Cyclone Report Hurricane Irma (AL112017) 2018. Available online: https://www.nhc.noaa.gov/data/tcr/AL112017_Irma.pdf (accessed on 2 October 2019).
- Huang, W.; Mukherjee, D.; Chen, S. Assessment of Hurricane Ivan impact on chlorophyll-a in Pensacola Bay by MODIS 250 m remote sensing. Mar. Pollut. Bull. 2011, 62, 490–498. [Google Scholar] [CrossRef] [PubMed]
- Lohrenz, S.E.; Cai, W.J.; Chen, X.; Tuel, M. Satellite assessment of bio-optical properties of northern gulf of Mexico coastal waters following Hurricanes Katrina and Rita. Sensors (Basel Switzerland) 2008, 8, 4135–4150. [Google Scholar] [CrossRef] [PubMed] [Green Version]
- Werdell, P.; McKinna, L.; Boss, E.; Ackleson, S.; Craig, S.; Gregg, W.; Lee, Z.; Maritorena, S.; Roesler, C.; Rousseaux, C.; et al. An overview of approaches and challenges for retrieving marine inherent optical properties from ocean color remote sensing. Prog. Oceanogr. 2018, 160, 186–212. [Google Scholar] [CrossRef] [PubMed]
- Otero, E. Spatial and temporal patterns of water quality indicators in reef systems of southwestern Puerto Rico. Caribb. J. Sci. 2009, 45, 168–180. [Google Scholar] [CrossRef]
- Wild-Allen, K.; Skerratt, J.; Whitehead, J.; Rizwi, F.; Parslow, J. Mechanisms driving estuarine water quality: A 3D biogeochemical model for informed management. Estuar. Coast. Shelf Sci 2013, 135, 33–45. [Google Scholar] [CrossRef]
- Gilbes, F.; López, J.M.; Yoshioka, P.M. Spatial and temporal variations of phytoplankton chlorophyll a and suspended particulate matter in Mayagüez Bay, Puerto Rico. J. Plankton Res. 1996, 18, 29–43. [Google Scholar] [CrossRef] [Green Version]
- García-Sais, J.R.; Williams, S.M.; Amirrezvani, A. Mortality, recovery, and community shifts of scleractinian corals in Puerto Rico one decade after the 2005 regional bleaching event. PeerJ 2017, 5, e3611. [Google Scholar] [CrossRef] [Green Version]
- Wetz, M.S.; Yoskowitz, D.W. An ‘extreme’ future for estuaries? Effects of extreme climatic events on estuarine water quality and ecology. Mar. Pollut. Bull. 2013, 69, 7–18. [Google Scholar] [CrossRef]
- Shi, W.; Wang, M. Observations of a Hurricane Katrina-induced phytoplankton bloom in the Gulf of Mexico. Geophys. Res. Lett. 2007, 34, 11607. [Google Scholar] [CrossRef]
- Peierls, B.L.; Christian, R.R.; Paerl, H.W. Water quality and phytoplankton as indicators of hurricane impacts on a large estuarine ecosystem. Estuaries 2003, 26, 1329–1343. [Google Scholar] [CrossRef]
- D’Sa, E.J.; Joshi, I.; Liu, B. Galveston Bay and coastal ocean optical-geochemical response to Hurricane Harvey from VIIRS ocean color. Geophys. Res. Lett 2018, 45, 10579–10589. [Google Scholar] [CrossRef] [PubMed] [Green Version]
- Liu, B.; D’Sa, E.J.; Joshi, I.D. Floodwater impact on Galveston Bay phytoplankton taxonomy, pigment composition and photo-physiological state following Hurricane Harvey from field and ocean color (Sentinel-3A OLCI) observations. Biogeosciences 2019, 16, 1975–2001. [Google Scholar] [CrossRef] [Green Version]
- Wachnicka, A.; Browder, J.; Jackson, T.; Louda, W.; Kelble, C.; Abdelrahman, O.; Stabenau, E.; Avila, C. Hurricane Irma’s impact on water quality and phytoplankton communities in Biscayne Bay (Florida, USA). Estuaries Coasts 2020, 43, 1217–1234. [Google Scholar] [CrossRef]
- Schaeffer, B.A.; Myer, M.H. Resolvable estuaries for satellite derived water quality within the continental United States. Remote Sens. Lett. 2020, 11, 535–544. [Google Scholar] [CrossRef] [Green Version]
- Gilbes, F.; Armstrong, R.A.; Webb, R.M.; Müller-Karger, F.E. SeaWifs helps assess hurricane impact on phytoplankton in Caribbean Sea. EOS Trans. Am. Geophys. Union 2001, 82, 529–533. [Google Scholar] [CrossRef]
- Miller, P.W.; Kumar, A.; Mote, T.L.; Moraes, F.D.S.; Mishra, D.R. Persistent hydrological consequences of Hurricane María in Puerto Rico. Geophys. Res. Lett. 2019, 46, 1413–1422. [Google Scholar] [CrossRef] [Green Version]
- Hernández, W.J.; Ortiz-Rosa, S.; Armstrong, R.A.; Geiger, E.F.; Eakin, C.M.; Warner, R.A. Quantifying the effects of Hurricanes Irma and María on coastal water quality in Puerto Rico using moderate resolution satellite sensors. Remote Sens. 2020, 12, 964. [Google Scholar] [CrossRef] [Green Version]
- Eakin, C.M.; Morgan, J.A.; Heron, S.F.; Smith, T.B.; Liu, G.; Alvarez-Filip, L.; Baca, B.; Bartels, E.; Bastidas, C.; Bouchon, C.; et al. Caribbean corals in crisis: Record thermal stress, bleaching, and mortality in 2005. PLoS ONE 2010, 5, e13969. [Google Scholar] [CrossRef] [Green Version]
- Weil, E.; Croquer, A.; Urreiztieta, I. Temporal variability and impact of coral diseases and bleaching in La Parguera, Puerto Rico from 2003–2007. Caribb. J. Sci. 2009, 45, 221–246. [Google Scholar] [CrossRef]
- Pittman, S.J.; Hile, S.D.; Jeffrey, C.F.G.; Clark, R.; Woody, K.; Herlach, B.D.; Caldow, C.; Monaco, M.E.; Appeldoorn, R. Coral reef ecosystems of Reserva Natural La Parguera (Puerto Rico): Spatial and temporal patterns in fish and benthic communities (2001–2007). In NOAA Technical Memorandum NOS NCCOS 107; NOAA: Silver Spring, MD, USA, 2010; p. 202. [Google Scholar]
- Hedley, J.D.; Roelfsema, C.M.; Phinn, S.R.; Mumby, P.J. Environmental and sensor limitations in optical remote sensing of coral reefs: Implications for monitoring and sensor design. Remote Sens. 2012, 4, 271–302. [Google Scholar] [CrossRef] [Green Version]
- Cooper, T.; Fabricius, K.E. Coral-based indicators of changes in water quality on nearshore coral reefs of the Great Barrier Reef. In Unpublished Report to Marine and Tropical Sciences Research Facility; Reef and Rainforest Research Centre Limited: Cairns, Australia, 2007; p. 31. [Google Scholar]
- Rogers, C.S. Responses of coral reefs and reef organisms to sedimentation. Mar. Ecol. Prog. Ser. 1990, 62, 185–202. [Google Scholar] [CrossRef]
- Scheffer, M.; Carpenter, S.; Foley, J.A.; Folke, C.; Walker, B. Catastrophic shifts in ecosystems. Nature 2001, 413, 591–596. [Google Scholar] [CrossRef]
- Daniel, J. Chemical characterization and cycling of dissolved organic matter. In Biogeochemistry of Marine Dissolved Organic Matter, 2nd ed.; Dennis, A., Hansell, A., Carlson, C.A., Eds.; Academic Press: London, UK, 2015; Chapter 2; pp. 21–63. ISBN 9780124059405. [Google Scholar] [CrossRef]
- Slonecker, E.T.; Jones, D.K.; Pellerin, B.A. The new Landsat 8 potential for remote sensing of colored dissolved organic matter (CDOM). Mar. Pollut. Bull. 2016, 107, 518–527. [Google Scholar] [CrossRef]
- Wei, J.; Lee, Z.; Ondrusek, M.; Mannino, A.; Tzortziou, M.; Armstrong, R. Spectral slopes of the absorption coefficient of colored dissolved and detrital material inverted from UV-visible remote sensing reflectance. J. Geophys. Res. Oceans 2016, 121, 1953–1969. [Google Scholar] [CrossRef]
- Aurin, D.; Mannino, A.; Lary, D.J. Remote sensing of CDOM, CDOM spectral slope, and dissolved organic carbon in the global ocean. Appl. Sci. 2018, 8, 2687. [Google Scholar] [CrossRef] [Green Version]
- IOCCG Protocol Series. Inherent optical property measurements and protocols: Absorption coefficient. In IOCCG Ocean Optics and Biogeochemistry Protocols for Satellite Ocean Colour Sensor Validation; Neeley, A.R., Mannino, A., Eds.; IOCCG: Dartmouth, NS, Canada, 2018; Volume 1.0. [Google Scholar]
- Vodacek, A.; Blough, N.V.; DeGrandpre, M.D.; Peltzer, E.T.; Nelson, R.K. Seasonal variation of CDOM and DOC in the Middle Atlantic Bight: Terrestrial inputs and photooxidation. Limnol. Oceanog. 1997, 42, 674–686. [Google Scholar] [CrossRef] [Green Version]
- Zhang, Y.; Liu, M.; Qin, B.; Feng, S. Photochemical degradation of chromophoric-dissolved organic matter exposed to simulated UV-B and natural solar radiation. Hydrobiologia 2009, 627, 159–168. [Google Scholar] [CrossRef]
- Castillo, C.D.; Miller, R.L. On the use of ocean color remote sensing to measure the transport of dissolved organic carbon by the Mississippi River plume. Remote Sens. Environ. 2008, 112, 836–844. [Google Scholar] [CrossRef] [Green Version]
- Mannino, A.; Russ, M.E.; Hooker, S.B. Algorithm development and validation for satellite-derived distributions of DOC and CDOM in the U.S. Middle Atlantic Bight. J. Geophys. Res. 2008, 113, C07051. [Google Scholar] [CrossRef]
- D’Sa, E.J.; Miller, R.L. Bio-optical properties in waters influenced by the Mississippi River during low flow conditions. Remote Sens. Environ. 2003, 84, 538–549. [Google Scholar] [CrossRef]
- Kirk, J.T.O. Light and Photosynthesis in Aquatic Ecosystems; Cambridge University Press: Cambridge, UK, 2011. [Google Scholar]
- Bauer, L.J.; Edwards, K.; Roberson, K.K.W.; Kendall, M.S.; Tormey, S.; Battista, T.A. Shallow-Water Benthic Habitats of Southwest Puerto Rico; NOAA Technical Memorandum, NOAA NOS NCCOS 155: Silver Spring, MD, USA, 2012; p. 39. [Google Scholar]
- Bonekamp, H.; Montagner, F.; Santacesaria, V.; Nogueira, L.C.; Wannop, S.; Tomazic, I.; O’Carroll, A.; Kwiatkowska, E.; Scharroo, R.; Wilson, H. Core operational Sentinel-3 marine data product services as part of the Copernicus Space Component. Ocean Sci. 2016, 12, 787–795. [Google Scholar] [CrossRef] [Green Version]
- Morel, A.; Huot, Y.; Gentili, B.; Werdell, P.J.; Hooker, S.B.; Franz, B.A. Examining the consistency of products derived from various ocean color sensors in open ocean (Case 1) waters in the perspective of a multi-sensor approach. Remote Sens. Environ. 2007, 111, 69–88. [Google Scholar] [CrossRef]
- Doerffer, R.; Schiller, H. The MERIS Case 2 water algorithm. Int. J. Remote Sens. 2007, 28, 517–535. [Google Scholar] [CrossRef]
- Maritorena, S.; Siegel, D.A. Consistent merging of satellite ocean colour data sets using a bio-optical model. Remote Sens. Environ. 2005, 94, 429–440. [Google Scholar] [CrossRef]
- Maritorena, S.; D’Andon, O.H.F.; Mangin, A.; Siegel, D.A. Merged satellite ocean color data products using a bio-optical model: Characteristics, benefits and issues. Remote Sens. Environ. 2010, 114, 1791–1804. [Google Scholar] [CrossRef]
- Ciotti, A.M.; Bricaud, A. Retrievals of a size parameter for phytoplankton and spectral light absorption by colored detrital matter from water-leaving radiances at SeaWiFS channels in a continental shelf region off Brazil. Limnol. Oceanogr. Methods 2006, 4, 237–253. [Google Scholar] [CrossRef] [Green Version]
- Miller, R.L.; Belz, M.; Del Castillo, C.; Trzska, R. Determining CDOM absorption spectra in diverse coastal environments using a multiple pathlength, liquid core waveguide system. Cont. Shelf Res. 2002, 22, 1301–1310. [Google Scholar] [CrossRef]
- Ondrusek, M.E.; Stengel, E.; AmpoUo, M.; Goode, W.; Ladner, S.; Feinholz, M. Validation of ocean color sensors using a profiling hyperspectral radiometer. In Proceedings of the SPIE—The International Society for Optical Engineering, Baltimore, MD, USA, 23 May 2014; Volume 9111, p. 91110Y. [Google Scholar] [CrossRef]
- Austin, R.W.; Petzold, T.J. The determination of the diffuse attenuation coefficient of sea water using the coastal zone color scanner. In Oceanography from Space. Marine Science; Gower, J.F.R., Ed.; Springer: Boston, MA, USA, 1981; Volume 13. [Google Scholar] [CrossRef]
- Corredor, J.E.; Morell, J.M. Seasonal variation of physical and biogeochemical features in eastern Caribbean Surface water. J. Geophys. Res. 2001, 106, 4517–4525. [Google Scholar] [CrossRef]
- Gilbes, F.; Armstrong, R.A. Phytoplankton dynamics in the eastern Caribbean Sea as detected with space remote sensing. Int. J. Remote Sens. 2004, 25, 1449–1453. [Google Scholar] [CrossRef] [Green Version]
- López, R.; López, J.M.; Morell, J.; Corredor, J.E.; Del Castillo, C.E. Influence of the Orinoco River on the primary production of eastern Caribbean surface waters. J. Geophys. Res. Oceans 2013, 118, 4617–4632. [Google Scholar] [CrossRef]
- Jones, R.; Giofre, N.; Luter, H.M.; Neoh, T.L.; Fisher, R.; Duckworth, A. Responses of corals to chronic turbidity. Sci. Rep. 2020, 10, 4762. [Google Scholar] [CrossRef] [PubMed]
- Ateweberhan, M.; Feary, D.A.; Keshavmurthy, S.; Chen, A.; Schleyer, M.H.; Sheppard, C.R. Climate change impacts on coral reefs: Synergies with local effects, possibilities for acclimation, and management implications. Mar. Pollut. Bull. 2013, 74, 526–539. [Google Scholar] [CrossRef]
- Bessell-Browne, P.; Negri, A.P.; Fisher, R.; Clode, P.L.; Duckworth, A.; Jones, R. Impacts of turbidity on corals: The relative importance of light limitation and suspended sediments. Mar. Pollut. Bull. 2017, 117, 161–170. [Google Scholar] [CrossRef] [PubMed]
- Fourney, F.; Figueiredo, J. Additive negative effects of anthropogenic sedimentation and warming on the survival of coral recruits. Sci. Rep. 2017, 7, 12380. [Google Scholar] [CrossRef] [Green Version]
- Bessette-Kirton, E.K.; Cerovski-Darriau, C.; Schulz, W.H.; Coe, J.A.; Kean, J.W.; Godt, J.W.; Thomas, M.A.; Hughes, K.S. Landslides triggered by Hurricane María: Assessment of an extreme event in Puerto Rico. GSA Today Geol. Soc. Am. 2019, 29, 4–10. [Google Scholar] [CrossRef] [Green Version]
- Ortiz-Rosa, S. Optical Properties and Photochemical Response of Colored Dissolved Organic Matter (CDOM) at Jobos Bay National Estuarine Research Reserve (JOBANERR), Puerto Rico. Master’s Thesis, Department of Marine Sciences, University of Puerto Rico, Mayagüez, Puerto Rico, 2010. [Google Scholar]
- Edmunds, P.J.; Tsounis, G.; Boulon, R.; Bramanti, L. Acute effects of back-to-back hurricanes on the underwater light regime of a coral reef. Short Article. Mar. Biol. 2019, 166, 20. [Google Scholar] [CrossRef]
- Edmunds, P.J.; Tsounis, G.; Boulon, R.; Bramanti, L. Long-term variation in light intensity on a coral reef. Coral Reefs 2018, 37, 955–965. [Google Scholar] [CrossRef]


| S3_ADG443 | 7/22–9/3 | 9/11–10/8 | 10/11–11/27 | 11/30–12/12 | 12/16–12/27 |
|---|---|---|---|---|---|
| Mean | 0.1675 | 0.3536 | 0.1540 | 0.1322 | 0.1716 |
| SD | 0.0750 | 0.2398 | 0.1108 | 0.0544 | 0.0901 |
| SE of mean | 0.0375 | 0.1199 | 0.0554 | 0.0272 | 0.0451 |
| Variance | 0.0056 | 0.0575 | 0.0123 | 0.0030 | 0.0081 |
| Sum | 0.6699 | 1.4143 | 0.6160 | 0.5288 | 0.6863 |
| Minimum | 0.0889 | 0.1277 | 0.0812 | 0.0849 | 0.0973 |
| Median | 0.1586 | 0.3016 | 0.1093 | 0.1168 | 0.1434 |
| Maximum | 0.2638 | 0.6834 | 0.3162 | 0.2103 | 0.3022 |
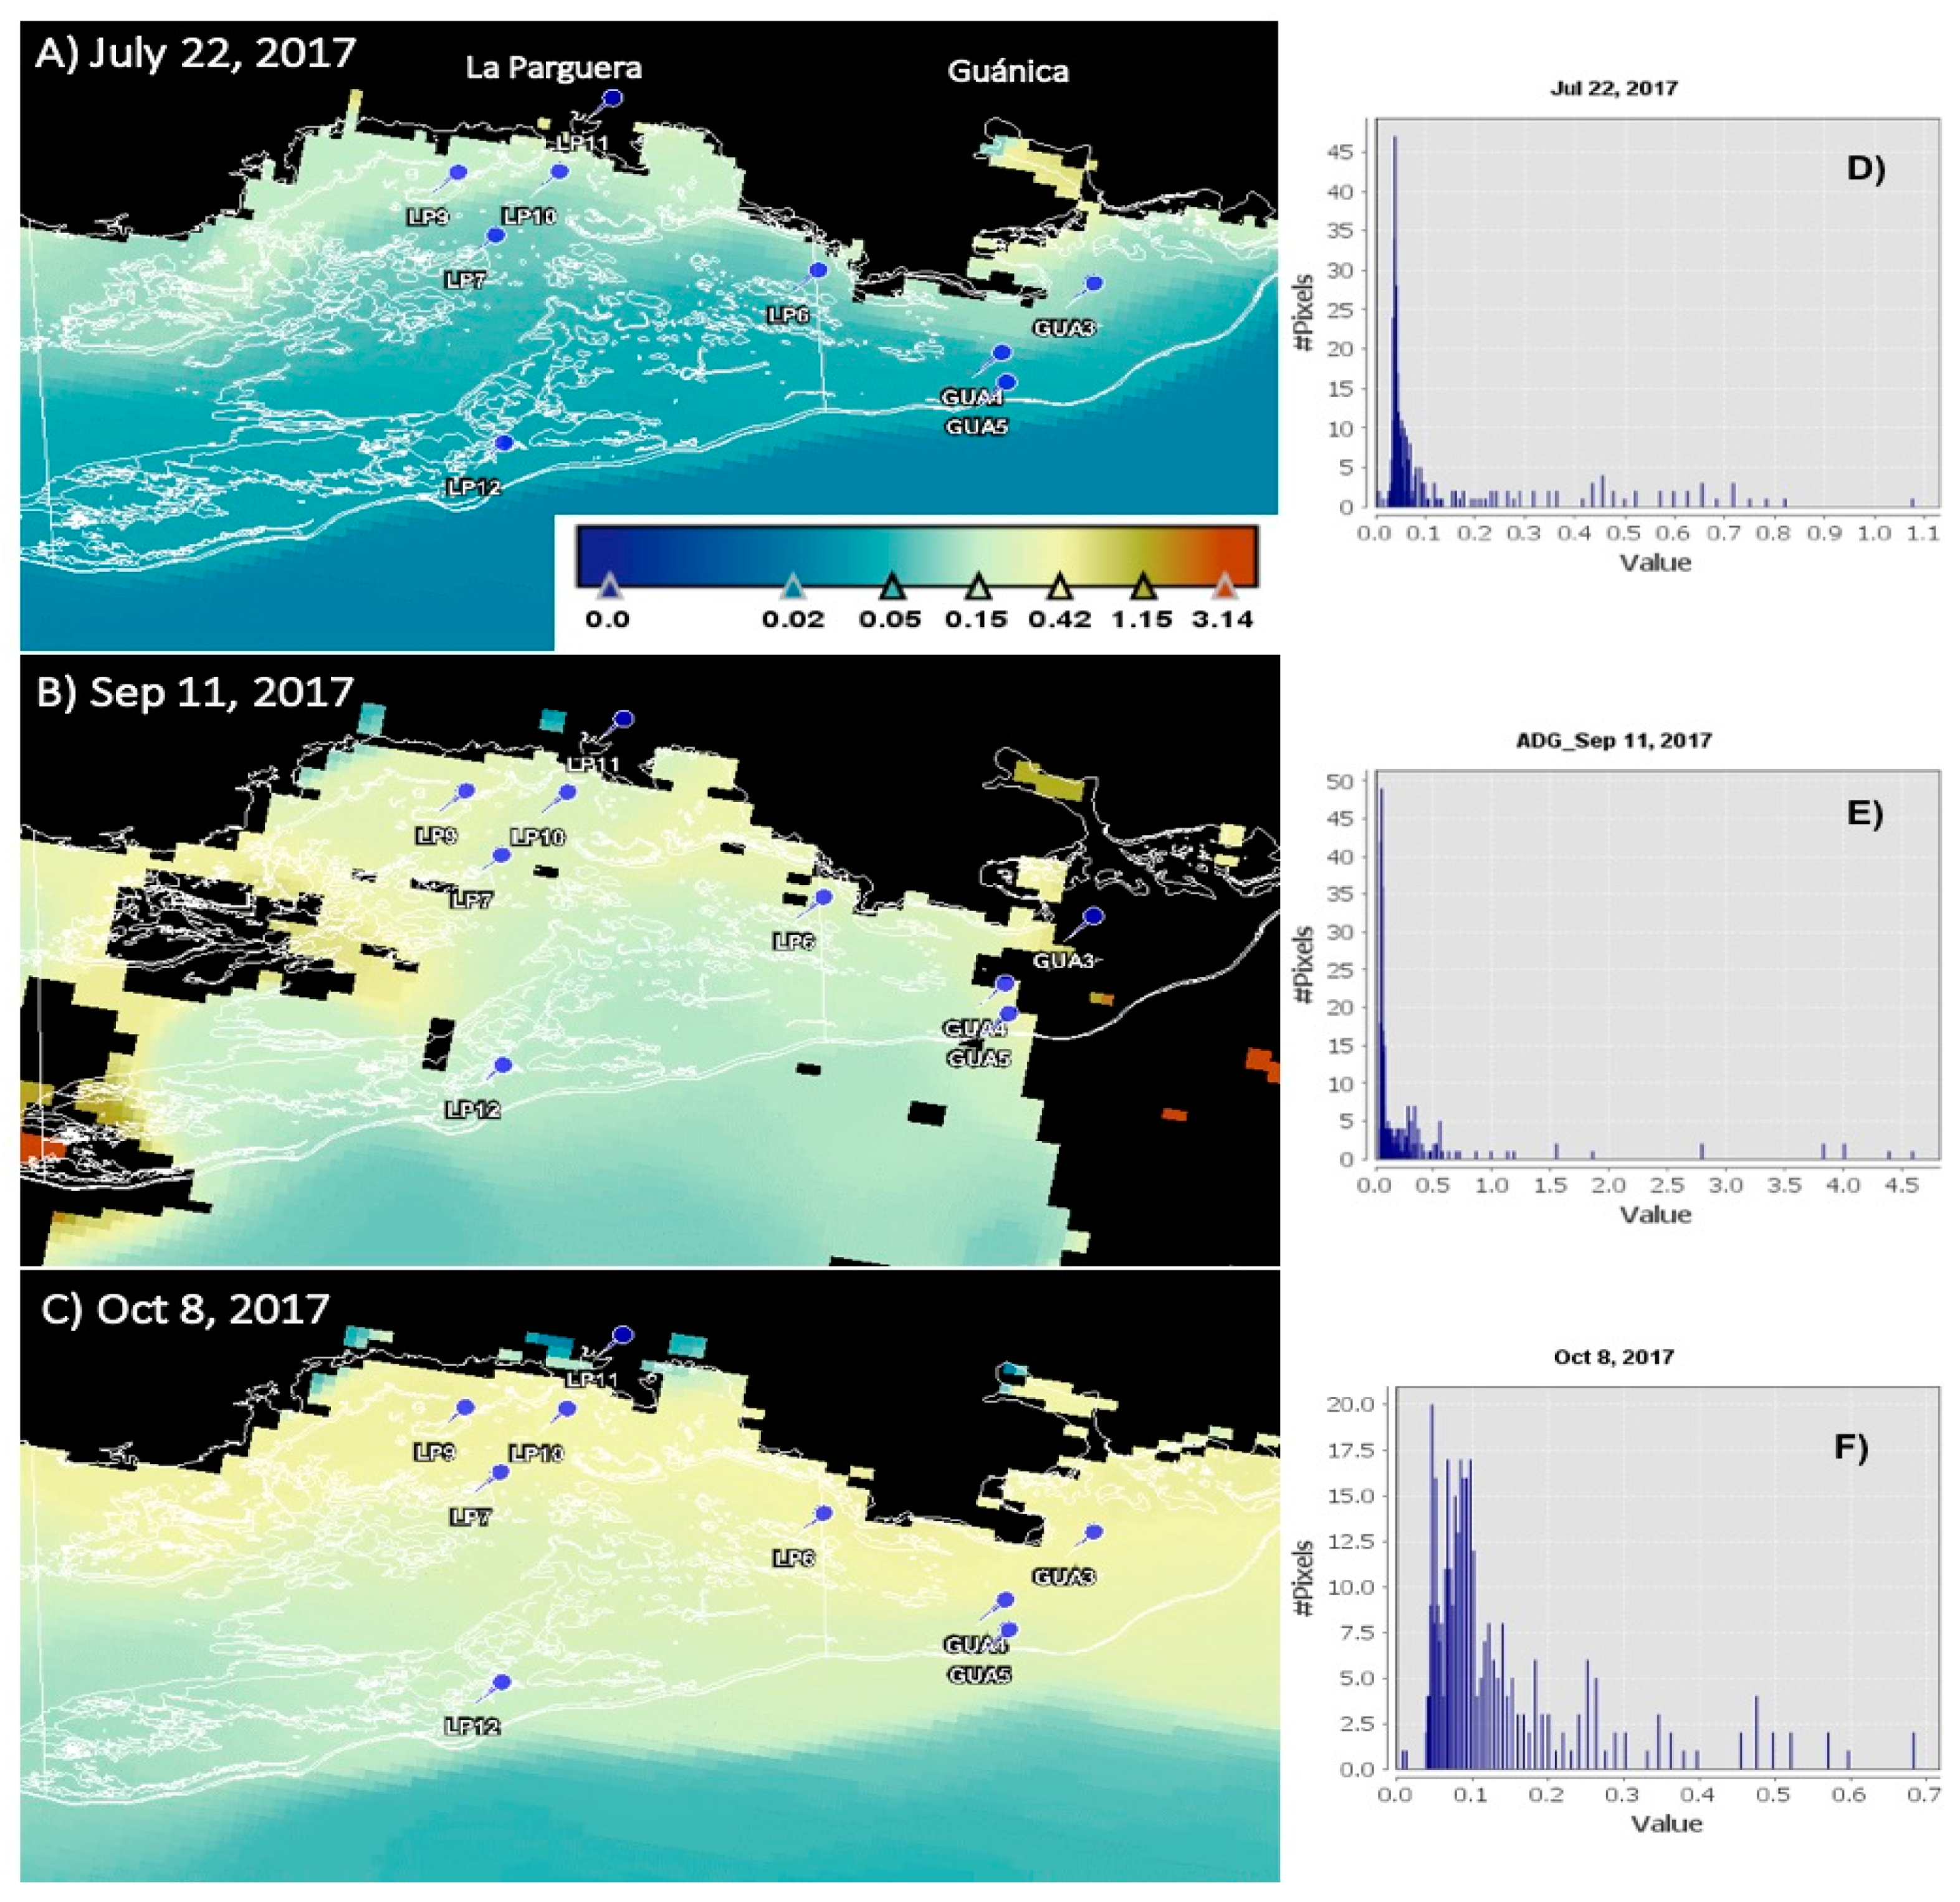
| S3_ADG over Coral Reef Areas | 22-Jul | 11-Sep | 8-Oct |
|---|---|---|---|
| Number of considered pixels | 349 | 339 | 365 |
| Ratio of considered pixels (%) | 12.1138 | 11.7667 | 12.3020 |
| Min. | 0.0053 | 0.0343 | 0.0080 |
| Max. | 1.0752 | 4.5858 | 0.6834 |
| Mean | 0.1097 | 0.2353 | 0.1216 |
| SD | 0.1650 | 0.5991 | 0.1086 |
| CV | 1.5048 | 2.5458 | 0.8932 |
| Median | 0.0435 | 0.0628 | 0.0849 |
| S3_KD490 | 7/22–9/3 | 9/11–10/8 | 10/11–11/27 | 11/30–12/12 | 12/16–12/27 |
|---|---|---|---|---|---|
| Mean | 0.1673 | 0.3433 | 0.2158 | 0.1648 | 0.1783 |
| SD | 0.0356 | 0.1251 | 0.0811 | 0.0335 | 0.0468 |
| SE of mean | 0.0205 | 0.0626 | 0.0405 | 0.0167 | 0.0234 |
| Variance | 0.0013 | 0.0157 | 0.0066 | 0.0011 | 0.0022 |
| Sum | 0.5019 | 1.3734 | 0.8632 | 0.6593 | 0.7131 |
| Minimum | 0.1289 | 0.1992 | 0.1289 | 0.1361 | 0.1095 |
| Median | 0.1738 | 0.3493 | 0.2047 | 0.1564 | 0.1966 |
| Maximum | 0.1992 | 0.4755 | 0.3249 | 0.2103 | 0.2103 |
Publisher’s Note: MDPI stays neutral with regard to jurisdictional claims in published maps and institutional affiliations. |
© 2020 by the authors. Licensee MDPI, Basel, Switzerland. This article is an open access article distributed under the terms and conditions of the Creative Commons Attribution (CC BY) license (http://creativecommons.org/licenses/by/4.0/).
Share and Cite
Ortiz-Rosa, S.; Hernández, W.J.; Williams, S.M.; Armstrong, R.A. Water Quality Anomalies following the 2017 Hurricanes in Southwestern Puerto Rico: Absorption of Colored Detrital and Dissolved Material. Remote Sens. 2020, 12, 3596. https://0-doi-org.brum.beds.ac.uk/10.3390/rs12213596
Ortiz-Rosa S, Hernández WJ, Williams SM, Armstrong RA. Water Quality Anomalies following the 2017 Hurricanes in Southwestern Puerto Rico: Absorption of Colored Detrital and Dissolved Material. Remote Sensing. 2020; 12(21):3596. https://0-doi-org.brum.beds.ac.uk/10.3390/rs12213596
Chicago/Turabian StyleOrtiz-Rosa, Suhey, William J. Hernández, Stacey M. Williams, and Roy A. Armstrong. 2020. "Water Quality Anomalies following the 2017 Hurricanes in Southwestern Puerto Rico: Absorption of Colored Detrital and Dissolved Material" Remote Sensing 12, no. 21: 3596. https://0-doi-org.brum.beds.ac.uk/10.3390/rs12213596