Article

Mapping Forest Fire Risk—A Case Study in Galicia (Spain)

by
Ana Novo
1,*,
Noelia Fariñas-Álvarez
2,
Joaquín Martínez-Sánchez
1,
Higinio González-Jorge
2,
José María Fernández-Alonso
3 and
Henrique Lorenzo
4
1
Geotech Group, CINTECX, Department of Natural Resources and Environmental Engineering, School of Mining Engineering, University of Vigo, 36310 Vigo, Spain
2
Geotech Group, Department of Natural Resources and Environmental Engineering, School of Aerospace Engineering, University of Vigo, 32004 Ourense, Spain
3
Lourizán Forest Research Center, Xunta de Galicia, P.O. Box 127, 36080 Pontevedra, Spain
4
Geotech Group, CINTECX, Department of Natural Resources and Environmental Engineering, School of Forestry Engineering, University of Vigo, 36005 Pontevedra, Spain
*
Author to whom correspondence should be addressed.
Remote Sens. 2020, 12(22), 3705; https://0-doi-org.brum.beds.ac.uk/10.3390/rs12223705
Submission received: 23 October 2020 / Revised: 9 November 2020 / Accepted: 10 November 2020 / Published: 11 November 2020

Abstract

:
The optimization of forest management in roadsides is a necessary task in terms of wildfire prevention in order to mitigate their effects. Forest fire risk assessment identifies high-risk locations, while providing a decision-making support about vegetation management for firefighting. In this study, nine relevant parameters: elevation, slope, aspect, road distance, settlement distance, fuel model types, normalized difference vegetation index (NDVI), fire weather index (FWI), and historical fire regimes, were considered as indicators of the likelihood of a forest fire occurrence. The parameters were grouped in five categories: topography, vegetation, FWI, historical fire regimes, and anthropogenic issues. This paper presents a novel approach to forest fire risk mapping the classification of vegetation in fuel model types based on the analysis of light detection and ranging (LiDAR) was incorporated. The criteria weights that lead to fire risk were computed by the analytic hierarchy process (AHP) and applied to two datasets located in NW Spain. Results show that approximately 50% of the study area A and 65% of the study area B are characterized as a 3-moderate fire risk zone. The methodology presented in this study will allow road managers to determine appropriate vegetation measures with regards to fire risk. The automation of this methodology is transferable to other regions for forest prevention planning and fire mitigation.

Graphical Abstract

1. Introduction

One major environmental concern is the occurrence of forest fires, that affect forest preservation, create economic and ecological damage, and cause human suffering. Spain is among the top five European countries with the highest number of wildfires. In the NW region of Galicia, forest fires are one of the natural hazards. In 2019, 1676 forest fires were registered in the Galician region, covering 13.691 ha [1].
Human caused fires are initiated by accidents, negligence, or arson. Road access is a significant contributing factor in the occurrence of human caused ignitions [2]. The 70% of forest fires occur close to main roads, at a distance of less than 500 m [3]. The increased ignition risk related to increasing housing and road density may be additionally modulated by the vegetation types crossed by roads [2]. Road managers have the knowledge to control roadside vegetation through preventive operations including herb mowing, applying herbicide products, clearing, or pruning vegetation. The assessment of the ignition potential of roadside vegetation plays a cornerstone role in prevention management. The best method to mitigate the likelihood of fire ignition is decreasing the roadside flammability [4]. The current law regarding forest firefighting in Galicia [5] establishes a forest-to-road distance threshold between 4 and 10 m, depending on tree species and road class. Targeting fuel treatments and locating resources to areas where fire ignitions are predicted to occur may be effective in improving the probability in the fire containment [6].
Fire risk could be defined as the probability of a forest fire occurring as well as the potential damage it could cause in a given place (vulnerability) [7]. The susceptibility mapping or spatial fire prediction consists of locating where a forest fire will likely occur [8]. Further, the current technology applied in the control of such natural events has three component categories: predicting, monitoring and prevention [9]. Therefore, fire risk mapping is essential to plan the maintenance actions on vegetation.
Regarding the scale, there are studies of long-term, short-term, or in real-time. Considering spatial scales there are global, regional, or local studies. Long-term risk is linked to features of a territory that do not vary periodically (topography or vegetation types) and it is more suitable to improve overall forest management planning [10]. On the other hand, short-term risk is linked to changeable factors (vegetation stress or climate conditions) and is updated using a time scale that can eventually be daily or hourly, with mainly operative usefulness [11]. From a geographic point of view, global wildfires are linked to long-term approaches [12]. Regional risk mapping is especially suitable for national and regional orientation of environment, such as forest polices and legislation [13]. Local risk maps are refereed to extensions below those aforementioned which are especially to be included in land management, wildfire risk communication, and emergency planning, at the municipal or local community level [14].
Fire occurrence, frequency, and intensity primarily depend on weather conditions and vegetation fuel load, which contribute to ignition of and to sustaining fire, respectively [15]. Identification of the greatest influence variables on fire occurrence is essential for modeling fire risk [16]. The main factors which contribute to fire ignition and propagation are topography (elevation, slope and aspect), vegetation, weather, and human factors [17]. Several common variables, slope, aspect, elevation, distance from road, distance from settlement, and land use cover are used to generate forest fire risk maps [7,18,19,20,21,22]. There are studies which include other parameters such as normalized difference vegetation index (NDVI) and climate parameters (annual air temperature, annual precipitation, and wind speed) [23]. On the other hand, there are several studies which include the fire weather index (FWI) [24] or fire historic to map forest fire risk areas [25] and have pointed-out the suitability of the FWI as a fire danger indicator for different Mediterranean climates and forest types [26,27].
Remote sensing technologies is a frequently used method to assess vegetation conditions. LiDAR (light detection and ranging) is an active remote sensing technology that can accurately measure three-dimensional vegetation structure over large areas efficiently, in comparison to other traditional methodologies. The use of LiDAR data to map fuel types is subject of current research [28,29]. Having up to date and accurate fuel type maps is fundamental to properly manage wildland fire risk areas [30]. Thus, the integration of this parameter in forest fire risk maps is an innovative and interesting aspect which provides significant fuel information.
Many studies have been executed to produce forest fire maps using geographic information systems (GIS) and remote sensing (RS) techniques [22,31,32,33,34].
Several techniques are used in the forest fire risk maps generation, such as knowledge-based methods in combination with GIS [21,23,35,36,37], logistic regression [38], analytic hierarchy process (AHP) [39,40,41], fuzzy logic [42], goal programming (GP) and analytical network process [43], artificial neural networks (ANN) [44], and random forest [45].
Capabilities of GIS and multi criteria decision analysis (MCDA) have been combined to solve a wide range of spatial problems [46,47]. The integration of MCDAs with the capabilities of GIS provides a smart spatial modelling methodology for identifying the relative significance of indicators. The AHP method approaches decision-making by arranging the important components of a problem into a hierarchical structure like a family tree. The AHP method reduces complex decisions into a series of simple comparisons, called pairwise comparison, between elements of the decision hierarchy [17].
In general, expert knowledge plays a fundamental role in fire risk modelling. In this context, the criteria weights determined by AHP and GIS software are used as a support to determine the fire risk areas. Furthermore, the opinion of five experts were considered to derive criteria weights who collaborate in the present research. The purpose of this study is to define and implement a forest fire risk assessment for fire risk mapping, by combining several attributes. The vegetation management could be optimized by development of fire risk maps around roads.
The specific objectives of this study are to:
  • Investigate and determine the main factors affecting fire risk in the study area.
  • Determine the weight for each factor influencing forest fire risk.
  • Improve existing information about the generation of fuel and flammability models by LiDAR data analysis, generate vegetation continuity covers, and apply forest fire risk weather index based on the weather conditions in the area.
  • Develop a methodology to automatically calculate main factors involved in forest fire risk map.
  • Report on fire risks obtained and establish the recommendations to road managers focusing on mitigation measures or actions.

2. Materials and Methods

2.1. Area of Study

In this study two pilot areas were analyzed to generate risk maps around two different types of road. The study areas are located in the Northwest Spain: one in the region of Lobios which is referred to as study area A, and the second in the region of Celanova which is known as study area B.
Ourense province is in the south-central part of Galician region, at 128 m in average above sea level. The climatic type is sub-Mediterranean oceanic temperate, so vegetation is adapted to dry periods. The average temperature is 14.5 °C and the precipitation is about 912 mm per year, July being the warmest and driest month in contrast to December and January.
Study area A is located around OU-312 road, two-way tertiary road located in Lobios municipality (Figure 1). It belongs to the Natural Park of Baixa Limia-Serra do Xurés, where flora is characterized by a deciduous forest, the main species being Quercus pyrenaica, Betula alba, Quercus suber, Arbutus unedo, Sorbus aucuparia, and Ilex aquifolium.
Study area B is in the municipality of Celanova (Figure 1). The study of this area focuses on the AG-31 motorway which is a high capacity road with 18.7 km long and two 3.5-m wide lanes in each direction.

2.2. Materials

2.2.1. Satellite Imagery

The images used in this study came from the Sentinel 2 mission, that is part of the Copernicus program by the European Commission in partnership with European Space Agency (ESA). The Copernicus Sentinel-2 mission consists of two satellites flying in the same orbit but phased at 180°, resulting in a revisiting frequency of 5 days. Satellite images were downloaded from the Copernicus Open Hub with a L2A processing level, that includes geometric and radiometric correction. The selected 20-m resolution images were recorded on 23 August 2019. Particularly, bands 4 (central wavelength 665 nm) and 8A (central wavelength 865 nm) were used in this methodology because these are the bands needed in the NDVI calculation [48].

2.2.2. Aerial LiDAR Data

The experimental data for this work were collected using a Phoenix system [49], which is based on a Velodyne LiDAR model, the Alpha AL3-32. It shows survey-grade centimetric accuracy and intensity calibration. Their 32 lasers emit 700,000 pulses per second and record up to two returns per pulse. The system includes a global navigation satellite system (GNSS) that provides real-time kinematics and post-processing options with an accuracy specification up to 1 cm in horizontal and 2.5 cm in vertical positioning. The raw point clouds were collected on 15 August 2019 and contain 18,000,000 points in study area A and 63,126,000 points in study area B, with a density of 350 points/m2 and an average point spacing of 0.05 m.

2.3. Methodology

The overall methodology adopted to achieve the objective of this study is illustrated in Figure 2. QGIS software [50] and Python language were used for data processing. First, layers for each factor were created by each parameter evaluation and a criterion was defined to classify each layer into a hazard index from 1 to 5, being 1-very low, 2-low, 3-moderate, 4-high, and 5-very high. Once thematic layers were created, analytic hierarchy process (AHP) was computed to define the influence of each variable in the final risk map.
In this study nine relevant parameters categorized in five groups were considered in the forest fire risk map which are detailed below.

2.3.1. Topography

Morphometric properties (elevation, slope, and aspect) were derived from a 2-m resolution Digital Terrain Model (DTM) available from the official Spanish National Centre for Geographical Information (CNIG) [51] using the topographic analysis (GDAL) library in QGIS software (Figure 3). The orthometric DTM heights were previously transformed to match point cloud ellipsoidal heights by adding the Geoid model used in Spain (“EGM2008-REDNAP”) as shown in Figure 4.

2.3.2. Vegetation

The goal of the classification of the structure is to divide the vegetation in three major groups (grass, shrubs, and trees) following the Prometheus system [52] that adapts NFFL (Northern Forest Fire Laboratory) classification [53] to the Mediterranean conditions (Table 1).
Point cloud data preprocessing starts with a cleaning filter to remove noise points. The filter used was the Radius Outlier Removal filter (ROR) due to its good results compared to other filters [54].
After noise filtering, points were organized in a 20 m grid and segmented into two main groups: ground and vegetation points, following the methodology presented in previous studies [55]. Vegetation points were filtered to obtain the objective categories: grass (points with heights lower than 0.4 m), shrubs (points with heights between 0.4 and 4 m), and trees (points with heights higher than 4 m) [56]. Finally, each 20 m cell was labelled with the corresponding fuel type in Table 1 according to their spatial distribution and height.
Regarding vegetation condition, the NDVI index [57] was computed using L2A Sentinel-2 imagery with a 20 m spatial resolution using Equation (1), where Near Infrared Reflectance (NIR) corresponds to the reflectance of band 8A and RED corresponds to the reflectance of band 4. NDVI values range between −1.0 and +1.0. Figure 5 shows the classification of vegetation points in fuel types.
NDVI =   ( NIR RED ) ( NIR + RED )
where NDVI is normalized difference vegetation index, NIR is near infrared band, and RED is visible infrared band.

2.3.3. Fire Weather Index

The FWI system is one of the components of the Canadian Forest Fire Danger Rating System (CFFDRS) [58] and was adopted by the European Forest Fire Information System (EFFIS) as a harmonized European level fire danger assessment.
In this work, FWI was used to rate the fire danger, that accounts for the effects of fuel moisture and wind on fire behavior and was computed making use of three major components consisting of Fire Weather Observations, Fuel Moisture Codes, and the Fire Behavior Indices.
The Fire Weather Observations consist of temperature (°C), wind direction (°), wind speed (km/h), relative humidity (%), absolute pressure (hPa), and instantaneous rainfall (mm) data at 15:00 UTC+00, and the accumulated precipitation in the previous 24 h. Data was gathered from six stations at distances lower than 30 km belonging to Meteogalicia, the meteorological service of the Regional Ministry of the Environment of Xunta de Galicia [59].
The meteorological data was interpolated using a Thin Plate Splines (TPS). The goal of this interpolator is to generate a minimum-curvature continuous surface defined by Equation (2)
Etps   =   1 n i = 1 n ( z ( x i ) f ( x i ) ) 2 + λ J ( f )
where Etps is the smoothing interpolant, J(f) is the surface, z(xi) are observation values in a set of measurement points xi, f(xi) is a spline piecewise function, and λ is a smoothing parameter.
The resulting layer is a 500 m resolution raster containing hourly data for each of the weather variables. These layers are input to the fuel moisture codes and fire indices to provide the FWI, that were implemented using Python. To obtain consistent values, the codes consider a period of 60 days before the date target, in our case, 14 and 15 of August 2019.

2.3.4. Anthropogenic Issues

Human activities are strongly associated with the occurrence of forest fire and, thus, the proximity to urban areas and roads should be considered fundamental for forest fire risk mapping [60]. Anthropogenic parameters have been used in other studies [18,22,23].
Roads and settlement vectors data were gathered from the CNIG [51] and by a buffer tool in QGIS. It covers 300, 600, 900, 1200, and >1200 m for roads and 500, 1000, 1500, 2000, and >2000 m for settlements. The next step was to clip and rating layers with each intersection from 1 (very low) to 5 (very high). The output layer has 2 m of spatial resolution. Figure 6 shows settlements buffer layers result, as this study focuses on roads so are obviously within the 300 m of road buffer.

2.3.5. Historical Fire Regimes

The historical fires layer was obtained by combining Fire Recurrence (FR) and Time Since Fire (TSF) [61], input gathered from a public database [62] containing the burned areas from year 2001 to 2017. TSF information was classified into values ranging from 1-very low (2001–2004); 2-low (2005–2007); 3-moderate (2008–2011); 4-high (2012–2015); 5-very high (2016 and 2017). Null values were result of the raster generation which pixels without forest fire record obtained a zero-value assignment. Then FR and TSF were combined using a merge tool in QGIS to obtain the historical fire layer, shown in Figure 7.

2.4. Classification

Once the layer variables were obtained, the next step was the assignment of values from 1 to 5, 1 being the lowest fire risk and 5 the highest one. The weights assignment was carried out to each parameter according their influence on fire risk [20,22,23,40,63,64]. However, historical fires and fuel model types parameters were classified by development of an own methodology.
Fuel parameters were considered fuel model types 4 and 7, as the most dangerous regarding a forest fire for their height and fuel load. Additionally, fuel model type 1 is considered dangerous because it is formed of herbaceous and the flame speed could be fanned and spread quickly.
Regarding historical fires, pixels classified as very low and low fire risk are characterized for TSF greater than 5 years and the fire recurrence is less than three times for 1-very low-grade, while is three times for 2-low grade. The 3-moderate fire risk corresponds to pixels where there is an only forest fire record in the last five years. The 4-high and 5-very high fire risk grades match with pixels which have records of forest fire within the last 5 years and a fire recurrence of two for high classification and three for classification as very high. Table 2 shows the different classes in the variables were separately based on their sensitivity to forest fire.

2.5. Analytic Hierarchy Process (AHP)

An analytic hierarchy process (AHP) was followed to define the influence of each variable to output a raster for the fire risk. A precedence weighting was derived and combined to determine the global ranking score of each relevant criterion [65]. To check the consistency of the decision making and reduce the bias in the process, a consistency ratio (CR) was obtained with Equations (3) and (4).
CR =   CI   RI  
CI =   λ max   n n 1  
where CR is the consistency ratio, CI is the consistency index and RI is the random index in Equation (3). λmax is the maximum value in the average of dividing the sum of the weights, and n is the number of criteria. CR values of 0.10 and lower are considered tolerable [66].

3. Results

3.1. Base Layers

As defined in Table 2, base layer classification ranges from 1-very low, 2-low, 3-moderate, 4-high to 5-very high (value 5). The null values were one of the results obtained in the process of raster generation and correspond with pixels assignment of zero value which matched with road and buildings. Elevation parameter ranges from 461 to 582 m above mean see level (MSL) in the study area A, while in the study area B ranges from 477 to 551 m above MSL. The classified DTM map shows a 3-moderate index for both areas. The study area A presents a maximum slope of 51° and 65° of slope in study area B, that corresponds to the embankment roads. Both study areas have a predominant northeast orientation that receive less hours of sunshine in the energy balance of the year comparing to the rest of orientations. Figure 8 shows the result of classification for both factors, where we can highlight a 5-very high value for slope layer in study area A, while study area B exhibits the higher risk in the edges of the motorway. However, the mean value consists of 3-moderate risk.
Regarding vegetation characterization and fuel models, the most representative models for study area A are models 3 and 5, which represent a total of 1.3 ha (42%) and 1.5 ha (48%), respectively. There is also a presence, but to a lesser extent, of fuels models 4 (0.02 ha) and 6 (0.27 ha). In study area B, fuel models 3–6 are present, with a total of 4.22 ha (36%), 1.11 ha (9%), 5.04 ha (43%), and 1.30 ha (11%). In addition, there is a presence of fuel model type 2 (0.01 ha) in the margins of AG-31 motorway. An important issue to be highlighted is the presence of fuel type 5 very near the roadsides, a focus item for prevention.
NDVI values range between 0.6 and 0.80 for forest areas and 0.15–0.16 for rocks and low vegetation. According with NDVI results, the highest fire risk is in the shrub area in study area A. The road surroundings in study area B includes pixels with a wide range from 1-very low to 5-very high, where the average value is 2 and mode is 1. Figure 9 shows the results of the fuel model types and NDVI layers classification. It is important to highlight that NDVI values for road and building areas were catalogued as null to avoid overestimation.
Temperature, wind, and moisture conditions for the dates used in the study, 14 and 15 of August, were not extreme the value of temperature being high (30 °C), the wind speed is low (9–11 km/h), and the relative humidity of combustible does not present a danger value in case of forest fire with a value between 40% and 50%. Table 3 shows the results of the meteorological raster data obtained in both study areas and FWI calculated components.
Meteorologic data is the basis for FWI calculation where the codes provide insightful partial results. The FFMC value indicates the moisture content in fine fuels, showing an average value of 89, a high score that exhibits a low ignition probability. This fact is coherent with the average value of 6 for the ISI factor, that indicates a low ignition probability. DMC and DC average values of 10 and 21, respectively, indicate a low amount of fuel available for combustion. These partial results support a FWI value of 7.01 for study area A and 7.17 for study area B, ensuing a FWI layer rated with a 2-low risk factor for both areas.
Regarding the fire historical layers analysis, 
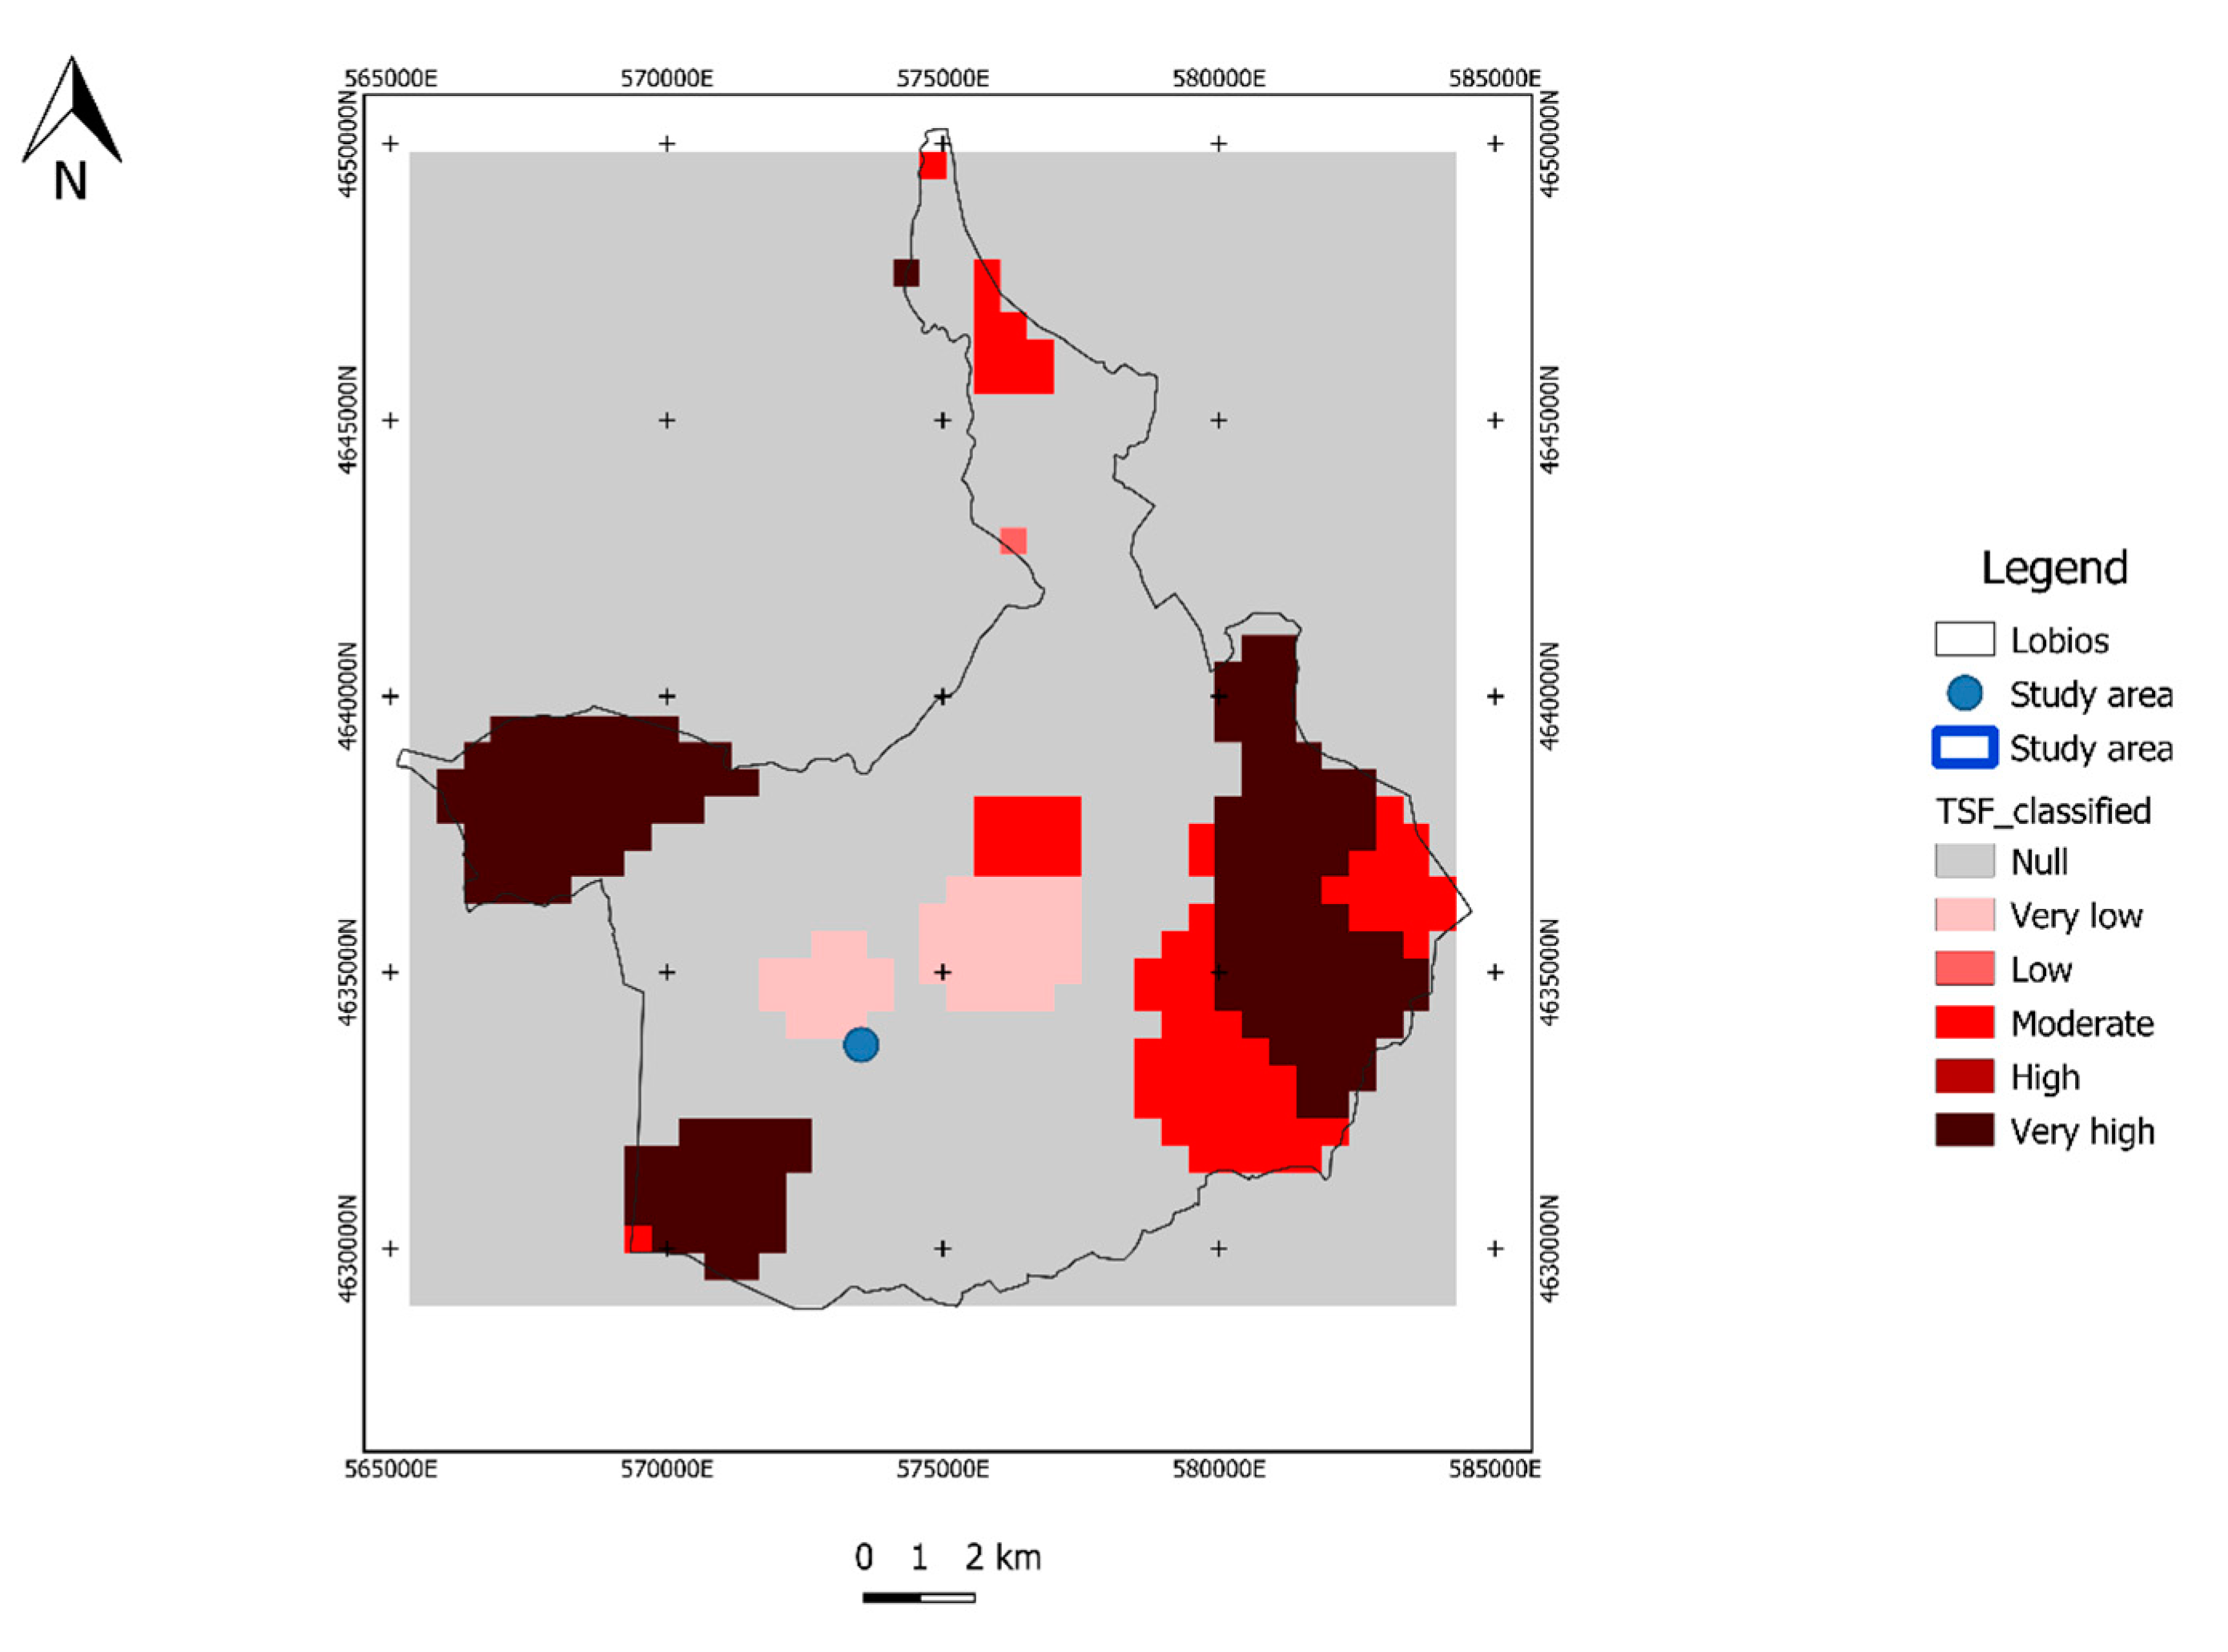
Table 4 shows the forest fires registered, the burnt area (ha), and the recurrence years of fires in the Lobios municipality since 2001.
These fires did not strictly affect study area A, that is catalogued as Null in the map, but it is crucial to remark the anthropogenic fire risk index due to fire recurrence.
The Celanova municipality located in the study area B only presents a registered forest fire in 2005, with a total 243 ha burned that occurred far away from the study area B, resulting in a Null classification.
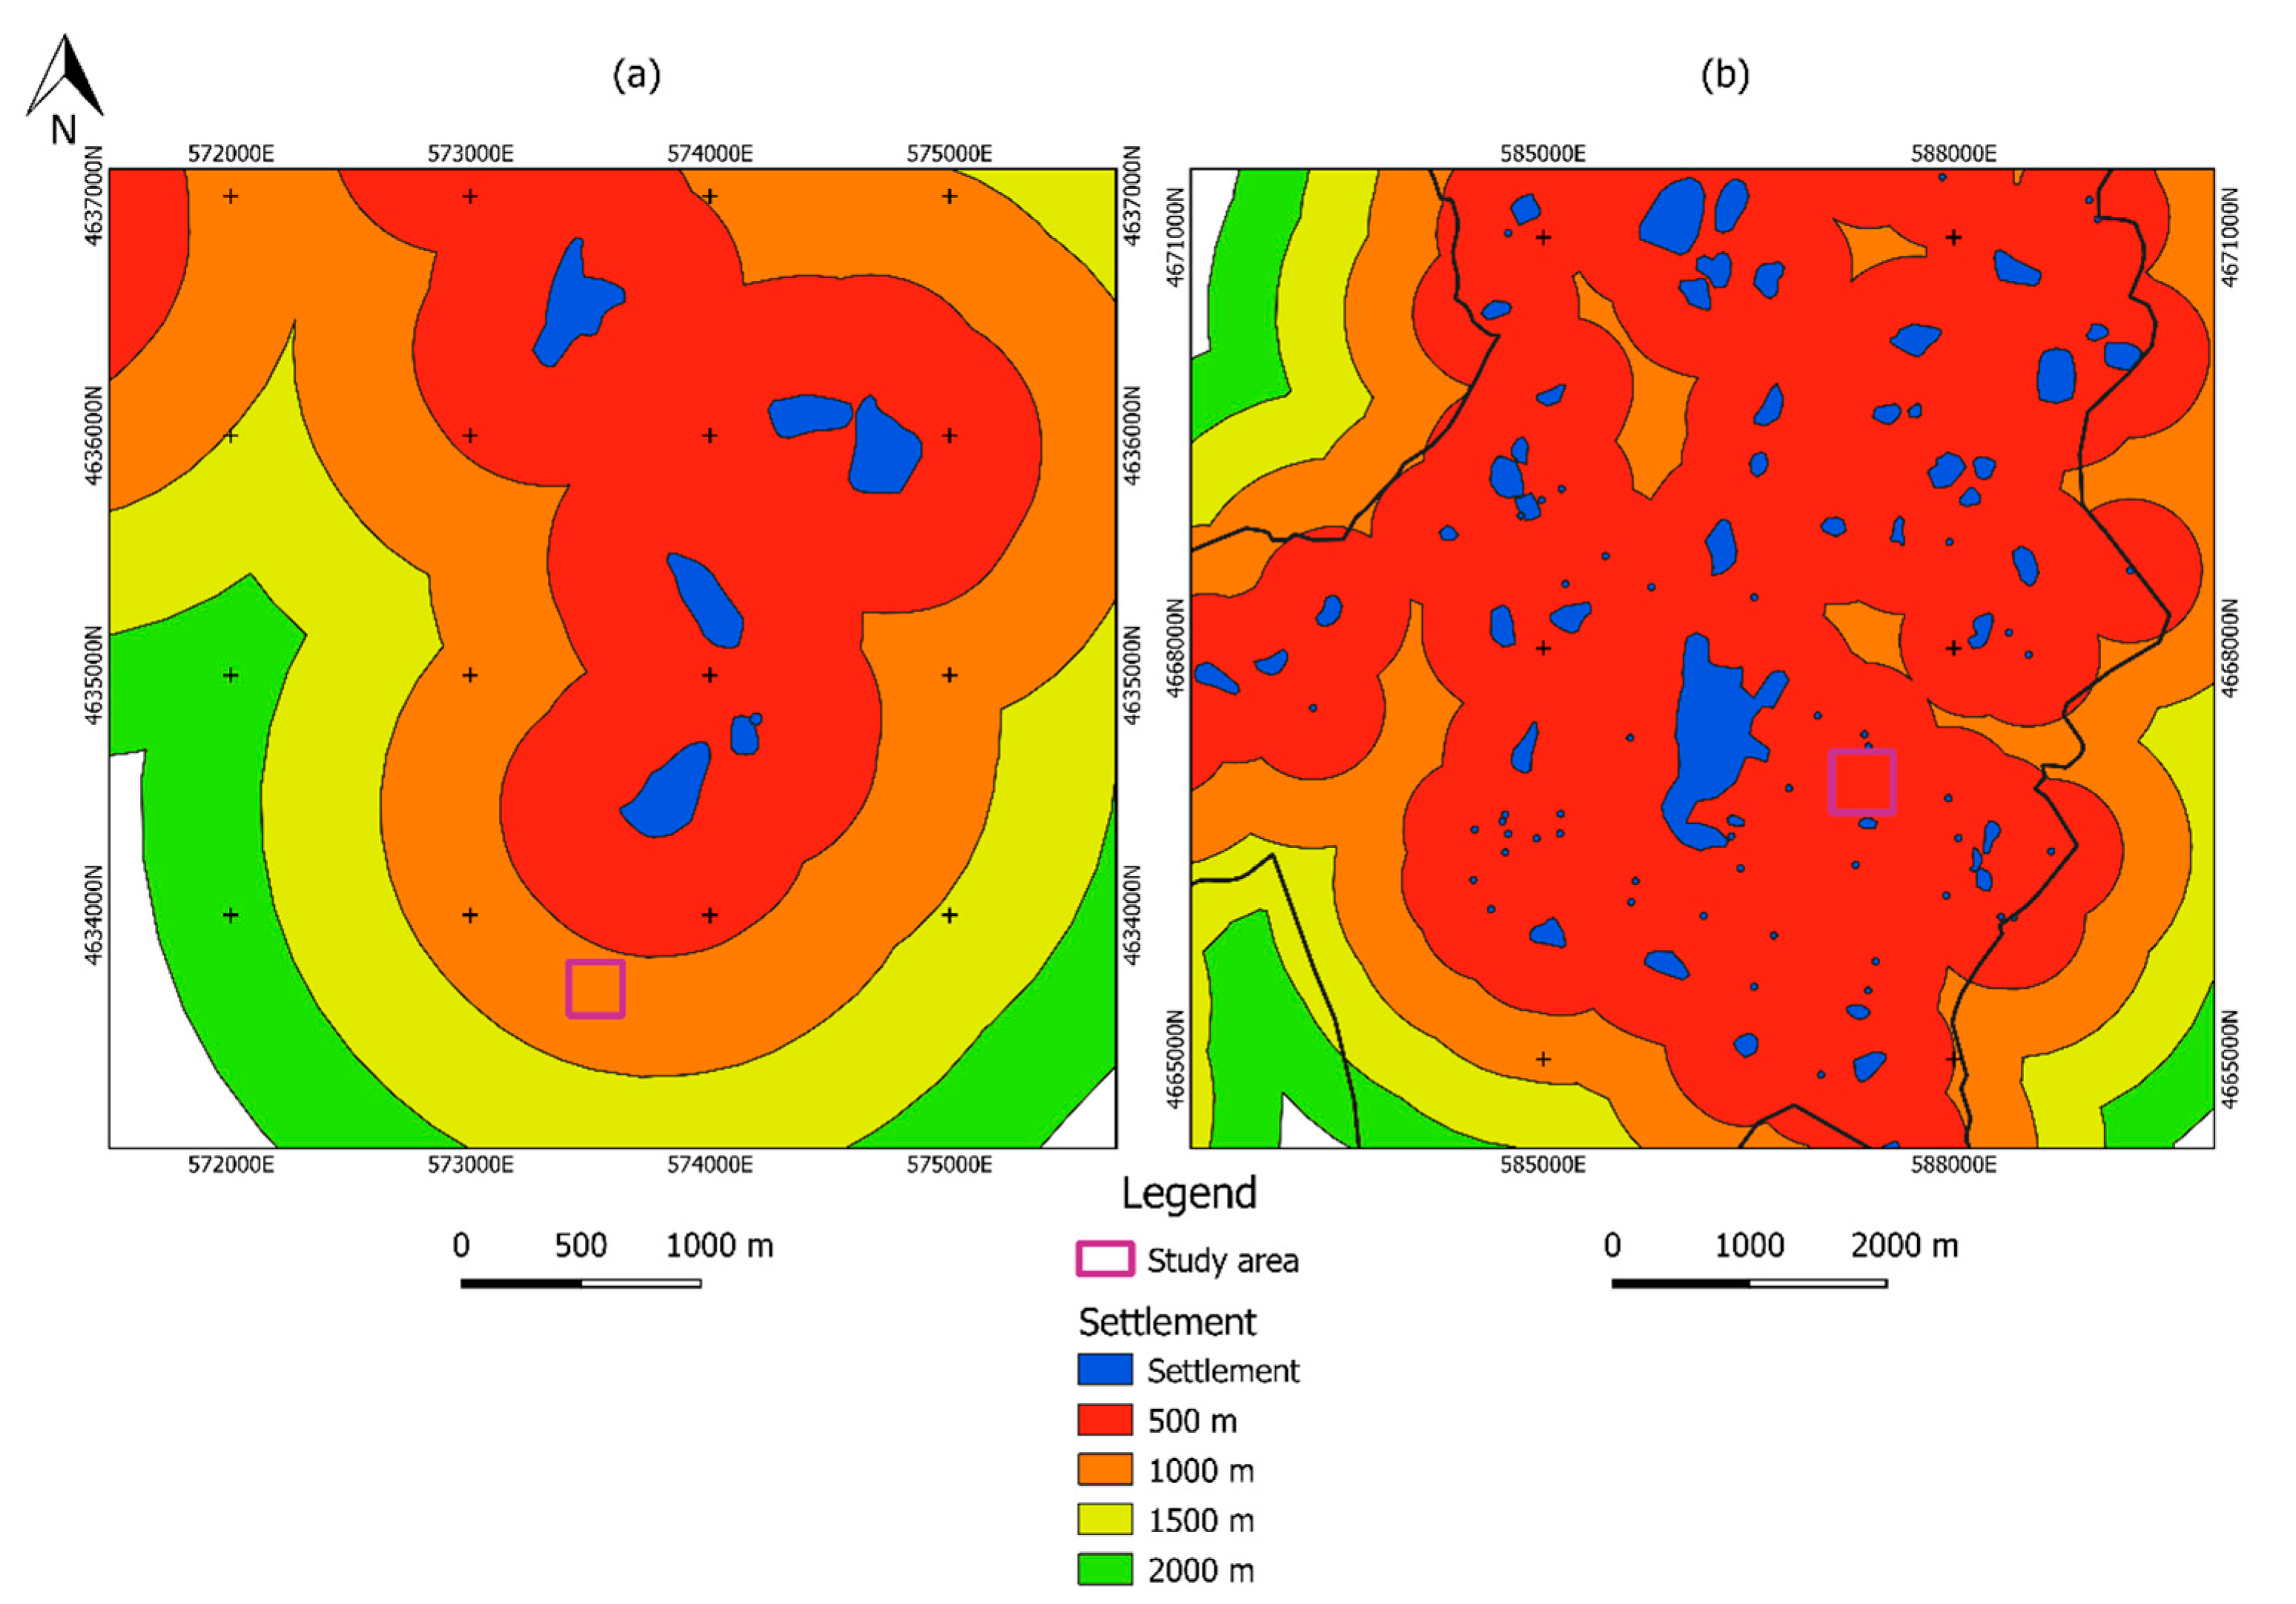
Regarding anthropogenic issues, the study areas are within the first described road buffer of 300 m and were classified as 5-very high risk. By taking settlements distances into account, study area B is located within the 500 m buffer while study area A is located within the buffer settlement of 1000 m. The layers were classified as 5-very high-risk index for the study area B, and a 4-high risk index in the study area A.

3.2. Forest Fire Risk Mapping

Table 5 and Table 6 show the results of the AHP, where Table 5 allocates the results of weighting criteria factors and Table 6 shows weights of groups. The lowest weight corresponds to the fire historical variable, while the highest weight corresponds to vegetation parameters.
The CR of the confusion matrix calculated is 0.080, and thus, the matrix is consistent enough [65]. The weights vector derived from the comparison matrix are used to obtain the equation for the fire risk as given in Equation (5).
FR = 0.359V × (0.250NDVI + 0.750FMT) + 0.108T × (0.539A + 0.297S + 0.164E) + 0.180AI × (0.750DR + 0.250DS) + 0.298FWI + 0.055FH
where FR is fire risk, V is vegetation type, NDVI is normalized difference vegetation index, FMT is fuel model types, T is topography, A is aspect, S is slope, E is elevation, AI is anthropogenic issues, DR is road distance, DS is distance settlement distance, FWI is fire weather index, and FH is fire historical.
Figure 10 shows the final risk map where each pixel has a value between 1 and 5 according to the previous classification.
The forest fire risk map layer was created merging layers of different resolution. Aspect, slope, elevation, fuel types, distance from roads, and settlement layers have 2 m of resolution, while NDVI has 20 m and FWI and fire historic layers have 500 m of resolution. The resolution of 2 m was determined for the output layer. Layers with different resolution were resampled according to the nearest neighbors algorithm.
The forest fire risk map shows that the vegetation factor played a key role. Slope is an important factor in forest fire risk being very high in the surroundings of road, which is visible in the study area B, with areas classified as high possibility of forest fire with a 4 value. FWI obviously decreases the susceptibility of forest fire ignition.
The Study area A map resulted in two classes, low and moderate forest fire risk, which represent a total area of 2.25 and 2.77 ha, respectively. In study area B, forest fire risk map resulted, low, moderate, and high, which represent a total area of 6.81, 12.96, and 0.23 ha, respectively.

4. Discussion

This study presented a workflow for forest fire risk mapping around roads based on several data sources. Results show fire key variables and their weight in an AHP decision support system. The contribution of LiDAR allows the analysis of the vegetation structure and its integration on the forest fire risk map. The fuel information provides an important weight of 0.750 in the forest fire risk map calculation. Moreover, this methodology can be applied to other areas with higher dimensions, for example, when LiDAR data are available in a public spatial data infrastructure (SDI).
Most fire incidents happen in low elevation areas, due to numerous factors such as human presence, decrease in relative humidity, and the increase in the temperature [63]. Due to this, topography, anthropogenic, and meteorological parameters are fundamental in the study being the meteorological parameter considered the most important of the three with a weight of 0.298 and the topography the lower weight assignment with 0.108. The anthropogenic parameter was considered more important than topography with an assignment of 0.180.
In residential areas and near roads, more human activities are witnessed, and the human activity is the most significant factor in the fire outbreak [67]. In this study, anthropogenic parameters have a value of 0.180, of which road distances has a weight of 0.750, while settlement distances have a weight of 0.250. The weights indicated that the factor of vegetation group has the highest significance and affectation. This statement is in accordance with the results achieved by Valdrevu et al. [47] and Rassoli et al. [63].
In contrast, the historical fires parameter is less important than other factors with a weight assignment of 0.055. Historical fires were used as fire risk parameter in this study. The study of Yathish et al. [15] used the fire occurrence layer for calibration and validation, considering land surface temperature as the only meteorological parameter. In this paper, the FWI integration was investigated as a parameter in the fire risk mapping which allow detailed information about the moisture effects in fuel and wind in the behavior of fire being of great importance in the fire risk prevention and providing more concrete information than meteorological data.
The results of Gigović et al. [40] also showed that land use is an important parameter in forest fire modelling, which is consistent with the results of our research. The land use parameter is comparable to the vegetation fuel type parameter used in the present study. However, the results of Gigović et al. [40] showed the high importance of distance between roads and settlement, which have more importance than climate, in contrast to the present study. The weights obtained for the FWI parameter and the human factors were 0.298 and 0.180, respectively. FWI provides meteorological information directly related to forest fire risk and its probability of ignition and propagation, while the meteorological conditions do not provide information on fuels state. This fact supports the application of FWI as an influence parameter in forest fire risk mapping.
Suryabhagavan et al. [37] in their study, showed that the most important parameter in the fire risk is the vegetation, followed by slope. The lower values of weight parameters are for settlement and road distances. The attribution of weight of the parameters are similar with this study. The lower values were also attributed to the anthropogenic issues and the higher weight was assigned to the vegetation parameter. The difference in both studies regardless of the FWI parameter used in the present study is in line with the research done.
Vallejo et al. [7] remarked that spatial cadastral information of buildings and roads could address the main limitations in their study and improve the classification of fuel types along with the analysis of transport networks. In the present work, these topics were covered with the use of cadaster layers to adapt fuel condition based on NDVI and, hence, buildings and roads were clipped to filter misleading or wrong values. The vegetation information used by Vallejo et al., was obtained from Landsat- 7 images with a resolution of 15 m. In comparison, the LiDAR data used in this study has a mean spacing between points of 0.05 and 2 m of resolution in raster transformation which allows for a more detailed study of the vegetation structure parameters.
In the study by Gheshalghi [21], a GIS-based analytical network process was used to provide a fire risk map using slope, aspect, altitude, land cover, NDVI, annual rainfall, temperature, distance to settlements, and distance to roads as input layers. The classification of the parameters and their weights is very similar to that followed in the present study. The highest weight consists of the climatic group, giving an annual rainfall weight of 0.17713 followed by NDVI with 0.16445 value. Lowest values were obtained for distance to roads and distance to settlements with 0.05499 and 0.07056 values, respectively. The conclusions include the consideration that the most important parameters were vegetation and climate, which is coherent with the results presented in this manuscript.
The study of Coelho et al. [36] showed the importance of rainfall and temperature parameters in a forest fire. The land use parameter had the higher weight assigned to pasture and planted forest, as the vegetation parameter in the present study, being considered fuel types 5 and 7 as the most dangerous regarding forest fire risk.
The methodology used by Eskandari [39] used fuzzy AHP and GIS to estimate the weights of the parameters affecting forest fire mapping, including distances to farmland, roads, settlement, and rivers in addition to slope, aspect, and elevation. The results of fuzzy weighting show that human factor, with a value of 0.301, and biologic factors were the most important parameters to be considered. In the study of Eskandari, the topography group has a value 0.2517 being the least considered parameter. Additionally, in the present study, topography group was considered the second least important parameter with a weight of 0.108.
Kayet et al. [19] in their recent study, showed a comparative of frequency ratio (FR) and AHP models for forest fire risk mapping. The results from FR and AHP showed similar trends (accuracy of 81 and 79%, respectively). In the present study, vegetation group has a value of 0.359, of which NDVI has a weight of 0.250, and FWI parameter has a value of 0.298. These parameters have the highest significance in the fire risk map to the contrary of results achieved by Kayet et al. [19] where land surface temperature was considered the most important parameter with a value of 0.25 and NDVI parameter has a value of 0.11.
The major difference found with regards to other investigations lies in the size of the study area. This study is based on fire risk around roads, while others are done at the municipally or provincial level. Due to the use of dense point cloud, a detailed analysis of vegetation is obtained in comparison with other studies.
In general terms, the proposed method, and the availability of the required data, allows its straightforward application to a wide range of regions.

5. Conclusions

In this paper, a methodology based on GIS and AHP was developed to determine forest fire risk areas around roads in Northwest Spain. According to the results, vegetation and FWI parameters have a strong influence on forest fire ignition, whereas parameters like historical fire, topography, and humans have a lower weight in risk calculation. The final risk model shows that approximately 50% of study area A and 65% of study area B are classified as moderate fire risk (value 3 out of 5).
Fire risk mapping is a suitable tool to identify and locate areas around roads that are vulnerable and supports roadside vegetation management. For example, herbicidal products application and pruning in areas of special risk like slopes, embankments, and clearing areas which could help to reduce the propagation and intensity of forest fire. At the same time, fire risk maps help transport managers and practitioners to develop and adopt fire emergency plans. As a future trend, sensitivity analysis of AHP could be integrated with other multi criteria decision analysis (MCDA) techniques to improve the results.

Author Contributions

A.N., N.F.-Á. and J.M.F.-A. participated in the conceptualization of the manuscript. A.N., and N.F.-Á. participated in the methodology development and software development. H.G.-J., J.M.-S. and J.M.F.-A. conceived the designed the experiments. A.N., J.M.-S. wrote the manuscript. J.M.-S. and H.L. provided supervision on the design and implementation of the research. All authors contributed to review and improvement of the manuscript. All authors have read and agreed to the published version of the manuscript.

Funding

The authors want to thank TOPACIO project (IN852A 2018/37) for financial support given, including the companies Aeromedia UAV, Extraco Obras e Proxectos, Conexiona Telecom and San2 Sustainable Innovation. [SIRMA/This project] is co-financed by the INTERREG Atlantic Area Programme through the European Regional Development Fund (ERDF) with application code: EAPA_826/2018. The sole responsibility for the content of this publication lies with the authors. It does not necessarily reflect the opinion of the European Union. Neither the INTERREG Europe programme authorities are responsible for any use that may be made of the information contained therein. J.M.-S. wants to thank Ministerio de Ciencia, Innovación y Universidades for the support through the project PID2019-108816RB-100. A.N. wants to thank University of Vigo through the grant Axudas Predoutorais para a formación de Doutores 2019 (grant number 00VI 131H 6410211)

Acknowledgments

The authors also would like to thank to AEROMEDIA UAV for collecting the data.

Conflicts of Interest

The authors declare no conflict of interest.

References

  1. Gobierno de España Ministerio de Agricultura, Pesca y Educacion. Available online: https://www.mapa.gob.es/es/desarrollo-rural/estadisticas/Incendios_default.aspx (accessed on 22 July 2020).
  2. Ricotta, C.; Bajocco, S.; Guglietta, D.; Conedera, M. Assessing the influence of roads on fire ignition: Does land cover matter? Fire 2018, 1, 24. [Google Scholar] [CrossRef] [Green Version]
  3. Ganteaume, A.; Camia, A.; Jappiot, M.; San-Miguel-Ayanz, J.; Long-Fournel, M.; Lampin, C. A review of the main driving factors of forest fire ignition over Europe. Environ. Manag. 2013, 51, 651–662. [Google Scholar] [CrossRef] [PubMed] [Green Version]
  4. Molina, J.R.; Lora, A.; Prades, C.; Silva, F.R. Roadside vegetation planning and conservation: New approach to prevent and mitigate wildfires based on fire ignition potential. For. Ecol. Manag. 2019, 444, 163–173. [Google Scholar] [CrossRef]
  5. de Galicia, X. Ley 3/2007, de 9 de Abril, de Prevención y Defensa Contra los Incendios Forestales de Galicia. Boletin Oficial del Estado 2007, 119, 21377–21394. [Google Scholar]
  6. Collins, K.M.; Price, O.F.; Penman, T.D. Suppression resource decisions are the dominant influence on containment of Australian forest and grass fires. J. Environ. Manag. 2018, 228, 373–382. [Google Scholar] [CrossRef]
  7. Vallejo-Villalta, I.; Rodríguez-Navas, E.; Márquez-Pérez, J. Mapping Forest Fire Risk at a Local Scale—A Case Study in Andalusia (Spain). Environments 2019, 6, 30. [Google Scholar] [CrossRef] [Green Version]
  8. Carrara, A.; Guzzetti, F. Geographical Information Systems in Assessing Natural Hazards; Springer Science & Business Media: Berlin/Heidelberg, Germany, 2013. [Google Scholar]
  9. Lin, H.; Liu, X.; Wang, X.; Liu, Y. A fuzzy inference and big data analysis algorithm for the prediction of forest fire based on rechargeable wireless sensor networks. Sustain. Comput. Informatics Syst. 2018, 18, 101–111. [Google Scholar] [CrossRef]
  10. Šturm, T.; Podobnikar, T. A probability model for long-term forest fire occurrence in the Karst forest management area of Slovenia. Int. J. Wildl. Fire 2017, 26, 399–412. [Google Scholar] [CrossRef]
  11. Wang, L.; Zhao, Q.; Wen, Z.; Qu, J. RAFFIA: Short-term forest fire danger rating prediction via multiclass logistic regression. Sustainability 2018, 10, 4620. [Google Scholar] [CrossRef] [Green Version]
  12. Meng, Y.; Deng, Y.; Shi, P. Mapping forest wildfire risk of the world. In World Atlas of Natural Disaster Risk; Springer: Berlin/Heidelberg, Germany, 2015; pp. 261–275. [Google Scholar]
  13. Modugno, S.; Balzter, H.; Cole, B.; Borrelli, P. Mapping regional patterns of large forest fires in Wildland—Urban Interface areas in Europe. J. Environ. Manag. 2016, 172, 112–126. [Google Scholar] [CrossRef]
  14. Schoennagel, T.; Balch, J.K.; Brenkert-Smith, H.; Dennison, P.E.; Harvey, B.J.; Krawchuk, M.A.; Mietkiewicz, N.; Morgan, P.; Moritz, M.A.; Rasker, R. Adapt to more wildfire in western North American forests as climate changes. Proc. Natl. Acad. Sci. USA 2017, 114, 4582–4590. [Google Scholar] [CrossRef] [PubMed] [Green Version]
  15. Yathish, H.; Athira, K.V.; Preethi, K.; Pruthviraj, U.; Shetty, A. A Comparative Analysis of Forest Fire Risk Zone Mapping Methods with Expert Knowledge. J. Indian Soc. Remote Sens. 2019, 47, 2047–2060. [Google Scholar] [CrossRef]
  16. Eskandari, S.; Chuvieco, E. Fire danger assessment in Iran based on geospatial information. Int. J. Appl. Earth Obs. Geoinf. 2015, 42, 57–64. [Google Scholar] [CrossRef]
  17. Yakubu, I.; Mireku-Gyimah, D.; Duker, A.A. Review of methods for modelling forest fire risk and hazard. Afr. J. Environ. Sci. Technol. 2015, 9, 155–165. [Google Scholar]
  18. Rasooli, S.B.; Bonyad, A.E.; Pir Bavaghar, M. Forest fire vulnerability map using remote sensing data, GIS and AHP analysis (Case study: Zarivar Lake surrounding area). Casp. J. Environ. Sci. 2018, 16, 369–377. [Google Scholar]
  19. Kayet, N.; Chakrabarty, A.; Pathak, K.; Sahoo, S.; Dutta, T.; Hatai, B.K. Comparative analysis of multi-criteria probabilistic FR and AHP models for forest fire risk (FFR) mapping in Melghat Tiger Reserve (MTR) forest. J. For. Res. 2020, 31, 565–579. [Google Scholar] [CrossRef]
  20. Pandey, K.; Ghosh, S.K. Modeling of parameters for forest fire risk zone mapping. Int. Arch. Photogramm. Remote Sens. Spatial. Inf. Sci. 2018, 5, 299–304. [Google Scholar] [CrossRef] [Green Version]
  21. Gheshlaghi, H.A. Using GIS to Develop a Model for Forest Fire Risk Mapping. J. Indian Soc. Remote Sens. 2019, 47, 1173–1185. [Google Scholar] [CrossRef]
  22. Adab, H.; Kanniah, K.D.; Solaimani, K. Modeling forest fire risk in the northeast of Iran using remote sensing and GIS techniques. Nat. Hazards 2013, 65, 1723–1743. [Google Scholar] [CrossRef]
  23. Abedi Gheshlaghi, H.; Feizizadeh, B.; Blaschke, T. GIS-based forest fire risk mapping using the analytical network process and fuzzy logic. J. Environ. Plan. Manag. 2020, 63, 481–499. [Google Scholar] [CrossRef]
  24. Varela, V.; Sfetsos, A.; Vlachogiannis, D.; Gounaris, N. Fire Weather Index (FWI) classification for fire danger assessment applied in Greece. Tethys 2018, 15, 31–40. [Google Scholar] [CrossRef]
  25. Zhang, Y.; Lim, S.; Sharples, J.J. Modelling spatial patterns of wildfire occurrence in South-Eastern Australia. Geomatics Nat. Hazards Risk 2016, 7, 1800–1815. [Google Scholar] [CrossRef] [Green Version]
  26. Bedia, J.; Herrera, S.; San Martín, D.; Koutsias, N.; Gutiérrez, J.M. Robust projections of Fire Weather Index in the Mediterranean using statistical downscaling. Clim. Chang. 2013, 120, 229–247. [Google Scholar] [CrossRef]
  27. Dimitrakopoulos, A.P.; Bemmerzouk, A.M.; Mitsopoulos, I.D. Evaluation of the Canadian fire weather index system in an eastern Mediterranean environment. Meteorol. Appl. 2011, 18, 83–93. [Google Scholar] [CrossRef]
  28. Inan, M.; Bilici, E.; Akay, A.E. Using airborne lidar data for assessment of forest fire fuel load potential. ISPRS Ann. Photogramm. Remote Sens. Spatial. Inf. Sci. 2017, 4, 255–258. [Google Scholar] [CrossRef] [Green Version]
  29. Huesca, M.; Riaño, D.; Ustin, S.L. Spectral mapping methods applied to LiDAR data: Application to fuel type mapping. Int. J. Appl. Earth Obs. Geoinf. 2019, 74, 159–168. [Google Scholar] [CrossRef] [Green Version]
  30. Chuvieco, E.; Wagtendonk, J.; Riaño, D.; Yebra, M.; Ustin, S.L. Estimation of fuel conditions for fire danger assessment. In Earth Observation of Wildland Fires in Mediterranean Ecosystems; Springer: Berlin/Heidelberg, Germany, 2009; pp. 83–96. [Google Scholar]
  31. Chuvieco, E.; Salas, J. Mapping the spatial distribution of forest fire danger using GIS. Int. J. Geogr. Inf. Sci. 1996, 10, 333–345. [Google Scholar] [CrossRef]
  32. Pradhan, B.; Mohd Dini Hairi, B.S.; Mohamad Arshad, B.A. Forest fire susceptibility and risk mapping using remote sensing and geographical information systems (GIS). Disaster Prev. Manag. 2007, 16, 344–352. [Google Scholar] [CrossRef]
  33. Chuvieco, E.; Congalton, R.G. Application of remote sensing and geographic information systems to forest fire hazard mapping. Remote Sens. Environ. 1989, 29, 147–159. [Google Scholar] [CrossRef]
  34. Jaiswal, R.K.; Mukherjee, S.; Raju, K.D.; Saxena, R. Forest fire risk zone mapping from satellite imagery and GIS. Int. J. Appl. Earth Obs. Geoinf. 2002, 4, 1–10. [Google Scholar] [CrossRef]
  35. Sachdeva, S.; Bhatia, T.; Verma, A.K. GIS-based evolutionary optimized Gradient Boosted Decision Trees for forest fire susceptibility mapping. Nat. Hazards 2018, 92, 1399–1418. [Google Scholar] [CrossRef]
  36. Eugenio, F.C.; dos Santos, A.R.; Fiedler, N.C.; Ribeiro, G.A.; da Silva, A.G.; dos Santos, Á.B.; Paneto, G.G.; Schettino, V.R. Applying GIS to develop a model for forest fire risk: A case study in Espírito Santo, Brazil. J. Environ. Manag. 2016, 173, 65–71. [Google Scholar] [CrossRef] [PubMed]
  37. Suryabhagavan, K.V.; Alemu, M.; Balakrishnan, M. GIS-based multi-criteria decision analysis for forest fire susceptibility mapping: A case study in Harenna forest, southwestern Ethiopia. Trop. Ecol. 2016, 57, 33–43. [Google Scholar]
  38. Deng, O.; Su, G.; Huang, Q.; Li, Y. Forest Fire Risk Mapping Based on Spatial Logistic Model of Northeastern China Forest Zone. In Proceedings of the International Conference on Geo-Informatics in Resource Management and Sustainable Ecosystem, Wuhan, China, 8–10 November 2013; pp. 181–192. [Google Scholar]
  39. Eskandari, S. A new approach for forest fire risk modeling using fuzzy AHP and GIS in Hyrcanian forests of Iran. Arab. J. Geosci. 2017, 10, 190. [Google Scholar] [CrossRef]
  40. Gigović, L.; Jakovljević, G.; Sekulović, D.; Regodić, M. GIS Multi-Criteria Analysis for Identifying and Mapping Forest Fire Hazard: Nevesinje, Bosnia and Herzegovina. Teh. Vjesn. 2018, 25, 891–897. [Google Scholar]
  41. Akay, A.E.; Erdoğan, A. GIS-based multi-criteria decision analysis for forest fire risk mapping. ISPRS Ann. Photogramm. Remote Sens. Spat. Inf. Sci. 2017, 4, 25. [Google Scholar] [CrossRef] [Green Version]
  42. Pourghasemi, H.R.; Beheshtirad, M.; Pradhan, B. A comparative assessment of prediction capabilities of modified analytical hierarchy process (M-AHP) and Mamdani fuzzy logic models using Netcad-GIS for forest fire susceptibility mapping. Geomat. Nat. Hazards Risk 2016, 7, 861–885. [Google Scholar] [CrossRef] [Green Version]
  43. Ghorbanzadeh, O.; Feizizadeh, B.; Blaschke, T. Multi-criteria risk evaluation by integrating an analytical network process approach into GIS-based sensitivity and uncertainty analyses. Geomat. Nat. Hazards Risk 2018, 9, 127–151. [Google Scholar] [CrossRef] [Green Version]
  44. Dutta, R.; Das, A.; Aryal, J. Big data integration shows Australian bush-fire frequency is increasing significantly. R. Soc. Open Sci. 2020, 3, 150241. [Google Scholar] [CrossRef] [Green Version]
  45. Kim, S.J.; Lim, C.H.; Kim, G.S.; Lee, J.; Geiger, T.; Rahmati, O.; Son, Y.; Lee, W.K. Multi-temporal analysis of forest fire probability using socio-economic and environmental variables. Remote Sens. 2019, 11, 86. [Google Scholar] [CrossRef] [Green Version]
  46. Pascual, C.; García-Abril, A.; García-Montero, L.G.; Martín-Fernández, S.; Cohen, W.B. Object-based semi-automatic approach for forest structure characterization using lidar data in heterogeneous Pinus sylvestris stands. For. Ecol. Manag. 2008, 255, 3677–3685. [Google Scholar] [CrossRef] [Green Version]
  47. Vadrevu, K.P.; Eaturu, A.; Badarinath, K. Fire risk evaluation using multicriteria analysis—A case study. Environ. Monit. Assess. 2010, 166, 223–239. [Google Scholar] [CrossRef] [PubMed]
  48. Tucker, C.J. Red and photographic infrared linear combinations for monitoring vegetation. Remote Sens. Environ. 1979, 8, 127–150. [Google Scholar] [CrossRef] [Green Version]
  49. Phoenix LiDAR Systems. Available online: https://www.phoenixlidar.com/ (accessed on 7 July 2020).
  50. QGIS. Available online: https://www.qgis.org/es/site/ (accessed on 17 June 2020).
  51. CNIG Centro Nacional de Información Geográfica 2019. Available online: https://www.cnig.es/home (accessed on 25 May 2020).
  52. European Comission. Management Techniques for Optimization of Suppression and Minimization of Wildfire Effects. System Validation; European Comission: Brussels, Belgium, 1999. [Google Scholar]
  53. Albini, F.A. Estimating Wildfire Behavior and Effects; Intermountain Forest and Range: Washington, DC, USA, 1976. [Google Scholar]
  54. Ruchay, A.N.; Dorofeev, K.A.; Kalschikov, V.V. Accuracy analysis of 3D object reconstruction using point cloud filtering algorithms. In Proceedings of the 5th International Conference on Information Technology and Nanotechnology 2019: Image Processing and Earth Remote Sensing, ITNT 2019, Samara, Russia, 21–24 May 2019; pp. 169–174. [Google Scholar]
  55. Novo, A.; Fariñas-Álvarez, N.; Martínez-Sánchez, J.; González-Jorge, H.; Lorenzo, H. Automatic Processing of Aerial LiDAR Data to Detect Vegetation Continuity in the Surroundings of Roads. Remote Sens. 2020, 12, 1677. [Google Scholar] [CrossRef]
  56. Price, O.F.; Gordon, C.E. The potential for LiDAR technology to map fire fuel hazard over large areas of Australian forest. J. Environ. Manag. 2016, 181, 663–673. [Google Scholar] [CrossRef]
  57. Rouse, J.W.; Haas, R.H.; Schell, J.A.; Deering, D.W. Monitoring vegetation systems in the great plains with ERTS, Paper A 20. In Proceedings of the Third Earth Resources Technology Satellite-1 Symposium, Washington, DC, USA, 10–14 December 1973; p. 309. [Google Scholar]
  58. Van Wagner, C.E. Equations and FORTRAN Program for the Canadian Forest Fire Weather Index System; Service Canadien des Forests, Gouvernement du Canada: Ottawa, ON, Canada, 1985. [Google Scholar]
  59. Meteogalicia. La Unidade de Observación e Predición Meteorolóxica de la Consellaría de Medio Ambiente, Territorio e Vivenda de la Xunta de Galicia, Comúnmente Conocida como MeteoGalicia, es un Organismo Público Creado en el año 2000 con el Objetivo de Operar y Mantener. Available online: https://www.meteogalicia.gal/web/initio.action (accessed on 22 April 2020).
  60. Avila-Flores, D.; Pompa-Garcia, M.; Antonio-Nemiga, X.; Rodriguez-Trejo, D.A.; Vargas-Perez, E.; Santillan-Perez, J. Driving factors for forest fire occurrence in Durango State of Mexico: A geospatial perspective. Chinese Geogr. Sci. 2010, 20, 491–497. [Google Scholar] [CrossRef]
  61. Regos, A. Cartografía de áreas queimadas en Galicia no século XXI: Presentación do produto e aplicación web mapping. NACC. Biol. 2018, 25, 45–53. [Google Scholar]
  62. Cartografía de Incendios Forestais en Galicia. Available online: https://www.arcgis.com/apps/MapSeries/index.html?appid=c66a1997501a441da3d31f6d8e5b5603 (accessed on 6 April 2020).
  63. Rasooli, S.B.; Bonyad, A.E. Evaluating the efficiency of the Dong model in determining fire vulnerability in Iran’s Zagros forests. J. For. Res. 2019, 30, 1447–1458. [Google Scholar] [CrossRef]
  64. Ghorbanzadeh, O.; Blaschke, T.; Gholamnia, K.; Aryal, J. Forest fire susceptibility and risk mapping using social/infrastructural vulnerability and environmental variables. Fire 2019, 2, 50. [Google Scholar] [CrossRef] [Green Version]
  65. Saaty, T.L.; Vargas, L.G. Models, Methods, Concepts & Applications of the Analytic Hierarchy Process; Springer Science & Business Media: Berlin/Heidelberg, Germany, 2012. [Google Scholar]
  66. Malczewski, J.; Rinner, C. Multicriteria Decision Analysis in Geographic Information Science; Springer: Berlin/Heidelberg, Germany, 2015. [Google Scholar]
  67. Giglio, L.; van der Werf, G.R.; Randerson, J.T.; Collatz, G.J.; Kasibhatla, P. Global estimation of burned area using MODIS active fire observations. Atmos. Chem. Phys. 2006, 6, 957–974. [Google Scholar] [CrossRef] [Green Version]
Figure 1. (a) Location of both study areas in Ourense province; (b) location of Ourense province on the Spain map; (c) location of study area A in Lobios municipality; (d) location of study area B in Celanova municipality. The map coordinate system is EPSG:25829 ETRS89/UTM zone 29N.
Remotesensing 12 03705 g001
Figure 2. Workflow of the methodology to determine forest fire risk map.
Remotesensing 12 03705 g002
Figure 3. Slope and aspect maps. (a) Slope map of study area A; (b) aspect map of study area A; (c) slope map of study area B; (d) aspect map of study area B. The map coordinate system is EPSG:25829 ETRS89/UTM zone 29N.
Remotesensing 12 03705 g003
Figure 4. DTM maps. (a) DTM map of study area A in Lobios municipality; (b) DTM map of study area B in Celanova municipality. Legend indicates height in meters. The map coordinate system is EPSG:25829 ETRS89/UTM zone 29N.
Remotesensing 12 03705 g004
Figure 5. Fuel models type and NDVI maps. (a) Map of fuel model types of study area A; (b) NDVI map of study area A; (c) map of fuel model types of study area B; (d) NDVI map of study area B. The map coordinate system is EPSG:25829 ETRS89/UTM zone 29N.
Remotesensing 12 03705 g005
Figure 6. Settlement maps. (a) Settlement distances map of study area A; (b) settlement distances map in study area B. The map coordinate system is EPSG:25829 ETRS89/UTM zone 29N.
Remotesensing 12 03705 g006
Figure 7. Map of the registered forest fires classified in the Lobios municipality. The map coordinate system is EPSG:25829 ETRS89/UTM zone 29N.
Remotesensing 12 03705 g007
Figure 8. Classification of slope (first row) and aspect maps (second row). (a) Slope map classified of the study area A; (b) aspect map classified of the study area A; (c) slope map classified of the study area B; (d) aspect map classified of the study area B. The map coordinate system is EPSG:25829 ETRS89/UTM zone 29N.
Remotesensing 12 03705 g008
Figure 9. Fuel model (first row) and NDVI (second row) maps classified. (a) Fuel model map classified of study area A; (b) NDVI map classified of study area A; (c) fuel model map classified of study area B; (d) NDVI map classified of study area B. The map coordinate system is EPSG:25829 ETRS89/UTM zone 29N.
Remotesensing 12 03705 g009
Figure 10. Forest fire risk map. (a) Forest fire risk map of study area A; (b) forest fire risk map of study area B. The map coordinate system is EPSG:25829 ETRS89/UTM zone 29N.
Remotesensing 12 03705 g010
Table 1. Description of the seven models of Prometheus classification for vegetation.
Fuel Model TypePresence (%)Height (m)
Fuel model 1>60% grass≤0.4 m
Fuel model 2>60% shrubs and ≤50% trees≤0.6 m
Fuel model 3>60% shrubs and ≤50% trees≤2.0 m
Fuel model 4>60% shrubs and ≤50% trees≤4.0 m
Fuel model 5≤30% shrubs and >50% trees≤4.0 m
Fuel model 6>30% shrubs and >50% trees(h shrubs—h trees) >0.5m
Fuel model 7>30% shrubs and >50% trees(h shrubs—h trees) ≤0.5m
Table 2. Values and relating classes assigned to variables of forest fire risk map.
VariablesClassesValuesRelating Classes
TopographyElevation (m)>8001Very low
600–8002Low
400–6003Moderate
200–4004High
≤2005Very high
AspectSouth5Very high
West3Moderate
East3Moderate
North1Very low
Flat1Very low
Northeast2Low
Northwest2Low
Southeast4High
Southwest5Very high
Slope (°)>355Very high
25–354High
15–253Moderate
5–152Low
≤51Very low
VegetationNDVI>0.671Very low
0.54–0.672Low
0.40–0.543Moderate
0.27–0.404High
≤0.275Very high
Fuel type modelFuel model 13Moderate
Fuel model 21Very low
Fuel model 34High
Fuel model 45Very high
Fuel model 53Moderate
Fuel model 64High
Fuel model 75Very high
MeteorologicalFWI>285Very high
23–284High
13–233Moderate
3–132Low
≤31Very low
Anthropogenic issuesRoad distance (m)>12001Very low
12002Low
9003Moderate
6004High
3005Very high
Settlement distance (m)>20001Very low
20002Low
15003Moderate
10004High
5005Very high
Historical firesFire regimes (TSF-FR)Fire regime 11Very Low
Fire regime 22Low
Fire regime 33Moderate
Fire regime 44High
Fire regime 55Very high
Table 3. Results of the FWI calculated components.
VariablesStudy Area AStudy Area B
Temperature (°C)30.329.9
Temperature previous day (°C)28.226.6
Relative humidity (%)47.042.6
Relative humidity previous day (%)56.458.0
Absolute pressure (hPa)960.4966.6
Wind speed (km/h)11.19.5
Wind direction (°)106.9139.7
Instantaneous rainfall (mm)00
FFMC89.0989.71
ISI6.586.64
DMC10.0310.31
DC21.4021.33
BUI9.9610.22
Table 4. Historical records of forest fire from 2001 to 2017 in Lobios municipality.
Fire YearBurnt Area (ha) Recurrence Year
20011.717-
2004211-
2005362-
2006116-
200716.042001, 2004
20092922001, 2004, 2007
20105242001
20113.1082001, 2005, 2006
20161.2762004
20172.6722001, 2006, 2010, 2011
Table 5. Results of comparison matrix and weights to criteria factors.
CriteriaCriteriaWi
Anthropogenic issuesDistance from roadsDistance from settlements
Distance from roads130.750
Distance from settlements1/310.250
Criteria: vegetationNDVIFuel model typeWi
NDVI11/30.250
Fuel model type310.750
Criteria: topographyAspectSlopeElevationWi
Aspect1230.539
Slope1/2120.297
Elevation1/31/210.164
Table 6. Results of weight calculated for each group.
VegetationTopographyFWISocioeconomicsFire HistoricalWi
Vegetation132250.359
Topography1/311/31/330.108
FWI1/231350.298
Anthropogenic issues1/231/3130.180
Fire historical1/51/31/51/310.055
Publisher’s Note: MDPI stays neutral with regard to jurisdictional claims in published maps and institutional affiliations.

