Technical Note

CoralTemp and the Coral Reef Watch Coral Bleaching Heat Stress Product Suite Version 3.1

1
Coral Reef Watch, National Oceanic and Atmospheric Administration, College Park, MD 20740, USA
2
ReefSense Pty, Ltd., P.O. Box 343, Aitkenvale BC, Aitkenvale, QLD 4814, Australia
3
Earth System Science Interdisciplinary Center, Cooperative Institute for Satellite Earth System Studies, University of Maryland, College Park, MD 20740, USA
4
NOAA/NESDIS/STAR Center for Satellite Applications and Research, 5830 University Research Court, College Park, MD 20740, USA
*
Author to whom correspondence should be addressed.
Remote Sens. 2020, 12(23), 3856; https://0-doi-org.brum.beds.ac.uk/10.3390/rs12233856
Submission received: 30 August 2020 / Revised: 11 November 2020 / Accepted: 16 November 2020 / Published: 25 November 2020

Abstract

:
The National Oceanic and Atmospheric Administration (NOAA) Coral Reef Watch (CRW) program has been providing resource managers, scientific researchers, and other coral reef ecosystem stakeholders with coral bleaching heat stress products for more than 20 years. The development of the CoralTemp sea surface temperature (SST) dataset has allowed CRW to produce the Coral Bleaching Heat Stress product suite with climatologies and daily SST measurements from within the same SST dataset, significantly improving data quality. Previously, the Monthly Mean (MM) SST and Maximum Monthly Mean (MMM) SST climatologies were derived using a different dataset from the near real-time SST. Here we provide an up-to-date description of how each product within the Coral Reef Watch Coral Bleaching Heat Stress product suite version 3.1 is derived, including descriptions of the MM, MMM, SST Anomaly, Coral Bleaching HotSpot and Degree Heating Week (DHW) products.

Graphical Abstract

1. Introduction

In the face of increased mass coral bleaching due to climate change [1,2,3], tools that allow coral reef managers, scientists and stakeholders to monitor the extent and severity of coral bleaching are becoming more and more important. Although it remains important for the gathering of in situ bleaching surveys, the advent of freely available satellite products that monitor heat stress, leading to coral bleaching, have become one of the most important coral bleaching monitoring tools that exist today. The most widely used satellite heat stress monitoring tools are developed and served by the National Oceanic and Atmospheric Administration’s (NOAA) Coral Reef Watch (CRW) program.
CRW relies heavily on satellite-based sea surface temperature (SST) products to provide a wide range of coral stress metrics for use by coral reef managers, scientists, and other stakeholders. Its flagship product, Degree Heating Week (DHW), provides a measure of accumulated heat stress, which is a strong predictor of mass coral bleaching [1,2,3]. This, and most of the other CRW heat stress products, are based on anomalies and as such, they require a climatology for their derivation. Historically, when developing these anomaly products, CRW has been challenged by two separate and seemingly intractable issues: having a long enough dataset for creating a stable and accurate climatology, and being able to do this with a dataset that is identical to the near real-time (NRT) SST data used to calculate the anomaly products.
In the early days of satellite remote sensing of SST, the Rosenstiel School of Marine and Atmospheric Science, University of Miami, created a climatology for these anomaly products using an in-house archive of NRT satellite SST observations. At the time, they only had nine years of data (1985 to 1993) from polar-orbiting satellites; however, due to the eruption of Mt. Pinatubo in the Philippines, which caused aerosol contamination of the SST products, they chose not to use data from 1991 and 1992, leaving seven years of data. An average of these years created a climatology that was centered on 1988.2857, which is the date to which CRW continues to “set” its climatologies (see Section 2.2 below). Seven years was less than ideal for the creation of a climatology but, at the time, was the best available dataset. Furthermore, the algorithms used to produce the SSTs in the climatology were somewhat different from those used for the derivation of the NOAA NRT SST, resulting in non-geophysical biases among the various CRW anomaly products.
The Advanced Very High Resolution Radiometer (AVHRR) Pathfinder dataset was developed to provide a long, consistent dataset. Its use enabled CRW to improve the climatology by increasing the number of years used. However, differences remained between the climatology SSTs and NRT SSTs, causing biases, especially at the highest temperatures.
Beginning in 2009 the NOAA Geostationary/Polar-Orbiting Blended Satellite SST product team (herein referred to as the Geo-Polar SST team) developed higher resolution SST datasets, first at 11 km, switching to 5 km in 2012. This blended SST product [4], (herein referred to as Geo-Polar SST) was adopted by CRW for its products starting in 2014. Since the 5 km Geo-Polar SST data were so new, CRW had to rely on the AVHRR Pathfinder dataset to provide a 5 km climatology to develop its anomaly-based products. This dataset mismatch resulted in even larger biases between the NRT SST and climatology.
Throughout 2017, with help from the Geo-Polar SST team, CRW created the CoralTemp SST product to use as the basis for its Coral Bleaching Heat Stress product suite. This provided a single, daily 0.05-degree resolution SST product that continuously spanned 1985 to the present, allowing CRW to produce internally consistent anomaly products.
This paper provides a detailed description of the key components to the NOAA CRW Coral Bleaching Heat Stress product suite version 3.1, including: the CoralTemp SST product, the Monthly Mean (MM) climatology, the Maximum Monthly Mean (MMM) climatology, the SST Anomaly product, the Coral Bleaching HotSpot (HS) product, and the Degree Heating Week (DHW) product used to monitor heat stress, leading to mass coral bleaching. Some of this methodology has been previously published [5,6,7]; however, this is the first time that these products have all been detailed in the one paper. It serves as a reference for users of the CRW Coral Bleaching Heat Stress product suite, providing a clear description of the algorithms and methods.

2. Data and Methods

2.1. CoralTemp Version 3.1

CoralTemp version 3.1 is derived using a combination of three level-4 satellite SST products.
  • The Operational SST and Sea Ice Analysis (OSTIA) reanalysis version 1.0 [8] combines polar-orbiting satellite SST with in situ data from the International Comprehensive Ocean-Atmosphere Data Set (ICOADS) to produce a daily, gap-free SST product, gridded at 0.05 degrees, that spans 1985 to 2007. The OSTIA reanalysis includes SST data from thermal infrared sensors on nine polar-orbiting satellites, information about the presence of ice from microwave sensors on two polar-orbiting satellites, and all of the in situ data contained within the ICOADS Release 2.0 dataset (Figure 1);
  • The NOAA Geo-Polar SST product is an operational NRT SST product, developed and delivered by NOAA [4]. The Geo-Polar SST product combines SST from a combination of two, and more recently three, polar orbiting satellites and now five geostationary satellites. The NRT Geo-Polar SST now uses NRT OSTIA as a bias correction reference, rather than the NOAA National Centers for Environmental Prediction (NCEP) Real-Time Global High-Resolution SST. As with OSTIA, the NRT Geo-Polar SST product is a daily, gap-free SST product, gridded at 0.05 degrees;
  • The NOAA Geo-Polar SST reanalysis product implements the same methodologies as the NRT Geo-Polar SST, and also uses OSTIA to correct for bias (the OSTIA reanalysis is used from 2002 to end-2007 and the NRT OSTIA is used from 2008 to 2016). Throughout the entire reprocessing period (2002 to 2016), SSTs from two polar orbiting satellites and 2–4 geostationary satellites were used as data inputs. As with the OSTIA and NRT Geo-Polar SST, the Geo-Polar SST reanalysis product is a daily, gap-free SST product, gridded at 0.05 degrees.
In the CoralTemp SST dataset, the OSTIA reanalysis was used to span the period from January 1985 to November 2002, the Geo-Polar SST reanalysis for November 2002 to October 2016, and the NRT Geo-Polar SST for October 2016 to the present.
As CoralTemp was created for CRW to use in developing its Coral Bleaching Heat Stress products, it made sense to set the timing of dataset merges during times of little to no heat stress. Accordingly, the percentage of global reef pixels at HS ≥ 1 were calculated for the overlap years of 2002 and 2016 (Figure 2 and Figure 3). Exactly the same methods were used as described in Skirving et al., 2019 [3].
As the Geo-Polar SST reanalysis extended back to 1 September 2002, November 2002 was chosen as the month in which the switch from the OSTIA reanalysis to the Geo-Polar SST reanalysis took place (Figure 2). To ensure that there were no unusual jumps for any satellite pixel, the transition took place across the first 28 days of November (a full tidal cycle), over which time the OSTIA reanalysis was phased out and the Geo-Polar SST reanalysis was phased in using a linear approach.
Each SST was calculated as follows:
  • Day 1: (28 × SSTOSTIA + 1 × SSTGP)/29
  • Day 2: (27 × SSTOSTIA + 2 × SSTGP)/29
  • … through to
  • Day 28: (1 × SSTOSTIA + 28 × SSTGP)/29, where GP is short for Geo-Polar SST.
The Geo-Polar SST reanalysis was extended through to the end of 2016. Using similar logic to the above, October 2016 was chosen to be the month for the transition from the Geo-Polar SST reanalysis to the NRT Geo-Polar SST, which took place from 1 to 28 October 2016 (Figure 3), and was calculated as above.

2.2. Monthly Mean Climatology

The monthly mean (MM) climatology is a set of 12 SST values that represent the average SST for each month calculated over the period 1985 to 2012, adjusted to 1988.2857 (being the average of the years used in the original climatology, i.e., 1985–1990 and 1993). To achieve this, the daily SST values in each month were averaged to produce 12 mean SST values for each of the 28 years from 1985 to 2012. A least squares linear regression was then applied to each month, e.g., the 28 values for each of the Januaries (Y-values) were regressed against the years (X-values), and the SST value corresponding to X = 1988.2857 was assigned as the MM value for January for each 0.05 × 0.05 degree pixel separately. This was repeated for each month until each pixel had a set of 12 MM values, representing the MM climatology. This method maintained a similar MM value to that of the original climatology while increasing the number of years that contributed to the climatology. This was done in order to provide consistency of interpretation throughout the various versions of the heat stress products.

2.3. Maximum Monthly Mean Climatology

The Maximum Monthly Mean (MMM) climatology is the maximum of the 12 MM values for each satellite pixel.

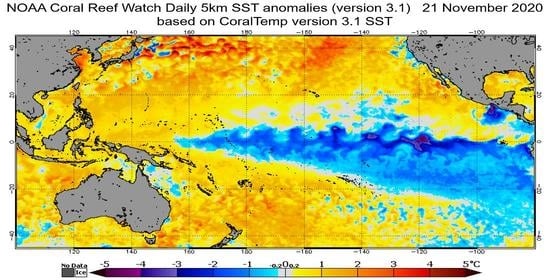
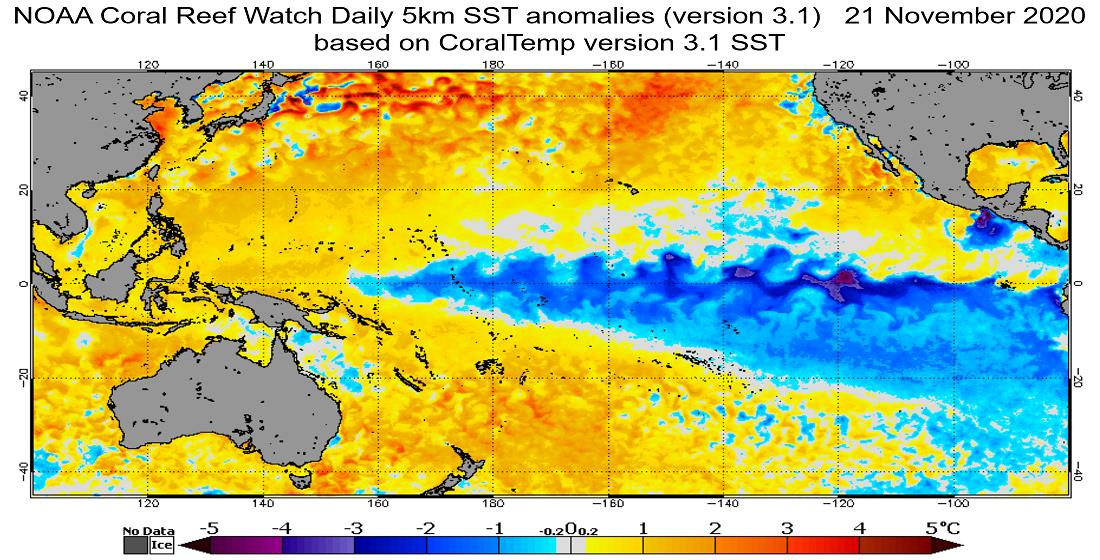
2.4. SST Anomaly Product

The daily SST Anomaly product requires a daily climatology for calculating the daily SST anomalies. The daily climatologies (DC) are derived from the MM via a linear interpolation. To achieve this, the MM value was assigned to the 15th day of each corresponding month, with the individual days between these dates being derived using a linear interpolation. The daily SST Anomaly product is then calculated using
SST   Anomaly i = SST i DC d , where   i   is   the   day   of   the   anomaly   and   d   is   the   day   number   corresponding   to   i

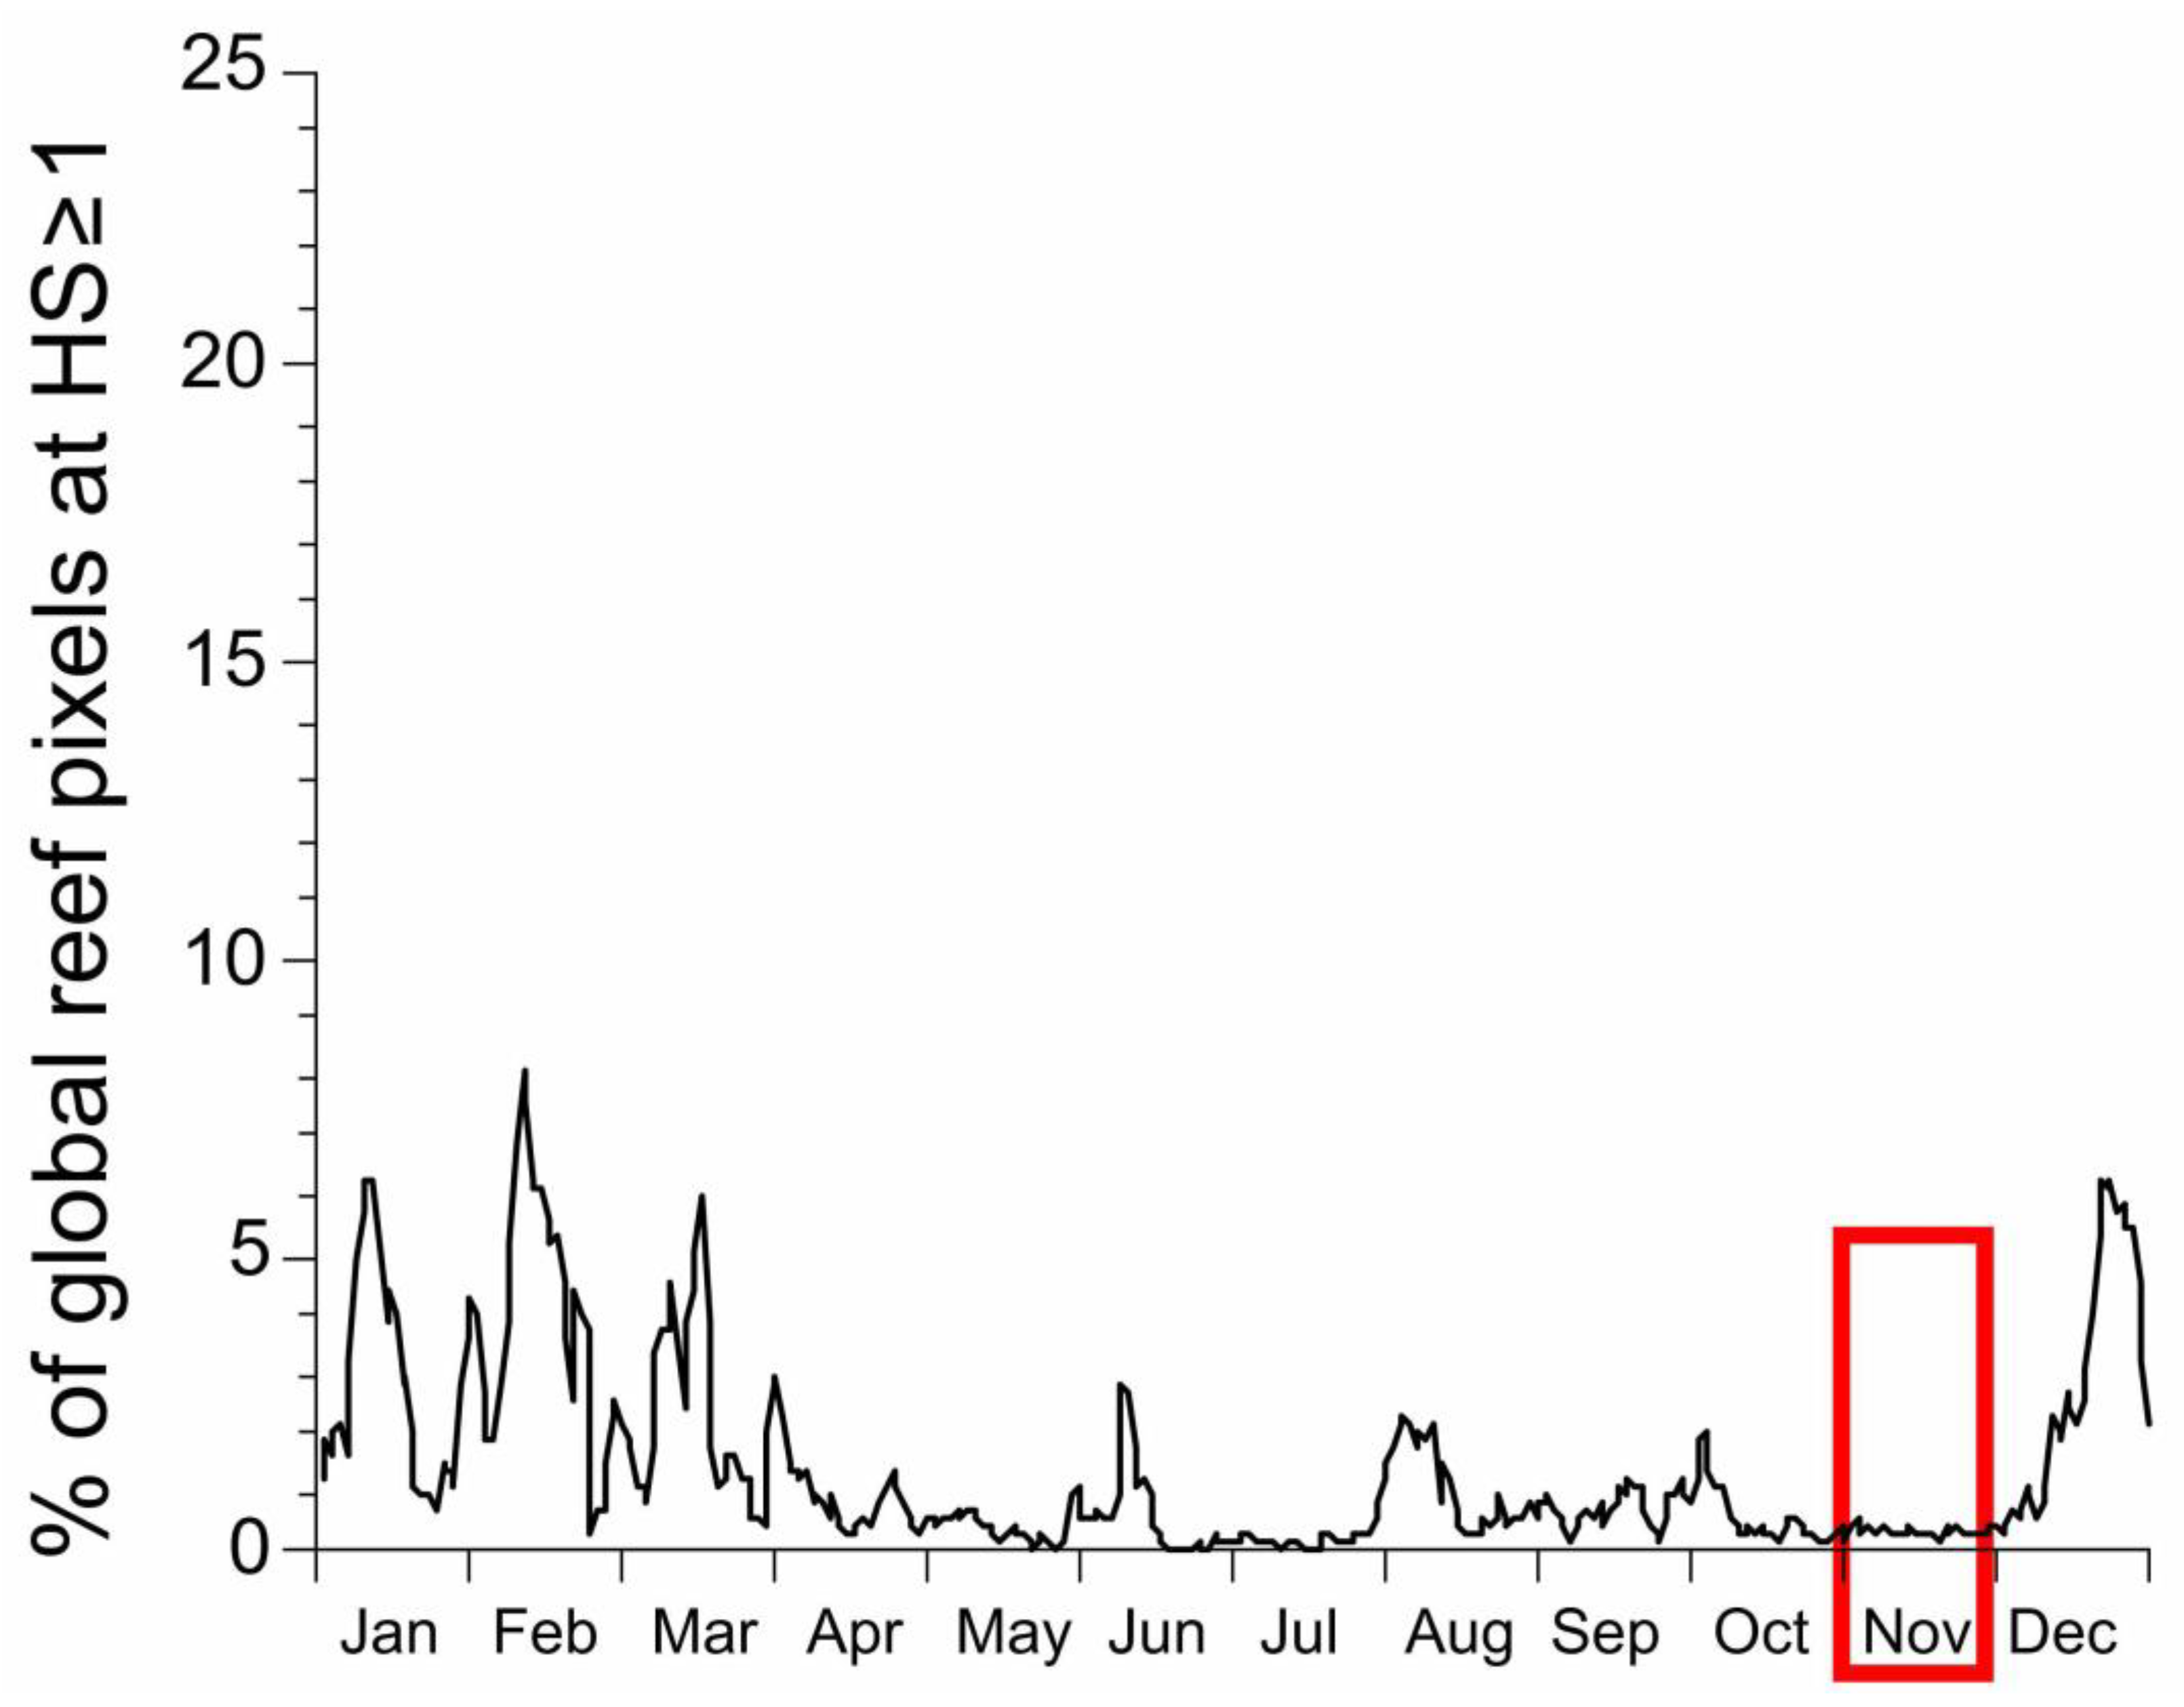
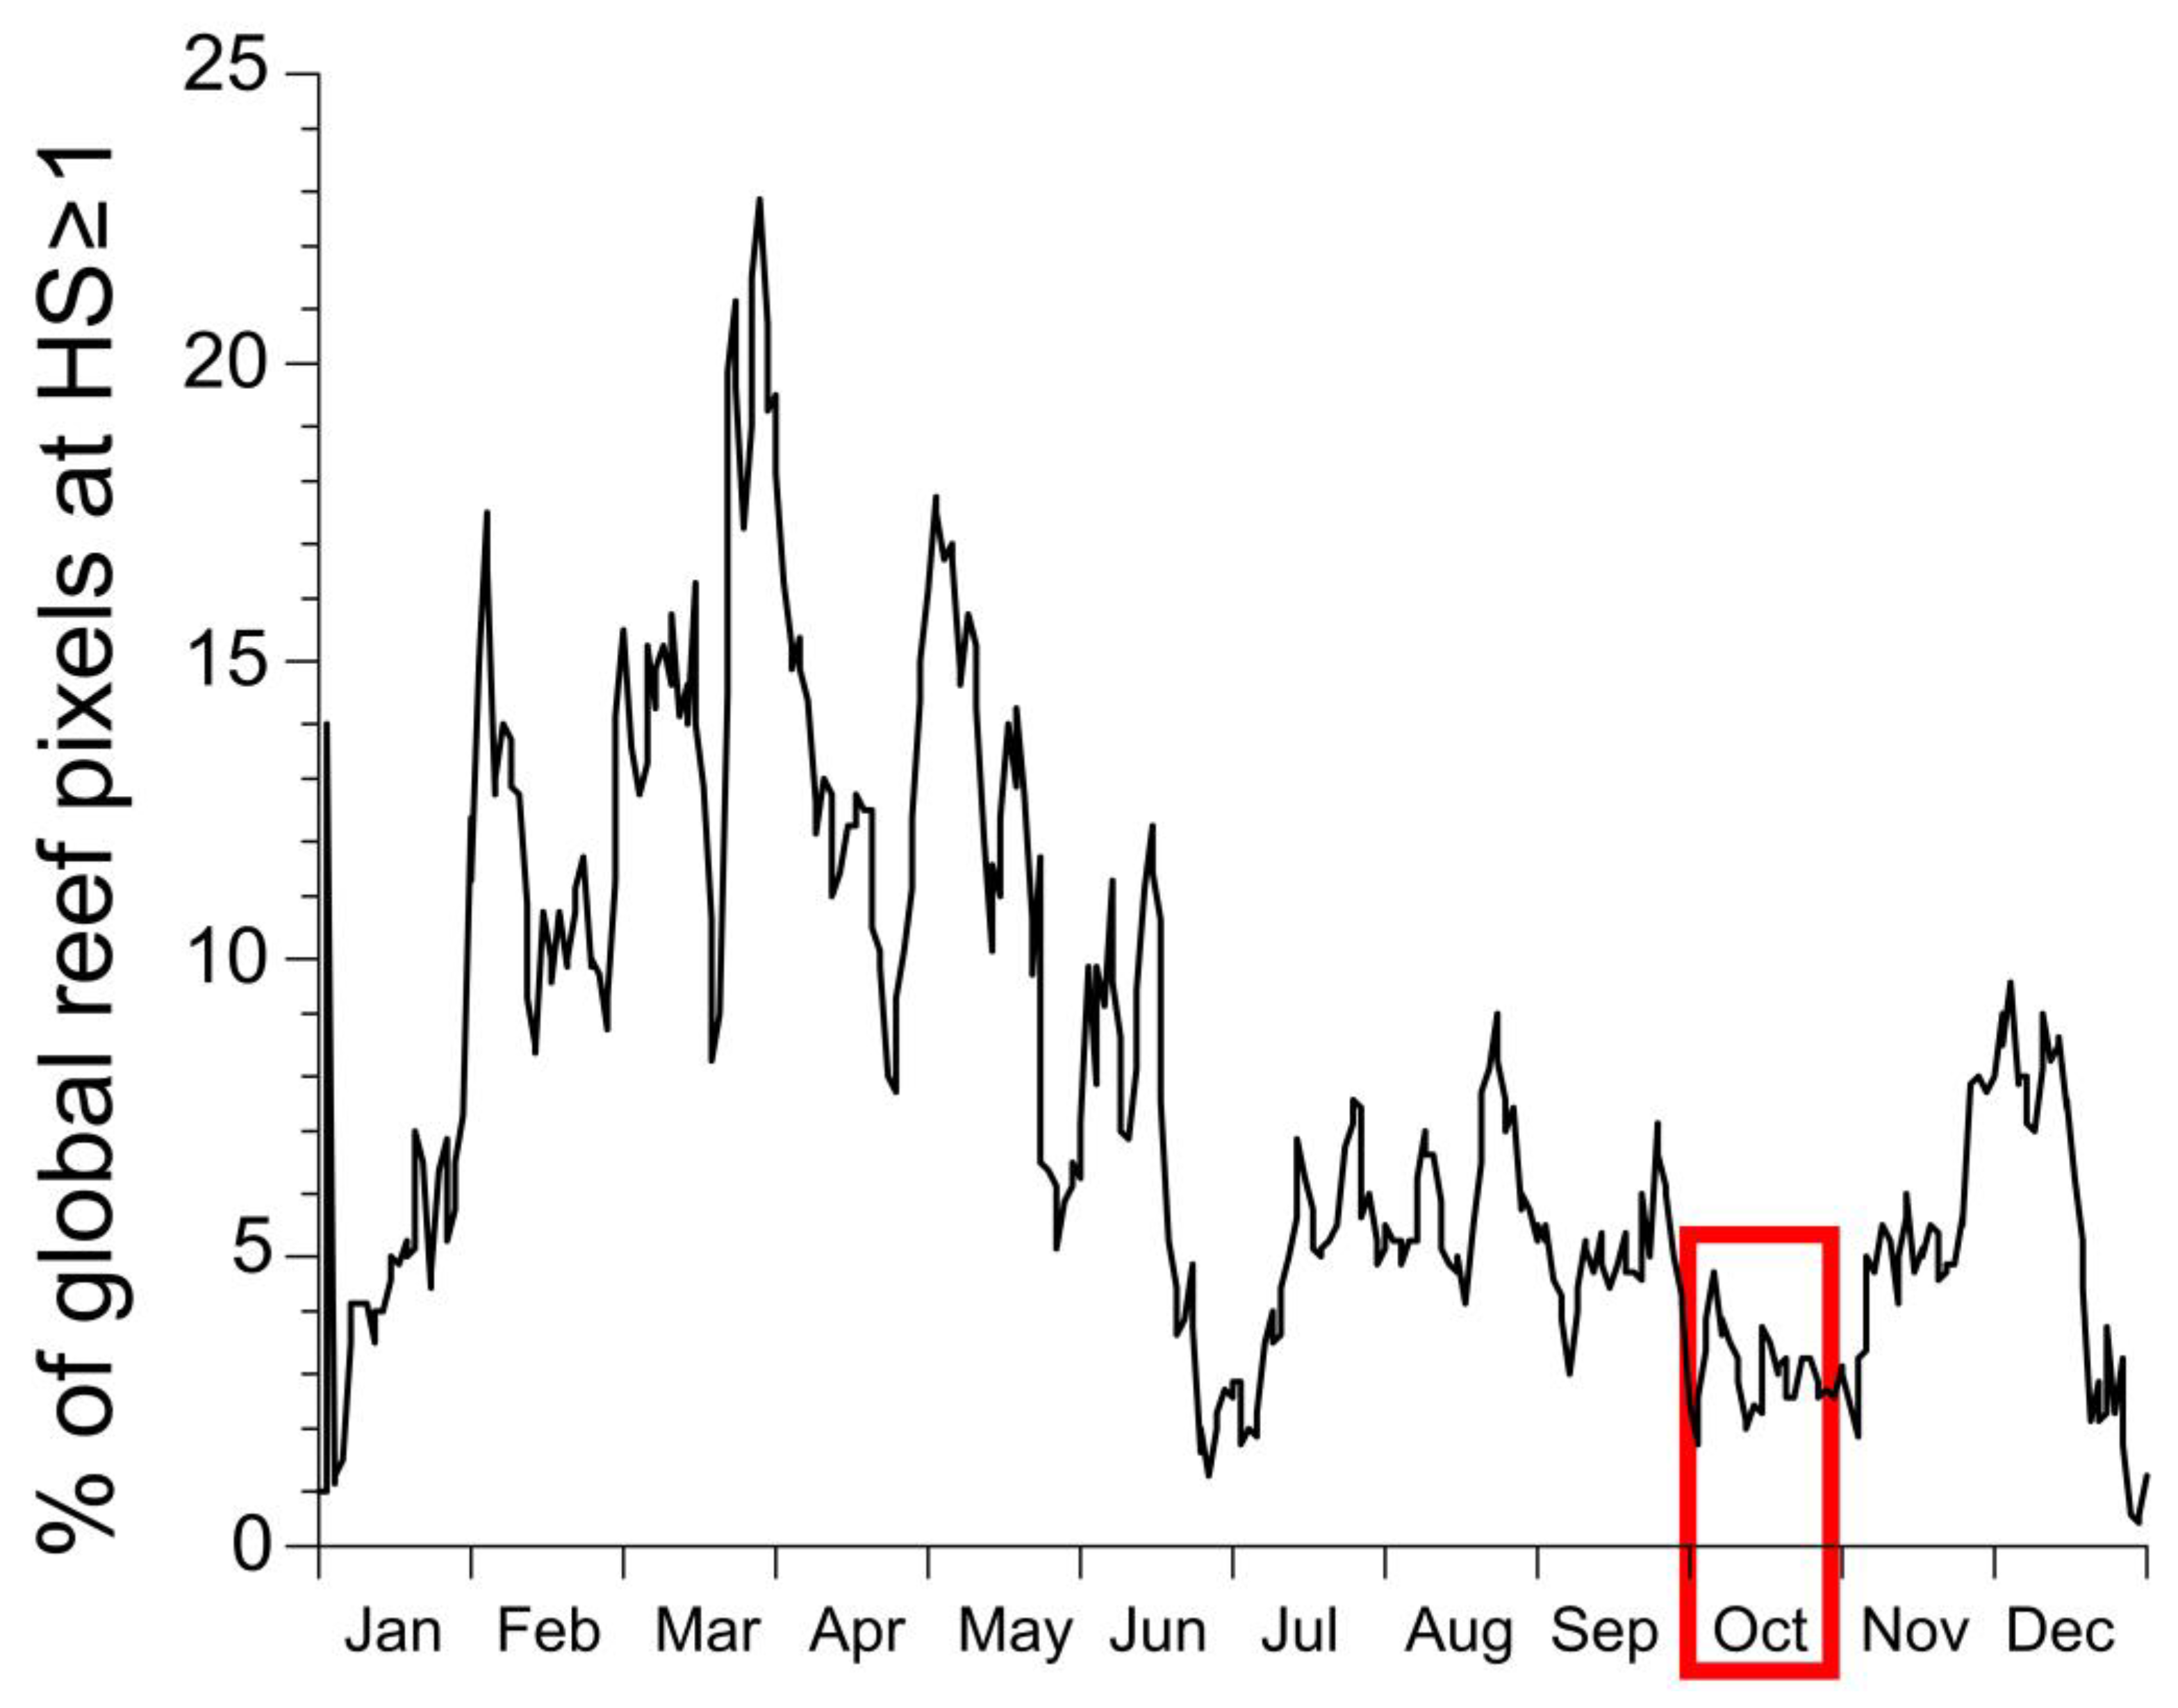
2.5. Coral Bleaching HotSpot (HS) Product

The HS is calculated as the difference between a day’s SST and the MMM:
HS i = SST i MMM ,   HS i 0
Note that there is only one value of the MMM for a single pixel, whereas the HS and corresponding SST vary on a daily basis. The HS is always zero or positive, so when the calculation results in a negative HS, it is set to zero.

2.6. Degree Heating Week (DHW) Product

The DHW is the daily summation, over a 12-week (84 days) running window, of HS values of 1 or more, expressed as degrees Celsius weeks (°C weeks), since the development of coral bleaching is usually on the order of weeks. Each daily HS value, if included in the summation, is divided by seven prior to being added to the total, such that
DHW i = n = i 83 i ( HS n 7 ) ,   where   HS n 1
For example, if the 12-week window ending on June 1, 2014 (i = 1 June 2014), had included only four daily Coral Bleaching HotSpot values above zero, of 1.0, 2.0, 0.8 and 1.2 °C, then, since 0.8 °C is less than 1 °C, it would not be included in the DHW summation of accumulated heat stress for this period. However, 1.0, 2.0, and 1.2 °C each would have been divided by seven, and then summed. The resulting DHW value for 1 June 2014 (DHW1 June 2014) would have been 0.6 °C weeks.

3. Discussion

Mass coral bleaching has long been associated with temperatures above expected warm-season conditions [9,10,11]. If heat stress is sufficiently severe and persistent, coral bleaching and subsequent death can occur across an entire reef ecosystem [12]. The CRW Coral Bleaching Heat Stress product suite version 3.1 discussed herein is designed to assist coral reef managers, scientists and other users with tracking and understanding the heat stress associated with mass coral bleaching.

3.1. CoralTemp

When CoralTemp was conceived, there was only one level-4 daily SST satellite product that was gap-filled, had a spatial resolution of 0.05 degrees (approximately 5 km), and had a reanalysis and near real-time version. Developed and produced by the United Kingdom Meteorological Office (Met Office), the NRT OSTIA [13] is provided by the Met Office, and since 2014, also by the Copernicus Marine Environment Monitoring Service. When combined with the OSTIA reanalysis, which covers 1985 to 2007 [8], the NRT OSTIA constitutes a continuous SST dataset that stretches from 1985 to the present.
Although OSTIA is an accurate SST product [8,14], it is spatially inconsistent, especially over coral reefs. The NRT OSTIA uses numerous polar-orbiting satellites and blends these with one geostationary satellite over Europe/Africa and in situ data from the International Comprehensive Ocean-Atmosphere Data Set (ICOADS). This results in a product with spatially dense data in the vicinity of Europe/Africa and less dense data in other parts of the world, especially in cloudy regions such as Indonesia. There is also a density difference in data between the open ocean, where ICOADS data are frequent, and coral reefs, where ICOADS data are virtually absent due to a lack of shipping near coral reefs.
The NRT Geo-Polar SST product was developed and is delivered by NOAA [4]. The NRT Geo-Polar SST originally used the National Centers for Environmental Prediction (NCEP) real-time global (RTG) SST [15] for bias correction of the satellite data. Early in 2017, NOAA switched the Geo-Polar SST to use OSTIA as the reference, which brought the Geo-Polar SST in line with OSTIA from a radiometric perspective, whilst retaining the spatial completeness of the Geo-Polar SST. This paved the way for the creation of CoralTemp.
It is worth noting that the data density benefits of the Geo-Polar SST (both the NRT and the reanalysis) are present in CoralTemp from 2002 onwards, and since the OSTIA reanalysis is used to provide data to cover from 1985 to 2002, this period has lower data density, and hence more interpolation. This should not be an issue for the derivation of climatologies such as the MMM; however, it may be an issue in some regions for analyses that make highly specific comparisons of small areas (e.g., a single coral reef) across the entire time period of CoralTemp.
Note that recently CRW have moved to versioning based on product suites, and since CoralTemp is part of the CRW Coral Bleaching Heat Stress product suite, CoralTemp is referred to as being version 3.1, even though it is the first version of this product.

3.2. MM and MMM Climatologies

All CRW Coral Bleaching Heat Stress products are derived using some form of SST Anomaly product. These anomaly products utilize two climatologies to derive the heat stress metrics. The MM describes the seasonal variation of the average SST for a particular region, while the maximum of the MMs (i.e., the MMM) is used to determine the maximum expected warm-season SST.

3.3. SST Anomaly Product

Since its inception in 2000, CRW has provided its users with the SST Anomaly product that is aimed at tracking the difference between the current SST and the long-term daily average SST, derived using the MM climatology. Although this does not track the extreme heat stress associated with coral bleaching, it allows users to track changes in local conditions, providing them with a broader view of SST anomalies that can help contextualize coral bleaching-level heat stress events as well as other departures from the climatological norm. Note that the SST Anomaly product is positive if the current SST is warmer than the climatology and negative if the current SST is cooler than the climatology.

3.4. Coral Bleaching HotSpot Product

The Coral Bleaching HotSpot product is a daily anomaly product based on the MMM climatology. It is designed to provide a metric that describes the daily heat stress being experienced by corals. Damaging heat stress is considered to be present at HS ≥ 1 °C [16,17]. Since the spatial resolution of this product is 0.05 degrees (approximately 5 × 5 km), and since the anomaly is derived as an SST tuned to a depth of 20 cm [18], HS is best thought of as a generic reef-wide measure of daily heat stress, especially when considering the variety of thermal thresholds that exist among coral species [19]. Note that since HS is a measure of heat stress resulting from high SSTs, the HS is provided as zero or as a positive value (i.e., all negative values are presented as zero since HS ≤ 0 represents a state of no heat stress).

3.5. Degree Heating Week Product

While the HS provides a measure of daily heat stress, organismal stress is frequently a cumulative effect, increasing in physiological impact over time. The DHW is a measure of accumulated daily heat stress. Since heat stress is present for a coral location when HS reaches or exceeds 1 °C, the DHW only accumulates HS values of 1 or more. Accumulated heat stress, as measured by the DHW, is well correlated with bleaching onset and severity e.g., [1,2]. It is also correlated with mortality [20].
DHW is one of the most widely used products from within the CRW product suite. It is extensively utilized by coral reef managers, scientists and other users throughout the world to monitor, predict, track and understand heat stress related to coral bleaching and often serves as the basis for regional bleaching response plans [2,21,22,23,24,25].
The bleaching event on the Great Barrier Reef (GBR) during 2016 is a good example of how CoralTemp has improved the CRW Coral Bleaching Heat Stress product suite. The CRW Bleaching Alert Area (BAA) is a categorization of the DHW and HS values and is a good product for simplifying the complexities of heat stress on reefs. Figure 4a,b shows the 2016 annual maximum BAA for the GBR during 2016. Figure 4a depicts the results from BAA version 2.0, which used the AVHRR Pathfinder-derived MMM and the NRT Geo-Polar SST to calculate the DHW version 2.0, while Figure 4b depicts the results from BAA version 3.1, which uses CoralTemp version 3.1 to derive the DHW version 3.1. The difference between the two datasets is the replacement of SST in the calculation of the climatology (described above), since the exact same methodologies are used to derive the climatologies and to calculate the DHW. Note that the Bleaching Alert Levels 1 (light red) and 2 (dark red) for Figure 4b are a far better match with the aerial surveys of coral bleaching (Figure 4c), than Figure 4a, demonstrating the improvement CoralTemp brought to the estimates of coral bleaching heat stress. A more thorough analysis of the accuracy of DHW version 3.1 will be the subject of a future paper.

4. Conclusions

The development of CoralTemp has allowed NOAA CRW to produce the Coral Bleaching Heat Stress product suite with climatologies and daily SST from within the same SST dataset, an improvement over previous methodologies. NOAA CRW will continue to develop and enhance CoralTemp and the derived Coral Bleaching Heat Stress products in the years ahead. All products can be found on the NOAA CRW website: www.coralreefwatch.noaa.gov.

Author Contributions

W.S., B.M., J.D.L.C., G.L., A.H., E.M., E.G. and C.M.E. conceived and designed the products; W.S., B.M., J.D.L.C., G.L., E.G. and A.H. developed the products; W.S. wrote the paper with editorial assistance from B.M., J.D.L.C., G.L., A.H., E.M., E.G. and C.M.E. All authors have read and agreed to the published version of the manuscript.

Funding

Coral Reef Watch and ReefSense staff were fully supported, and this study was partially supported, by NOAA grant NA19NES4320002 (Cooperative Institute for Satellite Earth System Studies) at the University of Maryland/ESSIC.

Acknowledgments

The scientific results and conclusions, as well as any views or opinions expressed herein, are those of the author(s) and do not necessarily reflect the views of NOAA or the Department of Commerce.

Conflicts of Interest

On behalf of all authors, the corresponding author states that there is no conflict of interest. All authors have read and agreed to the published version of the manuscript.

References

  1. Eakin, C.M.; Morgan, J.A.; Heron, S.F.; Smith, T.B.; Liu, G.; Alvarez-Filip, L.; Baca, B.; Bartels, E.; Bastidas, C.; Bouchon, C.; et al. Caribbean Corals in Crisis: Record Thermal Stress, Bleaching, and Mortality in 2005. PLoS ONE 2010, 5, e13969. [Google Scholar] [CrossRef] [PubMed] [Green Version]
  2. Heron, S.F.; Johnston, L.; Liu, G.; Geiger, E.F.; Maynard, J.A.; De La Cour, J.L.; Johnson, S.; Okano, R.; Benavente, D.; Burgess, T.F.R.; et al. Validation of Reef-Scale Thermal Stress Satellite Products for Coral Bleaching Monitoring. Remote Sens. 2016, 8, 59. [Google Scholar] [CrossRef] [Green Version]
  3. Skirving, W.J.; Heron, S.F.; Marsh, B.L.; Liu, G.; De La Cour, J.L.; Geiger, E.F.; Eakin, C.M. The relentless march of mass coral bleaching: A global perspective of changing heat stress. Coral Reefs 2019, 38, 547–557. [Google Scholar] [CrossRef] [Green Version]
  4. Maturi, E.; Harris, A.; Mittaz, J.; Sapper, J.; Wick, G.; Zhu, X.; Dash, P.; Koner, P.K. A New High-Resolution Sea Surface Temperature Blended Analysis. Bull. Am. Meteorol. Soc. 2017, 98, 1015–1026. [Google Scholar] [CrossRef]
  5. Liu, G.; Heron, S.F.; Eakin, C.M.; Mullerkarger, F.E.; Vega-Rodriguez, M.; Guild, L.S.; De La Cour, J.L.; Geiger, E.F.; Skirving, W.J.; Burgess, T.F.R.; et al. Reef-Scale Thermal Stress Monitoring of Coral Ecosystems: New 5-km Global Products from NOAA Coral Reef Watch. Remote Sens. 2014, 6, 11579–11606. [Google Scholar] [CrossRef] [Green Version]
  6. Heron, S.F.; Liu, G.; Rauenzahn, J.L.; Christensen, T.R.L.; Skirving, W.J.; Burgess, T.F.R.; Eakin, C.M.; Morgan, J.A. Improvements to and continuity of operational global thermal stress monitoring for coral bleaching. J. Oper. Oceanogr. 2014, 7, 3–11. [Google Scholar] [CrossRef]
  7. Liu, G.; Skirving, W.J.; Geiger, E.F.; De La Cour, J.L.; Marsh, B.L.; Heron, S.F.; Tirak, K.V.; Strong, A.E.; Eakin, C.M. NOAA Coral Reef Watch’s 5km satellite coral bleaching heat stress monitoring product suite version 3 and four-month Outlook version 4. Reef Encount. 2017, 32, 39–45. [Google Scholar]
  8. Roberts-Jones, J.; Fiedler, E.K.; Martin, M.J. Daily, Global, High-Resolution SST and Sea Ice Reanalysis for 1985–2007 Using the OSTIA System. J. Clim. 2012, 25, 6215–6232. [Google Scholar] [CrossRef]
  9. Glynn, P.W.; D’Croz, L. Experimental evidence for high temperature stress as the cause of El Niño-coincident coral mortality. Coral Reefs 1990, 8, 181–191. [Google Scholar] [CrossRef]
  10. Jokiel, P.L.; Coles, S.L. Response of Hawaiian and other Indo-Pacific reef corals to elevated temperature. Coral Reefs 1990, 8, 155–162. [Google Scholar] [CrossRef]
  11. Hoegh-Guldberg, O. Climate change, coral bleaching and the future of the world’s coral reefs. Mar. Freshw. Res. 1999, 50, 839–866. [Google Scholar] [CrossRef] [Green Version]
  12. Ove, H.-G.; Hoegh-Guldberg, O. The cell physiology of coral bleaching. In Tropical Mangrove Ecosystems; Phinney, J.T., Hoegh-Guldberg, O., Kleypas, J., Skirving, W., Strong, A., Eds.; American Geophysical Union: Washington, DC, USA, 2006; pp. 55–71. [Google Scholar]
  13. Donlon, C.; Martin, M.; Stark, J.D.; Roberts-Jones, J.; Fiedler, E.; Wimmer, W. The Operational Sea Surface Temperature and Sea Ice Analysis (OSTIA) system. Remote Sens. Environ. 2012, 116, 140–158. [Google Scholar] [CrossRef]
  14. Fiedler, E.K.; McLaren, A.; Banzon, V.; Brasnett, B.; Ishizaki, S.; Kennedy, J.; Rayner, N.; Roberts-Jones, J.; Corlett, G.; Merchant, C.J.; et al. Intercomparison of long-term sea surface temperature analyses using the GHRSST Multi-Product Ensemble (GMPE) system. Remote Sens. Environ. 2019, 222, 18–33. [Google Scholar] [CrossRef] [Green Version]
  15. Thiébaux, J.; Rogers, E.; Wang, W.; Katz, B. A New High-Resolution Blended Real-Time Global Sea Surface Temperature Analysis. Bull. Am. Meteorol. Soc. 2003, 84, 645–656. [Google Scholar] [CrossRef] [Green Version]
  16. Strong, A.; Barrientos, C.S.; Duda, C.; Sapper, J. Improved Satellite Techniques for Monitoring Coral Reef Bleaching. In Proceedings of the 8th International Coral Reef Symposium, Panama City, Panama, 24–29 June 1996; Volume 2, pp. 1495–1498. [Google Scholar]
  17. Skirving, W.J.; Liu, G.; Strong, A.E.; Liu, C.; Sapper, J.; Arzayus, F. Extreme events and perturbations of coastal ecosystems. In Thermal Infrared Remote Sensing; Rixhardson, L., LeDrew, E., Eds.; Springer: Dordrecht, The Netherlands, 2006; Volume 9, pp. 11–25. [Google Scholar]
  18. Skirving, W.J.; Enríquez, S.; Hedley, J.D.; Ove, H.-G.; Eakin, C.M.; Mason, R.A.B.; De La Cour, J.L.; Liu, G.; Hoegh-Guldberg, O.; Strong, A.E.; et al. Remote Sensing of Coral Bleaching Using Temperature and Light: Progress towards an Operational Algorithm. Remote Sens. 2017, 10, 18. [Google Scholar] [CrossRef] [Green Version]
  19. Mason, R.A.B.; Skirving, W.J.; Ove, H.-G. Integrating physiology with remote sensing to advance the prediction of coral bleaching events. Remote Sens. Environ. 2020, 246, 111794. [Google Scholar] [CrossRef]
  20. Hughes, D.P.M.; Kerry, J.T.; Baird, A.H.; Connolly, S.R.; Dietzel, A.; Eakin, C.M.; Heron, S.F.; Hoey, A.S.; Hoogenboom, M.O.; Liu, G.; et al. Global warming transforms coral reef assemblages. Nat. Cell Biol. 2018, 556, 492–496. [Google Scholar] [CrossRef] [PubMed]
  21. Marshall, P.; Schuttenberg, H. A Reef Manager’s Guide to Coral Bleaching; Great Barrier Reef Marine Park Authority: Townsville, Australia, 2006; p. 164.
  22. Thomas, C.R.; Heron, S.F. South-East Asia Coral Bleaching Rapid Response: Final Report; Commonwealth Scientific and Industrial Research Organisation: Campbell, Australia, 2011; p. 24.
  23. Moore, J.A.Y.; Bellchambers, L.M.; Depczynski, M.; Evans, R.D.; Evans, S.N.; Field, S.N.; Friedman, K.J.; Gilmour, J.P.; Holmes, T.H.; Middlebrook, R.; et al. Unprecedented Mass Bleaching and Loss of Coral across 12° of Latitude in Western Australia in 2010–11. PLoS ONE 2012, 7, e51807. [Google Scholar] [CrossRef] [PubMed] [Green Version]
  24. Liu, G.; Eakin, C.M.; Rauenzahn, J.L.; Christensen, T.R.L.; Heron, S.F.; Li, J.; Skirving, W.; Strong, A.E.; Burges, T. NOAA Coral Reef Watch’s Decision Support System for Coral Reef Management. In Proceedings of the 12th International Coral Reef Symposium, Cairns, Australia, 9–13 July 2012; p. 5. [Google Scholar]
  25. GBRMPA. Coral Bleaching Risk and Impact Assessment Plan, 2nd ed.; Great Barrier Reef Marine Park Authority: Townsville, Australia, 2013; ISSN 2200-2022.
  26. Hughes, D.P.M.; Kerry, J.T.; Álvarez-Noriega, M.; Álvarez-Romero, J.G.; Anderson, K.D.; Baird, A.H.; Babcock, R.C.; Beger, M.; Bellwood, D.R.; Berkelmans, R.; et al. Global warming and recurrent mass bleaching of corals. Nat. Cell Biol. 2017, 543, 373–377. [Google Scholar] [CrossRef] [PubMed]
Figure 1. Timeline of availability of observational datasets for the Operational Sea Surface Temperature and Sea Ice Analysis (OSTIA) reanalysis (after Figure 1 in [8]). They include the (Advanced) Along-Track Scanning Radiometer ((A)ATSR) multi-mission series (blue shading), NASA/NOAA Pathfinder (orange shading), Ocean and Sea Ice Satellite Application Facility (OSI-SAF) sea ice concentration (green shading), and internal comprehensive Ocean Atmosphere Data Set (ICOADS) Release 2.0 in situ data (purple shading).
Remotesensing 12 03856 g001
Figure 2. Percentage of global coral reef pixels at HotSpot (HS) ≥ 1 for 2002. Note that the red box represents the transition period from OSTIA reanalysis to the Geo-Polar sea surface temperature (SST) reanalysis, which took place from 1 to 28 November 2002.
Remotesensing 12 03856 g002
Figure 3. Percentage of global coral reef pixels at HS ≥ 1 for 2016. Note that the red box represents the transition period from the Geo-Polar SST reanalysis to the NRT Geo-Polar SST, which took place from 1 to 28 October 2016.
Remotesensing 12 03856 g003
Figure 4. Comparison between Bleaching Alert Area (BAA) for the 2016 bleaching event on the Great Barrier Reef (BAA version 2.0 (a) and BAA version 3.1 (b)) and bleaching observations (c). BAA data were obtained from the NOAA Coral Reef Watch website (www.coralreefwatch.noaa.gov). The BAA categories are: yellow (Watch ≡ 0 < HS < 1), orange (Warning ≡ 0 < DHW < 4), light red (Alert Level 1 ≡ 4 ≤ DHW < 8) and dark red (Alert Level 2 ≡ DHW ≥ 8). Bleaching observations were obtained via extensive aerial surveys (totalling 1156 reefs): dark green (<1% of corals bleached), light green (1–10%), yellow (10–30%), orange (30–60%), red (>60%) (from [26]).
Remotesensing 12 03856 g004
Publisher’s Note: MDPI stays neutral with regard to jurisdictional claims in published maps and institutional affiliations.

