Article

Effects of Patchiness on Surface Soil Moisture of Alpine Meadow on the Northeastern Qinghai-Tibetan Plateau: Implications for Grassland Restoration

1
State Key Laboratory of Cryospheric Sciences, Northwest Institute of Eco-Environment and Resources, Chinese Academy of Sciences, 320 Donggang West Road, Lanzhou 730000, China
2
University of the Chinese Academy of Sciences, No.19A Yuquan Road, Beijing 100049, China
3
Institute of Fragile Ecosystem and Environment, School of Geographic Sciences, Nantong University, 999 Tongjing Road, Nantong 226007, China
*
Author to whom correspondence should be addressed.
Remote Sens. 2020, 12(24), 4121; https://0-doi-org.brum.beds.ac.uk/10.3390/rs12244121
Submission received: 25 November 2020 / Revised: 11 December 2020 / Accepted: 14 December 2020 / Published: 16 December 2020

Abstract

:
Surface soil moisture (SSM) is a key limiting factor for vegetation growth in alpine meadow on the Qinghai-Tibetan Plateau (QTP). Patches with various sizes and types may cause the redistribution of SSM by changing soil hydrological processes, and then trigger or accelerate alpine grassland degradation. Therefore, it is vital to understand the effects of patchiness on SSM at multi-scales to provide a reference for alpine grassland restoration. However, there is a lack of direct observational evidence concerning the role of the size and type of patches on SSM, and little is known about the effects of patches pattern on SSM at plot scale. Here, we first measured SSM of typical patches with different sizes and types at patch scale and investigated their patterns and SSM spatial distribution through unmanned aerial vehicle (UAV)-mounted multi-type cameras at plot scale. We then analyzed the role of the size and type of patchiness on SSM at both patch and plot scales. Results showed that: (1) in situ measured SSM of typical patches was significantly different (P < 0.01), original vegetation patch (OV) had the highest SSM, followed by isolate vegetation patch (IV), small bare patch (SP), medium bare patch (MP) and large bare patch (LP); (2) the proposed method based on UAV images was able to estimate SSM (0–40 cm) with a satisfactory accuracy (R2 = 0.89, P < 0.001); (3) all landscape indices of OV, with the exception of patch density, were positively correlated with SSM at plot scale, while most of the landscape indices of LP and IV showed negative correlations (P < 0.05). Our results indicated that patchiness intensified the spatial heterogeneity of SSM and potentially accelerated the alpine meadow degradation. Preventing the development of OV into IV and the expansion of LP is a critical task for alpine meadow management and restoration.

Graphical Abstract

1. Introduction

The Qinghai-Tibetan Plateau (QTP) encompasses 83% of the Earth’s terrain above 4000 m [1], and alpine meadow is widely distributed on the QTP [2]. The healthy development of alpine meadow not only affects the survival of local pastoralists but also plays an important role in climate regulation, soil water conservation, carbon fixation and biodiversity maintenance [3,4,5].
Nevertheless, the alpine meadow ecosystem on the QTP is fragile and vulnerable to external disturbances [6]. Permafrost degradation, rodent disturbance and overgrazing usually divide intact vegetation into archipelagos of small fragments [7,8]. Various patches, such as original vegetation patches, isolated vegetation patches and bare patches with different sizes are common on the QTP [9,10,11]. These patches with various sizes and types intensify the spatial heterogeneous distribution of soil gravel content, root biomass, and soil-saturated hydraulic conductivity [11,12]. These differences will cause the vertical exchange of energy and water fluxes among atmosphere, ground surface and underneath the soil, and thereby alter surface soil moisture (SSM). In addition, the patch pattern (the spatial distribution of various patches) can also affect SSM through horizontal exchange of soil waters [13].
SSM is the main source of water for plants and the carrier of soil nutrient circulation and flow [14]. SSM directly determines alpine grassland growth and spatial distribution, and then affects the ecological processes, ecological carrying capacity and restoration of the alpine meadow ecosystem [15]. The loss of soil water caused by climate warming and human activities accelerates the degradation of alpine grassland [16]. Similarly, changes of SSM caused by patches may also trigger grassland degradation on the QTP [17]. It is critical to investigate the characteristics of typical patches and explore their underlying effects on SSM. However, previous research mainly focused on the differences of SSM among different patch types such as poisonous weed patches and “black soil land” at patch scale [17,18]. There has been a lack of studies directly revealing the role of patch size on SSM and linking the patches pattern and SSM process at plot scale. The dilemma is that the spatial distributions of patchiness and SSM at plot scale are difficult to measure by in situ field survey or remote-sensing images [9].
Recently, the widespread application of lightweight unmanned aerial vehicles (UAVs) may fill this gap. UAVs can conduct low-altitude photogrammetry and obtain high spatial-temporal resolution data. They have become an efficient tool for long-term and repeated monitoring of patches [9,19,20]. In addition, a UAV with multi-type cameras is a viable observation platform for monitoring drought stress and soil moisture [21,22]. In this study, we aimed to perform in situ measurement and aerial images by UAV with multi-type cameras to evaluate the underlying effects of patchiness on SSM in alpine meadows. The specific objectives were to (1) study the effects of five typical patches with different sizes and types (original vegetation patch, isolate vegetation patch, small bare patch, medium bare patch and large bare patch) on SSM at patch scale; (2) investigate spatial distributions of the five typical patches and SSM based on UAV-borne visible, thermal infrared and multispectral images; and (3) reveal the role of the patches pattern on SSM at plot scale.

2. Materials and Methods

2.1. Study Area

The study was conducted at Suli Ecological Observation and Experiment Station (98°18′33.2″E, 38°25′13.5″N, 3887 m a.s.l.), Northwest Institute of Eco-Environment and Resources, Chinese Academy of Science. The research station is located in the source region of the Shule River Basin, the northeast edge of the QTP, China (Figure 1). The study area has a typical continental arid desert climate, with low mean annual air temperature, little rainfall, and high evaporation [23]. The mean annual precipitation is 200–400 mm, about 90% falls from May to September, and the mean annual temperature is −4.0 °C [11]. Soil in the study station is classified as “felty” with a pH of 8.56 and consists of 30.96% silt and fine soils, 57.52% fine sand and 10.68% coarse sand, and soil bulk density is 1.41 g cm−3 within 0–40 cm depth of the soil layer [24]. The vegetation belongs to alpine meadow, dominated by Kobresia capillifolia and Carex moorcroftii [25].

2.2. Field Work

The vegetation patch pattern was relatively stable [26,27], and the variations during the vigorous growth stage were small [20]. Given that the vegetation cover usually peaks at the end of July and beginning of August on the QTP [20,28,29], we chose six sampling plots (~50 m × 40 m) around the meteorological tower to conduct field work during June to August 2018 (Figure 1c). The effects of patchiness on SSM were evaluated by classifying the land surface into five typical patches: (1) original vegetation patch (OV, intact vegetation patch and patch size larger than 20 m2), (2) isolate vegetation patch (IV, vegetation patch surrounded by bare soil and patch size less than 20 m2), (3) large bare patch (LP, with patch size larger than 9.0 m2), (4) medium bare patch (MP, with patch size of 1.0–9.0 m2) and (5) small bare patch (SP, with patch size less than 1.0 m2) (Figure 2). At all sampling plots, aerial photogrammetry and field measurements were conducted simultaneously.
The UAV flew over six sampling plots in sequence and took photos at the center point automatically using the FragMAP (Fragmentation Monitoring and Analysis with Aerial Photography) system [9] (Figure 1c). We used Inspire 1 (global position system hovering accuracy: ± 2.5 m, DJI Innovation Company, China) mounted with three UAV-borne cameras (DJI Innovation Company, China) to construct the observation platform, including ZX3 visible (red, green and blue, RGB) camera, ZX3 near infrared camera and Zenmuse XT (ZXT) thermal infrared camera (Table 1). Prior to the UAV flied, a whiteboard was placed on each sampling plot for multispectral images calibration. During the automatic flight, all cameras were in a vertically downward position using a gimbal.
For each typical patch, SSM at top 40 cm soil was measured with an auto-measurement system (Decagon Inc., Pullman, WA, USA). The system consisted of an EM50 logger and five 5TM sensors installed at 0–5 cm, 5–10 cm, 10–20 cm, 20–30 cm and 30–40 cm soil layers, respectively. The data logged automatically every 30 min. At the corresponding soil layers, 75 bulk soil samples (three replicates) were taken in the five typical patches using volumetric rings (diameter: 7 cm, height: 5.2 cm, and volume: 200 cm3) to determine soil bulk density and field capacity.
Evapotranspiration was measured by micro-lysimeter [23]. The cylindrical shaped micro-lysimeter was made of 2 mm-thick metal. It was divided into inner barrel and outer barrel. The inner barrel of each micro-lysimeter, containing isolated volumes of soil and grass mounted flush with or slightly above the soil surface, was 36 cm in diameter with a depth of 40 cm. The micro-lysimeters were weighed twice a day (8:00 a.m. and 8:00 p.m.) to determine water loss using electronic balances with 0.001 kg precision.
In order to calibrate the land surface temperature (LST) extracted from thermal infrared images, 12~20 mercury thermometers were evenly placed in each plot to measure the real LST simultaneously with the UAV (Figure 2). The mercury thermometer could directly measure the instantaneous LST with a range of 0~100 Celsius degree (°C), and the precision was approximate 0.2 °C.
The meteorological tower recorded air temperature (Ta), relative humidity (RH) (HMP45C, Vaisala, Helsinki, Finland), horizontal wind speed and wind direction (020C-1, Met One Inc., Grants Pass, OR, USA) at four levels (2.0 m, 5.0 m, 7.5 m, and 10.0 m).

2.3. Unmanned Aerial Vehicle (UAV) Image Processing

Vegetation patches and bare patches were extracted from RGB images using the threshold method by the Pixel-based Manual Classifier software [25,30]. Although the high spatial resolution of UAV images ensured the capture of the smallest patches, it could also erroneously identify shadows between plants as bare patches. To avoid these errors caused by high resolution, patches with area 0.01 m2 or greater were considered, while the smaller isolate patches (<0.01 m2) were merged to the adjacent patch.
Binary images generated by Pixel-based Manual Classifier software were then analyzed by FRAGSTATS 4.2 to calculate various landscape indices. FRAGSTATS 4.2 could calculate dozens of landscape indices, however, many of them were highly correlated. Therefore, seven typical landscape indices at class level were used to quantitatively describe the spatial pattern of patchiness, including patch density (PD), the average area of patches (PA), the percent of total area (PTA), edge density (ED), shape index (Shape), contiguity index (Contig) and connect index (Connect).
Multispectral images were used to calculate the GNDVI (green normalized difference vegetation index), which was sensitive to the changes in chlorophyll content and vegetation growth [22,31]. The spectral reflectance of the whiteboard was set to 1, and the ratio of the digital number (DN) value of each band to the DN value of the whiteboard at the corresponding band was used as the spectral reflectance. Then the spectral reflectance of near infrared band and green band were used to calculate GNDVI. Where NIR and G are spectral reflectance of the near infrared band and green band, respectively.
GNDVI = NIR - G NIR + G
The land surface temperature (LST) matrix was extracted from thermal infrared images using FLIR Tools software (FLIR Systems Inc., Nashua, NH, USA.). Several meteorological and flight parameters were necessary to extract LST, including distance between camera and ground (40 m), emissivity of underlying surface (0.98) [32], Ta and RH at the height of 2.0 m above the ground. To ensure high accuracy, LST data measured by mercury thermometers were used to calibrate LST obtained from thermal infrared images (Figure A1). Finally, UAV images were registered and clipped with ArcGIS software (Environmental Systems Research Institute Inc., Redlands, CA, USA.) to obtain LST, GNDVI and patch type information at the same grid point.

2.4. Modeling of Surface Soil Moisture (SSM)

SSM was highly related to LST and vegetation index (e.g., normalized difference vegetation index, NDVI), and the physical relationship usually followed a triangular variant of trapezoidal space [33,34]. Therefore, SSM could be obtained from LST and vegetation indices by means of regression equations [35,36]. Remarkably, the difference between LST and Ta significantly affected evapotranspiration, and then altered SSM [22]. This effect was very pronounced on the QTP, and thus LST was replaced by the difference between LST and Ta in this study; 70% of the in situ measured SSM data were used for modeling and the rest 30% were used for accuracy validation.
SSM = i = 0 n j = 0 n a i j ( T s - T a ) i GNDVI j
where aij, Ts are the regression coefficients and LST, and n is usually set to 2.

2.5. Statistical Analysis

The polynomial equation was solved through regression method to obtain the coefficients. The coefficient of determination (R2) and the root-mean-squared error (RMSE) were used to evaluate the performance of the proposed SSM estimation model. In situ measured SSM and evapotranspiration of the five typical patches were investigated by a one-way analysis of variance (ANOVA). All statistical analyses were completed in SPSS 17.0 (SPSS Inc., Chicago, IL, USA.) and the plotting was performed using Origin software (OriginLab Inc., Northampton, MA, USA).

3. Results

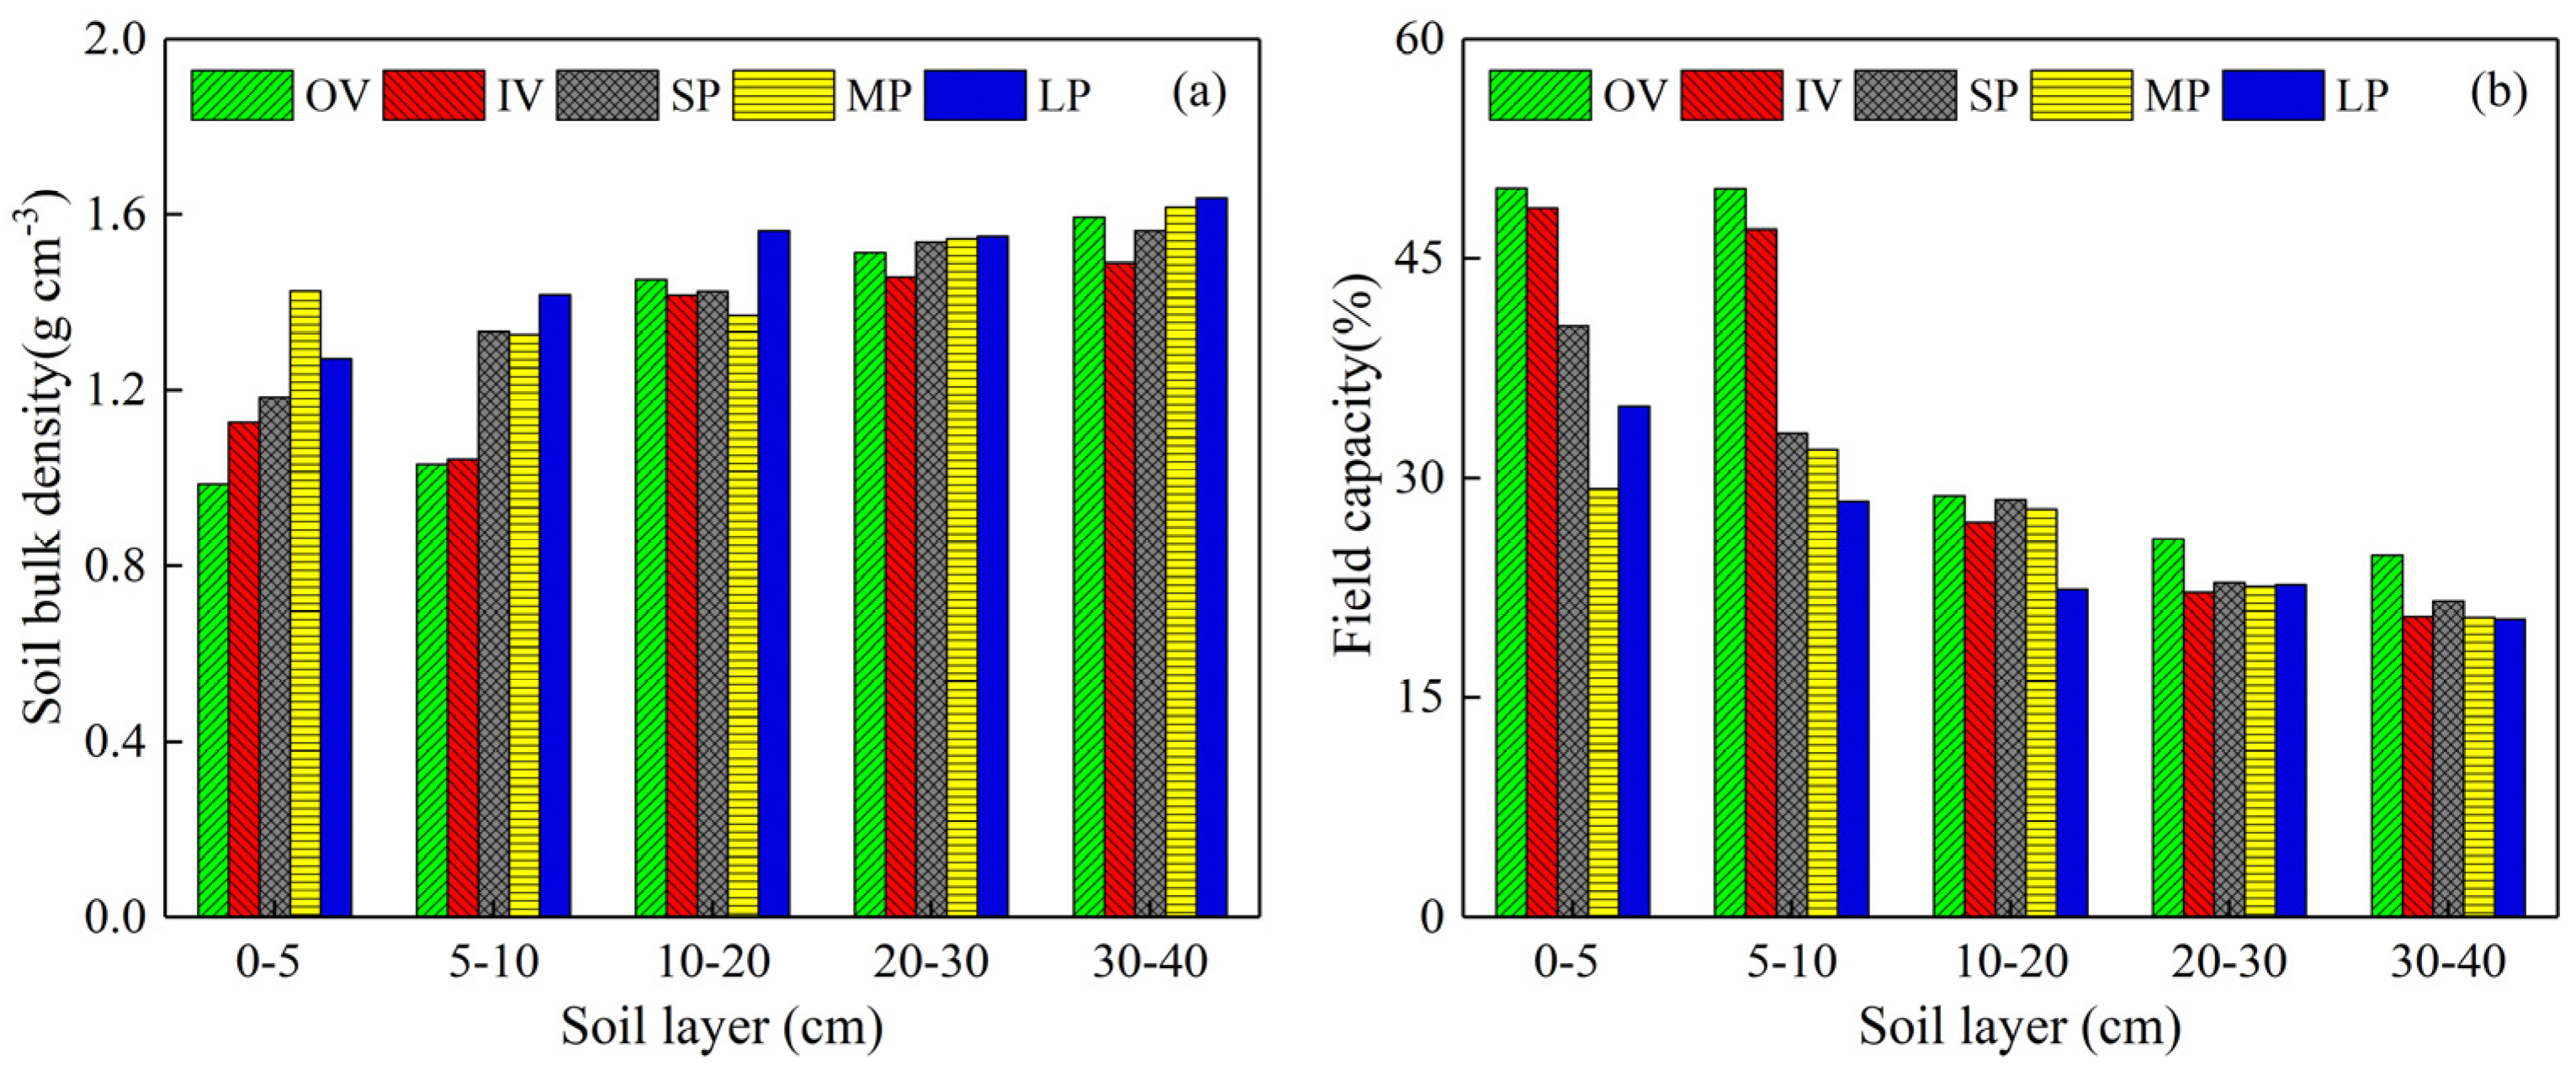
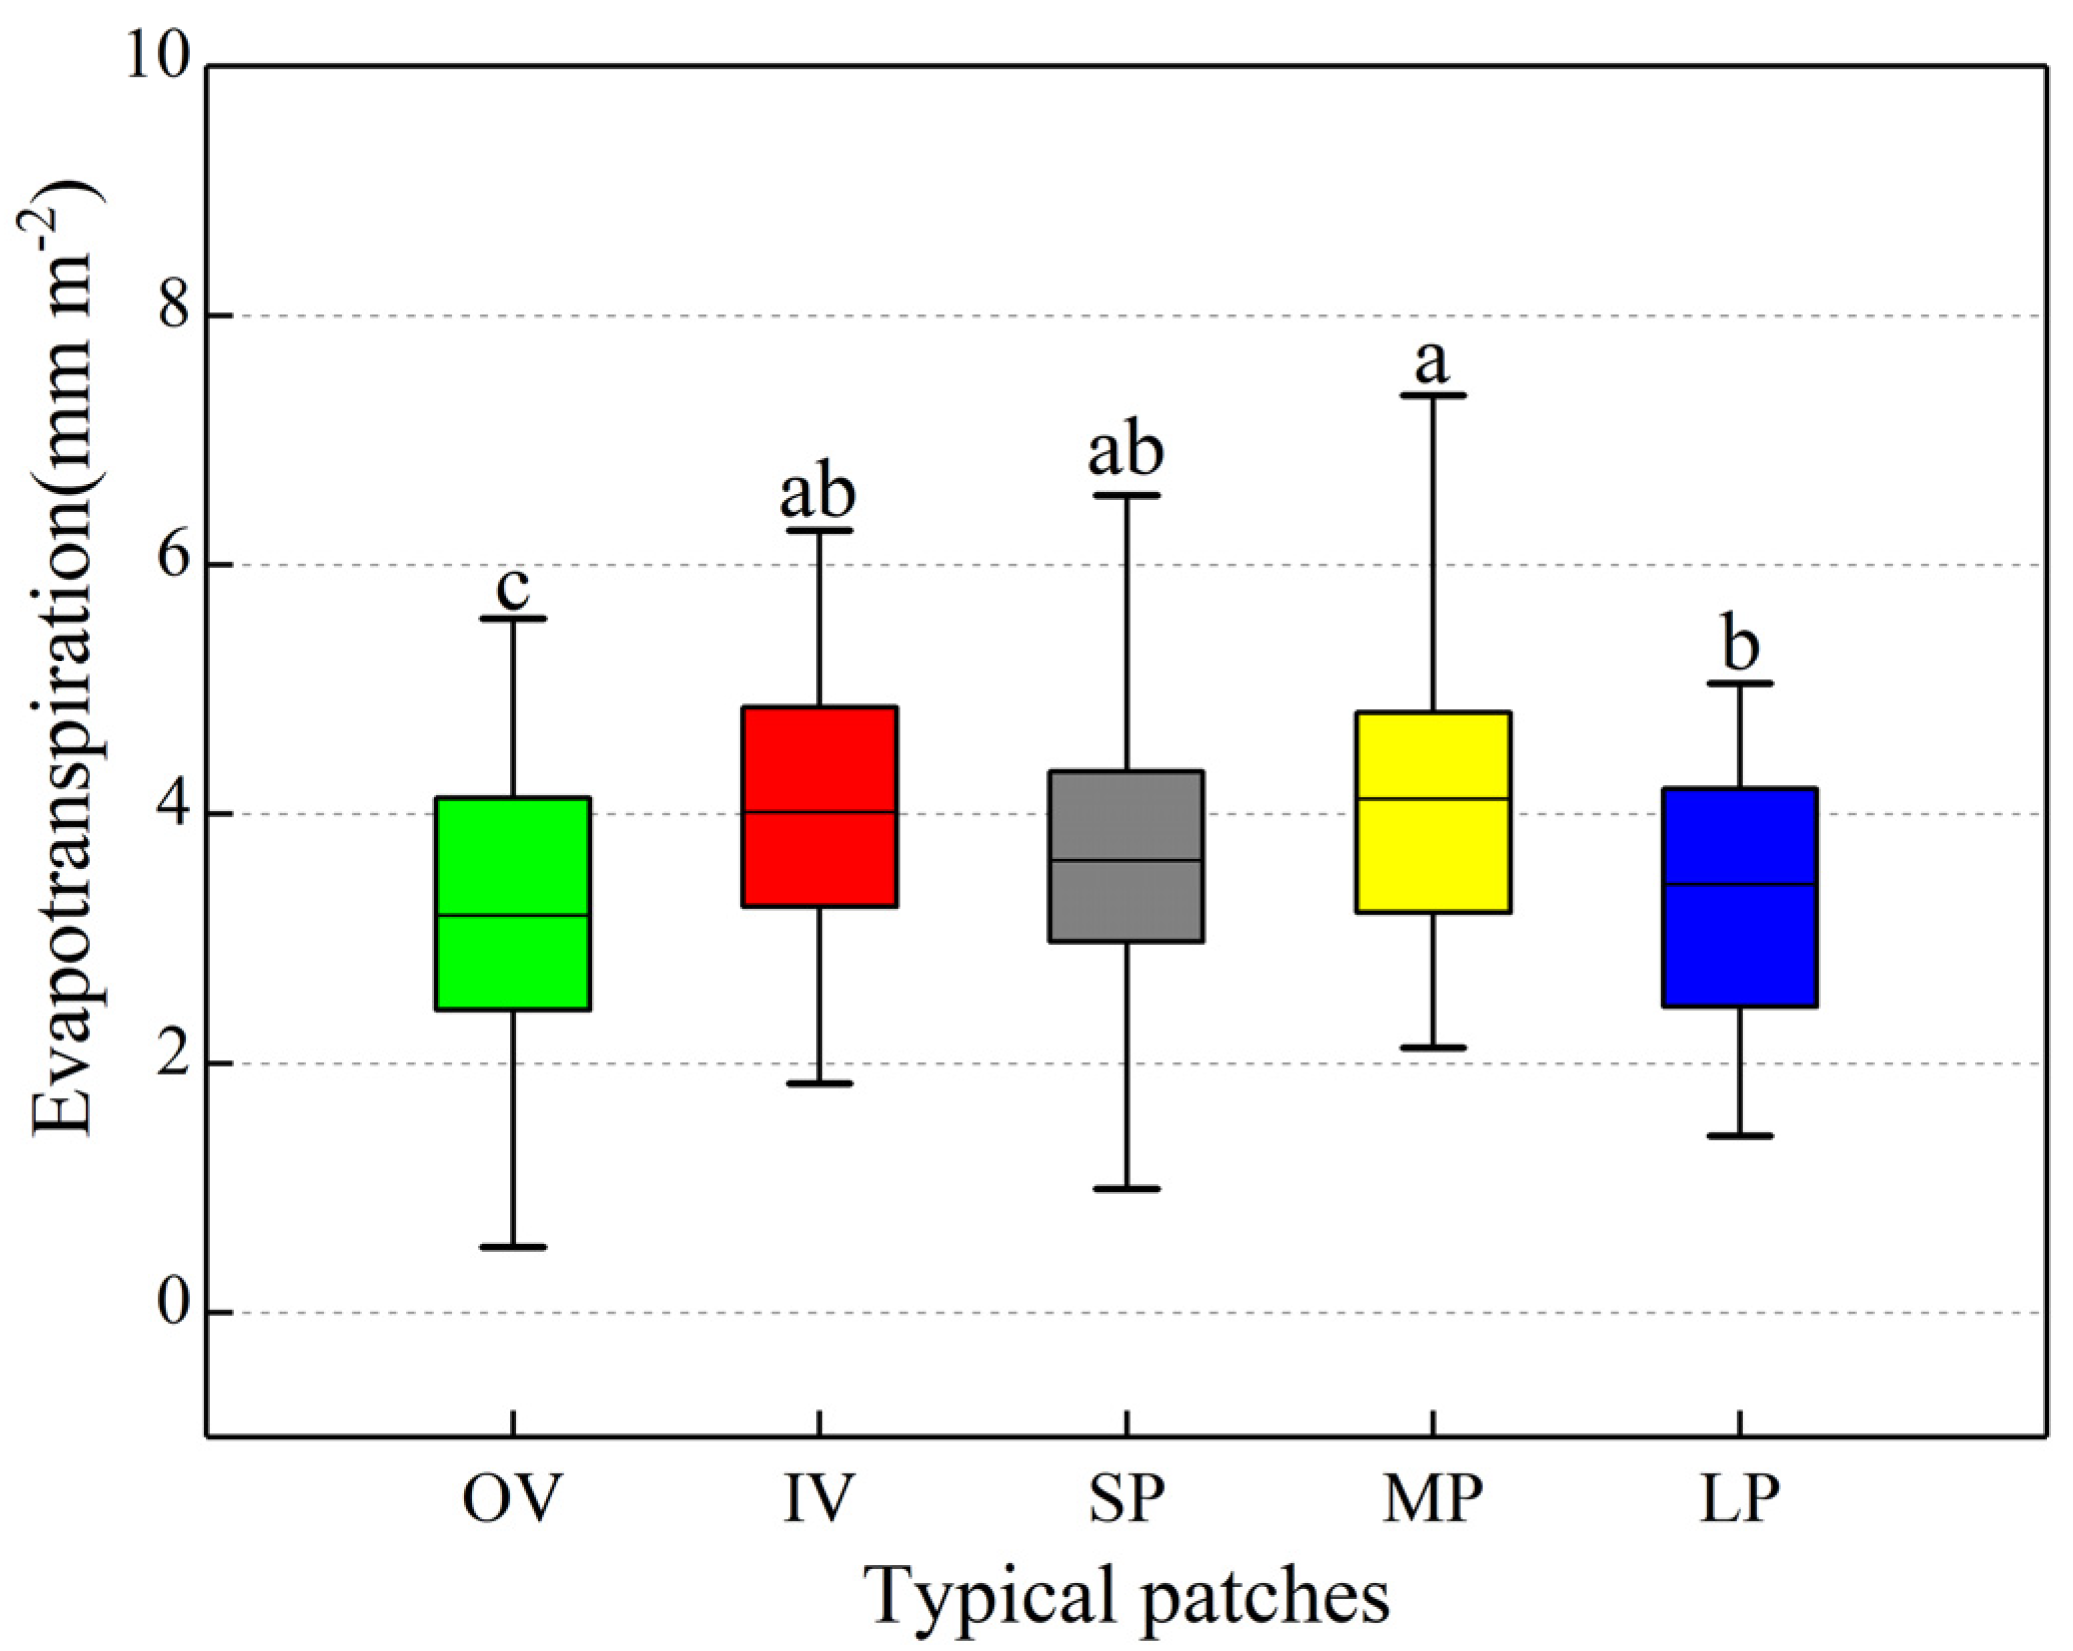
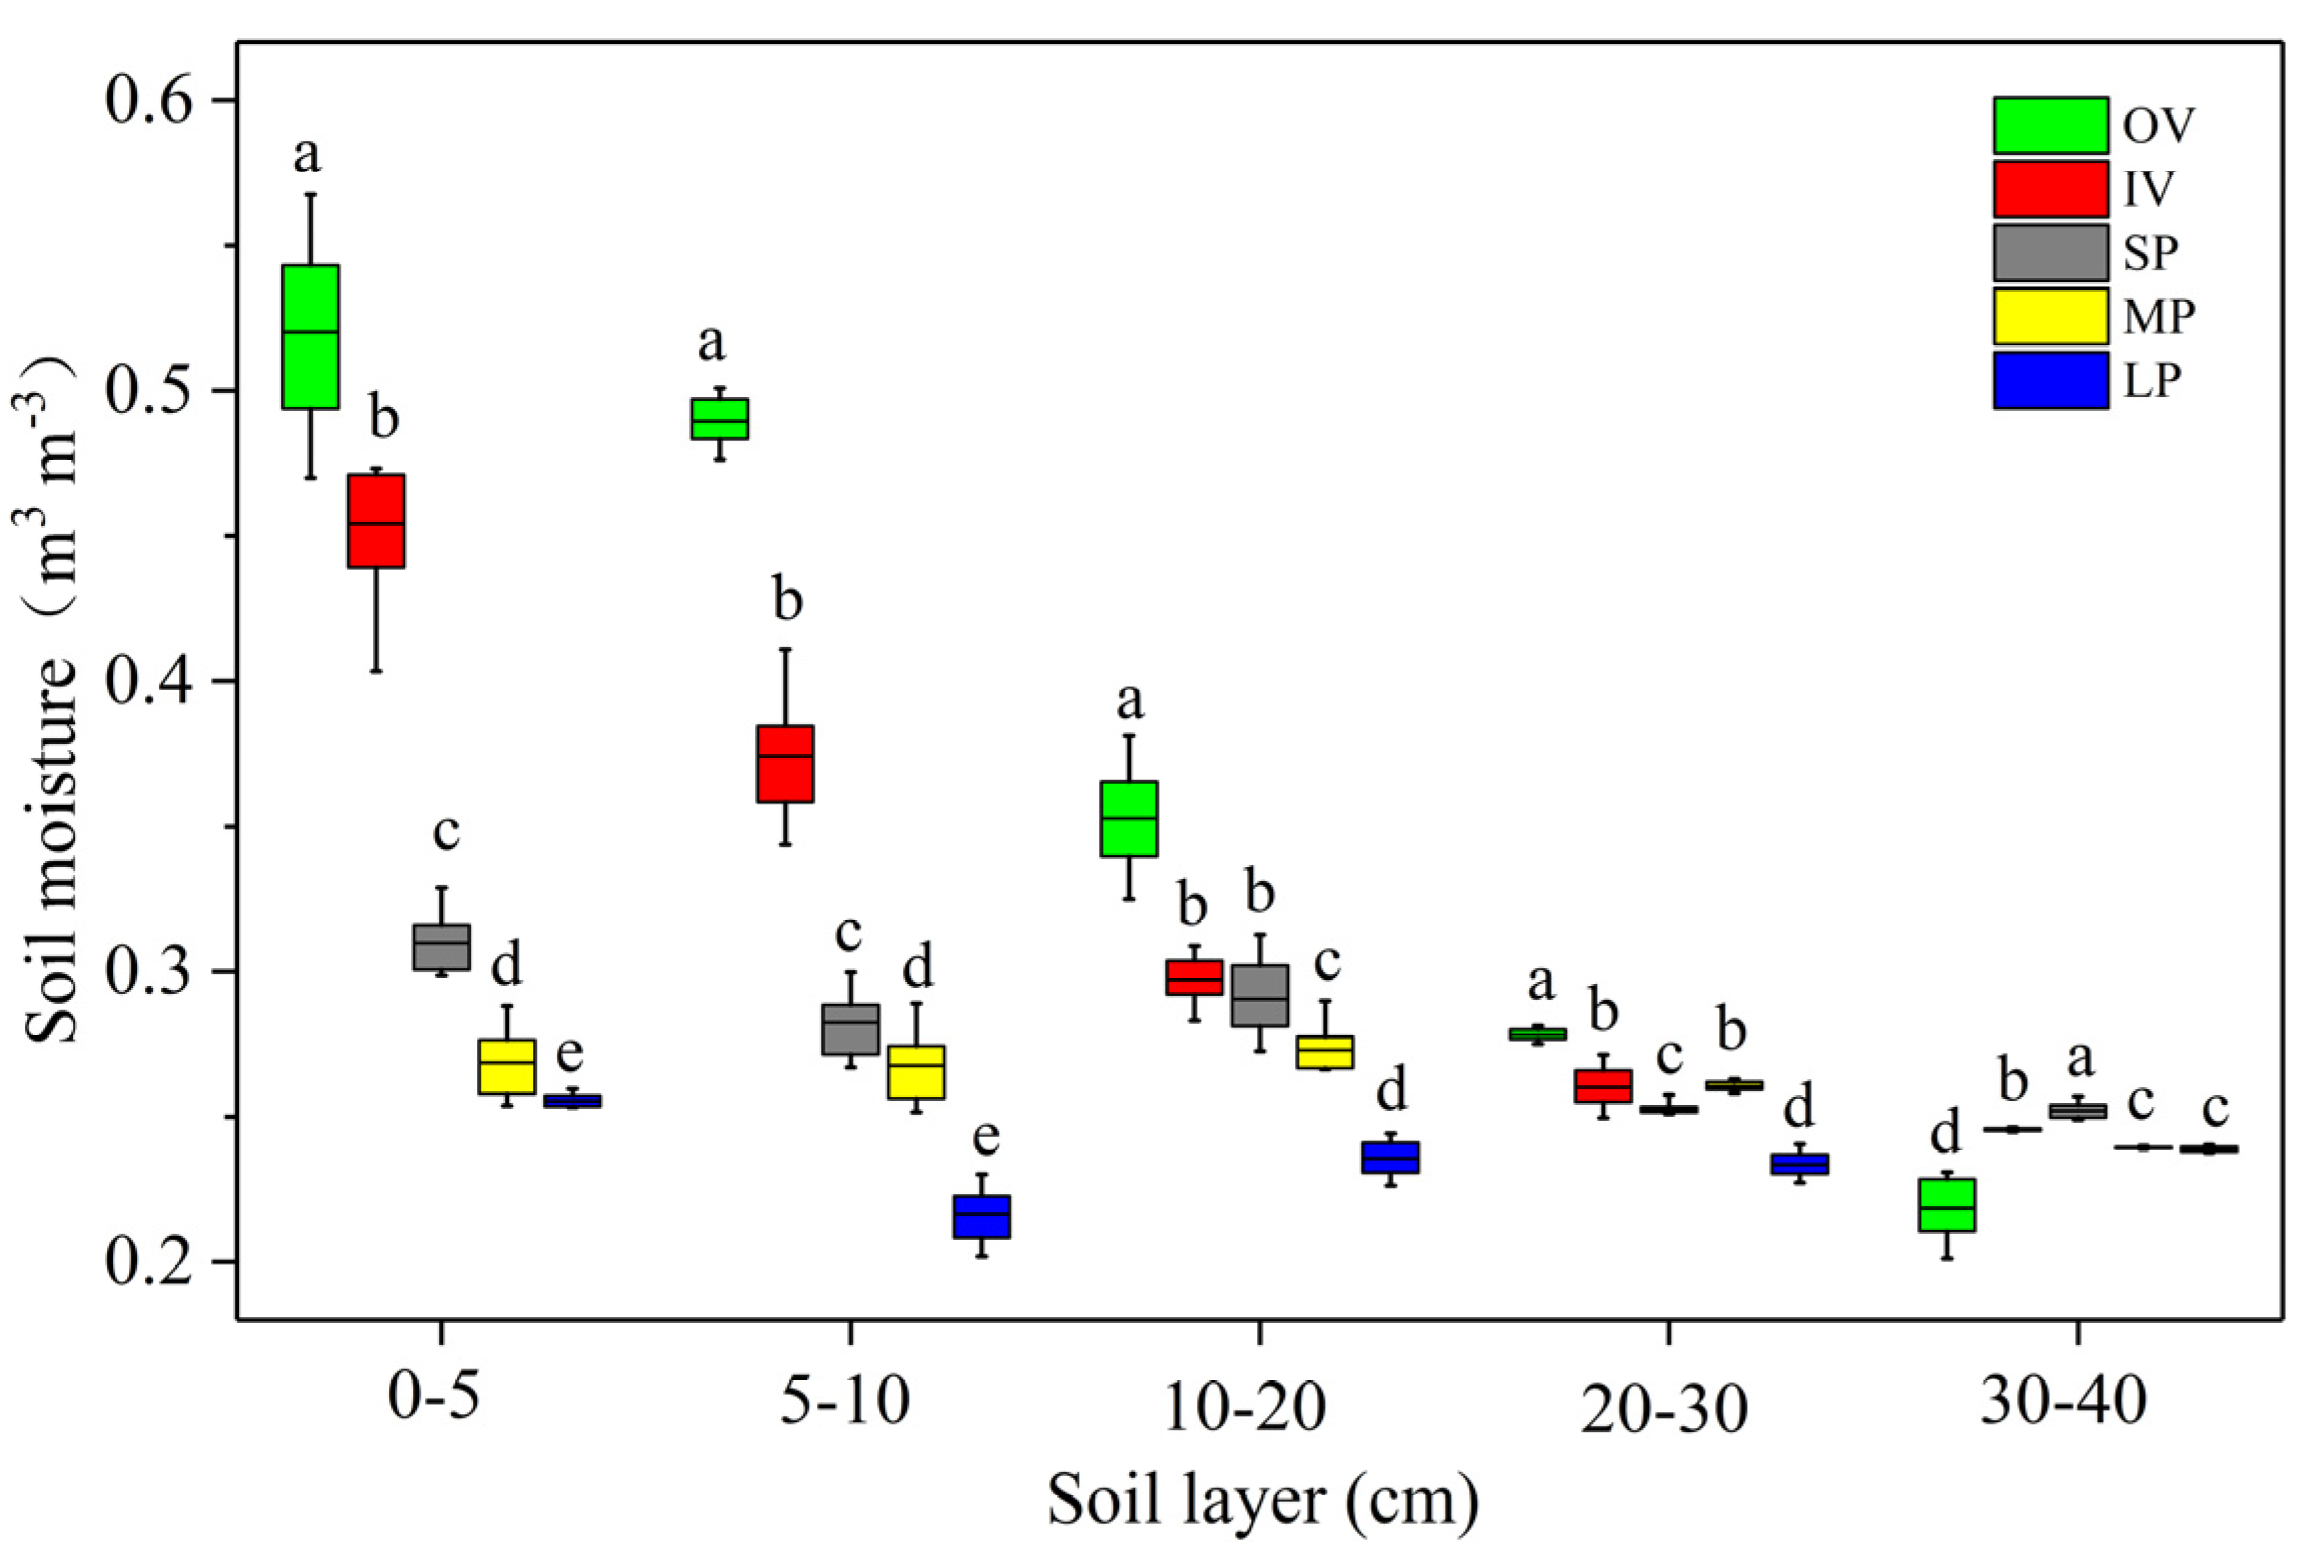
3.1. In Situ Measured Soil Properties, Evapotranspiration and SSM at Patch Scale

Patchiness significantly changed soil properties in the alpine meadow area, and the differences were mainly observed at upper soil layer with root distribution (0–20 cm). Soil bulk density was 1.14 g cm−3 in OV, approximately 1.21 g cm−3 in IV, and greater than 1.31 g cm−3 in bare patches at 0–20 cm soil layer (Figure 3a). By contrast, field capacity was the highest in OV (42.79%), about 1.98%, 8.82%, 13.08% and 14.21% higher than IV, SP, MP and LP, respectively (Figure 3b). Evapotranspiration also exhibited considerable variations among the five typical patches. The mean evapotranspiration ranged from 3.19 mm m−2 to 4.12 mm m−2 and the highest value was observed in MP, followed by IV, SP, LP and OV (Figure 4).
In situ measured SSM showed significant differences among the five typical patches, vegetation patches had higher SSM than those of bare patches, and OV had higher SSM than IV at the 0–30 cm soil layer (Figure 5). SSM in bare patches with different sizes also had remarkable discrepancy, except for 20–30 cm soil layer, the maximum mean value appeared in SP, followed by MP and LP (Figure 5). It was noteworthy that the differences in SSM depended on soil depth. At 0–30 cm soil layer, the differences of SSM weakened with the increase of soil depth, when the soil depth exceeded 30 cm, SSM of the five typical patches tended to be consistent.

3.2. Patches Pattern and SSM at Plot Scale

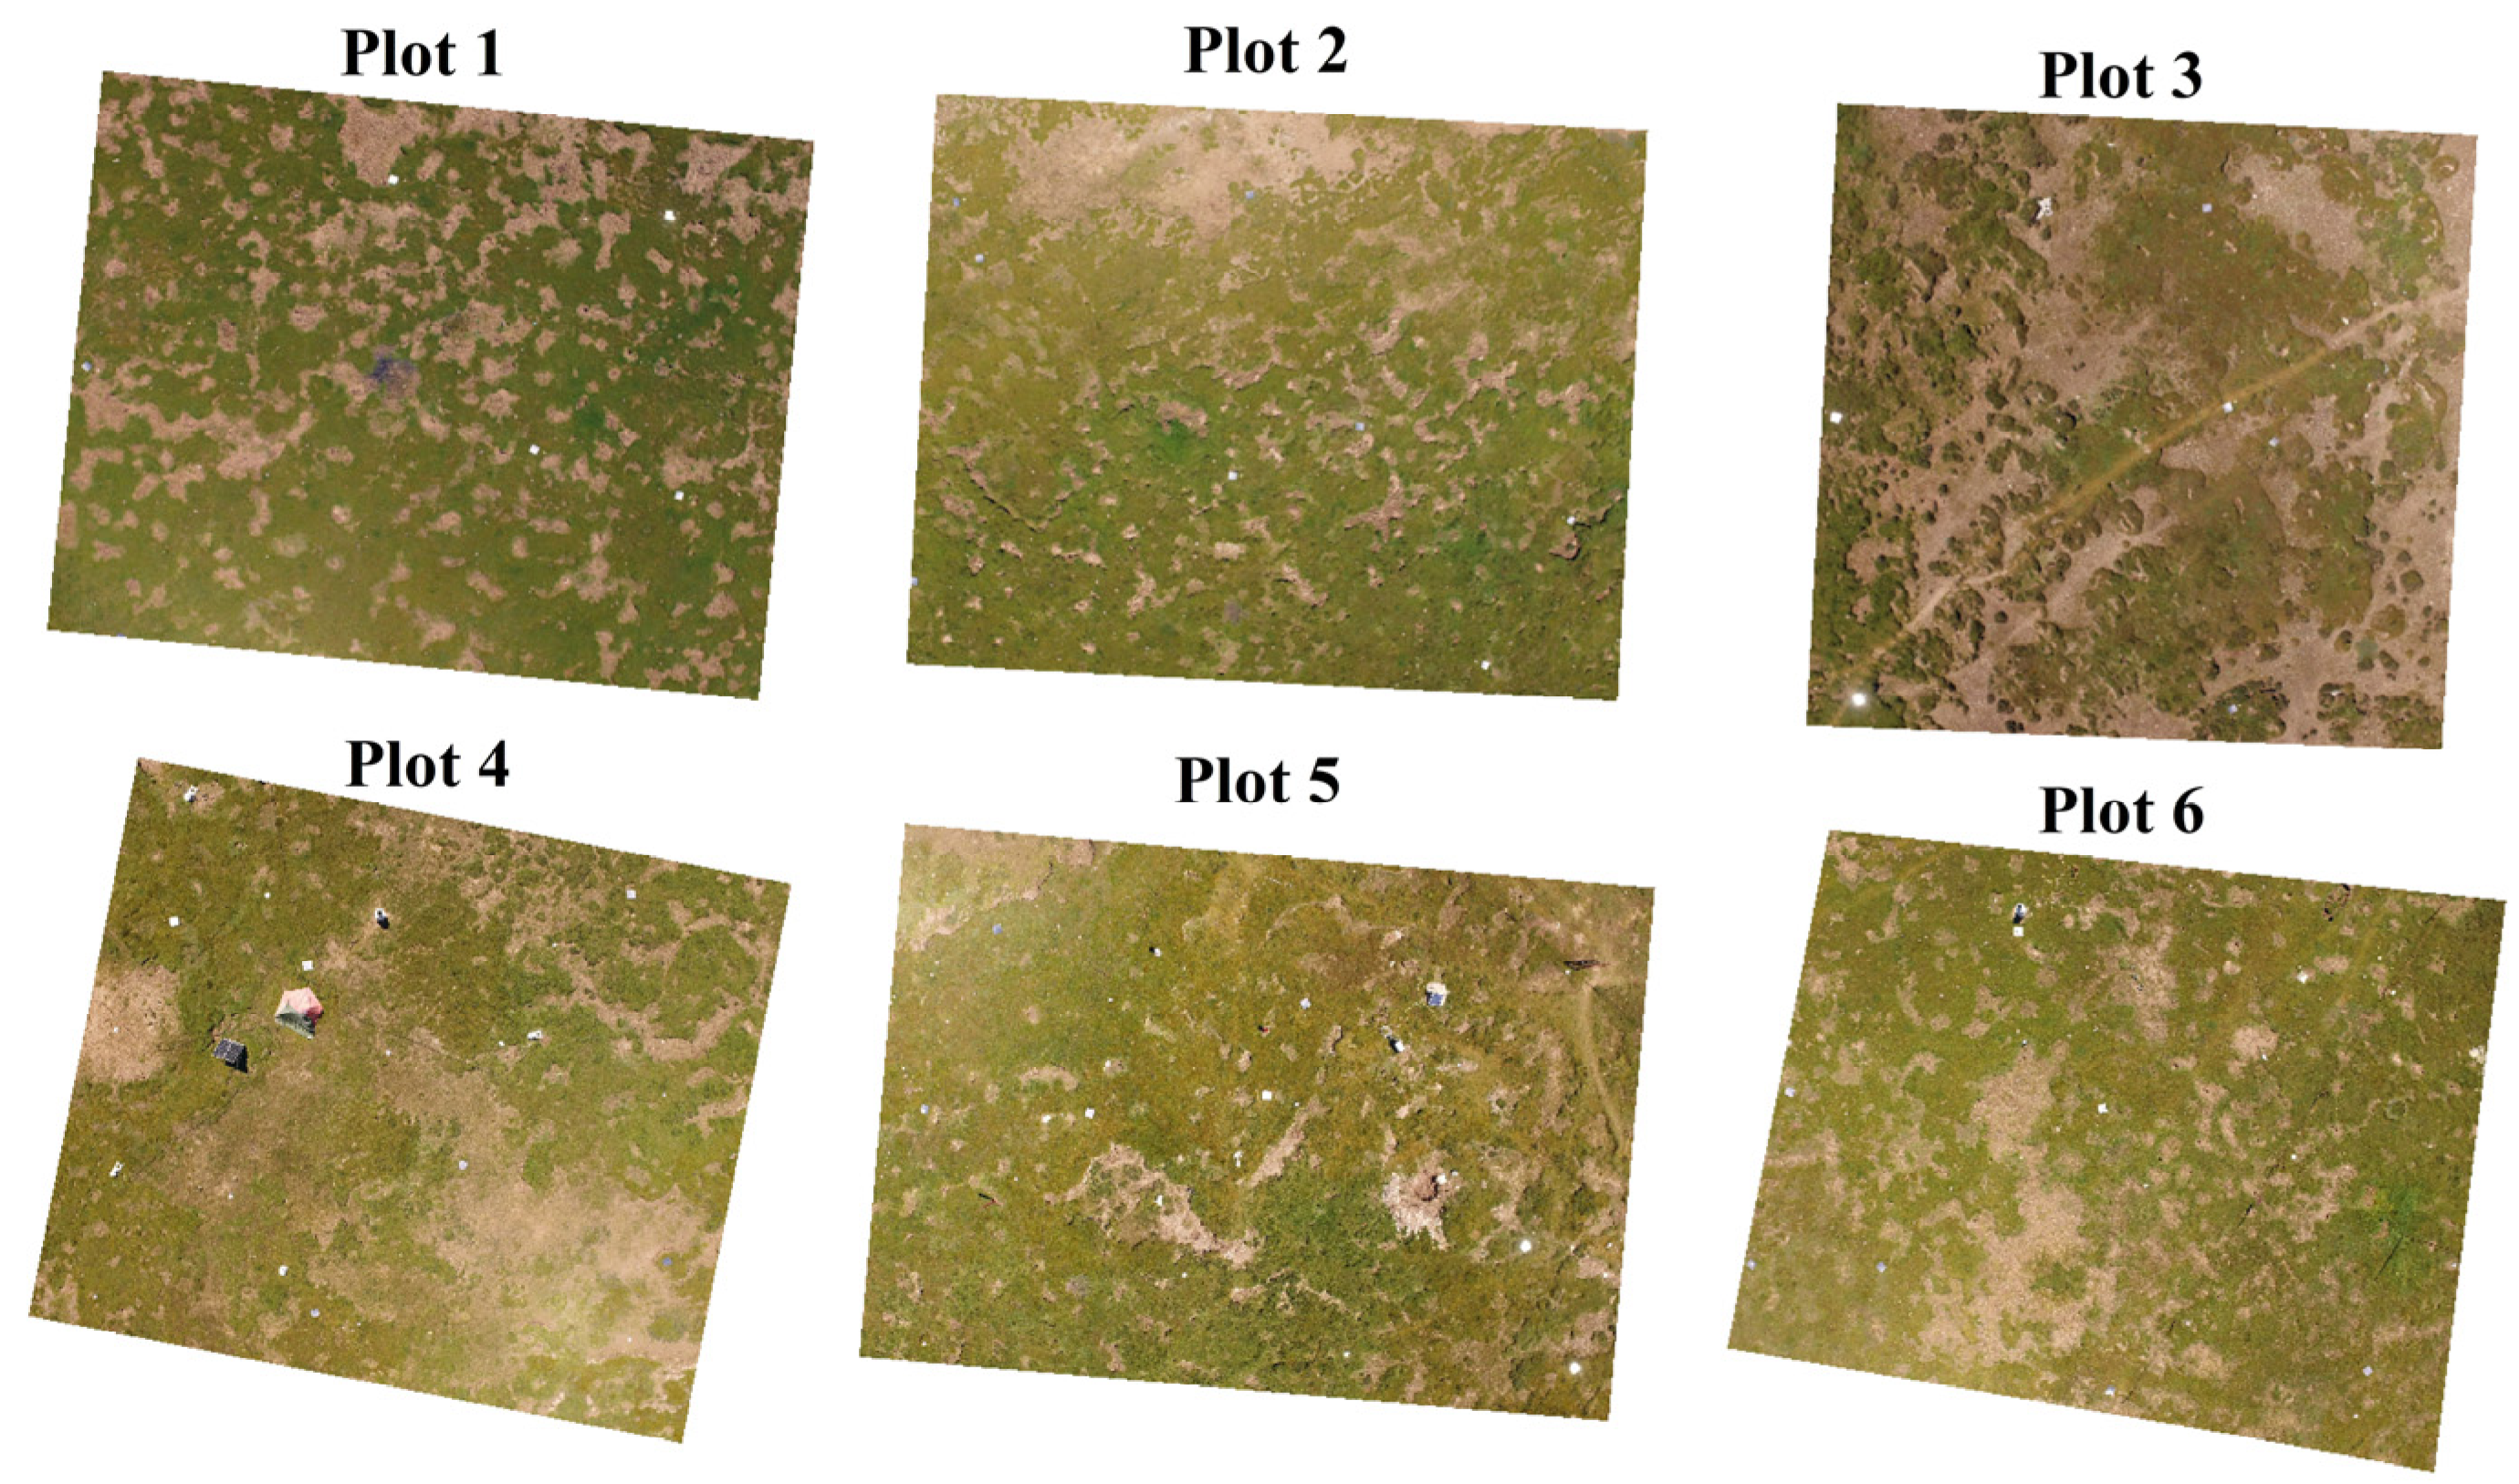
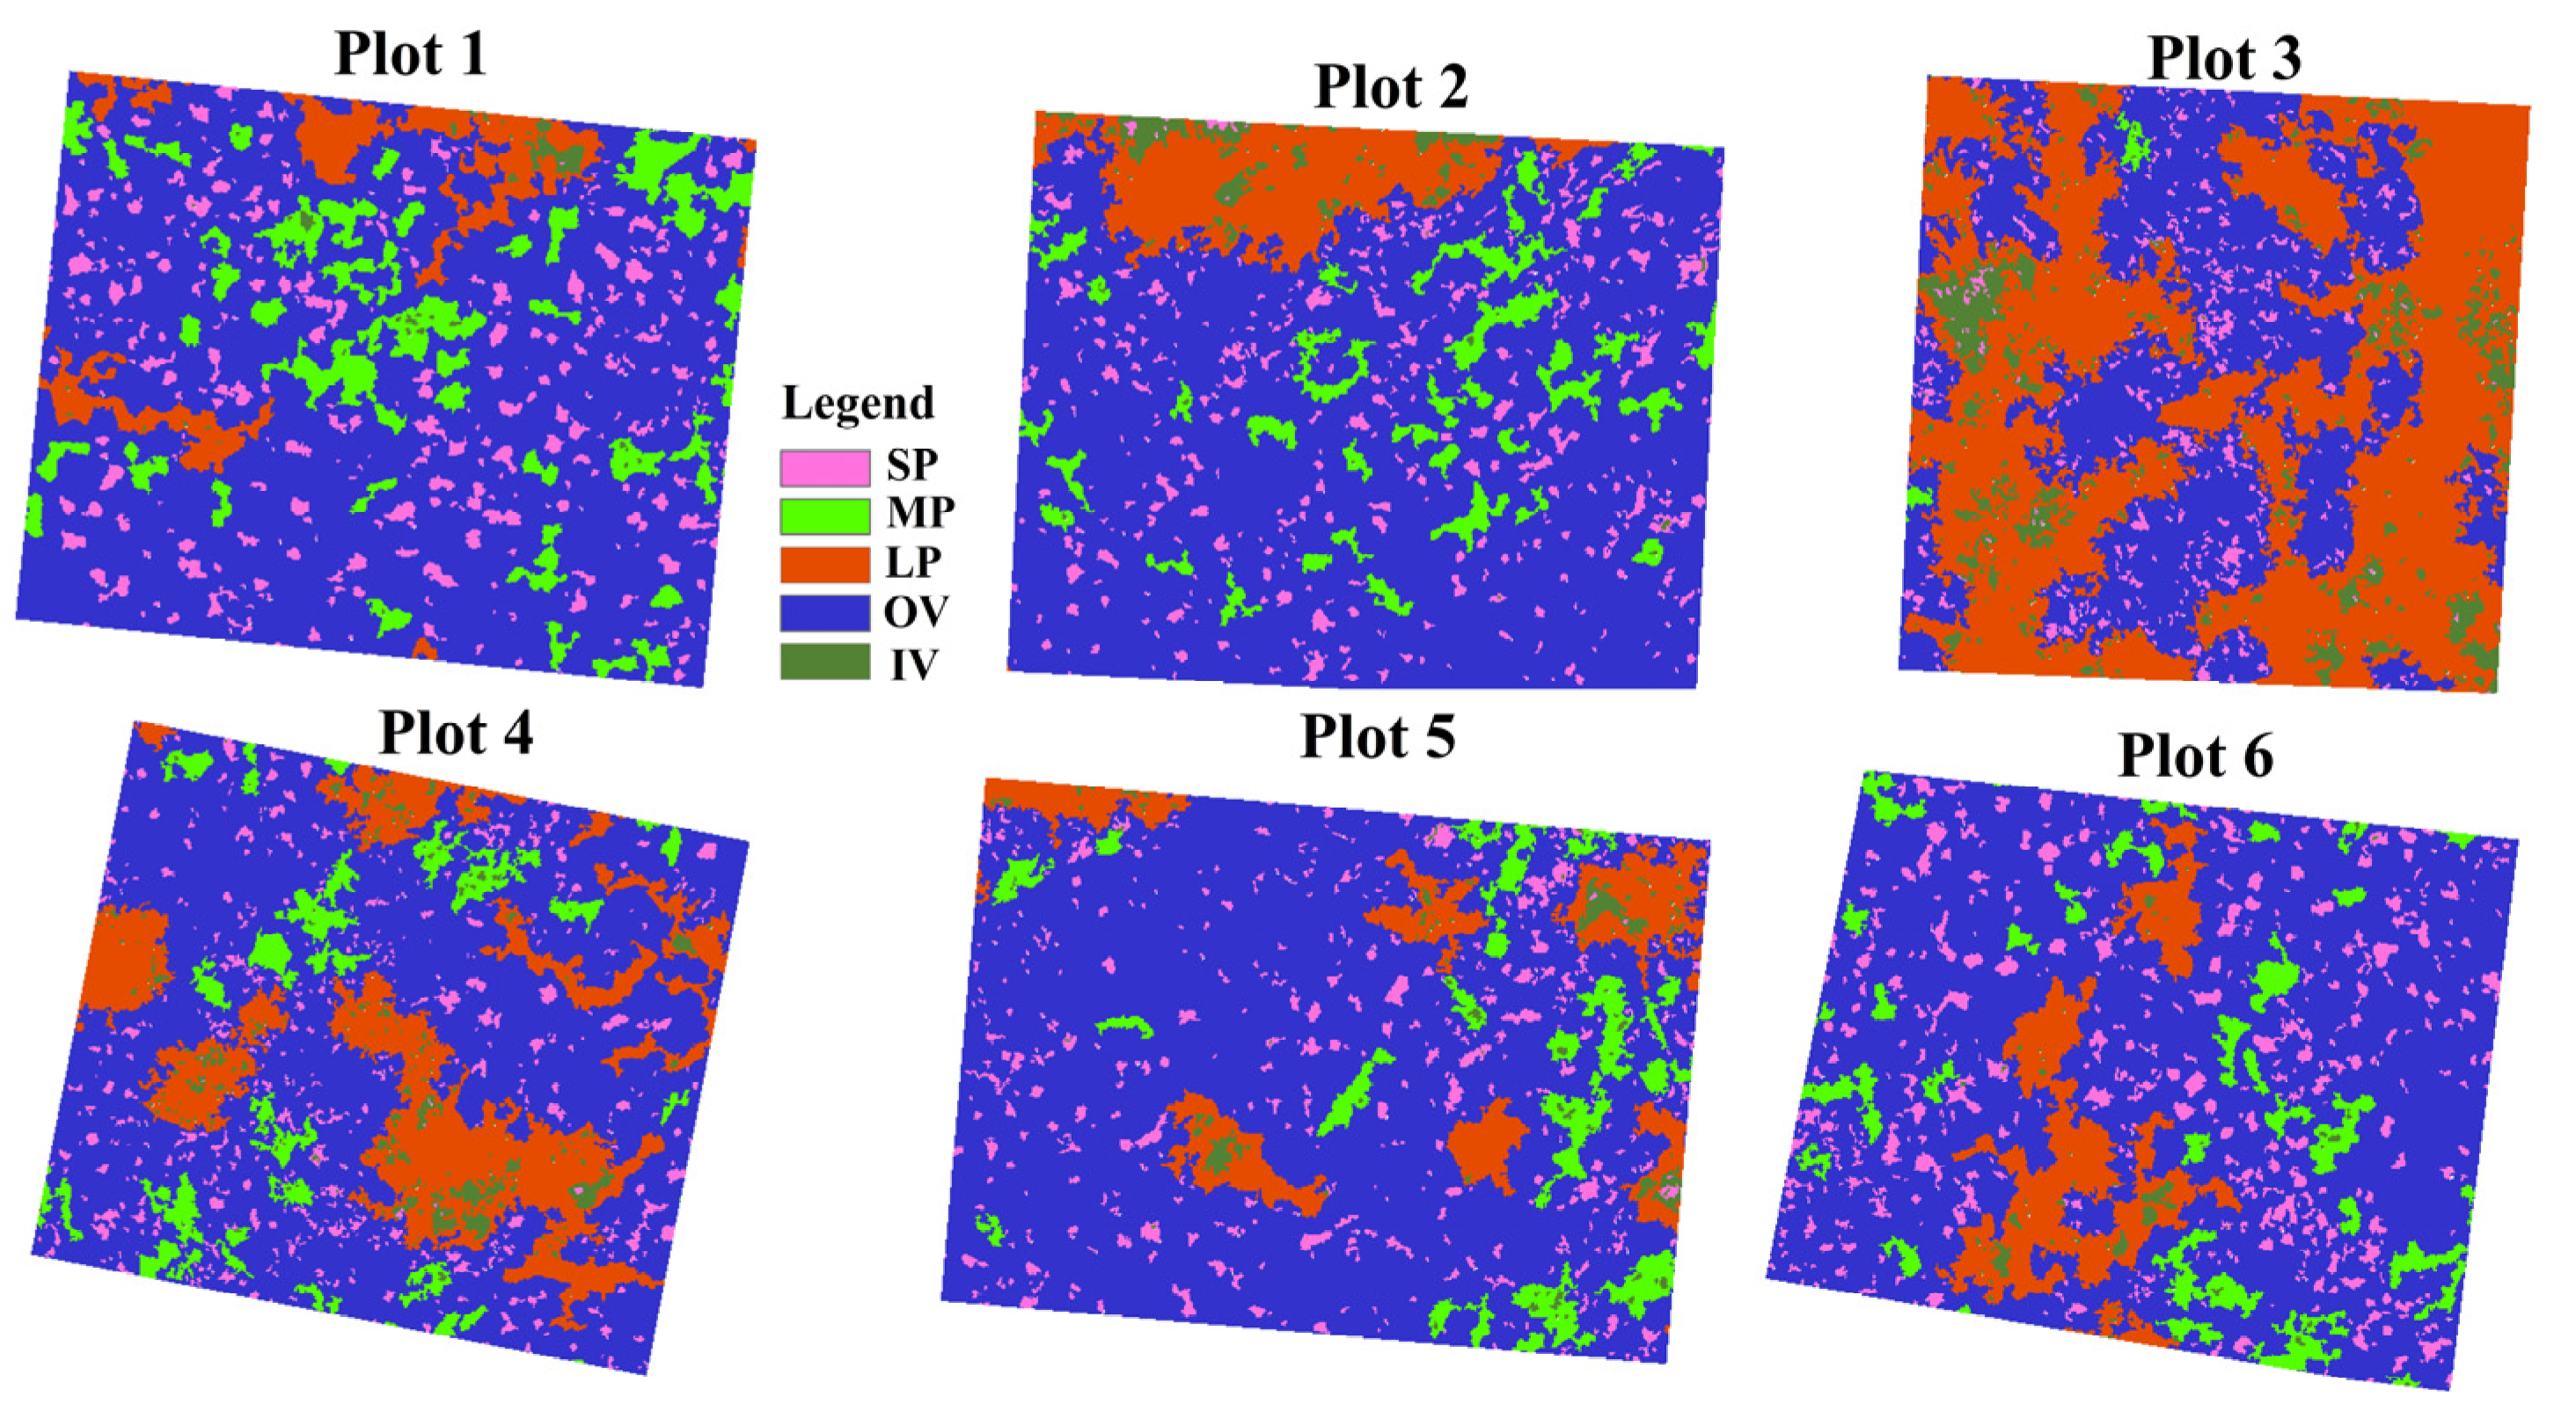
3.2.1. Patches Pattern

Patchiness was presented as two distinct spatial patterns in our sampling plots (Figure 6). One was the mosaic of densely bare patches interspersed within a large intact vegetation patch, and the other was the mosaic of several isolated vegetation patches interspersed in the bare soil background (plot 3 in Figure 6). The classification images of the five typical patches showed that, with the exception of plot 3, OV had the largest patch area, the most complex geometric shape and the highest connectivity (Figure 7). Compared with OV, IV displayed as a more fragmented spatial pattern with smaller patch area, simpler patch shape, poorer continuity and higher patch density. SP had the smallest patch size and the highest patch density and only occupied 5% of the total landscape area. MP and LP had the analogous distribution with IV and OV respectively, but LP had smaller landscape indices.

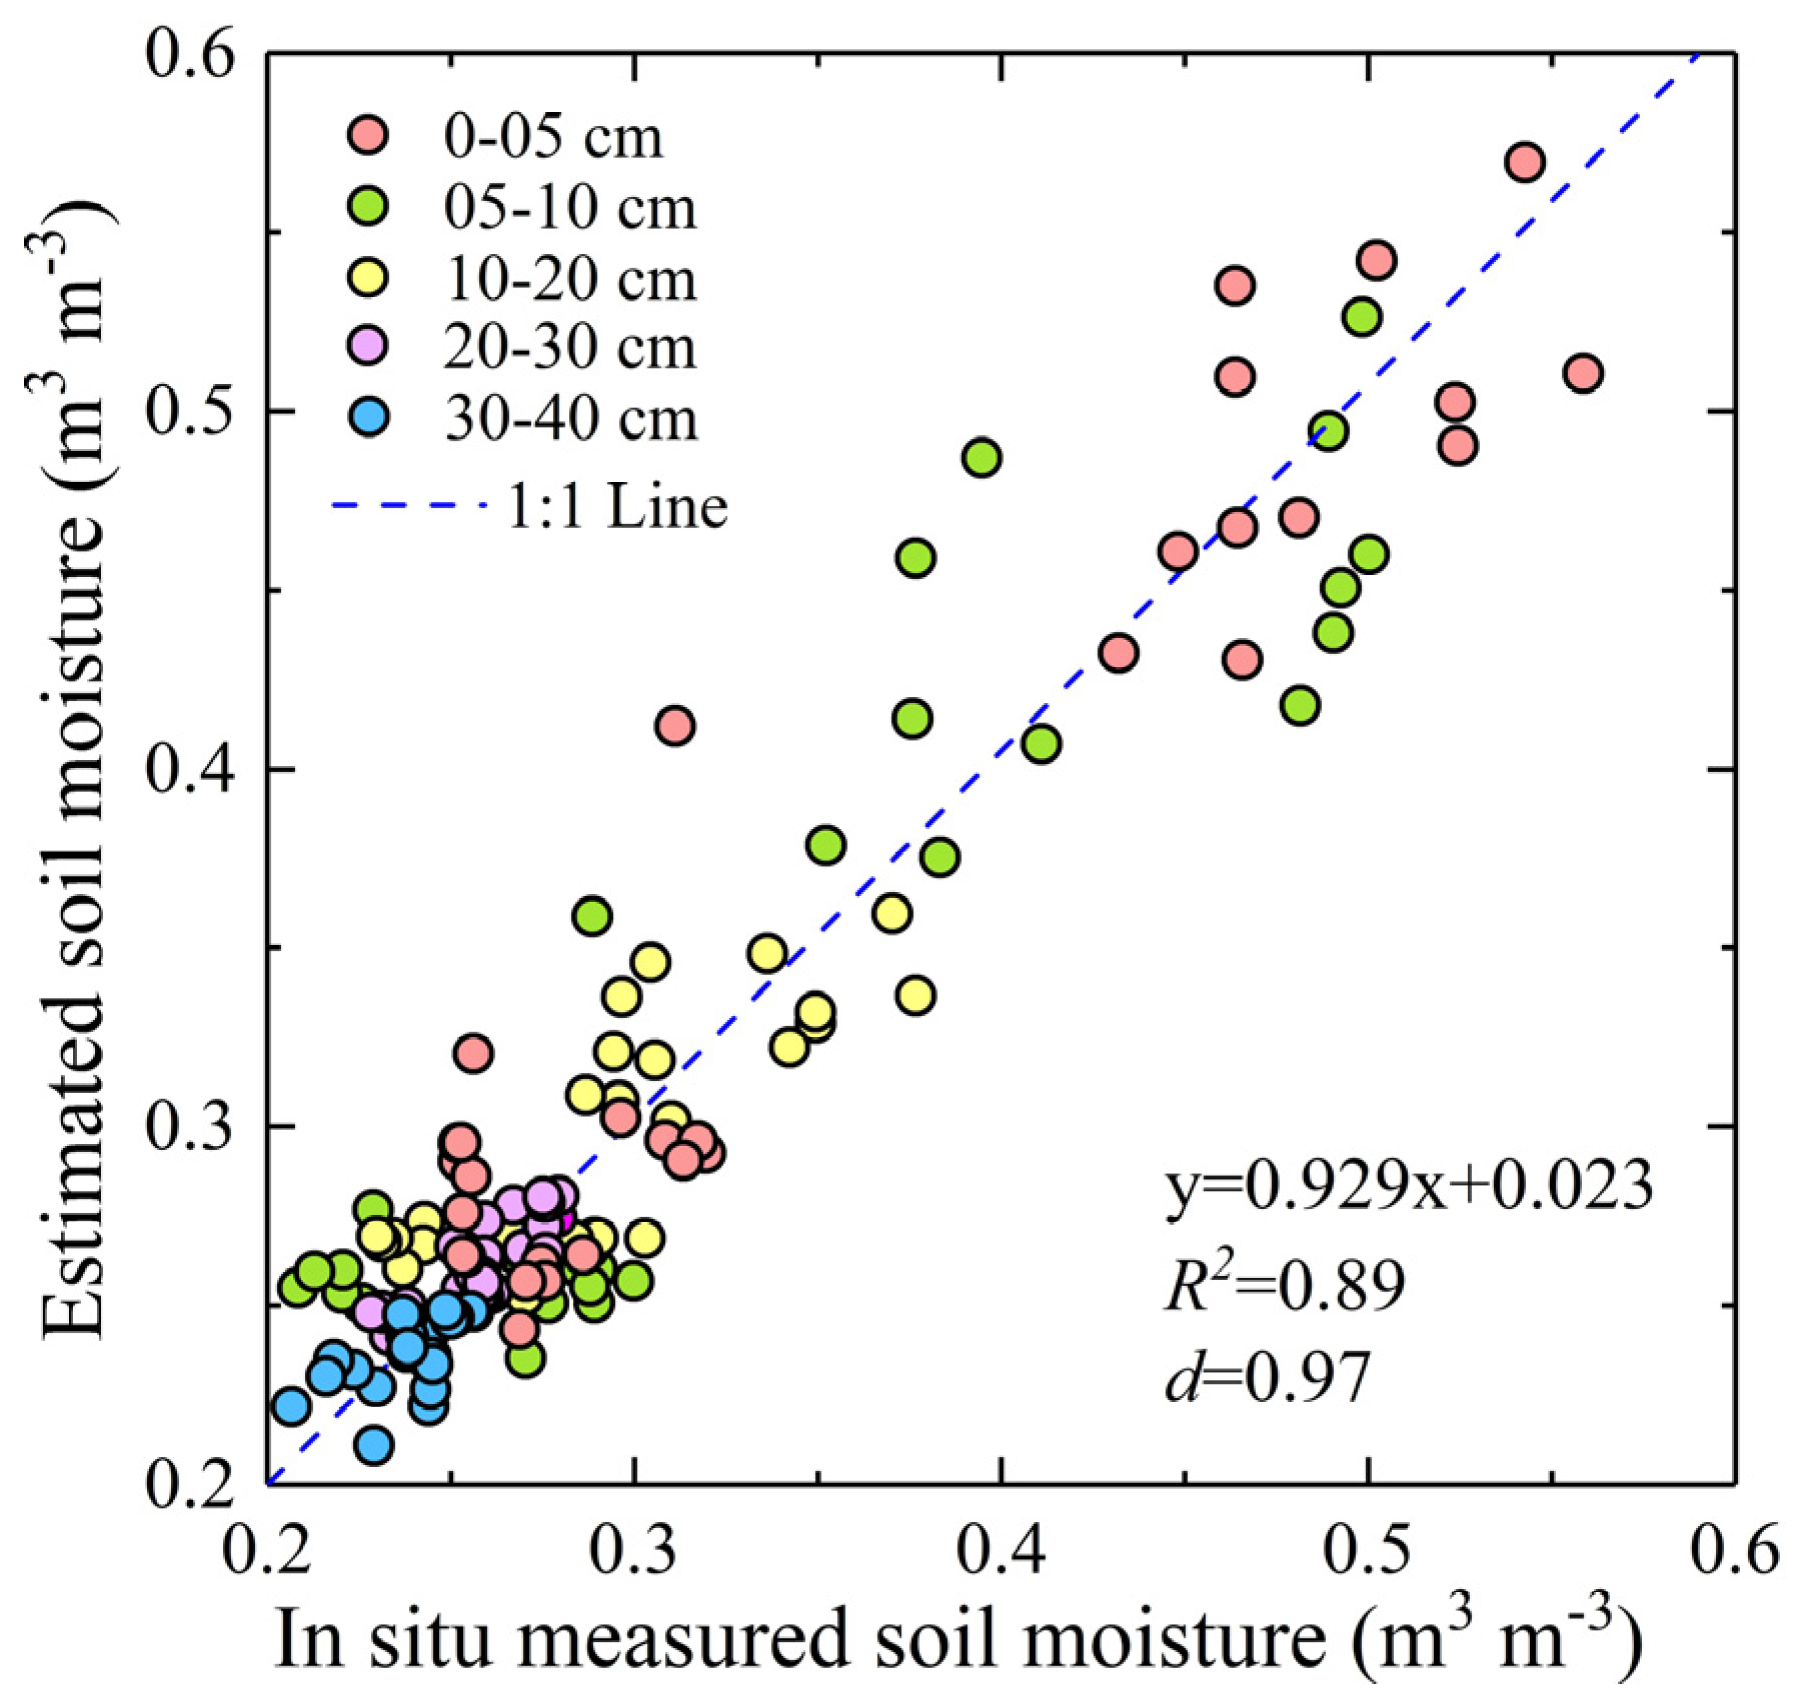
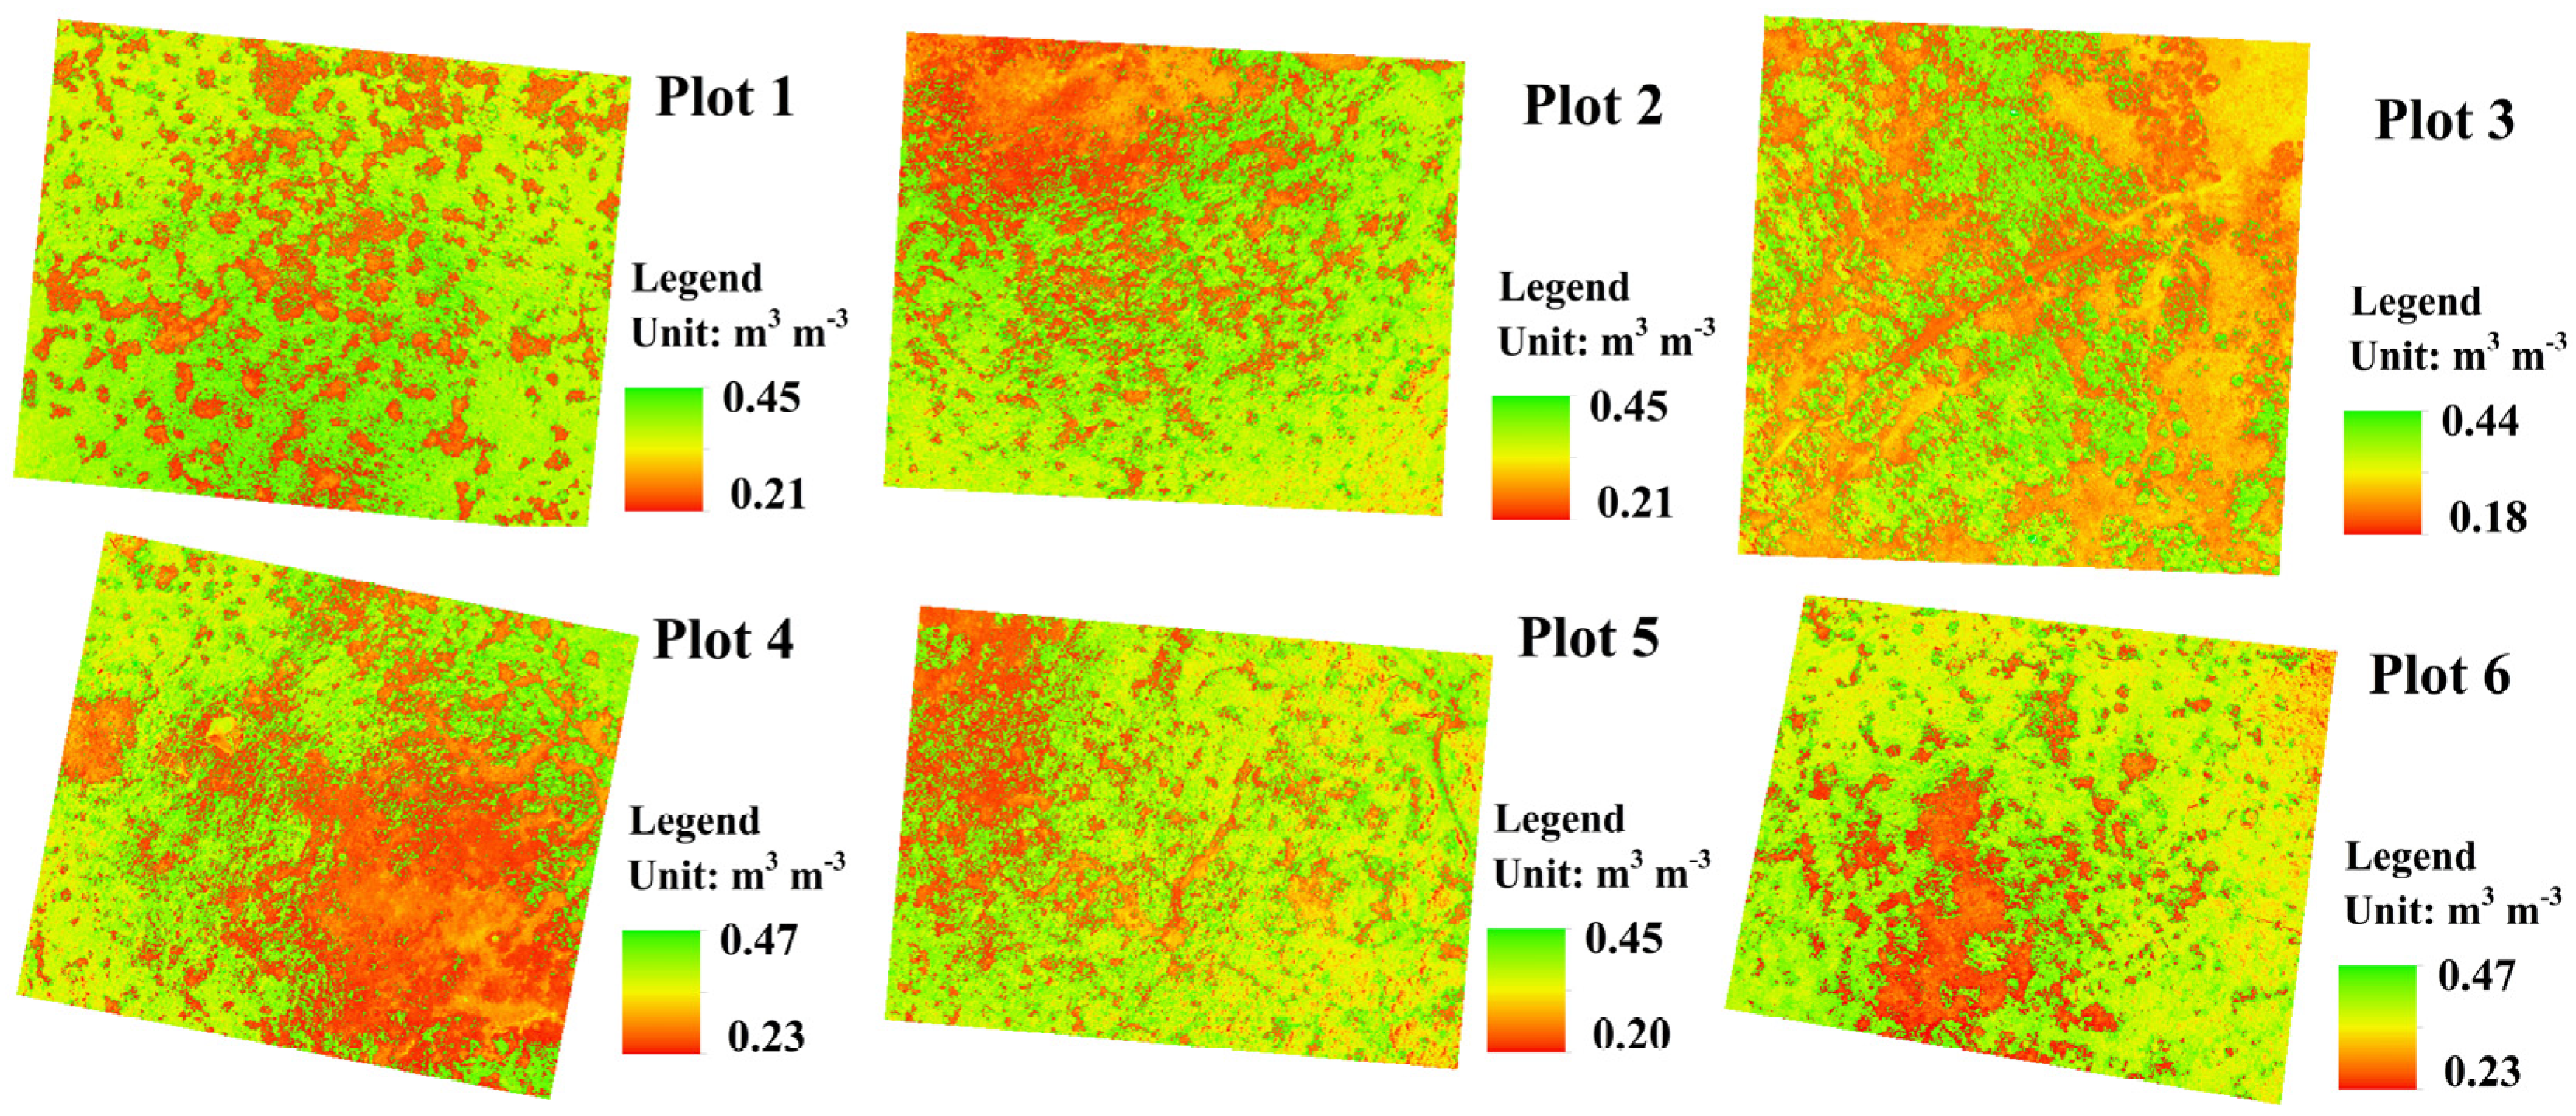
3.2.2. SSM Estimated by UAV

To test the feasibility of estimating SSM based on UAV, correlation analysis between the in situ measured SSM and UAV estimated SSM was first conducted. Results demonstrated that the model performance at surface soil layer was satisfactory and most points were distributed around the 1:1 line (Figure 8). Remarkably, the model performance depended on soil depth. At the 0–5 cm soil layer, it achieved the highest estimation accuracy, the coefficient of determination (R2) and root mean squared error (RMSE) were about 0.89 and 0.036 m3 m−3 and the probability value (P) was less than 0.001. With the increase of soil depth, the model performance showed a significant downward trend (Table 2).
Considering that the effects of patchiness on SSM were concentrated in the 0–30 cm soil layer (Figure 5), and the UAV-based SSM estimated model also had considerable inversion accuracy in this soil layer, SSM estimated by the UAV in the 0–30 cm soil layer was, therefore, used for plot scale analysis. The spatial distribution of SSM was consistent with the spatial pattern of patchiness (Figure 7 and Figure 9). SSM in the vegetation patches was significantly higher than that in the bare patches. The existence of OV was conducive to maintain high SSM while the spatial distribution of LP led to significant reduction of SSM (Figure 7 and Figure 9).

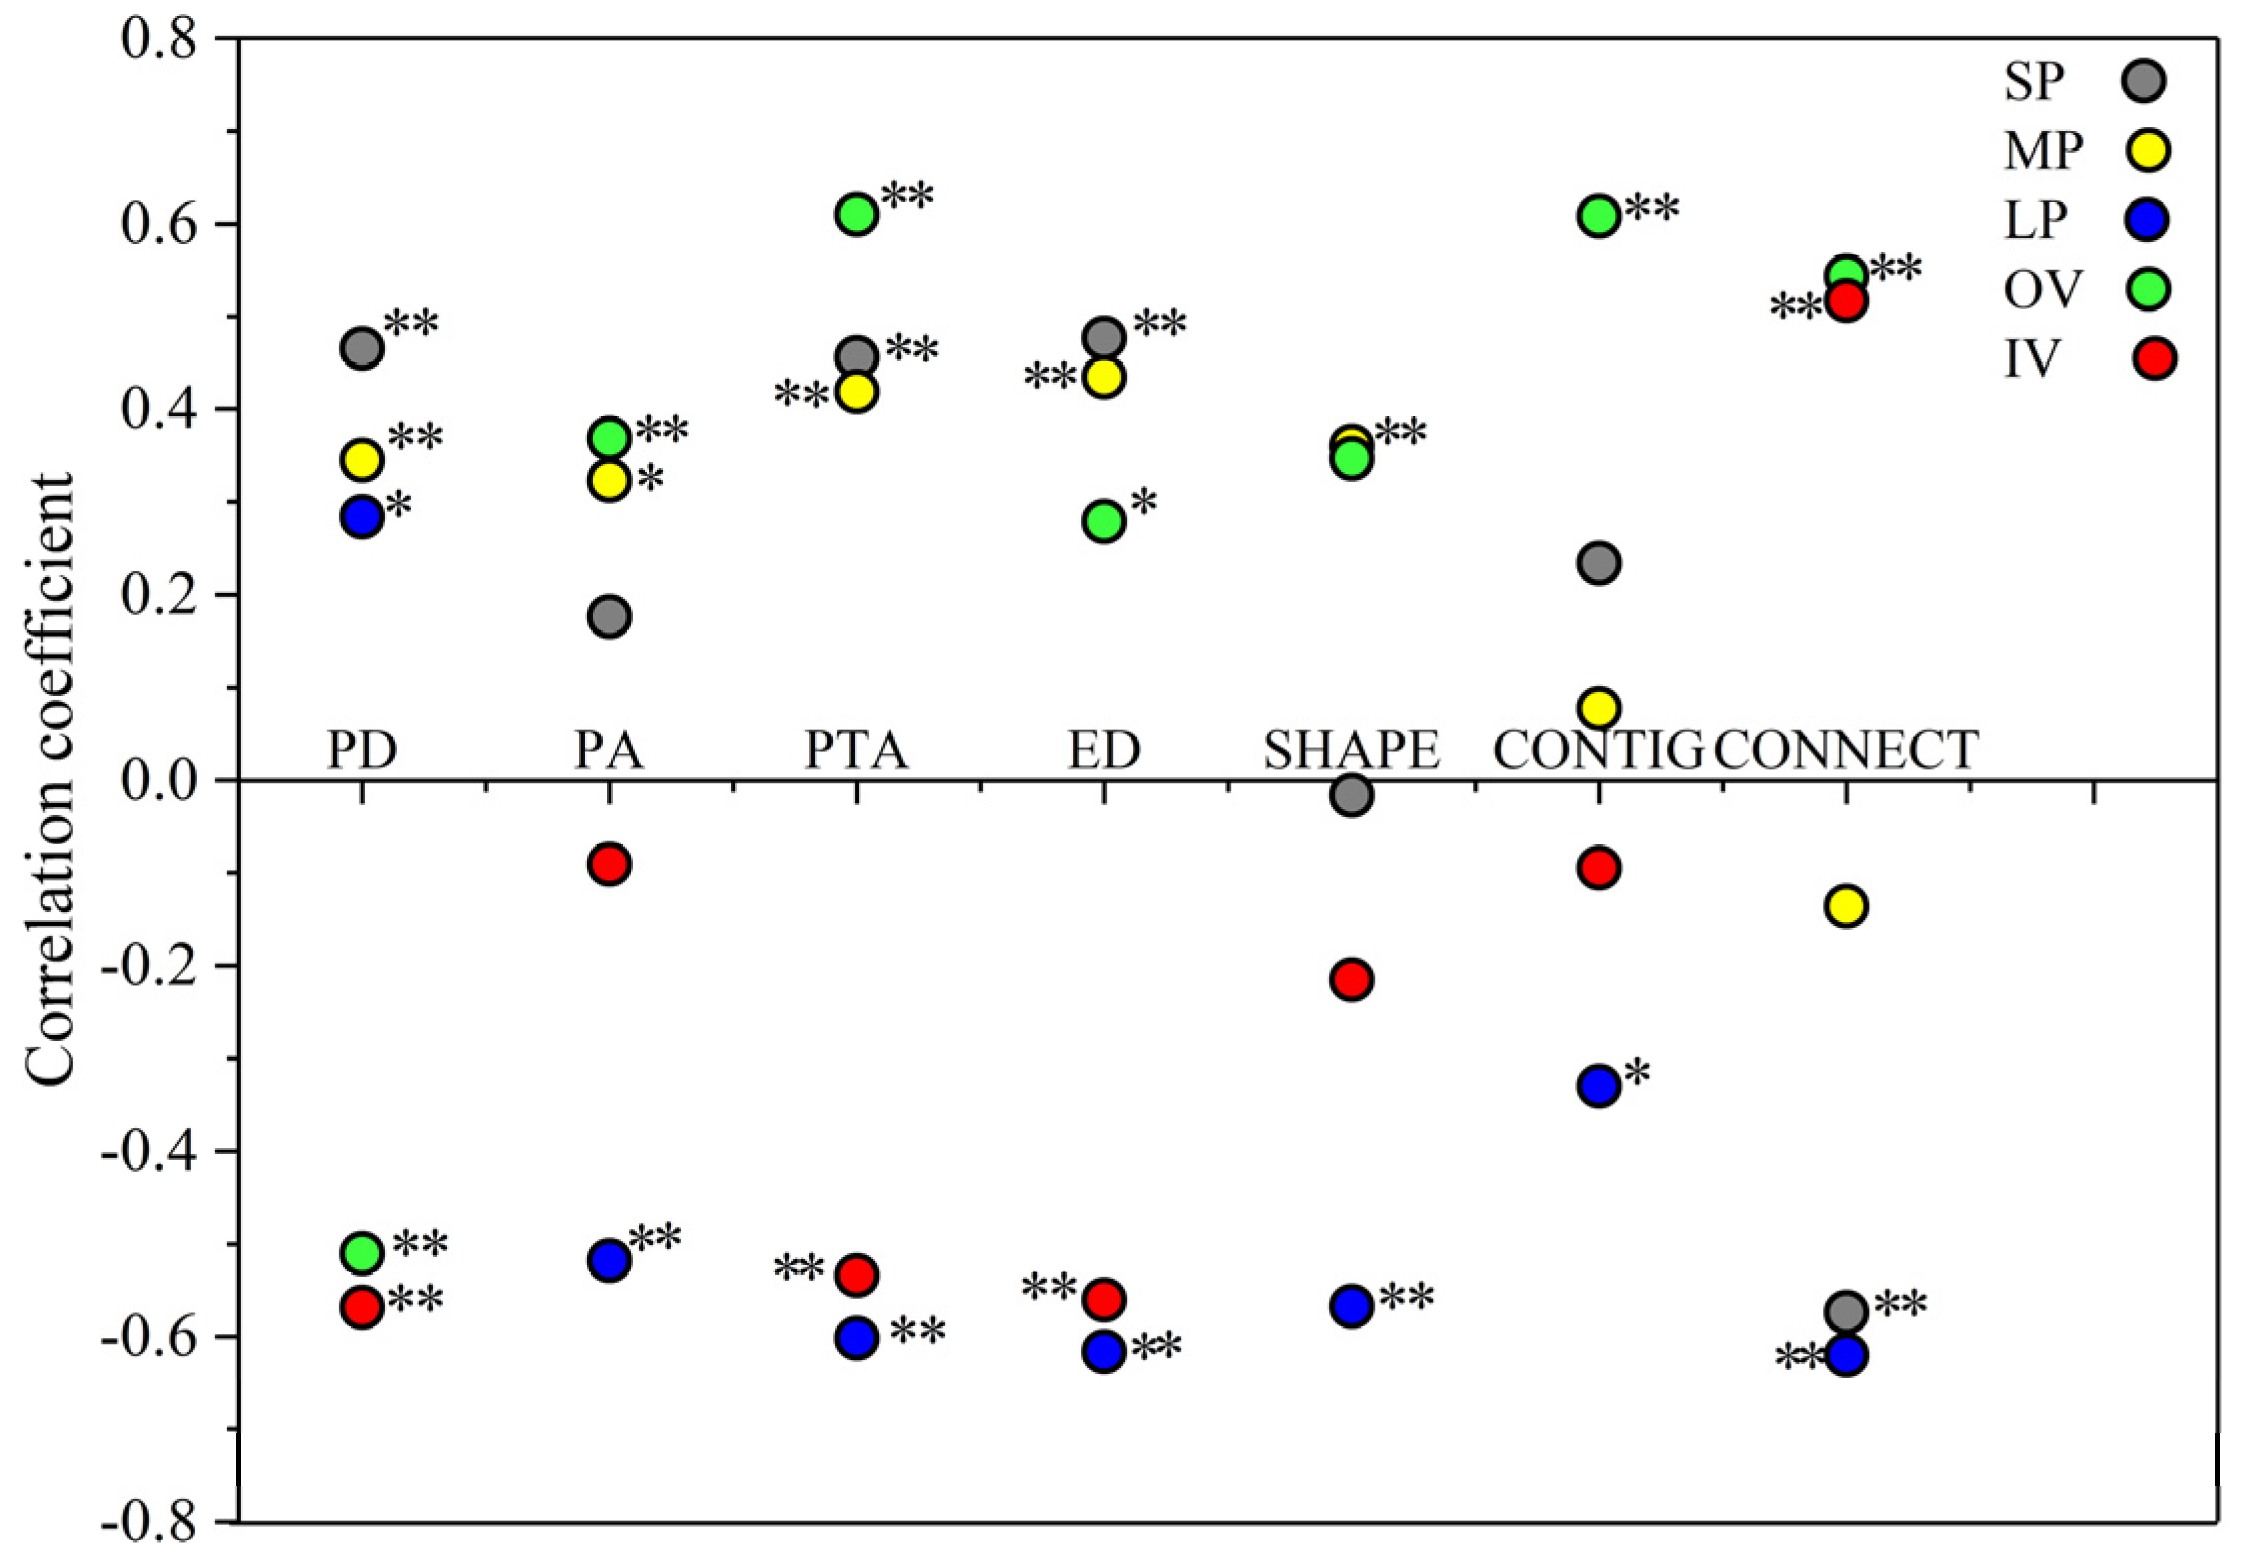
3.2.3. Correlations Between Landscape Indices of Patchiness and Plot SSM

As the main patch types, all landscape indices of OV and LP were significantly correlated with SSM (P < 0.05), indicating that the spatial patterns of OV and LP had the most significant impacts on SSM (Figure 10). Among all the indices, PD of OV was negatively correlated with SSM, while the other indices were positively correlated with SSM (P < 0.05). By contrast, except for the PD index, all indices of LP were negatively correlated with SSM (P < 0.05) (Figure 10). Moreover, the correlation analysis indicated that most landscape indices of IV also had negative correlations with SSM, although IV had higher SSM than bare patches at patch scale (Figure 5 and Figure 10).

4. Discussion

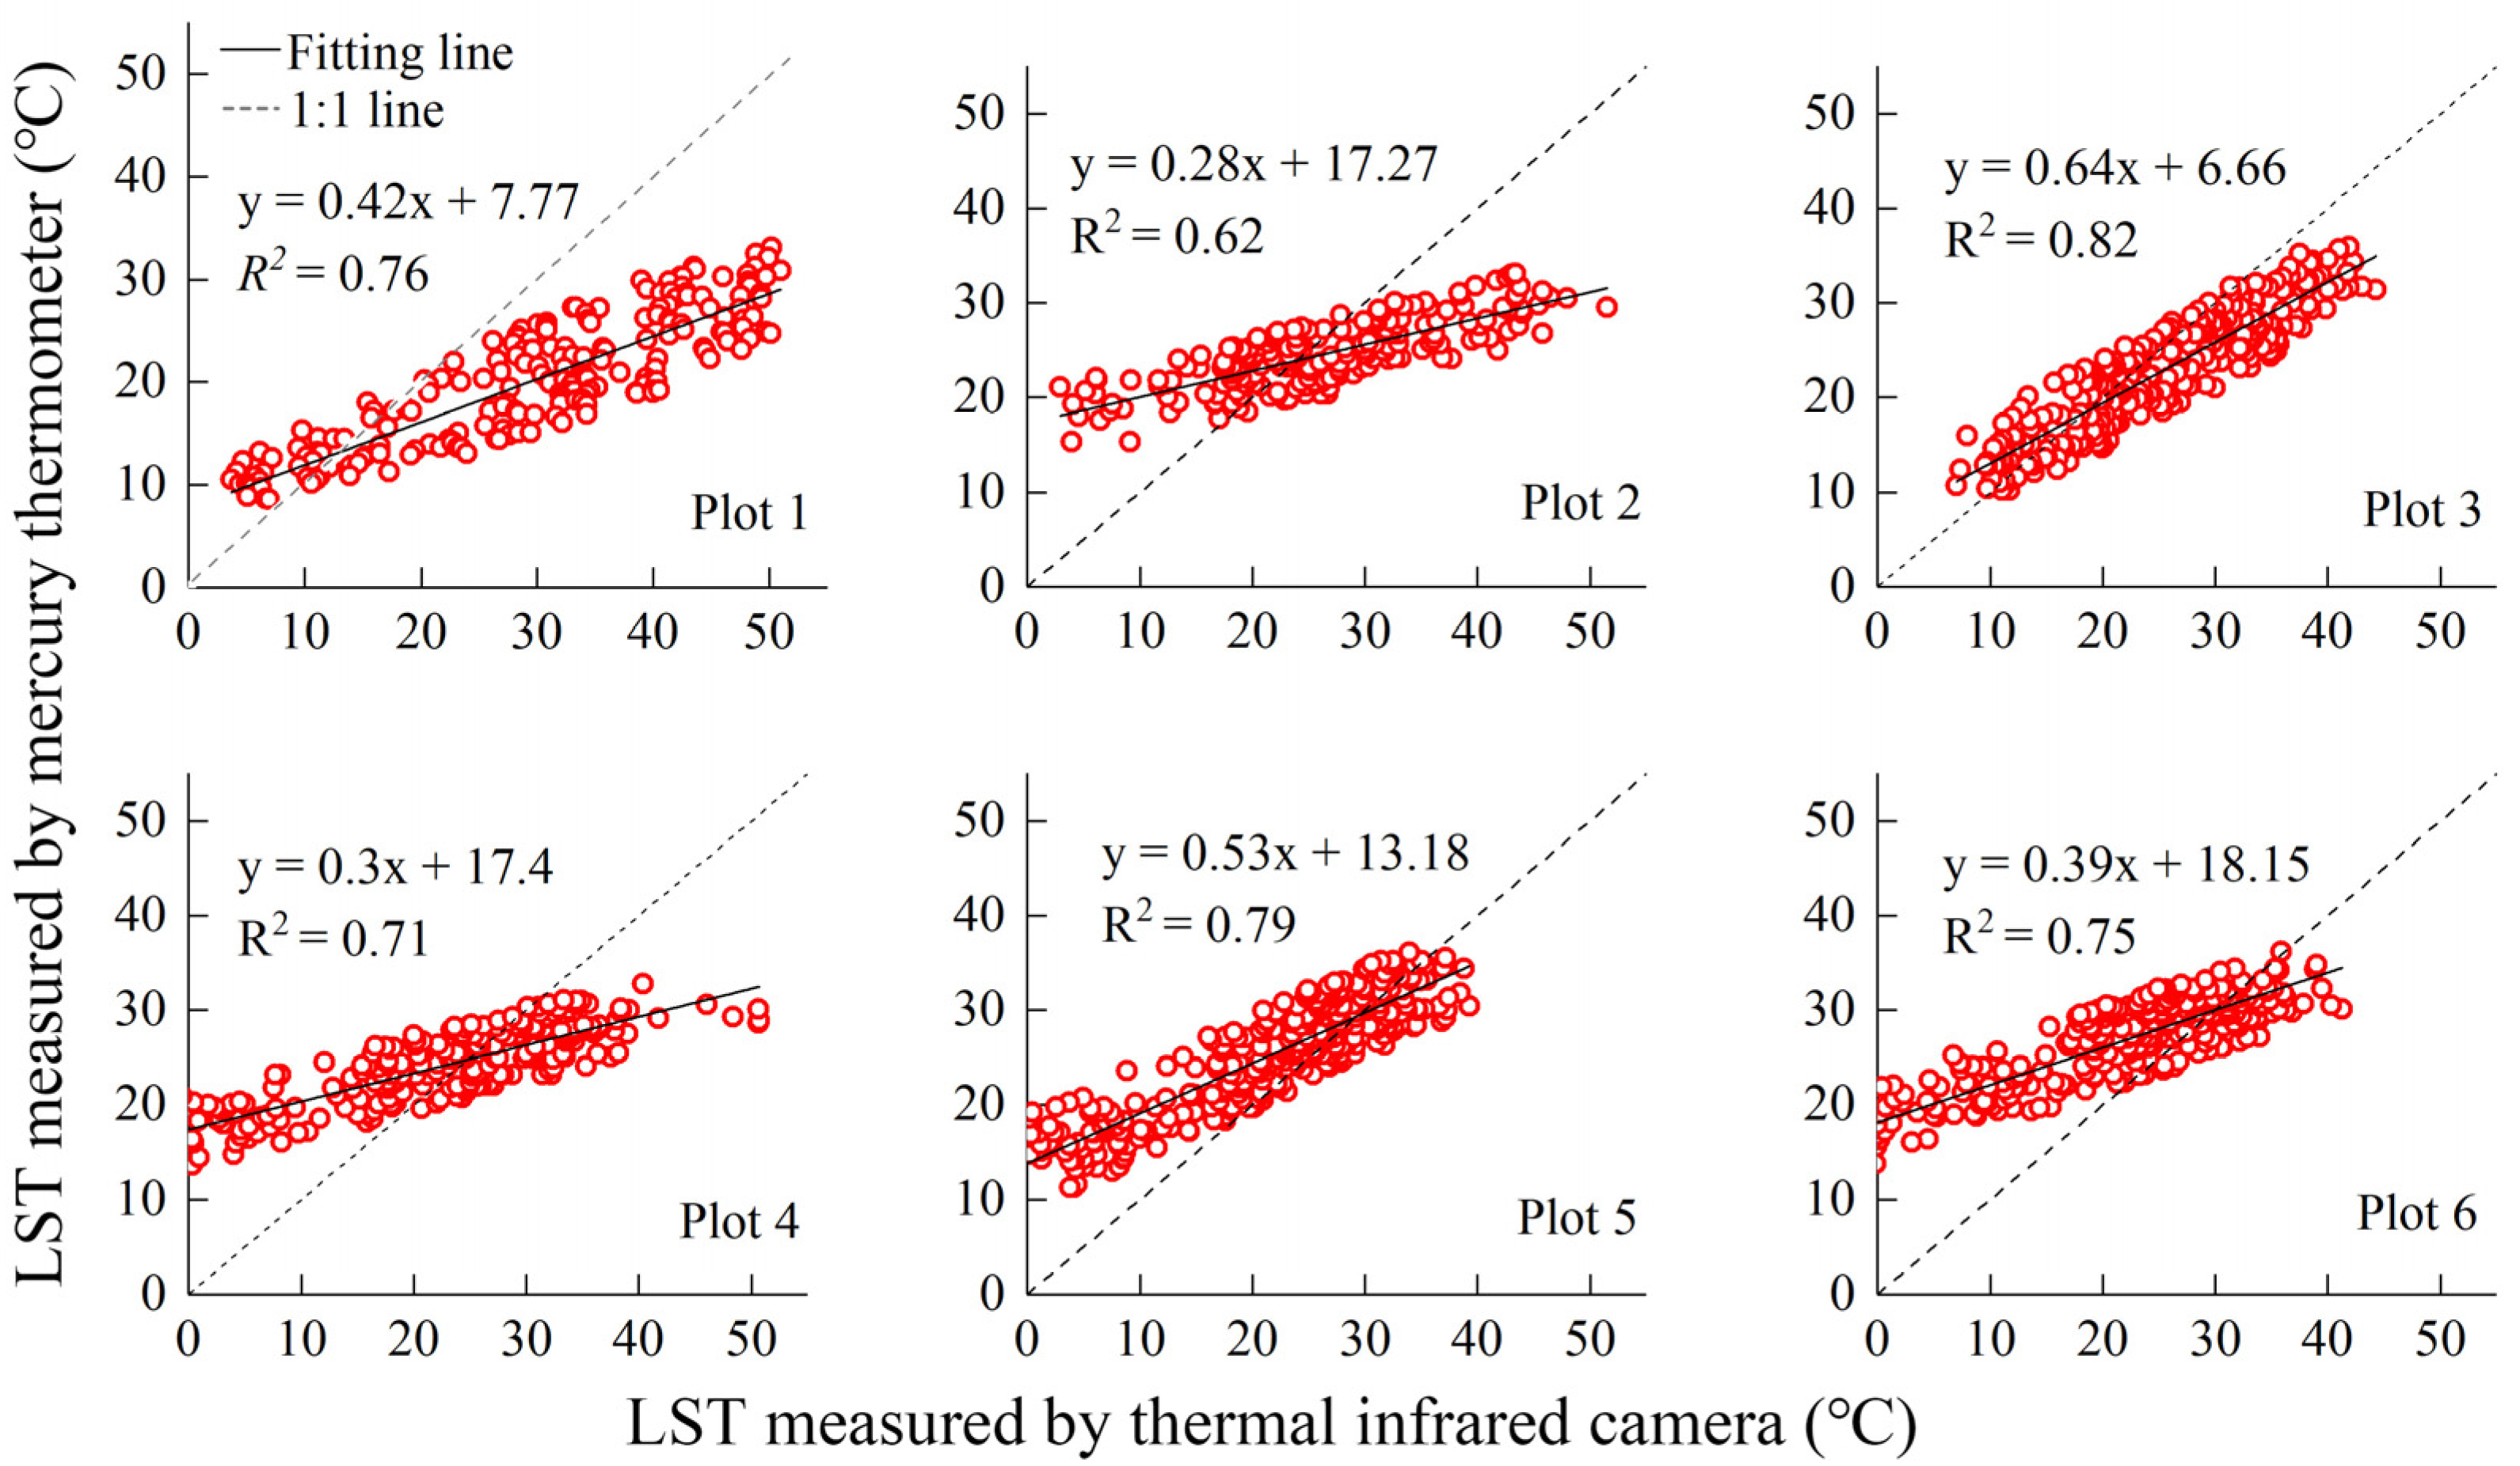
4.1. SSM Estimation Uncertainty

The proposed UAV-based SSM estimation model in our study performs well at the surface soil layer in alpine meadow areas (Figure 8 and Table 2). Nevertheless, the unique weather condition on the QTP still brings uncertainty to the SSM estimation. The uncertainty mainly comes from errors in LST and GNDVI retrieval, which are used for SSM modeling [36]. The unpredictable clouds and winds on the QTP complicate the problem enormously, not only because they can quickly change the real LST, but also because they reduce the sensitivity of thermal infrared sensor to ambient temperature [37,38]. In addition, continuous precipitation during the observation period leads to high air humidity and moist soil, and further reduces the inversion accuracy of LST [39,40]. Moreover, in order to distinguish vegetation canopy from soil background, visible images are utilized as references to register near infrared and thermal infrared images. The differences in image resolutions and edge distortions may bring errors to the registration results [37].

4.2. Effects of Patchiness on SSM at Patch Scale

Patchiness intensifies the heterogeneity of SSM at patch scale (Figure 5). The effects may be associated with three processes, i.e., precipitation redistribution, soil water retention and consumption. Vegetation and bare patches create a spatial mosaic of “sources” and “sinks” [41]. Bare soil generates runoff and promotes rainfall erosion, acting as “sources”, while the vegetation canopy intercepts rainfall and weakens the impact energy of raindrops, serving as “sinks” [42]. Consequently, vegetation patches capture more precipitation than bare patches.
Patchiness leads to heterogeneity of soil physical properties [43,44], which can change soil bulk density and field capacity (Figure 3). A high proportion of decayed and fresh root channels can increase soil porosity [45,46] and reduce soil bulk density (Figure 3a), resulting in higher field capacity in vegetation patches than bare patches (Figure 3b). In addition, bare patches are more vulnerable to erosion and rainfall mainly erodes fine soil particles [47]. Gravel content is significantly higher in bare patches than those in vegetation patches [12], leading to low soil water holding capacity and SSM [48].
Furthermore, evapotranspiration is an important component of SSM consumption [49]. Similar with previous studies, this study reported that most of soil water in bare patches is more likely to be lost via evaporation [11,50], our results demonstrated that bare patches have higher evapotranspiration than OV (Figure 4). Interestingly, IV has relatively higher evapotranspiration than OV, even than LP and SP (Figure 4). It may be attributed to surface wind, which is an essential forcing for the evapotranspiration process [51,52]. The QTP is windy all the year round and the annual mean wind speed exceeds 2 m s−1 [53]. IV is surrounded by bare soil with lower ground level, lack of shelter and resulting acceleration of surface heat flux and evapotranspiration.

4.3. Effects of Patches Pattern on SSM at Plot Scale

The landscape spatial pattern has a crucial influence on energy and material flows, thereby determining eco-hydrological processes [54]. Similarly, patches pattern in alpine meadow described by landscape indices significantly affect SSM at plot scale, especially for PD, PTA, ED, and CONNECT indices of OV, LP and IV (Figure 10). With the largest patch area, a complex shape and the maximum connectivity, the spatial distribution of OV plays a significant positive role on SSM at plot scale (Figure 10). The vast area of OV provides numerous and stable channels for runoff infiltration, and the high connectivity makes plant roots interweave to form a continuous network, which is conducive for storing more soil water and maintaining the stability of SSM [55]. The negative relationship between PD and SSM seems to imply that the existence of OV reduces SSM (Figure 10). Actually, within a fixed coverage, patch density represents the degree of patch fragmentation, indicating that the integrity of OV is conducive to SSM retention.
Nevertheless, bare patches divide the intact vegetation into small fragments and reduce the connectivity between these broken vegetation patches, leading to a decrease in SSM (Figure 10). With the transition from OV to IV, SP, MP and LP, SSM shows a decreasing trend (Figure 5). Consequently, the spatial pattern of LP with a large area (corresponding to low density), complex shape and high connectivity has a significant negative effect on SSM at plot scale (Figure 10). Shang et al. (2018) similarly reported that bare patches exert a hydrothermal-hole effect on alpine meadow, the gradual expansion of bare patches may cause the “root-soil” system to become unstable [18]. As a result, the alternate distribution of the vegetation patch and bare patch with lower ground level can generate erosion interfaces, where alpine meadows are easily stripped by erosions and have low SSM. Finally, the spatial distribution of LP exerts a negative role on SSM at plot scale.
IV has high SSM at patch scale and ranks only second to OV (Figure 5). However, the spatial distribution of IV inhibits the water retention capacity of alpine meadow at plot scale (Figure 10), which can be explained by lateral flow. The differences in evapotranspiration can drive lateral flow of subsurface soil water [56,57]. Coincidentally, our results find that IV has higher evapotranspiration than OV, even than LP and SP (Figure 4). Jiang et al. (2020) reported that the differences in saturated hydraulic conductivity conduct a lateral flow from bare patches to vegetation patches [47]. Similarly, our results also revealed the differences in soil bulk density, which is significantly correlated with saturated hydraulic conductivity for the same soil type. Therefore, we believe that the spatial distribution of IV can extract soil water from surrounding bare patches via the root system and use it for excessive evapotranspiration, playing a role of SSM consumer. Remarkably, the CONNECT index of IV is positively correlated with SSM (Figure 10). This indicates, to a certain extent, the highly connected IV may play the similar role of OV for soil water retention.

4.4. Implications for Alpine Meadow Restoration

Despite significant efforts having been made to restore the degraded alpine meadow on the QTP, few restoration measures consider the effects of patches with different sizes and types [58,59]. Our study clearly reveals that patches with different sizes and types significantly influence SSM, which is a key limiting factor for alpine meadow growth. Consistent with previous studies [11,47,50], OV is the key patch type for water retention in alpine meadow while LP has negative effects on SSM (Figure 5 and Figure 10). Moreover, we also emphasize the negative role of IV in alpine meadow health. IV captures SSM from surrounding bare patches through a lateral flow mechanism, and then consumes it via excessive evapotranspiration. This behavior not only causes the dissipation of SSM, but also reduces the success rate of reseeding and other restoration measures. Therefore, we suggest that more attention should be paid to restoring the vegetation of bare soil surrounding IV in degraded alpine meadow; for example, laying mulch (crop, vegetation, litter, etc.) within a certain area around the edge of IV to reduce soil evaporation, enhance the ability to resist erosions and improve soil fertility and then reseeding.

5. Conclusions

Aerial photogrammetry based on a UAV with multi-type cameras performed well in investigating patch pattern and estimating surface soil moisture distribution. The original vegetation patch had the highest surface soil moisture at patch scale and its spatial pattern played a critical role in maintaining the stability of surface soil moisture in the alpine meadow area. Conversely, the large bare patches had the lowest surface soil moisture at patch scale and their spatial pattern led to significant reduction in surface soil moisture at plot scale. Our results also emphasized the negative role of isolated vegetation patches in the alpine meadow. Patchiness intensified the spatial heterogeneity of surface soil moisture and might be an inducement for grassland degradation. The effects of patches with different sizes and types on surface soil moisture should be taken into consideration in future grassland restoration efforts.

Author Contributions

Conceptualization, W.Z. and S.Y.; methodology, W.Z. and S.Y.; software, B.M. and M.L.; data curation, W.Z.; formal analysis, W.Z., Y.Q. and D.S.; investigation, W.Z.; resources, Y.Q.; writing—original draft preparation, W.Z.; writing—review and editing, S.Y., Y.Q., Y.S., B.M. and J.Z.; visualization, W.Z.; supervision, S.Y.; funding acquisition, S.Y. and Y.Q. All authors have read and agreed to the published version of the manuscript.

Funding

This research was jointly supported by the National Key Research and Development Program of China (2018YFC0406601, 2017YFA0604801), grants from the National Natural Science Foundation of China (42071139, 42071056), and the independent grants from the State Key Laboratory of Cryospheric Sciences (SKLCS-ZZ-2020).

Acknowledgments

The authors would like to thank Xiaogang Ye, Xiaoping Meng, Yan Qin and Qi Zhang for their help in field sampling.

Conflicts of Interest

The authors declare no conflict of interest.

Appendix A

Figure A1. Comparison of land surface temperature measured by mercury thermometer and thermal infrared camera. LST means land surface temperature.
Remotesensing 12 04121 g0a1

References

  1. Miehe, G.; Schleuss, P.; Seeber, E.; Babel, W.; Biermann, T.; Braendle, M.; Chen, F.; Coners, H.; Foken, T.; Gerken, T.; et al. The Kobresia pygmaea ecosystem of the Tibetan highlands-Origin, functioning and degradation of the world’s largest pastoral alpine ecosystem: Kobresia pastures of Tibet. Sci. Total. Environ. 2019, 648, 754–771. [Google Scholar] [CrossRef]
  2. Lin, L.; Li, Y.K.; Xu, X.; Zhang, F.W.; Du, Y.G.; Liu, S.L.; Guo, X.W.; Cao, G.M. Predicting parameters of degradation succession processes of Tibetan Kobresia grasslands. Solid Earth 2015, 6, 1237–1246. [Google Scholar] [CrossRef] [Green Version]
  3. Loveland, T.R.; Reed, B.C.; Brown, J.F.; O Ohlen, D.; Zhu, Z.; Yang, L.; Merchant, J.W. Development of a global land cover characteristics database and IGBP DISCover from 1 km AVHRR data. Int. J. Remote Sens. 2000, 21, 1303–1330. [Google Scholar] [CrossRef]
  4. Wen, L.; Li, Y.; Li, Y.; Wang, X.; Li, X.; Shi, J.; Dong, Q. The impact of land degradation on the C pools in alpine grasslands of the Qinghai-Tibet Plateau. Plant Soil 2012, 368, 329–340. [Google Scholar] [CrossRef]
  5. Qin, Y.; Chen, J.; Yi, S. Plateau pikas burrowing activity accelerates ecosystem carbon emission from alpine grassland on the Qinghai-Tibetan Plateau. Ecol. Eng. 2015, 84, 287–291. [Google Scholar] [CrossRef]
  6. Wei, X.; Li, S.; Yang, P.; Cheng, H. Soil erosion and vegetation succession in alpine Kobresia steppe meadow caused by plateau pika—A case study of Nagqu County, Tibet. Chin. Geogr. Sci. 2007, 17, 75–81. [Google Scholar] [CrossRef] [Green Version]
  7. Akiyama, T.; Kawamura, K. Grassland degradation in China: Methods of monitoring, management and restoration. Grassl. Sci. 2007, 53, 1–17. [Google Scholar] [CrossRef]
  8. Harris, R.B. Rangeland degradation on the Qinghai-Tibetan plateau: A review of the evidence of its magnitude and causes. J. Arid. Environ. 2010, 74, 1–12. [Google Scholar] [CrossRef]
  9. Yi, S. FragMAP: A tool for long-term and cooperative monitoring and analysis of small-scale habitat fragmentation using an unmanned aerial vehicle. Int. J. Remote Sens. 2016, 38, 2686–2697. [Google Scholar] [CrossRef]
  10. Qin, Y.; Yi, S.; Ding, Y.; Xu, G.; Chen, J.; Wang, Z. Effects of small-scale patchiness of alpine grassland on ecosystem carbon and nitrogen accumulation and estimation in northeastern Qinghai-Tibetan Plateau. Geoderma 2018, 318, 52–63. [Google Scholar] [CrossRef]
  11. Qin, Y.; Yi, S.; Ding, Y.; Zhang, W.; Qin, Y.; Chen, J.; Wang, Z. Effect of plateau pika disturbance and patchiness on ecosystem carbon emissions in alpine meadow in the northeastern part of Qinghai–Tibetan Plateau. Biogeosciences 2019, 16, 1097–1109. [Google Scholar] [CrossRef] [Green Version]
  12. Chen, J.; Yi, S.; Qin, Y. The contribution of plateau pika disturbance and erosion on patchy alpine grassland soil on the Qinghai-Tibetan Plateau: Implications for grassland restoration. Geoderma 2017, 297, 1–9. [Google Scholar] [CrossRef]
  13. Jiang, Z.-Y.; Philippe, C.; Wu, H.; Zhang, S.; Zhao, G.-Q.; Wei, J.-Q. Linking spatial distributions of the patchy grass Achnatherum splendens with dynamics of soil water and salt using electromagnetic induction. Catena 2017, 149, 261–272. [Google Scholar] [CrossRef]
  14. Yu, G.R.; Wang, Q.F.; Yu, Z.L. Study on the coupling cycle of water-carbon and process management in terrestrial ecosystem. Adv. Earth Sci. 2004, 19, 831–838. [Google Scholar]
  15. Chen, M.F.; Zeng, H.; Wang, J. Research progress in the ecological characteristics of soil water in alpine grasslands on the Qinghai-Tibetan plateau. Chin. J. Grassl. 2015, 37, 94–101. [Google Scholar]
  16. Klein, J.A.; Harte, J.; Zhao, X.-Q. Experimental warming causes large and rapid species loss, dampened by simulated grazing, on the Tibetan Plateau. Ecol. Lett. 2004, 7, 1170–1179. [Google Scholar] [CrossRef]
  17. Bao, G.S.; Wang, Y.Q.; Song, M.L.; Wang, H.S.; Yin, Y.L.; Liu, S.C.; Yang, Y.W.; Yang, M. Effects of Stellera chamaejasme patches on the surrounding grassland community and on soil physical-chemical properties in degraded grasslands susceptible to S. chamaejasme invasion. Acta Pratacult. Sin. 2019, 28, 51–61. (In Chinese) [Google Scholar]
  18. Shang, Z.; Dong, Q.; Shi, J.; Zhou, H.; Dong, S.; Shao, X.; Li, S.; Wang, Y.; Ma, Y.; Ding, L.; et al. Research progress in recent ten years of ecological restoration for ‘black soil land’ degraded grassland on Tibetan Plateau-Concurrently discuss of ecological restoration in sangjiangyuan region. Acta Agrestia Sin. 2018, 26, 1–21. (In Chinese) [Google Scholar]
  19. Salamí, E.; Barrado, C.; Pastor, E. UAV Flight Experiments Applied to the Remote Sensing of Vegetated Areas. Remote Sens. 2014, 6, 11051–11081. [Google Scholar] [CrossRef] [Green Version]
  20. Yi, S.; Chen, J.; Qin, Y.; Xu, G. The burying and grazing effects of plateau pika on alpine grassland are small: A pilot study in a semiarid basin on the Qinghai-Tibet Plateau. Biogeosciences 2016, 13, 6273–6284. [Google Scholar] [CrossRef] [Green Version]
  21. Bian, J.; Zhang, Z.; Chen, J.; Chen, H.; Cui, C.; Li, X.; Chen, S.; Fu, Q. Simplified Evaluation of Cotton Water Stress Using High Resolution Unmanned Aerial Vehicle Thermal Imagery. Remote Sens. 2019, 11, 267. [Google Scholar] [CrossRef] [Green Version]
  22. Wang, W.; Wang, X.; Wang, L.; Lu, Y.; Li, Y.; Sun, X. Soil moisture estimation for spring wheat in a semiarid area based on low-altitude remote-sensing data collected by small-sized unmanned aerial vehicles. J. Appl. Remote Sens. 2018, 12. [Google Scholar] [CrossRef]
  23. Wu, J.; Zhang, S.-Q.; Wu, H.; Liu, S.-W.; Qin, Y.; Qin, J. Actual Evapotranspiration in Suli Alpine Meadow in Northeastern Edge of Qinghai-Tibet Plateau, China. Adv. Meteorol. 2015, 2015, 1–10. [Google Scholar] [CrossRef]
  24. Qin, Y.; Yi, S.; Chen, J.; Ren, S.; Ding, Y. Effects of gravel on soil and vegetation properties of alpine grassland on the Qinghai-Tibetan plateau. Ecol. Eng. 2015, 74, 351–355. [Google Scholar] [CrossRef]
  25. Yi, S.; Zhou, Z.; Ren, S.; Xu, M.; Qin, Y.; Chen, S.; Ye, B. Effects of permafrost degradation on alpine grassland in a semi-arid basin on the Qinghai–Tibetan Plateau. Environ. Res. Lett. 2011, 6. [Google Scholar] [CrossRef]
  26. Maestre, F.T. On the importance of patch attributes, environmental factors and past human impacts as determinants of perennial plant species richness and diversity in Mediterranean semiarid steppes. Divers. Distrib. 2004, 10, 21–29. [Google Scholar] [CrossRef]
  27. Hu, G.L.; Zhao, W.Z.; Wang, G. Reviews on spatial pattern and sand-binding effect of patch vegetation in arid desert area. Acta Ecol. Sin. 2011, 31, 7609–7616. [Google Scholar]
  28. Piao, S.; Fang, J.; Zhou, L.; Guo, Q.; Henderson, M.; Ji, W.; Li, Y.; Tao, S. Interannual variations of monthly and seasonal normalized difference vegetation index (NDVI) in China from 1982 to 1999. J. Geophys. Res. Space Phys. 2003, 108, 2002. [Google Scholar] [CrossRef]
  29. Chen, J.; Yi, S.; Ren, S.; Qin, Y.; Wang, X. Retrieval of fractional vegetation cover of alpine grassland and the efficiency of remote sensing retrieval in the upper of Shule River Basin. Pratacult. Sci. 2014, 31, 56–65. [Google Scholar]
  30. Chen, J.; Yi, S.; Qin, Y.; Wang, X. Improving estimates of fractional vegetation cover based on UAV in alpine grassland on the Qinghai–Tibetan Plateau. Int. J. Remote Sens. 2016, 37, 1922–1936. [Google Scholar] [CrossRef]
  31. Ahamed, T.; Tian, L.; Zhang, Y.; Ting, K. A review of remote sensing methods for biomass feedstock production. Biomass Bioenergy 2011, 35, 2455–2469. [Google Scholar] [CrossRef]
  32. Chang, Y.; Zhang, S.; Zhao, Q. Comparative study on land surface temperature retrieval on alpine mountainous cold regions: A case study of upper reach of Shule River Basin. Remote Sens. Inf. 2016, 31, 122–128. (In Chinese) [Google Scholar]
  33. Carlson, T. An Overview of the “Triangle Method” for Estimating Surface Evapotranspiration and Soil Moisture from Satellite Imagery. Sensors 2007, 7, 1612–1629. [Google Scholar] [CrossRef] [Green Version]
  34. Stisen, S.; Sandholt, I.; Nørgaard, A.; Fensholt, R.; Jensen, K.H. Combining the triangle method with thermal inertia to estimate regional evapotranspiration—Applied to MSG-SEVIRI data in the Senegal River basin. Remote Sens. Environ. 2008, 112, 1242–1255. [Google Scholar] [CrossRef]
  35. Chauhan, N.S.; Miller, S.; Ardanuy, P. Spaceborne soil moisture estimation at high resolution: A microwave-optical/IR synergistic approach. Int. J. Remote Sens. 2003, 24, 4599–4622. [Google Scholar] [CrossRef]
  36. Zhao, W.; Li, A.; Zhao, T. Potential of estimating surface soil moisture with the triangle-based empirical relationship mode. IEEE Trans. Geosci. Electron. 2017, 55, 6494–6504. [Google Scholar] [CrossRef]
  37. Kelly, J.; Kljun, N.; Olsson, P.-O.; Mihai, L.; Liljebladh, B.; Weslien, P.; Klemedtsson, L.; Eklundh, L. Challenges and Best Practices for Deriving Temperature Data from an Uncalibrated UAV Thermal Infrared Camera. Remote Sens. 2019, 11, 567. [Google Scholar] [CrossRef] [Green Version]
  38. Song, B.; Park, K. Verification of Accuracy of Unmanned Aerial Vehicle (UAV) Land Surface Temperature Images Using In-Situ Data. Remote Sens. 2020, 12, 288. [Google Scholar] [CrossRef] [Green Version]
  39. Aubrecht, D.M.; Helliker, B.R.; Goulden, M.L.; Roberts, D.A.; Still, C.J.; Richardson, A.D. Continuous, long-term, high-frequency thermal imaging of vegetation: Uncertainties and recommended best practices. Agric. For. Meteorol. 2016, 228, 315–326. [Google Scholar] [CrossRef] [Green Version]
  40. Hammerle, A.; Meier, F.; Heinl, M.; Egger, A.; Leitinger, G. Implications of atmospheric conditions for analysis of surface temperature variability derived from landscape-scale thermography. Int. J. Biometeorol. 2017, 61, 575–588. [Google Scholar] [CrossRef] [Green Version]
  41. Archer, N.A.L.; Quinton, J.N.; Hess, T. Patch vegetation and water redistribution above and below ground in south-east Spain. Ecohydrology 2011, 5, 108–120. [Google Scholar] [CrossRef]
  42. Vásquez-Méndez, R.; Ventura-Ramos, E.; Oleschko, K.; Hernández-Sandoval, L.; Parrot, J.-F.; Nearing, M.A. Soil erosion and runoff in different vegetation patches from semiarid Central Mexico. Catena 2010, 80, 162–169. [Google Scholar] [CrossRef]
  43. Lesschen, J.P.; Cammeraat, L.; Kooijman, A.; Van Wesemael, B. Development of spatial heterogeneity in vegetation and soil properties after land abandonment in a semi-arid ecosystem. J. Arid. Environ. 2008, 72, 2082–2092. [Google Scholar] [CrossRef]
  44. Rossi, M.; Ares, J.O. Overland flow from plant patches: Coupled effects of preferential infiltration, surface roughness and depression storage at the semiarid Patagonian Monte. J. Hydrol. 2016, 533, 603–614. [Google Scholar] [CrossRef]
  45. Gill, R.; Burke, I.C.; Milchunas, D.G.; Lauenroth, W.K. Original Articles: Relationship Between Root Biomass and Soil Organic Matter Pools in the Shortgrass Steppe of Eastern Colorado. Ecosystems 1999, 2, 226–236. [Google Scholar] [CrossRef]
  46. Van Schaik, L. Spatial variability of infiltration patterns related to site characteristics in a semi-arid watershed. Catena 2009, 78, 36–47. [Google Scholar] [CrossRef]
  47. Jiang, X.-J.; Zhu, X.; Yuan, Z.-Q.; Li, X.G.; Liu, W.; Zakari, S. Lateral flow between bald and vegetation patches induces the degradation of alpine meadow in Qinghai-Tibetan Plateau. Sci. Total Environ. 2021, 751. [Google Scholar] [CrossRef]
  48. Yi, S.; He, Y.; Guo, X.; Chen, J.; Wu, Q.; Qin, Y.; Ding, Y. The physical properties of coarse-fragment soils and their effects on permafrost dynamics: A case study on the central Qinghai–Tibetan Plateau. Cryosphere 2018, 12, 3067–3083. [Google Scholar] [CrossRef] [Green Version]
  49. Rivas, R.; Caselles, V. A simplified equation to estimate spatial reference evaporation from remote sensing-based surface temperature and local meteorological data. Remote Sens. Environ. 2004, 93, 68–76. [Google Scholar] [CrossRef]
  50. Yi, S.; Wang, X.; Qin, Y.; Xiang, B.; Ding, Y. Responses of alpine grassland on Qinghai–Tibetan plateau to climate warming and permafrost degradation: A modeling perspective. Environ. Res. Lett. 2014, 9. [Google Scholar] [CrossRef] [Green Version]
  51. Rayner, D.P. Wind run changes are the dominant factor affecting pan evaporation trends in Australia. J. Clim. 2007, 20, 3379–3394. [Google Scholar] [CrossRef]
  52. Liuzzo, L.; Viola, F.; Noto, L.V. Wind speed and temperature trends impacts on reference evapotranspiration in Southern Italy. Theor. Appl. Clim. 2014, 123, 43–62. [Google Scholar] [CrossRef]
  53. Yang, K.; Guo, X.; Wu, B. Recent trends in surface sensible heat flux on the Tibetan Plateau. Sci. China Earth Sci. 2010, 54, 19–28. [Google Scholar] [CrossRef]
  54. Wu, J.; Hobbs, R. Key issues and research priorities in landscape ecology: An idiosyncratic synthesis. Landsc. Ecol. 2002, 17, 355–365. [Google Scholar] [CrossRef]
  55. Moreno-De-Las-Heras, M.; Saco, P.M.; Willgoose, G.R.; Tongway, D.J. Assessing landscape structure and pattern fragmentation in semiarid ecosystems using patch-size distributions. Ecol. Appl. 2011, 21, 2793–2805. [Google Scholar] [CrossRef] [Green Version]
  56. Von Hardenberg, J.; Meron, E.; Shachak, M.; Zarmi, Y. Diversity of Vegetation Patterns and Desertification. Phys. Rev. Lett. 2001, 87. [Google Scholar] [CrossRef] [Green Version]
  57. Rietkerk, M.; Dekker, S.C.; De Ruiter, P.C.; Van De Koppel, J. Self-Organized Patchiness and Catastrophic Shifts in Ecosystems. Science 2004, 305, 1926–1929. [Google Scholar] [CrossRef] [Green Version]
  58. Feng, R.; Long, R.; Shang, Z.; Ma, Y.; Dong, S.; Wang, Y. Establishment of Elymus natans improves soil quality of a heavily degraded alpine meadow in Qinghai-Tibetan Plateau, China. Plant Soil 2010, 327, 403–411. [Google Scholar] [CrossRef]
  59. Dong, S.; Wang, X.X.; Liu, S.L.; Li, Y.Y.; Su, X.K.; Wen, L.; Zhu, L. Reproductive responses of alpine plants to grassland degradation and artificial restoration in the Qinghai-Tibetan Plateau. Grass Forage Sci. 2015, 70, 229–238. [Google Scholar] [CrossRef]
Figure 1. (a) Source region of the Shule River Basin and its location on the Qinghai-Tibetan Plateau and China; (b) working point (red pentagram) in the source region of Shule River Basin; (c) irregular flight way with 6 fixed sampling plots. Red boxes represent the plots (~50 m × 40 m).
Remotesensing 12 04121 g001
Figure 2. An aerial photo of field observation at the five typical patches: (1) large bare patch (LP), (2) small bare patch (SP), (3) medium bare patch (MP), (4) isolate vegetation patch (IV) and (5) original vegetation patch (OV). The white columns inside the rectangles are mercury thermometers.
Remotesensing 12 04121 g002
Figure 3. Variations of (a) soil bulk density and (b) field capacity among the five typical patches. OV, IV, SP, MP and LP mean original vegetation patch, isolate vegetation patch, small bare patch, medium bare patch and large bare patch, respectively.
Remotesensing 12 04121 g003
Figure 4. Variations of evapotranspiration among the five typical patches. OV, IV, SP, MP and LP mean original vegetation patch, isolate vegetation patch, small bare patch, medium bare patch and large bare patch, respectively. The middle bold line within the box represents the mean value, and the short lines at the end of the vertical line represent 5%~95% interval. Different letters indicate significant differences among the five typical patches (P < 0.05).
Remotesensing 12 04121 g004
Figure 5. Variations of in situ measured surface soil moisture among the five typical patches. SP, MP, LP, OV and IV mean small bare patch, medium bare patch, large bare patch, original vegetation patch and isolate vegetation patch, respectively. Values fall between 5~95%, different letters indicate significant differences among the five typical patches (P < 0.01).
Remotesensing 12 04121 g005
Figure 6. Aerial images (~50 m × 40 m) of the six sampling plots.
Remotesensing 12 04121 g006
Figure 7. Spatial patterns of the five typical patches at six plots. SP, MP, LP, OV and IV mean small bare patch, medium bare patch, large bare patch, original vegetation patch and isolated vegetation patch, respectively.
Remotesensing 12 04121 g007
Figure 8. Validation of the estimated soil moisture with in situ measured soil moisture at different soil layers. d is the Willmott agreement index.
Remotesensing 12 04121 g008
Figure 9. Spatial distribution of surface soil moisture at the 0–30 cm soil layer.
Remotesensing 12 04121 g009
Figure 10. The correlation coefficient scatter plots between surface soil moisture (0–30 cm) and landscape indices of the five typical patches. SP, MP, LP, OV and IV mean small bare patch, medium bare patch, large bare patch, original vegetation patch and isolated vegetation patch, respectively. PD: patch density; PA: average area of patches (log-transformed); PTA: percent of total area; ED: edge density; SHAPE: shape index; CONTIG: contiguity index; CONNECT: connect index. (** indicates P < 0.01, * indicates P < 0.05, no marks indicate the correlation is not significant).
Remotesensing 12 04121 g010
Table 1. Parameters of visible, near infrared and thermal infrared cameras.
Camera TypesSpectral BandResolution (Pixel)Flight Height (m)Cover Range (m2)Pixel Size (cm2)Sampling Time
ZX3 R, G, B4000 × 30003052.50 × 39.371.31 × 1.31 12:00
ZX3 PlusNIR, G, B4000 × 30003052.50 × 39.37 1.31 × 1.31 11:00 and 15:00
ZXTTIR512 × 6404048.32 × 38.66 7.55 × 7.55every hour
ZX3, ZX3 Plus and ZXT mean ZX3 visible camera, ZX3 near infrared camera and Zenmuse XT thermal infrared camera, respectively. R, G, B, NIR and TIR mean red (620 to 750 nm), green (525 to 600 nm), blue (450 to 515 nm), near infrared (845 to 885 nm) and thermal infrared (750 to 1300 nm) spectral bands, respectively.
Table 2. Performances of the unmanned aerial vehicle (UAV)-based surface soil moisture (SSM) estimation model at different soil layers.
Parameters0–5 cm5–10 cm10–20 cm20–30 cm30–40 cm0–40 cm
R20.890.820.640.650.350.89
RMSE0.036 0.042 0.024 0.009 0.01 0.028
P<0.001<0.001<0.001<0.001<0.05<0.001
Publisher’s Note: MDPI stays neutral with regard to jurisdictional claims in published maps and institutional affiliations.

