Article

Volcanic Hot-Spot Detection Using SENTINEL-2: A Comparison with MODIS–MIROVA Thermal Data Series

1
Dipartimento di Scienze della Terra, Università di Torino, V. Valperga Caluso 35, 10125 Torino, Italy
2
Dipartimento di Scienze della Terra, Università di Firenze, V. G. La Pira 4, 50121 Firenze, Italy
3
NATRISK: Centro Interdipartimentale sui Rischi Naturali in Ambiente Montano e Collinare, Università di Torino, Largo Paolo Braccini, 2, 10095 Grugliasco (TO), Italy
4
Dep. Computer Vision & Remote Sensing, Technische Universität Berlin, 10587 Berlin, Germany
5
GFZ German Research Centre for Geosciences, Telegrafenberg, 14473 Potsdam, Germany
*
Author to whom correspondence should be addressed.
Submission received: 9 January 2020 / Revised: 25 February 2020 / Accepted: 1 March 2020 / Published: 3 March 2020
(This article belongs to the Special Issue Satellite Remote Sensing of High-Temperature Thermal Anomalies)

Abstract

:
In the satellite thermal remote sensing, the new generation of sensors with high-spatial resolution SWIR data open the door to an improved constraining of thermal phenomena related to volcanic processes, with strong implications for monitoring applications. In this paper, we describe a new hot-spot detection algorithm developed for SENTINEL-2/MSI data that combines spectral indices on the SWIR bands 8a-11-12 (with a 20-meter resolution) with a spatial and statistical analysis on clusters of alerted pixels. The algorithm is able to detect hot-spot-contaminated pixels (S2Pix) in a wide range of environments and for several types of volcanic activities, showing high accuracy performances of about 1% and 94% in averaged omission and commission rates, respectively, underlining a strong reliability on a global scale. The S2-derived thermal trends, retrieved at eight key-case volcanoes, are then compared with the Volcanic Radiative Power (VRP) derived from MODIS (Moderate Resolution Imaging Spectroradiometer) and processed by the MIROVA (Middle InfraRed Observation of Volcanic Activity) system during an almost four-year-long period, January 2016 to October 2019. The presented data indicate an overall excellent correlation between the two thermal signals, enhancing the higher sensitivity of SENTINEL-2 to detect subtle, low-temperature thermal signals. Moreover, for each case we explore the specific relationship between S2Pix and VRP showing how different volcanic processes (i.e., lava flows, domes, lakes and open-vent activity) produce a distinct pattern in terms of size and intensity of the thermal anomaly. These promising results indicate how the algorithm here presented could be applicable for volcanic monitoring purposes and integrated into operational systems. Moreover, the combination of high-resolution (S2/MSI) and moderate-resolution (MODIS) thermal timeseries constitutes a breakthrough for future multi-sensor hot-spot detection systems, with increased monitoring capabilities that are useful for communities which interact with active volcanoes.

Graphical Abstract

1. Introduction

Satellite thermal remote sensing is a key discipline to study and monitor recent and ongoing volcanic activity. This role arises from several pioneering studies demonstrating how volcanogenic heat, measured in the InfraRed wavelengths (IR; 0.7–20 μm), is strictly related to the activity of volcano itself (i.e., [1,2,3,4]). In the last decades, space-based thermal data have been used to investigate a wide spectrum of volcanic phenomena, in particular lava-flow-forming eruptions [5,6], lava lakes’ dynamic [7,8], extrusion of lava domes [9,10], mechanisms driving effusive dynamics [11,12] and magma budgets [13,14], as well as to track high-temperature fumaroles [15,16,17]. Nowadays, thermal signals from volcanoes can be investigated by using new sensors and processing algorithms, and such advancements will continue to make thermal remote sensing an expanding field, whose techniques represent a safe and low-cost tool for improving volcano comprehension [18]. Fundamental parameters, such as the location, size and temperature of the hot target(s), the radiant flux and the time-averaged lava discharge rates (TADR) can be estimated from IR remote sensing and delivered to research centers, observatories and protection agencies that are in charge of volcano monitoring [19,20].
The thermal signature (i.e., intensity, dimension, spatial distribution and temporal persistency) of these volcanic phenomena may vary in space and time, because of the distinct source processes and conditions at which the hot source (magma/gas) is exposed at the surface. Thus, different kinds of volcanic activities could be expressed by a wide spectrum of thermal signals, with some being more explicit, such as a fresh lava body exposed to surface, others more cryptic, such as a highly viscous lava dome or a hot-degassing surface [21]. The prompt interpretation of the thermal signature is a challenge, particularly for volcano monitoring and real-time assessment of hazardous scenarios.
In the last decade, several automated detection systems of volcanic IR signal have been developed, most of which use the Middle InfraRed/Thermal InfraRed region (MIR, 3.44–4.13 mm; TIR, 8.6–12.2 mm) to extract the radiances emitted by a hot body [22,23,24,25]. The widespread use of MIR is mainly because the integrated temperature of the lava surfaces (from 200 to 1200 °C) produces an emission peak at these wavelengths and strongly increases spectral radiance in a pixel if compared with other spectral wavelengths [26,27]. Particularly, MODIS sensor (Moderate-Resolution Imaging Spectroradiometer, on-board NASA Terra and Aqua satellites since 1999 and 2002, respectively) has been highly utilized in the last 20 years for thermal volcanic observation. This sensor is characterized by two useful bands for volcanic hot-spot detection, located in MIR and TIR respectively, by a moderate spatial resolution in the IR bands (1 km), and by regular overpasses providing up to four images per day considering both sensors [28]. Several algorithms have been developed to automatically detect the presence of thermal anomalies based on MODIS data, each one with its own advantages and drawbacks, mainly related to variabilities in spatial–temporal–spectral resolution and temperature saturation limits (see [29]). Among all, MODVOLC [22] and MIROVA [25] are probably the most used in real-time volcanic monitoring [20].
Even though the moderate temporal resolution of MODIS (four data per day) is crucial for volcano monitoring, its spatial resolution (1 km) is too coarse for detailed analysis of volcanic hot spots and prevents to retrieve accurate spatial information from hot targets. Instead, high-spatial-resolution sensors (<120 m pixel size), such as the recent Multispectral Instrument (MSI) and the Operational Land Imager (OLI), carried on SENTINEL-2 [30,31] and LANDSAT-8 [16,32,33] platforms, respectively, or the older ASTER (Advanced Spaceborne Thermal Emission and Reflection) sensor [34,35], can prove crucial to tackle this. Indeed, smaller pixel size allow a higher detail of observation and measurement, yet with the drawback that higher-resolution IR sensors can saturate and have low temporal resolution for several days [21]. The NASA’s LANDSAT program has a long history of satellite volcanic thermal studies since the 1980s, and it has been the centerpiece of high-spatial-resolution volcanic-hot-spot analysis from space ([27] and reference therein). The 2013 launch of LANDSAT-8 (OLI and TIRS onboard instruments), with spatial resolution of 100 m in TIR and 30 m in VIS-NIR-SWIR (Visible 0.4 to 0.7 μm/Near InfraRed 0.7 to 1.1 μm/Shortwave InfraRed SWIR 1.1 to 3.0 μm; [27]) provides a continuation of the LANDSAT program [32]. In any case, its revisit frequency of 16 days poses a major limit to characterize volcanic activity with an adequate temporal resolution.
In this regard, the recent launches of the Copernicus SENTINEL-2A and -2B platforms provide an additional tool to improve high-resolution thermal monitoring of unrest and eruptive dynamics, possibly on a global scale. Even if SENTINEL-2 was mainly designed for agriculture, forests, land consumption, coastlines evolution and risks mapping applications [36], its usage has high potentials for volcanic studies. In fact, the availability of 13 bands, particularly of SWIR channels for detection of thermal emission by hot bodies, a revisit frequency of maximum five days and a spatial resolution of 20 m/pixel in the SWIR bands, make SENTINEL-2 data excellent to detect small high-temperature thermal anomalies and to retrieve relevant spatial information (e.g., location, size and shape) from active hot targets, improving potentialities both for volcanic scientific research and monitoring. Moreover, the compatibility between the SENTINEL-2 MSI and LANDSAT-8 OLI sensors in spectral calibration and spatial resolutions, particularly in NIR and SWIR regions, allows the scientific community to use the two datasets synergistically, possibly improving and developing volcanic thermal investigations.
Nevertheless, because of their recent availability, the SENTINEL-2 (hereafter S2) thermal dataset is partially still under-investigated in volcanological studies: a few works started to use these images, mainly for studying qualitatively a specific eruption or volcanic phase [37,38,39], mapping lava flows [40] or as a comparison dataset to calculate pixel-integrated temperatures or to infer thermal model of a specific volcanic phenomena [41,42].
Anyway, some relevant SWIR fires-devoted hot-spot-detection algorithms, using high-spatial resolution data (LANDSAT-8 and SENTINEL-2), are available (i.e., [43,44,45,46]), stating an increasing interest for these imagery products in last years. Moreover, recently, Marchese and co-authors [47] tested an easy multichannel algorithm based on NIR and SWIR analysis, with valuable results on mapping volcanic hot spots in different volcanic contexts, using both SENTINEL-2 and LANDSAT-8 imagery. However, as far as we know, no operationally systems use these existing high-resolution SWIR-based algorithms for volcanic monitoring tasks and, in addition, no multi-years and continuous analysis have been carried out to combine these algorithms results with automated and web-based hot-spot volcanic detection systems, or to compare hot-spot-related data with key volcanic parameters.
Here, we present a new volcano-dedicated contextual hot-spot-detection algorithm for SENTINEL-2 MSI data, based on SWIR bands analysis, with the aim to precisely locate and quantify the number of thermally anomalous pixels in a variety of volcanic eruptive phenomena. The algorithm analyzes the TOA (Top of the Atmosphere) reflectance of the 12–11–8A bands, improving the hot pixel detection method with a contextual threshold based on a statistical distribution of each thermally anomalous clusters.
We tested the reliability of this algorithm by comparing the number of thermally anomalous pixels detected by S2 data with the Volcanic Radiative Power (VRP, in Watt) timeseries provided by the global MIROVA system [25], based on an MIR analysis of MODIS satellite images, at different worldwide volcanoes (Figure 1) during a period of almost four years, between January 2016–October 2019. More than 2200 S2 images were visually inspected in order to quantitively assess both the algorithm efficiency to sense thermal volcanic activity and the capacity to avoid false alerts, proving its reliability to be applied as a tool on a global scale. Hence, we explore the potential of the integration between moderate- and high-spatial-resolution images, providing exceptional constrains in terms of distribution, persistence and extent of hot targets, and, in turn, insights to better understand the thermal signals and the related volcanic source processes.
The algorithm represents a volcano-devoted enhancement adopting, as a starting point and solid reference, the HOTMAP detection method [43]. But it fully differs, since here the algorithm is developed applying spatial and statistical criteria, reaching an improved care to detect hot pixels on volcanic environments, especially when disturbing effects (i.e., clouds coverage, diffraction spikes, blurring and thermal halo) affect the detection precision and possibly induce to sense non-volcanic-related hot pixels. The algorithm we developed is specifically focused to detect the size (number of hot pixels) and location of volcanic hot thermal anomalies with high accuracy, in order to provide useful and reliable information about thermal signals related to ongoing volcanic activity. In this regard, we preferred to avoid calculation of pixel-integrated temperature or radiant fluxes, because the SWIR bands at a high spatial resolution (such as ASTER and OLI/LANDSAT-8 sensors) offer smaller pixels and a more sensitivity to detect hot magmatic features (200–1200 °C), and thus are often saturated over high-temperature targets (fires, volcanoes), since a hot surface constitutes a greater part of pixel footprint [21,48]. In fact, some previous works on fire detection, using SWIR wavelengths, reported common saturation issues, leading to counterfeit DN pixel values and artificial radiances conversions, thereby hindering accurate quantitative analyses [43,44,45].
This is one of the first works, even if embryonic, to specifically design a volcano thermal-detection algorithm. using S2 high-resolution imagery, tested on several different volcanic cases through a multi-year-long analysis. Moreover, it is the first attempt to compare the two different thermal signals derived from SENTINEL-2 MSI and MODIS sensors on volcanic environments. The algorithm was developed in order to be applicable for volcanic-monitoring purposes at a global scale and to be integrated into thermal space-based systems, such as MIROVA, and in multiparametric applications. In this respect, the algorithm here presented works operationally nowadays on MOUNTS (Monitoring Unrest from Space, http://www.mounts-project.com/home; [30]), a multiparametric monitoring satellite system combining SAR, UV and IR analysis, using SENTINEL constellation.
The final goal of this work is to demonstrate the validity of the here-proposed detection algorithm for the SENTINEL-2 high-resolution data (and possibly exportable on LANDSAT-8 imagery), with the aim to provide to the volcanological community—from single researcher to volcanic observatories and monitoring centers—a useful and solid tool to evaluate the presence and size of active hot spot, to detect possible volcanic precursor thermal signals, and to track the thermal and spatial evolution of active volcanic portions, such as single vents, fumaroles fields or lava bodies.

2. Products and Methods

2.1. SENTINEL-2 Products

The SENTINEL-2 mission consists of the two platforms, 2A and 2B, launched in June 2015 and March 2017, respectively, by the European Space Agency (Copernicus program). They are located at 786 km altitude and placed in the same sun-synchronous polar orbit at 180° from each other [49]. The Multispectral Instrument (MSI) onboard captures multispectral images at 13 different bands, spanning from visible (VIS) to short-wave infrared (SWIR) wavelengths, with spatial resolution of 10, 20 and 60 m (Table 1). The revisit time, considering both orbiting platforms, spans from 5 days at equator latitudes to 2–3 days at midlatitudes [50]. The SENTINEL-2 constellation provides coherence with LANDSAT-type image data, contributing to ongoing multispectral observation [50,51]. Here, we used the SENTINEL-2 Level-1C products, composed of 100 × 100 km2 tiles (or granules) orthorectified in UTM/WGS84 projection, where the radiometric data are furnished in Top of Atmosphere (TOA) reflectances (ρ), together with the conversion parameters for radiances calculation.

2.2. Data Access

SENTINEL-2 data are originally distributed by the ESA Copernicus Open Access Hub [52], and in the past years, other visualization and storage platforms came out, which can be of great help to whoever takes the first steps to manage satellite data. Amongst these, the cloud storage service of Amazon Web Service S3 (AWS-S3, [53]) hosts SENTINEL-2 data, which are added regularly, usually within few hours after they are available on Copernicus OpenHub. One of the advantages of this service (AWS-S3) consists in the possibility to download just single bands of interest, instead of the entire SENTINEL-2 L1C product, greatly reducing the amount of data to be downloaded for specific applications. By considering three bands with 20 m of resolution, as used by the here-proposed algorithm, this opportunity allows us to reduce the data volume from ~600 MB (full SENTINEL-2 Level-1C size) to that of the three downloaded bands (i.e., less than ~100 MB). Conversely, it is important to point out that, since summer 2018, this service has imposed a pay request for each download ($0.05–$0.09 per GB, [54]; roughly, less than $1 for a one-year thermal monitoring, using the three SWIR bands per volcano). After downloading the bands of interest in JPEG 2000 format and the supporting metadata files (Granule_Metadata_File and Product_Level_Metadata containing respectively the geometric/satellite and sensing data), granules products are cropped in a mask of 10 km size (501 × 501 pixel), centered on the coordinates of each volcano summit of interest. For consistency with the MIROVA system (see [25]), we used the Global Volcanism Program volcano database [55] as a reference for both volcano names and coordinates.

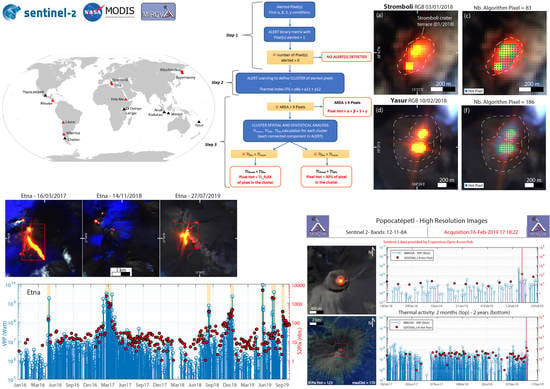
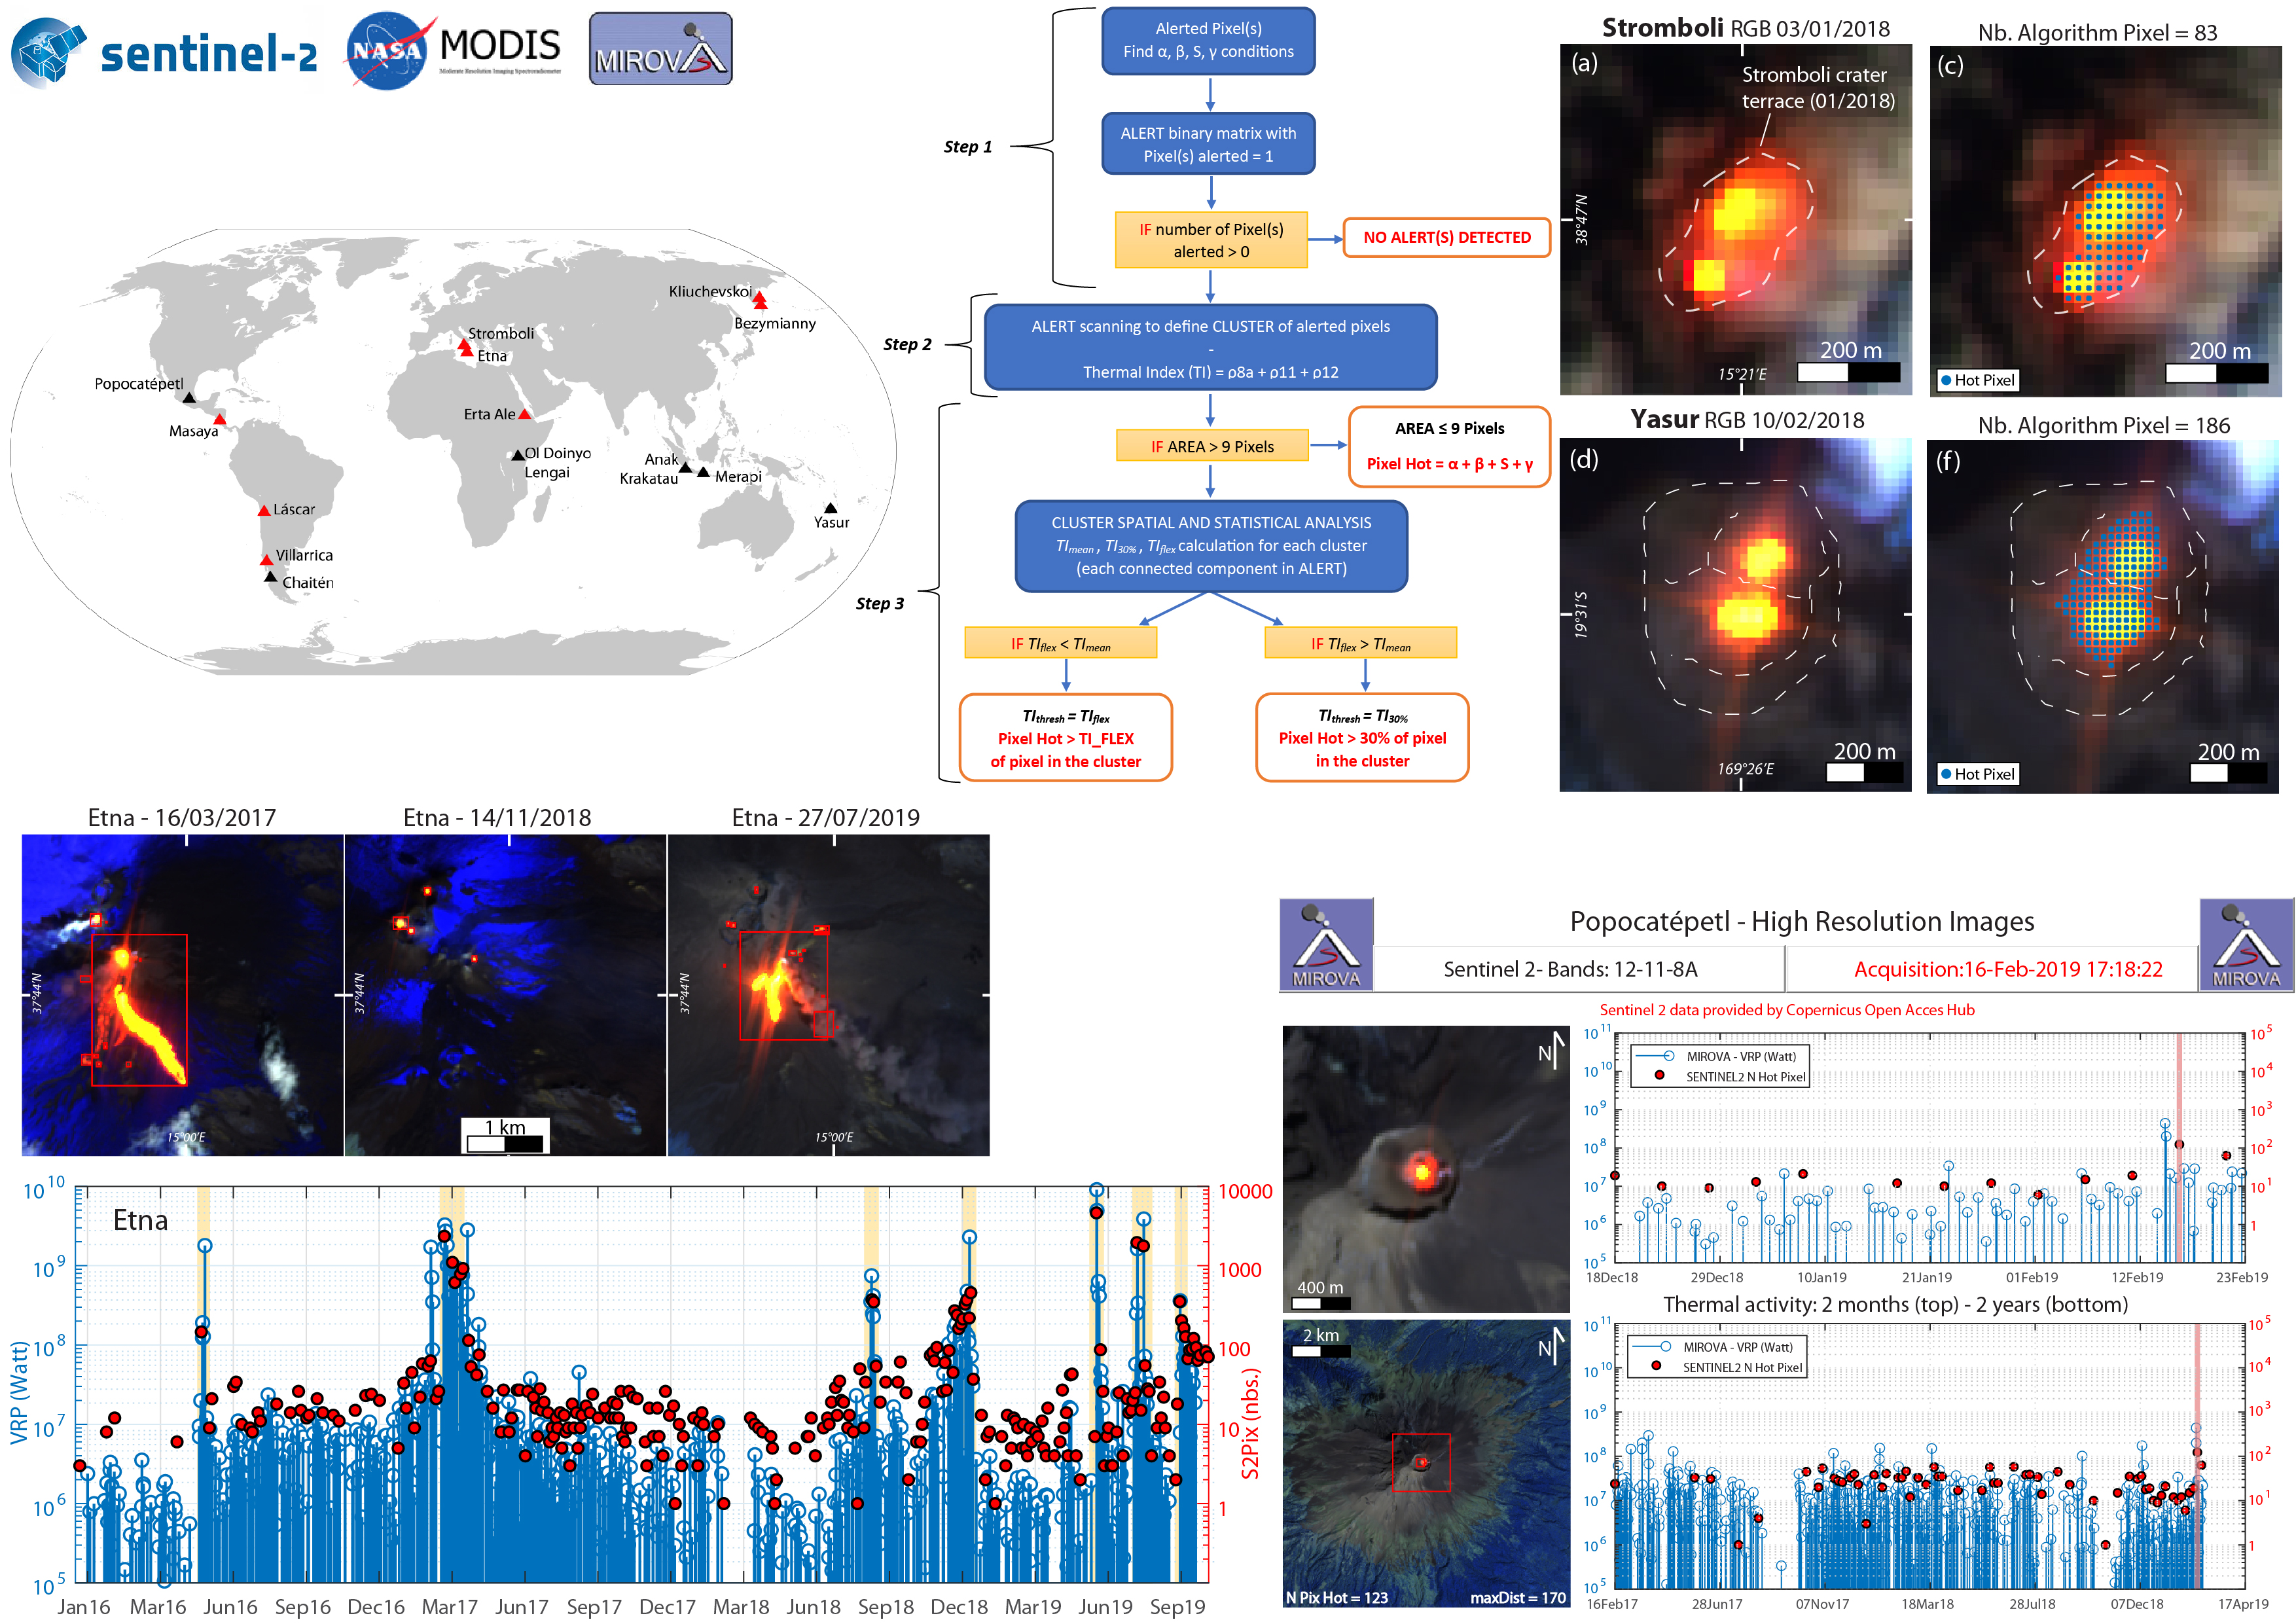
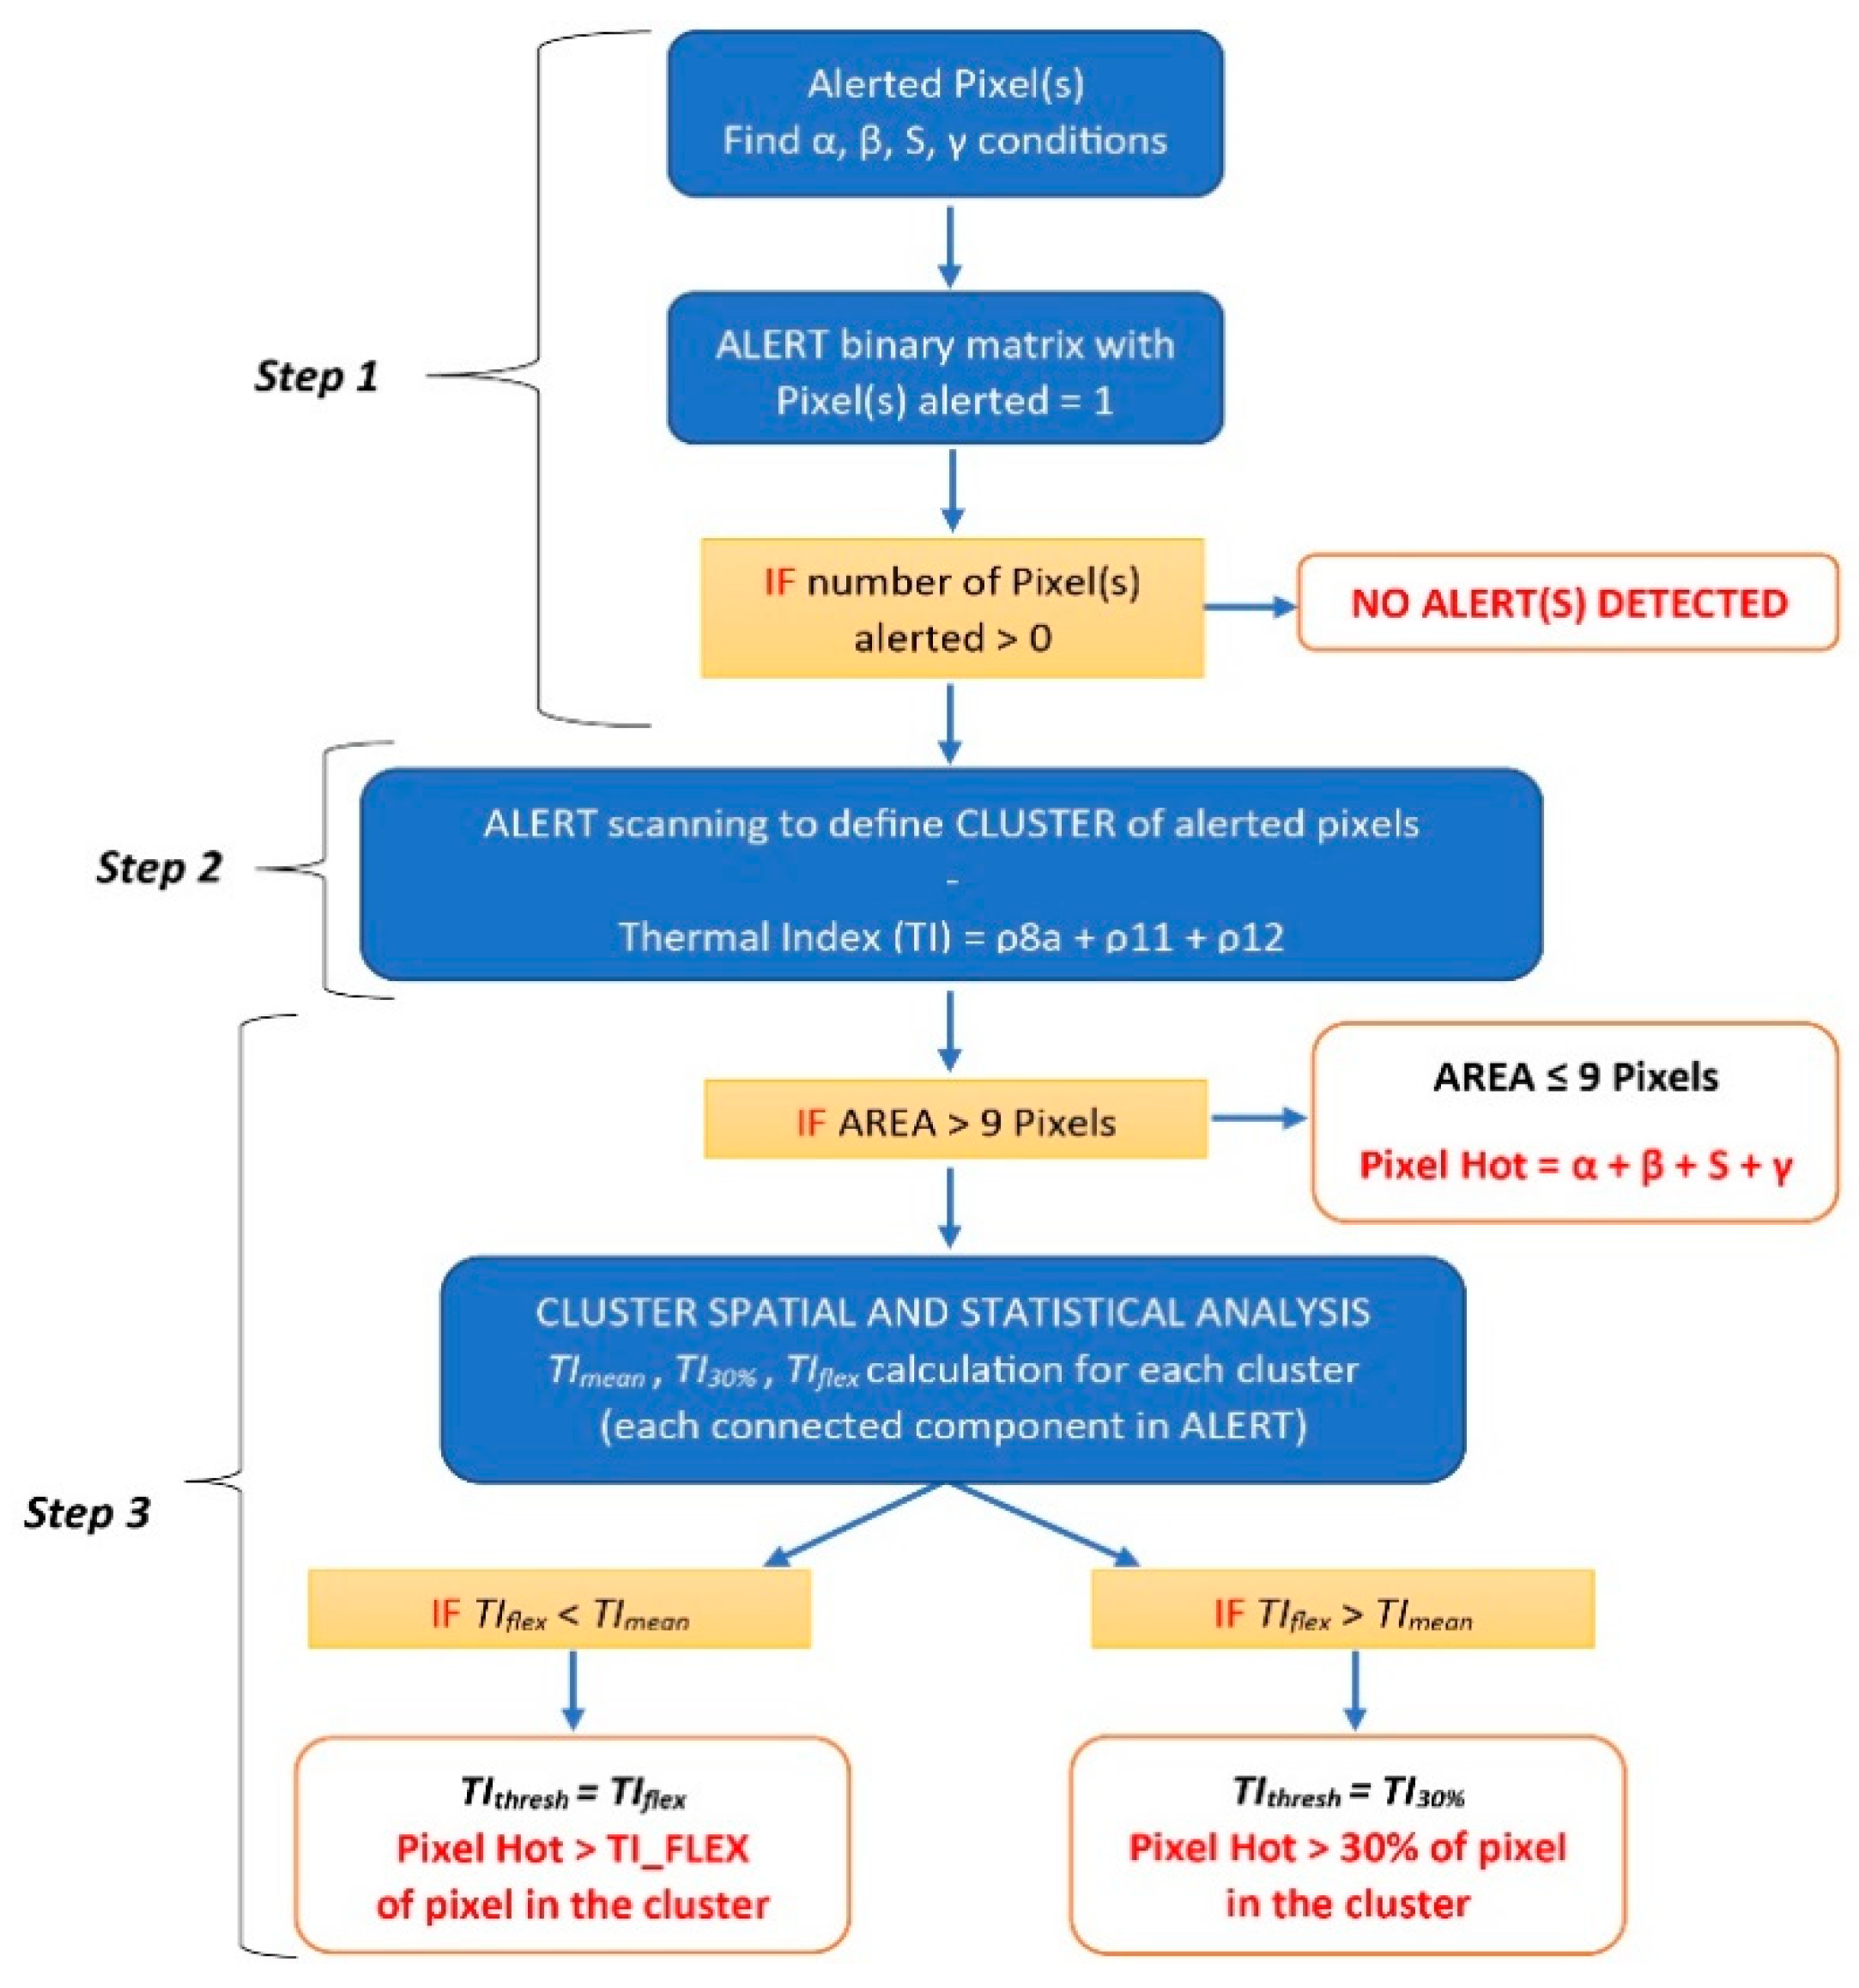
2.3. Hot-Spot Algorithm

According to several authors [43,44,45,46], for the hot-spot detection during daytime, SWIR reflectances are preferred to radiances because (i) they are normalized to the incoming solar radiation, reducing the effects of Earth–sun–satellite geometry; and (ii) they allow for better compatibility between different satellite sensors (SENTINEL-2 MSI and LANDSAT-8 OLI, mainly), making the algorithm easily exportable to other sensors [43]. The presented algorithm is based on the analysis on the TOA reflectances of three bands in the SWIR regions, ρ8a (865 nm), ρ11 (1610 nm) and ρ12 (2190 nm), all having a 20 m pixel size resolution (Figure 2). These bands are chosen because the nearest to higher wavelengths and falling in the SWIR region, extremely sensitive to radiations from very hot surfaces (e.g., fires and fresh lava; [21]). In addition, the selected S2 bands are the equivalent of bands 7-6-5 OLI LANDSAT-8 sensor, previously used for fires detection [43,44,45]. The algorithm is essentially divided into three main steps focused in detecting all the hot-spot-contaminated pixels present in the analyzed image (Figure 3). In the first step, a series of logical test is used to identify pixels potentially contaminated by hot spots. The second step calculates a Thermal Index (hereby considered a proxy of the pixel integrated temperature) for each alerted pixel and group the adjacent pixels into distinct clusters. In the third step, each cluster is analyzed spatially and statistically in order to reduce effects of thermal halo, diffractions spikes or “blurring” (adjacency effects, i.e., the scattering of light reflected from the nearby land into the sensor’s field of view, due to contrast between a target pixel and its neighborhood; [56]).

2.3.1. Step 1: Spectral Principles

This initial step is an implementation of the Hotmap algorithm [44], developed to detect hot-spot-contaminated pixels within OLI-LANDSAT 8 daytime images.
Accordingly, hot-spot-contaminated pixels are individuated by using reflectance ratios and single-band thresholds grouped to define four distinct logical tests, named α, β, S and γ:
α = [ ( ( ρ 12 ρ 11 ) 1.4 ) & ( ( ρ 12 ρ 8 a ) 1.2 ) & ( ρ 12 0.15 ) ]
β = { [ ( ( ρ 11 ρ 8 a ) 2 ) & ( ρ 11 0.5 ) & ( ρ 12 0.5 ) ] }
S = { [ ( ρ 12 1.2 ) & ( ρ 8 a 1 ) ] o r [ ( ρ 11 1.5 ) & ( ρ 8 a 1 ) ] }
γ = { ( ρ 12 1 ) & ( ρ 11 1 ) & ( ρ 8 a 0.5 ) } & ( surrounded   by   α   o r   β )
A pixel fulfilling at least one of these tests is flagged as hot-spot-contaminated and is taken into account during the further steps.
In this procedure, we keep the original Hotmap approach, where tests α and β are designed to (i) reveal very few false alarms and detect at least one hot “warm” pixel (α condition), and (ii) identify “hot” pixels (β condition). However, we modified the band ratios’ thresholds in order to better avoid false alarms over highly reflective surfaces (i.e., clouds and dry soils): parameters α and β are structured in a first-ratio portion (ρ12 must be 40% and 20% greater than ρ11 and ρ8a for α, respectively; ρ11 twofold of ρ8a for β) and in minimal conditions in the three bands, to avoid too-low reflectances in bands 12, 11 and 8a.
In addition, we added two other conditions which allow us to consider pixels having α and/or β corrupted by saturation of bands 12 and 11 (S condition), as well as very reflective pixels (γ condition), surrounded by other alerted pixels (satisfying α and β). The thresholds for S test condition represent the saturation values, retrieved empirically by analyzing the limits of reflectance values for the SWIR bands in different volcanic thermal active bodies. The γ condition triggers just the very hot detected pixels, which are placed into an area surrounded by α and β parameters; this is necessary to detect pixels located in the inner part of very-high-radiance-emitting events (such as large lava flows or very thermally active lava lakes) otherwise discarded by the previous tests. It should be noted that some single-band thresholds in condition S and γ are higher than 1: this condition is necessary since specular effect on land surface and clouds can lead to reflectance values of S2 higher than 1 [51]. The spectral thresholds proposed for Step 1 are derived by using an empirical approach, starting with those band ratios proposed by previous hot-spot-detection systems [43] and testing on different volcanic cases (as shown later) the best achievable combination both to avoid non-volcanic false alarms and to detect low thermal anomalies. The output of Step 1 is thus a logical matrix named ALERT (composed by 0 and 1), having the same dimension of the S2 cropped image (501 × 501 pixel), and containing all the pixels classified as alerted (with value = 1). If the ALERT matrix is composed only by zeros, no alerted pixels are founded.

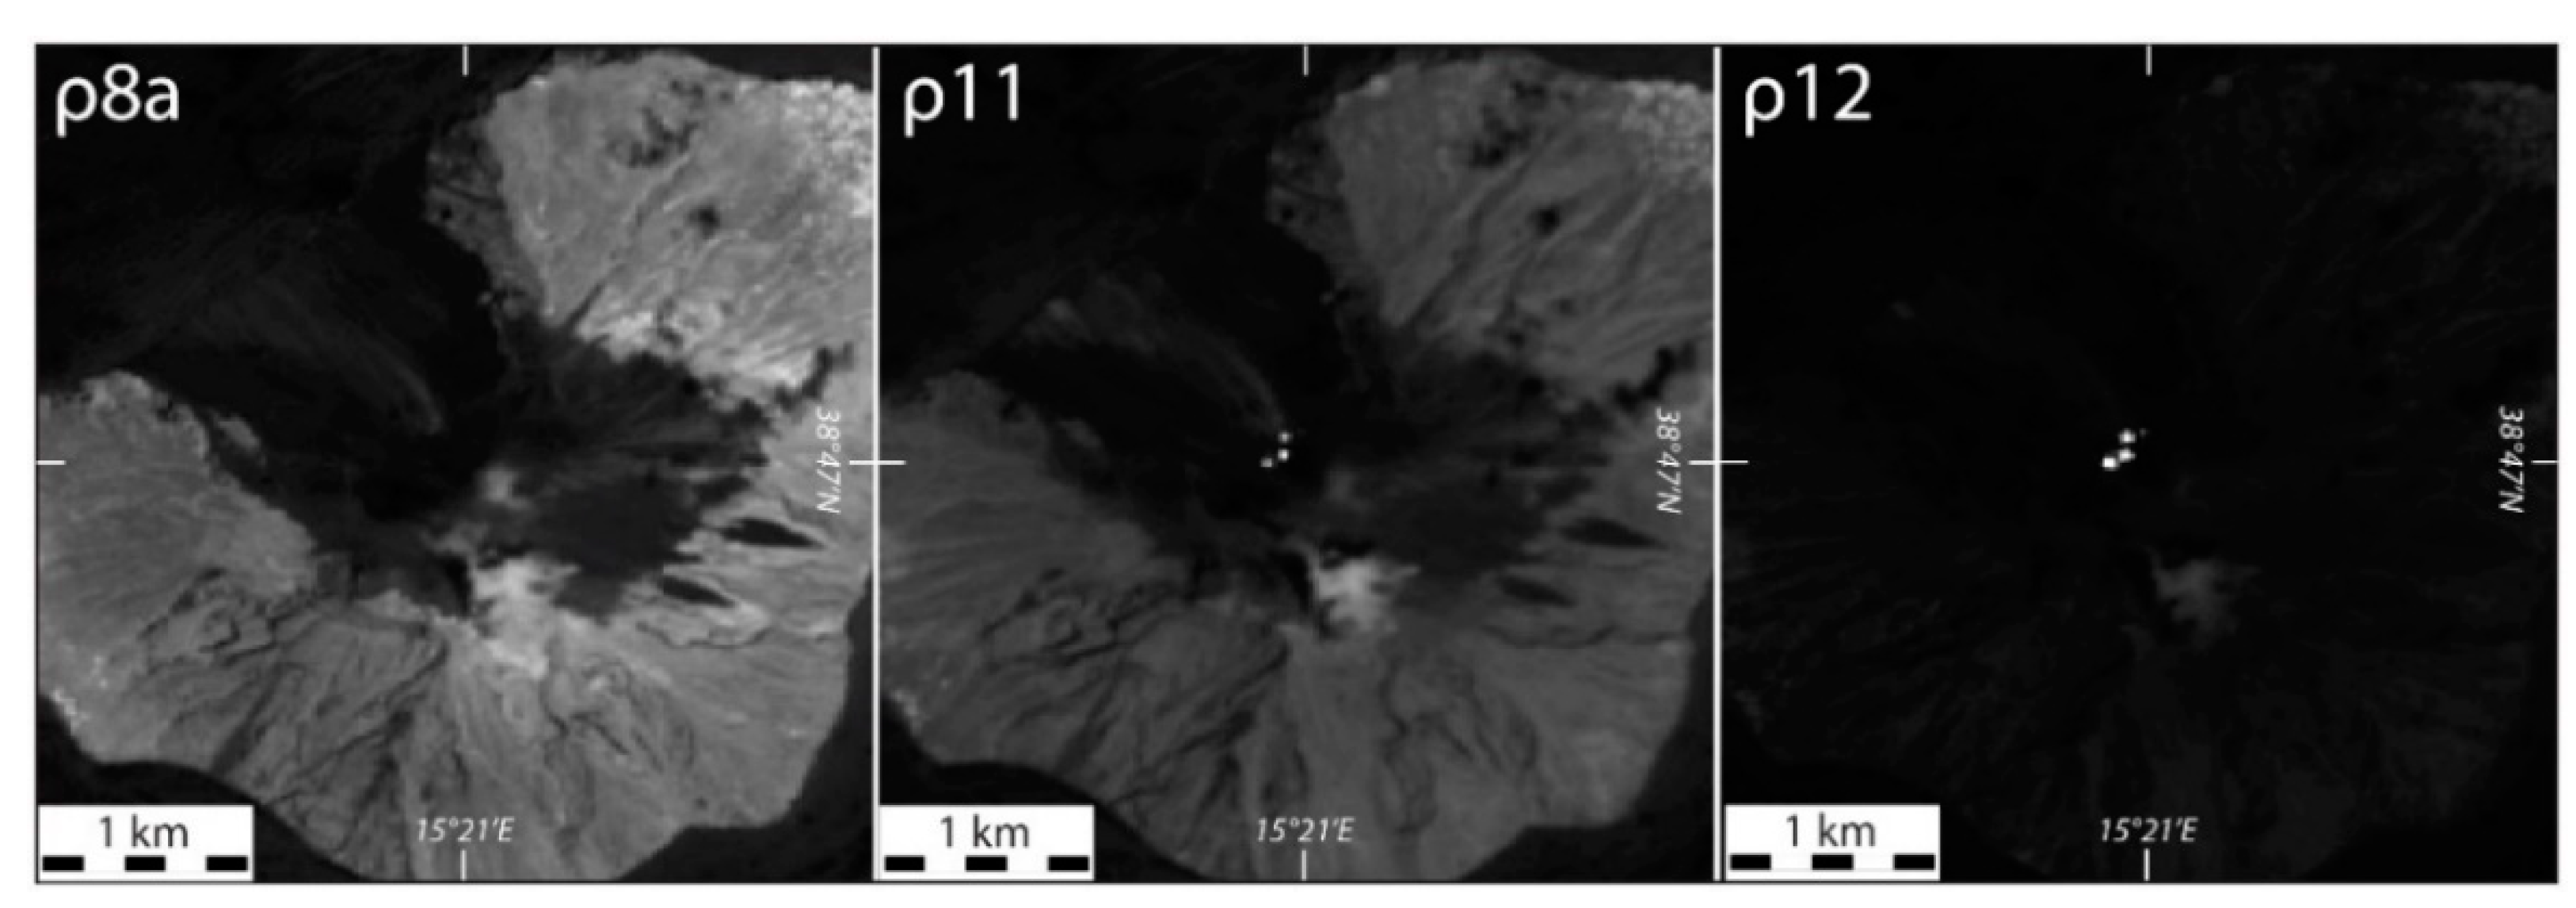
2.3.2. Step 2: Thermal Index

The ALERT mask is scanned in order to group all adjacent pixels potentially alerted into distinct clusters, identified as each connected component in the binary image. As explained above, it is not practical to use the spectral radiances to accurately calculate the area or integrated temperature the sub-pixel hot emitter because, over volcanic targets, the bands 12 and 11 are often saturated. For this reason, in this work, we introduced an empirical Thermal Index (TI), defined as the sum of the reflectance recorded in bands 8, 11 and 12:
Thermal   Index ( TI ) = ρ 8 a + ρ 11 + ρ 12
Here, the TI is considered to be a proxy for the pixel integrated temperature, based on the assumption that increasing the size or temperature of the sub-pixels’ hot target will produce an increase in the reflectance values and hence in the TI. This Thermal Index is calculated for all the pixels alerted during Step 1. Each cluster is then analyzed separately from the others during the Step 3.

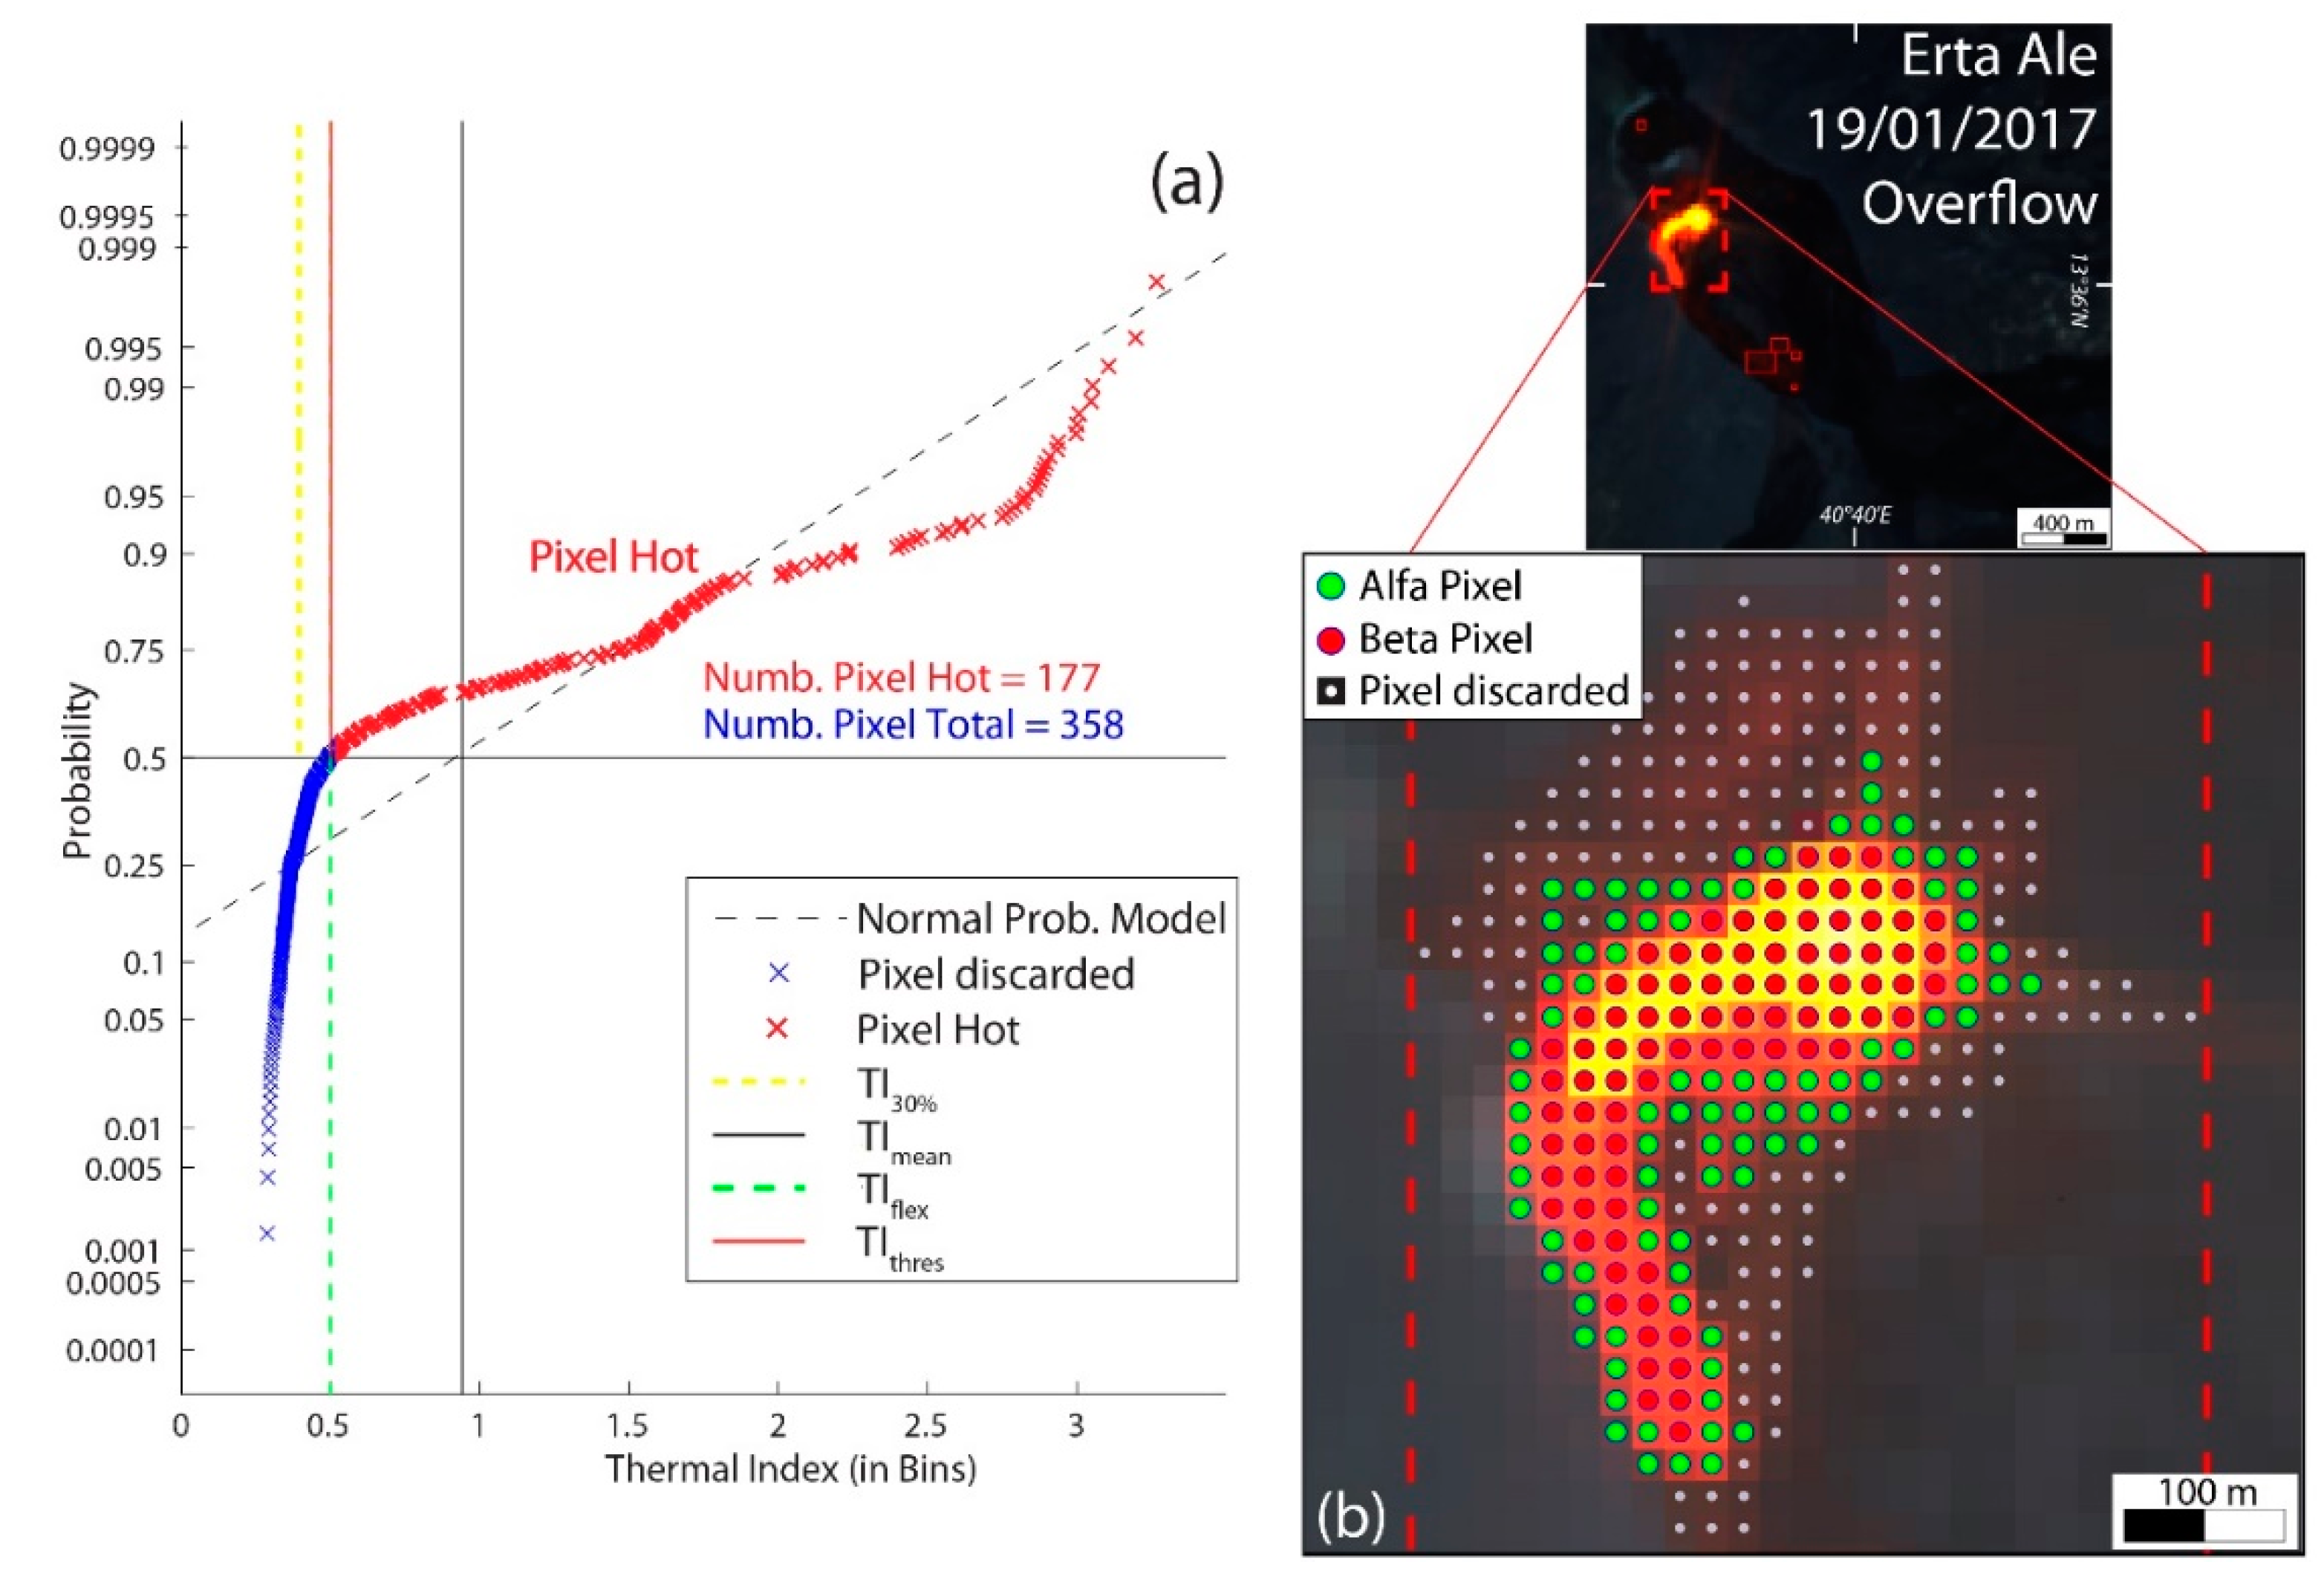
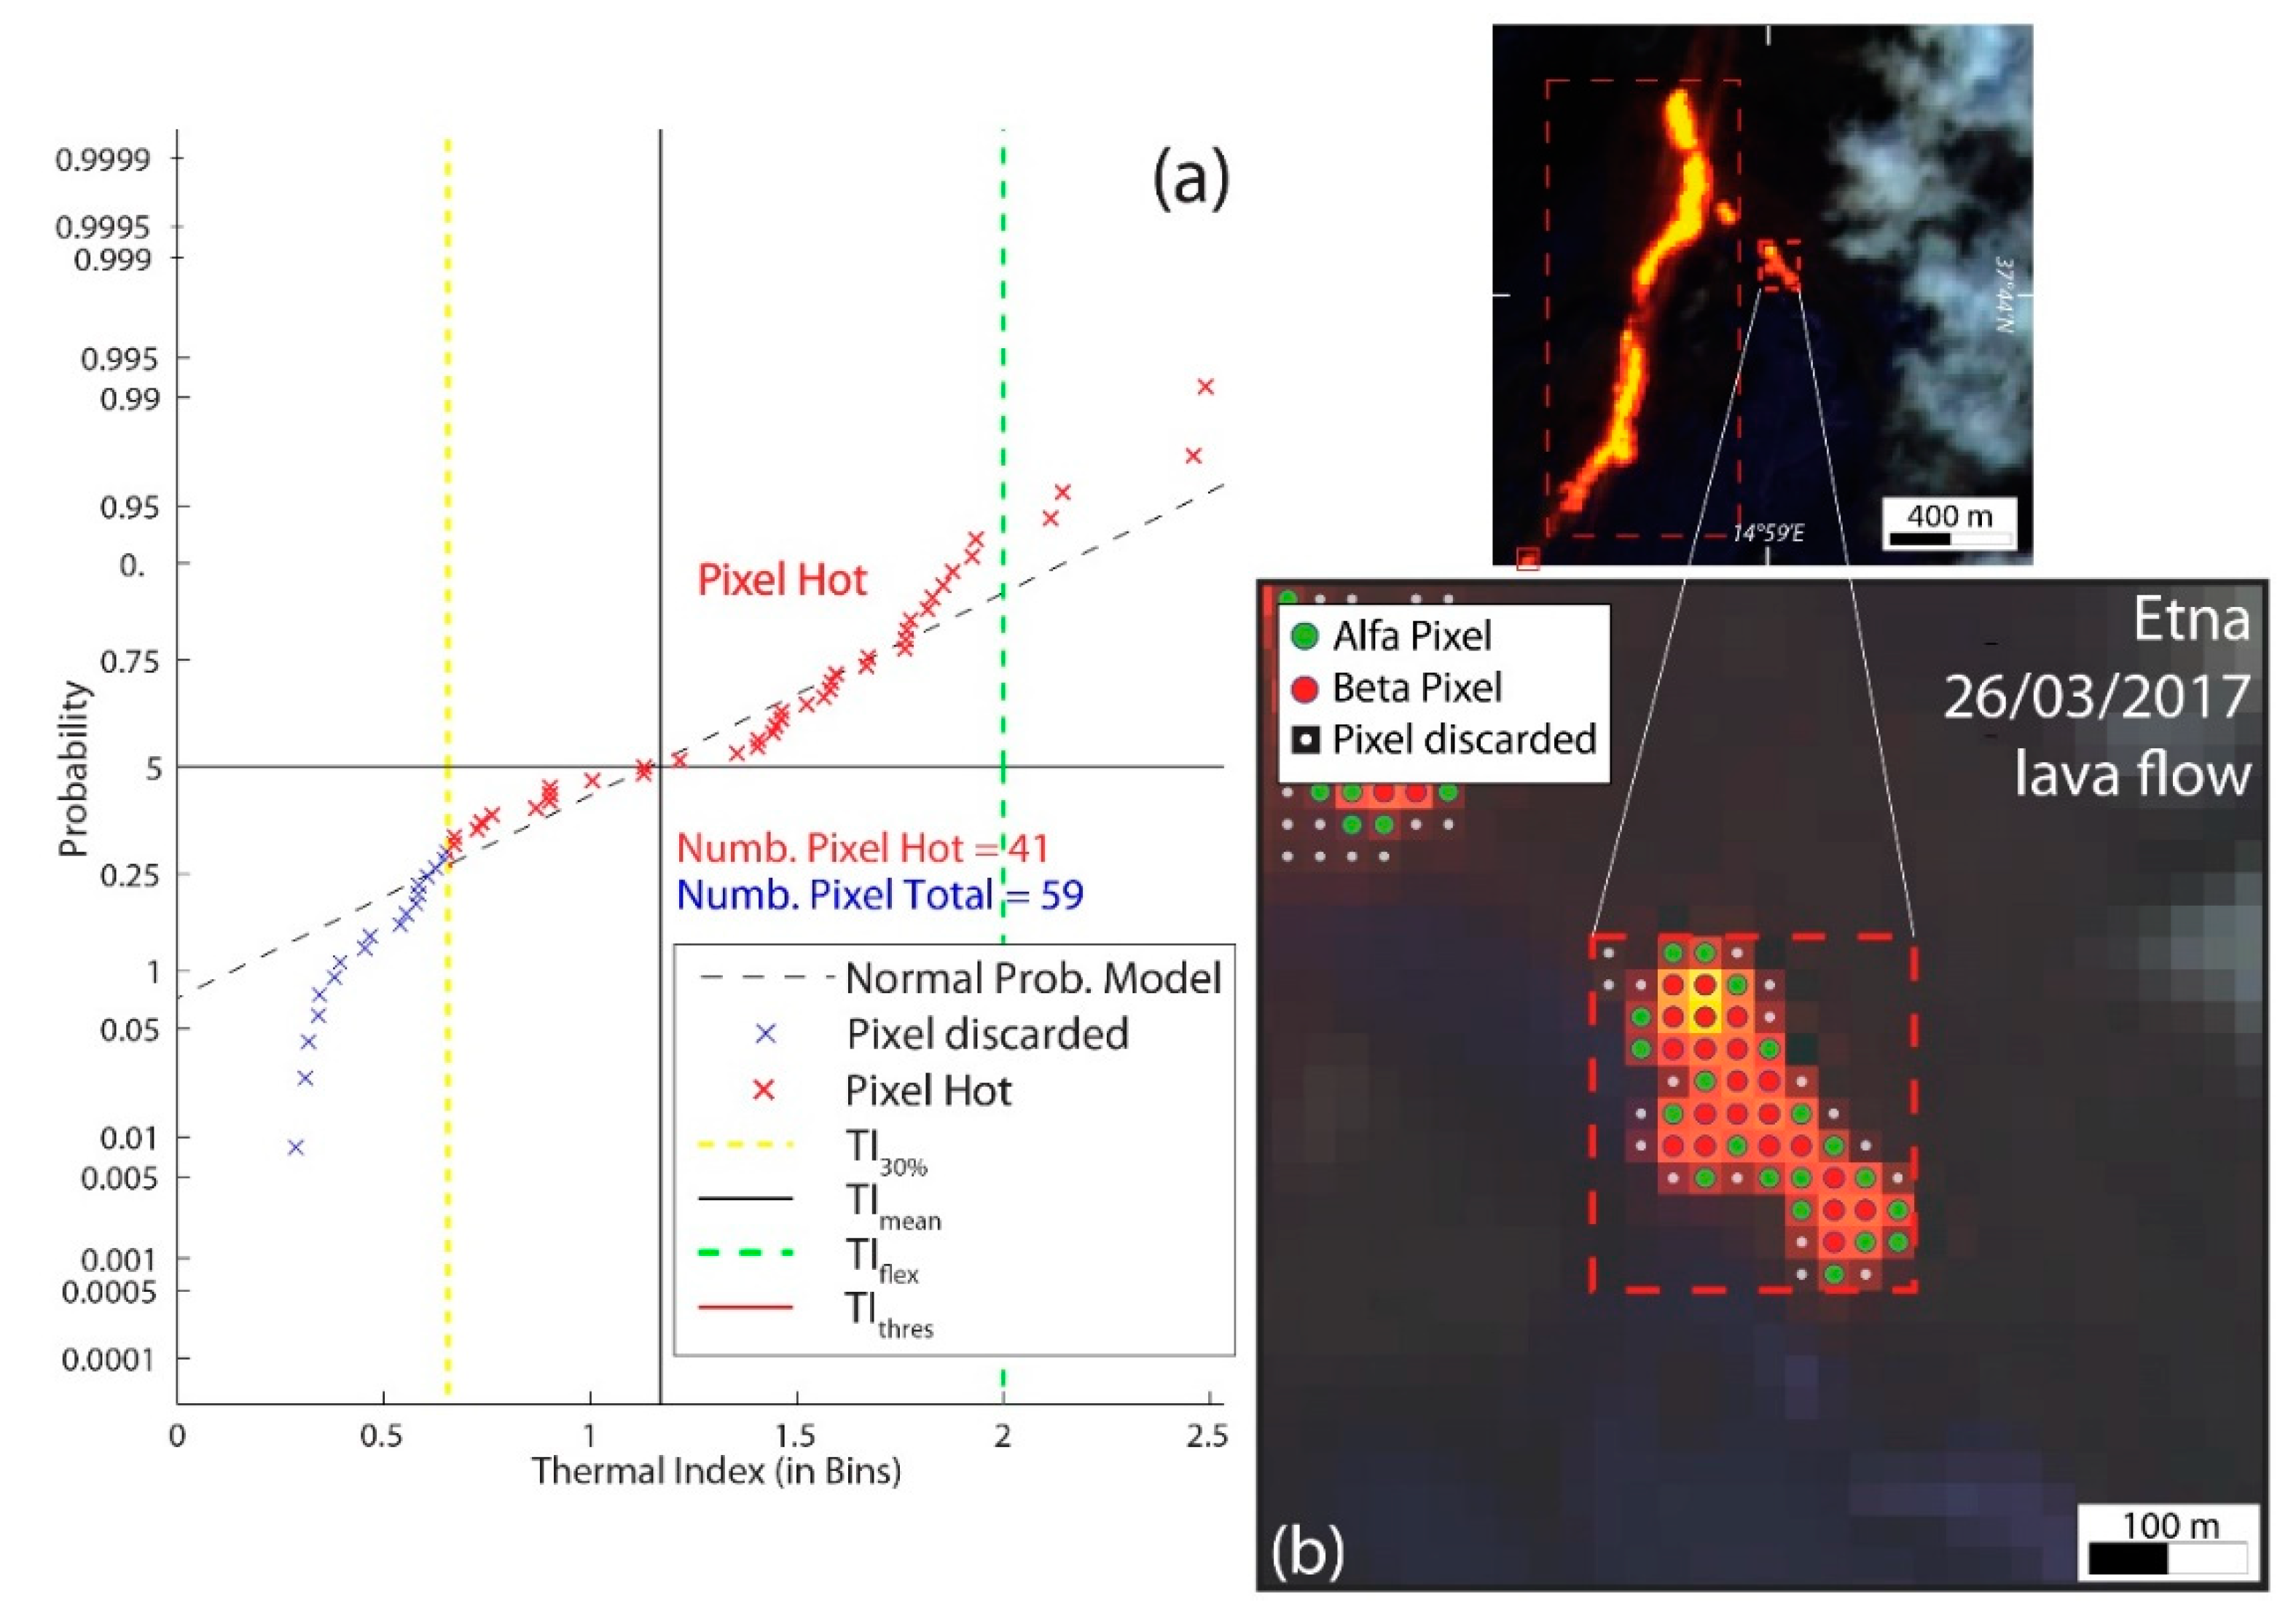
2.3.3. Step 3: Spatial and Statistical Principles

Step 3 consists in the spatial and statistical analysis of TI values, applied to each cluster identified in Step 2 (see scheme in Figure 2). The aim of this step is to remove, or at least reduce, the number of alerted pixels caused by “blurring”, diffraction spikes and/or halo effects, which in some cases distort the effective spatial pattern of the anomaly and cause an evident increase in the size of the alerted clusters (i.e., excess of hot area, which may occur in presence of clouds or large thermal anomalies), especially in case of intense thermal anomalies.
Due to their small size, all clusters composed by less or equal than 9 pixels (3×3 box) are considered unaffected by the above-described effects and are immediately classified as hot-spot-contaminated, independently on the TI values. This condition allows us to detect and keep unchanged small-size thermal anomalies associated to hot degassing cracks or eventually occurring at the beginning of a renovated volcanic activity phase (i.e., Figure 4a–d). For instances, fumaroles at Chaitén lava dome (Chile, [57]) are perfectly localized by our algorithm, which detect several small (< 9 pixels) clusters composed by α-triggered warm pixels only (Figure 4 a,b). Instead, glowing inside the main vent of Anak Krakatau Island (Indonesia, [58]) triggered a central hot pixel (β condition) and a surrounding perimeter of eight warm pixels (α condition), related to a new Strombolian activity producing incandescence and grey plumes at the beginning of the eruptive phase culminating with the December 2018 island flank collapse (Figure 4c,d; see [59]). These cases definitively reveal the meaning of the 9 pixels threshold, working as a minimal criterion to detect thermal signals produced by a very hot and localized source, with a hotter core extending heat in the nearby area of at least of eight pixels. As discussed later, this feature proves to be extremely useful to detect volcanic precursor thermal signals and/or weak but persistent hot spots.
If the cluster is composed of more than 9 pixels, the algorithm applies an investigation of the frequency distribution of TI values (see flow chart in Figure 3, Figure 5a and Figure 6a). In particular, it calculates the arithmetic mean of TI (TImean), the 30th percentile of TI (TI30%), and recognizes the value of max departure of the observed distribution from the normal one (TIflex), for each cluster. The frequency distribution plot of the Thermal Index allows us to observe how the different pixels are thermally distributed and where the observed distribution diverges from the theoretical normal one (Figure 5a and Figure 6a). The purpose of this step is to automatically recognize the lower tail of the observed thermal distribution, by defining a “flex” threshold where the distribution of hottest pixels in the cluster moves from the less hot pixels. This analysis allows us to automatically recognize the colder pixels in the lower tail of the TI distribution, which we ascribe to the thermal halo or “blurring effects” surrounding the real hot spots. These pixels are detected by defining a contextual TI threshold (TIthres), which varies from cluster to cluster, depending on the analyzed TI distribution and according to the following conditions:
TIthresh = TIflex  (for TIflex < TImean)
TIthresh = TI30%   (for TIflex > TImean)
where TIflex is the TI value exhibiting the largest difference between the observed and the theoretical normal distribution (Figure 5a).
We define the two conditions expressed in Equations (6) and (7), because the clear presence of a single sharp flex in the distribution of a thermal cluster able to cut the lower emitting pixels is not unequivocal in all cases. This could be mainly due to a limited extension of the hot body, which may bring to a complex thermal distribution with different potential “flexes” (Figure 6), or to a masking effects of thermal anomalous region by clouds/plume presence. Indeed, the process could lead to the definition of a too-high thermal flex, which does not differentiate the lower tail but the higher one (see Figure 6a). In these cases, where the TIflex > TImean (Equation (7)) in the cluster (green dotted line and black line respectively in Figure 6a), we choose a conservative and fixed solution, setting TIthresh at the 30th percentile of thermal distribution (TI30%, yellow dotted line in Figure 6a). This threshold is set empirically because we observed in lots of thermal distribution cases, particularly those related to limited extended lava bodies, that the 30% simulates a good fitting cut in the divergency between the lower tail and the normal theoretical distribution (cross between blue pixels distribution and the normal theoretical distribution black dotted line Figure 6a).
The benefit of the frequency distribution analysis is that it does not act as a single threshold over the entire image, but works with a contextual filter based on the thermal distribution of each cluster itself. This means that, for instance, the threshold value for a high thermal anomaly produced by a widespread lava flow will not be the same as the one related to a breakout over an active lava-tube, to hot-degassing fumaroles fields or to hot materials at the surface of a growing lava dome. The discarding process of lower anomalous pixels based on the flex definition cuts the colder boundaries surrounding the hotter core and defines a more-fitting shape of thermal anomalies, as shown in Figure 5b and Figure 6b (where white represents the alerted pixels discarded; green and red are the α-triggered and β-triggered conditions pixels, respectively).
The differentiated-steps procedure described above was designed to work on a wide spectrum of volcanic activity, from hot fumaroles to lava domes, lava flows and lava lake. It has a high sensitivity to low, small thermal anomalies, which is extremely useful to detect both volcanic precursor signals and/or weak persistent hot spots. It is also able to effectively isolate the hottest pixels in wider clusters, discarding anomalous pixels alerted by thermal halo or clouds refraction effects.
In this regard, Figure 7 displays two explicit cases to show how the algorithm works overall and its potential for volcanological purposes.
A small-sized light-brown plume, probably of volcanic origin, overlays the anomalies triggered by summit strombolian activity at Stromboli volcano [62] during January 2018. The presence of this semitransparent cloud affects the thermal detection, because it produces a halo effect, expanding the possible hot-spotted pixels (Figure 7a). The contextual algorithm here proposed recognizes a clear TIflex in the thermal distribution of the cluster and excludes all pixels interested by cloud reflections, thus precisely isolating the hottest portion of the cluster, mainly colored with yellow to orange and bright red tones (Figure 7c). Figure 7b shows the performance of the Hotmap algorithm [43], which overestimates by about 4 times the hot area detected by our algorithm (Figure 7c).
The strong thermal anomalies occurring over the Yasur’s pyroclastic cone [63], composed by two distinct active vents, indicate a sustained strombolian activity or spatter producing incandescent bombs as far as the crater rim, underscoring the hazardous nature of get closer to the volcano summit (Figure 7d). The extremely powerful heat-release affects the MSI sensor and induces it to produce a “cross-shaped” thermal effect, called diffraction spikes, with four arms radiating from the bright volcanic sources in the SENTINEL-2 image. We noticed that these artifacts occurred commonly in very energetic and saturating thermal anomalies. As we can see in Figure 7e,f, the here-proposed contextual algorithm, compared to Hotmap algorithm, reduces the number of hot pixels related to these diffraction wings, detecting hot materials just into the two crater areas. Therefore, the concurrence of both spatial and statistical filters (Step 3 in the algorithm) particularly allowed to exclude hot-spot pixels not directly related to the volcanic hot spot (i.e., clouds coverage) or triggered by instrument optics effects combined to intense thermal emissions (i.e., diffraction spikes). This enhancement is extremely relevant for monitoring purposes, particularly for automated system applications, since pixels affected by halo effects might have been wrongly interpreted as hot materials emplacing outside the summit crater terrace of Stromboli or the Yasur crater rim, with relevant implications for hazard assessment.

3. Results

The reliability of the algorithm described above was tested on several different volcanoes, first by quantitively evaluating the algorithm performance to detect thermal anomalies and to avoid false alerts, and then by comparing the number of hot pixels detected by the algorithm with MODIS-derived radiant-heat-flux timeseries. Here, we present the results of these analysis.
We investigated eight volcanoes case studies, located in very different geographic contexts and characterized by four exemplary end-members volcanic heat sources: lava flows, lava lake, lava domes and open-vents. The eight case studies are examined from the 1st January 2016 to 1st October 2019 timespan: Kliuchevskoi (Kamchatka peninsula, Russia; [64]) and Etna (Sicily island, Italy; [61]) for lava-flow activity, Erta Ale (Afar region, Ethiopia; [60]) and Masaya (Nicaragua; [65]) for lava-lake activity, Stromboli (Sicily island, Italy; [62]) and Villarrica (Chile; [66]) for open-vent activity in low-viscosity systems, and Bezymianny (Kamchatka peninsula, Russia; [67]) and Láscar (Chile; [68]) as lava-dome type with high-viscosity lavas extruded (cf. with Figure 1). The algorithm is therefore tested on a wide variety of volcanic systems, in order to assess its performance and limits in detecting various thermal sources. Because the chosen volcanoes show persistent but variable activity, we tested the reliability of this latter on detecting transitions between different eruptive styles over time. Regardless, geographical locations of the volcanoes are variable (Figure 1), with diverse contributions of weather conditions and cloud-coverage effects.

3.1. S2 Algorithm Evaluation

The hot-spot-detection algorithm has the main aim to detect the most of thermal anomalies produced by volcanic activity, by minimizing errors related to false alerts, which is crucial to performing operationally over a global scale. To define when a pixel is volcanologically alerted or not is not a univocal concept [43], and this kind of analysis brings a certain degree of subjectivity and relativity. In this section, we present the performance of the proposed S2 algorithm based on the visual inspection all the SENTINEL-2 images, for a total of 2.211 products, acquired during the January 2016 to October 2019 period, over the abovementioned eight volcanic case studies.
According to our visual inspection, we classify all the “alerting conditions” in the following ways:
(i)
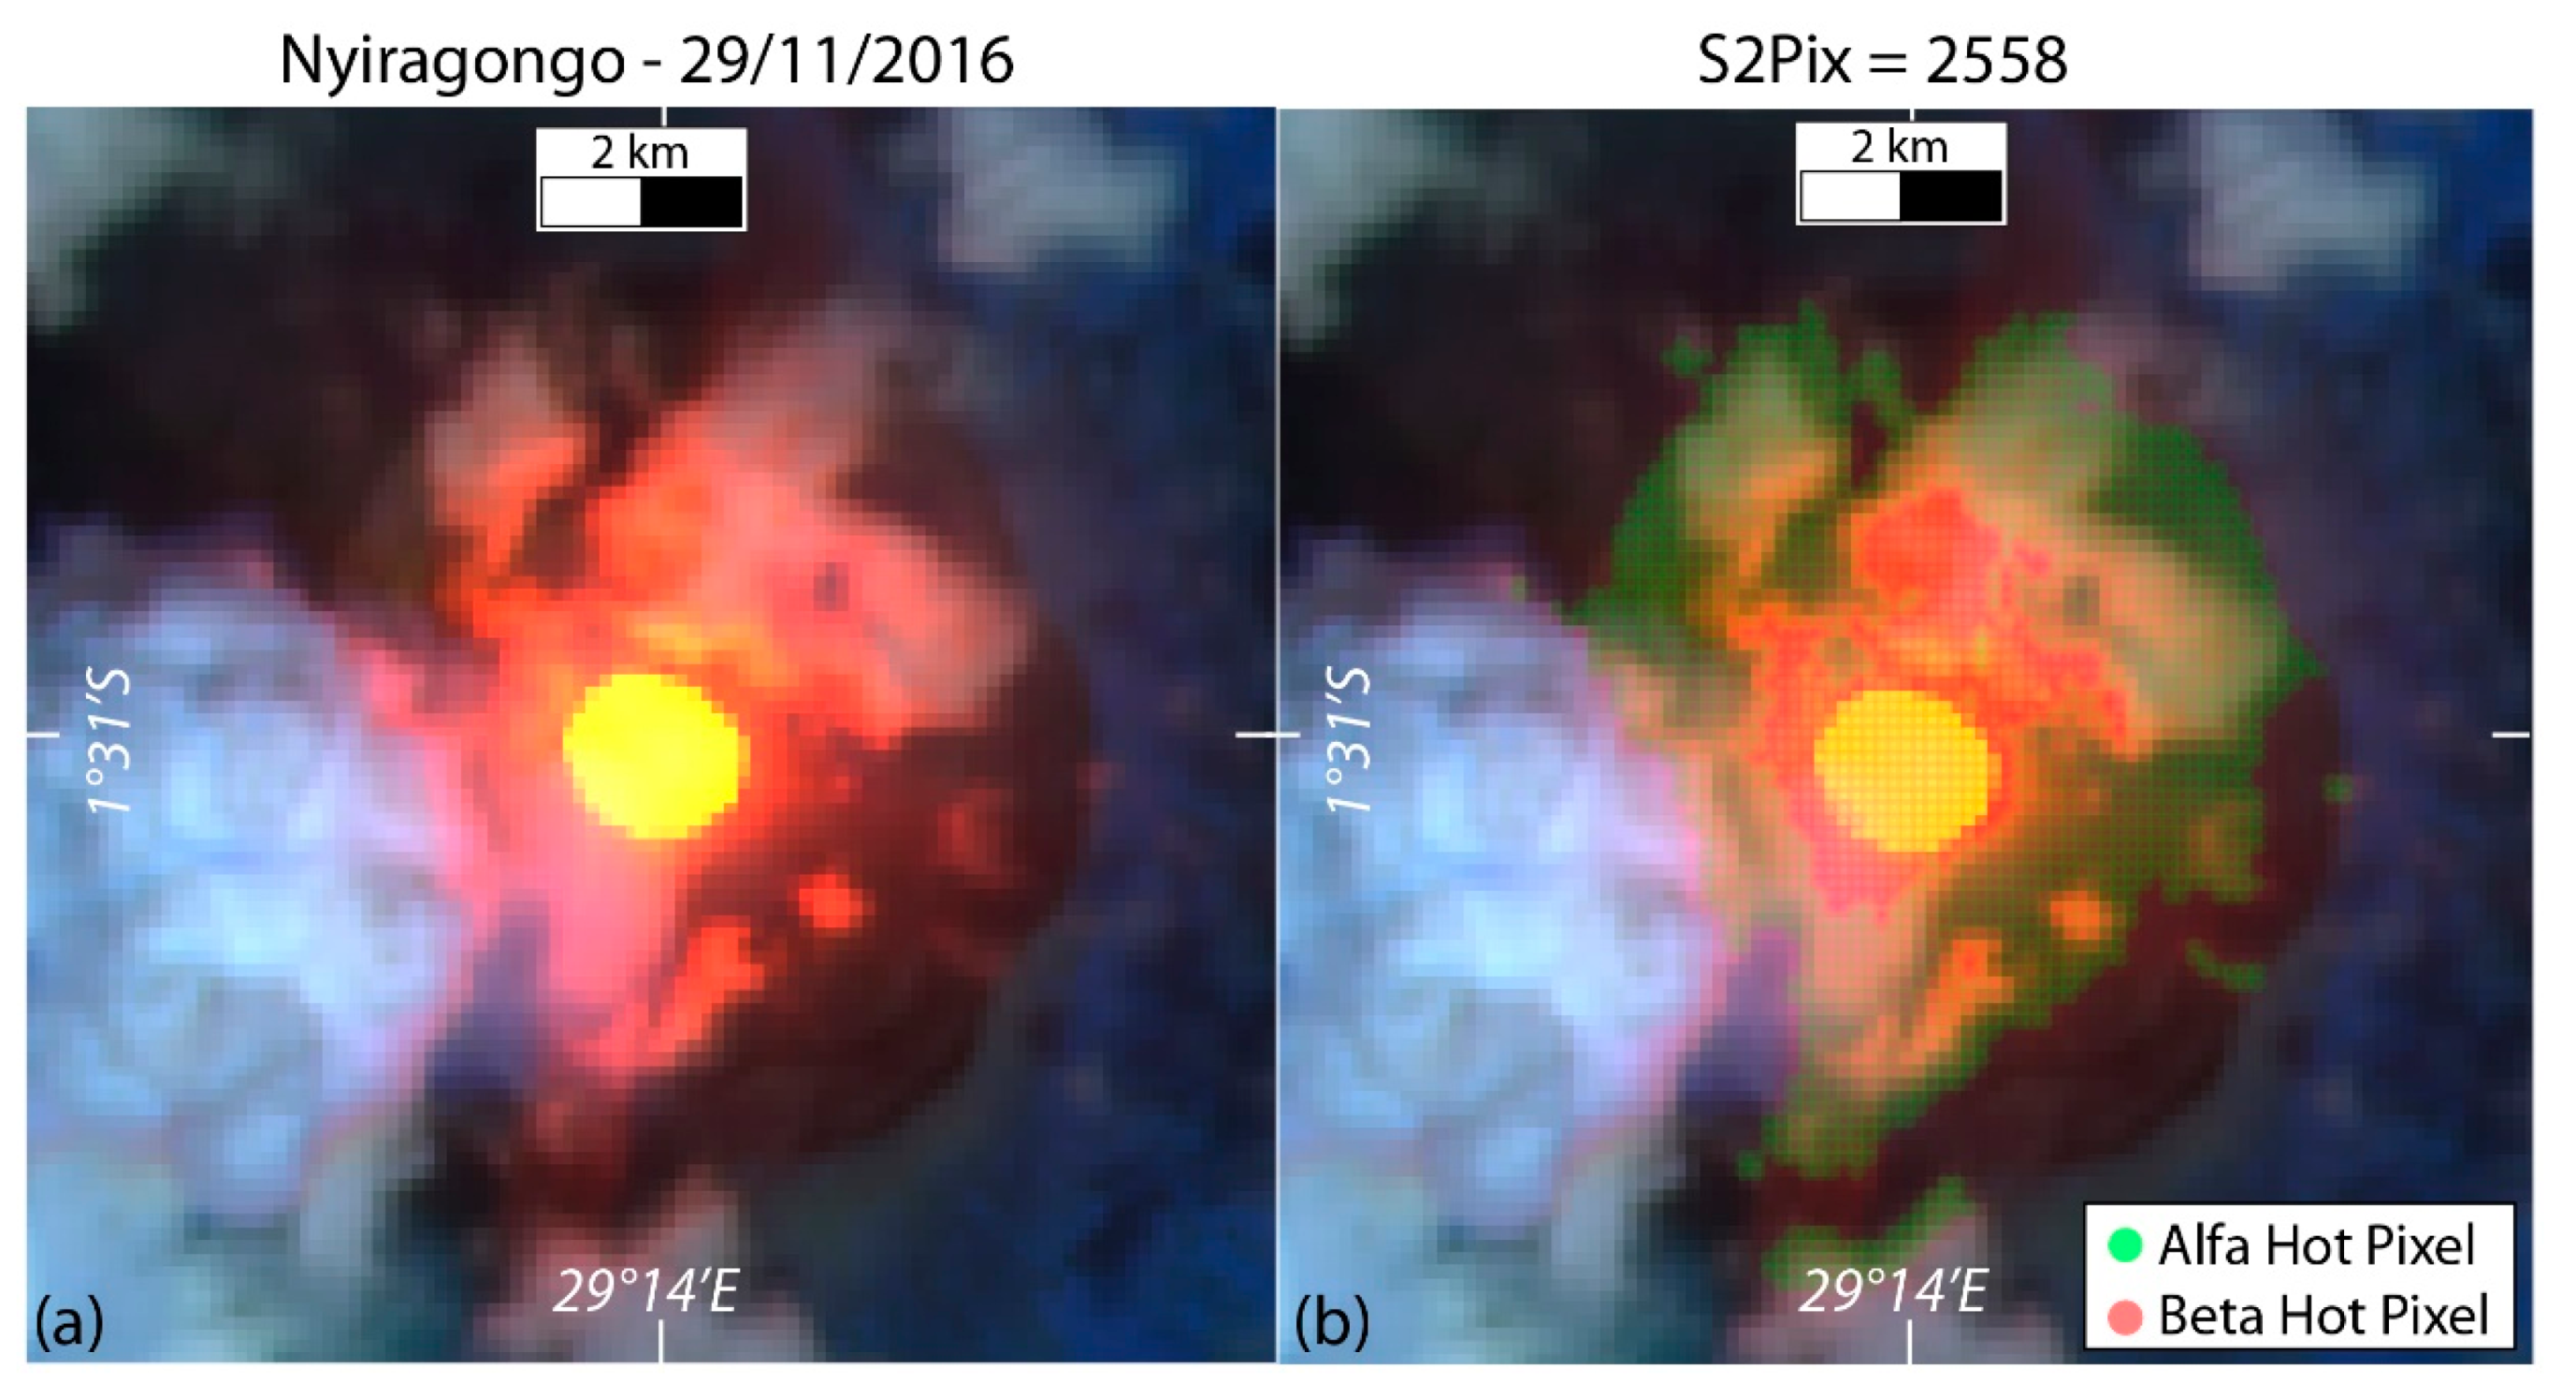
True volcanic alert: a pixel anomaly detected by the algorithm which is expressly and visually related to volcanic activity (hot degassing, lava body exposed, hot eruptive materials exposed and possibly confirmed by literature or consistent with the background knowledge of volcano activity) and that shows a visible thermal glowing (from dark-red to bright-white in color);
(ii)
Fires or anthropogenic alert: a pixel anomaly detected by the algorithm expressly and visually related to wildfire occurrence and/or located near of human-settled areas (usually these latter anomalies could be far from the source of volcanic activity, show dark-red tonalities and have a very small areal extent of 1–2 pixels);
(iii)
False alert: a pixel anomaly detected by the algorithm, visually related to cloud coverage, secondary cloud fringes and reflections effects over hot sources (also volcanic), blurring, high-reflectivity effects of land/sea surfaces;
(iv)
S2-MSI-derived false alert: a pixel anomaly detected by the algorithm and visually triggered by abnormal colored pixels related to stripe artifacts of the MSI sensor.
Notably, one “alerting condition”, as defined above, cannot exclude the occurrence in the same S2 image of one or more others “alerting condition(s)”, so that different kinds of alerts could take place concurrently. For a successful detection, the algorithm must detect a true volcanic alert, and this capability underlines the reliability of the algorithm to recognize thermal volcanic activity. On the contrary, the algorithm inaccuracy is expressed by how many false alerts have been counted in the overall number of alerts detected. In Table 2, we summarize the evaluation results.
In the upper part of the table, results about detection capabilities of the algorithm are presented. The successful detection percentages (sixth column in upper part of Table 2) show high values for all the case studies, with percentages spanning between ca. 85% and 97% (Bezymianny and Kliuchevskoi as minimum, Masaya as maximum case studies), highlighting the excellent algorithm accuracy on sensing thermal volcanic activity. The main controlling factor appears to be the weather conditions, with the only two percentages below 90% related to the Russian Kamchatka’s volcanoes, located at high-latitudes and with a robust cloud cover contribution. Particularly at Bezymianny and Etna, the algorithm missed diverse still visible volcanic hot spot due to a commonly thick cloud coverage, in first case mainly, and to persistent white steam and degassing over summit vents, partially hiding hot anomalous pixels. Notably, fire/human-induced alerts are excluded from this analysis, because they do not represent volcanogenic thermal anomalies, but nevertheless they are not considered as false, because they are likewise triggered by hot-spot sources, thermally comparable with volcano-related ones. Understandably, fires/human alerts are commonplace in Etna and Stromboli, where fires are likely and human activities are located on the volcano’s slopes, and Masaya, where the nearby villages surrounding Masaya city fall into 5 km from volcano crater.
In the second part of the table, false-detection amounts per volcano are listed, distinguished between false alerts and MSI artifacts. Algorithm false detection percentages (second column in lower part of Table 2) exhibit generally extreme low values, spanning from no fake alerts to 3.45%, with the two higher percentages are to be found on Etna and Kliuchevskoi. In some case studies (e.g., Erta Ale, Masaya, Villarrica and Láscar), no false alerts are detected, and this is mostly due to absence of cloud coverage and its related disturbing effects. Higher percentages of false detection occur if we also consider fake effects induced by artifact on MSI detector sensing. These effects, known as “spectral response non-uniformity” [69], consist in oblique soft-edged darker or brighter stripes near the detector margins, that induce localized irregular spectral response and anomalous pixel colors, some of that of red tones. Particularly, fake anomalous pixels are produced when stripes interact with clouds coverage, and this issue is more noticeable still in Etna and Kliuchevskoi cases and absent in ones with cloud-free conditions. These artifacts are tiles and sensor dependent and for that reason does not show the same occurrence in the geographical areas of volcanic case studies analyzed.
The evaluation results summarized in Table 2 indicate an overall great reliability of the S2 algorithm here presented for working on a global-scale level, considering the eight different volcanic case studies and their variabilities in thermal activity and geographical location. The remarkable successful detection percentages underline the high sensitivity of the algorithm to detect different thermal hot-spot sizes and natures. Moreover, if we do not consider the MSI-related artifacts, which are not dependent by how algorithm works and neither avoidable nor finally resolvable by our application, false-detection occurrence has certainly low frequencies. Expectedly, the most affecting factor algorithm turns out to be the cloud-cover-related effects, both in true- and false-alerts detection.

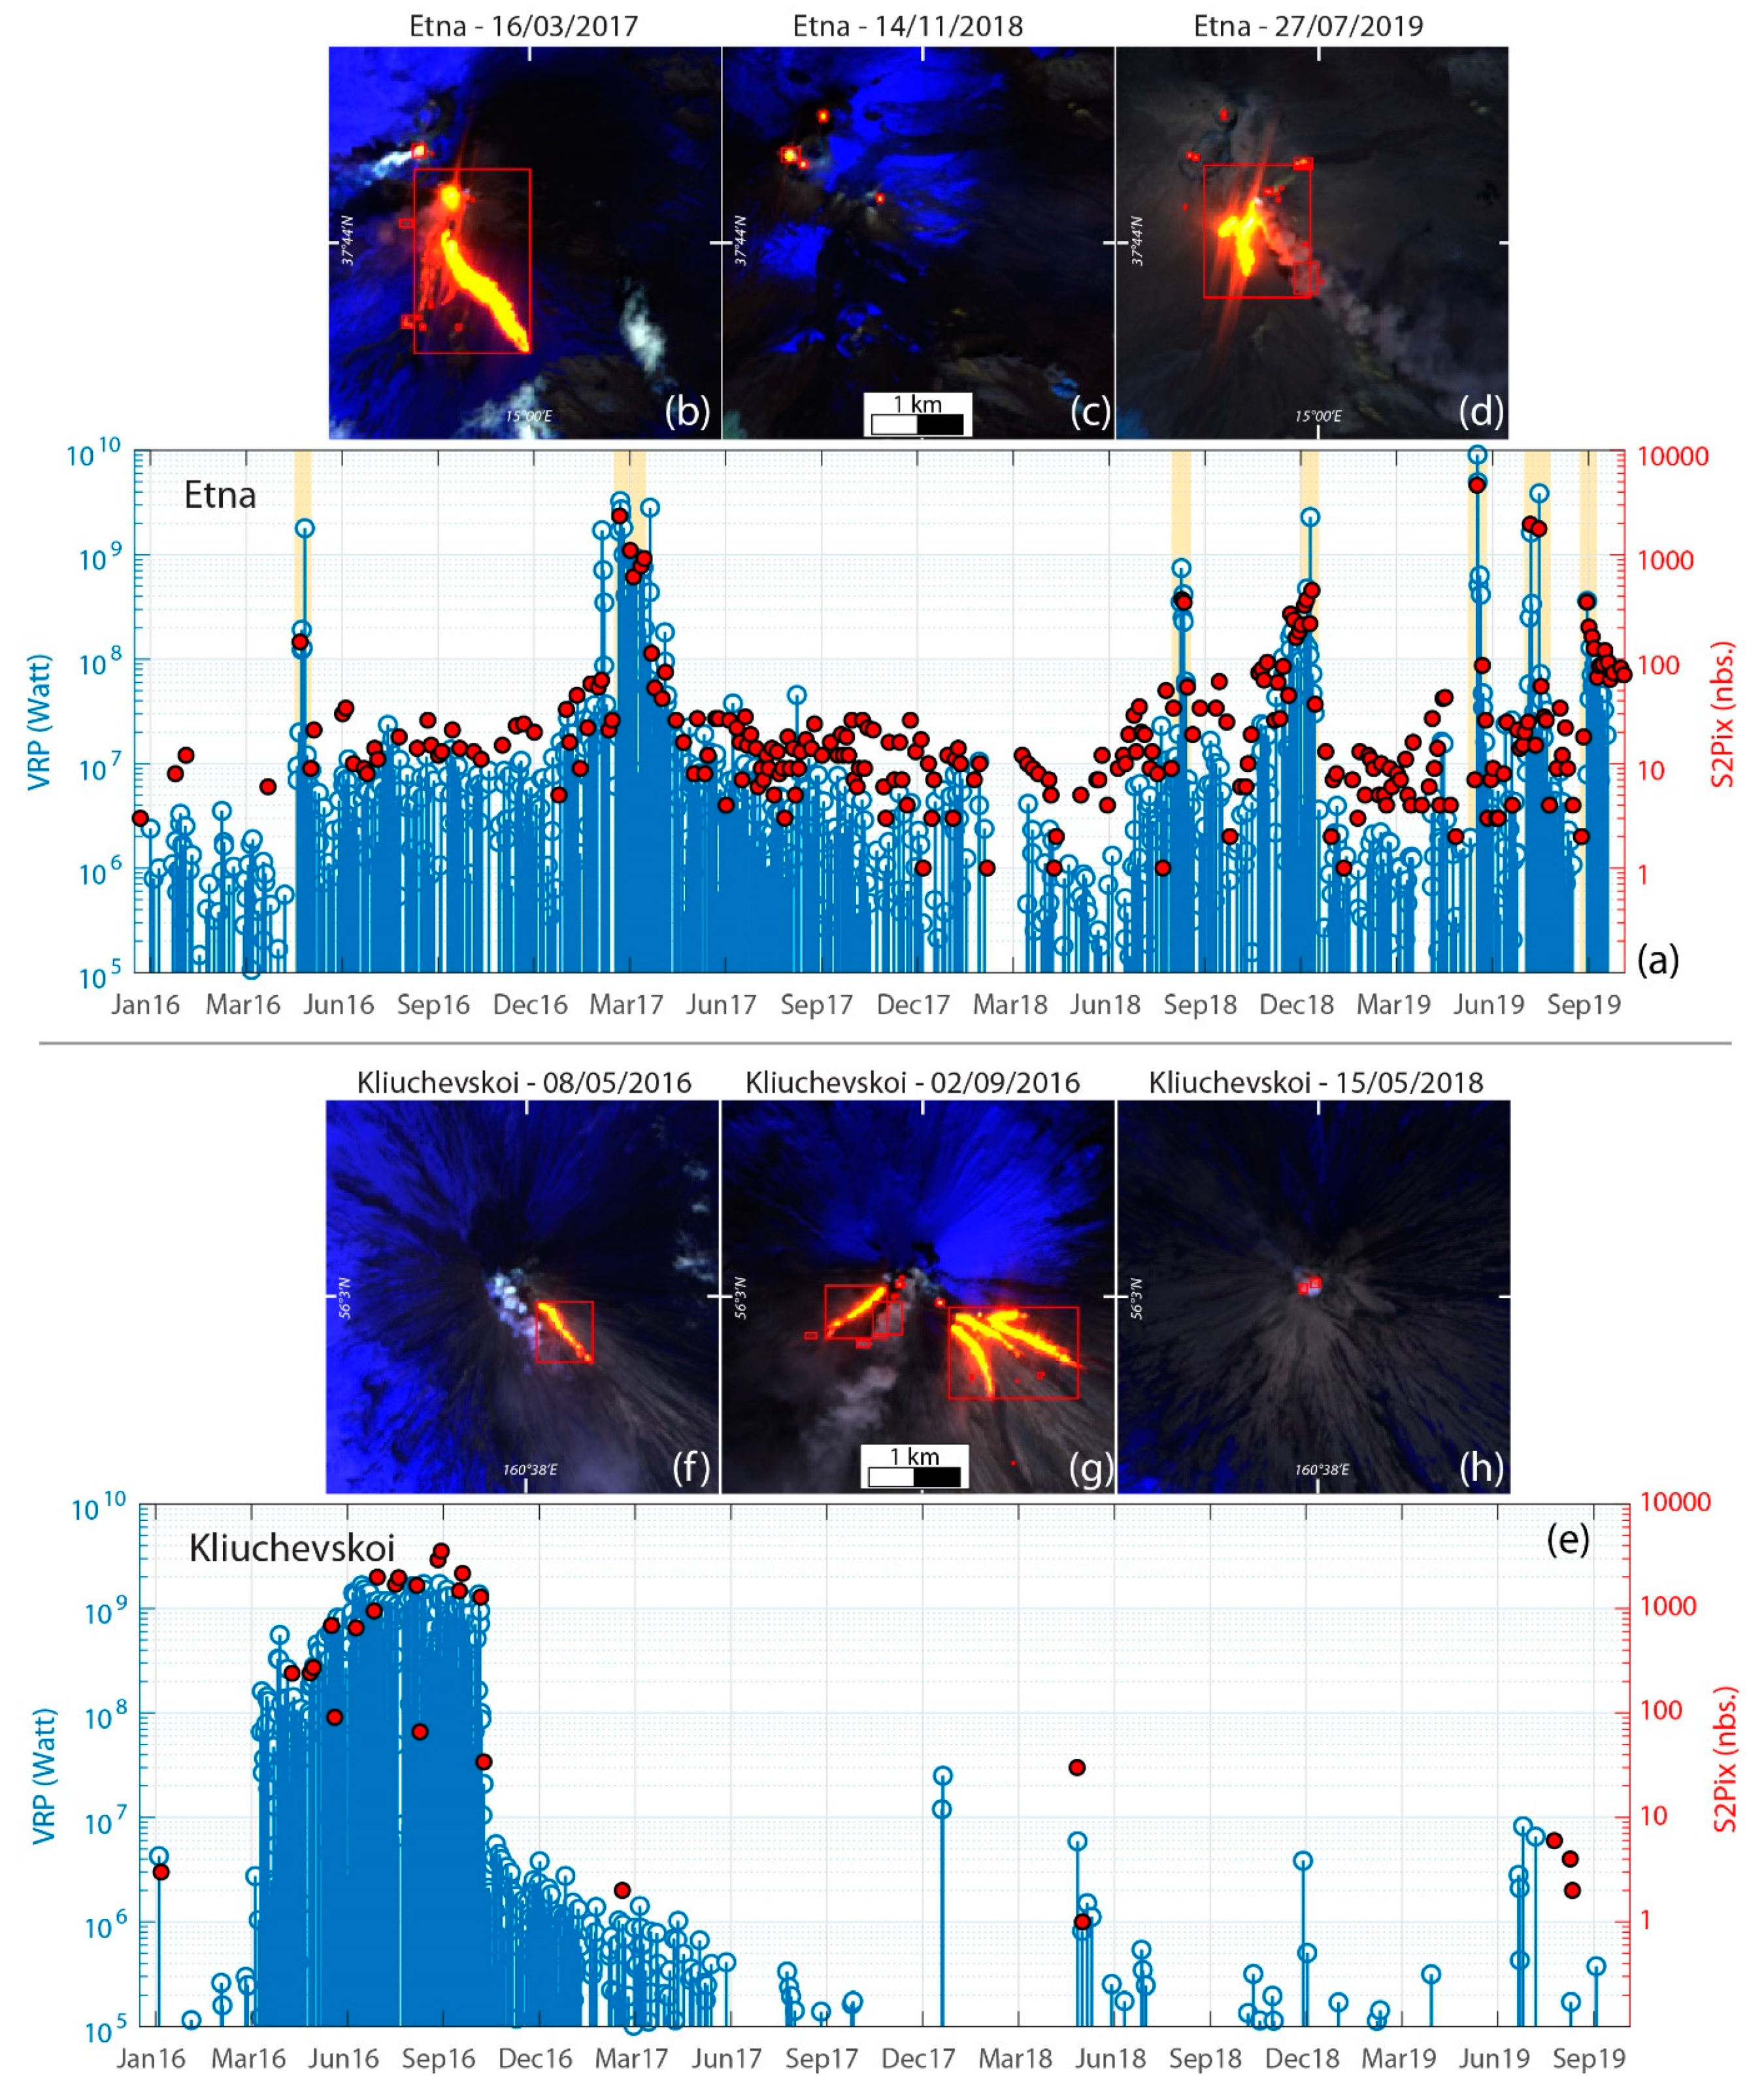
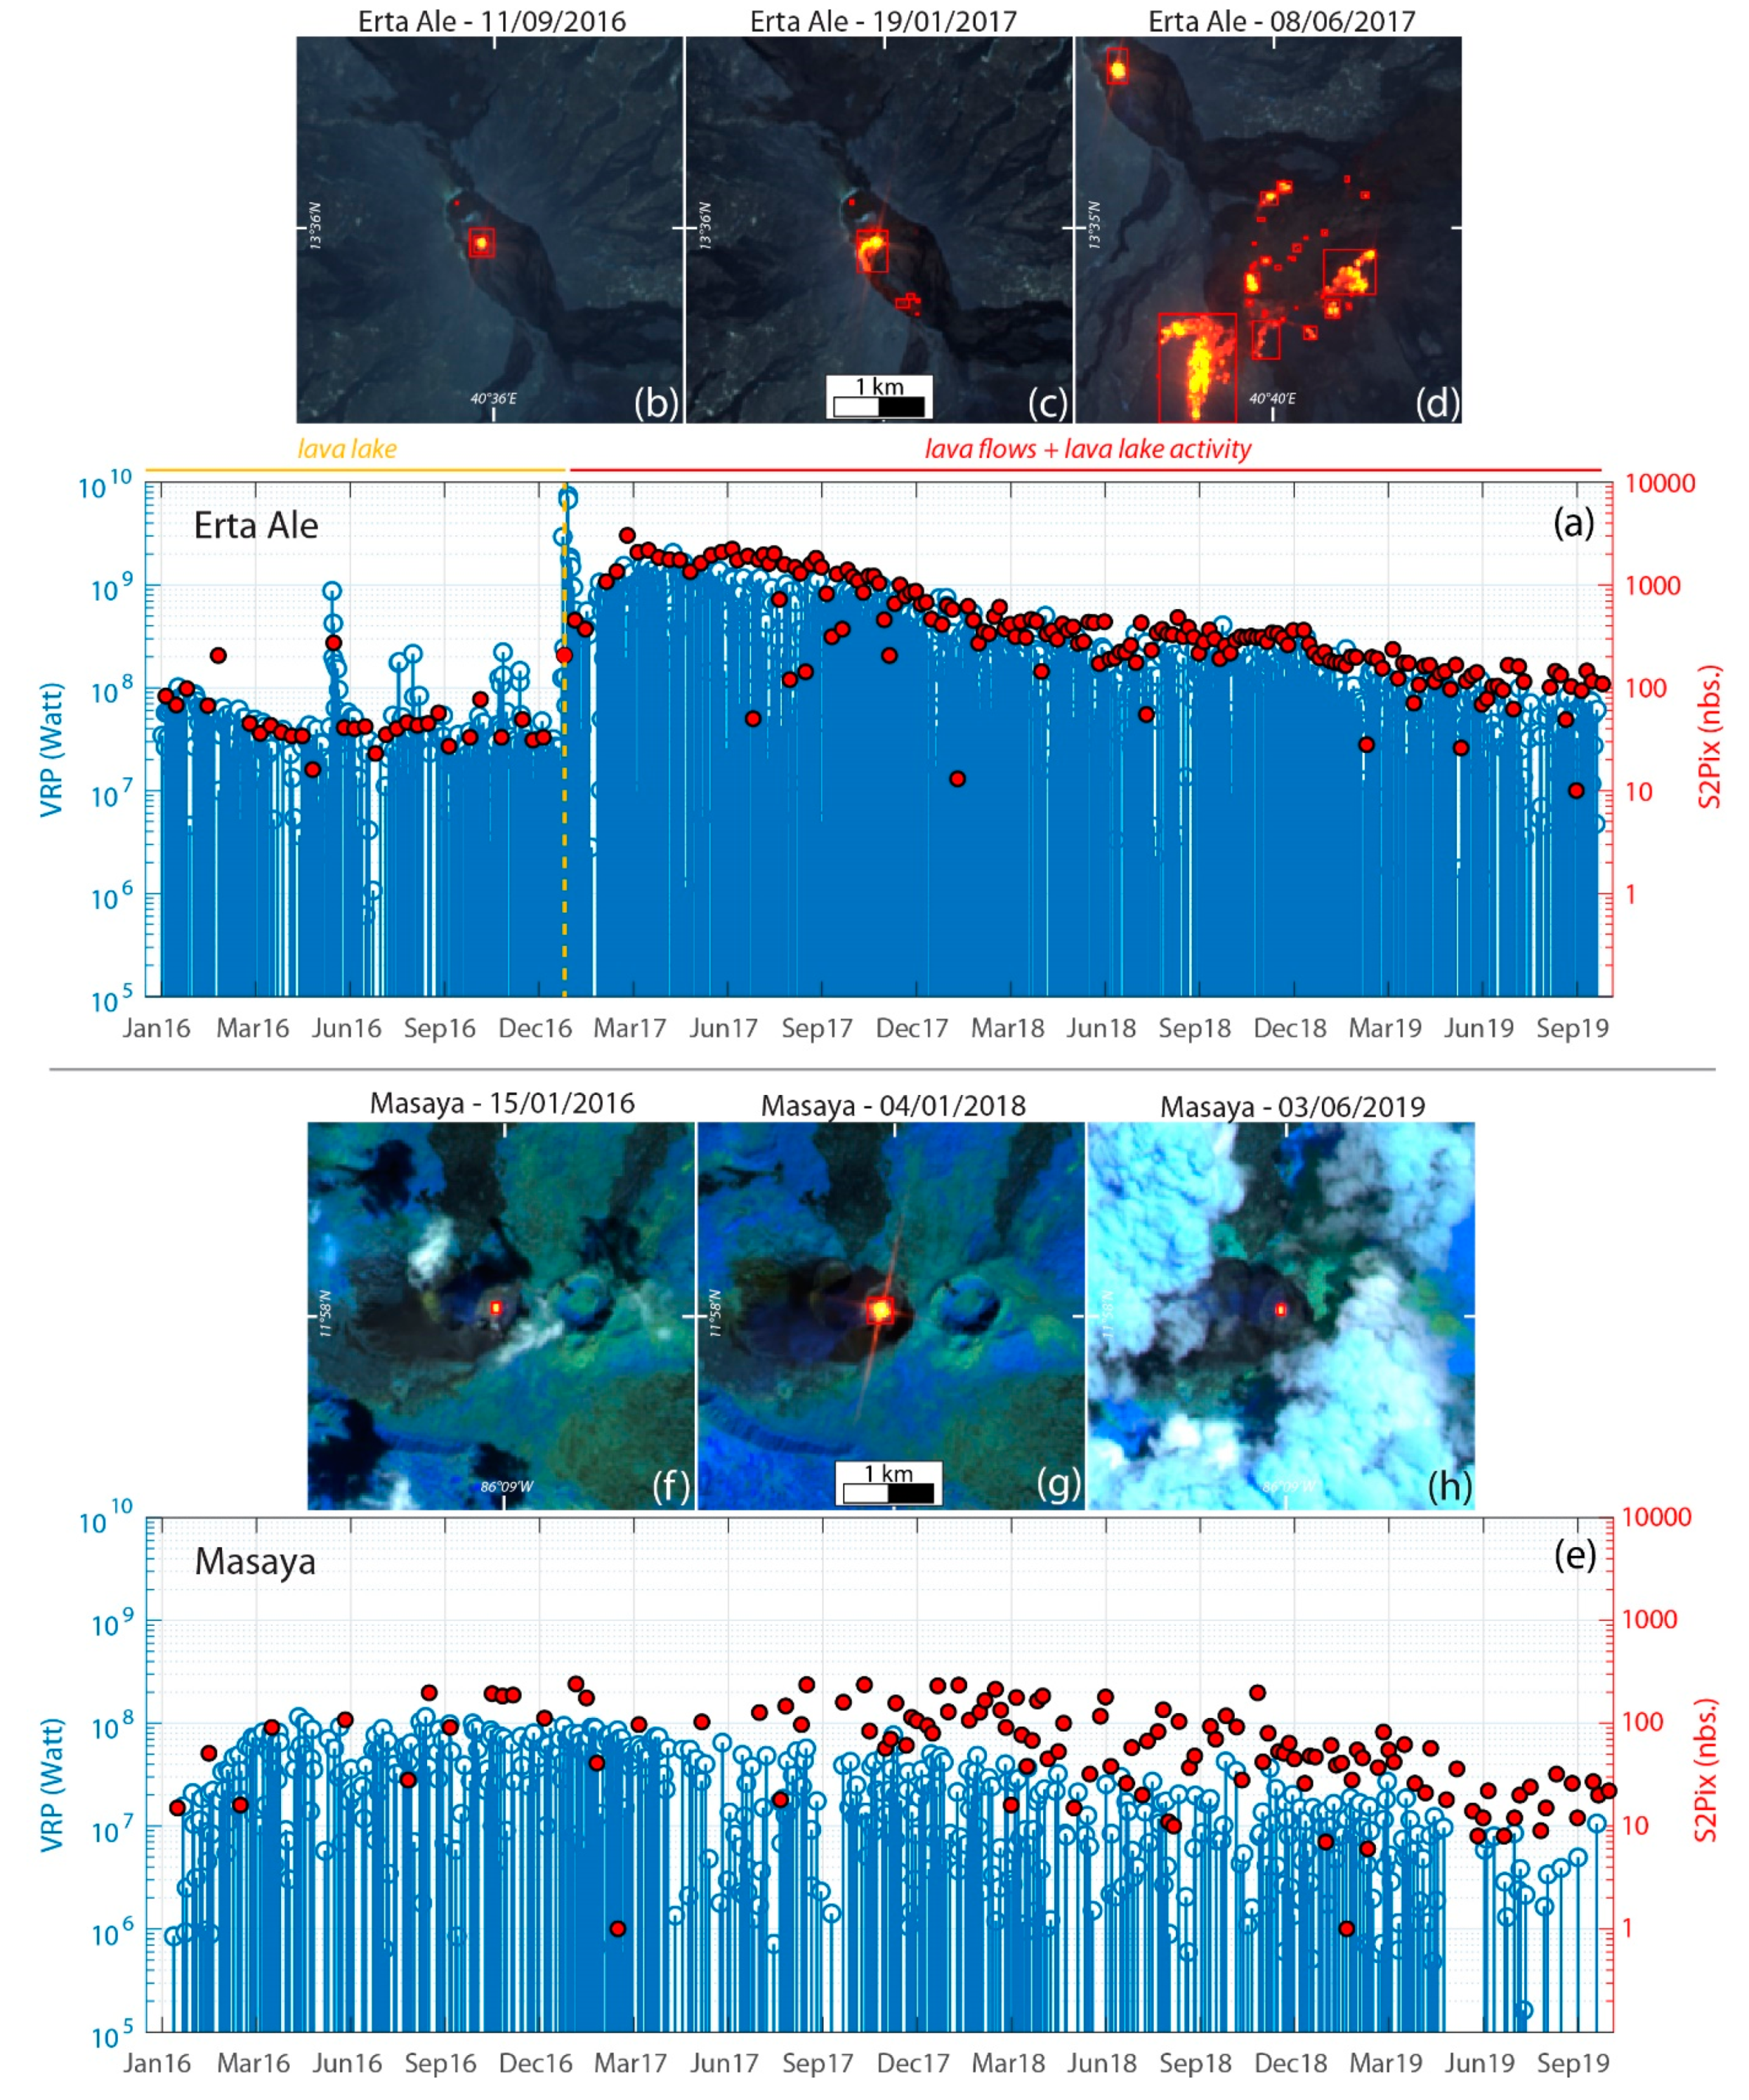
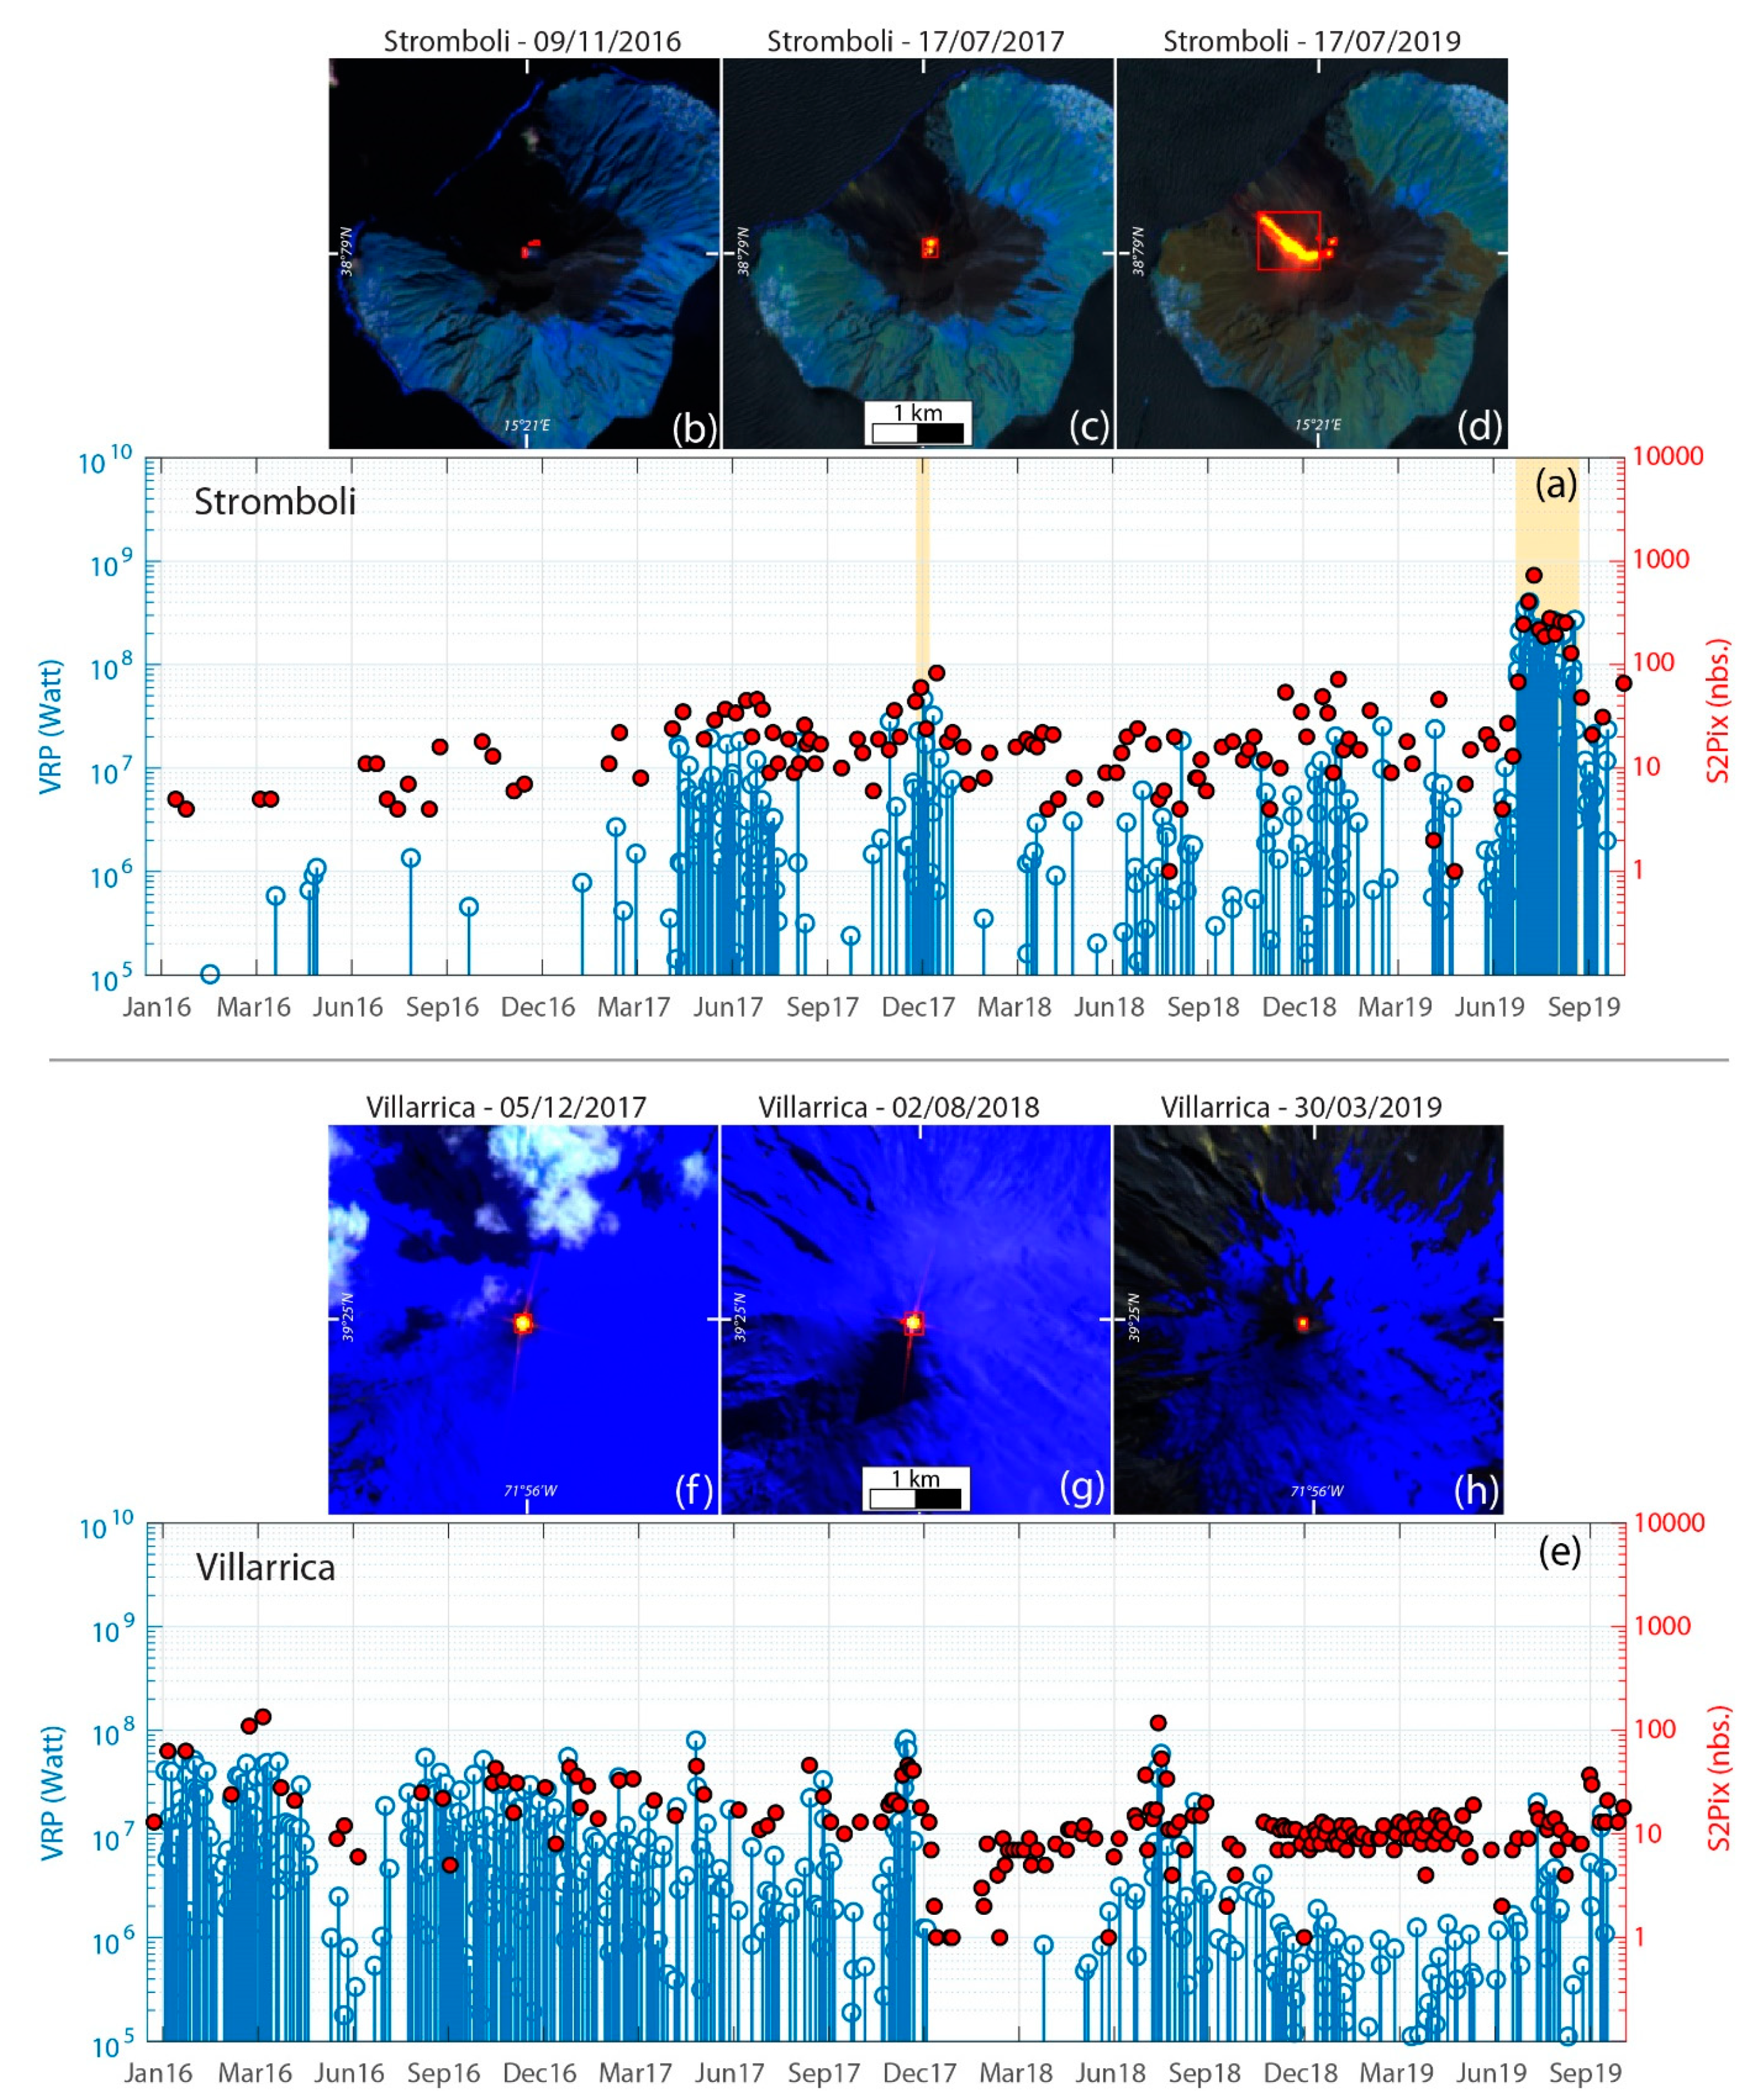
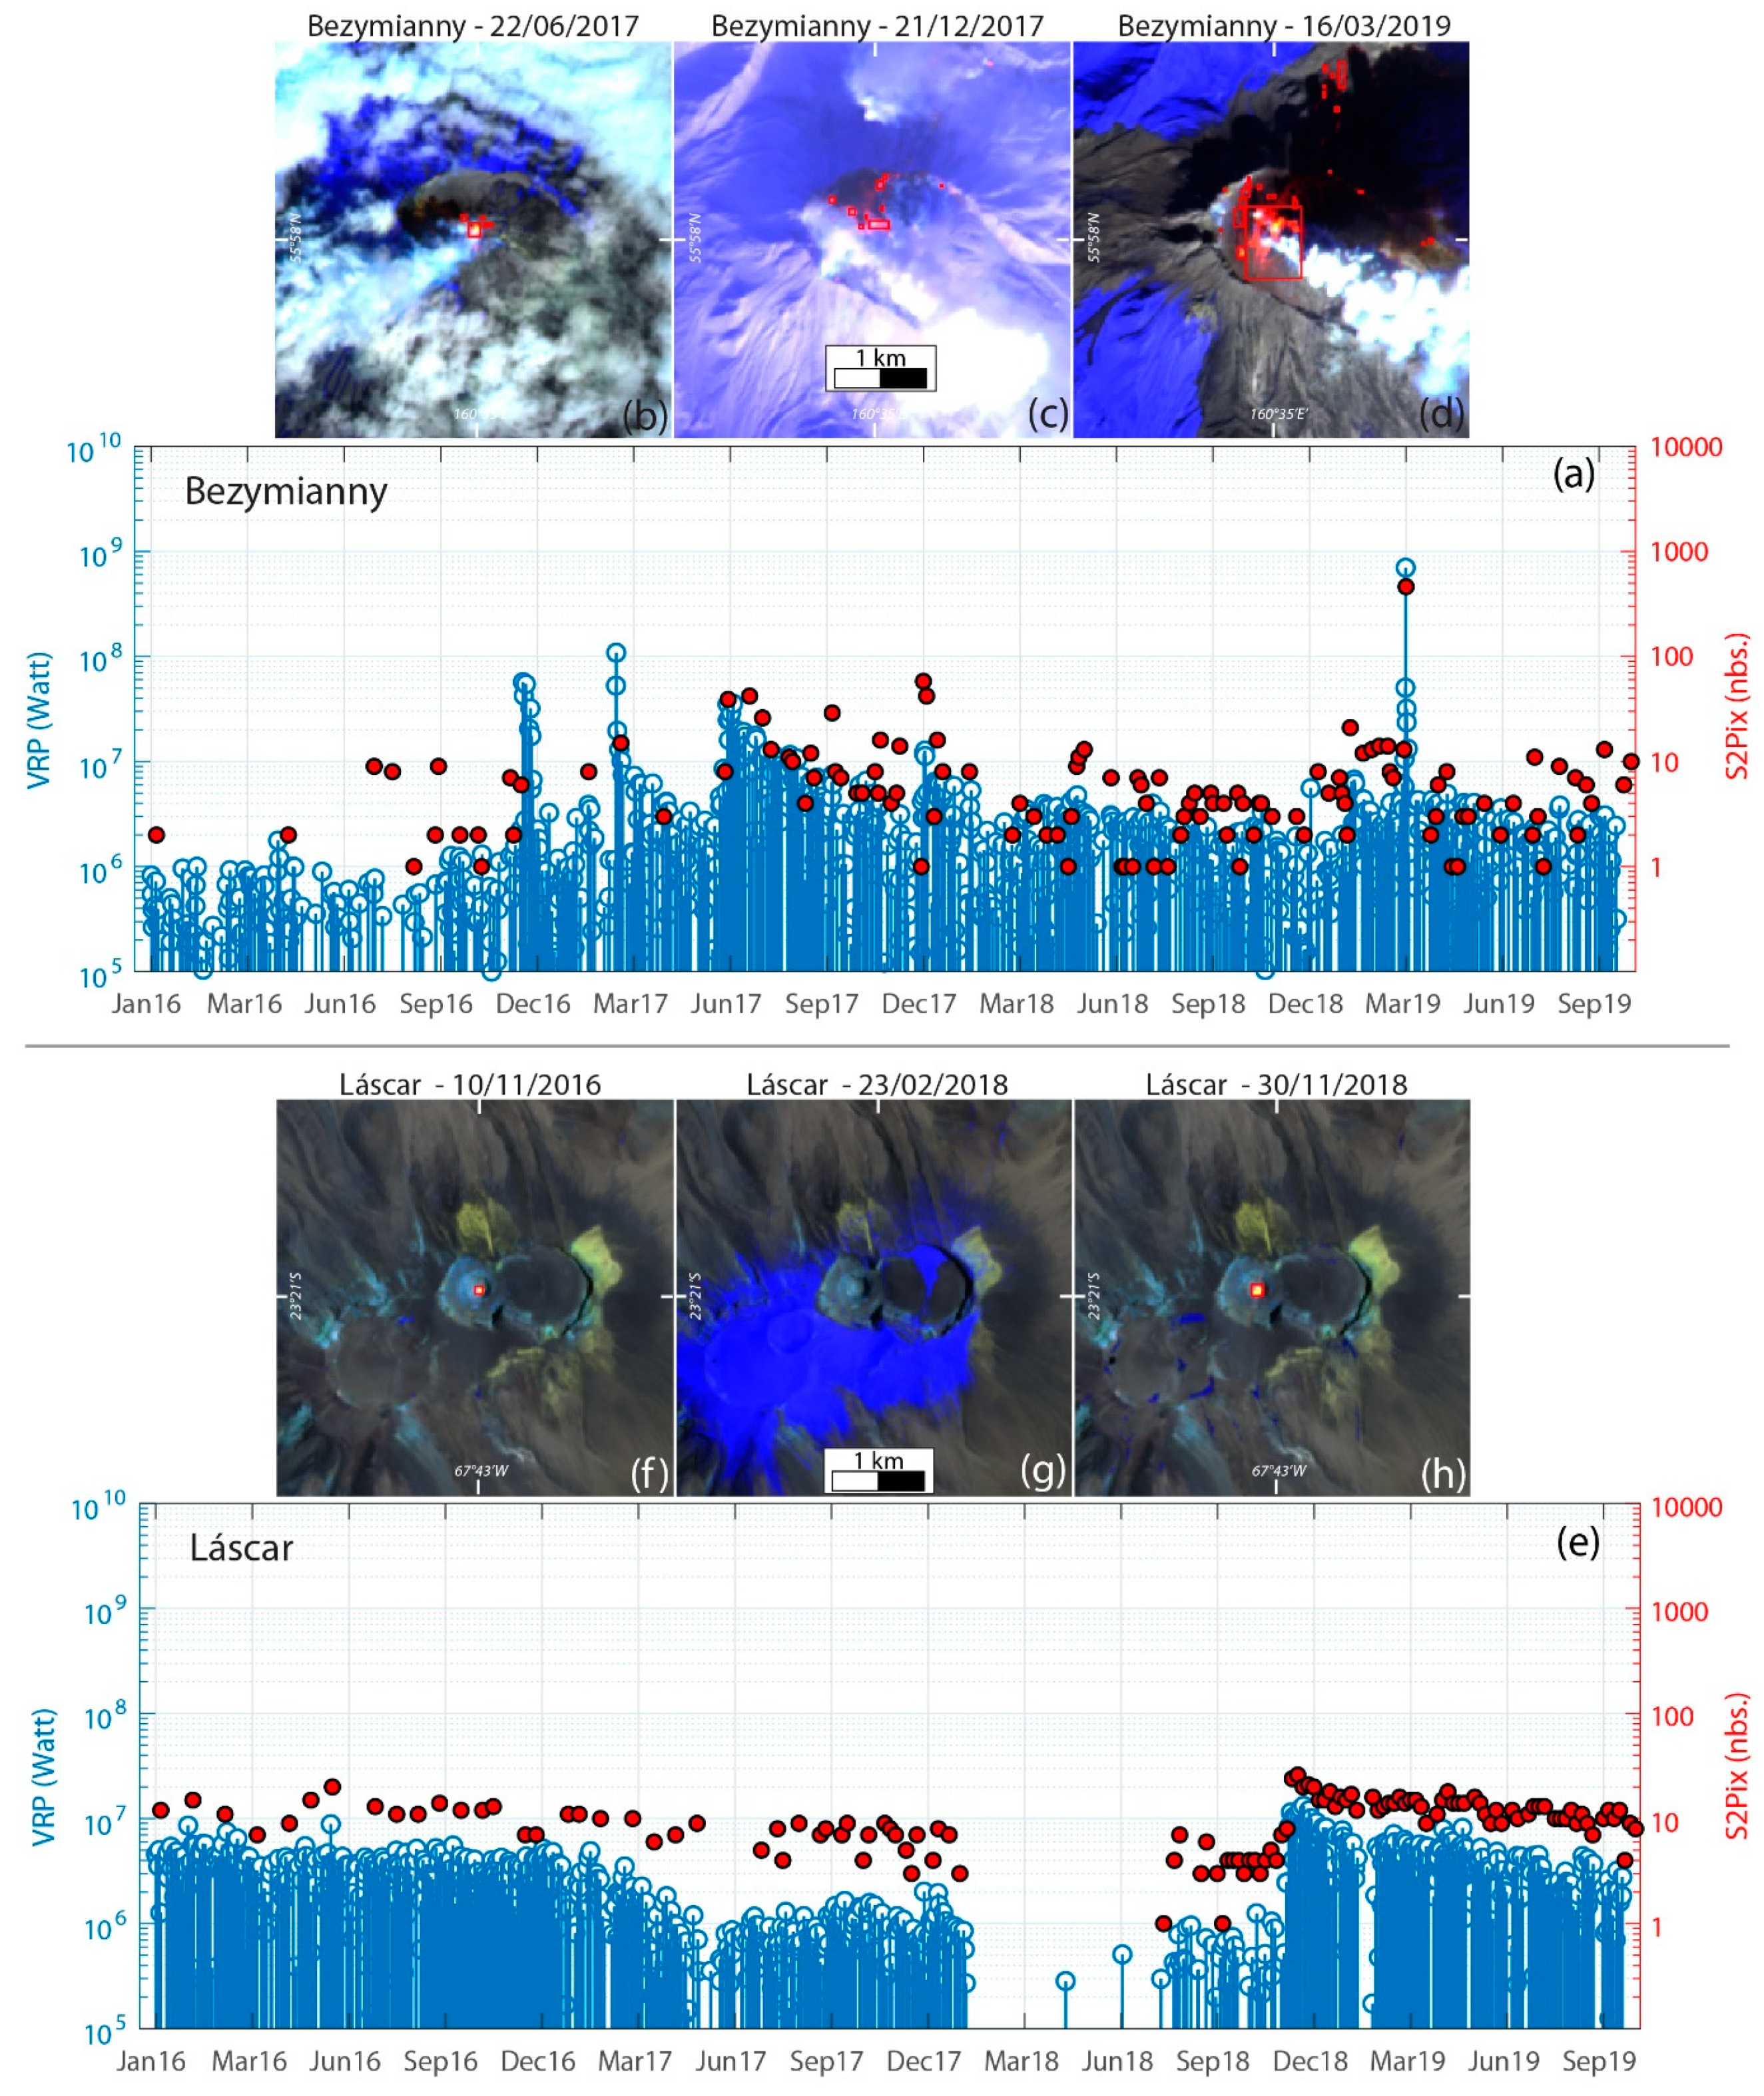
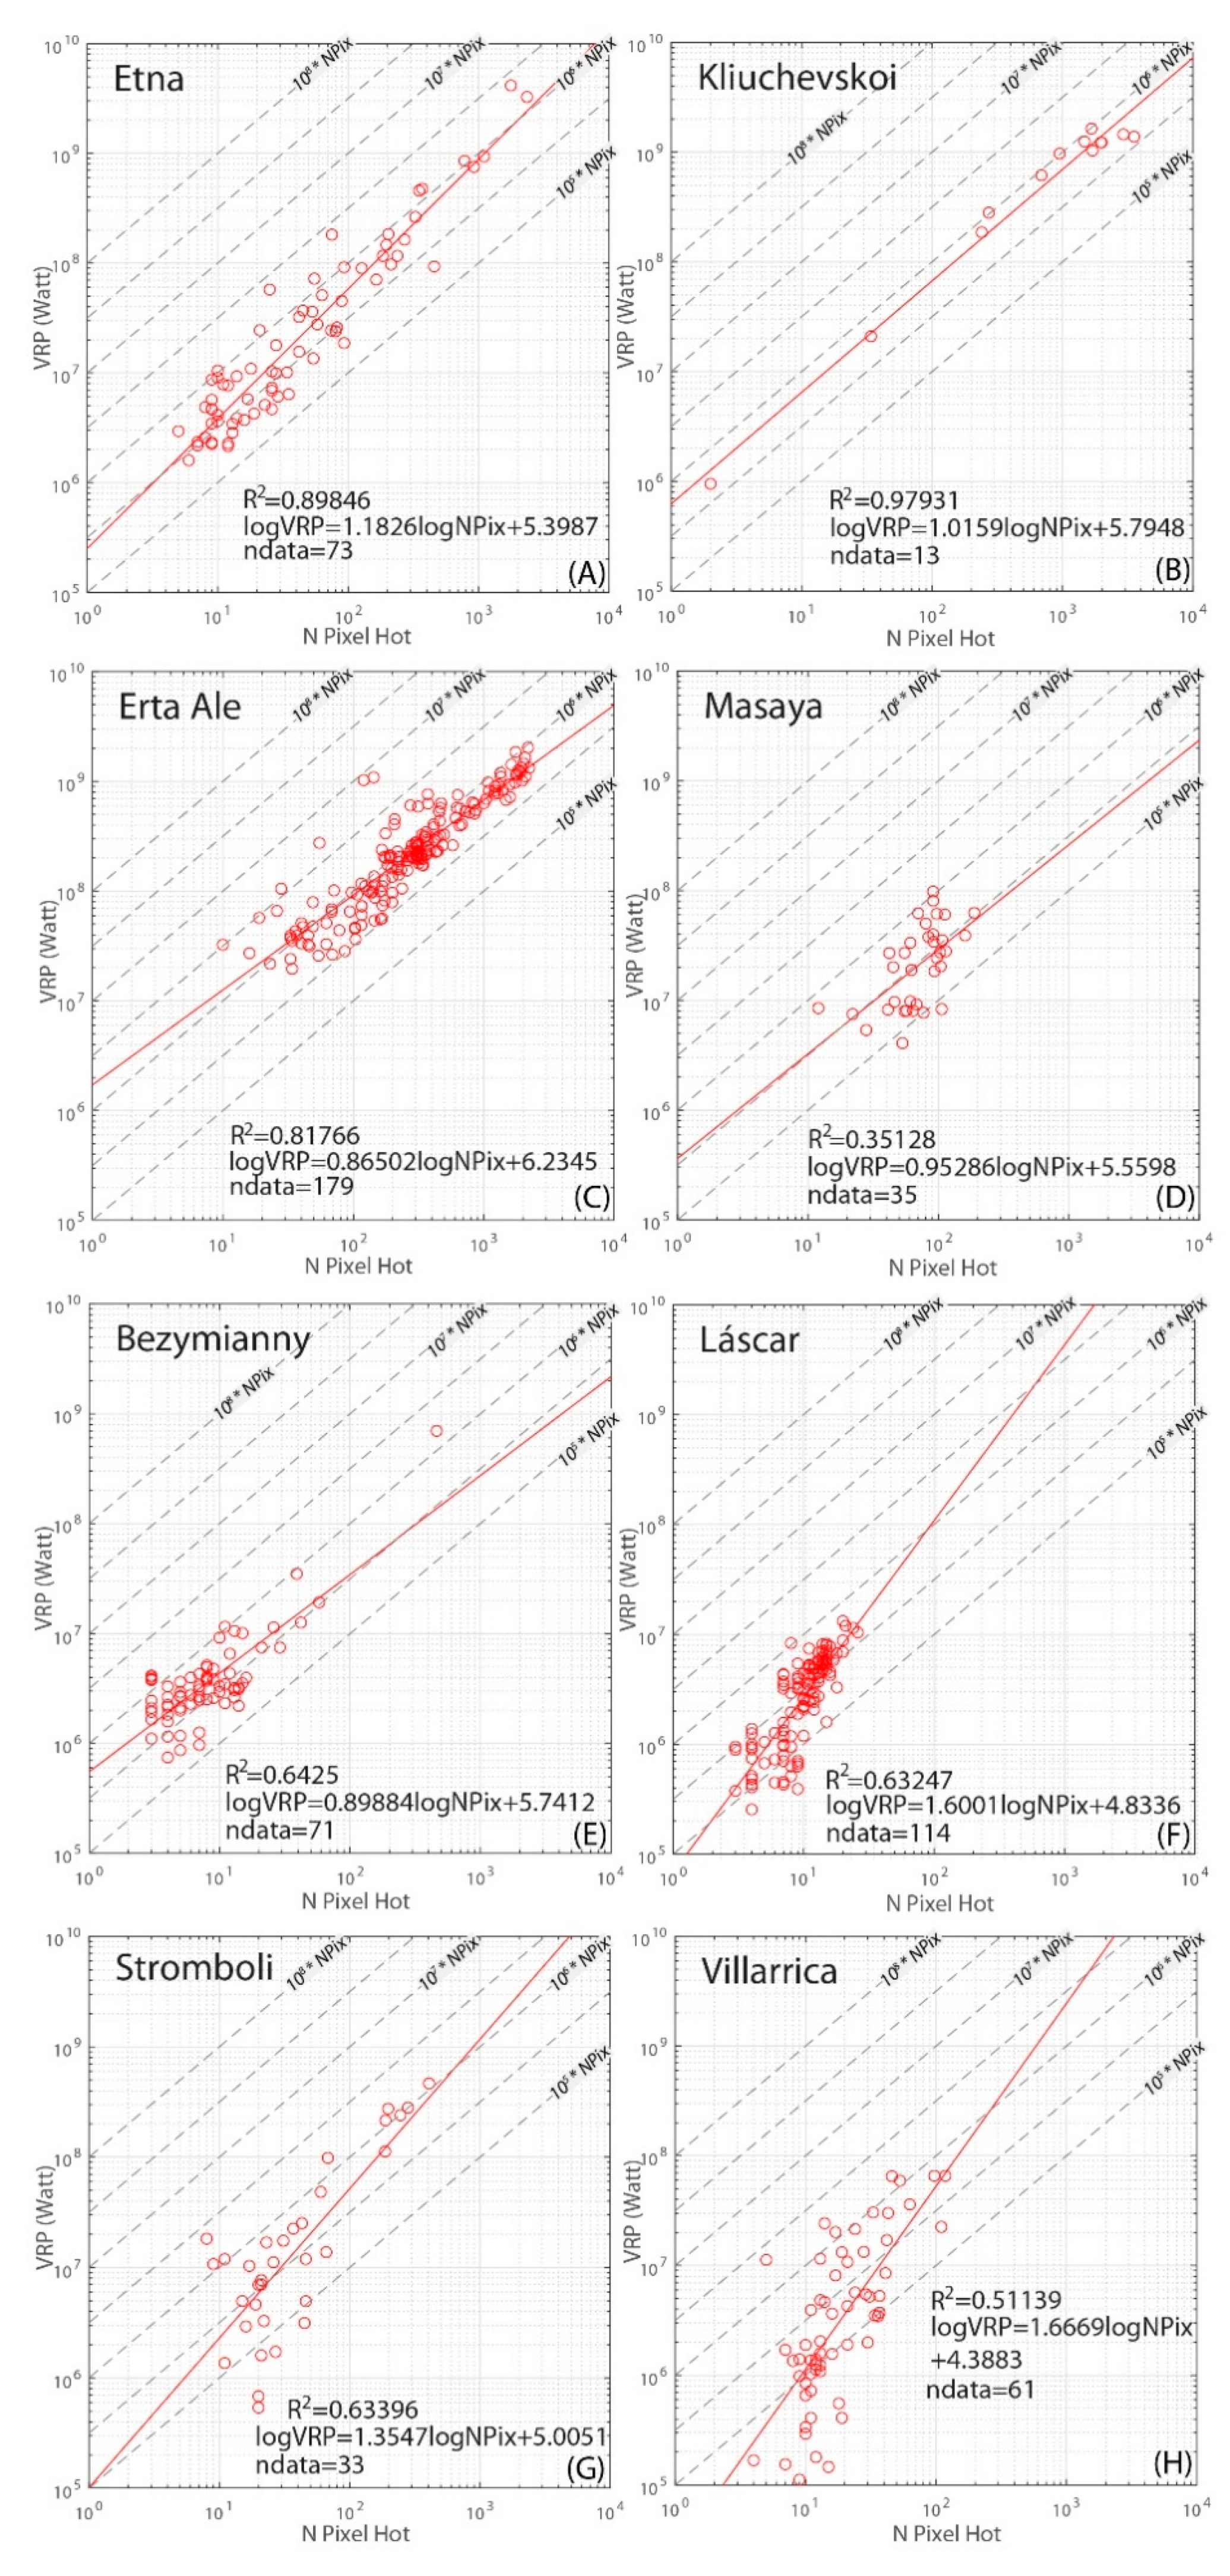
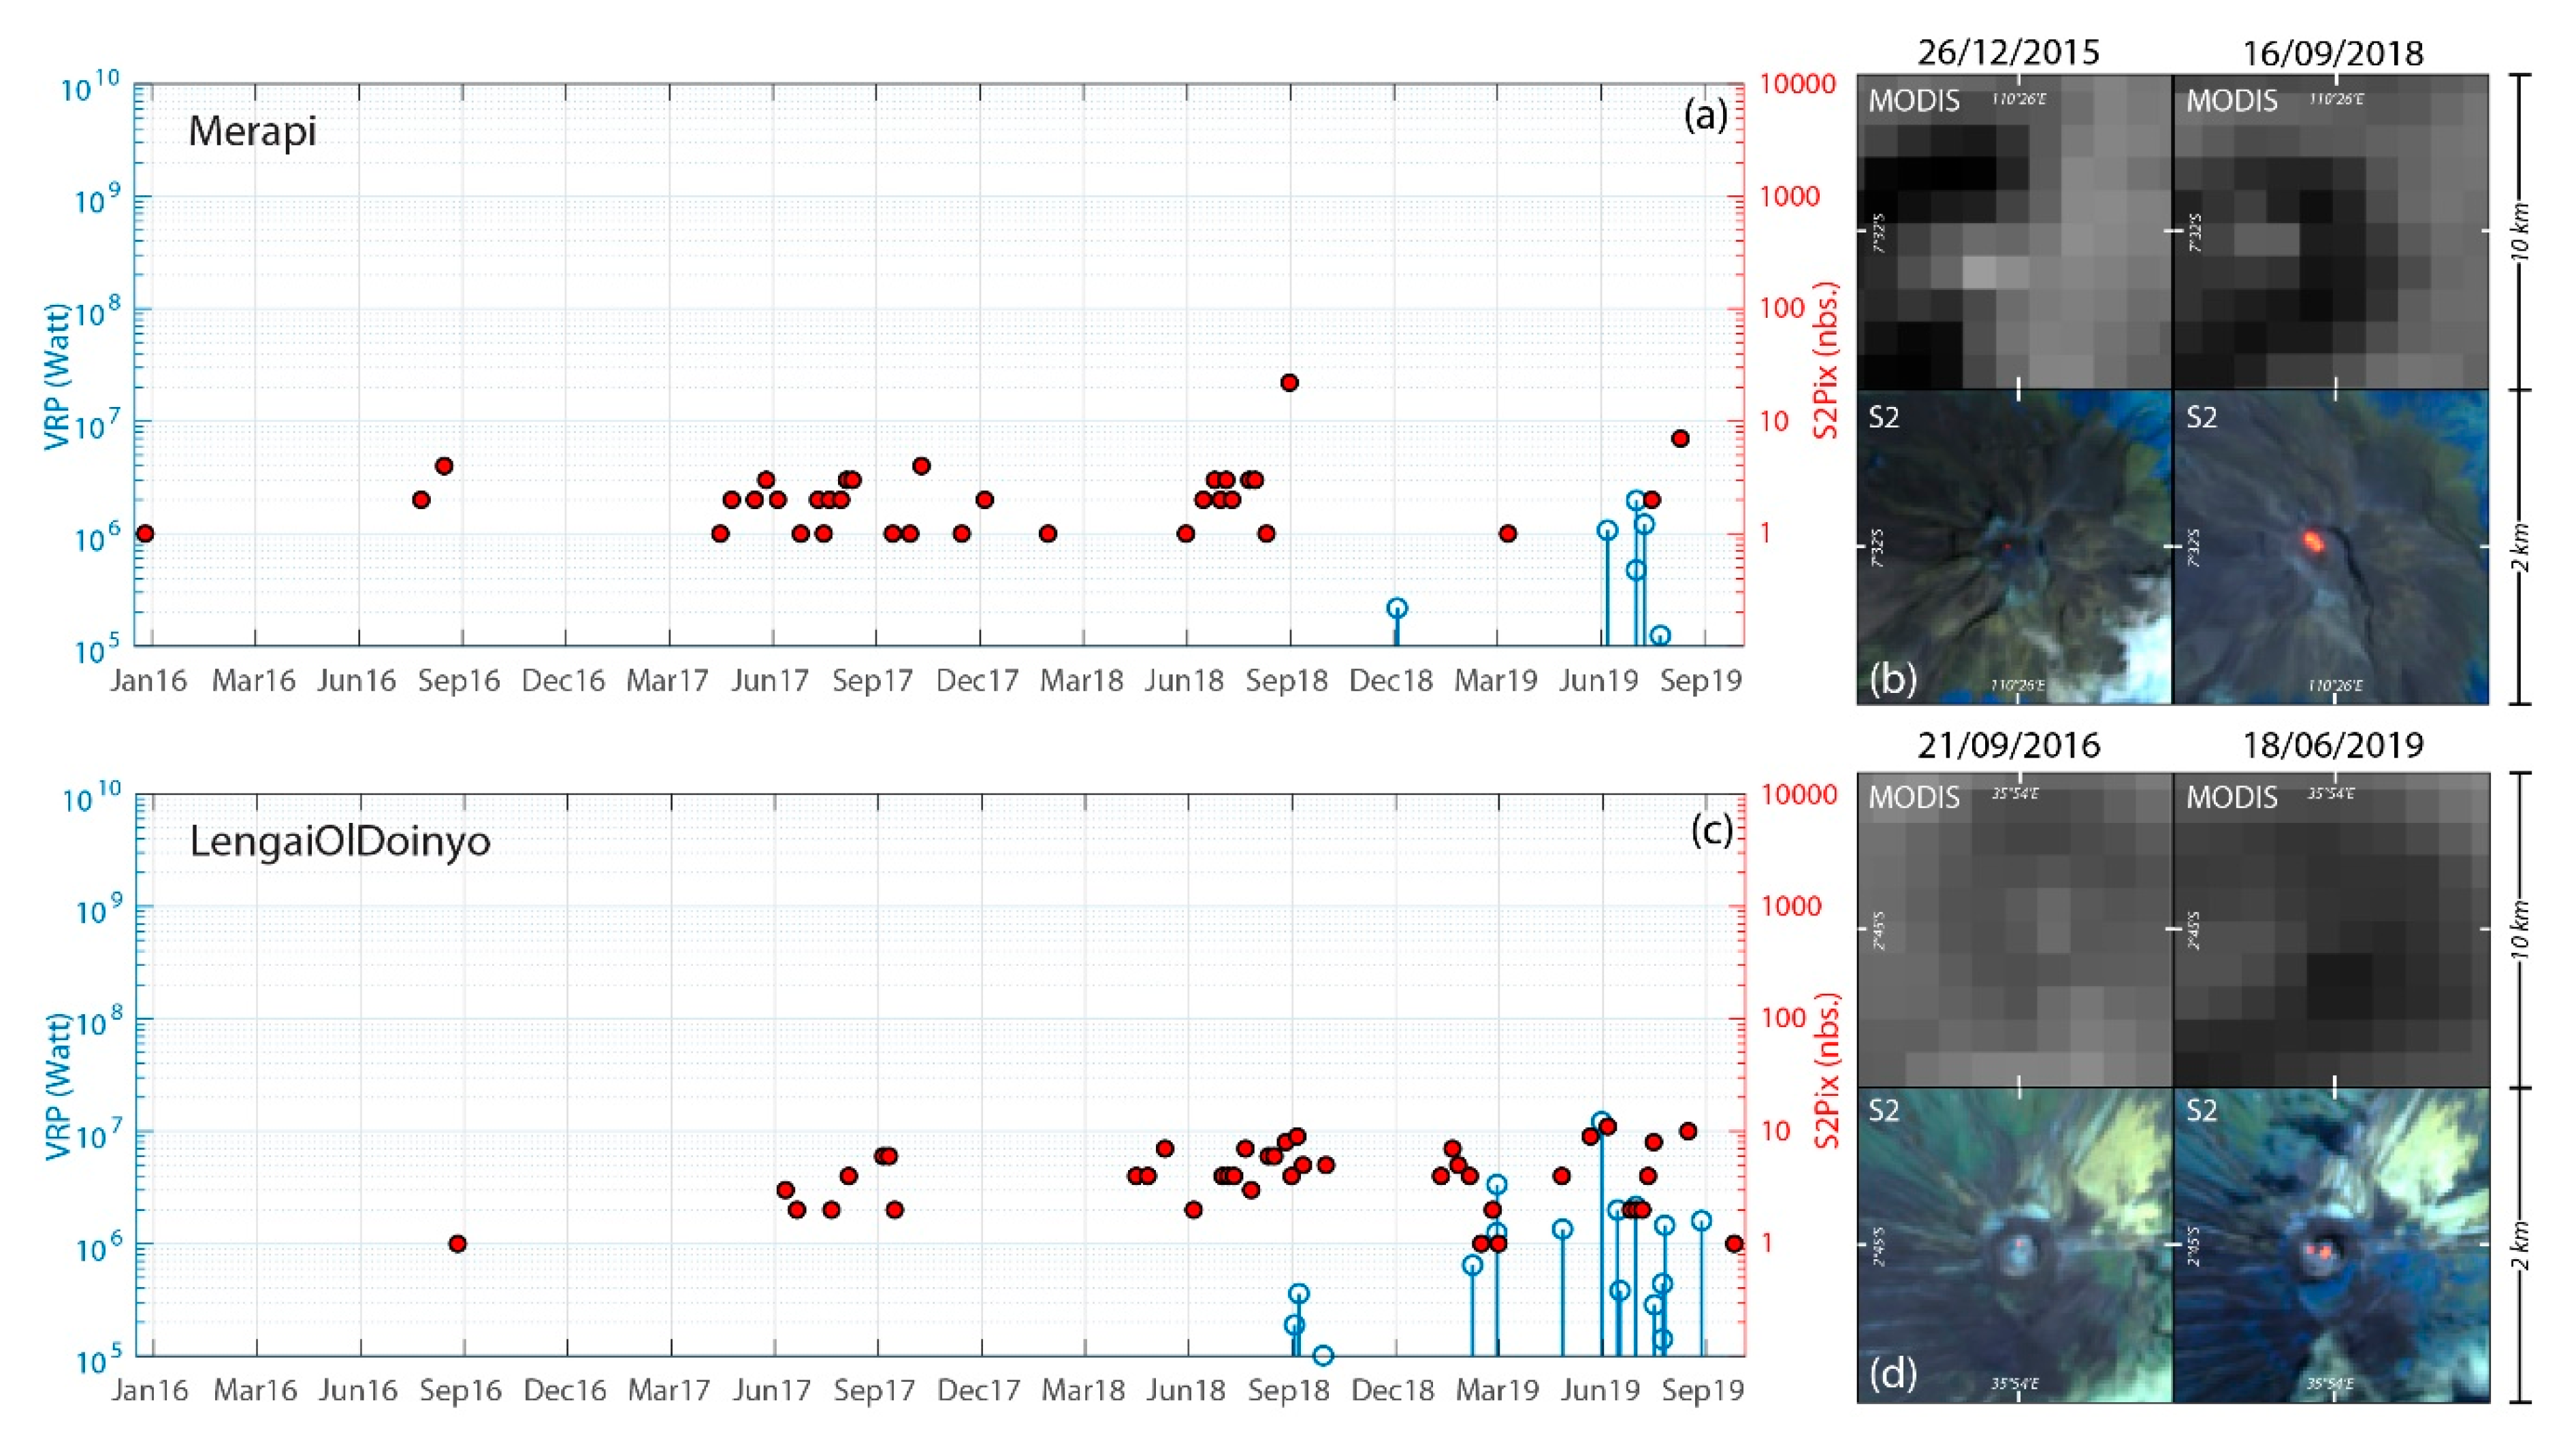
3.2. SENTINEL-2 and MODIS–MIROVA Timeseries Comparison

Here, we show the almost four-year-long timeseries comparison between the number of hot pixels, S2Pix, detected by the algorithm application on SENTINEL-2 MSI images and the Volcanic Radiative Power elaborated by the MIROVA system on MODIS data, in order to explore the accuracy of the algorithm to detect and track volcanic thermal activity.
MIROVA is an automated global hot-spot-detection system based on the near-real-time processing of infrared MODIS–MIR data (http://www.mirovaweb.it/; [25]). Its thermal algorithm incorporates spectral and spatial filters, providing an accurate sensitivity to lower thermal anomalies. It gives a quantification of the Volcanic Radiative Power (heat flux, in Watt) through a hybrid algorithm based on MIR radiance data analysis (~3.9 µm) recorded at the moderate spatial resolution of 1 km per pixel of MODIS satellites images. MIROVA currently monitors over 220 volcanoes, providing real-time post-processed products, such as lava effusion rates, in support to eruptive crisis management [20].
Figure 8, Figure 9, Figure 10 and Figure 11 show the heat flux in Watt calculated by MIROVA system (on the left y scale, with blue stem, from 105 W to 1010 W), and the number of hot pixels S2Pix detected by the new algorithm (on the right y scale, with red dots, from 1 to 10,000) on the eight volcanic case studies. No atmospheric correction was performed on S2-MSI and MODIS images here presented, in order to evaluate the purest detection capabilities. The MODIS dataset is filtered to exclude images with poor viewing geometry (Zenith > 40°) and possible deformation effects of the projected thermal anomalies (see [25]). The MIR method [70] applied by MIROVA to MODIS images detects the thermal flow radiated from the surfaces with T > 500 K solely and return the VRP with a standard error of 30%. VRP values represent just the thermal output of high-temperature features, produced by the arrival of magma at the surface or at very shallow levels [20]). The comparison with MIROVA data is therefore relevant for the S2 algorithm proposed here, because both aim to detect the hottest portion, directly related to the ascent of magmatic fluids subaerially exposed. The first measures the volcanogenic heat flux, and the second measures the number of hot pixels, i.e., the radiant emitting hot area.
Lava flows represent the most prominent example of volcanic heat sources detectable by satellite, as depicted in Figure 8a–h, showing Etna and Kliuchevskoi volcanoes.
In the case of Etna, whose thermal activity varied by several orders of magnitude during the analyzed period (Figure 8a), it is possible to observe how the detected S2Pix follow the VRP thermal trend with high accuracy and mimic its general trend. In fact, there is a strong correspondence between the two analyzed thermal signals, both during the so-called “low thermal regime”, related to strombolian and degassing activity at the summit craters (characterized by VRP < 108 W (cf. [37]) and S2Pix < ~100, Figure 8c), and during the “high thermal regime” related to high-sustained strombolian activity or major lava effusion phases (Figure 8b,d and yellow bands in Figure 8a, characterized by VRP > 108 W and S2Pix > 100). Even if energetic events such as summit overflows or fountaining episodes at Etna are generally short-lived, each peak detected by MIROVA is also constrained by S2Pix hot pixels detections, also thanks to 2–3 days of revisit time of SENTINEL-2 above Etna.
Kliuchevskoi volcano is another good example of lava flow-forming eruption, with an excellent correlation between MODIS and S2 related thermal signals, despite the high latitude and strong cloud coverage in the region. In this case, the main thermal activity was recorded between March and November 2016, with a rising trend related to an increased lava effusion from the summit craters (max VRP > 109 W, S2Pix >1000; Figure 8e,f,g). A sharp drop in the thermal activity tracked by MODIS and S2 marked the end of the eruptive phase on November 2016, and it was followed by a month-long slow decline of thermal emissions detected by MIROVA (VRP < 106 W; Figure 8h). Despite the low revisit frequency at these latitudes, spanning from 5 to 10 days, the effusive phase and its increasing trend was well detected by the algorithm, with a growing number of detections from hundreds to a peak of ~1200 S2Pix (Figure 8e). Afterward, the lack of a continuous satellite acquisition and the more sporadic thermal activity of Kliuchevskoi makes the S2 data sparse, although sporadic hot spots were detected during short-lived, low-level resuming phases (May–June 18 and July–August 19; Figure 8e,h).
Lava-lake cases are represented by Erta Ale and Masaya volcanoes, as shown in Figure 9a–h. Erta Ale volcano is well-known for its long-lived lava-lake activity hosted within one (or two) summit pit-crater(s) [71]. However, since January 2017, a large flank eruption (still ongoing at the time of this writing), has produced lava flows, with an estimated area of at least 26 km2, in June 2019 [72]. Considering the drastic change in the eruptive style, the consistency between MIROVA and S2 thermal signals is remarkable both in terms of recorded intensity and trends (Figure 9a). The correlation between the two signals is very high both during the lava-lake activity (before January 2017; Figure 9b), with S2Pix < 100 and VRP < 108 W, except some overflows, as well as during the lava flows’ production (after January 2017; Figure 9c,d), with a peak phase in S2Pix (max > 1000 pix.) and VRP (> 109 W). Some S2Pix values are underestimated due to cloud coverage that partially masked the satellite sensor detection (S2Pix ~ 10, visual inspection of those data). Moreover, a series of short-lived overflows occurred during the second half of 2016 and the beginning of the effusive eruption on 22 January 2017 (VRP > 7000 MW) were not detected by S2. This clearly highlights the limitations of this system in detecting short-lived yet very intense events. The high number of S2 hot-spot detections and the strong correlation observed with VRP values are even favored by the good atmospheric conditions in this African area, with a very low number of cloudy periods and, thus, optimal conditions satellite observations.
A similar behavior can be seen in the Masaya case study (Figure 9e), where a persistent thermal output has been detected by MIROVA since the resumption of the lava lake in December 2015 [8]. Here the S2Pix (generally between 10 to 200 pixels) maintains a good overall match with VRP (~107–108 W), tracking the formation and rise of the lava lake until March 2017 (Figure 9e,f,g), followed by a gentle decline until now; notwithstanding, the S2 hot spots appear more scattered and, in some cases, seems to be higher to the corresponding VRP (Figure 9e). This discrepancy could be partially due to (i) a greater influence of cloud coverage in scattering, masking or, at times, increasing of hot spots due to reflection effects by low and thin clouds (blurring effects not completely removed), and (ii) an inner variability in thermal output emission of the Masaya lava-lake system, with different energetic phases related to a rapid fluid dynamic behavior rather than a more stable and slower surface observable at Erta Ale, as testified by some works on Masaya lava-lake dynamics (see [73] and references therein).
Open-vent activity case studies are represented by Stromboli and Villarrica volcanoes, in Figure 10a–h. Both cases present interesting results, considering that open vents volcanoes should be characterized highly variable activities, with continuous gas emissions, mild explosive behavior and with the magma column top often visible and considered as the last portion of the shallow plumbing system [74].
At Stromboli, our algorithm detects almost persistent thermal anomalies associated to the continuous but variable strombolian activity (May–August 2017, December 2017, January 2018) as inferred by MIROVA-derived VRP (Figure 10a). The S2Pix and the VRP show excellent agreement during effusive activity (July–August 2019, Figure 10d), with the threshold of ~50 MW (see [75]), or 50 S2Pix, representing the transition between strombolian and effusive regimes (summit overflows and/or flank effusions, in Figure 10a as yellow bands and Figure 10d). During periods of weak strombolian activity the high sensitivity of our algorithm to very low thermal emissions (January–March 2016) is testified by few hot pixels almost continuously detected (S2Pix < 10), with no or weak MIROVA thermal anomalies (VRP ~ 106 W; Figure 10b,c). It is also clear how the thermal signal produced by strombolian open-vent activity results in a variability in the hot area detected by S2, spanning from a limited S2Pix < 10 to a dozen of hot-spots.
At Villarrica volcano, the MIROVA VRP measurements indicate persistent thermal emissions with values comprised between 107 and 108 W (Figure 10e–h), with variations in the volcanic heat flux probably related to the fluctuations of the lava level and intensity of strombolian activity [76]. Until December 2017, the S2 algorithm successfully recognizes this thermal trend, with a variable hot-spots number, from a few hot pixels to S2Pix > 100, that nicely fit the VRP trend (Figure 10e). Afterward, the VRP shows at least two major cycles of decreasing and increasing thermal emission (Figure 10e). In relation to these cycles, the S2Pix appears quite stable with a value around 10 pix., whilst they also track the higher thermal emitting phases of June-September 2018 (Figure 10g) and of September 2019. This suggests that, during the lowering phases, the area occupied by the thermal anomaly remains roughly constant (i.e., the bottom of the crater), while the thermal flux decreases greatly, in response to the lowering of the effective temperature of the hot target.
A similar behavior is thus found in these two open vent cases, with a strict correlation between VRP–S2Pix during major activity phases and the sensibility to recognize hot emitting area by S2 even when VRP clearly decreases.
Considering the lava-dome activity types, or more generally open-vents activity with high-viscosity magmas [74], we analyze Bezymianny and Láscar volcanoes, in Figure 11a–h. During the analyzed timespan, Bezymianny activities consist of sustained fumarolic emissions, periodically interrupted by phases of lava-dome growth, strong explosions and eventually by extrusion viscous lava flows (Figure 11a–d). This variability is well represented by VRP data, showing a “thermal baseline” (VRP < 107 W), and peaks in thermal flux occurring when lava domes/flows or hot pyroclastic deposits are exposed on the volcano summit and flanks (Figure 11a–d). This activity is well tracked also by the S2Pix, which follows the same overall trend, with particularly good accuracy during the higher activity phases (i.e., peak 16 March 2019, with ~7 × 10⁸ W of VRP and S2Pix = 515, where hot material is dispersed over the top of volcano and surrounding slopes Figure 11d). During lower thermal emission periods or decreasing phase, such as after a strong explosion occurred in June 2017 (Figure 11b), the S2Pix agrees with the overall VRP trend, but with a clear dispersion due to the high cloud coverage in the region.
Instead, over Láscar dome volcano, we find an extremely stable and persistent thermal signal, partially owed to excellent weather conditions in that area, detected by both MIROVA and S2 algorithm. Here, the S2Pix mimics very well the VRP trend both in the 2016–2017 phase, (with a VRP < 107 W and a S2Pix < 10 pixels; Figure 11e), and during phases of increased thermal activity, as occurred from November 2018 (Figure 11h). It is interesting to note that, during the first half of 2018, no thermal activity was detected by either of the systems (Figure 11g). Moreover, the S2 algorithm was able to detect the sharp rise in the thermal signal produced by Láscar lava dome during October to November 2018 (from S2Pix ~ 3 to S2Pix > 20 pixels; Figure 11h).

4. Discussion

The relationship between the number of S2 pixels and the VRP heat flux provides important information on the thermal structure of sources and related volcanic processes at the origin of the anomalies detected by SENTINEL-2 MSI and MODIS. For each of the eight cases described above, we selected only the cloud-free S2 images (through visual inspection), and we considered the maximum VRP recorded by MODIS images (filtered data with Zenith angle < 40°) in a time window of ±24 h, from each S2 acquisition. This allowed us to associate the S2Pix to a VRP value measured almost simultaneously, limiting the discrepancies due to sudden changes in activity or cloud cover. The aim is to compare the two best satellite images, acquired when the hot spots and the heat flux should represent and measure the same thermal volcanogenic process. This kind of analysis was similarly applied by some authors to test the correlation between MODIS and other thermal satellite related signals (i.e., ASTER; see [35]).
In order to evaluate the correlation between SENTINEL-2 and MODIS–MIROVA data, we examined the eight precedent cases by comparing the intensity of the heat flux produced (VRP) and the hot area responsible for that thermal radiation (S2Pix).
In Figure 12, we plotted the S2Pix as a function of the corresponding VRP, with dashed lines representing “isotherm” curves (from 105 to 108 W/S2Pix). Considering that VRP represents the radiant flux in Watt and the S2Pix is a proxy of the hot area, the region of the plot where the observed data fall is an indicator of the temperature of the source, which is useful to assess the thermal behavior of the investigated volcanic phenomena. In this regard, for each case, we modeled the relationship (red lines in Figure 12) according to the following equation:
logVRP = A ( logS 2 Pix ) + B
where A and B are the slope (Watt per pixel) and intercept (minimum radiant power for one alerted S2 pixel) of the model. According to Equation (8), all the isotherm curves in the graphs have A = 1.
Beginning from volcanoes dominated by lava flows, we observe how the relationship is represented by data that follow an isotherm trend and linearly grow in area and heat flux produced. Even if the numbers of the useful data are strikingly different, both Etna and Kliuchevskoi show this similar behavior (Figure 12a,b). In particular, for Etna, the distribution of the data is representative both of Strombolian (major clustering about 10–100 S2Pix and 106–108 W) and effusive activity, with major hot pixels (100–1000 S2Pix) and VRP (>108 W). This fits with what is expected for the thermal signal of a lava flow: the higher the area occupied by the hot body is, the greater the radiative power is [25]. Kliuchevskoi cluster has a lower number of data points (few cloud free images) and is more dispersed, but it is strictly related to the effusion phase described in Figure 8e, where the VRP–S2Pix combination detects the rising in thermal signal and the consecutive decline following the cessation of lava-flow feeding.
At lava lakes, two different behaviors are observed at Erta Ale and Masaya (Figure 12c,d). This results from the fact that Erta Ale dataset is composed of two different eruptive styles and associated thermal regimes (cf. Figure 9a). A first regime of lava-lake thermal emission only is characterized by a lower VRP/S2Pix ratio and some higher VRP—lower S2Pix points associated to overflow events. Conversely, the higher thermal regime is related to the large effusive phase (reaching S2Pix > 102 and VRP > 108 W) and is represented by the dense cluster with isothermal behavior, not by chance, as in Etna and Kliuchevskoi cases (Figure 12a–d). Masaya shows a different thermal behavior, with data clustered in the same region, around S2Pix ~ 102 and 107 W < VRP < 108 W, and not aligned along an isotherm. This feature suggests the presence of a thermal source (the lava lake), essentially confined within the deep crater, with very limited variations in both the hot area and the heat flux.
Lava dome examples draw clusters in the lower leftmost portion of the plots (Figure 12e,f), thus indicating small-size anomalies with an overall low heat radiation involved in dome-forming eruptions, such as degassing, surface cracks on the dome body, collapse events or extrusion phases. The Bezymianny volcano exhibits thermal behavior with most detections having a VRP < 107 W and S2Pix < 20, except for a few points related to explosive events or post-explosive exposure of hot ejecta (Figure 12e). Láscar displays two well-clustered point clouds, the first being sparser, around ~ 106 W, and the second being denser, with a VRP up to 107 W (Figure 12f), that in turn represent the two thermal regimes already observed in the timeseries (Figure 11e). The overall distribution seems partly to cut the isotherms, indicating that periods of higher heat flux are not accompanied by a proportional increase in the hot area exposed.
At open-vent systems, we observe the most scattered distributions among the case studies. Both Stromboli and Villarrica seem to draw a trend with a sharp increase in heat flux, from about 105 to VRP > 108 W, still maintaining a relatively small amount of hot area exposed, generally with S2Pix < 102 (Figure 12g,h). Only a few detections at Stromboli seem to represent a “isothermal” linear relationship between VRP and S2Pix, that are in fact related to an effusive phase occurred during July–August 2019 (cf. with Figure 10a). This behavior could represent an inner character of open-vent volcanoes, where an intensification in the VRP could be related to the increase in the convective dynamics in the upper portion of the magma column, inducing a rising of the magma column level and an increase in vent(s) temperature [20,75], while retaining a hot area quite constant.
These considerations allow us to outline some key points about the algorithm here proposed and its reliability in the detection of volcanic hot spots.
First of all, we observe that the SENTINEL-2 hot-spots number has a high correlation with MIROVA analysis (R2 > 0.8), particularly in low-viscous lava flows cases (i.e., Etna, Erta Ale and Kliuchevskoi; Figure 12a–c), where hot emitting bodies have the possibility to expand over large areas, to emit greater amount of heat flux and, thus, to trigger the sensitivity both of MODIS and MSI/S2 detectors, even though theirs spectral, spatial and revisit time differences.
Conversely, a diverse relationship takes place, when the heat source is partially morphologically constrained, and when the radiative processes are colder or more subtle to detect.
If the number of hot pixels cannot grow due to morphological constrain, the relationship necessarily diverges from an isotherm behavior and become more steep (increasing A parameter in Equation (8)). This occurs particularly at open-vent systems (i.e., Masaya, Villarrica and, in part, Stromboli examples; Figure 12d,g,h) where changes in the heat flux measured by MIROVA (A > 1) are not accompanied by the same evident variations in the hot area exposed to the atmosphere (the vent(s)). Thus, the increasing/decreasing in A value could, in turn, be useful to prove a variability in the temperature, and the consequent emitted heat flux, of the volcanic source.
When the emitter has a small size dimension, such as for lava domes, the VRP/S2Pix distribution substantially falls in the lower left region of the plots, indicating a clear colder thermal behavior, as testified by Bezymianny and Láscar cases. The points distribution can extend to higher VRP and higher S2Pix (following a more linear rule) only during major extrusive phases (Figure 12e,f) or in correspondence of pyroclastic flows produced generally after strong explosions.
Therefore, the proposed analysis turns out to be a useful approach to explore the thermal behavior and evolution of the volcanic processes. Accordingly, the different correlations observed and the relative values of R2 and the occurrence of a linearity between VRP and S2Pix (A parameter) indicate variable relationships between temperature and hot area of volcanic hot emitting body. It is correct and meaningful, from a volcanological point of view, that the amount of VRP produced by a lava dome through hot fumaroles and that of an expanding lava flow by radiation, for examples, have a different related number of hot pixels and thus a different extension of the thermal source. This discrepancy represents the variation in temperature, and we suggest that this method of analysis could be potentially used to explore and classify the thermal signals of a variety of volcanic activities by space-based methods. The comparison between the number of hot pixels detected and the MIROVA signal is thus relevant to both validate the S2 algorithm detection capability and to infer useful insights about volcanic processes and their thermal features.

5. Strengths and Limits

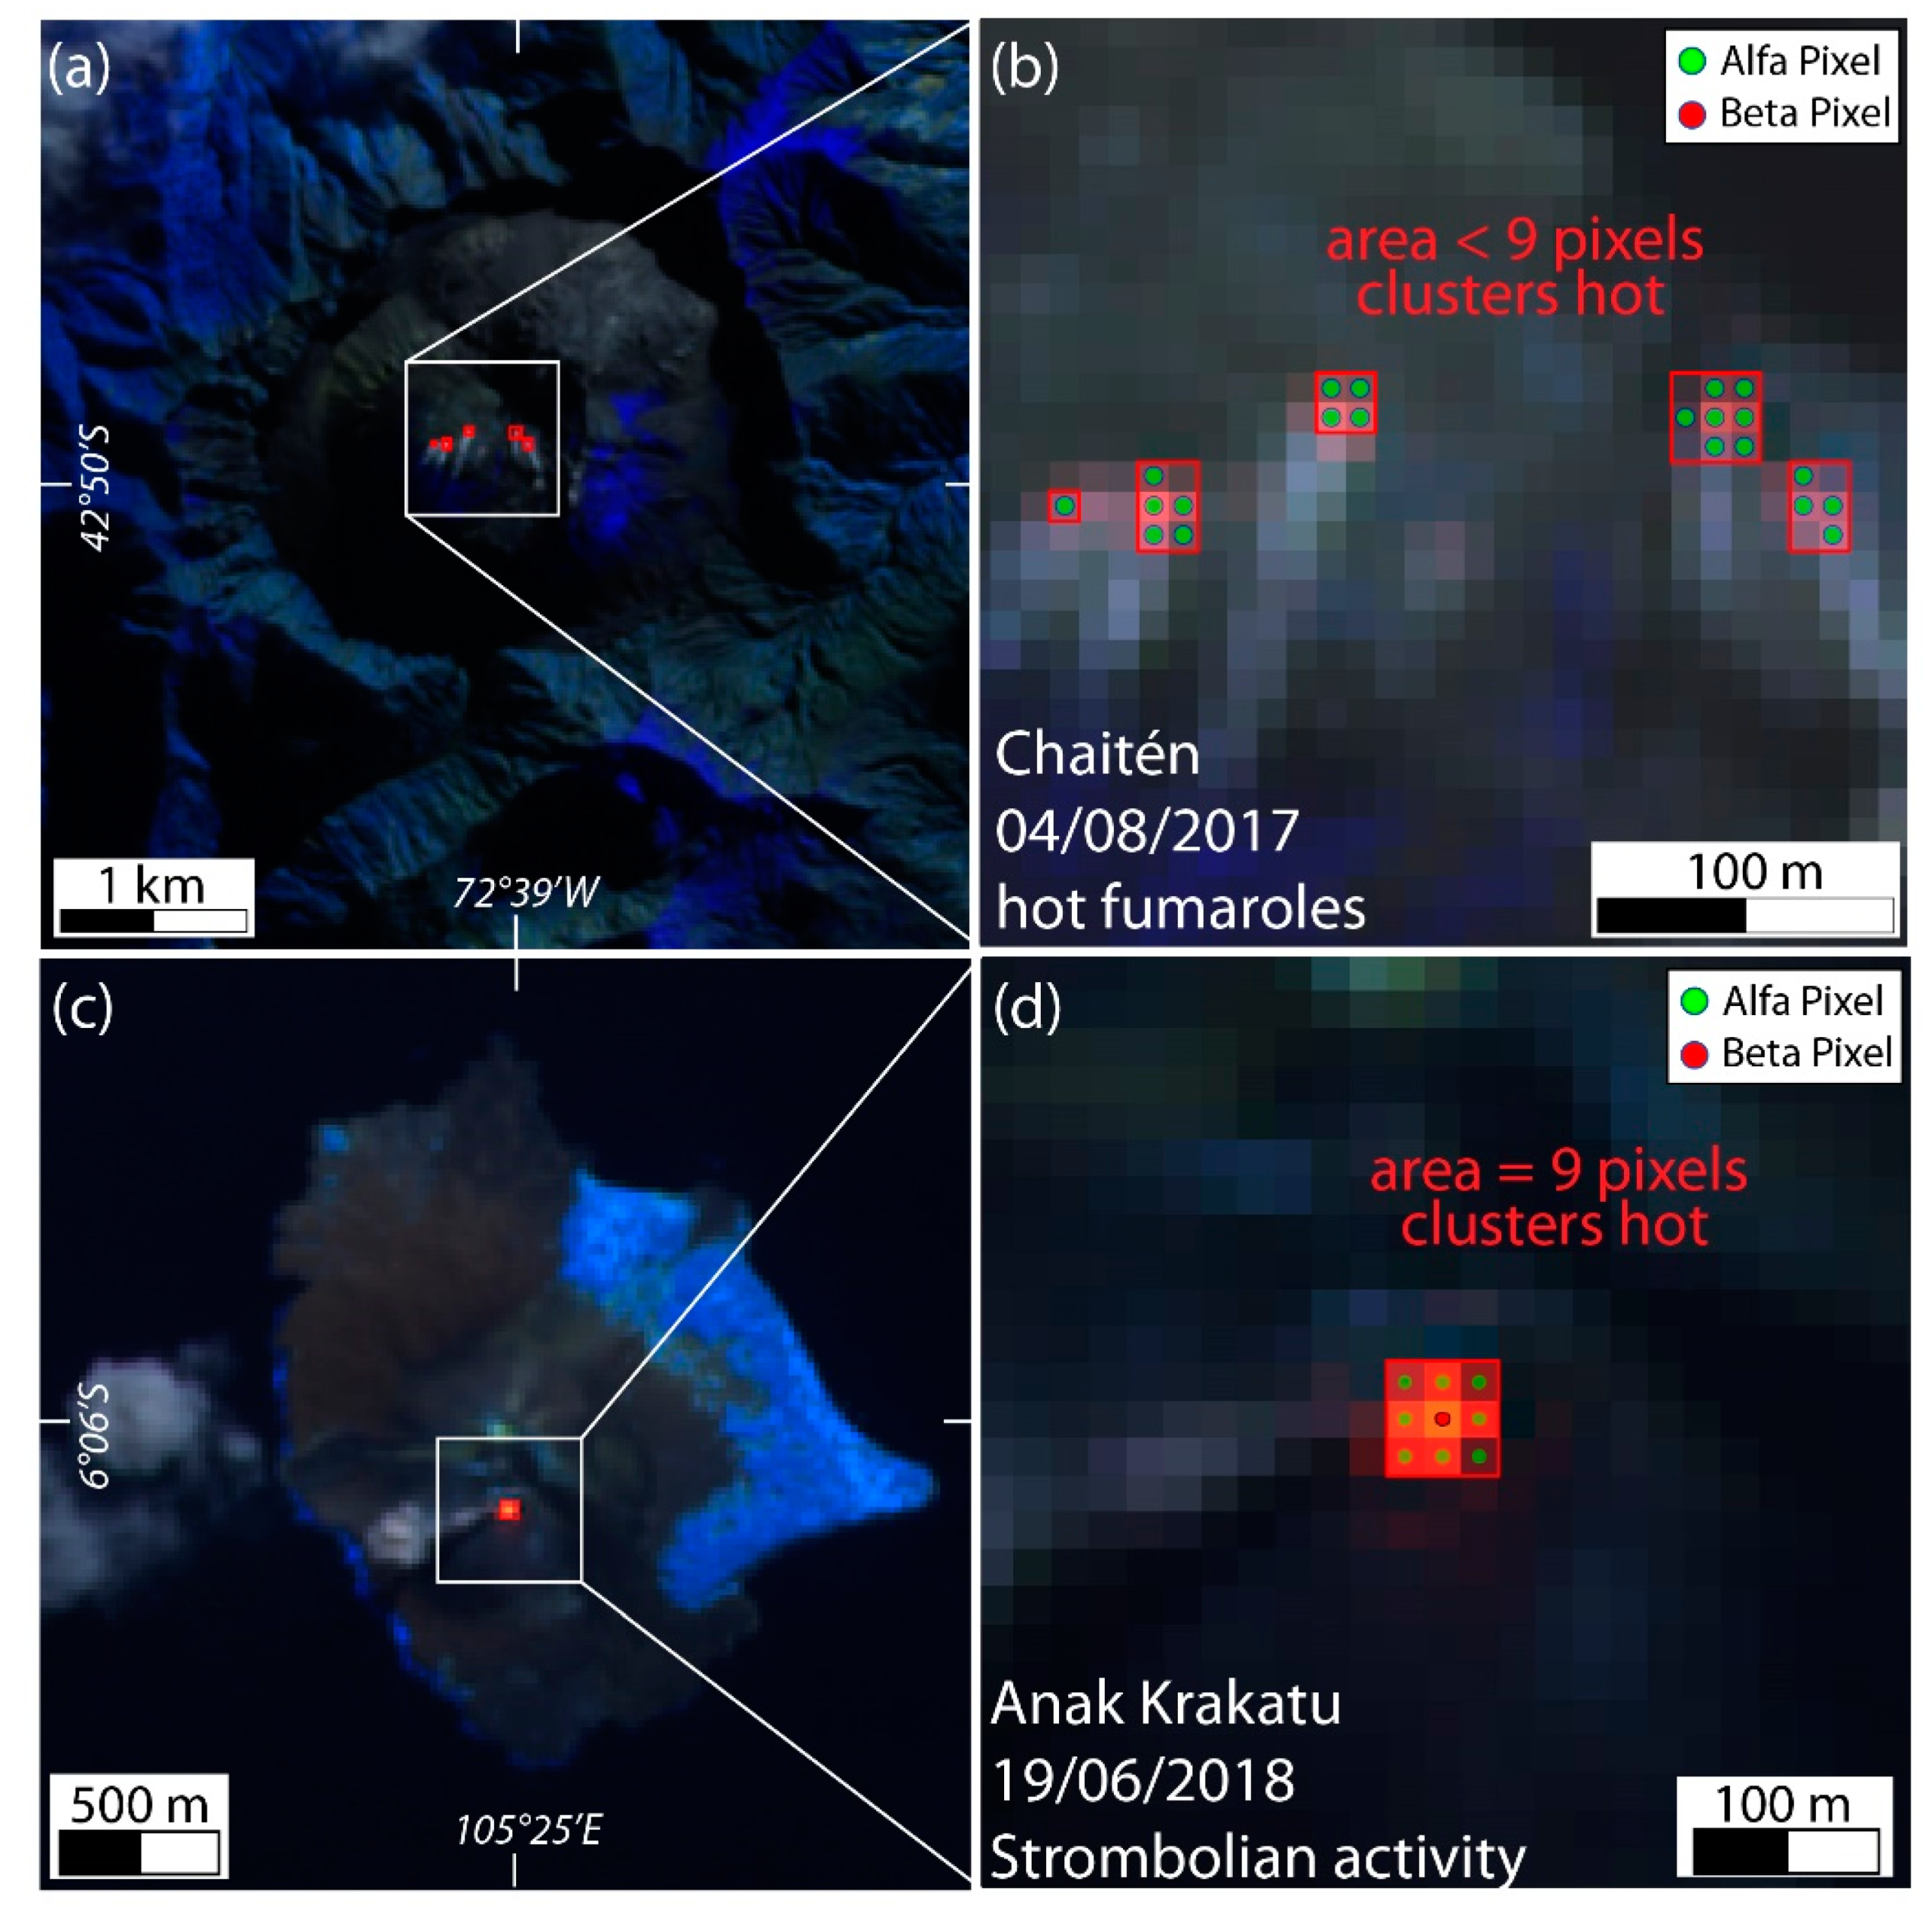
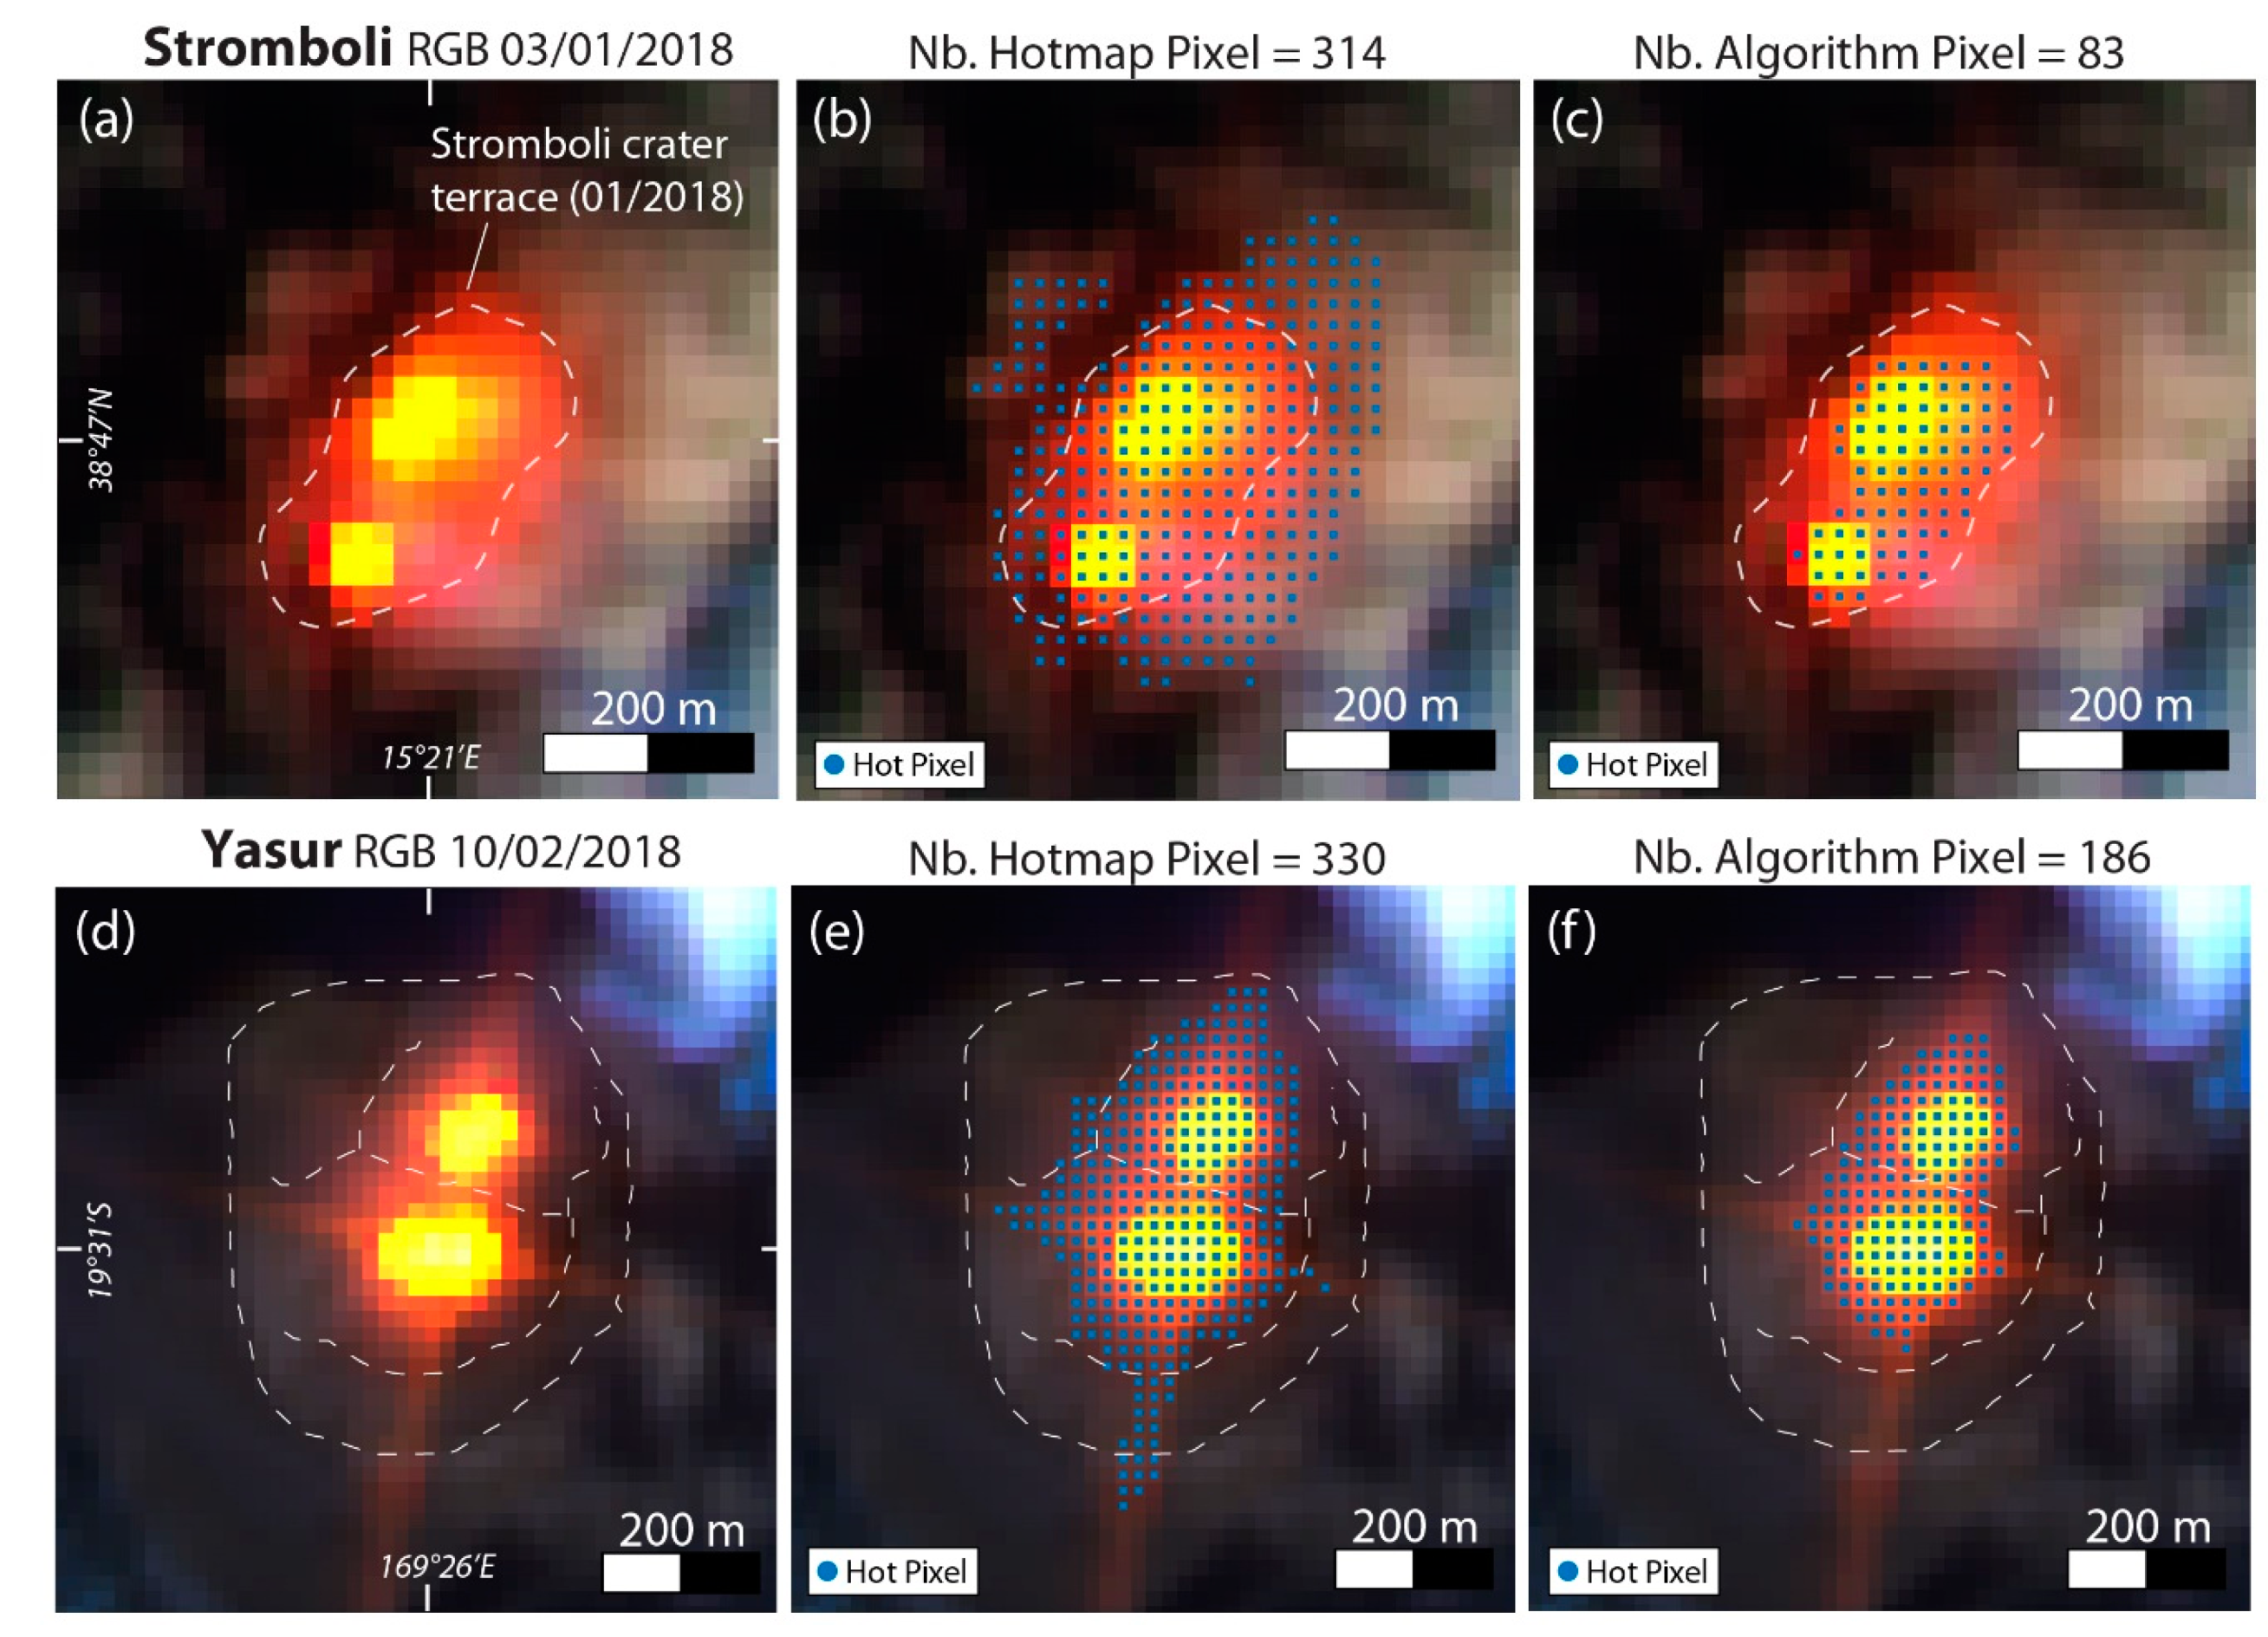
5.1. High-Spatial-Resolution Sensitivity

The most important advantage of SENTINEL-2 MSI imagery products is the high spatial resolution they offer. This feature strongly affects the detection capability and marks a sharp improvement compared to the moderate spatial resolution imagery, such as MODIS. In fact, sensors with higher spatial resolution are more skillful to sense small hot targets, because they cover a bigger proportion of the field of view of the detector element [43]. Detecting small thermal anomalies, minor volcanic events or changes in the locations of subtle hot targets could be extremely useful to notice thermal precursor signals and/or variations in weak but persistent hot spots. Here, we show two examples that clearly reflect this proficiency.
In Figure 13, timeseries of SENTINEL-2 S2Pix and MIROVA VRP are presented, for Merapi (Java Island and Indonesia; [77]) and Ol Doinyo Lengai (Tanzania, [78]) volcanoes. Merapi is the most active Indonesian volcano, located ~25 km from the densely populated town of Yogyakarta, and hosts in a 200 m deep crater, a growing basaltic–andesitic dome regularly disrupted by explosions (up to VEI 4 level) causing pyroclastic flows [79]. Notably, an explosive eruption in 2010 killed about 300 people in the southern area of the volcanic edifice [80].
Ol Doinyo Lengai (OL) volcano is famous for its unique active carbonatite volcanism, producing fluid and low temperature (495–590 °C) natrocarbonatite lavas [81]. Its recent summit thermal features included fumaroles, open vents, or small-scale cooling lava from pools or hornitos [82]. Some works already focused on the thermal analysis of OL activity using MODIS imagery, illustrating the limitations of original MODVOLC algorithm to routinely detect the low-intensity thermal anomalies [82,83] and underlining that these restrictions are mainly due to low temperatures, small area extents and low effusion rates of Ol Doinyo Lengai flows.
Our analysis shows that the MSI-S2 20 m resolution images allow the detection of low thermal hot spots at these two volcanoes, otherwise undetected by MODIS 1 km resolution images (Figure 13). At Merapi (Figure 13a), the algorithm detected very low thermal anomalies (S2Pix = 1) since January 2016 and discontinuous but frequent hot spots during all 2017-2018 (max. S2Pix = 20, the 16/09/2018), when MIROVA system did not detect any (Figure 13b). The first MODIS anomaly is measured during December 2018 (very low < 106 W), followed during June–August 2019 by sporadic low anomalies (max. 2*106 W). In the analyzed period, the SENTINEL-2 SWIR thermal signal precedes by at least two years the first MIROVA detection, giving regarding the thermal activity persistence and locations during the dome evolution.
Similarly, at Ol Doinyo Lengai, the first SENTINEL-2 detection occurs in September 2016 and is followed by several others hot-spot detections, between 1 < S2Pix < 10, during June–September 2017, April–October 2018 (Figure 13c). Notably, the first thermal activity was detected by MIROVA in September 2018 and then intermittently during 2019 (Figure 13c,d). Here, too, the first SENTINEL-2 hot spot anticipated by almost two years the MIROVA detections, demonstrating the sensitivity of the algorithm to detect the small, low-temperature signals produced by the OL volcano.
Despite the lack of the thermally sensitive MIR bands of MODIS, the advantages using the high-spatial-resolution SWIR wavelengths to detect very hot surfaces are thus outstanding, because any hot spot will most likely cover a major portion of a SWIR pixel, resulting in a clear thermal signal detected.
These two examples demonstrate the improved ability of the proposed algorithm, to detect small and low thermal emissions which are undetected by systems like MIROVA. This ability is of great interest in order to identify possible thermal precursors at explosive and high-risk volcanoes, such as Merapi. Moreover, the low temperature lavas of Ol Doinyo Lengai shows the ability of the proposed algorithm to successfully detect volcanic thermal anomalies in a very wide variety of volcanic settings.

5.2. Reflection Effects and False Anomalies

Due to the high sensitivity of the algorithm to detect subtle and low-temperature thermal anomalies, some issues arise in specific cases, generally related to clouds. One of the most difficult cases is when dense and cirrus clouds partially overlap and/or surround volcanogenic-heat-emission sources. Cirrus clouds are thin and semitransparent, able to create thermal halo when covering the heat source. As demonstrated beforehand (see Section 2.3; Figure 7a–c), the proposed contextual algorithm isolates the hottest part of the triggered cluster, which is falsely enlarged by the thermal halo.
In the case of dense clouds covering intense thermal radiations, strong reflection, along with diffraction effects, may occur. In Figure 14a,b, a SENTINEL-2 RGB image of Nyiragongo lava-lake volcano (DR Congo, [84]) in the 8a-11-12 bands is shown, with the relative hot pixels triggered in the α and β conditions by the algorithm. The combined effect of the strong thermal emission produces a “cross-shaped” diffraction spike, and the presence of dense clouds is striking. Here, pixels obscured by clouds become deep red by approaching lava lake because of the sharp reflection and are triggered, mainly by the α condition, as hot pixels by the algorithm (Figure 14b). Moreover, the powerful thermal emission of Nyiragongo lava lake generates an enlargement of the apparent hot area, even when not covered directly by clouds, due to diffraction spike effect on MSI sensor (cf. Figure 7d–f). These pixels are also recognized as hot and alerted by the α condition. Though the thermal emission by Nyiragongo lava lake is not an artifact (the relative measured MIROVA heat flux is about 7 × 10⁸ W), the result clearly overestimates the hot area dimension (Figure 14b). This issue results from the high sensitivity set for the α condition, that, however, as previously demonstrated, allows the detection of low thermal signal. Overall, the main aim being to offer a volcanic global applicable algorithm, able to detect hot spots, including hot-fumaroles and low-temperatures lavas, entails that partial overestimation can occur in specific settings, such as Nyiragongo. A possible solution is to use the SENTINEL-2 clouds mask [85] or to apply a more restrictive thermal algorithm just for a specific volcanic setting, for example limiting the detection to β condition triggered pixels in order to isolate the hottest portion of the detected hot area.

6. Conclusions and Perspectives

We developed a new algorithm for detecting, locating and counting hot thermal anomalies in volcanic environments, with a global applicability, using SENTINEL-2 satellites images. The algorithm is based on a multispectral hybrid approach, whereby SWIR bands 12, 11 and 8a are spectrally, spatially and statistically elaborated, in order to enhance the presence of subpixel hot spots, with a spatial resolution of 20 meters that represents, nowadays, a remarkable profit for volcanic studies.
To explore the algorithm efficiency, the S2-derived number of hot pixel (S2Pix), detected at eight different volcanoes, was compared with the Volcanic Radiative Power (VRP) recorded by the MODIS–MIROVA thermal dataset. The results demonstrate an extremely coherent match in a variety of volcanic settings, involving hot bodies of various temperatures, spatial extent and typology. The match is particularly striking for wide intense thermal emissions such as lava flows, and more generally proves to give complementary information about thermal volcanic status, even if some limitations are still present mainly due to clouds coverage disturbs. Moreover, we have not confined our analysis to MSI SENTINEL-2 SWIR and MODIS–MIROVA MIR trend comparisons, but we explored what these correlations, between number of hot pixels detected (hot area) and the heat flux, could decrypt about thermal features related to different volcanic processes.
Significantly, the algorithm presented here is, as far we know, the first SENTINEL-2 multispectral based volcanic thermal detection process that runs operationally. In fact, the algorithm is part of the multiplatform MOUNTS volcanic monitoring system online since the beginning of 2018 (http://www.mounts-project.com/home; [30]). This system uses the SENTINEL constellation (-1, -2 and -5P) to retrieve and display key parameters volcano monitoring timeseries, such as deformation, heat anomalies and SO2 flux, in near real time.
In this work, we demonstrated, through an almost four-year-long investigation of eight case studies, how SENTINEL-2 thermal signal analysis can enhance the study and monitoring of several volcanic processes, including lava-flow morphometric evaluations, extrusion phases and growing dynamics of lava domes, lava-lake pulsations, fumarolic activity, multiple active craters thermal activity, thermal precursors and new hot spots’ presence, or periods of magma column rising in open-vent volcanoes.
A future perspective for monitoring purposes is to build an integration of the two thermal datasets, joining both the high-spatial-resolution potentialities of MSI SENTINEL-2 and high temporal resolution of MODIS data processed by the MIROVA system, in order to provide a specifically devoted product for the volcanic thermal activity characterization. In Figure 15, an example is provided with an application to Popocatépetl volcano (Mexico, [86]). The two SENTINEL-2 RGB images allow to visualize the thermal anomaly location and status into the crater, with a double zoom visualization 2 × 2 km and 10 × 10 km and immediate estimation of the number of hot pixels and maximum distance from the summit of volcano, while the plots on short (two months) and long (two years) timespan allow to evaluate the thermal activity and to track the evolution of hot area exposed and heat flux radiated. The two RGB S2 images with a different detail level, the number hot pixels and the heat flux produced by volcanic activity, summarized in a near real-time produced output, can provide an easy-to-understand product, rich of relevant qualitative (location and presence of hot spot) and quantitative (heat flux, hot area exposed) information both on the past and current thermal activity state of volcanoes.
Considering the SENTINEL-2 global coverage, and the possible improvement by integrating the LANDSAT 8 OLI data (with 30 m/pixel resolution in the NIR/SWIR bands), a similar output of that exposed in Figure 15, could be produced over the most active volcanoes with a global scale and with a revisit time of a few days. These outputs could be made available to observatories, monitoring centers and local authorities, in order to improve already existing monitoring systems and to contribute to the thermal surveillance of volcanic activity, as already partially suggested by some recent attempts [20,87].
The current availability of satellite sensors with InfraRed detection capabilities in diverse wavelengths (MIR, TIR and SWIR) gives the possibility to characterize and monitor volcanic activity with an unprecedent level of detail. The MSI SENTINEL-2 multichannel thermal detection algorithm proposed here, even if represents a first-stage effort, and its correlation with MODIS–MIROVA analysis, fits into this view and aims to contribute to the monitoring and understanding of volcanic activity on a global scale.

Author Contributions

F.M., D.C. and M.L. conceived of the paper; F.M., D.C. and M.L. worked to the algorithm development; F.M. wrote the manuscript, prepared figures, analyzed MODIS and SENTINEL-2 MSI data; S.V. processed Erta Ale SENTINEL-2 data and worked on algorithm integration into MOUNTS system; D.C., M.L. and S.V. reviewed the paper; D.C., M.L., C.C. and M.R. supervised the preparation of the manuscript. All authors have read and agreed to the published version of the manuscript.

Funding

This research has benefited from funding provided by a collaborative project between the Earth Sciences Departments of the University of Florence and the University of Turin. This research was partially supported by the Italian Ministry for Universities and Research (MIUR).

Acknowledgments

MIROVA is a collaborative project between the Universities of Turin and Florence (Italy). We acknowledge the LANCE–MODIS data system for providing MODIS Near Real Time products. We acknowledge Copernicus Open Access Hub (https://scihub.copernicus.eu/) for the availability of SENTINEL-2 dataset. We thank three anonymous reviewers for their comments which helped improve the manuscript and the Editors for their suggestions and availability.

Conflicts of Interest

The authors declare no conflict of interest.

References

  1. Gawarecki, S.J.; Lyon, R.J.P.; Nordberg, W. Infrared spectral returns and imagery of the Earth from space and their application to geological problems. Sci. Technol. Ser. Am. Astron. Soc. 1965, 4, 13–33. [Google Scholar]
  2. Yokoyama, I. Heat and mass transfer through volcanoes. Riv. Ital. Geofis. 1972, 21, 165–169. [Google Scholar]
  3. Francis, P.W. Infra-red techniques for volcano monitoring and prediction—A review. J. Geol. Soc. Lond. 1979, 136, 355–359. [Google Scholar] [CrossRef]
  4. Oppenheimer, C. Volcanological applications of meteorological satellites. Int. J. Remote Sens. 1998, 19, 2829–2864. [Google Scholar] [CrossRef]
  5. Harris, A.J.L.; Baloga, S.M. Lava discharge rates from satellite-measured heat flux. Geophys. Res. Lett. 2009, 36, L19302. [Google Scholar] [CrossRef]
  6. Wright, R.; Flynn, L.P. On the retrieval of lava-flow surface temperatures from infrared satellite data. Geology 2003, 31, 893–896. [Google Scholar] [CrossRef]
  7. Francis, P.W.; Oppenheimer, C.; Stevenson, D. Endogenous growth of persistently active volcanoes. Nature 1993, 366, 554–557. [Google Scholar] [CrossRef]
  8. Aiuppa, A.; de Moor, J.M.; Arellano, S.; Coppola, D.; Francofonte, V.; Galle, B.; Giudice, G.; Liuzzo, M.; Mendoza, E.; Saballos, A.; et al. Tracking formation of a lava lake from ground and space: Masaya volcano (Nicaragua), 2014–2017. Geochem. Geophys. Geosyst. 2018, 19, 496–515. [Google Scholar] [CrossRef]
  9. Oppenheimer, C.; Francis, P.W.; Rothery, D.A.; Carlton, R.W.T.; Glaze, L.S. Infrared image analysis of volcanic thermal features: Lascar volcano, Chile, 1984–1992. J. Geophys. Res. 1993, 98, 4269–4286. [Google Scholar] [CrossRef]
  10. Werner, C.; Kern, C.; Coppola, D.; Lyons, J.J.; Kelly, P.J.; Wallace, K.L.; Schneider, D.J.; Wessels, R.L. Magmatic degassing, lava dome extrusion, and explosions from Mount Cleveland volcano, Alaska, 2011–2015: Insight into the continuous nature of volcanic activity over multi-year timescales. J. Volcanol. Geotherm. Res. 2017, 337, 98–110. [Google Scholar] [CrossRef]
  11. Ripepe, M.; Pistolesi, M.; Coppola, D.; Delle Donne, D.; Genco, R.; Lacanna, G.; Laiolo, M.; Marchetti, E.; Ulivieri, G.; Valade, S. Forecasting effusive dynamic and decompression rates by magmastatic model at open-vent volcanoes. Sci. Rep. 2017, 7, 3885. [Google Scholar] [CrossRef] [PubMed]
  12. Coppola, D.; Ripepe, M.; Laiolo, M.; Cigolini, C. Modelling satellite-derived magma discharge to explain caldera collapse. Geology 2017, 45, 523–526. [Google Scholar] [CrossRef] [Green Version]
  13. D’Aleo, R.; Bitetto, M.; Delle Donne, D.; Coltelli, M.; Coppola, D.; McCormick Kilbride, B.; Pecora, E.; Ripepe, M.; Salem, L.C.; Tamburello, G.; et al. Understanding the SO2 Degassing Budget of Mt Etna’s Paroxysms: First Clues from the December 2015 Sequence. Front. Earth Sci. 2018, 6, 239. [Google Scholar] [CrossRef] [Green Version]
  14. Coppola, D.; Laiolo, M.; Massimetti, F.; Cigolini, C. Monitoring endogenous growth of open-vent volcanoes by balancing thermal and SO2 emissions data derived from space. Sci. Rep. 2019, 9, 9394. [Google Scholar] [CrossRef] [PubMed] [Green Version]
  15. Harris, A.J.L.; Stevenson, D.S. Thermal observations of degassing open conduits and fumaroles at Stromboli and Vulcano using remotely sensed data. J. Volcanol. Geotherm. Res. 1997, 76, 175–198. [Google Scholar] [CrossRef]
  16. Mia, M.B.; Fujimitsu, Y.; Nishijima, J. Thermal Activity Monitoring of an Active Volcano Using Landsat 8/OLI-TIRS Sensor Images: A Case Study at the Aso Volcanic Area in Southwest Japan. Geosciences 2017, 7, 118. [Google Scholar] [CrossRef] [Green Version]
  17. Cigolini, C.; Coppola, D.; Yokoo, A.; Laiolo, M. The thermal signature of Aso Volcano during unrest episodes detected from space and ground-based measurements. Earth Planets Space 2018, 70, 67. [Google Scholar] [CrossRef]
  18. Ramsey, M.; Harris, A. Volcanology 2020: How will thermal remote sensing of volcanic surface activity evolve over the next decade? J. Volcanol. Geotherm. Res. 2013, 249, 217–233. [Google Scholar]
  19. Harris, A.J.L.; Villeneuve, N.; Di Muro, A.; Ferrazzini, V.; Peltier, A.; Coppola, D.; Favalli, M.; Bachèlery, P.; Froger, J.-L.; Gurioli, L.; et al. Effusive crises at Piton de la Fournaise 2014–2015: A review of a multi-national response model. J. Appl. Volcanol. 2017, 6, 11. [Google Scholar] [CrossRef] [Green Version]
  20. Coppola, D.; Laiolo, M.; Cigolini, C.; Massimetti, F.; Delle Donne, D.; Ripepe, M.; Arias, H.; Barsotti, S.; Parra, C.B.; Centeno, R.G.; et al. Thermal remote sensing for global volcano monitoring: Experiences from the MIROVA system. Front. Earth Sci. 2019, 7, 362. [Google Scholar] [CrossRef] [Green Version]
  21. Blackett, M. An overview of infrared remote sensing of volcanic activity. J. Imaging 2017, 3, 13. [Google Scholar] [CrossRef]
  22. Wright, R.; Flynn, L.P.; Garbeil, H.; Harris, A.J.L.; Pilger, E. MODVOLC: Near-real-time thermal monitoring of global volcanism. J. Volcanol. Geotherm. Res. 2004, 135, 29–49. [Google Scholar] [CrossRef]
  23. Ganci, G.; Bilotta, G.; Cappello, A.; Hérault, A.; Del Negro, C. HOTSAT: A multiplatform system for the satellite thermal monitoring of volcanic activity. Geol. Soc. Lond. Spec. Publ. 2016, 426, 207–221. [Google Scholar] [CrossRef]
  24. Gouhier, M.; Guéhenneux, Y.; Labazuy, P.; Cacault, P.; Decriem, J.; Rivet, S. HOTVOLC: A web-based monitoring system for volcanic hot spots. Geol. Soc. Lond. Spec. Publ. 2016, 426, 223–241. [Google Scholar] [CrossRef]
  25. Coppola, D.; Laiolo, M.; Cigolini, C.; Delle Donne, D.; Ripepe, M. Enhanced volcanic hot-spot detection using MODIS IR data: Results from the MIROVA system. Geol. Soc. Lond. Spec. Publ. 2016, 426, 181–205. [Google Scholar] [CrossRef]
  26. Wright, R.; Flynn, L.; Garbeil, H.; Harris, A.J.L.; Pilger, E. Automated volcanic eruption detection using MODIS. Remote Sens. Environ. 2002, 82, 135–155. [Google Scholar] [CrossRef] [Green Version]
  27. Harris, A.J.L. Thermal Remote Sensing of Active Volcanoes. A User’s Manual; Cambridge University Press: Cambridge, UK, 2013; p. 736. [Google Scholar]
  28. Rothery, D.A.; Coppola, D.; Saunders, C. Analysis of volcanic activity patterns using MODIS thermal alerts. Bull. Volcanol. 2005, 67, 539–556. [Google Scholar] [CrossRef] [Green Version]
  29. Steffke, A.M.; Harris, A.J.L. A review of algorithms for detecting volcanic hot spots in satellite infrared data. Bull. Volcanol. 2011, 73, 1109–1137. [Google Scholar] [CrossRef]
  30. Valade, S.; Ley, A.; Massimetti, F.; D’Hondt, O.; Laiolo, M.; Coppola, D.; Loibl, D.; Hellwich, O.; Walter, T.R. Towards Global Volcano Monitoring Using Multisensor Sentinel Missions and Artificial Intelligence: The MOUNTS Monitoring System. Remote Sens. 2019, 11, 1528. [Google Scholar] [CrossRef] [Green Version]
  31. Marchese, F.; Neri, M.; Falconieri, A.; Lacava, T.; Mazzeo, G.; Pergola, N.; Tramutoli, V. The Contribution of Multi-Sensor Infrared Satellite Observations to Monitor Mt. Etna (Italy) Activity during May to August 2016. Remote Sens. 2018, 10, 1948. [Google Scholar] [CrossRef] [Green Version]
  32. Blackett, M. Early analysis of Landsat-8 thermal infrared sensor imagery of volcanic activity. Remote Sens. 2014, 6, 2282–2295. [Google Scholar] [CrossRef] [Green Version]
  33. Mia, M.; Fujimitsu, Y.; Nishijima, J. Monitoring of Thermal Activity at the Hatchobaru–Otake Geothermal Area in Japan Using Multi-Source Satellite Images—With Comparisons of Methods, and Solar and Seasonal Effects. Remote Sens. 2018, 10, 1430. [Google Scholar] [CrossRef] [Green Version]
  34. Ramsey, M.S. Synergistic Use of Satellite Thermal Detection and Science: A Decadal Perspective Using ASTER. Geol. Soc. Spec. Publ. 2016, 426, 115–136. [Google Scholar] [CrossRef] [Green Version]
  35. Reath, K.; Pritchard, M.; Moruzzi, S.; Alcott, A.; Coppola, D.; Pieri, D. The AVTOD (ASTER Volcano Thermal Output Database) Latin America Archive. J. Volcanol. Geotherm. Res. 2019, 376, 62–74. [Google Scholar] [CrossRef] [Green Version]
  36. Drusch, M.; Del Bello, U.; Carlier, S.; Colin, O.; Fernandez, V.; Gascon, F.; Hoersch, B.; Isola, C.; Laberinti, P.; Martimort, P. Sentinel-2: ESA’s optical high-resolution mission for GMES operational services. Remote Sens. Environ. 2012, 120, 25–36. [Google Scholar] [CrossRef]
  37. Laiolo, M.; Ripepe, M.; Cigolini, C.; Coppola, D.; Della Schiava, M.; Genco, R.; Innocenti, L.; Lacanna, G.; Marchetti, E.; Massimetti, F.; et al. Space-and Ground-Based Geophysical Data Tracking of Magma Migration in Shallow Feeding System of Mount Etna Volcano. Remote Sens. 2019, 11, 1182. [Google Scholar] [CrossRef] [Green Version]
  38. Plank, S.; Walter, T.R.; Martinis, S.; Cesca, S. Growth and collapse of a littoral lava dome during the 2018/19 eruption of Kadovar Volcano, Papua New Guinea, analyzed by multi-sensor satellite imagery. J. Volcanol. Geotherm. Res. 2019, 388, 106704. [Google Scholar] [CrossRef]
  39. Plank, S.; Marchese, F.; Filizzola, C.; Pergola, N.; Neri, M.; Nolde, M.; Martinis, S. The July/August 2019 Lava Flows at the Sciara del Fuoco, Stromboli–Analysis from Multi-Sensor Infrared Satellite Imagery. Remote Sens. 2019, 11, 2879. [Google Scholar] [CrossRef] [Green Version]
  40. Corradino, C.; Ganci, G.; Cappello, A.; Bilotta, G.; Hérault, A.; Del Negro, C. Mapping Recent Lava Flows at Mount Etna Using Multispectral Sentinel-2 Images and Machine Learning Techniques. Remote Sens. 2019, 11, 1916. [Google Scholar] [CrossRef] [Green Version]
  41. Aufaristama, M.; Hoskuldsson, A.; Jonsdottir, I.; Ulfarsson, M.O.; Erlangga, I.G.D.. Thordarson, T. Thermal model of lava in Mt. Agung during December 2017 episodes derived from Integrated SENTINEL 2A and ASTER remote sensing datasets. In Proceedings of the IOP Conference Series: Earth and Environmental Science; Padjadjaran Earth Dialogues, International Symposium on Geophysical Issues, Bandung, Indonesia, 2–4 July 2018; Volume 311, p. 012016. [Google Scholar]
  42. Gray, D.M.; Burton-Johnson, A.; Fretwell, P.T. Evidence for a lava lake on Mt. Michael volcano, Saunders Island (South Sandwich Islands) from Landsat, Sentinel-2 and ASTER satellite imagery. J. Volcanol. Geotherm. Res. 2019, 379, 60–71. [Google Scholar] [CrossRef]
  43. Murphy, S.W.; de Souza Filho, C.R.; Wright, R.; Sabatino, G.; Pabon, R.C. HOTMAP: Global hot target detection at moderate spatial resolution. Remote Sens. Environ. 2016, 177, 78–88. [Google Scholar] [CrossRef]
  44. Giglio, L.; Csiszar, I.; Restás, Á.; Morisette, J.T.; Schroeder, W.; Morton, D.; Justice, C.O. Active fire detection and characterization with the advanced spaceborne thermal emission and reflection radiometer (ASTER). Remote Sens. Environ. 2008, 112, 3055–3063. [Google Scholar] [CrossRef]
  45. Schroeder, W.; Oliva, P.; Giglio, L.; Quayle, B.; Lorenz, E.; Morelli, F. Active fire detection using landsat-8/OLI data. Remote Sens. Environ. 2016, 185, 210–220. [Google Scholar] [CrossRef] [Green Version]
  46. Roteta, E.; Bastarrika, A.; Padilla, M.; Storm, T.; Chuvieco, E. Development of a Sentinel-2 burned area algorithm: Generation of a small fire database for sub-Saharan Africa. Remote Sens. Environ. 2019, 222, 1–17. [Google Scholar] [CrossRef]
  47. Marchese, F.; Genzano, N.; Neri, M.; Falconieri, A.; Mazzeo, G.; Pergola, N. A Multi-Channel Algorithm for Mapping Volcanic Thermal Anomalies by Means of Sentinel-2 MSI and Landsat-8 OLI Data. Remote Sens. 2019, 11, 2876. [Google Scholar] [CrossRef] [Green Version]
  48. Blackett, M.; Wooster, M.J. Evaluation of SWIR-based methods for quantifying active volcano radiant emissions using NASA EOS-ASTER data. Geomat. Nat. Haz. Risk 2:1 2011, 2, 51–78. [Google Scholar] [CrossRef] [Green Version]
  49. ESA Sentinel Online. Missions, SENTINEL 2. Available online: https://sentinel.esa.int/web/sentinel/missions/sentinel-2 (accessed on 11 December 2019).
  50. Li, J.; Roy, D.P. A Global Analysis of Sentinel-2A, Sentinel-2B and Landsat-8 Data Revisit Intervals and Implications for Terrestrial Monitoring. Remote Sens. 2017, 9, 902. [Google Scholar]
  51. ESA Sentinel Online. User Guides. Sentinel-2 MSI. Available online: https://sentinel.esa.int/web/sentinel/user-guides/sentinel-2-msi (accessed on 11 December 2019).
  52. Copernicus Open Access Hub. Available online: https://scihub.copernicus.eu/dhus/#/home (accessed on 11 December 2019).
  53. AWS S3. Registry of Open Data on AWS. Available online: https://registry.opendata.aws/ (accessed on November 2019).
  54. AWS Documentation. Requester Pays Buckets. Available online: https://docs.aws.amazon.com/AmazonS3/latest/dev/sRequesterPaysBuckets.html (accessed on November 2019).
  55. Global Volcanism Program. In Volcanoes of the World; Venzke, E. (Ed.) Smithsonian Institution: Washington, DC, USA, 2013; Available online: https://0-doi-org.brum.beds.ac.uk/10.5479/si.GVP.VOTW4-2013 (accessed on 2 March 2020).
  56. Sterckx, S.; Knaeps, S.; Kratzer, S.; Ruddick, K. SIMilarity Environment Correction (SIMEC) applied to MERIS data over inland and coastal waters. Remote Sens. Environ. 2015, 157, 96–110. [Google Scholar] [CrossRef]
  57. Global Volcanism Program. In Volcanoes of the World; Chaitén (358041), Vision 4.8.5; Venzke, E. (Ed.) Smithsonian Institution: Washington, DC, USA, 2013; Available online: https://volcano.si.edu/volcano.cfm?vn=358041 (accessed on 11 December 2019). [CrossRef]
  58. Global Volcanism Program. In Volcanoes of the World; Krakatau (262000), Vision 4.8.5; Venzke, E. (Ed.) Smithsonian Institution: Washington, DC, USA, 2013; Available online: https://volcano.si.edu/volcano.cfm?vn=262000 (accessed on 11 December 2019). [CrossRef]
  59. Walter, T.R.; Haghshenas Haghighi, M.; Schneider, F.M.; Coppola, D.; Motagh, M.; Saul, J.; Babeyko, A.; Dahm, T.; Troll, V.R.; Tilmann, F.; et al. Complex hazard cascade culminating in the Anak Krakatau sector collapse. Nat. Commun. 2019, 10, 4339. [Google Scholar] [CrossRef]
  60. Global Volcanism Program. In Volcanoes of the World; Erta Ale (221080), Vision 4.8.5; Venzke, E. (Ed.) Smithsonian Institution: Washington, DC, USA, 2013; Available online: https://volcano.si.edu/volcano.cfm?vn=221080 (accessed on 11 December 2019). [CrossRef]
  61. Global Volcanism Program. In Volcanoes of the World; Etna (211060), Vision 4.8.5; Venzke, E. (Ed.) Smithsonian Institution: Washington, DC, USA, 2013; Available online: https://volcano.si.edu/volcano.cfm?vn=211060 (accessed on 11 December 2019). [CrossRef]
  62. Global Volcanism Program. In Volcanoes of the World; Stromboli (211040), Vision 4.8.5; Venzke, E. (Ed.) Smithsonian Institution: Washington, DC, USA, 2013; Available online: https://volcano.si.edu/volcano.cfm?vn=211040 (accessed on 11 December 2019). [CrossRef]
  63. Global Volcanism Program. In Volcanoes of the World; Yasur (341090), Vision 4.8.5; Venzke, E. (Ed.) Smithsonian Institution: Washington, DC, USA, 2013; Available online: https://volcano.si.edu/volcano.cfm?vn=341090 (accessed on 11 December 2019). [CrossRef]
  64. Global Volcanism Program. In Volcanoes of the World; Klyuchevskoy (300260), Vision 4.8.5; Venzke, E. (Ed.) Smithsonian Institution: Washington, DC, USA, 2013; Available online: https://volcano.si.edu/volcano.cfm?vn=300260 (accessed on 11 December 2019). [CrossRef]
  65. Global Volcanism Program. In Volcanoes of the World; Masaya (344100), Vision 4.8.5; Venzke, E. (Ed.) Smithsonian Institution: Washington, DC, USA, 2013; Available online: https://volcano.si.edu/volcano.cfm?vn=344100 (accessed on 11 December 2019). [CrossRef]
  66. Global Volcanism Program. In Volcanoes of the World; Villarrica (357120), Vision 4.8.5; Venzke, E. (Ed.) Smithsonian Institution: Washington, DC, USA, 2013; Available online: https://volcano.si.edu/volcano.cfm?vn=357120 (accessed on 11 December 2019). [CrossRef]
  67. Global Volcanism Program. In Volcanoes of the World; Bezymianny (300250), Vision 4.8.5; Venzke, E. (Ed.) Smithsonian Institution: Washington, DC, USA, 2013; Available online: https://volcano.si.edu/volcano.cfm?vn=300250 (accessed on 11 December 2019). [CrossRef]
  68. Global Volcanism Program. In Volcanoes of the World; Láscar (355100), Vision 4.8.5; Venzke, E. (Ed.) Smithsonian Institution: Washington, DC, USA, 2013; Available online: https://volcano.si.edu/volcano.cfm?vn=355100 (accessed on 11 December 2019). [CrossRef]
  69. ESA Sentinel Online. User Guides. Sentinel-2 MSI. S2-MSI Document Library. Sentinel-2 L1C Data Quality Report Issue 48 (February 2020). Available online: https://sentinel.esa.int/documents/247904/685211/Sentinel-2_L1C_Data_Quality_Report (accessed on January 2020).
  70. Wooster, M.J.; Zhukov, B.; Oertel, D. Fire radiative energy for quantitative study of biomass burning: Derivation from the BIRD experimental satellite and comparison to MODIS fire products. Remote Sens. Environ. 2003, 86, 83–107. [Google Scholar] [CrossRef]
  71. Barnie, T.D.; Oppenheimer, C.; Pagli, C. Does the lava lake of Erta‘Ale volcano respond to regional magmatic and tectonic events? An investigation using Earth Observation data. Geol. Soc. Lond. Spec. Publ. 2016, 420, 181–208. [Google Scholar] [CrossRef]
  72. Moore, C.; Wright, T.; Hooper, A.; Biggs, J. The 2017 eruption of Erta ’Ale Volcano, Ethiopia: Insights into the shallow axial plumbing system of an incipient mid-ocean ridge. Geochem. Geophys. Geosyst. 2019, 20, 5727–5743. [Google Scholar] [CrossRef]
  73. Pering, T.D.; Ilanko, T.; Wilkes, T.C.; England, R.A.; Silcock, S.R.; Stanger, L.R.; Willmott, J.R.; Bryant, R.G.; McGonigle, A.J.S. A Rapidly Convecting Lava Lake at Masaya Volcano, Nicaragua. Front. Earth Sci. 2019, 6, 241. [Google Scholar] [CrossRef]
  74. Rose, W.I.; Palma, J.L.; Delgado Granados, H.; Varley, N. Open-vent volcanism and related hazards: Overview. Geol. Soc. Lond. Spec. Publ. 2013, 498, 7–13. [Google Scholar]
  75. Coppola, D.; Piscopo, D.; Laiolo, M.; Cigolini, C.; Delle Donne, D.; Ripepe, M. Radiative heat power at Stromboli volcano during 2000–2011: Twelve years of MODIS observations. J. Volcanol. Geotherm. Res. 2012, 215, 48–60. [Google Scholar] [CrossRef] [Green Version]
  76. Palma, J.L.; Calder, E.S.; Basualto, D.; Blake, S.; Rothery, D.A. Correlations between SO2 flux, seismicity, and outgassing activity at the open vent of Villarrica volcano, Chile. J. Geophys. Res. 2008, 113, B10201. [Google Scholar] [CrossRef] [Green Version]
  77. Global Volcanism Program. In Volcanoes of the World; Merapi (263250), Vision 4.8.5; Venzke, E. (Ed.) Smithsonian Institution: Washington, DC, USA, 2013; Available online: https://volcano.si.edu/volcano.cfm?vn=263250 (accessed on 11 December 2019). [CrossRef]
  78. Global Volcanism Program. In Volcanoes of the World; Ol Doinyo Lengai (222120), Vision 4.8.5; Venzke, E. (Ed.) Smithsonian Institution: Washington, DC, USA, 2013; Available online: https://volcano.si.edu/volcano.cfm?vn=222120 (accessed on 11 December 2019). [CrossRef]
  79. Pallister, J.S.; Schneider, D.J.; Griswold, J.P.; Keeler, R.H.; Burton, W.C.; Noyles, C.; Newhall, C.G.; Ratdomopurbo, A. Merapi 2010 eruption—Chronology and extrusion rates monitored with satellite radar and used in eruption forecasting. J. Volcanol. Geotherm. Res. 2013, 261, 144–152. [Google Scholar] [CrossRef]
  80. Surono, M.; Jousset, P.; Pallister, J.; Boichu, M.; Buongiorno, M.F.; Budisantoso, A.; Costa, F.; Andreastuti, S.; Prata, F.; Schneider, D.; et al. The 2010 explosive eruption of Java’s Merapi volcano—A ‘100-year’ event. J. Volcanol. Geotherm. Res. 2012, 241, 121–135. [Google Scholar] [CrossRef] [Green Version]
  81. Dawson, J.B.; Keller, J.; Nyamweru, C. Historic and recent eruptive activity of Oldoinyo Lengai. In Carbonatite Volcanism; Springer: Berlin/Heidelberg, Germany, 1995; Volume 4, pp. 4–22. [Google Scholar]
  82. Vaughan, R.G.; Kervyn, M.; Realmuto, V.; Abrams, M.; Hook, S.J. Satellite measurements of recent volcanic activity at Oldoinyo Lengai, Tanzania. J. Volcanol. Geotherm. Res. 2008, 173, 196–206. [Google Scholar] [CrossRef] [Green Version]
  83. Kervyn, M.; Ernst, G.G.J.; Harris, A.J.L.; Belton, F.; Mbede, E.; Jacobs, P. Thermal remote sensing of the low-intensity carbonatite volcanism of Oldoinyo Lengai, Tanzania. Int. J. Remote Sens. 2008, 29, 6467–6499. [Google Scholar] [CrossRef]
  84. Global Volcanism Program. In Volcanoes of the World; Nyiragongo (223030), Vision 4.8.5; Venzke, E. (Ed.) Smithsonian Institution: Washington, DC, USA, 2013; Available online: https://volcano.si.edu/volcano.cfm?vn=223030 (accessed on 11 December 2019). [CrossRef]
  85. ESA Sentinel Online. Technical Guides. Sentinel-2 MSI. Cloud Masks. Available online: https://sentinel.esa.int/web/SENTINEL/technical-guides/SENTINEL-2-msi/level-1c/cloud-masks (accessed on January 2020).
  86. Global Volcanism Program. In Volcanoes of the World; Popocatépetl (257100), Vision 4.8.5; Venzke, E. (Ed.) Smithsonian Institution: Washington, DC, USA, 2013; Available online: https://volcano.si.edu/volcano.cfm?vn=257100 (accessed on 11 December 2019). [CrossRef]
  87. Massimetti, F.; Coppola, D.; Laiolo, M.; Cigolini, C.; Ripepe, M. First comparative results from SENTINEL-2 and MODIS-MIROVA volcanic thermal dataseries. In Proceedings of the CoV10 IAVCEI General Assembly, Naples, Italy, 2–7 September 2018. [Google Scholar]
Figure 1. Geographic locations of volcanoes investigated in this work. With black triangles are indicated examples of algorithm applications presented in this work; with red triangles the case studies on which MSI SENTINEL-2 and MODIS–MIROVA 2016–2019 timeseries are here shown.
Remotesensing 12 00820 g001
Figure 2. SENTINEL-2 images of ρ8a (865 nm), ρ11 (1610 nm) and ρ12 (2190 nm) bands in grayscale colors, over Stromboli summit volcano, 12/07/2018. The three separated thermal anomalies, particularly evident in the 11 and 12 bands, are related to the three main summit craters of Stromboli.
Remotesensing 12 00820 g002
Figure 3. Flowchart of the algorithm. In blue boxes are the conceptual steps; in yellow, the logical conditions; and in red, the results. On left side, the three main steps of the algorithm are indicated.
Remotesensing 12 00820 g003
Figure 4. Nine pixels threshold. (a) Algorithm application on Chaitén volcano, the 04/08/2017; (b) red boxes represent the bounding box of each alerted cluster and isolated the hot fumaroles; (c) algorithm application on Anak Krakatau volcano, 19/06/2018; (d) red box represent the bounding box of the alerted cluster and isolated the hot-spot pixels related to strombolian activity. With green and red dots, hot pixels triggered by α and β conditions, respectively.
Remotesensing 12 00820 g004
Figure 5. Algorithm application on Erta Ale [60] lava flow case, 19/01/2017. (a) Normal Probability Distribution plot of the Thermal Index (TI) of the analyzed cluster. In red and blue, hot selected and discarded pixels. Dotted black, solid black, dotted yellow, dotted green and red lines represent, respectively, the theoretical normal distribution model, TImean, TIflex, TI30% and TIthres hot threshold, fitting with the TIflex in this case. (b) SENTINEL-2 RGB (12-11-8a) image zoomed over cluster analyzed; in green, red and withe, alfa-triggered, beta-triggered and discarded pixels; respectively.
Remotesensing 12 00820 g005
Figure 6. Algorithm application on Etna [61] lava flow small portion, 26/03/2017. (a) Normal Probability Distribution plot of the Thermal Index (TI) of the analyzed cluster. In red and blue, hot selected and discarded pixels. Dotted black, solid black, dotted yellow, dotted green and red lines represent, respectively, the theoretical normal distribution model, TImean, TIflex, TI30% and TIthres hot threshold, fitting with the TIflex in this case. (b) SENTINEL-2 RGB (12-11-8a) image zoomed over cluster analyzed; in green, red and withe, alfa-triggered, beta-triggered and discarded pixels; respectively.
Remotesensing 12 00820 g006
Figure 7. Application of the algorithm and comparison with Hotmap. (a) SENTINEL-2 MSI RGB (12-11-8a) image, over Stromboli crater summit area (roughly delimitated with a white dotted line by Google Earth analysis), 03/01/2018; (b) Application of Hotmap algorithm; (c) this work’s hot-spot algorithm; (d) SENTINEL-2 MSI RGB (12-11-8a) image, over summit crater of the Yasur pyroclastic cone, composed by the northern and southern vents (roughly delimitated with white dotted lines by Google Earth analysis), 10/02/2018; (e) application of Hotmap algorithm; (f) this work hot-spot algorithm. Blue dots mark the hot detected pixels by the respective algorithms.
Remotesensing 12 00820 g007
Figure 8. S2Pix and VRP–MIROVA thermal comparison on Etna and Kliuchevskoi lava-flow-type case studies. In (a,e), y-logarithmic timeseries. With blue stem on left y-axis, MIROVA VRP heat flux in Watt, with red dots on right y-axis the S2Pix. With yellow pale fields, major effusive phases are indicated for Etna case. In (bd), images, particulars of thermal emissions and volcanic activity over Etna summit. In (fh), particulars of thermal emissions and lava flows over Kliuchevskoi summit area.
Remotesensing 12 00820 g008
Figure 9. S2Pix and VRP–MIROVA thermal comparison on Erta Ale and Masaya lava-lake-type case studies. In (a,e), y-logarithmic timeseries. With blue stem on left y-axis, MIROVA VRP heat flux in Watt; with red dots on right y-axis, the S2Pix. Yellow dotted line in (a) distinguishes the lava-lake activity to the lava-flows periods at Erta Ale. In (bd), particulars of thermal emissions and lava flows over Erta Ale area. In (fh), particulars of thermal emissions and lava-lake activity of Masaya.
Remotesensing 12 00820 g009
Figure 10. S2Pix and VRP–MIROVA thermal comparison on Stromboli and Villarrica open-vent-type case studies. In (a,e) y-logarithmic timeseries. With blue stem on left y-axis, MIROVA VRP heat flux in Watt; with red dots on right y-axis the S2Pix. With yellow fields, major effusive and overflows phases are indicated for Stromboli case. In (bd), particulars of thermal emissions and strombolian to lava flow activity over Stromboli. In (fh), particulars of thermal emissions and open-vent activity of Villarrica.
Remotesensing 12 00820 g010
Figure 11. S2Pix and VRP–MIROVA thermal comparison on Bezymianny and Láscar lava-dome-type case studies. In (a,e), y-logarithmic timeseries. With blue stem on left y-axis, MIROVA VRP heat flux in Watt; with red dots on right y-axis, the S2Pix. In (bd), particulars of thermal emissions and lava dome activity over Bezymianny summit area. In (fh), particulars of thermal emissions and dome activity of Láscar.
Remotesensing 12 00820 g011
Figure 12. Log graphs for volcanic cases analyzed, (AH). On y-axis, VRP (Watt); on x-axis S2Pix, the number of hot pixels. In each graph, red dots represent the closest SENTINEL-2 and MIROVA data, in an interval of ± 24 h from each S2 cloudy free acquisition; the red line represents the best fit regression for the data. R2 values, fitting line equation and number of data are reported.
Remotesensing 12 00820 g012
Figure 13. SENTINEL-2 and MIROVA thermal comparison. Case studies of Merapi and Ol Doinyo Lengai. In (a,c), logarithmic timeseries. With blue stem on left y-axis, MIROVA VRP heat flux in Watt, with red dots on right y-axis S2Pix. In (b,c), composition images, particulars of NTI–MODIS zoomed maps from MIROVA (see [25]) are reported on top side, SENTINEL-2 MSI RGB (12-11-8a bands analysis) zooms are reported on the bottom side. The MODIS and SENTINEL-2 MSI images are taken in the same day acquisition and with the closest timing (hours or minutes) available between the acquisitions.
Remotesensing 12 00820 g013
Figure 14. Limits of algorithm detection. (a) SENTINEL-2 RGB image (12-11-8a bands analysis), over Nyiragongo lava-lake volcano, 29/11/2016; (b) application of detection algorithm at the same image, in which green area represent the α-triggered pixels and red area represent the β-triggered pixels.
Remotesensing 12 00820 g014
Figure 15. Model of output integration of SENTINEL-2 MSI and MODIS–MIROVA thermal data on Popocatépetl volcano. Left panels show the SENTINEL-2 RGB (bands 12, 11 and 8a). On the top-left, a 2 × 2 km zoomed-in view over crater area; on the bottom-left, a 10 × 10 granule with an estimation of the number of hot pixels and the maximum distance of hot pixels from the volcano summit [86]. On the right, two thermal y-logarithmic timeseries, two months and two years on the top and bottom respectively, with MIROVA thermal flux in Watt, blue stems, and S2Pix in red dots.
Remotesensing 12 00820 g015
Table 1. Wavebands of MSI sensor onboard of SENTINEL-2 satellites.
Band NumberResolution (m)Central Wavelength (µm)Purpose
Band 1600.443Aerosol detection
Band 2100.490Blue
Band 3100.560Green
Band 4100.665Red
Band 5200.705Vegetation classification
Band 6200.740Vegetation classification
Band 7200.783Vegetation classification
Band 8100.842Near Infrared
Band 8a200.865Vegetation classification (NIR/SWIR)
Band 9600.945Water vapor
Band 10601.375SWIR - Cirrus
Band 11201.610SWIR
Band 12202.190SWIR
Table 2. Results of evaluation of the SENTINEL-2 hot-spot algorithm. 1 N. images analyzed; 2 N. images with at least one alert detected by the algorithm; 3 N. images with at least one true volcanic alert detected by the algorithm; 4 N. images with at least one true volcanic alert; 5 N. images with at least one true volcanic alert missed by the algorithm; 6 Percentage of successful detections = (Algorithm volcanic alerts/True volcanic alerts) * 100; 7 N. images with at least one fire/human-related alert detected by the algorithm; 8 N. images with at least one false alert detected by the algorithm. 9 Percentage of false detections = (Algorithm false alerts/Algorithm alerts) * 100; 10 N. images with at least one false alert related to S2-MSI sensor artifacts detected by the algorithm; 11 Percentage of false detections considering also the S2-MSI derived false alerts = ((Algorithm false alerts + S2-MSI derived false alerts)/Algorithm alerts) * 100.
VOLCANOS2 Images 1Algorithm Alerts 2Algorithm Volcanic Alerts 3True Volcanic Alerts 4Missed Volcanic Alerts 5Successful Detection (%) 6Fires/Anthropogenic Alerts 7
ETNA4172752592701195.92% 7
KLIUCHEVSKOI337292529486.21%0
ERTA ALE207190190197796.44%0
MASAYA166124117120397.50%16
STROMBOLI243134128132496.96%7
VILLARRICA337184183186398.38%1
BEZYMIANNY3381261181371986.13%0
LÁSCAR166116116120496.66%0
False Alerts
VOLCANOAlgorithm False Alerts 8Algorithm False Detection (%) 9S2-MSI derived False Alerts 10False Detection All (%) 11
ETNA82.91%2210.91%
KLIUCHEVSKOI13.45%3 13.78%
ERTA ALE0-0-
MASAYA0- 21.61%
STROMBOLI21.49%0 1.49%
VILLARRICA0-0-
BEZYMIANNY10.79%76.34%
LÁSCAR0-0-

