1. Introduction
The Lee Tunnel was constructed as the first part of the Thames Tideway Improvements Scheme. On completion of the main Thames Tideway Tunnel (TTT), the scheme aims to eliminate frequent combined sewage and stormwater discharges into the River Thames, to comply with European waste-water directives (91/271/EEC) [
1]. The Lee Tunnel is a 7.2 m internal diameter, 6.9 km long transfer tunnel, from Abbey Mills Pumping Station to Beckton Sewage Treatment Works, London [
2]. Construction began in September 2010 [
3] and tunnelling was completed in 2014 [
4]; it became operational in April 2016 [
5]. The Lee Tunnel is the deepest tunnel ever built in London, with an average depth of 75 m.
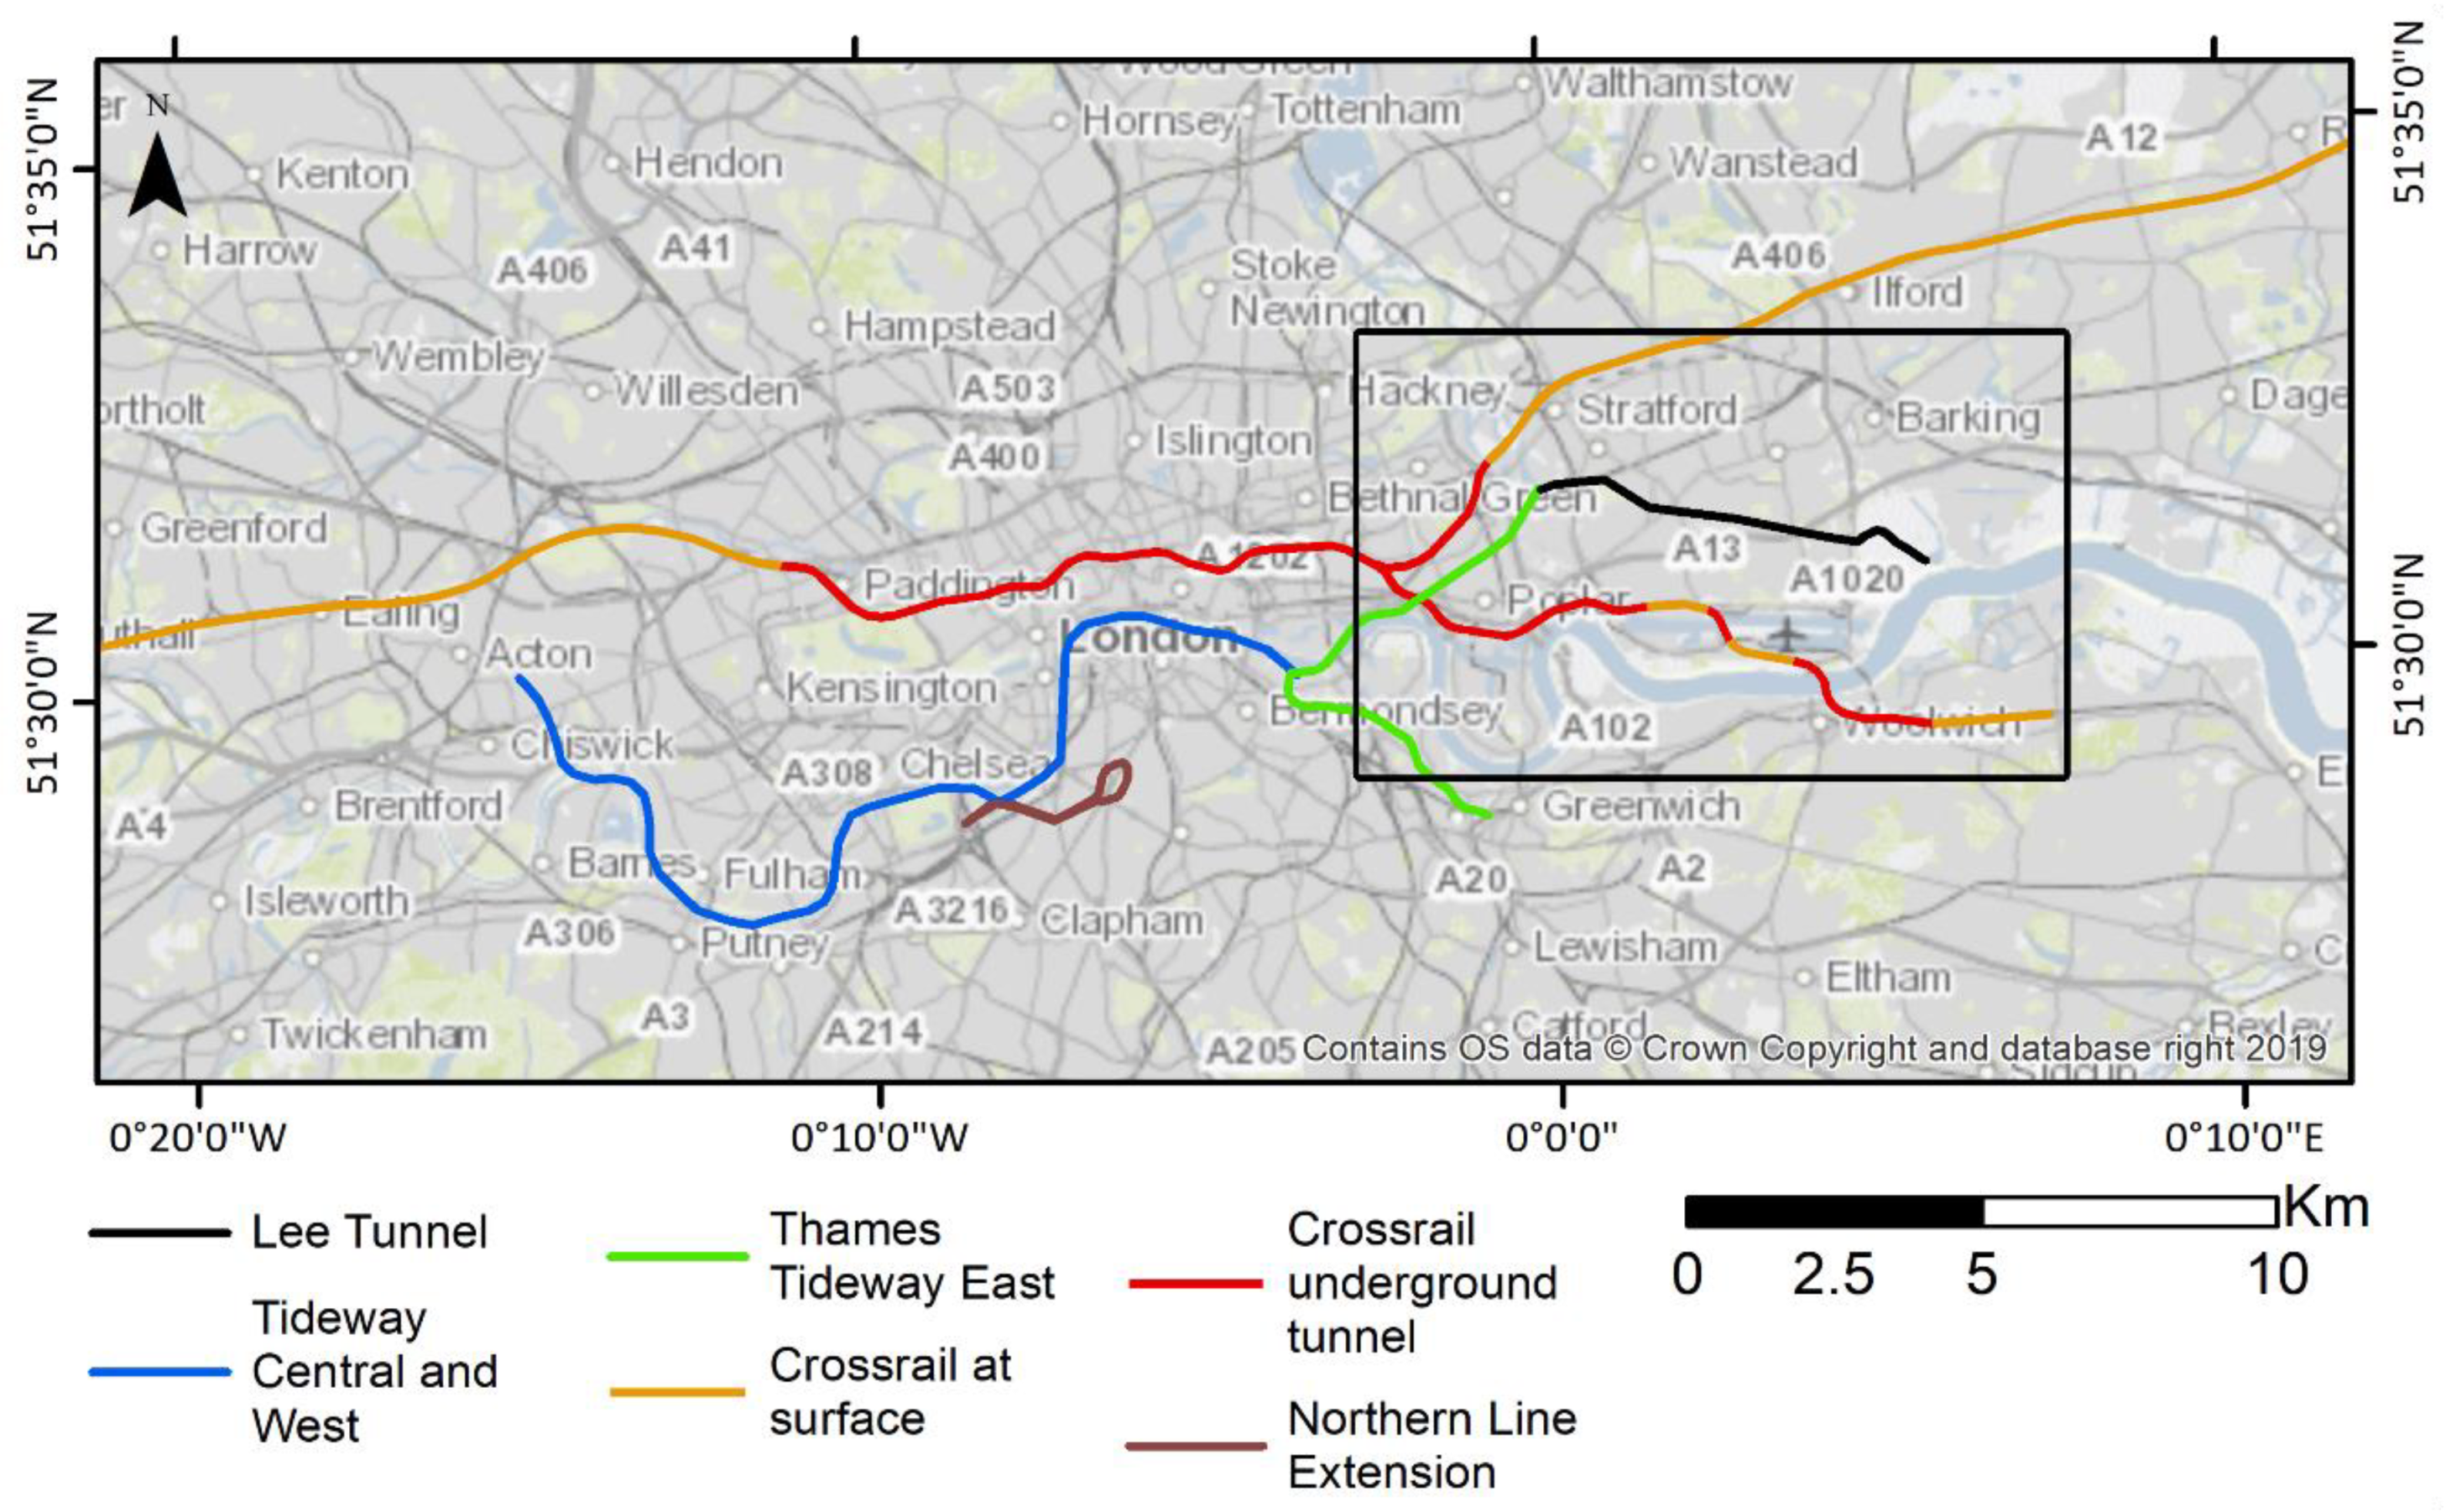
The main TTT, also known as London’s ‘super sewer’ is a 25 km tunnel of the same diameter, that runs from Acton in West London, to Abbey Mills Pumping Station, East London, where it joins the Lee Tunnel (
Figure 1). The West and Central sections of the TTT run directly beneath the River Thames. The East section consists of a 5.5 km tunnel that runs from Chambers Wharf, Bermondsey, to Abbey Mills Pumping Station, and the Greenwich Connection Tunnel, a 5 m internal diameter, 4.6 km long, tunnel from Greenwich to Chambers Wharf [
6]. Tunnelling for the East section is scheduled to begin in early 2020 and similarities between the East works and the Lee Tunnel in terms of size, geology and depth, means that much can be learnt from the challenges and successes of the Lee Tunnel and applied to the ongoing construction.
Interferometric Synthetic Aperture Radar (InSAR) is used to investigate patterns of ground deformation associated with the Lee Tunnel. InSAR is a remote sensing technique that provides reliable ground surface measurements over time, with millimetric precision, along the sensor’s ‘line-of-sight’ (LOS). InSAR has gained recognition in the last 10 years, as a tool for ground monitoring above tunnelling projects, in London particularly because of the post-construction monitoring of the Jubilee Line Extension (1993 to 1999) and the Crossrail project, for which tunnelling took place between May 2012 and May 2015 and led to a clear settlement trough aligned east–west across central London [
7,
8,
9,
10,
11]. Although much of the Lee Tunnel construction coincided with that of Crossrail, it remained largely unreported because it is much deeper and narrower, so that the surface deformation associated with it is much less apparent than Crossrail’s settlement trough. Beyond the UK, InSAR has notably been used to monitor tunnelling projects in China [
12,
13,
14], France [
15], Germany [
16], Italy [
17], Netherlands [
18], Romania [
19], Spain [
20,
21] and USA [
22].
This study looks mainly at East London over the period February 2010 to September 2015, using Radarsat-2 PSI data processed by CGG’s Satellite Mapping group. Additional InSAR data acquired by ERS (1992–2000), ENVISAT (2002–2010), TerraSAR-X (2011–2017) and Sentinel 1A and 1B (2015–2018) satellites are used in specific case studies.
1.1. Geological Setting
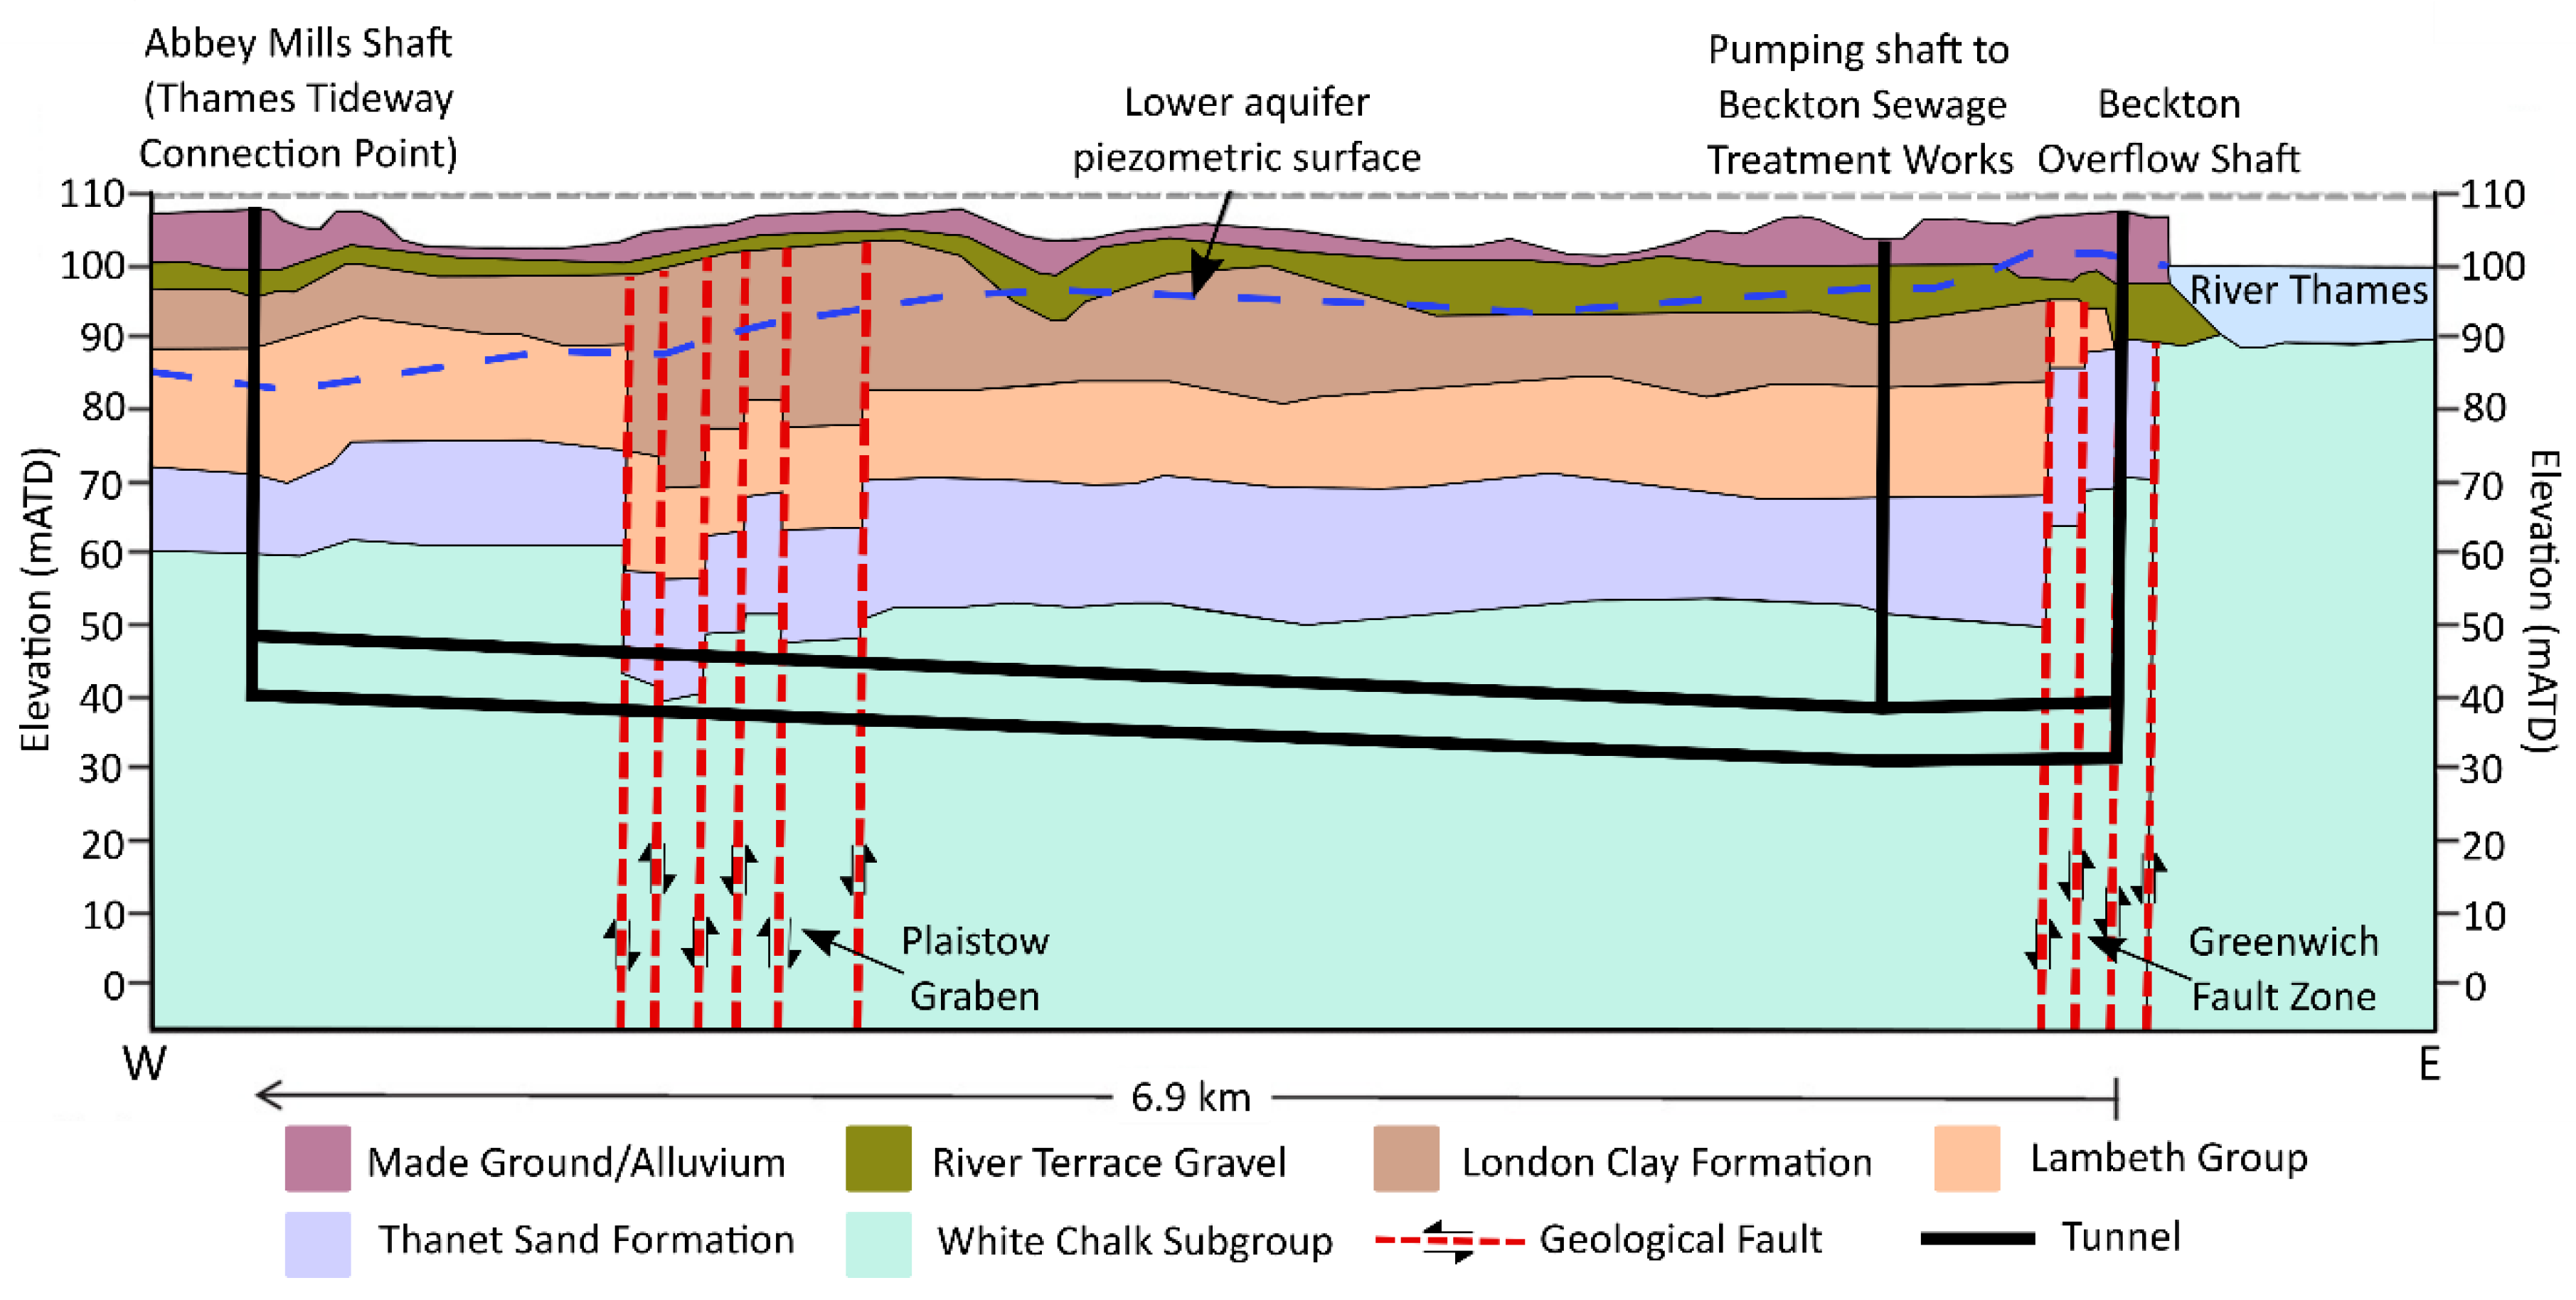
At an average depth of 75 m, the majority of the Lee Tunnel lies within the Upper Cretaceous, Seaford Chalk Formation (
Figure 2). Overlying the Chalk are Palaeogene sediments, including the Thanet Sand, Lambeth Group (variable sands, silts and clays), Harwich Formation (variable sands, clays and occasionally gravel) and London Clay Formation, and above these are Quaternary superficial sediments, the river terrace deposits and alluvium. Certain lithologies are relatively homogeneous, such as London Clay, whilst others are characterised by lateral and vertical variability [
23]. Further details on lithostratigraphy encountered during construction can be found in [
24,
25,
26].
Two fault zones are recognised along the tunnel alignment: the Greenwich fault zone, within which the Beckton shaft is sited, and the Plaistow Graben fault zone, which was discovered during ground investigations for the Lee Tunnel [
27,
28]. The Greenwich fault [
29] is a north–east south–west trending feature that has as much as 40 m vertical displacement across it, with strata downthrown to the north–west [
30]. The Plaistow Graben is a negative relief fault zone, approximately 900 m wide, in which the ground is progressively downthrown towards the centre, resulting in Thanet Sands being brought into the tunnel horizon [
28,
31]. Crossing any fault during tunnelling can be hazardous because they can cause sudden changes in lithology, disturbed ground, groundwater and mechanical properties of rocks, leading to tunnelling problems such as flowing ground, tunnel overbreak and steering problems for a Tunnel Boring Machine (TBM) [
25]. It is therefore important that the location and nature of any faulting are known prior to construction.
A feature with unexpected geological characteristics was encountered during the progress of the Lee Tunnel drive. In addition, a ‘yellowing’ of the chalk and rounded flints were reported in the slurry treatment plant [
4,
24]. Additional boreholes were drilled to understand the nature of the feature, which was later defined as a drift filled hollow (DFH) [
24]. DFH’s, also known as scour hollows, rockhead anomalies and buried hollows, are steep-sided geological depressions in the rockhead surface. They can be up to 75 m deep and 90 to 475 m wide, narrowing with depth [
29,
32,
33]. Infill deposits are typically a mélange of alluvial sand, gravel and some clayey beds. Several hypotheses have been proposed for their formation including fluvial scour [
32], periglacial activity (pingos) [
34], excess pore water pressures [
35], structural control by basement transcurrent faults [
36] and faults originating from pressurised water lenses during glacial periods [
37]; with all considering them as periglacial phenomena.
DFH’s are a substantial hazard to tunnelling projects, often containing perched water leading to variable groundwater conditions, potential slumping, shearing of the sides and differential compaction of material [
29,
38]. Adjustments to the TBM may be required in response to such variable conditions, such as an increase in TBM thrust or a decrease in cutting wheel rotation speed [
30]. This can lead to an increased risk for operators and project delays because of reduced speed, therefore resulting in additional costs. Additionally, their distribution across the region is largely unknown.
In terms of hydrogeology, both of London’s two main aquifers were encountered during the Lee Tunnel project. The Lower Aquifer was recorded in the Seaford Chalk, in hydraulic connection with the overlying Thanet Sand and Upnor formations. The Upper Aquifer was recorded in the river terrace deposits and alluvium across the whole tunnel alignment [
25]. The piezometric profile for the Lower Aquifer indicated groundwater pressures of up to 800 kPa at Beckton and 450 kPa at Abbey Mills [
25]. The Lower Aquifer (chalk) is a high transmissivity aquifer comprising dual porosity, with flow and storage occurring in both the fractures and the matrix [
39]. The majority of flow occurs in the fractures, with water stored in the matrix released to the fractures when groundwater levels fall [
39]. Groundwater levels in London are managed by the Environment Agency. During the 19th century and early 20th century, the Lower Aquifer in London was exploited as a result of increased industrialisation. From the mid-1960s, there was a significant reduction in groundwater abstraction from the Lower Aquifer, which caused groundwater levels to rise. In order to prevent potential structural damage, such as that to the London Underground and building formations, since the 1990s, the aquifer has been artificially managed by controlling changes in abstraction. The London Clay confines the Lower Aquifer in most of London and changes in groundwater can lead to uneven deformation of the London Clay as well as consolidation of the underlying sandy units. The Upper Aquifer is unconfined.
1.2. Tunnel Construction
Five permanent large-diameter shafts were constructed as part of the Lee Tunnel, three at Beckton and two at Abbey Mills [
40]. Tunnelling was carried out using an 8.85 m Slurry Pressure Balance System (SPBS) TBM, chosen because of the significant depth and high water pressures [
4]. The TBM was launched from the Beckton Overflow Shaft in February 2012 [
41] and completed tunnelling at Abbey Mills in January 2014 [
4].
Most tunnel construction results in ground settlements at the Earth’s surface. The ground deforms towards the tunnel face due to stress relief. This settlement is usually described by an inverted bell curve and is the mechanism that can lead to ground strains being transmitted to tunnel structures [
42]. Other movements tend to be more localised and erratic, resulting from specific failures in the tunnel, sudden changes in the hydrogeological regime and unpredicted geological features [
43]. The main factors affecting ground movements are tunnel diameter and shape, depth, construction method and ground properties. Empirical settlement equations tend to provide good results for ‘greenfield’ areas, i.e., those without road surfaces, hard standings, foundations or other subsurface infrastructure, but are less reliable for brownfield areas due to soil–structure interaction.
Ground deformation, both as a result of tunnelling, other construction projects and geological movements, can be measured using InSAR. Understanding the causes of deformation observed in InSAR results is important to improve our knowledge of potential unforeseen ground conditions for future engineering projects. In addition to the Thames Tideway East Tunnel, further construction is planned: the Silvertown Tunnel, which will carry a new road under the Thames to connect the Greenwich Peninsula to West Silvertown (Royal Docks).
2. Materials and Methods
The primary Synthetic Aperture Radar (SAR) data used in this study are from Radarsat-2 (RS2), chosen due to its availability over the time period of interest (2010 to 2015). It has been processed by CGG, using their PSI algorithm. RS2 is a jointly funded mission between the Canadian Space Agency (CSA) and MacDonald Dettwiler Associates Ltd. (MDA). It was launched in December 2007 and is still operational. RS2 is a C-band (wavelength 5.6 cm) sensor, with a revisit period of 24 days. The RS2 processed data have been derived from 58 ascending images acquired during the 5.5 years from 2 February 2010 to 28 September 2015. Displacements are given along the LOS which in this case has an inclination of approximately 33°, and the minimum coherence is 0.72. The dataset contains, on average, 2200 points per km2 over an area of 89 km2.
Displacement along the LOS can be measured to better than 1 mm on PS characterised by very consistent radar returns [
44]. The RS2 PSI results used here have a mean estimated uncertainty of 0.4 mm/y for the displacement rate, calculated using the covariance-weighted standard deviation of residual phase components for each point. However, these data-derived empirical estimates may potentially underestimate uncertainties in real-world use-cases. Validation against conventional land survey monitoring across a similar urban environment as part of a large European Space Agency (ESA) PSI validation activity showed the typical accuracy for the PSI average annual motion rates was ±1 to 2 mm/y, with individual time series displacements having a typical RMS error of 4-6 mm [
45], and we consider these values more representative.
Additional SAR data used are from ERS, ENVISAT, TerraSAR-X (TSX) and Sentinel 1A and 1B (
Table 1). Together, the ERS, ENVISAT, Radarsat-2 and Sentinel-1 data provide a near-continuous record of ground displacement from 1992 through to the present day. In addition, the TerraSAR-X data provide considerable overlap with that from Radarsat-2, providing an opportunity for cross-comparison between two fully independent datasets.
A Persistent Scatterer InSAR (PSI) dataset derived from 27 irregularly spaced ERS SAR images (19 June 1992 to 31 July 2000), and from 45 irregularly spaced ENVISAT ASAR scenes (13 December 2002 to 17 September 2010), is used here to assess long-term deformation patterns. ERS and ENVISAT were European Space Agency (ESA) C-band radar missions. ERS-1 was operational between 1991 and 2000 and ERS-2 1995 to 2011. ENVISAT was the successor to ERS, launched in 2002 and ended in 2012.
Sentinel-1 (A and B) ascending data were processed using ENVI (v5.5) SARScape (v5.4.1) PSI module. Sentinel-1 (A and B) are ESA-owned C-band satellites, with a repeat cycle of 6 days when both are in operation. The time period processed is from 6 May 2015 to 28 December 2018 and the LOS inclination is approximately 35°. The minimum coherence used was 0.8, which leads to an average density of 7200 PS points per km2. The velocity precision, calculated using the acquisition temporal baseline and the multi-temporal coherence is 0.1 mm/y.
TSX data has been used as a comparison to RS2 data because the TSX dataset was validated with levelling data (Building Research Establishment (BRE) levelling sockets and conventional levelling studs/plates) from Crossrail Elizabeth Line monitoring at Bond Street [
46]. TSX is an X-band (wavelength 3.1 cm) satellite, operated by the German Aerospace Centre (DLR) and launched in 2007. It has a revisit period of 11 days and the LOS inclination of the sensor is 37°. The TSX dataset contains 150 descending images, taken in StripMap mode, over the period May 2011 to April 2017 (6 years) and was processed by TRE Altamira using their SqueeSAR
TM method [
47]. In this part of East London, it has an average of 2400 PS points per km
2.
Direct comparison of the RS2 and TSX datasets, which have different start and end dates and a different temporal frequency of measurements, was made from the first common date, 1 May 2011, to the same end date, 28 September 2015. This was achieved by subtracting the displacement value on the first date, from the whole time series, to make 01/05/2011 zero. Each dataset was then interpolated to derive a daily value for displacement, to adjust for the different temporal frequencies and time gaps in the data. The two datasets use different reference locations, which can result in a systematic shift in displacement through time, corresponding to any differential displacement between the two reference locations.
3. Results and Discussion
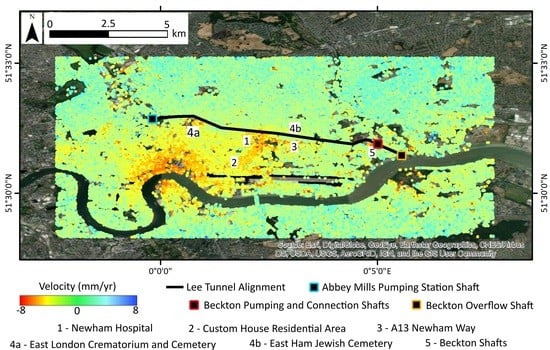
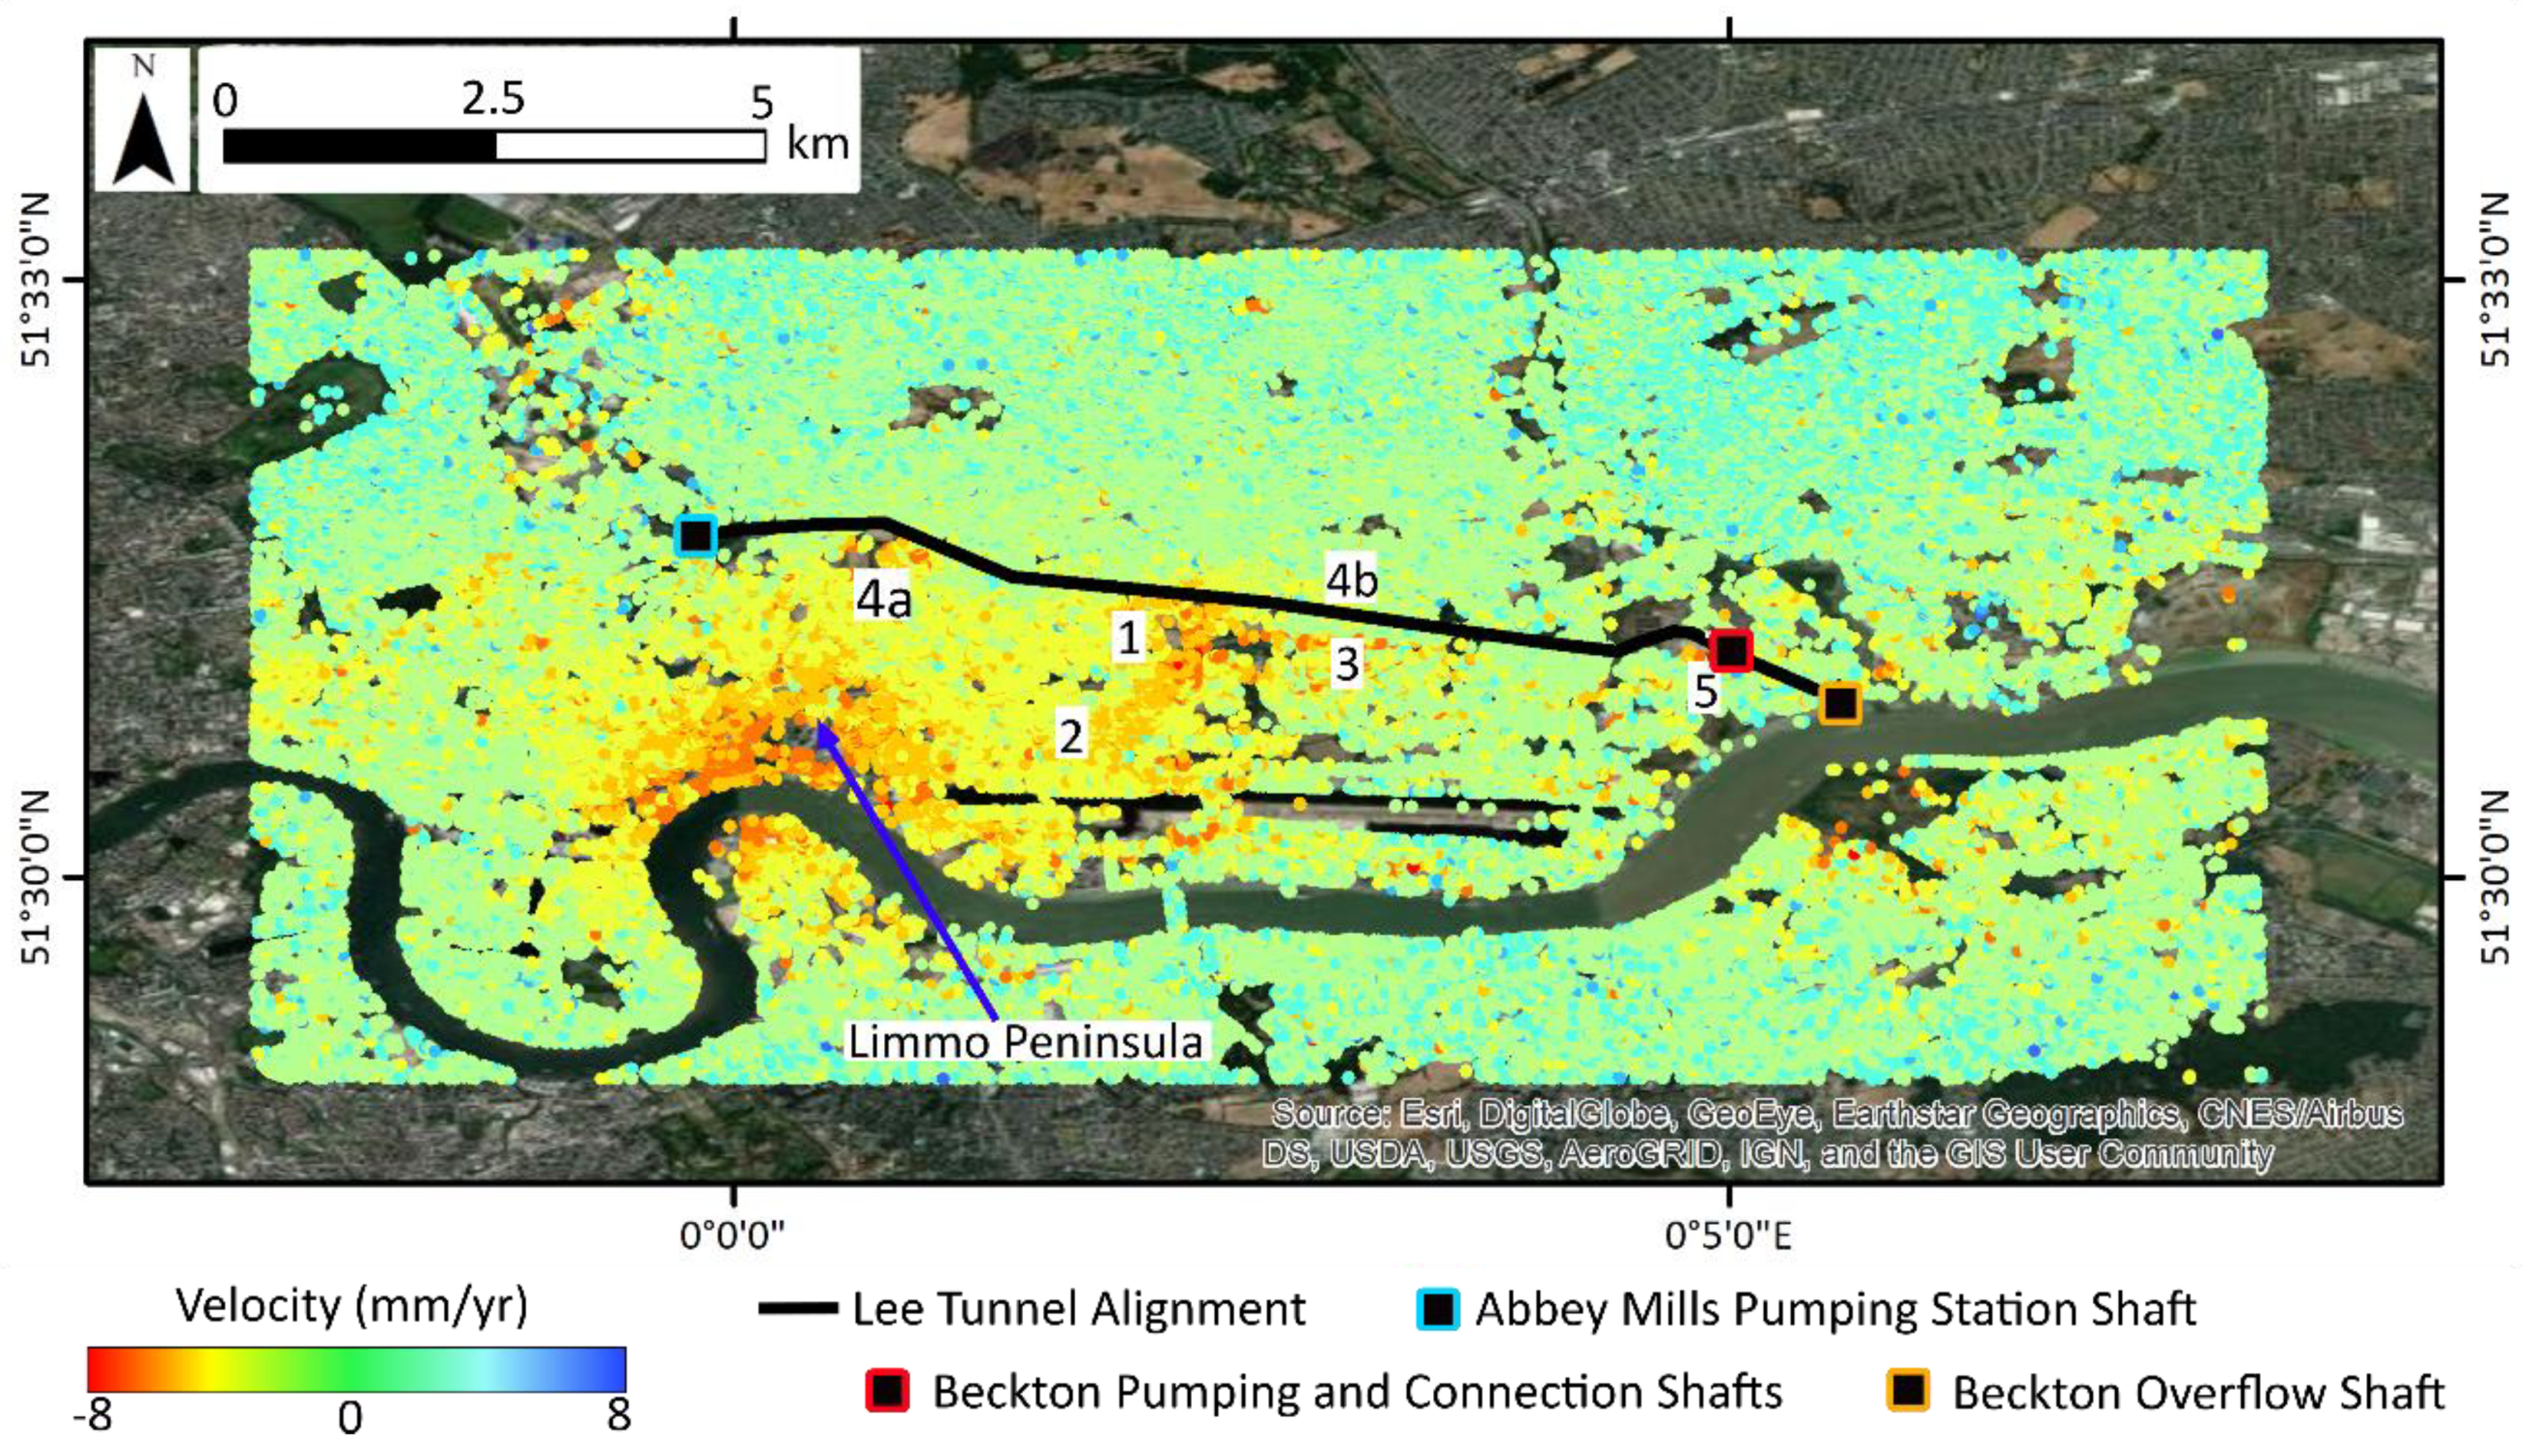
Several interesting features have been identified in the Radarsat dataset. One of the most notable is at the Limmo Peninsula (
Figure 3), where up to −40 mm of displacement, over the 5.5-year period, has been caused by dewatering for Crossrail construction. This phenomenon was similarly observed in the TSX results, described in detail by Bischoff et al. [
7].
The case studies presented in this paper are labelled on
Figure 3 and include: Newham Hospital (1), Custom House residential area (2), A13 Newham Way (3), East London Crematorium and Cemetery (4a) and East Ham Jewish Cemetery (4b), and Beckton Sewage Treatment Works (5).
3.1. Newham Hospital
Newham Hospital and Boundary Lane (to the east of the hospital) exhibit substantial settlement during the period 2010 to 2015, and this can be seen clearly in
Figure 3, Location 1. To understand the cause of this settlement, historic maps [
48] have been analysed (
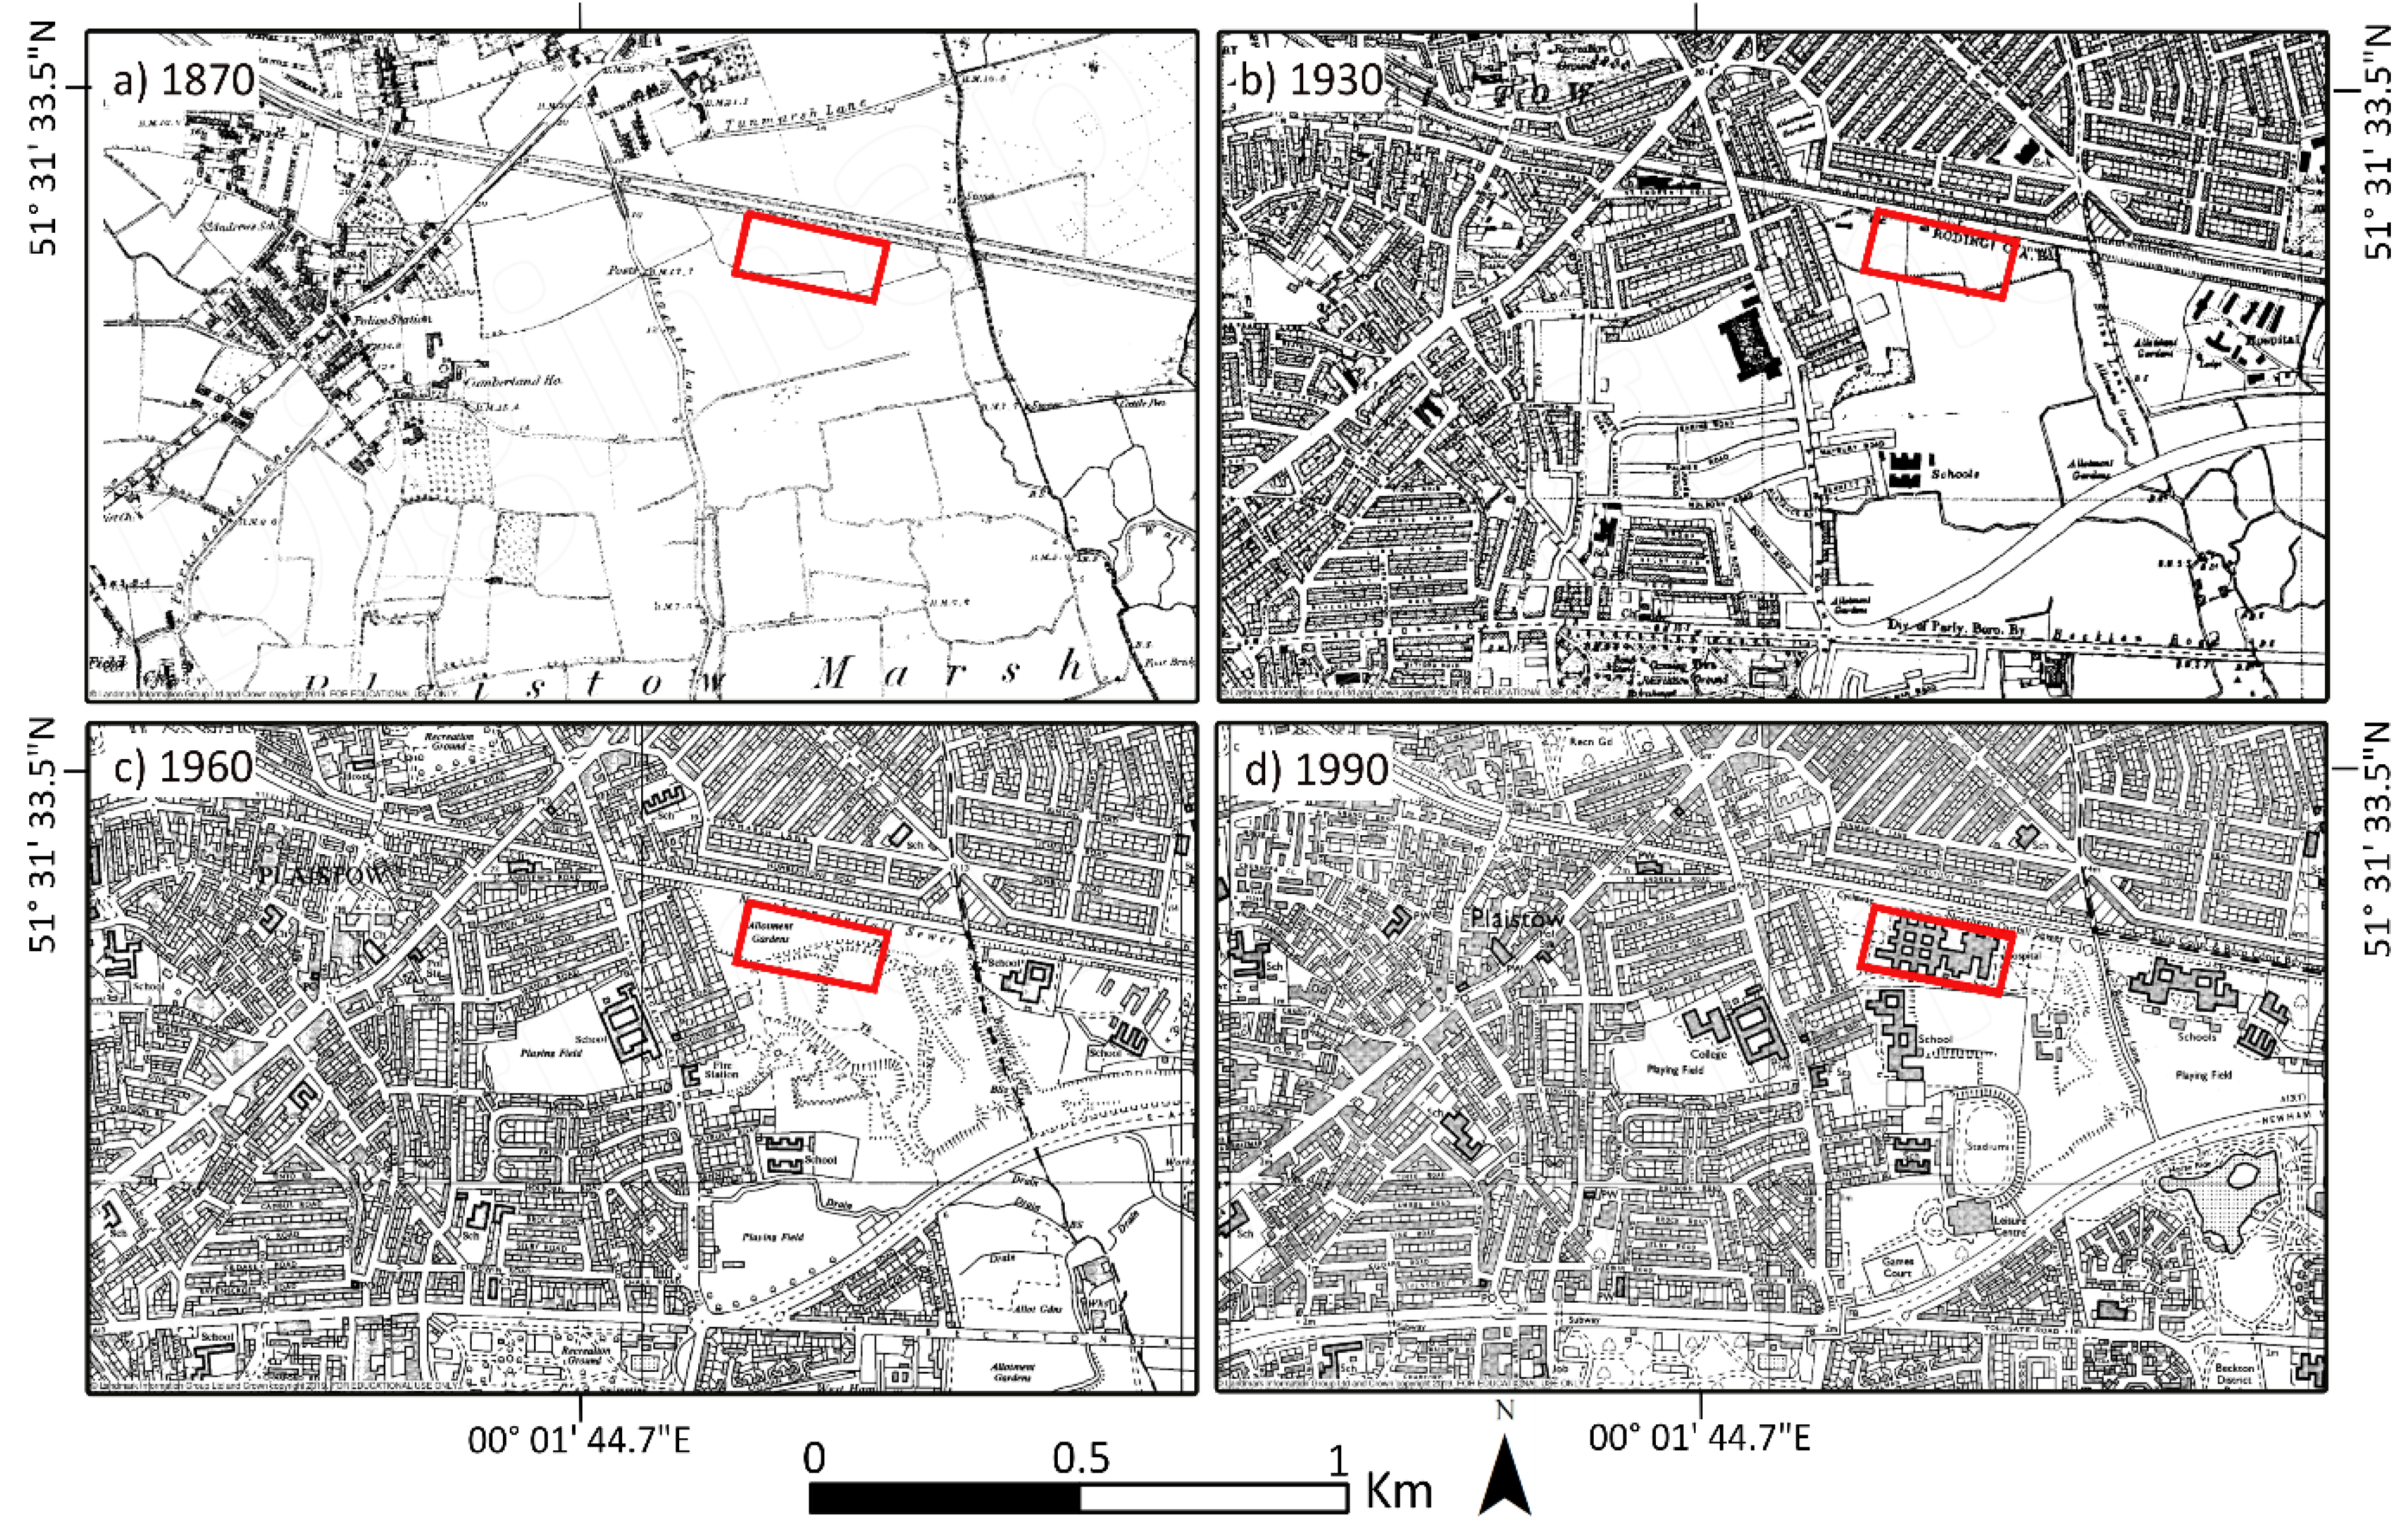
Figure 4). Until the 1910s, the hospital site and surrounding area were occupied by marshland and agricultural fields with the most notable man-made feature being the east–west embankment of the Northern Outfall Sewer which first appears in the 1870 map. In 1910, a gravel pit is first shown just south of the site. By 1930, there are substantial housing developments to the north of the Northern Outfall Sewer and to the West of the hospital site. In 1950, further embankments appear on the site of the current hospital and, by 1960, there is an extensive network of embankments with tracks on the top. Environment Agency records reveal that these embankments were constructed for the historic Prince Regent Lane landfill site. The extent of that landfill site was obtained from the Department of Environment Food and Rural Affairs [
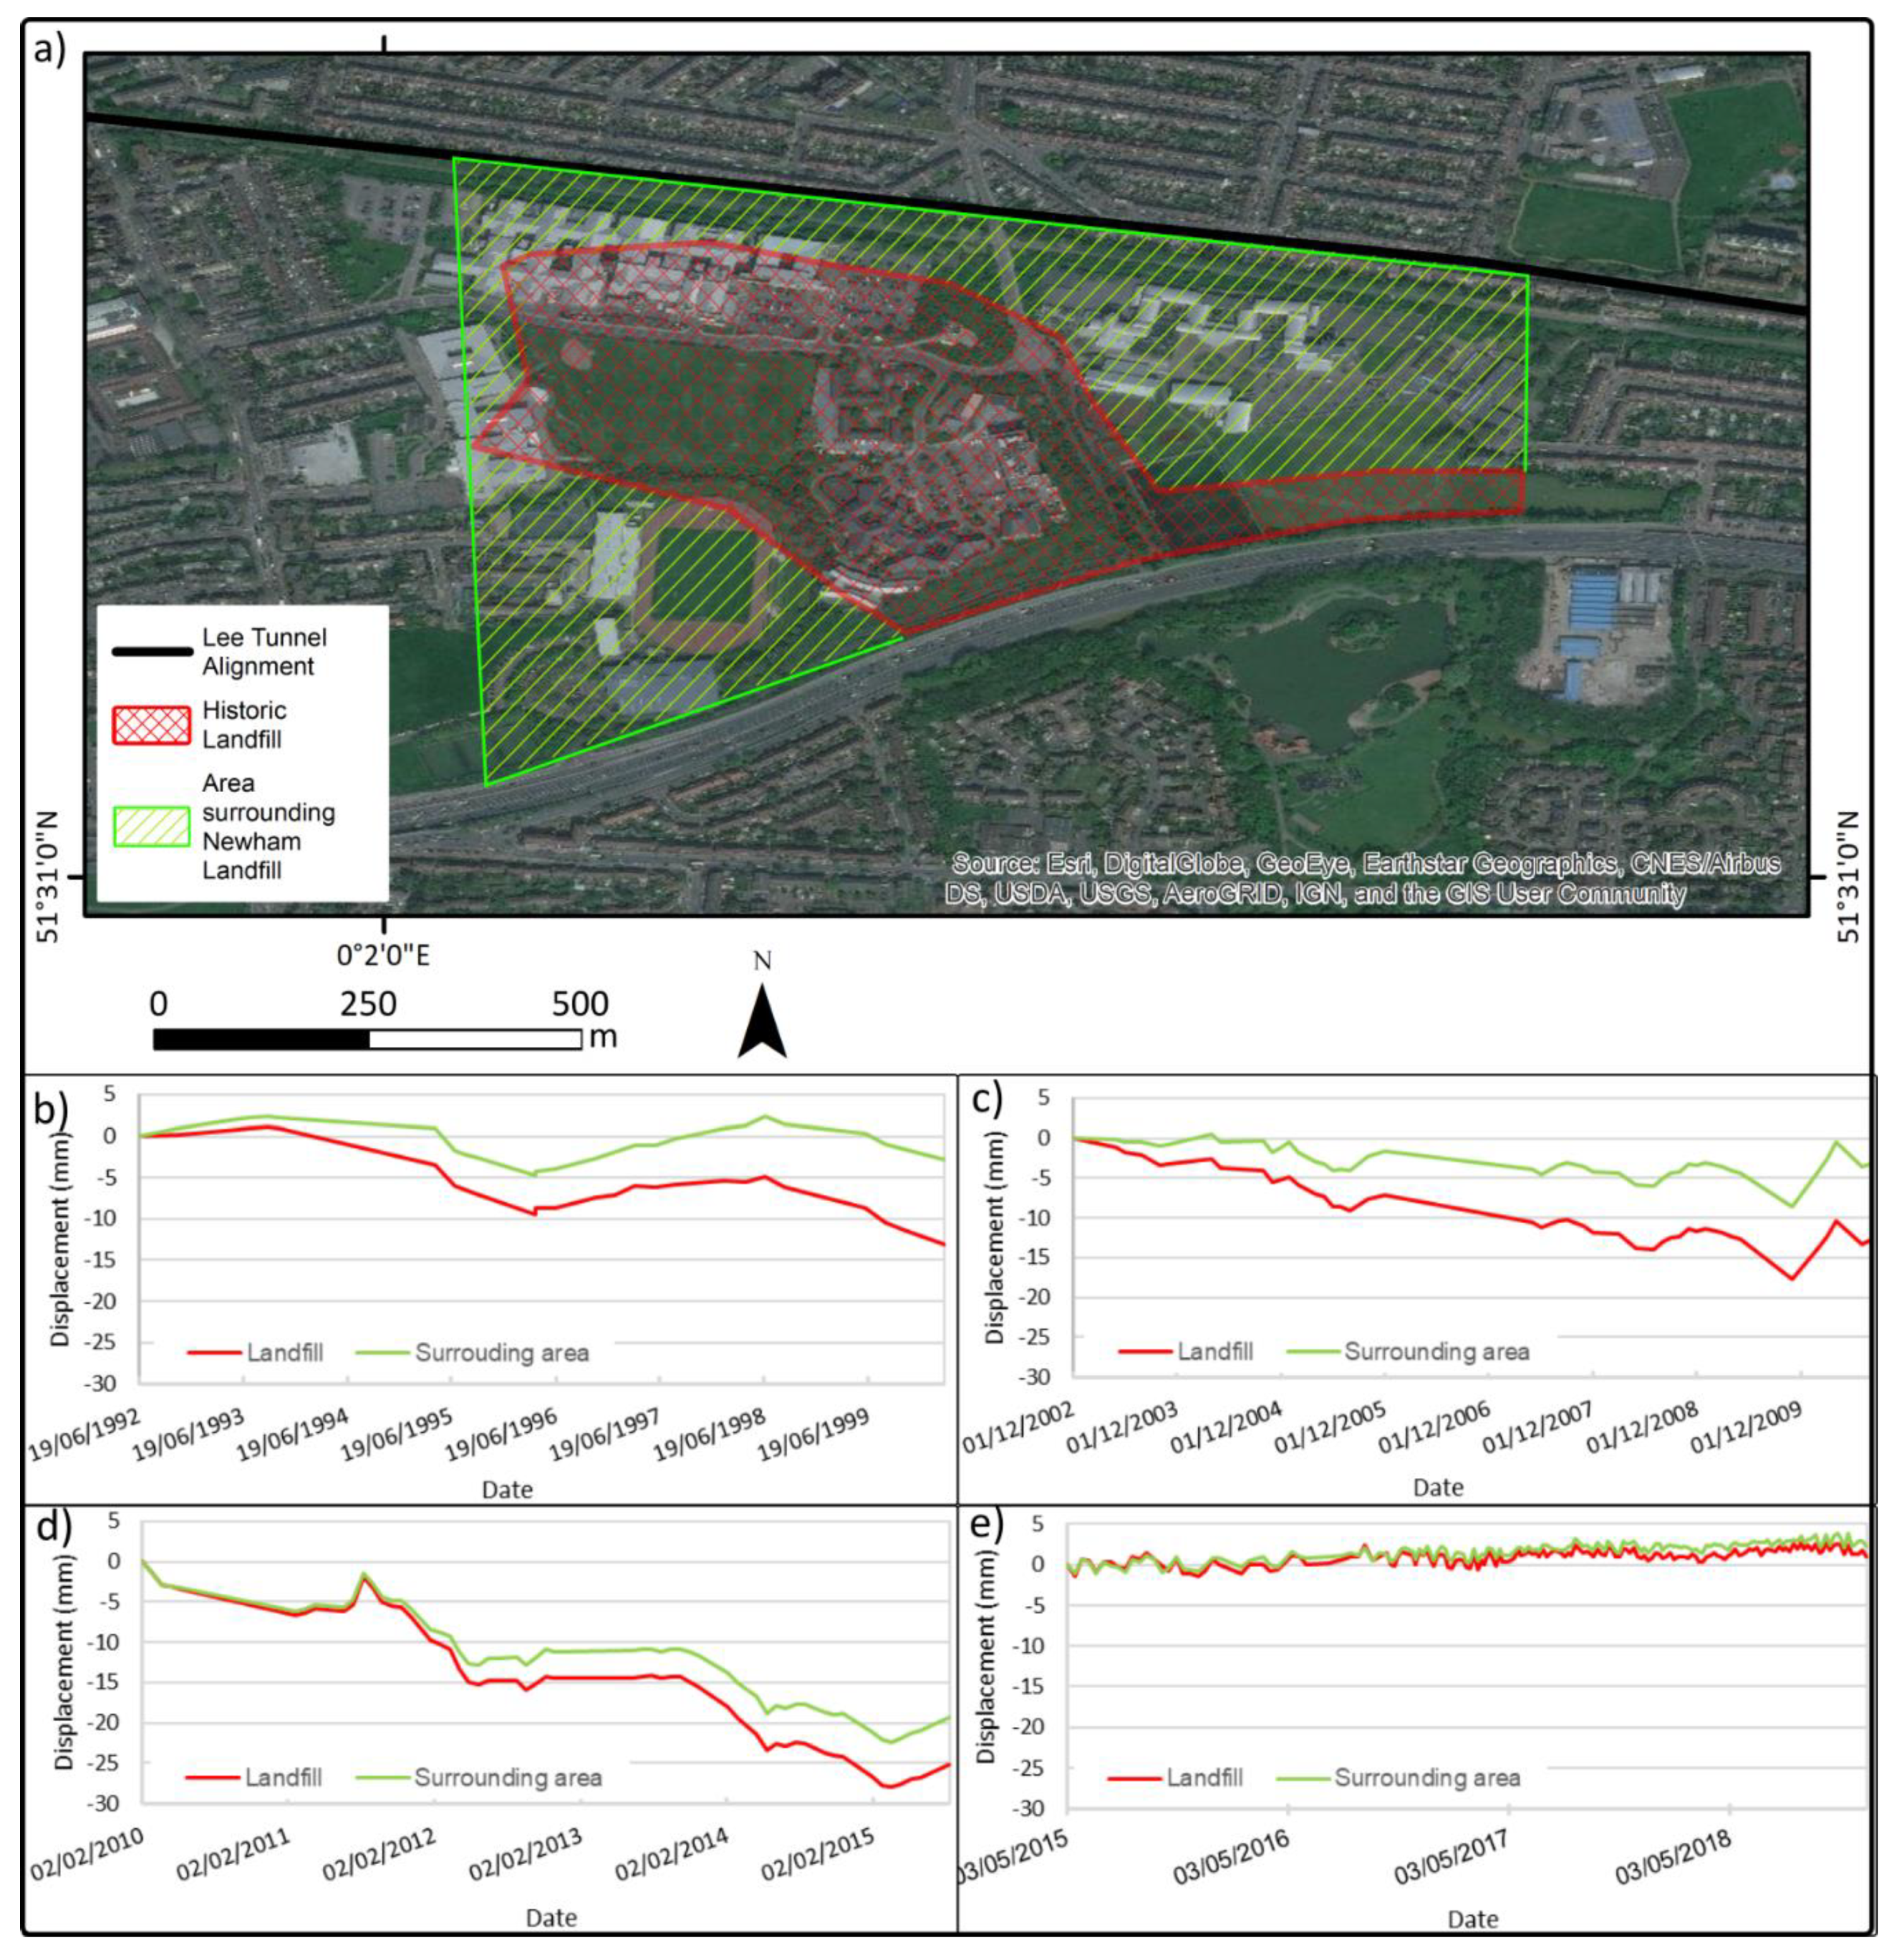
49]. The landfill lies beneath part of the current Newham Hospital, Cumberland School, Gateway Surgical Centre and Newham Centre for Mental Health. The geographical extents and ground-level measurement time series of the landfill site and its surrounding area are shown in
Figure 5.
This historic landfill is further evidenced in borehole records (accessed through the British Geological Survey’s (BGS) GeoIndex database), by an approximately 6 m thickness of Made Ground containing brick, glass, metal, clinker, pottery and wood (
Figure 6: TQ38SW 2081, 2082, 2083, 2084, 2085, 2087, 2088, 2090, 2091).
From the time series in
Figure 5, it is clear that the area of historic landfill settles more quickly than the surrounding area; ca. 7 mm more, over the five-year time period (2010–2015). Looking back at the ERS data from 1992 to 2010 (
Figure 5b,c), it is apparent that this pattern of deformation has been ongoing prior to tunnelling, for at least three decades, with the landfill area accumulating ca. −90 mm of settlement between 1992 and 2015 compared to ca. −40 mm for the surrounding area.
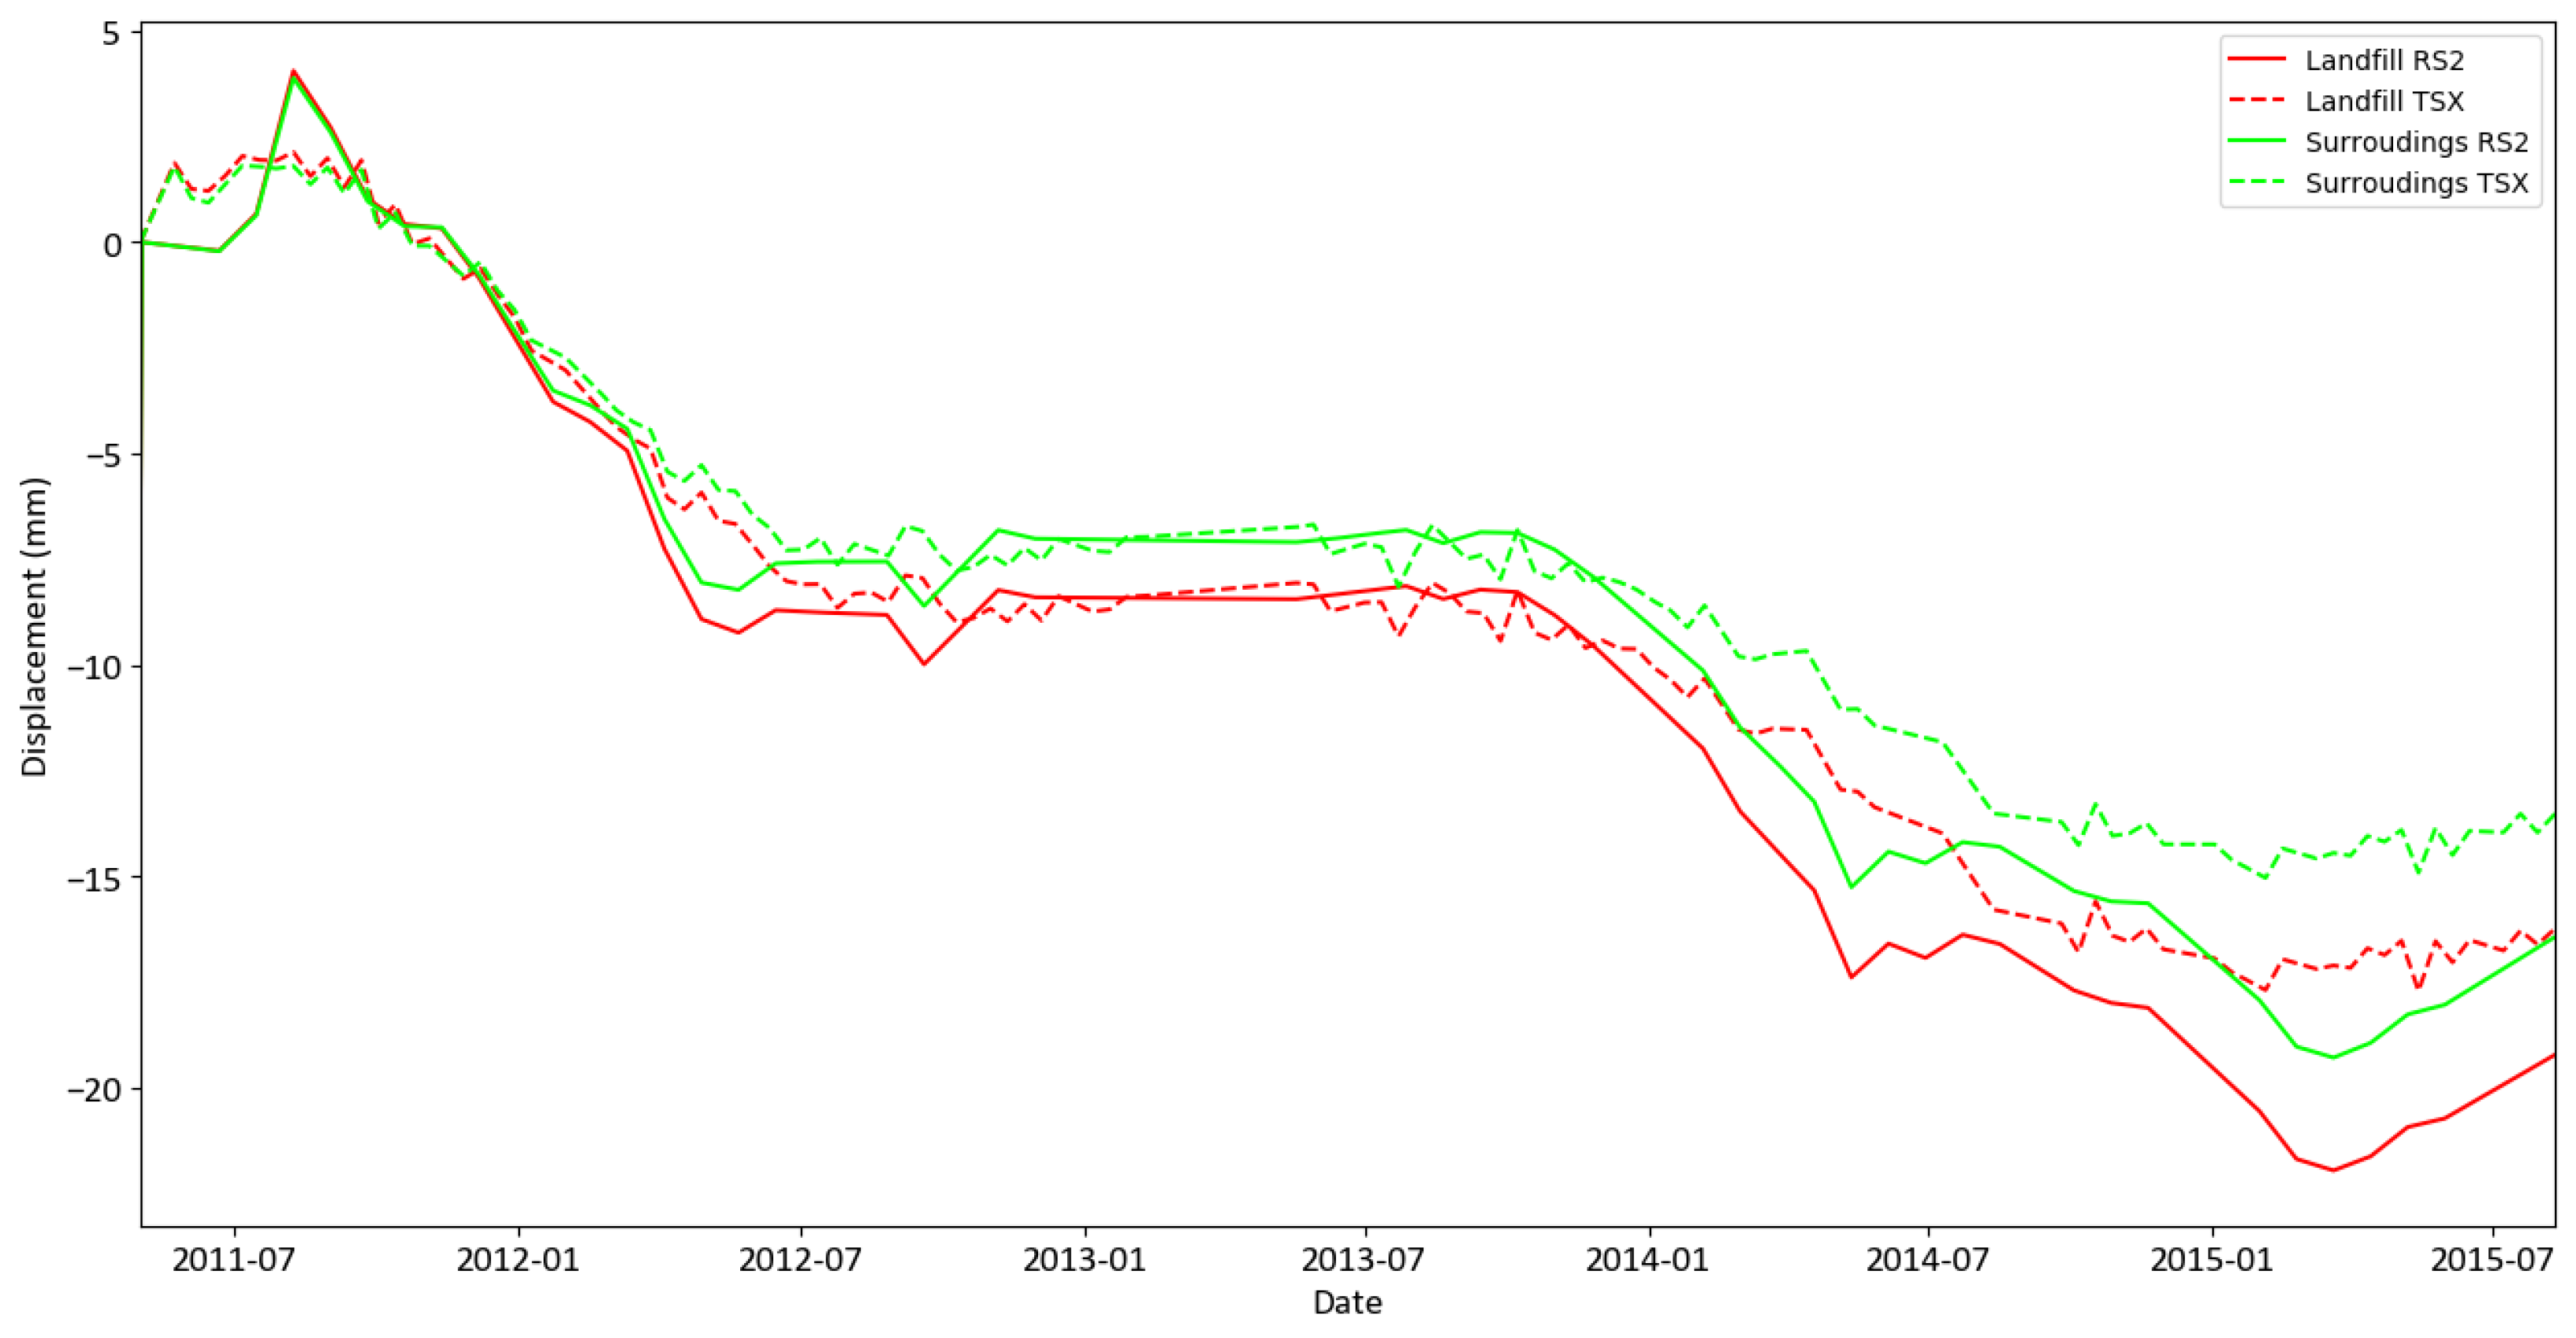
The same pattern of deformation can also be identified in the TSX data, from 2011 to 2015 (
Figure 7). In this comparison, the landfill area (red) contains 841 PS points for RS2 and 889 for TSX, and the surrounding area (green) contains 1735 PS points for RS2 and 1779 for TSX. The correlation between each dataset has been tested using a Pearson Product Moment Correlation Coefficient. The correlation for the landfill area between RS2 and TSX is 0.984 and for AOI 2 it is 0.980, therefore there is a strong positive correlation between the two datasets.
The settlement appears to cease in the first few months of 2015 (
Figure 5e). This is assumed to be a result of a cease in dewatering for Crossrail at the Limmo Peninsula Cross Passage 13 (CP13, [
50]) and in local chalk basin abstractions [
39].
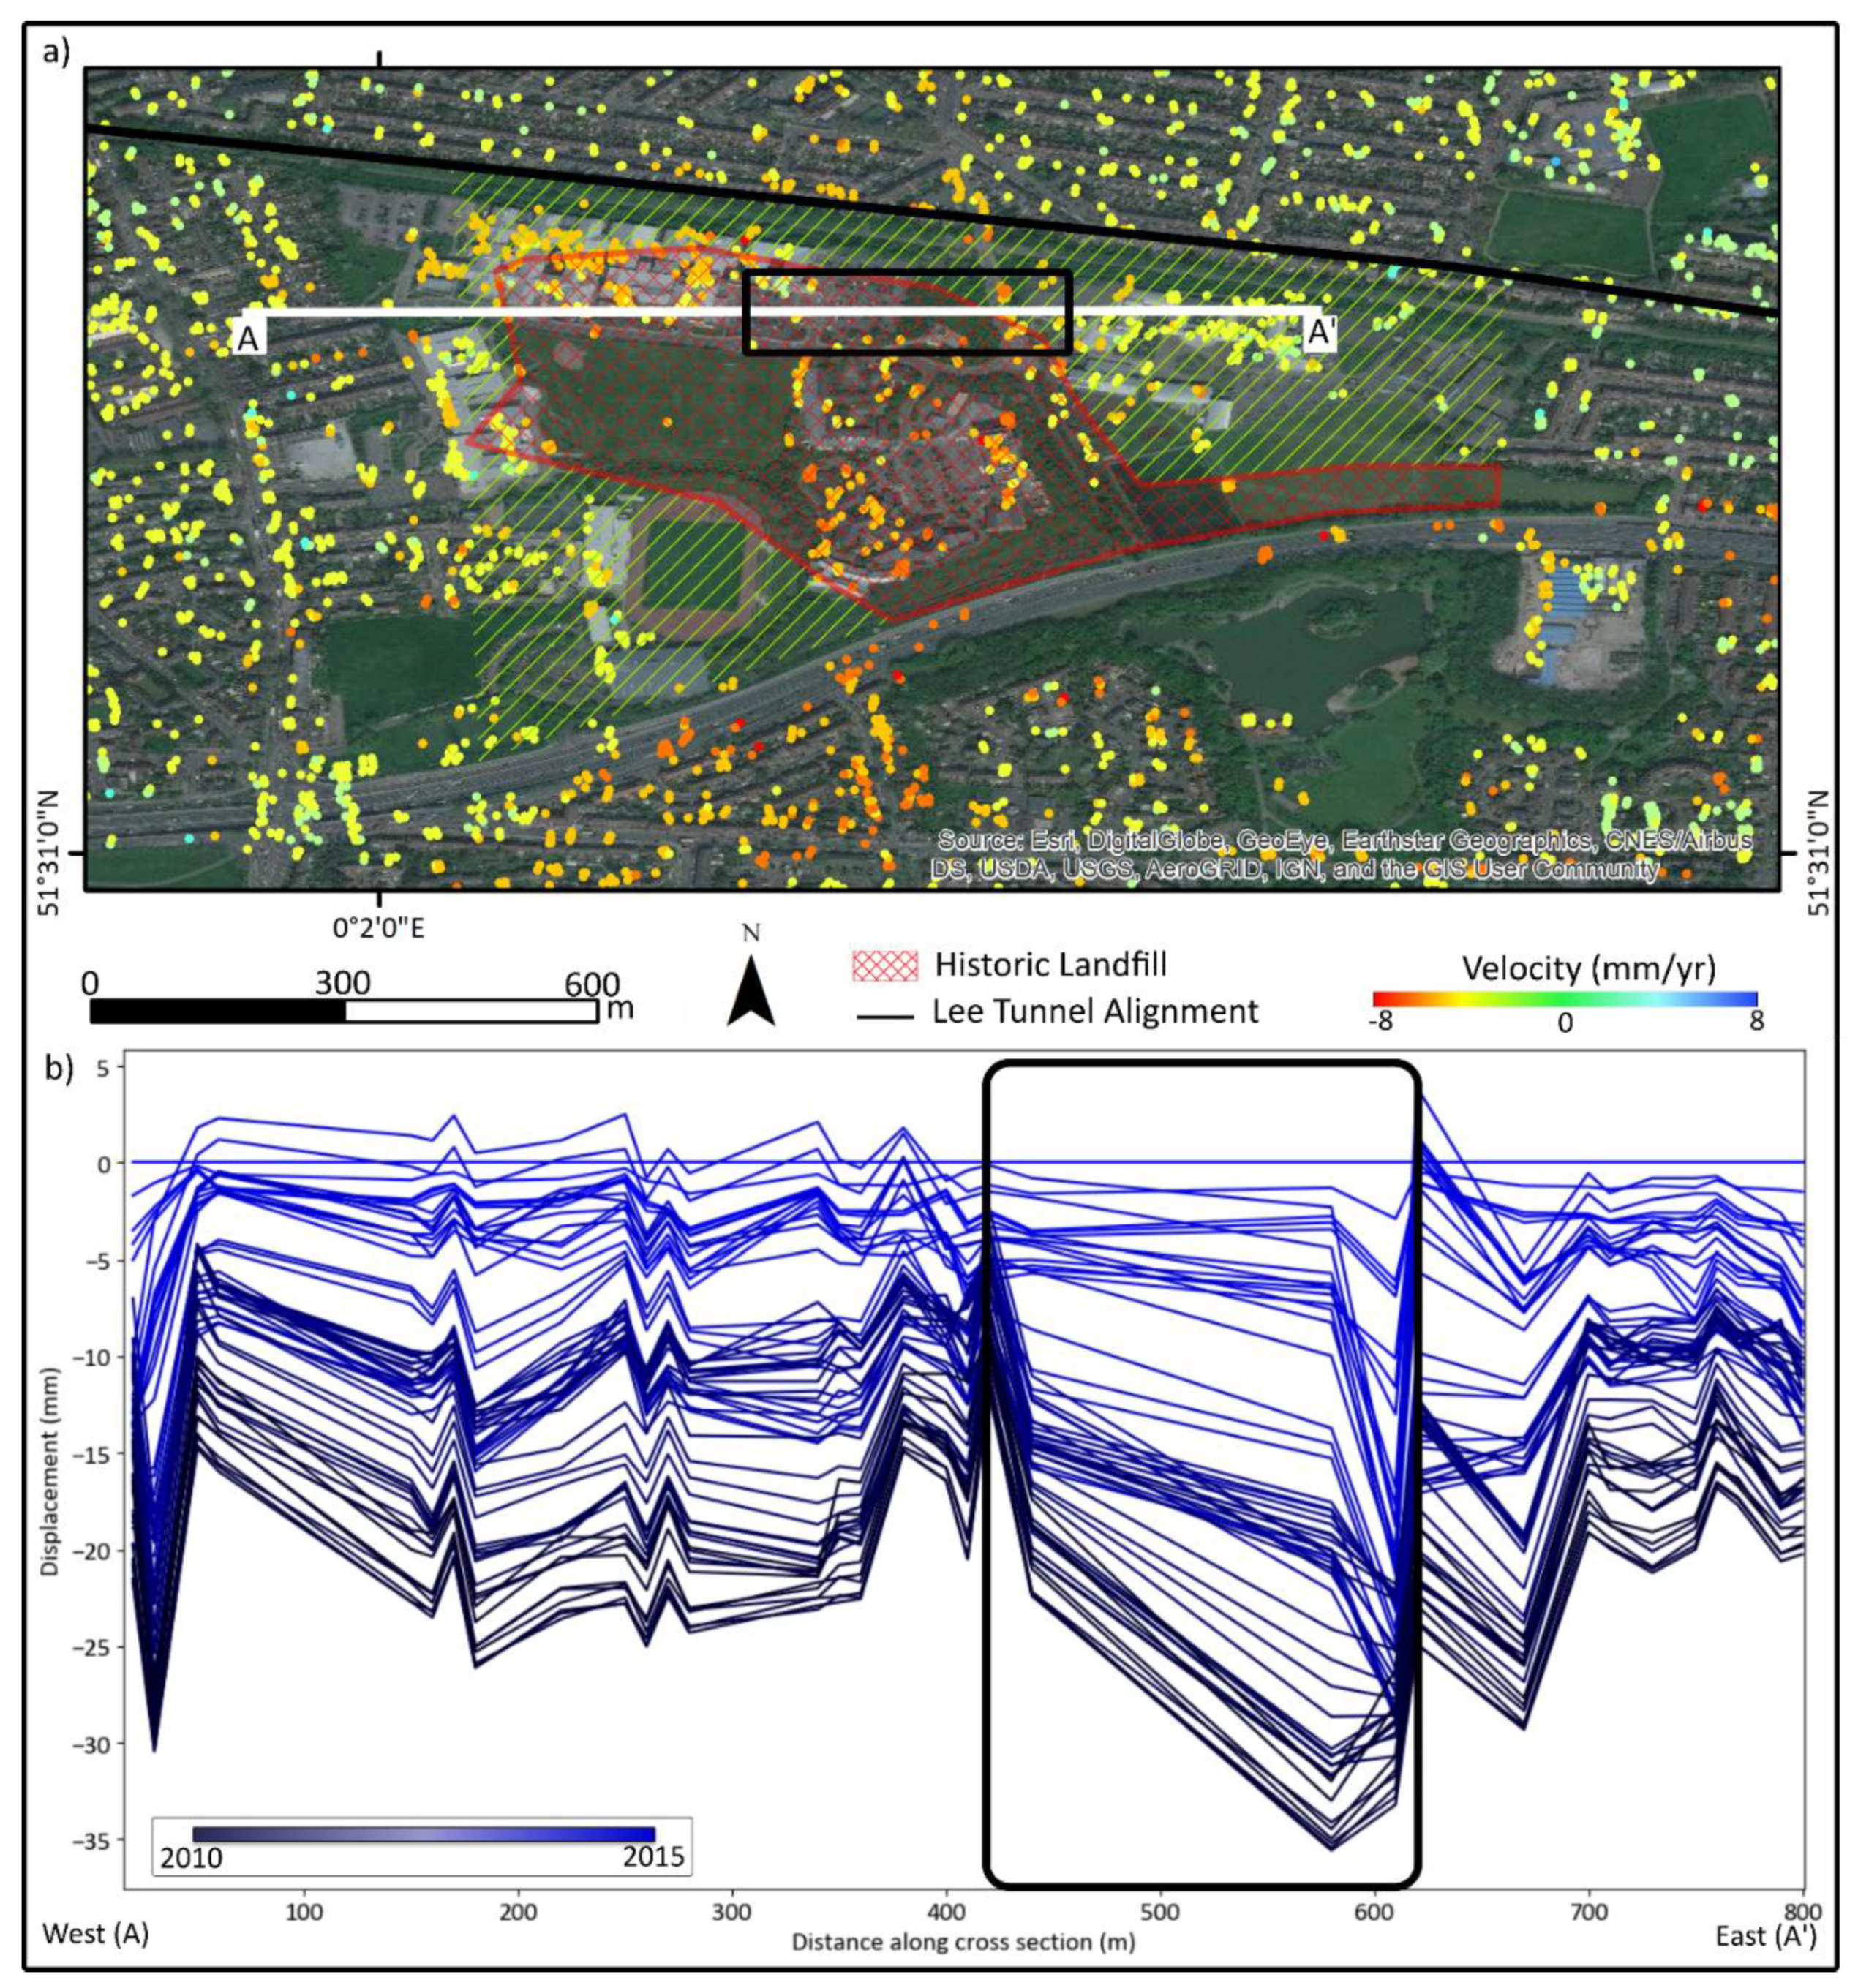
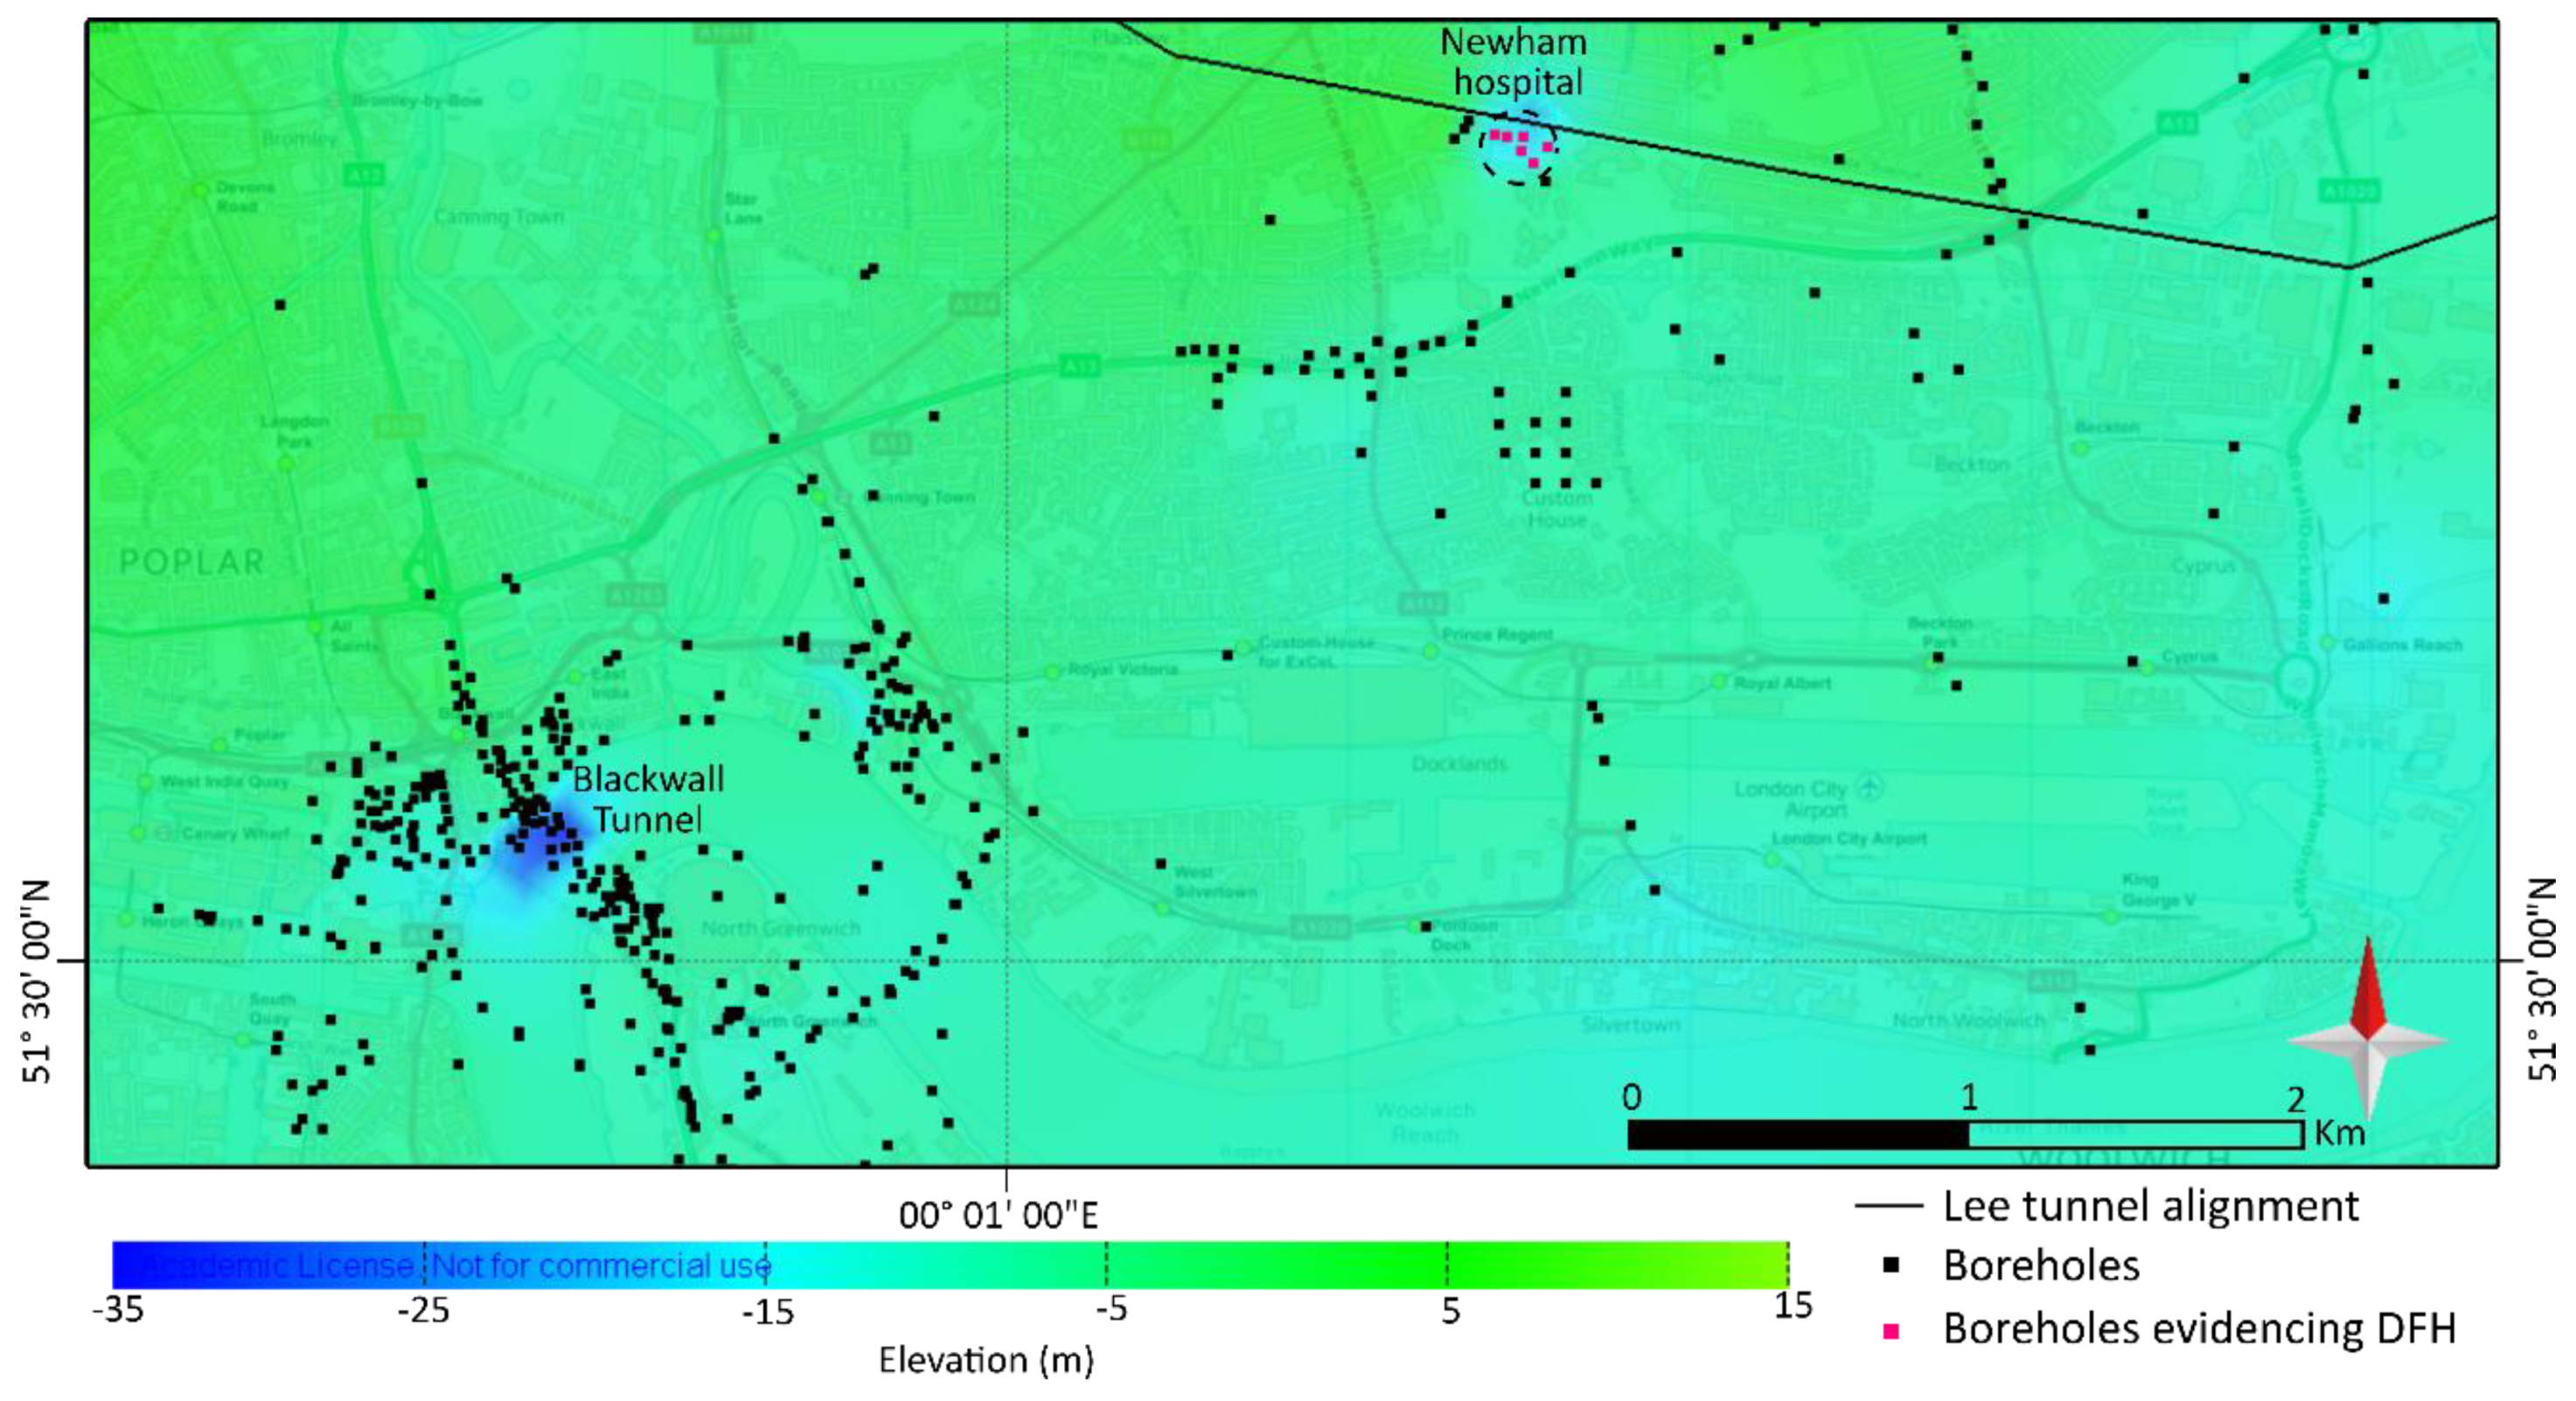
The area of high settlement extends well beyond the historic landfill, to the north and east. Borehole records reveal an unusual thickness of gravels and sands extending to a depth of at least −20 m AOD (above ordnance datum), which is the base of the boreholes, on the eastern edge of the hospital and in the car park (
Figure 6). The descriptions are consistent with that of DFH’s [
29,
32,
35]. Newman et al. [
25] and Bellhouse et al. [
24] reported a DFH here identified during construction of the Lee Tunnel. A mixture of sand and weathered flint was found in the slurry treatment plant, over a distance of approximately 4 m, before the TBM was stopped to allow further borehole investigation ahead of the tunnel face to go ahead [
25]. At this point approximately halfway along the Lee Tunnel, the depth is approximately 40 m, so the DFH must be at least 40 m deep, extending into the chalk, to be intersected by the TBM.
Rates of subsidence are variable across the area. The greatest subsidence rates are at the eastern edge of the hospital and in the hospital car park, which can be seen in the cross-section in
Figure 8. The cross-section was constructed using mean PS displacement measurements, averaged within a 25 m buffer of the profile line, with nodes spaced every 10 m. This area is consistent with the area in
Figure 6 containing boreholes that evidence a DFH.
The western and southern edge of this DFH are well constrained. Boreholes TQ48SW2091, TQ48SW2081, TQ48SW2082 and TQ48SW2083 encounter London Clay at an average depth of −2.2 m AOD (
Figure 6). However, there are no boreholes deeper than 10 m within 250 m to the north or east, so the true lateral extent is unknown. The extent of the DFH and similarities to the DFH at the Blackwall Tunnel is evident in a colour map of the rockhead in
Figure 9. This model consists of depth to rockhead of more than 1000 boreholes, accessed from the BGS and imported into Midland Valley’s Move 3D software, with Ordinary Kriging used to generate a 3D surface. Ordinary Kriging was found to create the most realistic surface and the option to honour all data points was selected. It should be noted that the densities of boreholes in the Blackwall area have enabled greater constraint of this DFH, whilst the data sparsity surrounding the Newham Hospital DFH inhibit recognition of its geometric extent.
The settlement mechanism(s) around Newham Hospital are unclear. Consolidation is evident, potentially being attributable to both anthropogenic (landfill) and natural (DFH) layers and appears to be a long-term phenomenon as settlement is evident since 1992. Dewatering, and to a less extent tunnelling, likely accelerated settlement. Now, these activities have ceased, the area has stabilised with a small amount of heave (ca. 3 mm,
Figure 5e) attributed to groundwater recharge.
3.2. Custom House Residential Area
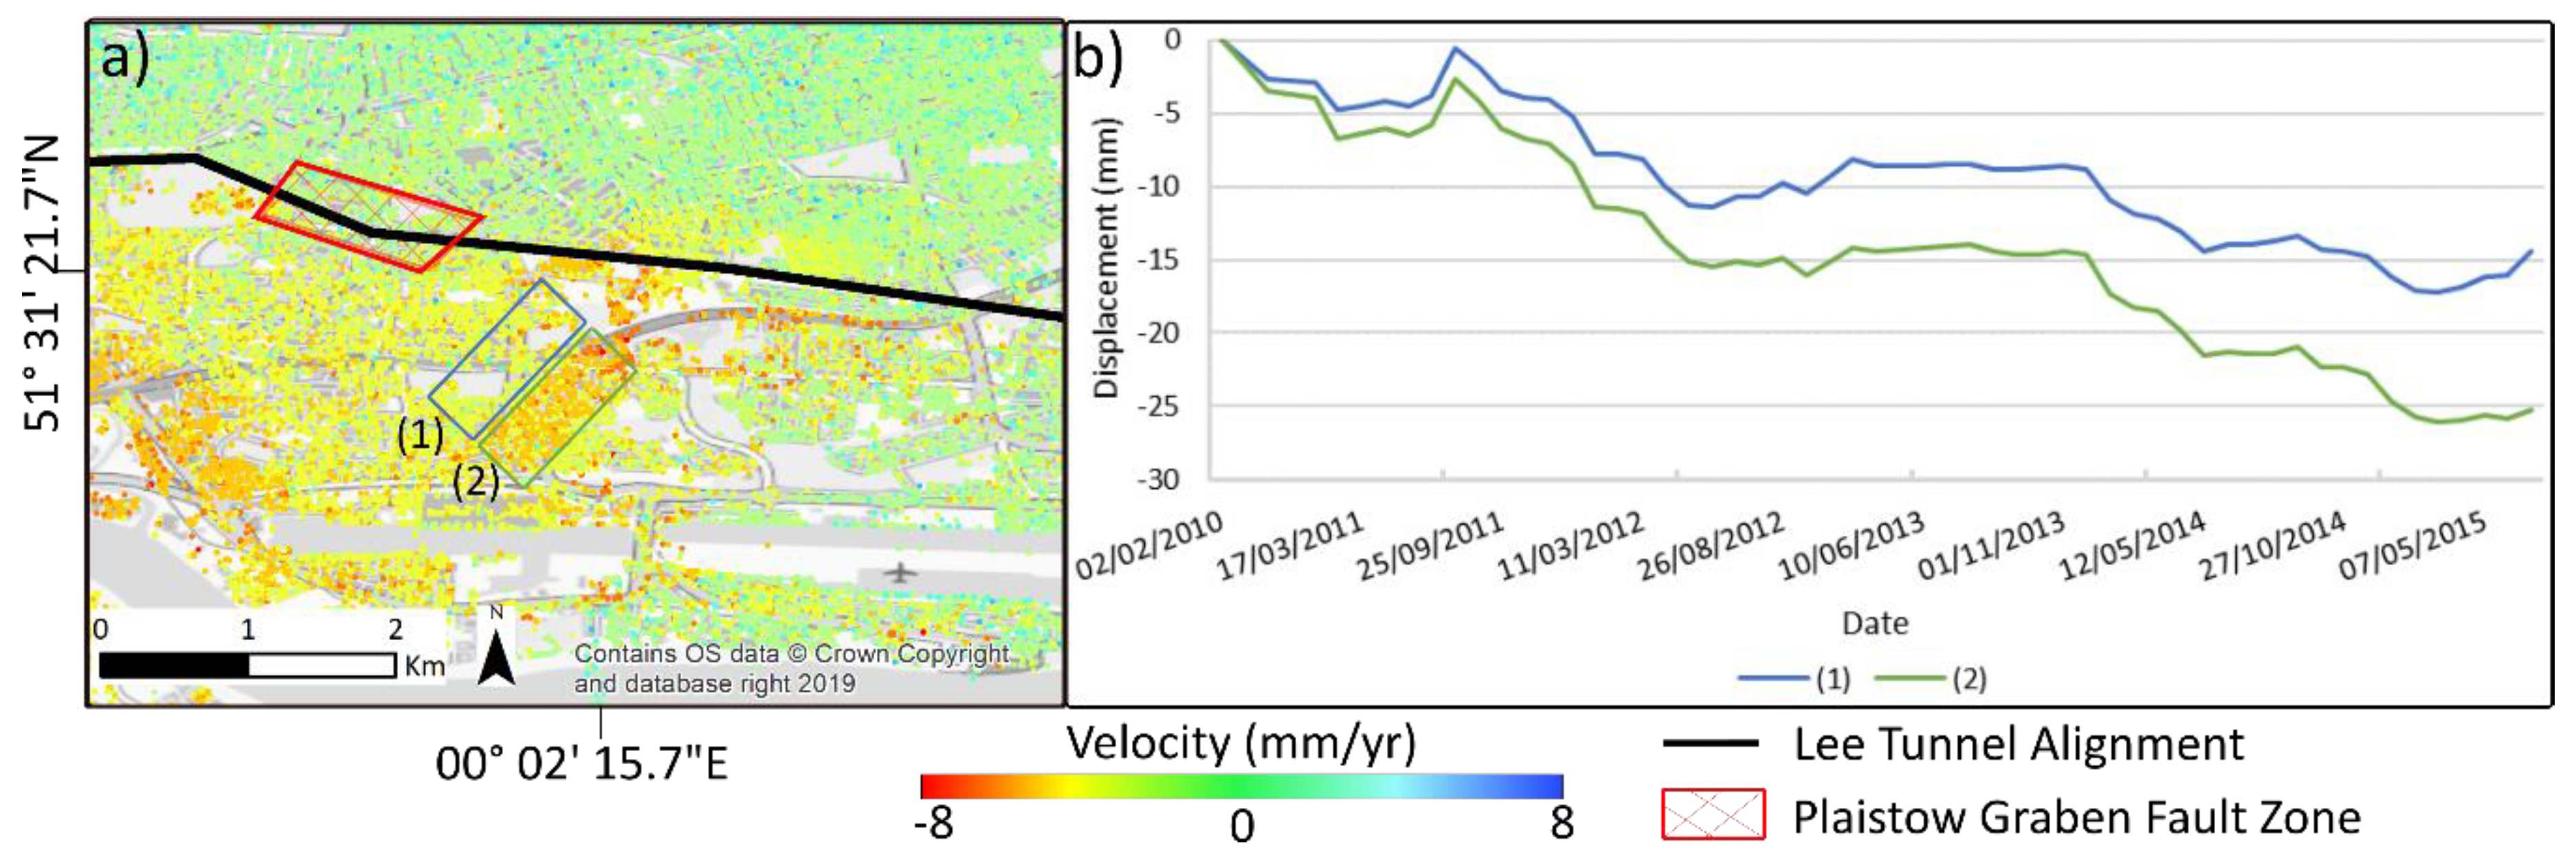
To the south of Newham Hospital, there is another area of subsidence with a distinct north–east to south–west trending boundary (
Figure 10a) and
Figure 3, Location 2. The overall pattern of subsidence, calculated by averaging the PS points within
Figure 10a (1) and (2) is similar on either side of this boundary but the south-eastern side subsides 9 mm more over the same time period (
Figure 10b).
In the ERS data, total displacement from 1992 to 2000 was −6 mm for (1) and −1 mm for (2), a −5 mm difference. From 2002 to 2010, (1) subsides 13 mm and (2) 8 mm ca. 5 mm more. The same pattern is not observed in the Sentinel-1 (1A and 1B) data from 2015 to 2018.
No large-scale redevelopment that aligns with the footprint of this area took place during the study period; the area is occupied by terraced housing, built between the 1960s and the 1990s.
We suggest this boundary is a north–east trending fault. Firstly, it is consistent with the trend of a major fault set identified by Morgan et al. (in press) [
31]. Secondly, it is proximal to the Plaistow Graben fault zone (
Figure 10), which is 750 m to the north–west and a suspected product of major fault linkage, implying the presence of an unmarked fault locally [
31]. Thirdly, the north–east continuation of this boundary intersects the DFH at Newham Hospital and DFH’s are postulated to have an association with faulting [
35,
38], since faults provide pathways for groundwater flow.
Another possible cause of this boundary is variability in the thickness and composition of alluvium, that underlies this area. However, the lack of boreholes in the vicinity of this boundary inhibit verification by examining geological evidence in borehole log records. If this differential settlement is associated with faulting, it would support observations by Mason et al. [
51] that these major structures are actively creeping in London.
3.3. Newham Way A13
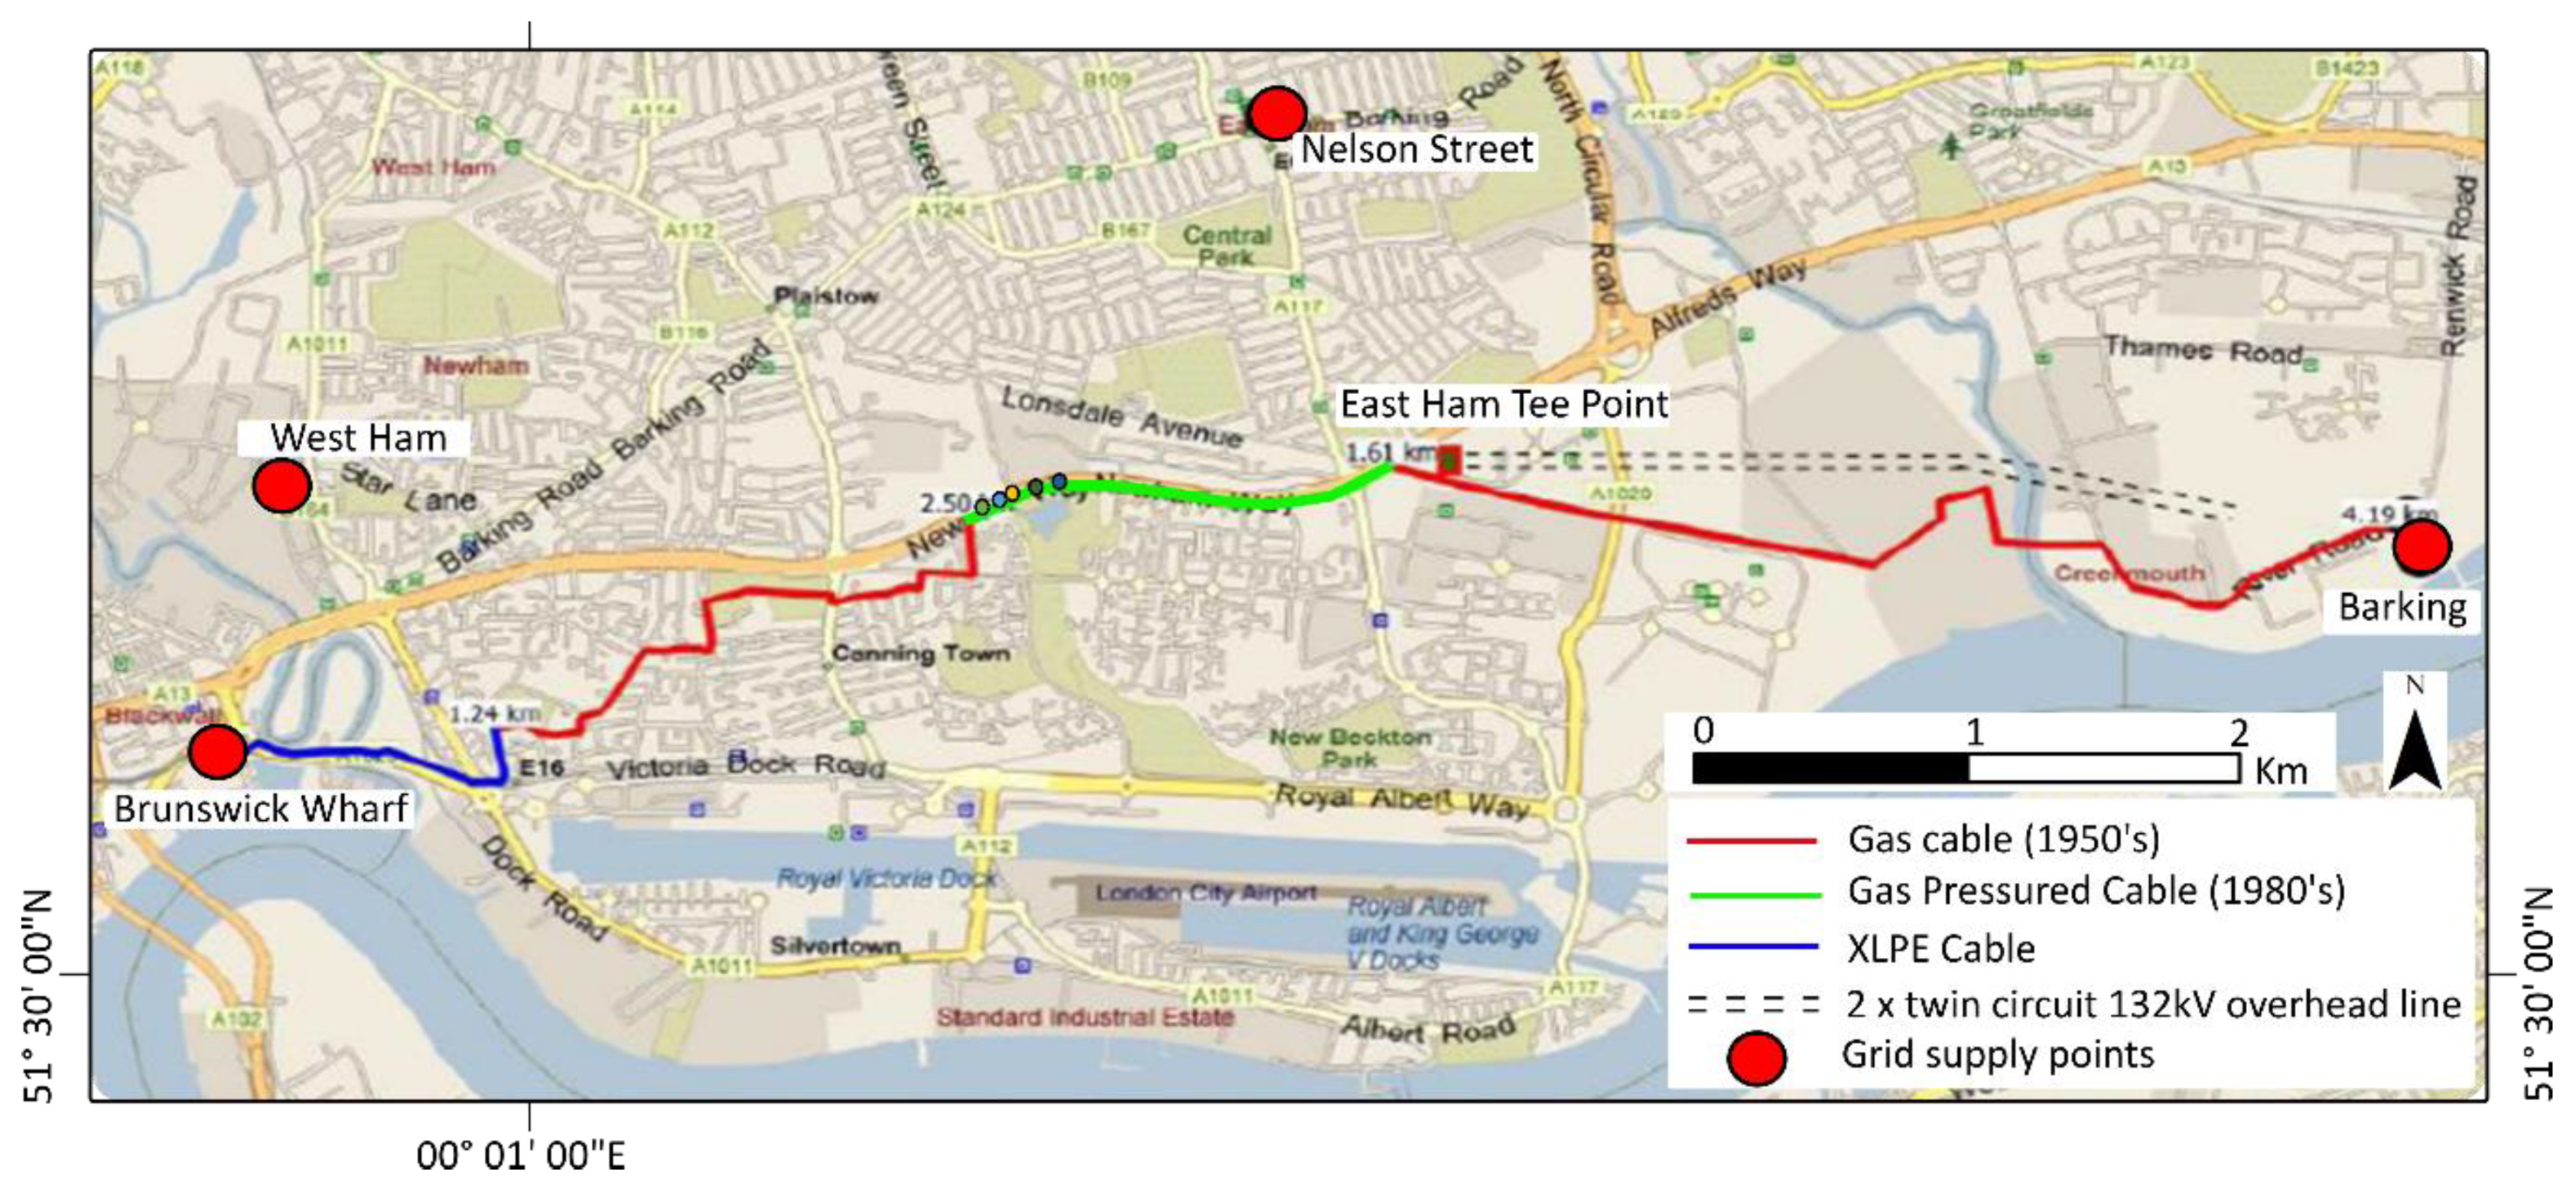
The road surface of Newham Way (A13), between Junctions 9 and 10, subsided by up to 45 mm between February 2010 to December 2015 (
Figure 3, Location 3 and
Figure 11). The cause of this subsidence is uncertain. It is known that there were ongoing improvements works to the A13 during this period. The UK Power Networks (UKPN) replaced a 1.6 km length of cable under the road [
52], the length of which appears to coincide with the section of road with the greatest subsidence (
Figure 12). The exact nature of these works is unknown due to the sensitive nature of the project. Historically, this area has been occupied by marshland, as labelled on historic maps between the 1870s and 1890s (
Figure 4), and this section of road first appears on the 1930 map [
48]. Subsidence here may therefore be a product of both natural and anthropogenic processes.
3.4. East London Crematorium and Cemetery and East Ham Jewish Cemetery
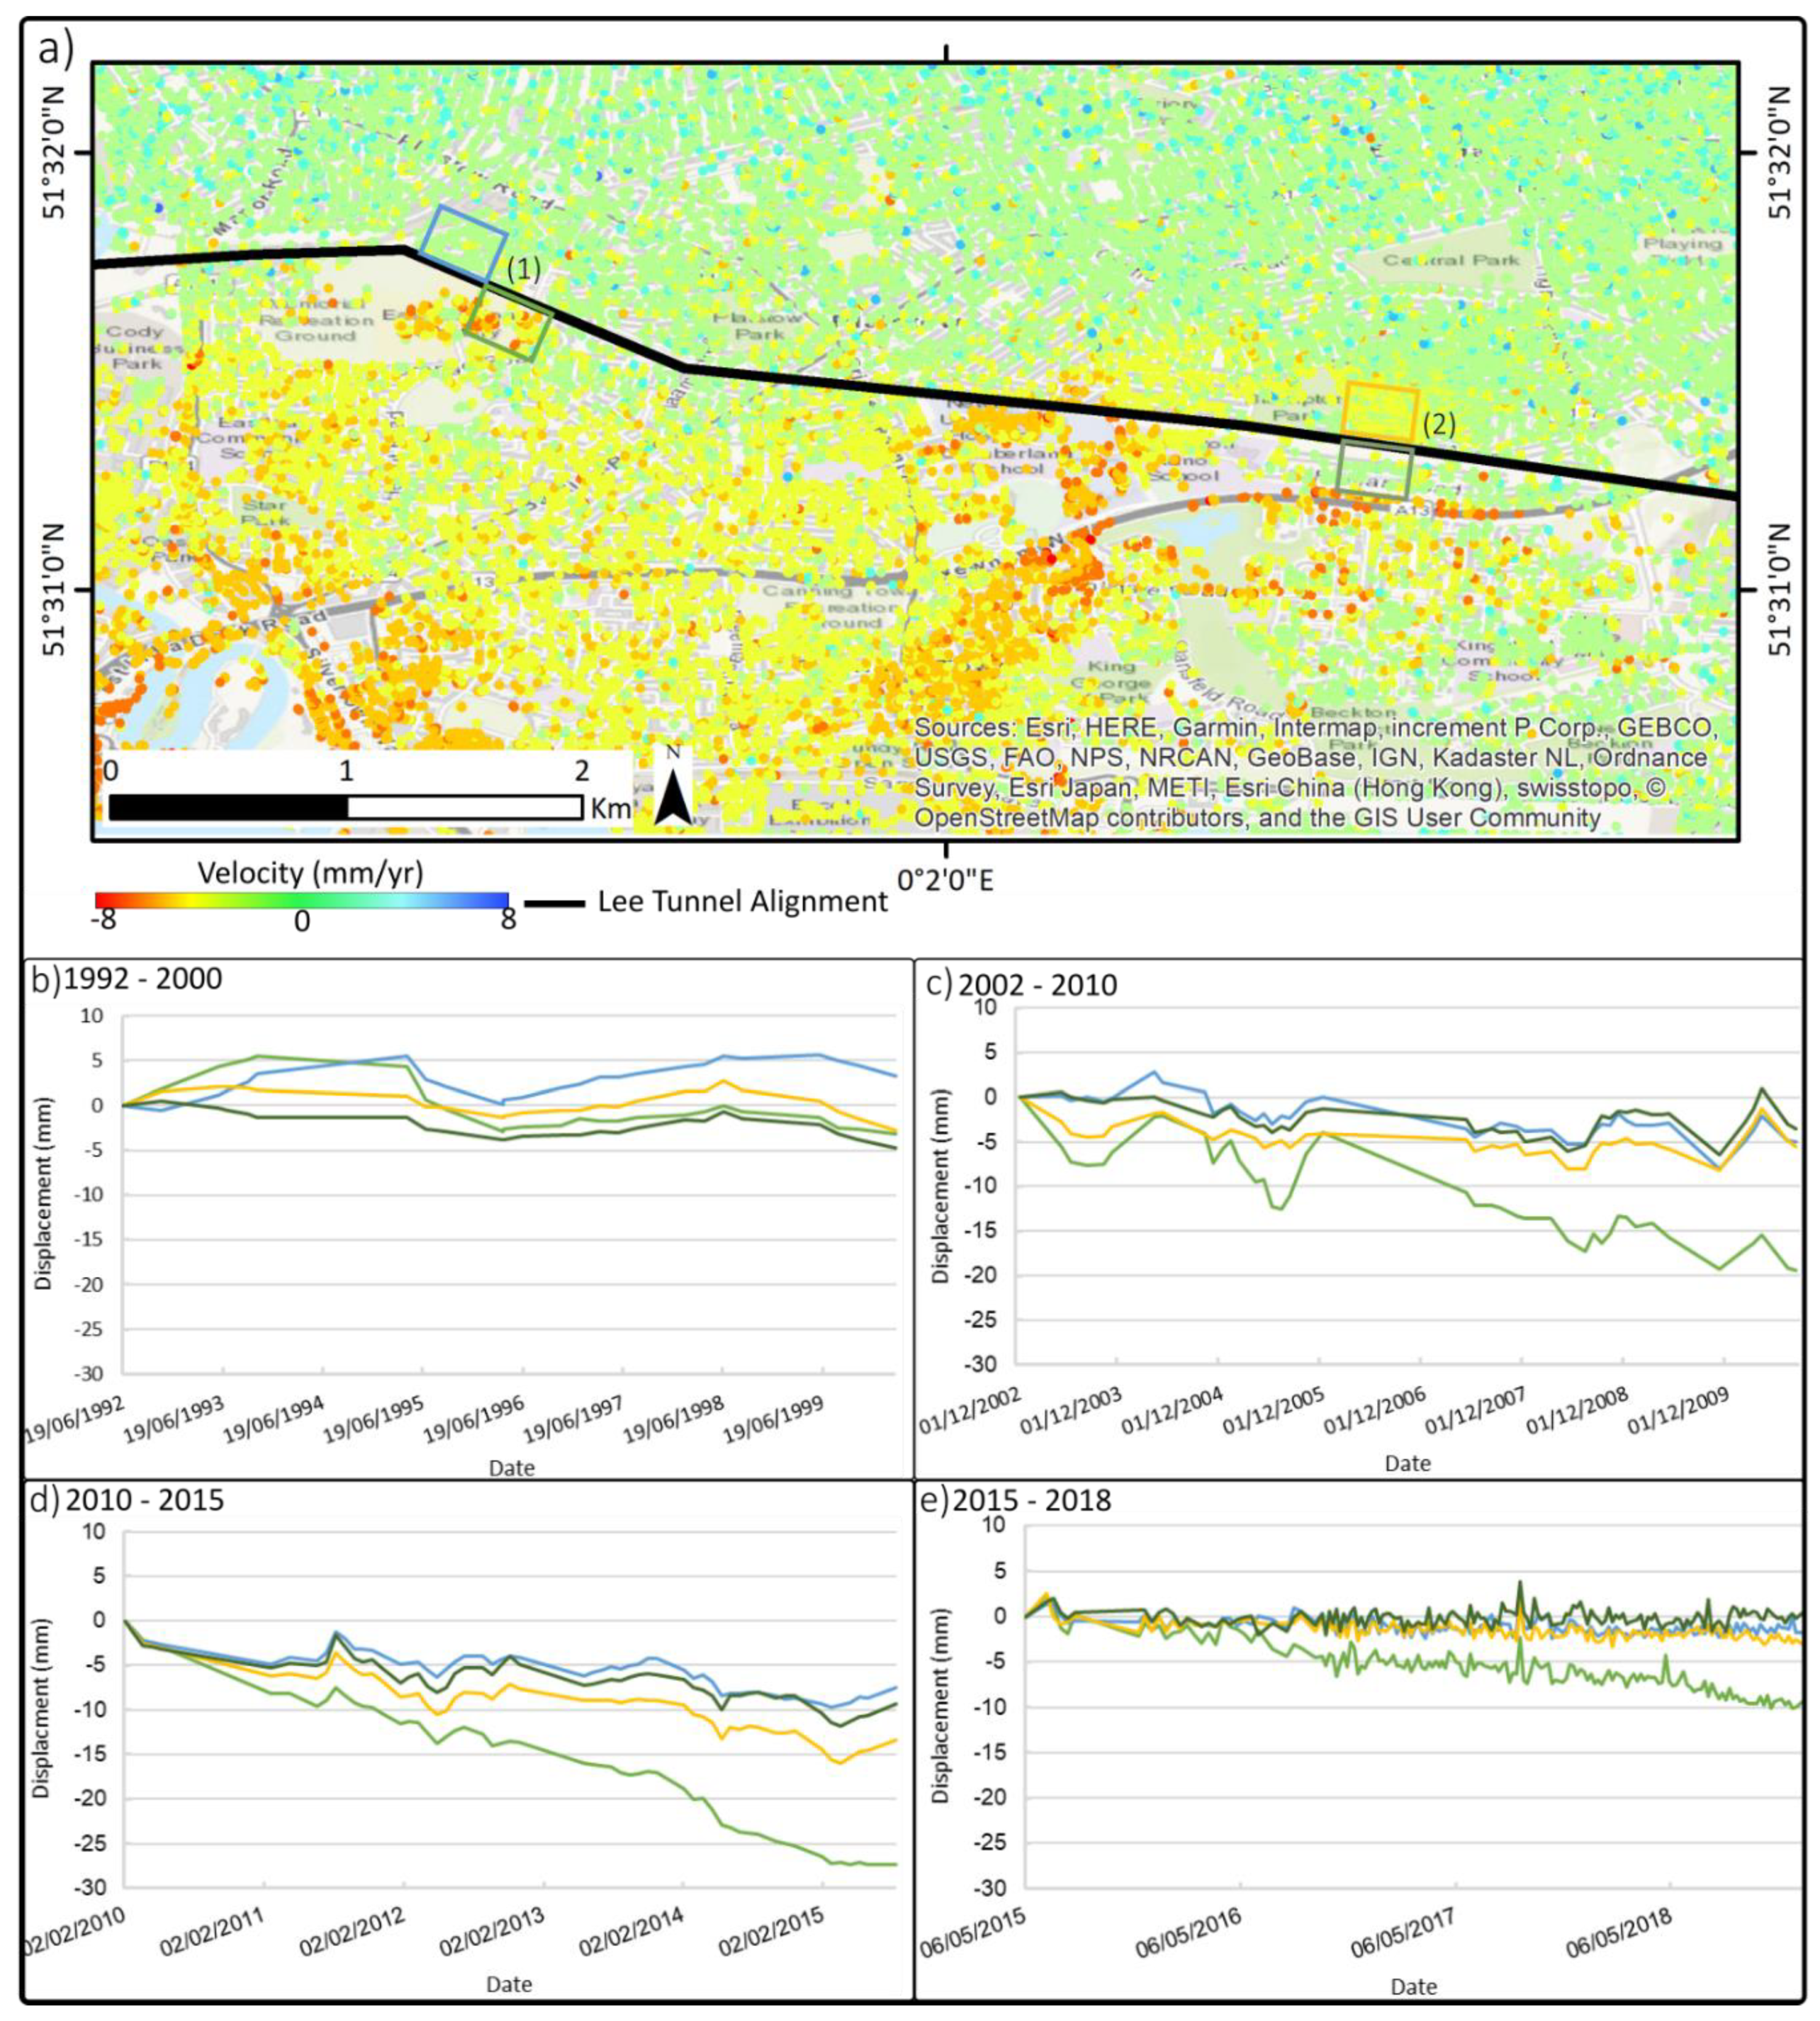
The Lee Tunnel drive passes just North of the East London Cemetery (
Figure 3, Location 4a). Over the 5.5-year period, 27.7 mm of the settlement was observed at the cemetery, when 167 PS points in the cemetery are averaged. On the opposite side of the tunnel drive, there are terraced houses, and the average settlement of 221 points is 6.8 mm in total. The extent of the areas analysed on either side of the tunnel drive is approximately equal, but the comparison area of terraced housing to the north–west of the cemetery area was selected to exclude Lister Gardens, because only areas of Made Ground are required for the comparison against the cemeteries (
Figure 13, Site 1).
A similar disparity in the settlement can be observed at East Ham Jewish Cemetery (
Figure 3, Location 4b), further east along the route (
Figure 13, Site 2). On the north side of the route where the cemetery is, there has been an average total settlement of 12.5 mm, whereas south of the tunnel in the terraced housing, the settlement is only 8 mm.
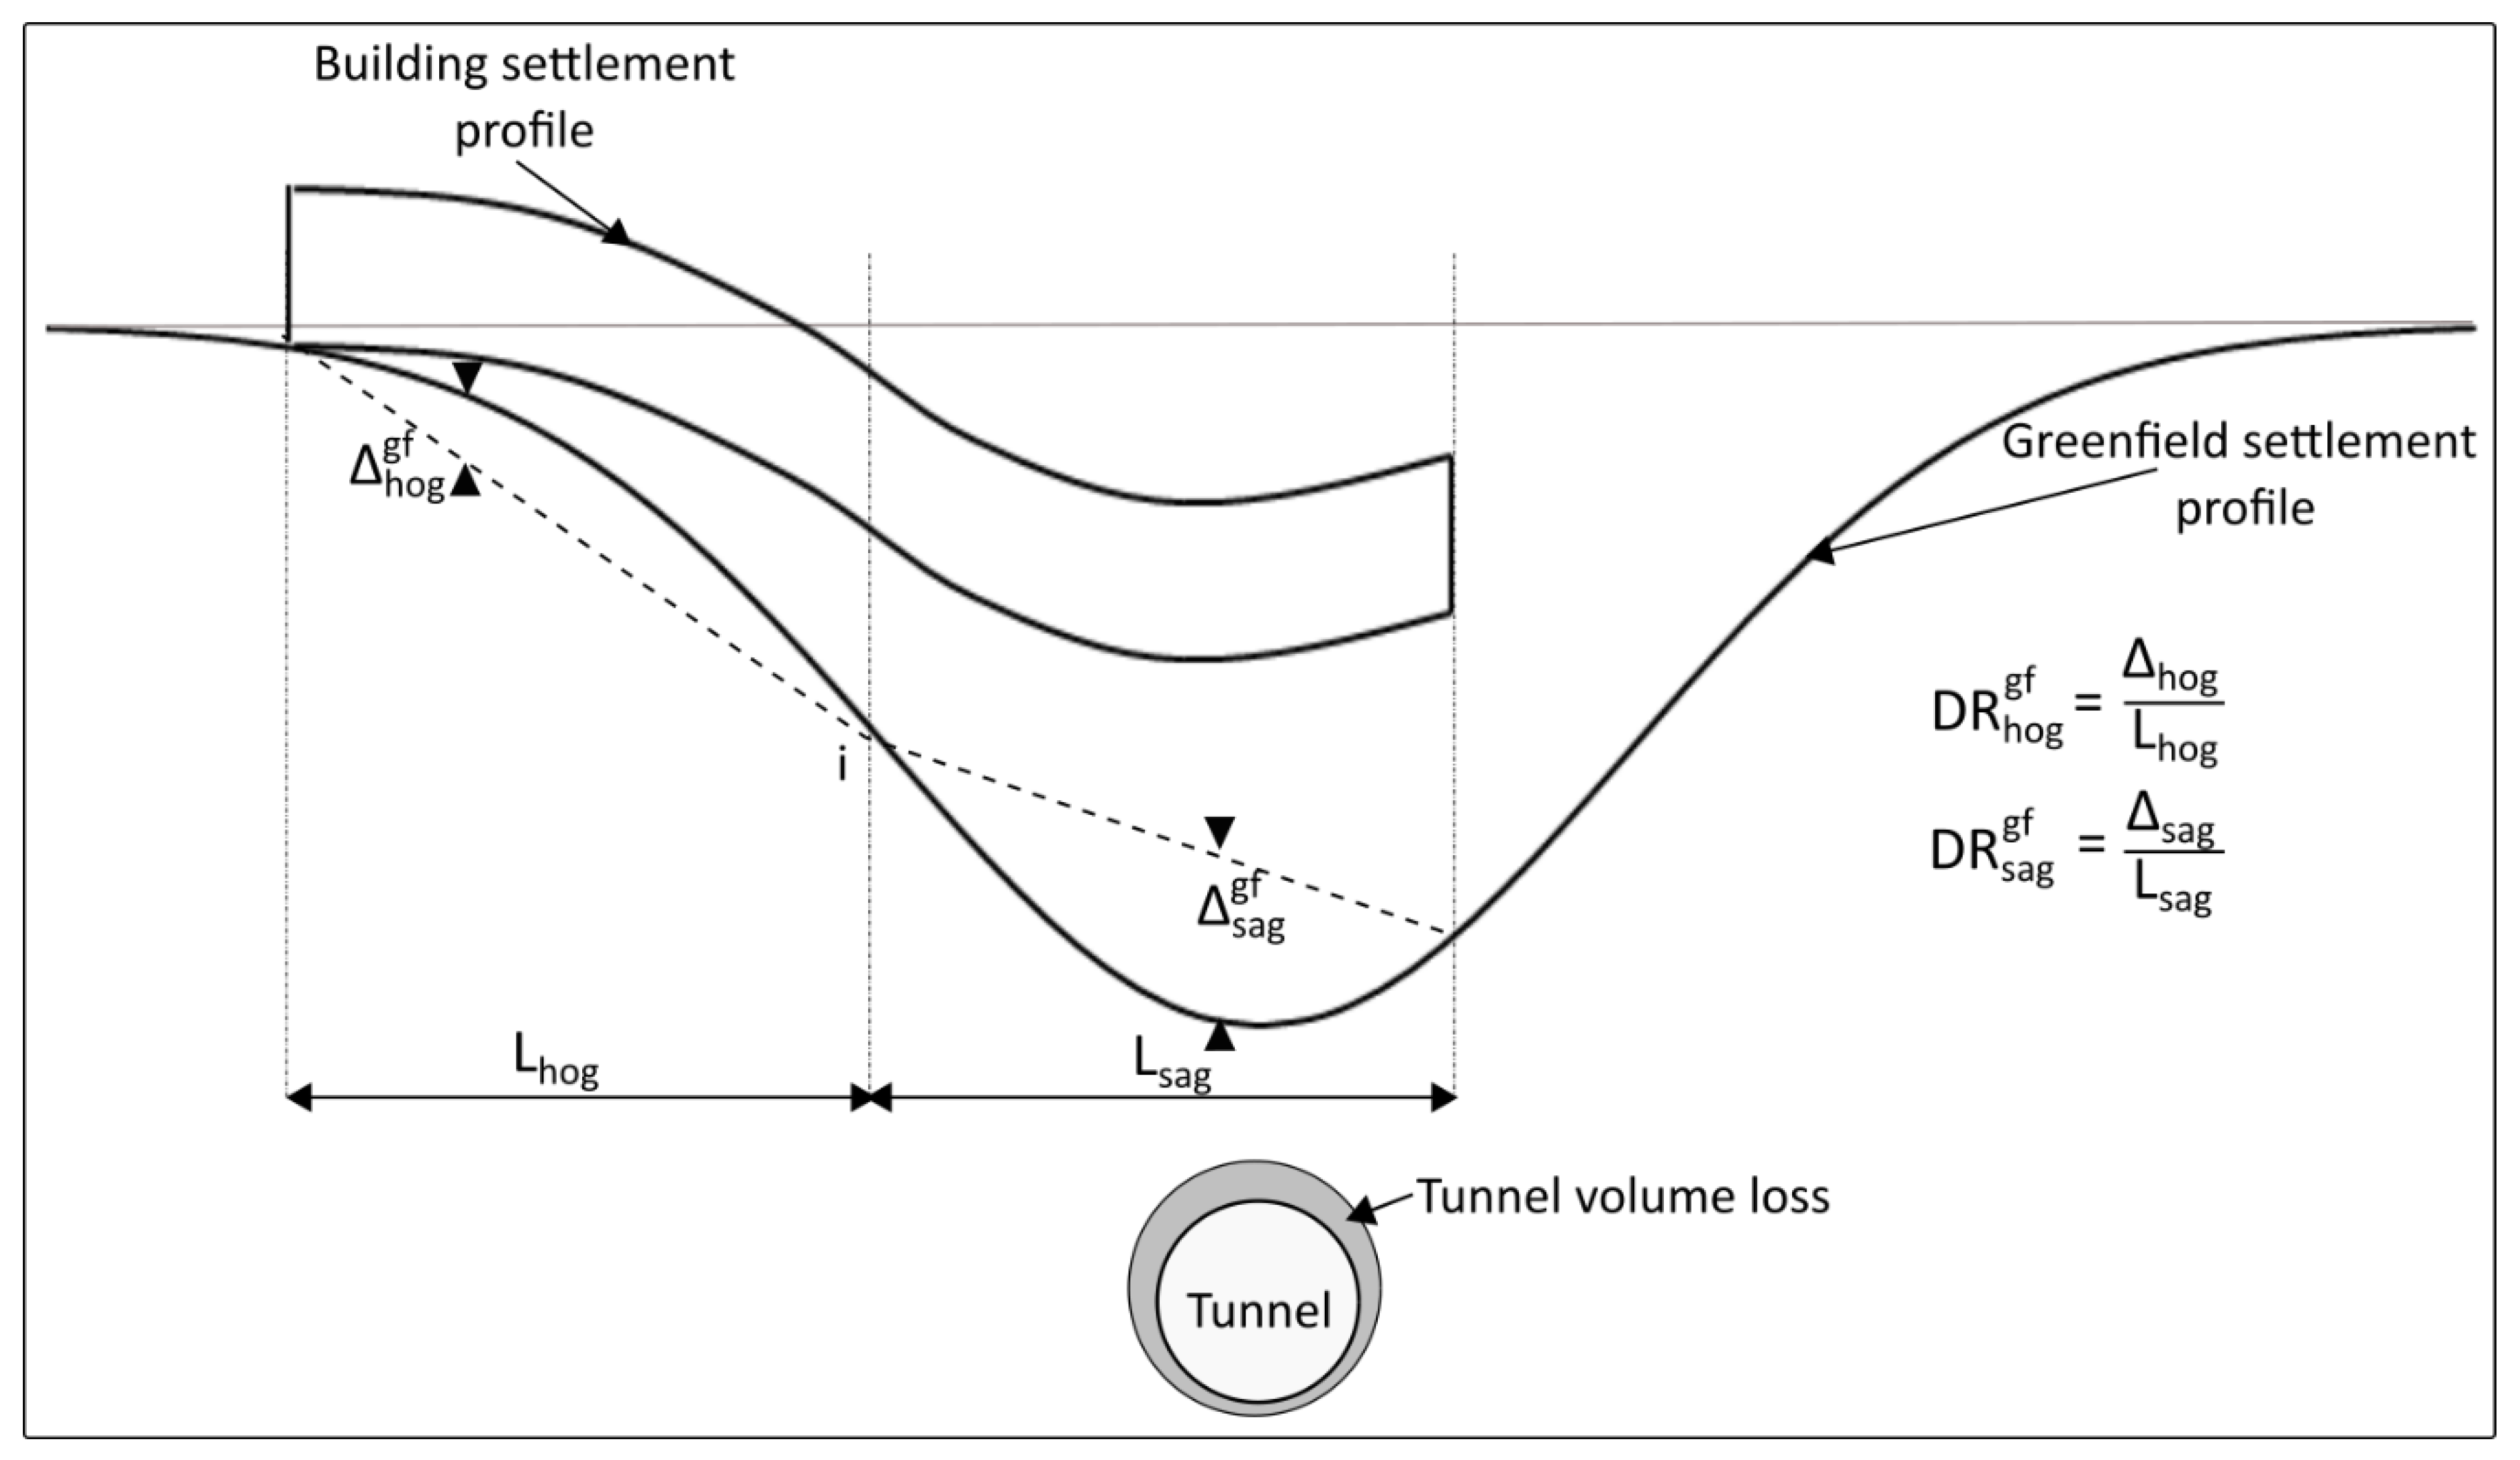
In the cemeteries, the PS points are located either directly on the ground surface or on the gravestones, whereas in the areas of terraced housing, PS points can be located anywhere from the roof to the pavement. Soil–structure interaction, stiffness of existing structures and consolidation from the loading of buildings reduce the magnitude of tunnelling induced displacements and produce a shallower and flatter settlement profile (
Figure 14) [
53,
54].
This could explain why the PS points on the unconsolidated ground of the cemetery subside more than those on the terraced housing. However, Walker [
4] reported that, in general, surface settlement as a result of tunnelling for the Lee Tunnel was less than 2 mm, therefore it is unlikely that tunnelling is the only contributing factor to this deformation. Prior to 2010, the cemeteries and surrounding houses (
Figure 13b,c) subside collectively, with a total displacement of −11 mm; the differing rates of deformation did not begin until approximately January 2011. More recent Sentinel-1 data (post-2015,
Figure 13e) shows that the East London Crematorium and Cemetery is still subsiding, by ca. 13 mm from May 2015 to December 2018, whereas the area of houses is stable, settling by just 1 mm over the 3.5 years (
Figure 13e).
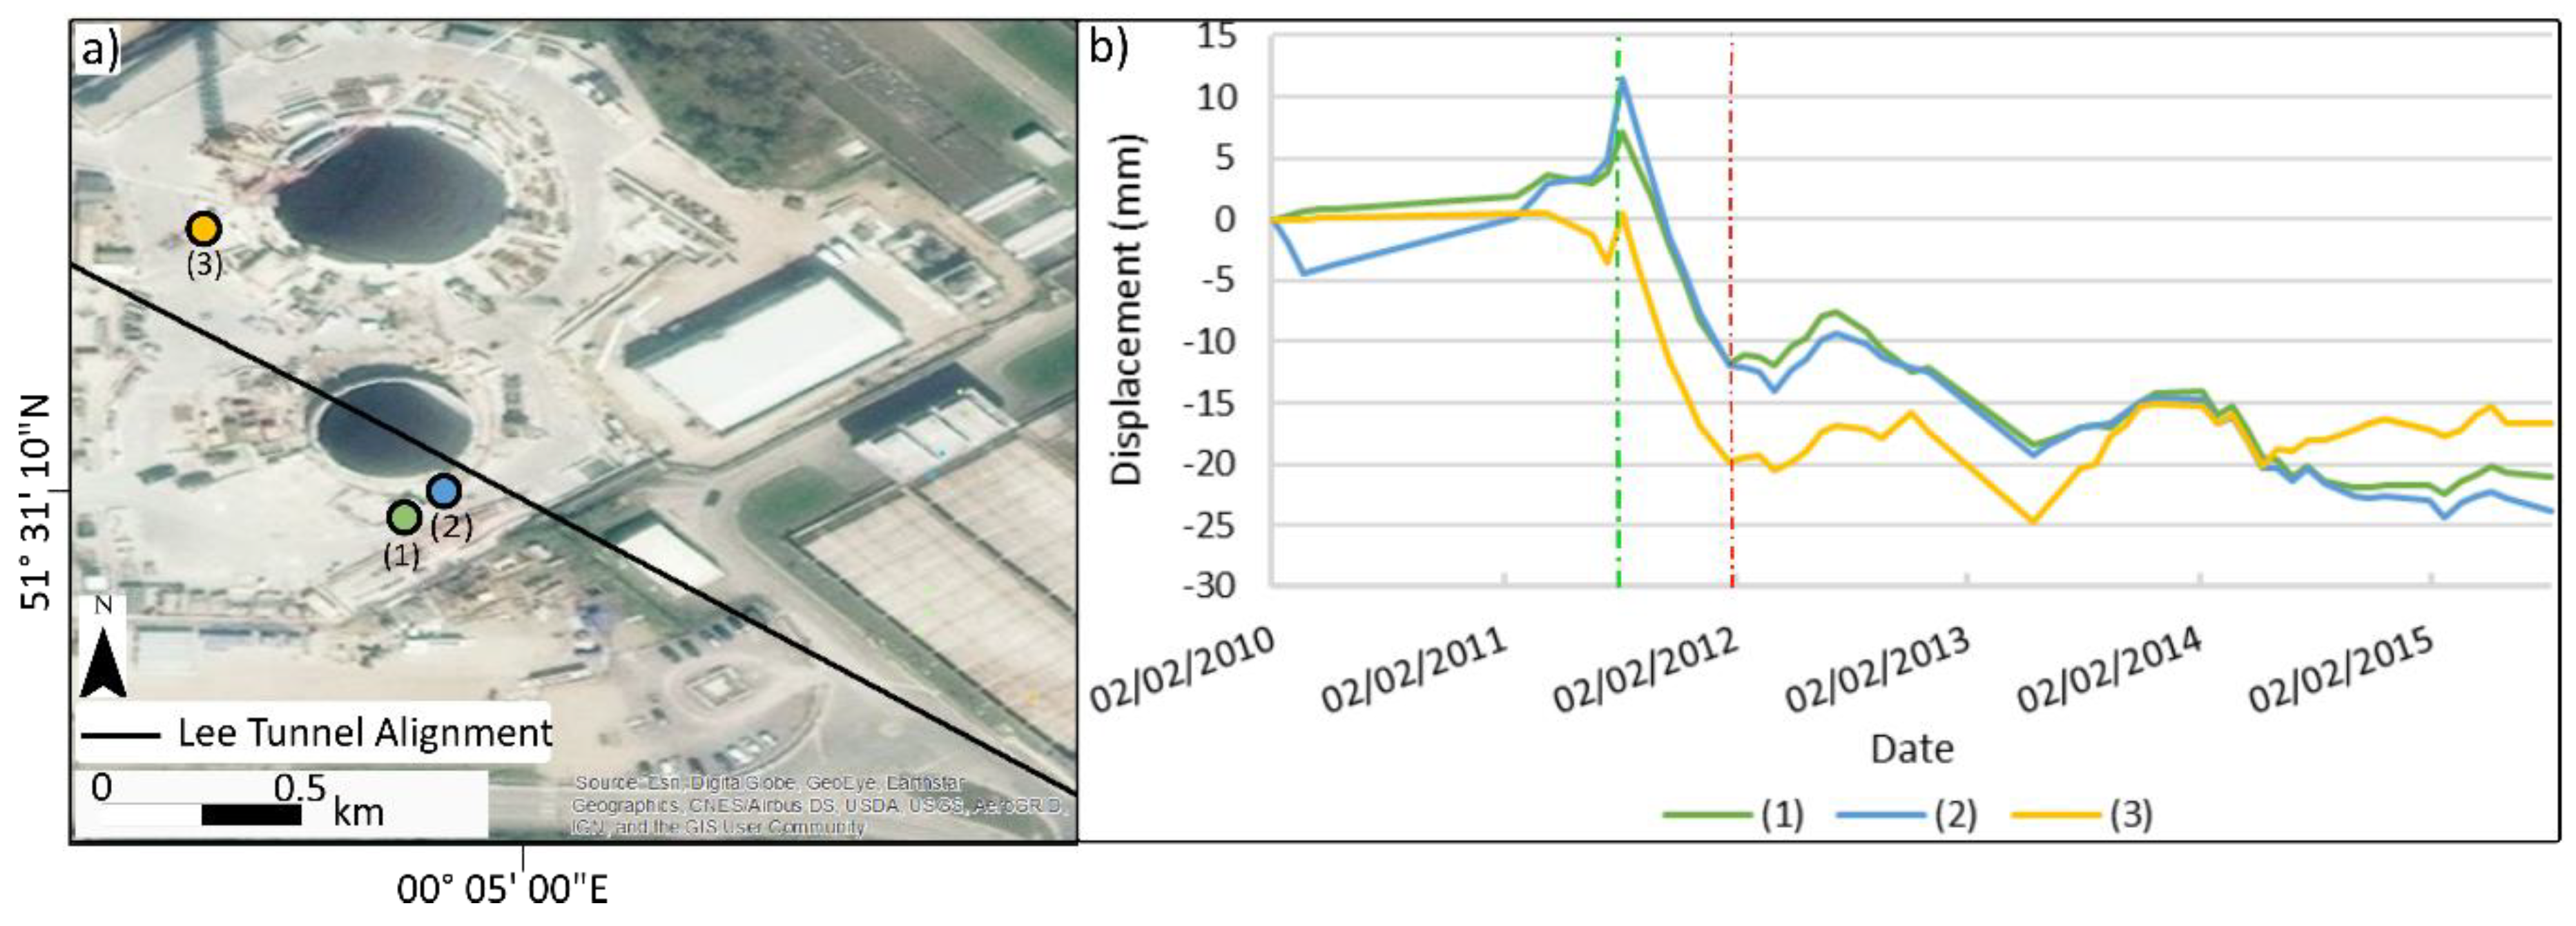
3.5. Dewatering at Beckton
The Beckton site comprises three shafts, the overflow shaft, from which the TBM was launched, the connection shaft, which is sited on the line of the main tunnel and the pumping shaft, which is connected to the main tunnel via a smaller diameter sprayed concrete lining tunnel (
Figure 3, Location 5).
At Beckton, dewatering took place at the pumping and connection shafts for three to four months, achieving a drawdown of 80 m, before it was switched off due to drawing in contaminants [
55]. Three PS points close to the shafts demonstrate the ground response to this dewatering. Pumping began on 9 September 2011, which coincides with the initial decrease in the ground level illustrated in
Figure 15. Pumping ceased at the start of February 2012, after which the ground stabilises.
4. Conclusions
The case studies in this paper demonstrate a range of causes of ground movement, as well as the challenges in interpreting InSAR data in an urban area where there is a long history of ongoing development. If the 2010 to 2015 data from Radarsat-2 only were considered, it could be reasonably concluded that subsidence at and around Newham Hospital was a result of the Lee Tunnel TBM encountering the DFH. Once the InSAR results for the previous 18 years are included, it becomes clear there is a much longer-term and more complex pattern of deformation occurring in this area. Had the 1992–2010 ERS and ENVISAT data been analysed prior to tunnelling, the unusual and longer-term deformation would likely have been noted and a more intense, targeted desk study and further borehole investigation being undertaken prior to TBM launch.
The findings highlight the importance of using InSAR to establish a reliable baseline prior to tunnelling (or other construction). There are currently 27 years of archive InSAR data available for London, from multiple satellites, with different resolutions, coverage and availability, including ERS, ENVISAT, Radarsat-2, Sentinel 1A and 1B, COSMO Sky-Med and TerraSAR-X. No conventional ground-based in-situ measurements can provide a comparable legacy of historical deformation at the same temporal and spatial resolution. Indeed, there are no other, more cost-effective methods for deriving such accurate and widespread measurements of ground movement.
Additionally, we have also shown the InSAR resolution requirements are dependent on the intention of the data. For example, the ERS data contains 27 images over eight years, which is approximately three images a year and is sufficient to define long-term deformation trends. However, during active construction, if InSAR is intended to be used as a monitoring tool, a higher temporal resolution and accuracy of displacement may be required. Aside from TerraSAR-X data, all the other InSAR data is C-band, which has an adequate resolution for these case studies. Therefore, the motivation for the InSAR data being acquired should always be considered when deciding if the higher spatial resolution X-band data is necessary. Despite the differences in resolution and processing between Radarsat-2 and TerraSAR-X, we have shown a strong correlation in their results.
Furthermore, multiple sources of data should be considered to fully understand the cause of deformation. Historical maps and optical imagery should be used to complement the measurement data, to better understand human activities as well as the geomorphology of an area. Ground modelling, geological maps and open-source borehole data are essential to assist in the identification of anomalous ground conditions. Even with all this information, causes cannot always be confirmed without local knowledge, as illustrated by the deformation at the A13.
Author Contributions
Conceptualization, J.S, R.G., J.L. and P.M.; methodology, J.S.; software, J.S. and R.H.; validation, J.S., M.B.; formal analysis, J.S.; investigation, J.S. and M.B.; resources, J.S., M.B. and R.H.; data curation, J.S. and R.H.; writing—original draft preparation, J.S.; writing—review and editing, J.S., R.G., J.L., P.M. and T.M.; visualization, J.S.; supervision, R.G., J.L. and P.M.; project administration, R.G., J.L. and P.M.; funding acquisition, R.G., J.L. and P.M. All authors have read and agreed to the published version of the manuscript.
Funding
This work was funded by the Engineering and Physical Sciences Research Council, grant number EP/L016826/1. The APC was funded by Research Councils UK (RCUK).
Acknowledgments
This research has been conducted as part of a PhD, funded by EPSRC (UK) Award EP/L016826/1 and Thames Tideway East (Costain Vinci Bachy JV). The authors would also like to thank CGG and TRE Altamira for providing data for this project and to PETEX for the academic licence for Midland Valley’s Move 3D software.
Conflicts of Interest
The authors declare no conflicts of interest.
References
- EC. Council Directive 91/271/EEC of 21 May 1991 Concerning Urban Waste-Water Treatment. J. Eur. Commun. 1991, 34, 40. [Google Scholar]
- Anamoah, M.; Feeney, M. The Lee Tunnel—TBM Launch. Wastewater Treatment & Sewerage. 2013, pp. 107–111. Available online: http://www.ukwaterprojectsonline.com/case_studies/2013/Thames_Lee_Tunnel_2013.pdf (accessed on 20 August 2019).
- Mitchell, R.; Jewell, P. The Lee Tunnel. Wastewater Treatment & Sewerage. 2011, pp. 57–62. Available online: http://www.ukwaterprojectsonline.com/case_studies/2011/Thames_Lee_Tunnel_2011.pdf (accessed on 20 August 2019).
- Walker, A. The Lee Tunnel. London’s deepest sewer—The main TBM drive and tunnel lining. Wastewater Treatment & Sewerage. 2014, pp. 1–5. Available online: http://www.ukwaterprojectsonline.com/case_studies/2014/Thames_Lee_Tunnel_2014.pdf (accessed on 20 August 2019).
- Costes, E.; Jewell, P.; Michel, C.; Pogu, F. Lee tunnel project—The first step toward a cleaner River Thames. Civ. Eng. 2018, 171, 69–76. [Google Scholar] [CrossRef]
- Tideway. Annual Report 2018/19. Available online: https://www.tideway.london/corporate-info/financial-publications/ (accessed on 20 November 2019).
- Bischoff, C.A.; Ghail, R.C.; Mason, P.J.; Ferretti, A.; Davis, J.A. Photographic feature: Revealing millimetre-scale ground movements in London using SqueeSAR™. Q. J. Eng. Geol. Hydrogeol. 2020, 53, 3–11. [Google Scholar] [CrossRef]
- Giardina, G.; Milillo, P.; DeJong, M.J.; Perissin, D.; Milillo, G. Evaluation of InSAR monitoring data for post-tunnelling settlement damage assessment. Struct. Control Health Monit. 2018, 26, e2285. [Google Scholar] [CrossRef] [Green Version]
- Marti, J.G.; Nevard, S.; Sanchez, J. The use of InSAR (Interferometric Synthetic Aperture Radar) to complement control of construction and protect third party assets. In Crossrail Learning Legacy Report; Crossrail Ltd.: London, UK, 2017. [Google Scholar]
- Milillo, P.; Giardina, G.; DeJong, M.J.; Perissin, D.; Milillo, G. Multi-Temporal InSAR Structural Damage Assessment: The London Crossrail Case Study. Remote Sens. 2018, 10, 287. [Google Scholar] [CrossRef] [Green Version]
- Robles, J.G.; Black, M.; Gomar, B. Correlation Study between In-Situ Auscultation and Satellite Interferometry for the Assessment of Nonlinear Ground Motion on Crossrail London. In Crossrail Learning Legacy Report; Crossrail Ltd.: London, UK, 2016. [Google Scholar]
- Chen, W.-F.; Gong, H.-L.; Chen, B.-B.; Liu, K.-S.; Gao, M.; Zhou, C.-F. Spatiotemporal evolution of land subsidence around a subway using InSAR time-series and the entropy method. Giscience Remote Sens. 2017, 54, 78–94. [Google Scholar] [CrossRef]
- Ge, D.; Zhang, L.; Li, M.; Liu, B.; Wang, Y. Beijing subway tunnellings and high-speed railway subsidence monitoring with PSInSAR and TerraSAR-X data. In Proceedings of the Geoscience and Remote Sensing Symposium (IGARSS), Beijing, China, 10–15 July 2016; pp. 6883–6886. [Google Scholar]
- Wang, H.; Feng, G.; Xu, B.; Yu, Y.; Li, Z.; Du, Y.; Zhu, J. Deriving spatio-temporal development of ground subsidence due to subway construction and operation in delta regions with PS-InSAR data: A case study in Guangzhou, China. Remote Sens. 2017, 9, 1004. [Google Scholar] [CrossRef] [Green Version]
- Koudogbo, F.; Urdiroz, A.; Robles, J.G.; Chapron, G.; Lebon, G.; Fluteaux, V.; Priol, G. Radar interferometry as an innovative solution for monitoring the construction of the Grand Paris Express metro network–First results. In Proceedings of the World Tunnel Congress, Dubai, UAE, 21–25 April 2018. [Google Scholar]
- Liu, D.; Sowter, A.; Niemeier, W. Process-related deformation monitoring by PSI using high resolution space-based SAR data: A case study in Düsseldorf, Germany. Nat. Hazards Earth Syst. Sci. Discuss. 2014, 2, 4813–4830. [Google Scholar] [CrossRef]
- Arangio, S.; Calò, F.; Di Mauro, M.; Bonano, M.; Marsella, M.; Manunta, M. An application of the SBAS-DInSAR technique for the assessment of structural damage in the city of Rome. Struct. Infrastruct. Eng. 2014, 10, 1469–1483. [Google Scholar] [CrossRef]
- Korff, M.; Maccabiani, J. Building damage related to Amsterdam subway; comparison of traditional monitoring with satellite monitoring results. In Proceedings of the 4th International Conference on Computational Methods in Tunnelling and Subsurface Engineering, Innsbruck, Austria, 18–20 April 2017. [Google Scholar]
- Poncos, V.; Teleaga, D.; Boukhemacha, M.A.; Toma, S.A.; Serban, F. Study of urban instability phenomena in Bucharest city based on Ps-InSAR. In Proceedings of the Geoscience and Remote Sensing Symposium (IGARSS), Quebec City, QC, Canada, 13–18 July 2014; pp. 429–432. [Google Scholar]
- García, A.J.; Marchamalo, M.; Martínez, R.; González-Rodrigo, B.; González, C. Integrating geotechnical and SAR data for the monitoring of underground works in the Madrid urban area: Application of the Persistent Scatterer Interferometry technique. Int. J. Appl. Earth Obs. Geoinf. 2019, 74, 27–36. [Google Scholar] [CrossRef]
- Serrano-Juan, A.; Pujades, E.; Vázquez-Suñè, E.; Crosetto, M.; Cuevas-González, M. Leveling vs. InSAR in urban underground construction monitoring: Pros and cons. Case of la sagrera railway station (Barcelona, Spain). Eng. Geol. 2017, 218, 1–11. [Google Scholar] [CrossRef]
- Eppler, J.; Kubanski, M. Subsidence monitoring of the Seattle viaduct tunnelling project with Homogeneous Distributed Scatterer InSAR. In Proceedings of the Ninth Symposium on Field Measurements in Geomechanics, 9–11 September 2015; pp. 303–313. [Google Scholar]
- Skipper, J.; Edgar, J. The Harwich formation in London—The legacy of Chris King. Proc. Geol. Assoc. 2019. [Google Scholar] [CrossRef]
- Bellhouse, M.; Skipper, J.; Sutherden, R. The engineering geology of the Lee Tunnel. In Proceedings of the Geotechnical Engineering for Infrastructure and Development: XVI European Conference on Soil Mechanics and Geotechnical Engineering, Edinburgh, UK, 13–17 September 2015; pp. 419–424. [Google Scholar]
- Newman, T.; Bellhouse, M.; Corcoran, J.; Sutherden, R.; Karaouzene, R.; Shirlaw, J.N. Discussion: TBM performance through the engineering geology of the Lee Tunnel. Proc. Inst. Civ. Eng. Geotech. Eng. 2017, 170, 559–560. [Google Scholar] [CrossRef] [Green Version]
- Newman, T.; Hadlow, N.W. Evaluation of chalk rock mass properties in subcrop and outcrop in London; examples from the Tideway and Lee tunnels. In Proceedings of the Engineering in Chalk 2018, Imperial College London, London, UK, 17–18 September 2018; pp. 721–727. [Google Scholar]
- Newman, T. Ground modelling for the Lee Tunnel. In Engineering Geology an Experience in the East London and Thames Gateway Area; Geological Society: London, UK, 2008. [Google Scholar]
- Skipper, J.; Newman, T.; Mortimore, R. The Engineering Geology of the Lee Tunnel; Euroengeo International Association of Engineering Geology: London, UK, 2008. [Google Scholar]
- Ellison, R.; Woods, M.; Allen, D.; Forster, A.; Pharaoh, T.; King, C. Geology of London: Special Memoir for 1: 50000 Geological Sheets 256 (North London), 257 (Romford), 270 (South London), and 271 (Dartford)(England and Wales); British Geological Survey: London, UK, 2004. [Google Scholar]
- Newman, T. Engineering Geology of the Thames Tideway Tunnel The Story So Far. In Proceedings of the 14th Annual BGA Conference, Institution of Civil Engineers, London, UK, 21 June 2017. [Google Scholar]
- Morgan, T.; Ghail, R.C.; Lawrence, J. Major faulting in London: Evidence for inherited basement faults in the London Basin. Q. J. Eng. Geol. Hydrogeol. 2020, in press. [Google Scholar] [CrossRef]
- Berry, F. Late Quaternary scour-hollows and related features in central London. Q. J. Eng. Geol. Hydrogeol. 1979, 12, 9–29. [Google Scholar] [CrossRef]
- Flynn, A.; Collins, P.; Reading, P.; Banks, V.; Anguilano, L. The role of chalk in the development of buried (“drift-filled”) hollows. In Proceedings of the Engineering in Chalk, Imperial College London, London, UK, 17–18 September 2018; pp. 309–314. [Google Scholar]
- Hutchinson, J. Possible late Quaternary pingo remnants in central London. Nature 1980, 284, 253. [Google Scholar] [CrossRef]
- Banks, V.J.; Bricker, S.H.; Royse, K.R.; Collins, P.E.F. Anomalous buried hollows in London: Development of a hazard susceptibility map. Q. J. Eng. Geol. Hydrogeol. 2015, 48, 55–70. [Google Scholar] [CrossRef] [Green Version]
- Ghail, R.; Mason, P.; Skipper, J. The geological context and evidence for incipient inversion of the London Basin. In Proceedings of the Geotechnical Engineering for Infrastructure and Development: XVI European Conference on Soil Mechanics and Geotechnical Engineering, Edinburgh, UK, 13–17 September 2015. [Google Scholar]
- Collins, P.E.; Banks, V.J.; Royse, K.R.; Bricker, S.H. Superficial hollows and rockhead anomalies in the London Basin, UK: Origins, distribution and risk implications for subsurface infrastructure and water resources. In Engineering Geology for Society and Territory-Volume 6; Springer: Berlin/Heidelberg, Germany, 2015; pp. 663–666. [Google Scholar]
- Toms, E.; Mason, P.J.; Ghail, R.C. Drift-filled hollows in Battersea: Investigation of the structure and geology along the route of the Northern Line Extension, London. Q. J. Eng. Geol. Hydrogeol. 2016, 49, 147–153. [Google Scholar] [CrossRef]
- Environment Agency. Management of the London Basin Chalk Aquifer Status Report 2018. 2018. Available online: https://www.gov.uk/government/publications/london-basin-chalk-aquifer-annual-status-report (accessed on 20 August 2019).
- Jewell, P.; O’Connor, M. The Lee Tunnel Shafts. Wastewater Treatment & Sewerage. 2012, pp. 33–37. Available online: http://www.ukwaterprojectsonline.com/case_studies/2012/Thames_Lee_Tunnel_2012.pdf (accessed on 20 August 2019).
- Tunnel Talk. TBMs Ready for London Sewerage Drives. Available online: https://tunneltalk.com/Lee-Tunnel-Feb12-Beckton-sewage-works-extension-TBM-drive.php (accessed on 11 July 2019).
- Attewell, P. An overview of site investigation and long-term tunnelling-induced settlement in soil. Geol. Soc. Lond. Eng. Geol. Spec. Publ. 1988, 5, 55–61. [Google Scholar] [CrossRef]
- Moss, N.; Bowers, K. Settlement due to tunnelling on the CTRL London Tunnels. In Proceedings of the Geotechnical Aspects of Underground Construction in Soft Ground—Proceedings of the 5th International Conference of TC28 of the ISSMGE, Amsterdam, The Netherlands, 15–17 June 2005. [Google Scholar]
- Ferretti, A.; Prati, C.; Rocca, F. Permanent scatterers in SAR interferometry. IEEE Trans. Geosci. Remote Sens. 2001, 39, 8–20. [Google Scholar] [CrossRef]
- Crosetto, M.; Monserrat, O.; Jungner, A.; Crippa, B. Persistent scatterer interferometry: Potential and limits. In Proceedings of the 2009 ISPRS Workshop on High-Resolution Earth Imaging for Geospatial Information, Hannover, Germany, 2–5 June 2009. [Google Scholar]
- Bischoff, C. Monitoring Ground Movements and Infrastructure in London, UK, Using Permanent Scatterer Interferometry; Imperial College London: London, UK, 2019. [Google Scholar]
- Ferretti, A.; Fumagalli, A.; Novali, F.; Prati, C.; Rocca, F.; Rucci, A. A new algorithm for processing interferometric data-stacks: SqueeSAR. IEEE Trans. Geosci. Remote Sens. 2011, 49, 3460–3470. [Google Scholar] [CrossRef]
- EDINA Historic Digimap Service: 1870–1996, Ordnance Survey, UK. Available online: http://0-edina-ac-uk.brum.beds.ac.uk/digimap (accessed on 20 August 2017).
- Department of Environment Food and Rural Affairs. Historic Landfill Sites. Available online: https://environment.data.gov.uk/DefraDataDownload/?mapService=EA/HistoricLandfill&Mode=spatial (accessed on 8 July 2019).
- Semertzidou, K. Crossrail Project Dewatering Work—Close-Out Report; Crossrail Learning Legacy: 2016. Available online: https://learninglegacy.crossrail.co.uk/documents/crossrail-dewatering-works-close-report/ (accessed on 20 August 2019).
- Mason, P.J.; Ghail, R.; Bischoff, C.; Skipper, J. Detecting and Monitoring Small-Scale Discrete Ground Movements Across London, Using Persistent Scatterer InSAR (PSI). In Proceedings of the Geotechnical Engineering for Infrastructure and Development: XVI European Conference on Soil Mechanics and Geotechnical Engineering, Edinburgh, UK, 13–17 September 2015. [Google Scholar]
- Winch, C. East London LPN Regional Development Plan. UK Power Networks. Available online: https://library.ukpowernetworks.co.uk/library/en/RIIO/Asset_Management_Documents/Regional_Development_Plans/ (accessed on 20 August 2019).
- Farrell, R.; Mair, R.; Sciotti, A.; Pigorini, A. Building response to tunnelling. Soils Found. 2014, 54, 269–279. [Google Scholar] [CrossRef] [Green Version]
- Leca, E.; New, B. Settlements induced by tunneling in soft ground. Tunn. Undergr. Space Technol. 2007, 22, 119–149. [Google Scholar]
- Warren, C.; Newman, T.; Hadlow, N.W. Comparison of earth pressure balance and slurry tunnel boring machines used for tunnelling in Chalk. In Proceedings of the Engineering in Chalk 2018, Imperial College London, London, UK, 17–18 September 2018; pp. 617–628. [Google Scholar]
Figure 1.
Map showing the location of major tunnelling projects in London since 2010. The area studied in this paper is shown by the black rectangle.
Figure 1.
Map showing the location of major tunnelling projects in London since 2010. The area studied in this paper is shown by the black rectangle.
Figure 2.
Geological cross-section of the Lee Tunnel (modified after Newman et al. [
25]).
Figure 2.
Geological cross-section of the Lee Tunnel (modified after Newman et al. [
25]).
Figure 3.
Extent of the Radarsat-2 dataset (2010 to 2015), showing average velocity in mm/y overlain on ArcGIS Online World Imagery. The locations of the Lee Tunnel route and its main shafts are shown, in addition to the case study sites at: 1—Newham Hospital; 2—Custom House Residential Area; 3—A13 Newham Way; 4a—East London Crematorium and Cemetery; 4b—East Ham Jewish Cemetery; 5—Beckton Shafts (Pumping and Connection).
Figure 4.
Historic maps of Newham Hospital (red rectangles) and its surroundings. The maps are from Ordnance Survey historical map database: (a) 1870, (b) 1930, (c) 1960 and (d) 1990. Available from Edina Digimap online. © Crown Copyright and Landmark Information Group Limited 2019. All rights reserved.
Figure 5.
(a) High-resolution image (ArcGIS Online World Imagery, dated 07/03/2014) indicating the location and extents of the historical Prince Regent Landfill Site (red hatched) and the area surrounding the Newham landfill (green striped). (b–e) Ground displacement curves over the past 27 years: (b) 1992–2000 ERS; (c) 2002–2010 ENVISAT; (d) 2010–2015 Radarsat-2; and (e) 2015 to 2018 Sentinel-1. The red line represents the landfill area, and the green line the surrounding area.
Figure 6.
BGS boreholes (accessed from BGS GeoIndex online) in the area surrounding Newham Hospital. Logged records from boreholes within the black dashed circle evidence materials typical of scour hollows. Borehole colours represent depth below surface.
Figure 6.
BGS boreholes (accessed from BGS GeoIndex online) in the area surrounding Newham Hospital. Logged records from boreholes within the black dashed circle evidence materials typical of scour hollows. Borehole colours represent depth below surface.
Figure 7.
Time series comparison showing the relatively close fit between the TerraSAR-X (TSX) and Radarsat ground displacement datasets for the area of landfill (red) and its surroundings (green), as shown in
Figure 5. The solid line represents Radarsat-2 (RS2) and dashed line TSX.
Figure 7.
Time series comparison showing the relatively close fit between the TerraSAR-X (TSX) and Radarsat ground displacement datasets for the area of landfill (red) and its surroundings (green), as shown in
Figure 5. The solid line represents Radarsat-2 (RS2) and dashed line TSX.
Figure 8.
(a) Map showing the location of the profile A (West) to A’ (East) across the hospital and landfill site. (b) Profile showing variable subsidence, with the greatest displacement to the East of the hospital building and in the car park (indicated by the black square).
Figure 8.
(a) Map showing the location of the profile A (West) to A’ (East) across the hospital and landfill site. (b) Profile showing variable subsidence, with the greatest displacement to the East of the hospital building and in the car park (indicated by the black square).
Figure 9.
Modelled surface of rockhead elevation in East London, constructed using Move 3D, showing two noticeable depressions which represent scour hollows: a larger one in the south–west at the Blackwall Tunnel and a smaller one in the north–north–east at Newham Hospital. The dashed black circle is the area shown in
Figure 7.
Figure 10.
(a) Map of average ground displacement (mm/y) at Persistent Scatterer (PS) points (RS2) showing sites (1) and (2), straddling a change in ground displacement behaviour in the Custom House residential area. (b) Time series displacement averaged over the area of boxes at sites (1) and (2) in (a). At (2) (green), the ground has subsided by 9 mm more than at (1) (blue) over the 5.5 years.
Figure 11.
(a) Map of average ground displacement (mm/y), from RS2, at PS Points 1 to 5, along Newham Way (A13) between Junctions 9 and 10; and (b) time series displacement at Points 1 to 5.
Figure 11.
(a) Map of average ground displacement (mm/y), from RS2, at PS Points 1 to 5, along Newham Way (A13) between Junctions 9 and 10; and (b) time series displacement at Points 1 to 5.
Figure 12.
Map of the extent of cables laid under the A13 during 2013 to 2014. The location of PS points from
Figure 11 are also shown. Modified from Winch [
52].
Figure 12.
Map of the extent of cables laid under the A13 during 2013 to 2014. The location of PS points from
Figure 11 are also shown. Modified from Winch [
52].
Figure 13.
(a) Map of average ground displacement (velocity, mm/y) at PS points, with the locations of the East London Crematorium and Cemetery (1) and East Ham Jewish Cemetery (2) indicated; (b–e) Time series displacement, averaged over the area of boxes shown in the map in 13a, selected as representative of local terrace housing: (b) 1992–2000 ERS; (c) 2002–2010 ENVISAT; (d) 2010–2015 Radarsat; and (e) 2015 to 2018 Sentinel-1. The line colours in (b–e) correspond to the outlined areas of the same colour in the map (a).
Figure 14.
Greenfield settlement profile compared to building settlement during tunnelling works, where DR is the deflection ratio of hogging and sagging. Modified after Farrell et al. [
53].
Figure 14.
Greenfield settlement profile compared to building settlement during tunnelling works, where DR is the deflection ratio of hogging and sagging. Modified after Farrell et al. [
53].
Figure 15.
(a) High resolution image (ArcGIS Online World Imagery, 2013) of the tunnel works at Beckton, showing the locations of PS points (RS2) at the southernmost, Beckton Connection Shaft (1, green and 2, blue), and at the northernmost Beckton Pumping Station Shaft (3, gold); (b) Time series displacement at sites 1, 2 and 3. The green dashed line indicates the start of dewatering (09-09-2011) and the red dashed line the end (02-2011).
Table 1.
SAR datasets used in the study.
Table 1.
SAR datasets used in the study.
| Satellite | Start Date | End Date | No. of Images | Asc/Desc | Processing Method | Band | PS Density (per km2) |
|---|
| ERS | 19/06/1992 | 31/07/2000 | 27 | Asc | PSI, CGG | C | 1400 |
| ENVISAT | 13/12/2002 | 17/09/2010 | 45 | Desc | PSI, CGG | C | 1500 |
| Radarsat-2 | 02/02/2010 | 28/09/2015 | 58 | Asc | PSI, CGG | C | 2200 |
| TerraSAR-X | 01/05/2011 | 28/04/2017 | 150 | Desc | SqueeSARTM, TRE Altamira | X | 2400 |
| Sentinel-1 (A and B) | 06/05/2015 | 28/12/2018 | 163 | Asc | PSInSAR, ENVI SARScape | C | 7200 |
© 2020 by the authors. Licensee MDPI, Basel, Switzerland. This article is an open access article distributed under the terms and conditions of the Creative Commons Attribution (CC BY) license (http://creativecommons.org/licenses/by/4.0/).

 ,
, 


