Article

From Remote Sensing to Species Distribution Modelling: An Integrated Workflow to Monitor Spreading Species in Key Grassland Habitats

by
Walter De Simone
1,
Marina Allegrezza
2,
Anna Rita Frattaroli
1,
Silvia Montecchiari
2,
Giulio Tesei
2,
Vincenzo Zuccarello
3 and
Michele Di Musciano
1,*
1
Department of Life, Health and Environmental Sciences, University of L’Aquila, Piazzale Salvatore Tommasi, 67100 L’Aquila, Italy
2
Department of Agricultural, Food and Environmental Sciences (D3A), Polytechnic University of Marche, Via Brecce Bianche, 60131 Ancona, Italy
3
Department of Biological and Environmental Sciences and Technologies, University of Salento, Ecotekne Pal Center. B—S.P. 6, 73100 Lecce, Italy
*
Author to whom correspondence should be addressed.
Remote Sens. 2021, 13(10), 1904; https://0-doi-org.brum.beds.ac.uk/10.3390/rs13101904
Submission received: 20 April 2021 / Revised: 5 May 2021 / Accepted: 7 May 2021 / Published: 13 May 2021

Abstract

:
Remote sensing (RS) has been widely adopted as a tool to investigate several biotic and abiotic factors, directly and indirectly, related to biodiversity conservation. European grasslands are one of the most biodiverse habitats in Europe. Most of these habitats are subject to priority conservation measure, and several human-induced processes threaten them. The broad expansions of few dominant species are usually reported as drivers of biodiversity loss. In this context, using Sentinel-2 (S2) images, we investigate the distribution of one of the most spreading species in the Central Apennine: Brachypodium genuense. We performed a binary Random Forest (RF) classification of B. genuense using RS images and field-sampled presence/absence data. Then, we integrate the occurrences obtained from RS classification into species distribution models to identify the topographic drivers of B. genuense distribution in the study area. Lastly, the impact of B. genuense distribution in the Natura 2000 (N2k) habitats (Annex I of the European Habitat Directive) was assessed by overlay analysis. The RF classification process detected cover of B. genuense with an overall accuracy of 94.79%. The topographic species distribution model shows that the most relevant topographic variables that influence the distribution of B. genuense are slope, elevation, solar radiation, and topographic wet index (TWI) in order of importance. The overlay analysis shows that 74.04% of the B. genuense identified in the study area falls on the semi-natural dry grasslands. The study highlights the RS classification and the topographic species distribution model’s importance as an integrated workflow for mapping a broad-expansion species such as B. genuense. The coupled techniques presented in this work should apply to other plant communities with remotely recognizable characteristics for more effective management of N2k habitats.

1. Introduction

Grassland ecosystems are a key spot of biodiversity worldwide [1]. They are characterized by noticeable plants and animal diversity and have a crucial role in species conservation. For these reasons, most of these communities in Europe are considered priority habitats of community interest under the European Community Habitats Directive (92/43/EEC) [2]. However, changes in agro-pastoral practices and land-use evolution mean that grasslands are rapidly disappearing and are nowadays among Europe’s most threatened ecosystems [3]. The land-use change in these ecosystems is mainly due to the abandonment of traditional human activities that have favored the maintenance of the grasslands over previous centuries [4]. These changes (abandonment of the traditional practices) harmed several habitats, including semi-natural grasslands [5].
In this context, remote sensing (RS) is widely adopted as a tool to investigate several biotic and abiotic factors, directly and indirectly, related to biodiversity conservation [6,7]. In the past decade, satellite data showed great versatility in environmental studies such as fires disturbances [8], floods [9], droughts [10], the spread of invasive alien species [11,12], and several other human-induced pressures [13,14,15]. From this perspective, the RS has proved to be an efficient tool for studying vegetation patterns and dynamics both locally and globally [16,17]. RS multispectral data, such as Landsat and Sentinel-2 MSI (S2) images, have proven suitable to investigate vegetation dynamics, especially in grassland ecosystems [16,17,18,19,20]. Moreover, the higher spatial and temporal resolution of S2 compared to Landsat makes S2 a better tool for vegetation studies and species mapping [21,22].
Species distribution models (SDMs) are numerical tools that combine species occurrences or abundance with environmental estimates [23]. SDMs have been widely used in ecology and conservation biology to understand the abiotic drivers and predict species distribution over space and time [24]. Those modelling approaches’ performance depends on the abiotic conditions and sampled observations’ distribution, critical for effective model training and validation [24,25]. Species occurrences are often biased by sampling effort. Frequently, researchers sample easily accessible areas (i.e., near major roads or towns), leading to geographic clusters of localities [26,27]. To overcome this bias, sampled observations to calibrate and validate the models can be obtained from classification analysis with RS data. Indeed, the distribution obtained from RS data provides many unbiased occurrences that strongly increase the model reliability [28,29].
This study focused on Apennine grassland communities colonized by Brachypodium genuense (B. genuense) and/or B. rupestre [30,31]. B. genuense is a spreading competitor species in the earliest stages of the colonization of the grasslands that are diffused in the Apennine chain [32]. We focused on this species because its invasive behaviour causes a change in community structure, species composition, and biodiversity loss [33,34]. Therefore, controlling the spread of B. genuense is crucial for conserving biodiversity and maintaining the value of mountain pastures [35,36], especially for conservation purposes of Natura 2000 (N2k) network [37]. The study aims to provide a new workflow to monitor essential grassland habitats. Based on S2 images, the study aims to achieve the following targets: (i) Mapping the Brachypodium genuense (B. genuense) distribution using RS data; (ii) investigating the target species’ topographic drivers integrating the occurrences obtained from RS classification with species distribution models; (iii) identifying the N2k habitats most invaded by B. genuense.

2. Materials and Methods
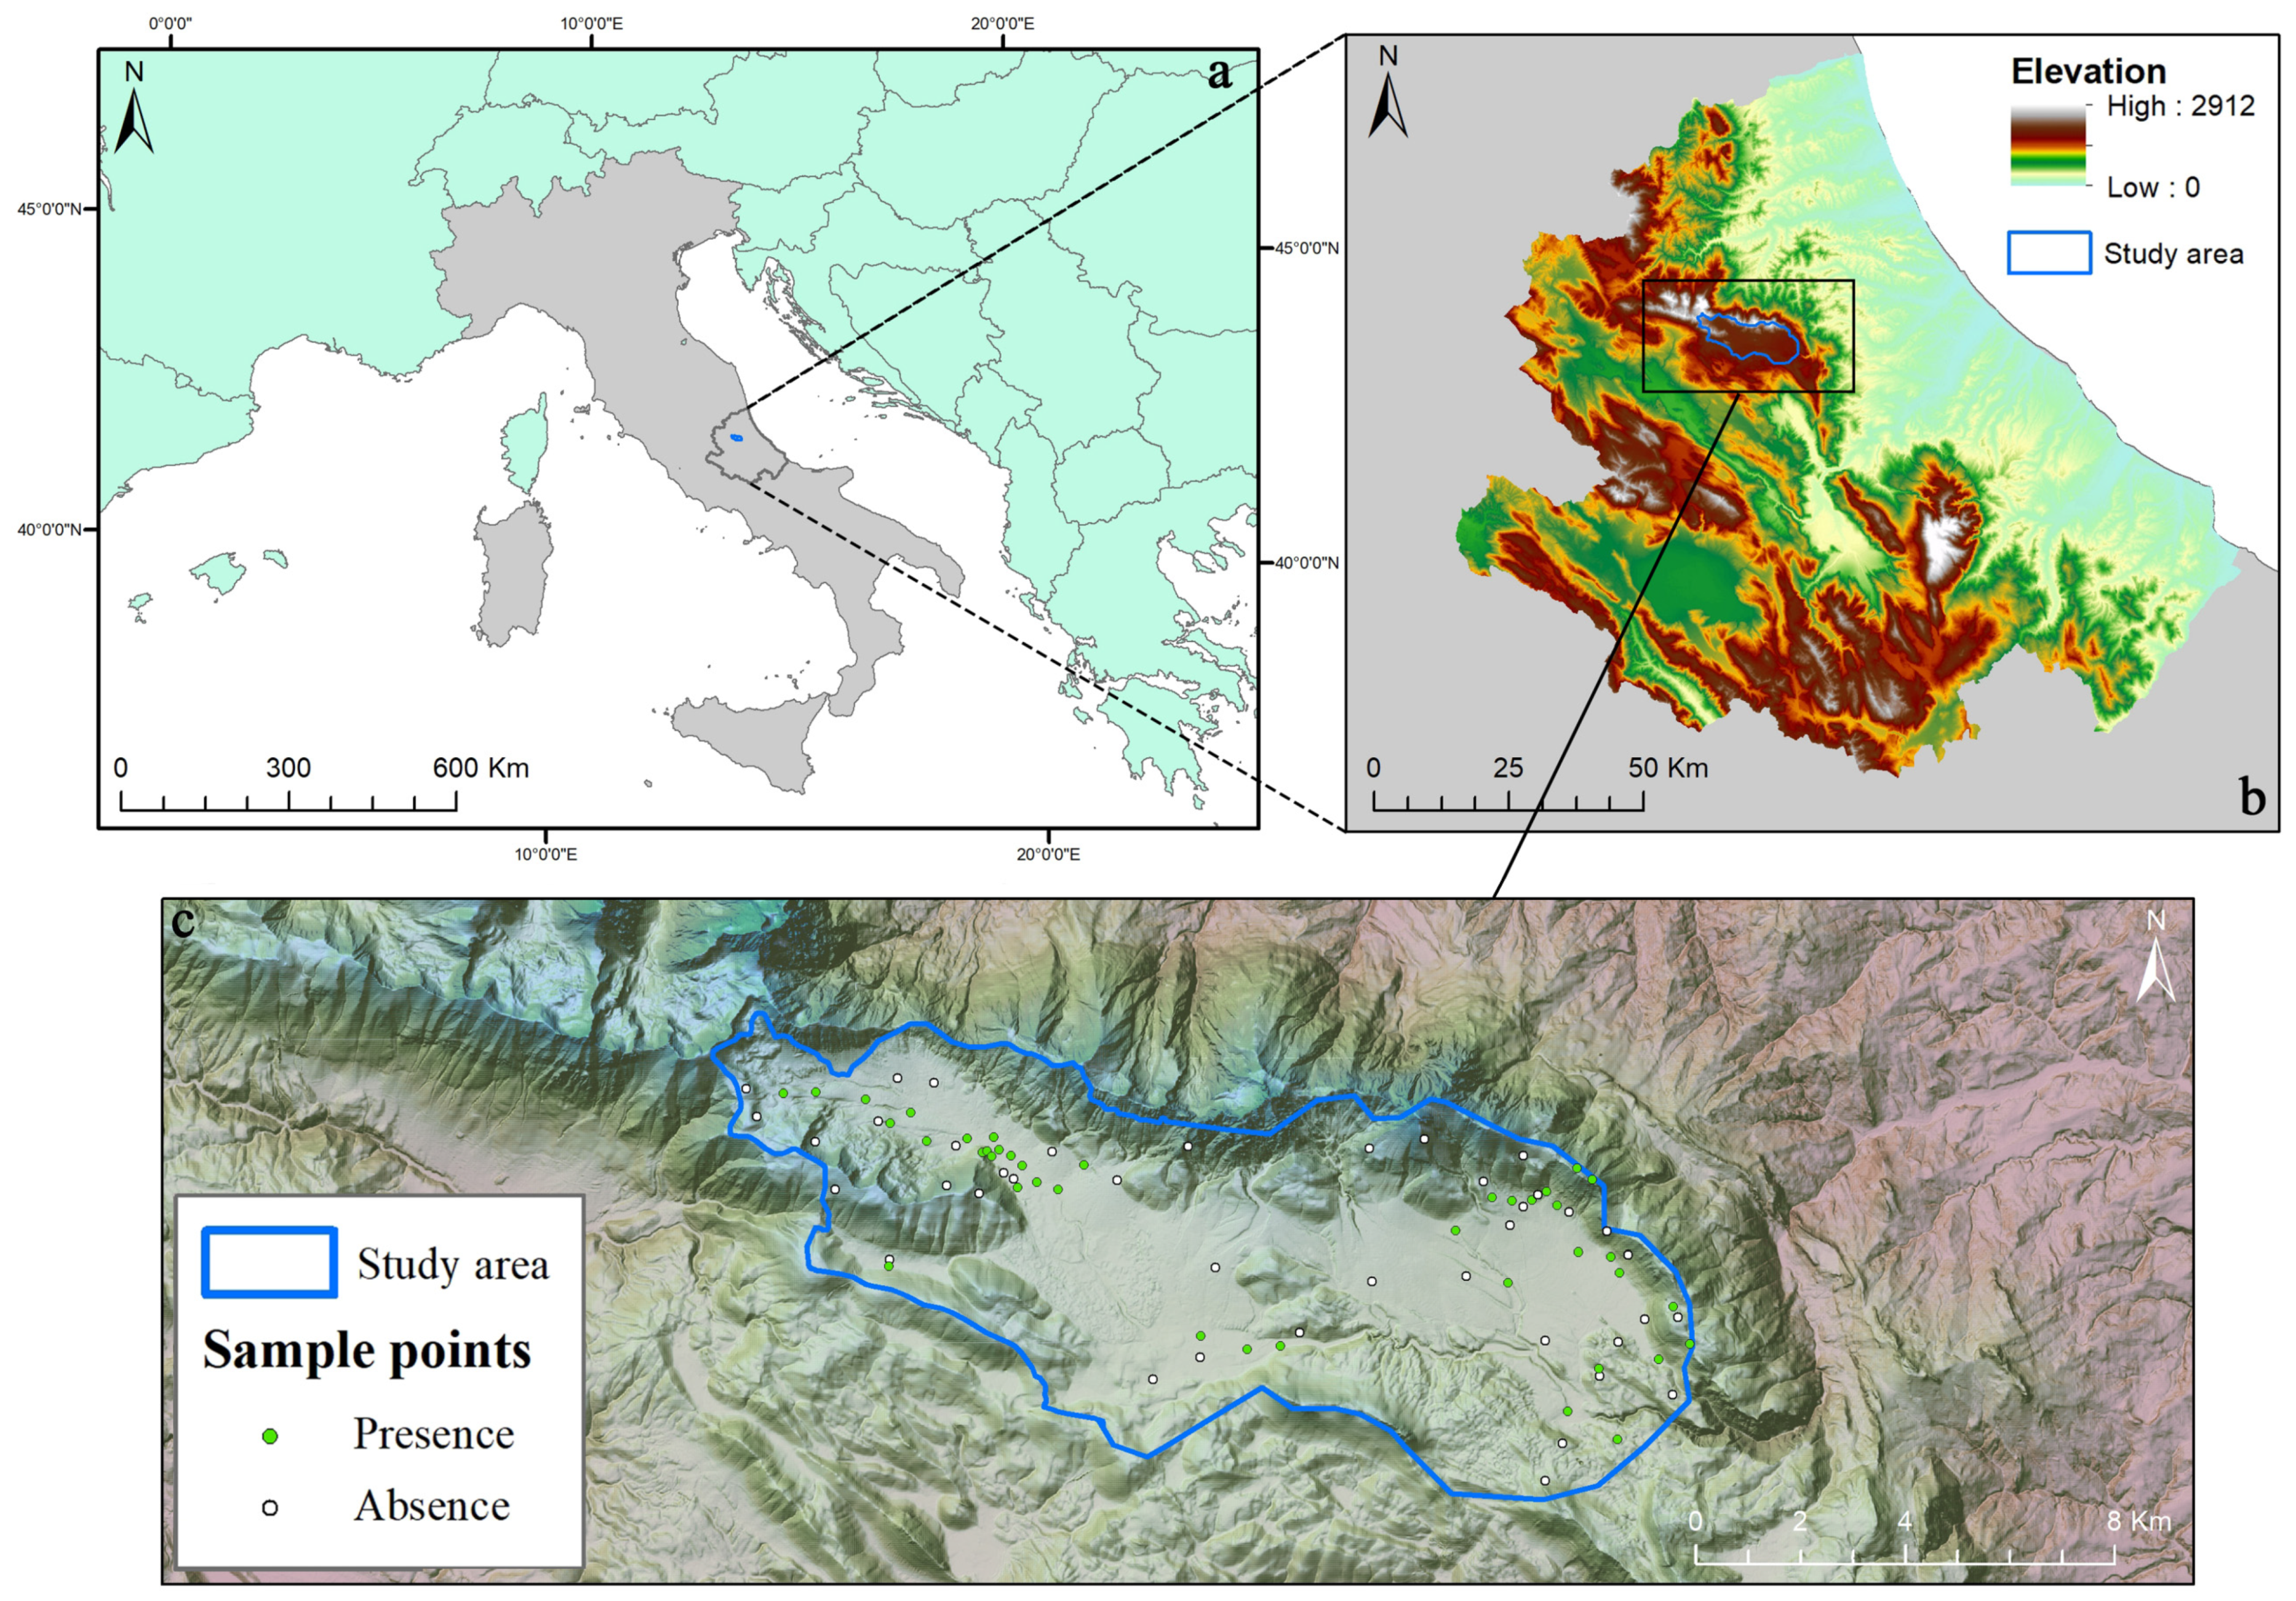
2.1. Study Area

The proposed workflow was tested on the Campo Imperatore upland plain (Abruzzo, Italy) (Figure 1) in the south-eastern sector of the Gran Sasso and Monti of Laga National Park. Campo Imperatore upland plain falling within the alpine biogeographical region [38], ranges from 1300 to 2500 m a.s.l. It is at the foot of the central limestone mountains of the Gran Sasso group, which has been strongly shaped by glaciations morphogenetic phenomena [39].
Pastoral activities strongly affect the structure and composition of grassland habitats over time. During the past century, the evolution of land use from sheep breeding into cattle and equine pasturage has favored the spreading of competitive and not palatable species. Moreover, the study area is crucial for biodiversity conservation, as one of the most extensive upland plains in Europe. Indeed, despite its limited size (~9400 ha), it is extremely rich in species composition [40,41]. For these reasons, the area falls within Special Protection Areas (SPAs) [42] and in Sites of Community Interest (SCIs) [43].

2.2. Remote Sensing Dataset and Pre-Processing

Brachypodium genuense (DC.) Roem. et Schult. is a graminoid perennial herbaceous species and is one of the most widespread dominant herbaceous species in Europe. In the central Apennines, this species follows distinct phenological phases [33] exploited in this study to identify it through satellite images.
The distribution of B. genuense was assessed using multispectral images of S2 satellites (Copernicus Program) at 10 m per pixel [44] accessed by ESA’s Open Access portal (https://scihub.copernicus.eu, accessed on 24 January 2021). The satellite images were chosen considering the phenological stages of the B. genuense species in the central Apennines [33]. Three phenological phases were considered: the beginning of vegetative growth (Green up—June 2019), the flowering and fruiting (Maturity—July 2019), the beginning of leaf yellowing and complete drying (Senescence—September 2019) [45].
“Level 1C” (TOA—top-of-atmosphere reflectance) was chosen by filtering images with low cloud coverage (0–20%). Then, cloud masking [46] and the atmospheric correction were performed [47,48]. The dataset for classification was built by selecting ten spectral bands (B2, B3, B4, B5, B6, B7, B8, B8A, B11, B12) [21], resampling and combining them into a single piled layer (raster stack). We also included a digital elevation model (provided by Abruzzo region: http://opendata.regione.abruzzo.it/content/modello-digitale-del-terreno-risoluzione-10x10-metri, accessed on 24 January 2021) at 10 m per pixel and its derivative products: slope and aspect. Finally, NDVI (Normalized Difference Vegetation Index) [49,50] and one of its derivative products, Texture (Focal analysis) [51,52], have been added to the raster stack. NDVI and Texture products were calculated for all images analyzed.

2.3. Data Collection

Presence/absence data for classification analysis were collected in the field integrating with some absences remotely gathered (e.g., Catonica, et al. [53], Congedo et al. [54], Copernicus [55], Google Earth [56]). A random stratified sampling based on elevational gradient and land-cover was used. The ground truth data were collected close to the exact date when the imagery used for the classification was acquired (2019-07). Moreover, the samplings were made in homogeneous areas to avoid mixed pixel signal [51]. A total of 80 sample points (presences/absences) (Figure 1) were collected within the study area. The presence sampled points were collected in 40 homogeneous patches of 100 m2, where B. genuense cover is higher than 90%. The same number (40) of absence points was also collected as follows: 30 absences were directly observed in the field (absence of the target species in the patches), while the rest were acquired from remotely sensed layers (see above) in sites where the target species cannot occur (e.g., forest canopies, bare soils, screes, urbanized).

2.4. Classification Analysis by Machine Learning

To capture the extents of B. genuense in the study area, we performed a binary classification using presence/absence data [57]. Three machine learning classifiers were tested: Random Forest (RF) [58], Support Vector Machine (SVM) [59], and Classification and Regression Trees (CART) [60]. The “superclass” function within the RStoolbox package [61] in R environment [62] was used to perform all the classification analyses. To assess the model accuracies, we first varied the number of input variables (with/without ancillary data). At the same time, we modulated the mtry parameter for RF, the C (Cost) parameter for SVM (svmRadialCost), and maxdepth for CART, based on the work of Li et al. [63].

2.5. Accuracy Assessment

We assessed overall classification performances by cross-validation and the Kappa through the “superclass” function of the RStoolbox package [61]. We used an iterative k-folds (k = 10) cross-validation approach; for each run, the dataset was split into 80% train and 20% test [61].
To estimate the area where the classification model can be reliably applied, we used the method proposed by Meyer and Pebesma [64], estimating the area of applicability (AOA). The dissimilarity index (DI), based on the minimum distance from the training data in the multidimensional predictive space, was calculated to derive the AOA. The predictors are weighted by their respective importance in the model [65]. The AOA is derived by applying a threshold based on the DI of the training data. The DI of the training data is calculated concerning the cross-validation strategy used for training the model. The CAST package [66] was used to estimate the AOA in the R environment. This function estimates the DI and the derived AOA of spatial prediction models by considering the distance of new data (i.e., a raster stack of spatial predictors used in the models) in the predictor variable space to the data used for model training.
The spatial association of the classified B. genuense patches were tested using the local indicators of spatial association (LISA) analysis. This analysis provides for each observation an indication of the extent of significant spatial clustering, and the sum of LISAs for all observations can be considered as a global indicator of spatial association [67].

2.6. Conversion of Plant Associations into NATURA 2000 Habitats

The plant associations in the study area were extrapolated from “La vegetazione di Campo Imperatore (Gran Sasso d’Italia)” [41]. The plant associations were transformed in N2k habitats according to the Interpretation Manual of European Union Habitats—EUR28 [2] and the Interpretation Manual of Italian Habitats [68]. The complex vegetation systems like those of the sinkholes that occur in a small area cannot be reported as one habitat type; thus, they were named “Mosaic”.

2.7. GIS Analysis of the Spread of B. genuense on Habitats NATURA 2000

To evaluate the spread of B. genuense on N2k habitats, we calculated the covered area of B. genuense obtained by classification analysis. All spatial processes and geographic analyses were managed through QGIS 3.10.11 [69]. The raster obtained from the classification process has been polygonized and intersected with another vector layer of the N2k habitats [41]. This post-modelling analysis was performed to investigate the spatial relationship between the B. genuense and the N2k habitats.
To assess how each habitat was affected by the spread of B. genuense, the patches’ cumulative contribution in each habitat and the differences between “realized” cover with “expected” cover were calculated. The realized cover is the real cover of the target species in each habitat. The expected cover is an equal repartition of B. genuense cover proportional to each habitat area; thus, the target species results equally distributed among the habitats. The “expected” cover in each habitat (Expected Cover(i)) was calculated by using the following formula:
Expected   Cover ( i ) = AreaH ( i ) TotAreaBra TotArea
AreaH(i) is the total area of each habitat, TotAreaBra is the total area covered by B. genuense, and TotArea is the entire study area.
We also investigate how the distribution of B. genuense is associated with the ecotones among habitats using the “moving windows” approach. The moving windows approach is widely used to detect the boundaries or ecotonal areas; indeed, a peak in standard deviation is associated with the transition zone [70,71,72]. Each pixel that shows a standard deviation higher than zero was identified as ecotones. The presence/absence data of B. genuense detected in these ecotonal areas were compared with each habitats’ core areas. To test if B. genuense is associated with habitats’ ecotones, three different buffer areas were used: 3 × 3, 5 × 5, and 7 × 7 [51].

2.8. Topographic SDMs

Species distribution models (SDMs) were used to investigate the topographic drivers of the investigated species. They are numerical tools that combine observations of species occurrence with environmental estimates [24].
The topographic variables considered were elevation, eastness, northness, slope, topographic wetness index (TWI), roughness, terrain ruggedness index (TRI), topographic position index (TPI), and solar radiation. All these variables were extrapolated from the digital elevation model (DEM) at 10 m per pixel, free available for the Abruzzo Region. Autocorrelation among variables was tested using Pearson correlation coefficient, excluding variables with Pearson R > 0.75 [73,74]. The occurrences data were extrapolated from the RS classification. Moran’s test was performed in R studio using the usdm package [75] to assess the spatial autocorrelation among occurrences. We reduce the high spatial autocorrelation among occurrences filtering out 95% of data based on topographic similarity. Occurrences were classified into 100 classes based on topography similarity. Within each class was sampled the 5% of points, obtaining a total of 884 presence points.
Three sets of 1000 pseudo absences were randomly sampled in all areas where the classification does not identify the B. genuense occurrences. For the species distribution model were used two different algorithms: Generalized Linear Models (GLMs; type = “quadratic”, interaction level = 2) and Generalized Boosting Model, also known as Boosted Regression Trees (BRT; number of trees = 10000, interaction depth = 3, cross-validation folds = 10). The choice of these techniques permitted us to explore responses from different classes of models, ranging from more classical statistical techniques (GLMs) to machine learning-oriented approaches (BRT) [25,76]. GLMs are based on parametric linear functions [73,77]. BRT combines the regression-tree and boosting algorithms to optimize predictive performance from an ensemble of trees sequentially fitted focusing on residuals from the previous iterations [78]; this technique generally results in high discrimination performance fit of accurate function [23]. The SDMs for the investigated species was performed using BIOMOD2 [79] and ECOSPAT [80].
All the methods used in this work are summarized in the following flowchart (Figure 2).

3. Results

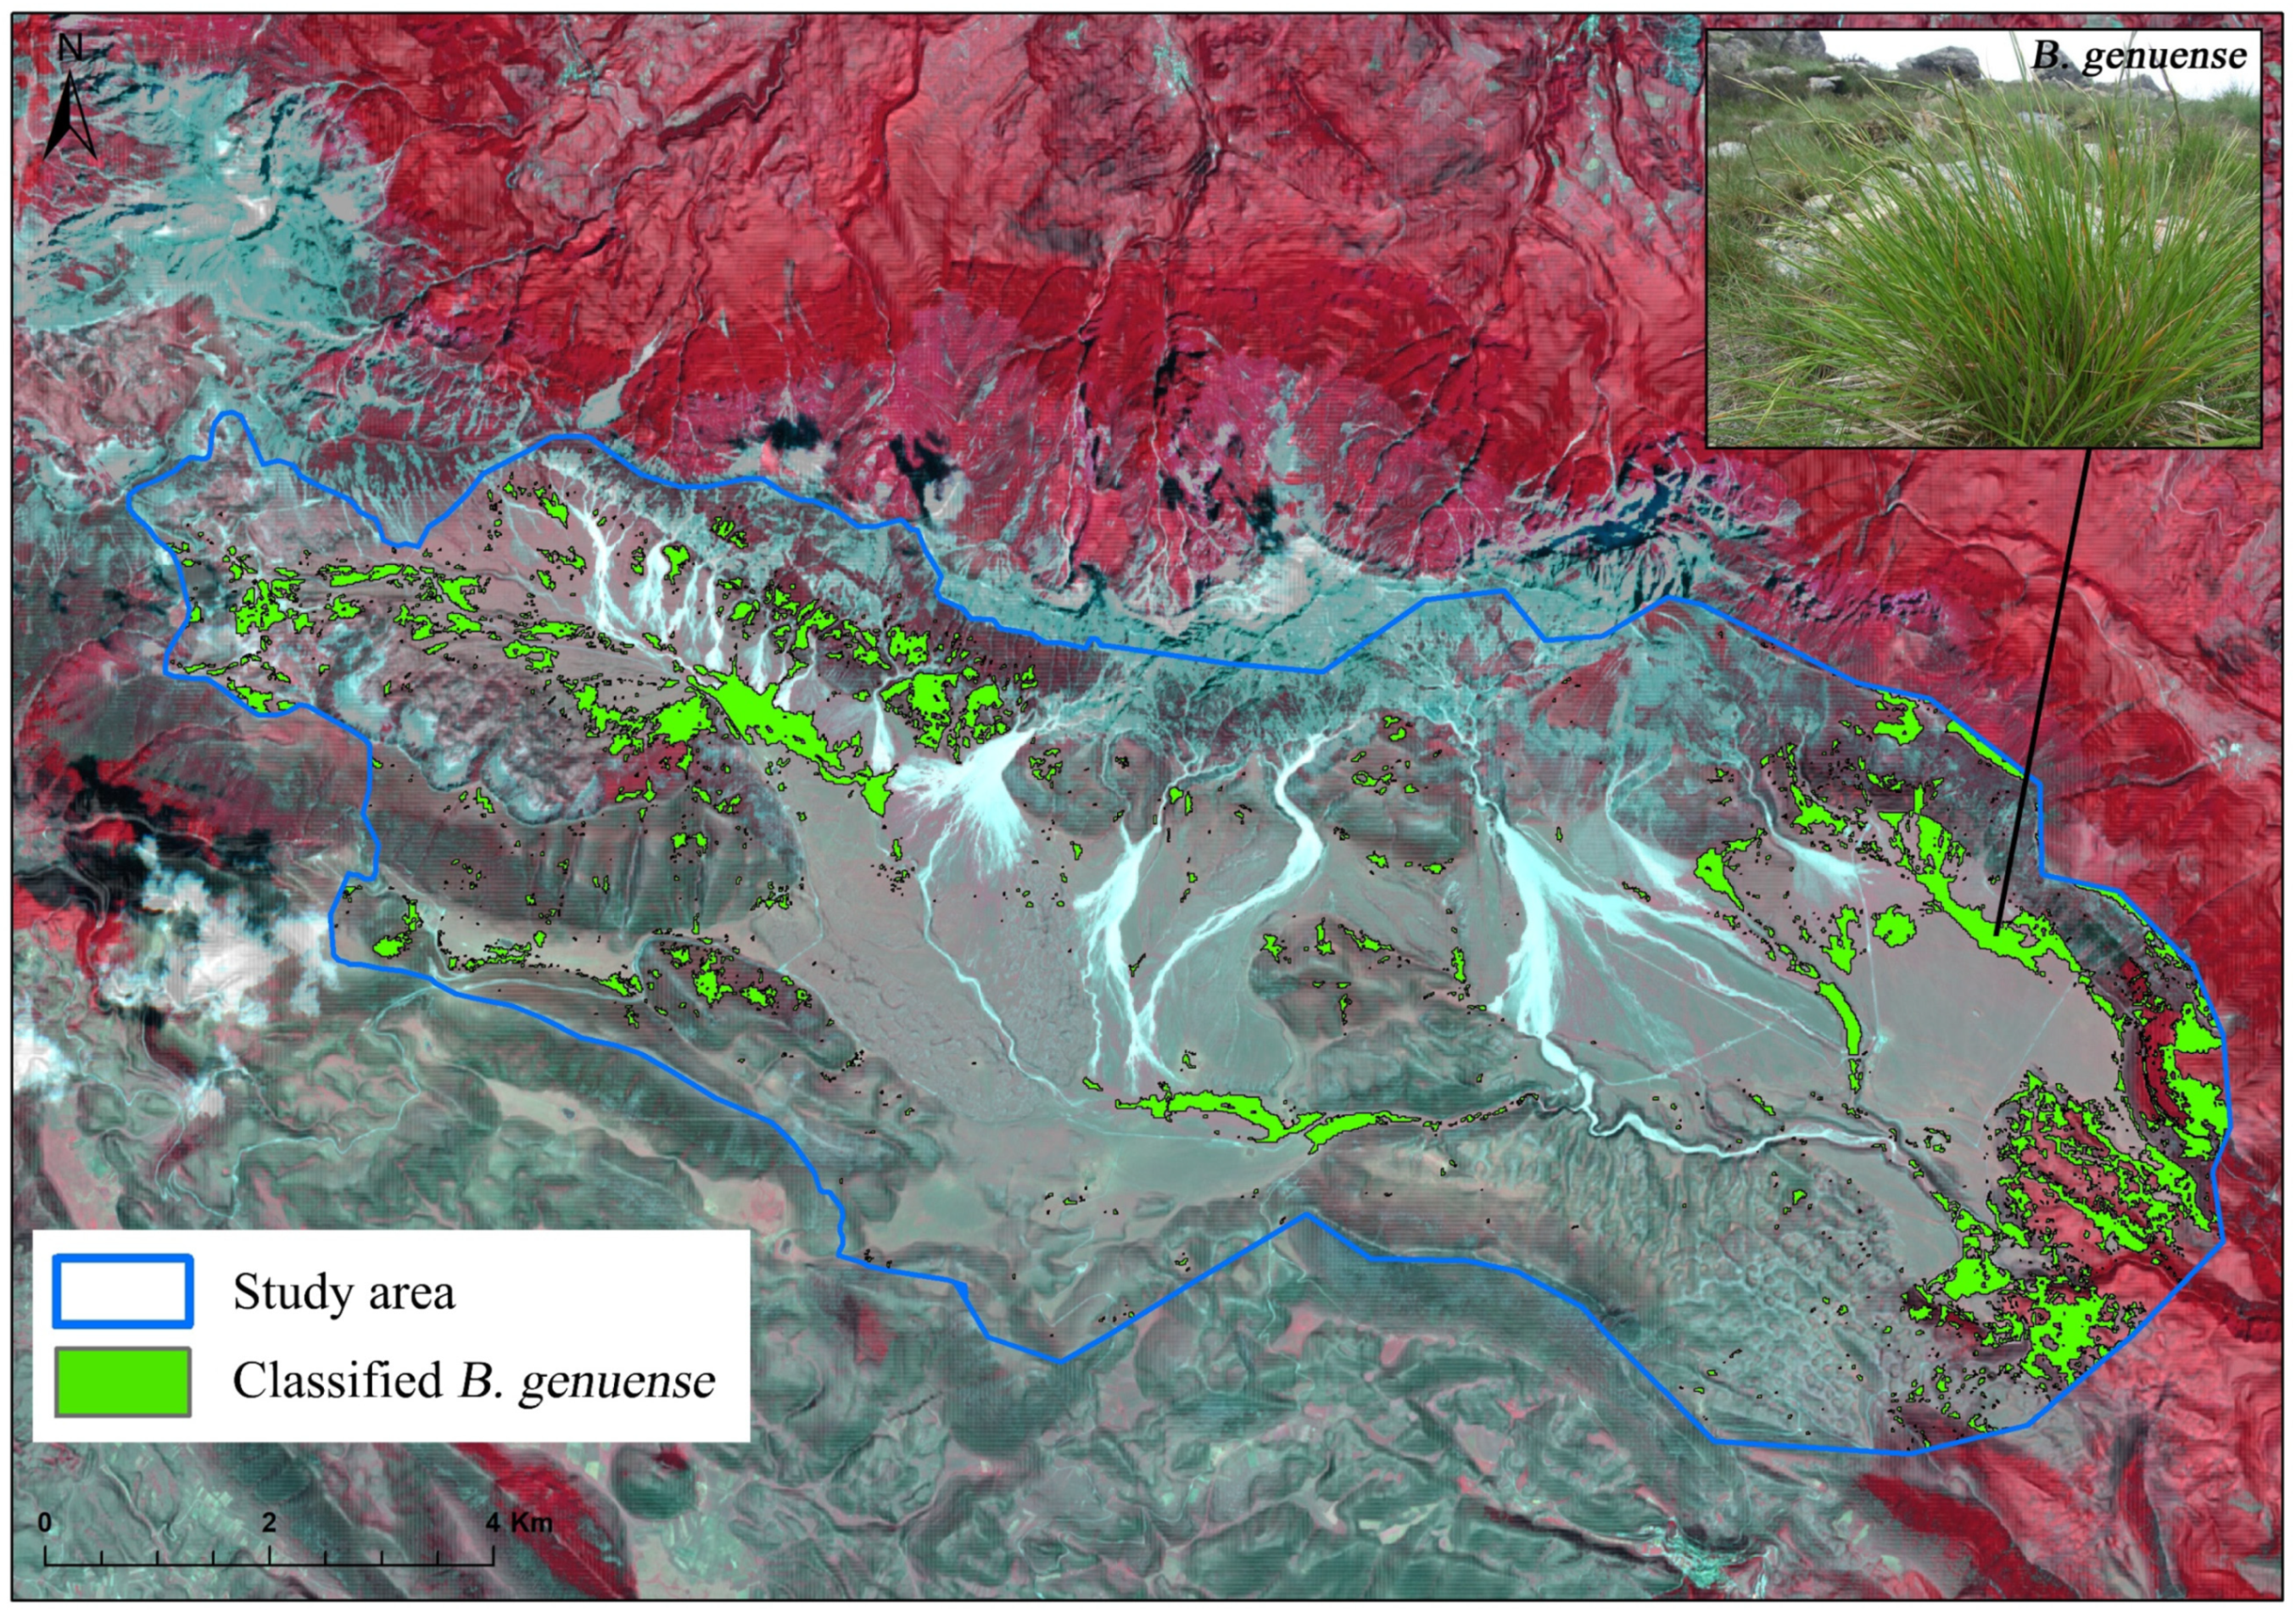
3.1. Classification Output and Accuracy Assessment

All the classification models used showed improved performances by adding ancillary data to the individual spectral bands deriving from S2 (Supplementary Materials, Table S1). RF showed the best performance for mapping the target species compared to SVM and CART (Supplementary Materials, Table S1); therefore, the RF model was chosen for the subsequent analyses.
The coverage map of B. genuense (Figure 3), obtained through the RF classifier, showed a large spread of this species within the study site. The classification algorithm (RF) detected 776.98 ha of B. genuense area out of the 9402.84 ha total study area (8.26% of the total area).
Before performing the classification process, we estimated the spatial areas for which the classification model should provide reliable predictions through the AOA calculation. Forecasts outside the AOA (Supplementary Materials, Figure S2) were strongly limited in the study area’s north-western sector. In the presence-absence context, the best result obtained (RF) on the Campo Imperatore upland plain provided a value of overall accuracy of 94.79% with a Kappa of 88.0% (Table 1). More details about the classification results were reported in Supplementary Materials (Table S3). In general, the RF classifier showed relatively consistent overall performance at the study site.
The spatial association analysis (LISA) on patches of B. genuense shows that most patches have a high clustering value. The general model in the study area is “clustered”. Only in the central and western parts of the study area, some patches are more dispersed (see Supplementary Materials, Figure S4).

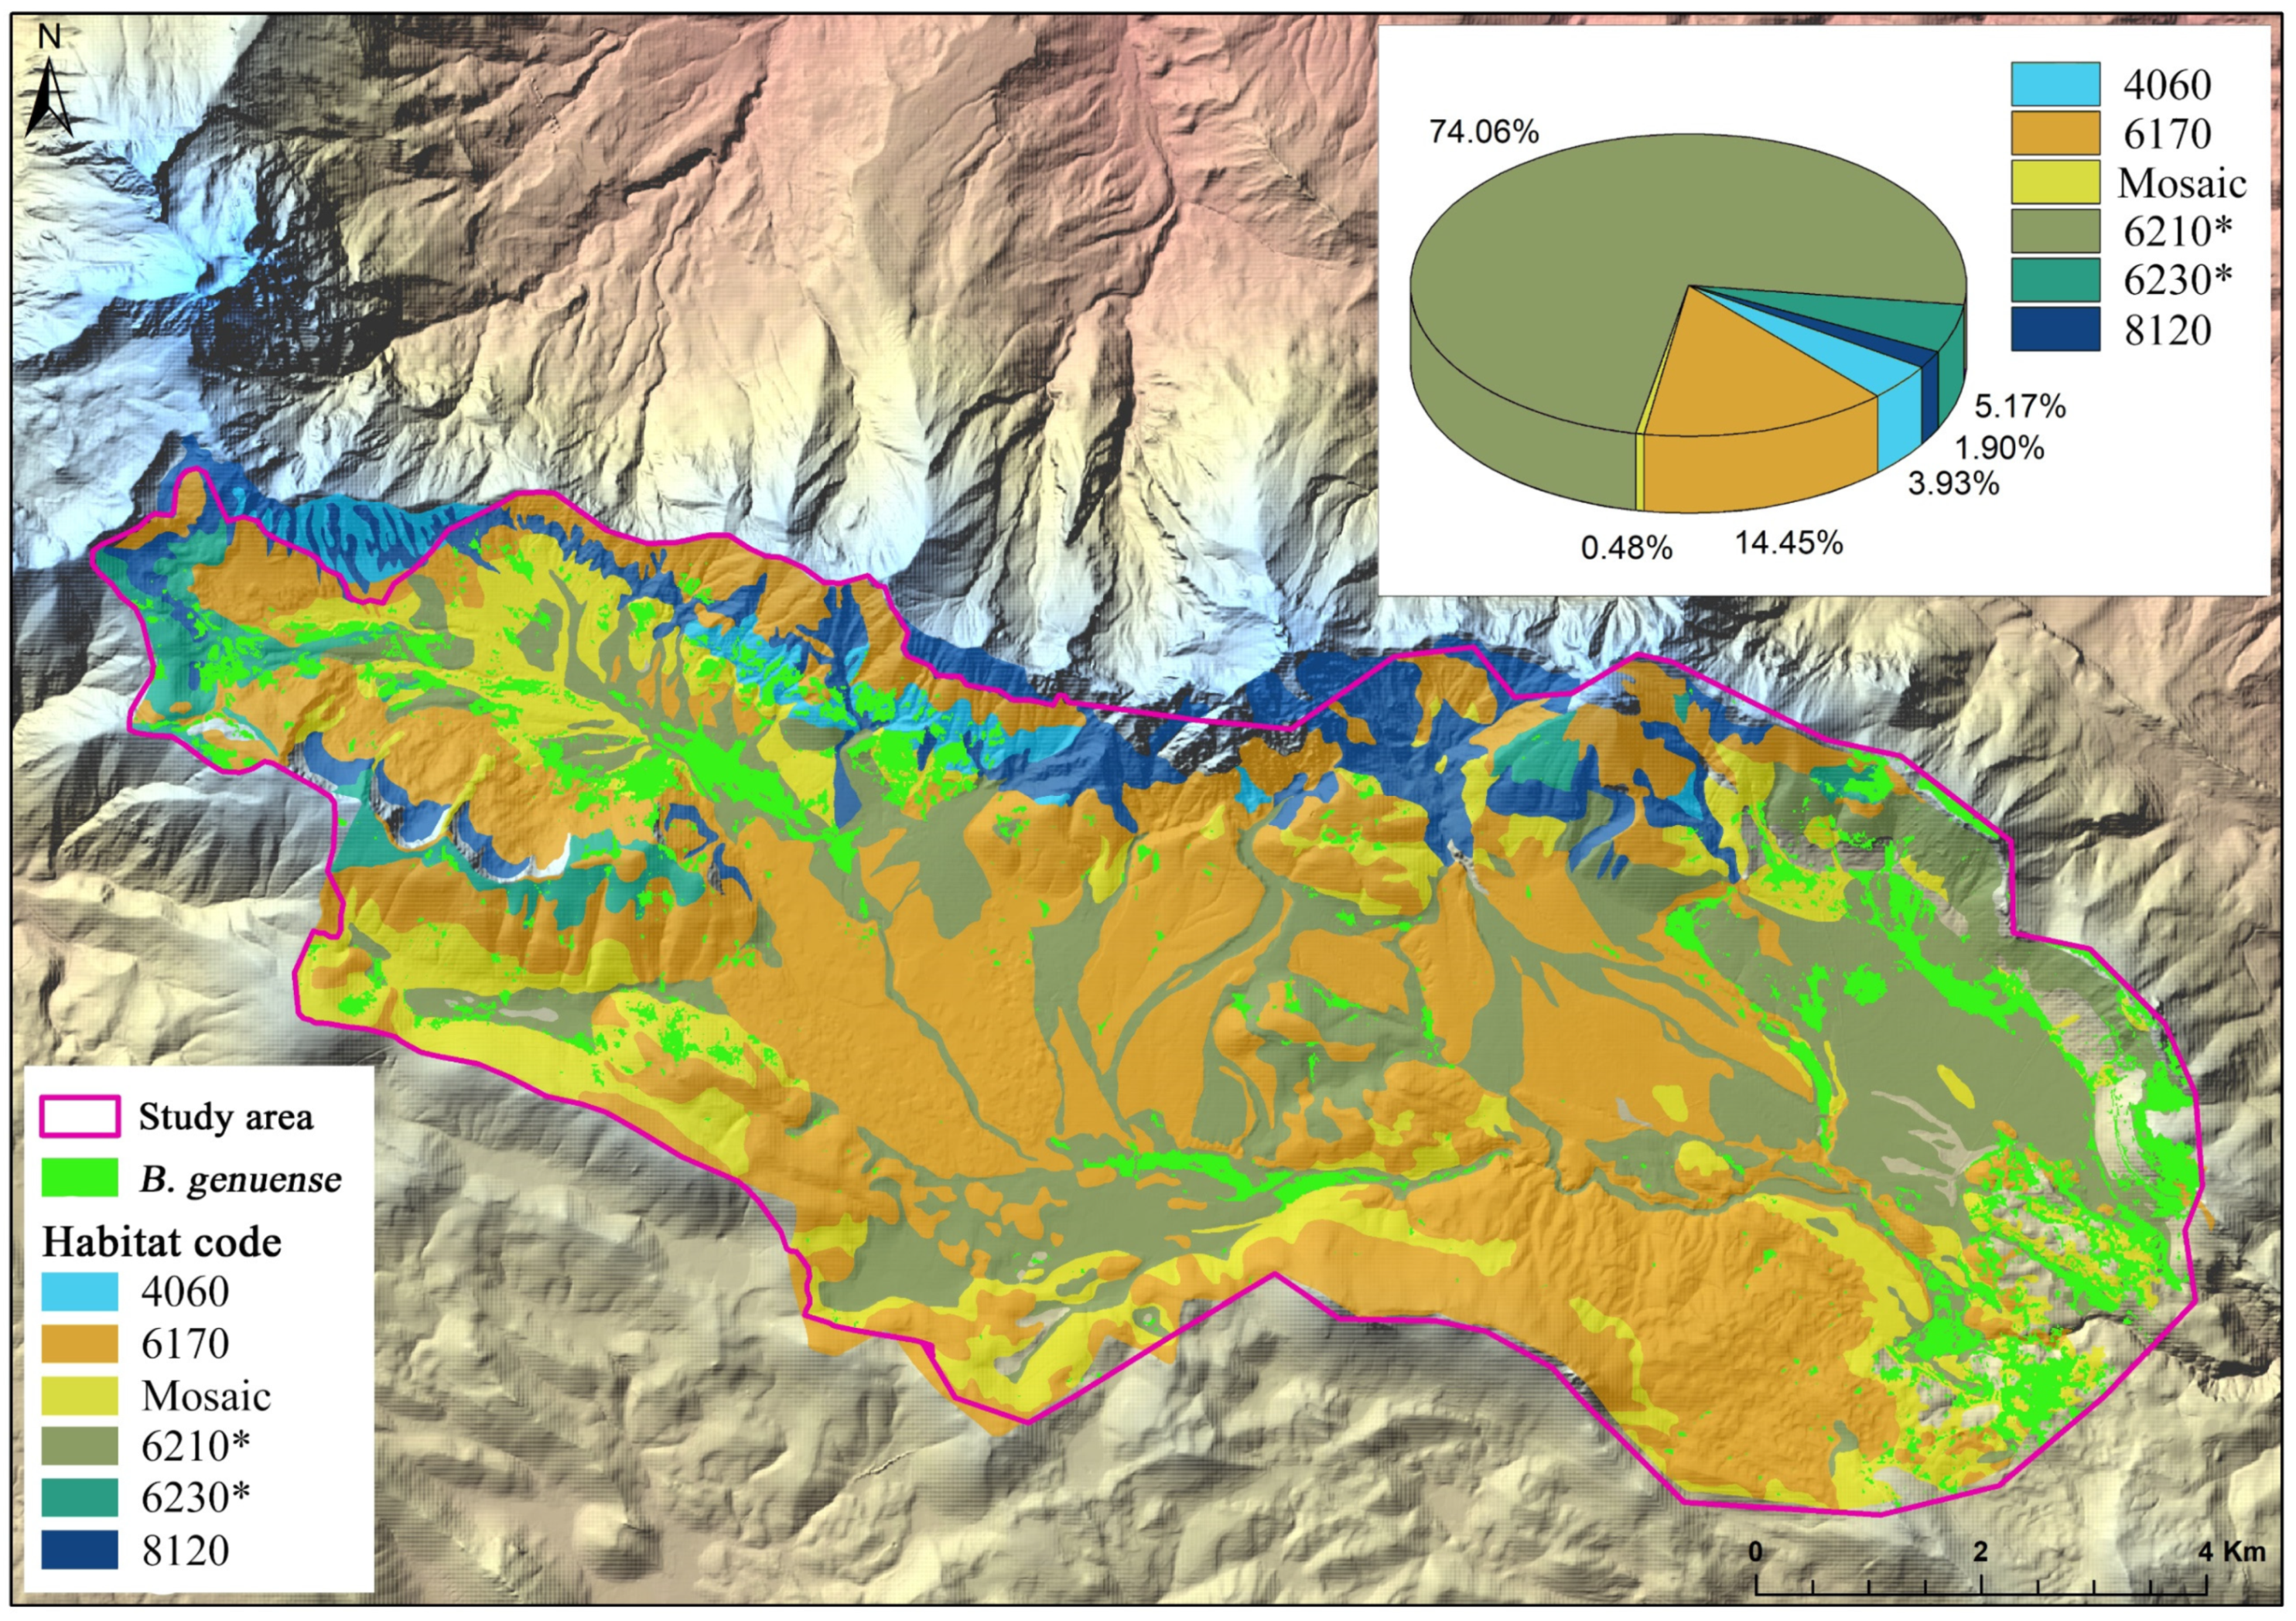
3.2. Conversion of Plant Associations into Natura 2000 Habitats

As observed by Figure 4, the dominant vegetation cover in the study area is represented by high altitude grasslands and meadows (N2k habitats 6170, 6210*, 6230*).
Based on habitat N2k (Supplementary Materials, Table S5), the plant associations, overlapped with B. genuense cover map, were divided into five habitats. The 6170, 6210* and 6230* are grassland habitats, the 8210 are screes habitats, and the 4060 represent shrubby habitats.

3.3. Overlay Analysis Output

Following the overlay analysis (Figure 4), B. genuense classified in the study area (8.26% of the total area) was found in five different types of habitats (Table 2). The differences between the “realized” and “expected” cover of B. genuense in each habitat show as the most invaded habitat is the 6210* (Semi-natural dry grasslands and scrubland facies on calcareous substrates—Festuco-Brometalia—* important orchid sites) with 255 ha more than expected. Moreover, 74.04% of the total B. genuense distribution was detected within this habitat. On the other hand, the less affected is the Alpine and subalpine calcareous grasslands (6170), with 3.45% B. genuense cover. The other habitats (6230*, Mosaic and 8120) have slight differences between “expected” and “realized” cover. These habitats have shown a cumulative contribution of 5.17% in 6230* (Species-rich Nardus grasslands, on siliceous substrates in mountain areas and submountain areas, in Continental Europe), 1.90% in “Mosaic” (habitats 6170/6210*/6230*), and 0.48% in 8120 (Calcareous rocky slopes with chasmophytic vegetation).
The results obtained using the moving windows techniques identify the ecotonal area among habitats. Compared to the B. genuense cover between the core and the ecotonal areas, a slight difference was observed (≈1.6%). All three different moving windows size (3 × 3, 5 × 5, 7 × 7) give similar results, and in the core area, the percentage of B. genuense ranges from 7.1% to 7.4%, while in the ecotonal areas ranges from 8.7% to 8.9%.

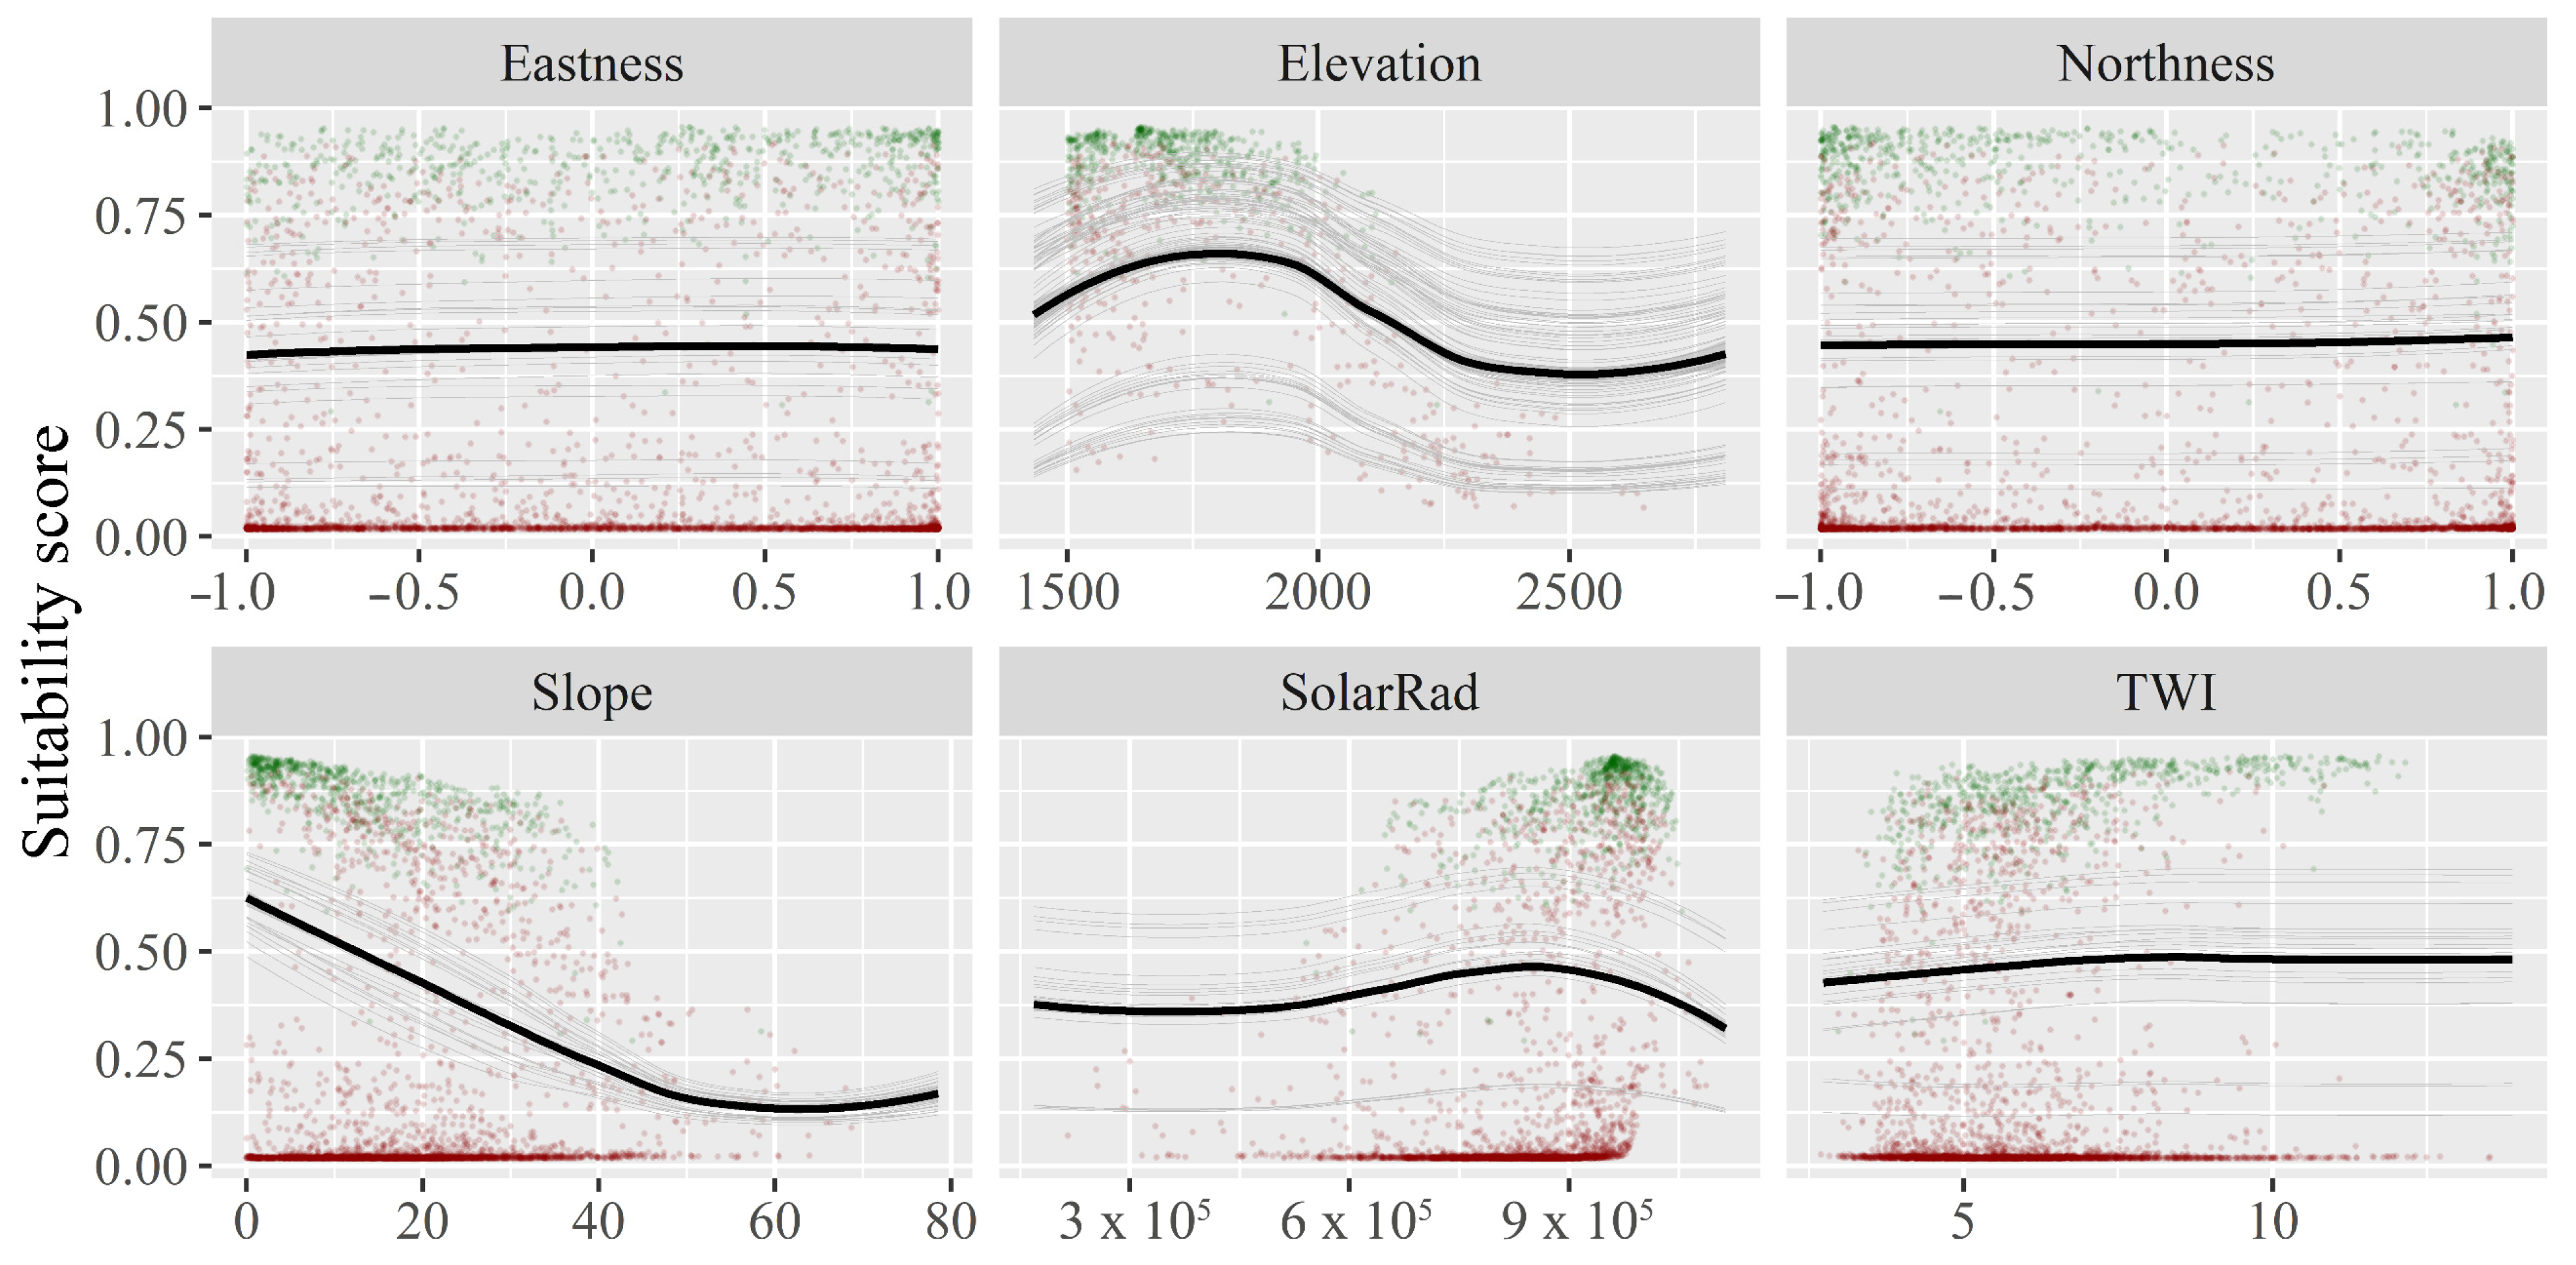
3.4. Topographic Model Output

The ensemble model to investigate the topographic driver of B. genuense distribution shows high accuracy with sensitivity higher than 95 and ~85 of specificity (Table 3). Six topographic variables with a Pearson correlation coefficient <0.75 were selected [73,74]: elevation, eastness, northness, slope, topographic wetness index (TWI), and solar radiation (Figure 5). The main topographic drivers are elevation, slope, solar radiation, and TWI in order of importance. Indeed, B. genuense shows a strong preference for a slight slope area with an elevation between 1500 and 2000 m a.s.l. Moreover, the target species prefers humid areas, as highlighted by TWI, which is the most commonly topographic index used to describe a cell’s tendency to accumulate water [81]. Moreover, this species shows a slight preference for areas with high solar radiation.
On the other hands, the distribution seems not affected by aspect; indeed, both eastness and northness show flat response curves.

4. Discussion

The tested workflow allowed to map the B. genuense and to identify the main topographic drivers that affect its distribution in the study area. Moreover, the obtained distribution has been used to assess the potential spread of the target species on N2k habitats.
The classification result allowed us to distinguish the species with overall accuracy values >90%. We agree with other studies on widely spread grasslands and invasive species where the accuracy values ranged from 70 to 90% [82,83,84,85]. RF proved to be the best classification methods among those tested, confirming its ability to map vegetation using various data types [86,87]. Moreover, RF demonstrates its lower sensitivity than other machine learning classifiers to sample quality training and overfitting [88]. Our results suggest that a binary classifier approach (presence/absence) well performs with small training samples, according to recent literature [63,89,90].
In the study area, some plants species, such as Bromopsis erecta and Festuca circummediterranea (with phenology and/or environmental needs similar to the target species), could alter the measure of the spectral signature of Brachypodium genuense, contributing to the spectral mixing [91] and overall classification error. Despite this, the high accuracy values of the RF classification may be due to the decrease in abundance of early and mid-flowering species, as the invasion of B. genuense decreases the heterogeneity of the vegetation from the phenological point of view [92]. Another factor that could explain the classifiers’ high performance may be due to the physiological peculiarities (silica-rich and hairy leaves) [93] of the target species. These characteristics allow the overabundance of B. genuense compared to other species as it is not palatable by domestic herbivores (sheep and cattle) in poor stock conditions [94].
It is well-known that the images’ spatial resolution must be carefully chosen concerning the spatial scale of the analyzed object [95]. Notwithstanding, the S2 data with a 10 m per pixel spatial resolution could map the target species. Through a careful ground-based survey campaign simultaneously as the acquisition of images by satellite sensors, we have shown how maps deriving from S2 can be a powerful source of information, as confirmed by Feilhauer et al. [96]. Thus, using the S2 images, the presented workflow can be applied worldwide to map species and communities with distinctive characteristics remotely detectable, as demonstrated by [97,98].
The topographic model suggests that a high-resolution digital elevation model strongly improves plant species distribution knowledge [99]. The results obtained are consistent with the ecology of B. genuense; in fact, a preference for humid areas (high value of TWI) with a high solar radiation value suggests this species’ competitiveness [32,100]. Topography can be considered a determinant factor of the distribution patterns in dry grasslands and controls soil moisture and pH. Thus, TWI is an excellent candidate to be a priority driver of local plant diversity patterns in grasslands [101]. These findings suggest the key role of hydrology in species distribution [102,103].
Moreover, the effect of topography on pH distribution could explain the strong effect of TWI in shaping B. genuense. Indeed, this species shows a small pH interval ranged from 6.17 to 7.2 [100]. However, the direct effect of solar radiation on local temperatures [104,105] may also affect the local vegetation patterns. Finally, the elevation and slope variables suggest that this species is limited by high elevation and high slope due to the combination of environmental constraints: decrease of soil depth, low temperature, and winter stress [33].
The overlay analysis on N2k habitats identify the most occupied habitat by B. genuense, and this result can be important to address management policy and conservation strategies for nature conservation. Concerning the relationship between species and N2k habitats, the most affected habitat for B. genuense spread is the semi-natural dry grasslands on calcareous substrates (habitat 6210*), which is also the most threatened habitat in Europe [5,106]. The strong diffusion of B. genuense on habitat 6210* is probably due to the variation in the livestock types (from sheep to cows/horses) and/or the reduction of extensive grazing in the study area. The increase of Brachypodium (B. pinnatum, B. genuense, B. rupestre) distribution cause a reduction in grasslands biodiversity [31,33,92,107,108]. As shown in a recent study [109], when B. genuense and/or B. rupestre becomes dominant (cover > 80%), a substantial reduction in biodiversity was observed. Moreover, as said above, many plant communities in the study area constitute habitats of interest for biodiversity conservation and hosting several plants of high naturalistic value that could be threatened by B. genuense spread.
Other habitats, such as 4060 and 6230*, have shown high B. genuense percentage probably associated with specific topographic characteristics and the limited area occupied in the study area. Indeed, the differences between “realized” and the “expected” cover are less than 20 ha. The 8120 and 6170 habitats have shown a low percentage of B. genuense cover; these results could be explained by the altitudinal distribution of these habitats that go up to 2000 m a.s.l., where the investigated species decrease its suitability.

5. Conclusions

The proposed workflow can be considered a practical approach to assess the distribution and spread of dominant plant species in grasslands habitats, especially in conservation perspectives. Binary classification coupled with SDMs is an affordable and reliable method for characterizing both distribution and topographic drivers of plant species such as B. genuense. Indeed, the occurrences data obtained from RS classification have proven to be crucial to reduce the sampling bias, and thus, to improve the SDMs calibration. The main results of SDMs have shown as elevation, slope, and TWI are the main distribution drivers of B. genuense.
The overlay analysis between B. genuense coverage and N2k habitats shows that the target species spread across all habitats with a strong preference for 6210*. The monitoring of potentially invasive species is fundamental for managing the N2k habitats, especially in the protected areas where biodiversity conservation is one of the priority goals. In this sense, further studies using high-resolution RS data and multitemporal diachronic analysis could strongly improve the knowledge on the spread of B. genuense. Moreover, the workflow presented in this study may be extended to larger areas and other plant communities for more effective habitats management.

Supplementary Materials

The following are available online at https://0-www-mdpi-com.brum.beds.ac.uk/article/10.3390/rs13101904/s1, Table S1: Performance of all tested algorithms by modulating hyperparameters. Figure S2: Results of the area of applicability (AOA) analysis. Table S3: Accuracy statistics. Figure S4: Maps derived from Local Indicators of Spatial Association (LISA) analysis of the classified B. genuense patches. Table S5: Plant associations recognized in the study area.

Author Contributions

Conceptualization, W.D.S. and M.D.M.; formal analysis, W.D.S. and M.D.M.; all the authors contributed to field investigation; all authors, writing original draft preparation. All authors have read and agreed to the published version of the manuscript.

Funding

This research received no external funding.

Data Availability Statement

All the RS data are freely available. Presence/absence points used to calibrate the RF classification are available from the corresponding author on reasonable request.

Acknowledgments

This study was supported by the Department of Life Health and Environmental Sciences of the University of L’Aquila (Abruzzo—Italy), the Department of Agricultural, Food and Environmental Sciences of Polytechnic University of Marche (Marche—Italy) and the Department of Biological and Environmental Sciences and Technologies of the University of Salento (Puglia—Italy). The authors thank the European Space Agency for making data (and software) publicly available.

Conflicts of Interest

The authors declare no conflict of interest.

References

  1. Habel, J.C.; Dengler, J.; Janišová, M.; Török, P.; Wellstein, C.; Wiezik, M. European grassland ecosystems: Threatened hotspots of biodiversity. Biodivers. Conserv. 2013, 22, 2131–2138. [Google Scholar] [CrossRef] [Green Version]
  2. European Commission. Interpretation Manual of European Union Habitats; EC DG Environment: Brussels, Belgium, 2013. [Google Scholar]
  3. Millennium Ecosystem Assessment. Ecosystems and Human Well-Being; Island Press: Washington, DC, USA, 2005; Volume 5. [Google Scholar]
  4. Köhler, B.; Gigon, A.; Edwards, P.J.; Krüsi, B.; Langenauer, R.; Lüscher, A.; Ryser, P. Changes in the Species Composition and Conservation Value of Limestone Grasslands in Northern Switzerland after 22 Years of Contrasting Managements. Perspect. Plant Ecol. Evol. Syst. 2005, 7, 51–67. [Google Scholar] [CrossRef]
  5. Rusina, S.; Kuzemko, A. EDGG Cooperation on Syntaxonomy and Biodiversity of Festuco-Brometea Communities in Transylvania (Romania): Report and Pre-Liminary Results. Bull. Eur. Dry Grassl. Group 2009, 4, 13–19. [Google Scholar]
  6. Nagendra, H.; Lucas, R.; Honrado, J.P.; Jongman, R.H.; Tarantino, C.; Adamo, M.; Mairota, P. Remote Sensing for Conservation Monitoring: Assessing Protected Areas, Habitat Extent, Habitat Condition, Species Diversity, and Threats. Ecol. Indic. 2013, 33, 45–59. [Google Scholar] [CrossRef]
  7. Wang, R.; Gamon, J.A. Remote Sensing of Terrestrial Plant Biodiversity. Remote Sens. Environ. 2019, 231, 111218. [Google Scholar] [CrossRef]
  8. De Simone, W.; Di Musciano, M.; Di Cecco, V.; Ferella, G.; Frattaroli, A.R. The Potentiality of Sentinel-2 to Assess the Effect of Fire Events on Mediterranean Mountain Vegetation. Plant Sociol. 2020, 57, 11–22. [Google Scholar] [CrossRef]
  9. Shahabi, H.; Shirzadi, A.; Ghaderi, K.; Omidvar, E.; Al-Ansari, N.; Clague, J.J.; Geertsema, M.; Khosravi, K.; Amini, A.; Bahrami, S. Flood Detection and Susceptibility Mapping Using Sentinel-1 Remote Sensing Data and a Machine Learning Approach: Hybrid Intelligence of Bagging Ensemble Based on K-Nearest Neighbor Classifier. Remote Sens. 2020, 12, 266. [Google Scholar] [CrossRef] [Green Version]
  10. Liu, Q.; Zhang, S.; Zhang, H.; Bai, Y.; Zhang, J. Monitoring Drought Using Composite Drought Indices Based on Remote Sensing. Sci. Total Environ. 2020, 711, 134585. [Google Scholar] [CrossRef]
  11. Iannella, M.; De Simone, W.; D’Alessandro, P.; Console, G.; Biondi, M. Investigating the Current and Future Co-Occurrence of Ambrosia Artemisiifolia and Ophraella Communa in Europe through Ecological Modelling and Remote Sensing Data Analysis. Int. J. Environ. Res. Public. Health 2019, 16, 3416. [Google Scholar] [CrossRef] [Green Version]
  12. Iannella, M.; D’Alessandro, P.; Longo, S.; Biondi, M. New Records and Potential Distribution by Ecological Niche Modelling of the Adventive Leaf Beetle Monoxia Obesula Blake in the Mediterranean Area (Coleoptera, Chrysomelidae, Galerucinae). Bull. Insectology 2019, 72, 135–142. [Google Scholar]
  13. Geldmann, J.; Joppa, L.N.; Burgess, N.D. Mapping Change in Human Pressure Globally on Land and within Protected Areas. Conserv. Biol. 2014, 28, 1604–1616. [Google Scholar] [CrossRef]
  14. Iannella, M.; Liberatore, L.; Biondi, M. The Effects of a Sudden Urbanization on Micromammal Communities: A Case Study of Post-Earthquake L’Aquila (Abruzzi Region, Italy). Ital. J. Zool. 2016, 83, 255–262. [Google Scholar] [CrossRef] [Green Version]
  15. De Simone, W.; Iannella, M.; D’Alessandro, P.; Biondi, M. Assessing Influence in Biofuel Production and Ecosystem Services When Environmental Changes Affect Plant–Pest Relationships. GCB Bioenergy 2020, 12, 864–877. [Google Scholar] [CrossRef]
  16. Knick, S.T.; Rotenberry, J.T.; Zarriello, T.J. Supervised Classification of Landsat Thematic Mapper Imagery in a Semi-Arid Rangeland by Nonparametric Discriminant Analysis. Photogramm. Eng. Remote Sens. 1997, 63, 79–86. [Google Scholar]
  17. Zha, Y.; Gao, J.; Ni, S.; Liu, Y.; Jiang, J.; Wei, Y. A Spectral Reflectance-Based Approach to Quantification of Grassland Cover from Landsat TM Imagery. Remote Sens. Environ. 2003, 87, 371–375. [Google Scholar] [CrossRef]
  18. Lehnert, L.W.; Meyer, H.; Wang, Y.; Miehe, G.; Thies, B.; Reudenbach, C.; Bendix, J. Retrieval of Grassland Plant Coverage on the Tibetan Plateau Based on a Multi-Scale, Multi-Sensor and Multi-Method Approach. Remote Sens. Environ. 2015, 164, 197–207. [Google Scholar] [CrossRef]
  19. Li, Y.; Zhang, H.; Shen, Q. Spectral–Spatial Classification of Hyperspectral Imagery with 3D Convolutional Neural Network. Remote Sens. 2017, 9, 67. [Google Scholar] [CrossRef] [Green Version]
  20. Griffiths, P.; Nendel, C.; Pickert, J.; Hostert, P. Towards National-Scale Characterization of Grassland Use Intensity from Integrated Sentinel-2 and Landsat Time Series. Remote Sens. Environ. 2020, 238, 111124. [Google Scholar] [CrossRef]
  21. Rapinel, S.; Mony, C.; Lecoq, L.; Clement, B.; Thomas, A.; Hubert-Moy, L. Evaluation of Sentinel-2 Time-Series for Mapping Floodplain Grassland Plant Communities. Remote Sens. Environ. 2019, 223, 115–129. [Google Scholar] [CrossRef]
  22. Odindi, J.; Mutanga, O.; Rajah, P. Assessing the Synergistic Potential of Sentinel-2 Spectral Reflectance Bands and Derived Vegetation Indices for Detecting and Mapping Invasive Alien Plant Species. S. Afr. J. Geomat. 2020, 9, 75–88. [Google Scholar]
  23. Guisan, A.; Thuiller, W.; Zimmermann, N.E. Habitat Suitability and Distribution Models: With Applications in R; Cambridge University Press: Cambridge, UK, 2017; ISBN 0-521-76513-7. [Google Scholar]
  24. Elith, J.; Leathwick, J.R. Species Distribution Models: Ecological Explanation and Prediction across Space and Time. Annu. Rev. Ecol. Evol. Syst. 2009, 40, 677–697. [Google Scholar] [CrossRef]
  25. Di Musciano, M.; Di Cecco, V.; Bartolucci, F.; Conti, F.; Frattaroli, A.R.; Di Martino, L. Dispersal Ability of Threatened Species Affects Future Distributions. Plant Ecol. 2020, 221, 265–281. [Google Scholar] [CrossRef]
  26. Reddy, S.; Dávalos, L.M. Geographical Sampling Bias and Its Implications for Conservation Priorities in Africa. J. Biogeogr. 2003, 30, 1719–1727. [Google Scholar] [CrossRef]
  27. Iannella, M.; D’Alessandro, P.; Biondi, M. Entomological Knowledge in Madagascar by GBIF Datasets: Estimates on the Coverage and Possible Biases (Insecta). Fragm. Entomol. 2019, 51, 1–10. [Google Scholar] [CrossRef] [Green Version]
  28. Graham, C.H.; Elith, J.; Hijmans, R.J.; Guisan, A.; Peterson, A.T.; Loiselle, B.A. The Influence of Spatial Errors in Species Occurrence Data Used in Distribution Models. J. Appl. Ecol. 2008, 45, 239–247. [Google Scholar] [CrossRef] [Green Version]
  29. He, Y.; Chen, G.; Potter, C.; Meentemeyer, R.K. Integrating Multi-Sensor Remote Sensing and Species Distribution Modeling to Map the Spread of Emerging Forest Disease and Tree Mortality. Remote Sens. Environ. 2019, 231, 111238. [Google Scholar] [CrossRef]
  30. Bonanomi, G.; Caporaso, S.; Allegrezza, M. Short-Term Effects of Nitrogen Enrichment, Litter Removal and Cutting on a Mediterranean Grassland. Acta Oecol. 2006, 30, 419–425. [Google Scholar] [CrossRef]
  31. Bonanomi, G.; Caporaso, S.; Allegrezza, M. Effects of Nitrogen Enrichment, Plant Litter Removal and Cutting on a Species-rich Mediterranean Calcareous Grassland. Plant Biosyst. 2009, 143, 443–455. [Google Scholar] [CrossRef]
  32. Allegrezza, M.; Ballelli, S.; Ciucci, V.; Mentoni, M.; Pesaresi, S. The Vegetation and the Plant Landscape of Monte Sassotetto (Sibillini Mountains, Central Apennines). Plant Sociol. 2014, 51, 59–87. [Google Scholar]
  33. Catorci, A.; Cesaretti, S.; Gatti, R.; Ottaviani, G. Abiotic and Biotic Changes due to Spread of Brachypodium Genuense (DC.) Roem. & Schult. in Sub-Mediterranean Meadows. Community Ecol. 2011, 12, 117–125. [Google Scholar]
  34. Tardella, F.M.; Bricca, A.; Piermarteri, K.; Postiglione, N.; Catorci, A. Context-Dependent Variation of SLA and Plant Height of a Dominant, Invasive Tall Grass (Brachypodium Genuense) in Sub-Mediterranean Grasslands. Flora 2017, 229, 116–123. [Google Scholar] [CrossRef]
  35. Buckland, S.M.; Thompson, K.; Hodgson, J.G.; Grime, J.P. Grassland Invasions: Effects of Manipulations of Climate and Management. J. Appl. Ecol. 2001, 38, 301–309. [Google Scholar] [CrossRef]
  36. Kosić, I.V.; Tardella, F.M.; Grbeša, D.; Škvorc, Ž.; Catorci, A. Effects of Abandonment on the Functional Composition and Forage Nutritive Value of a North Adriatic Dry Grassland Community (Ćićarija, Croatia). Appl. Ecol. Environ. Res. 2014, 12, 285. [Google Scholar] [CrossRef]
  37. Natura 2000 Network. Available online: https://ec.europa.eu/environment/nature/natura2000/index_en.htm (accessed on 24 January 2021).
  38. Cervellini, M.; Zannini, P.; Di Musciano, M.; Fattorini, S.; Jiménez-Alfaro, B.; Rocchini, D.; Field, R.; Vetaas, O.R.; Irl, S.D.H.; Beierkuhnlein, C.; et al. A grid-based map for the Biogeographical Regions of Europe. Biodivers. Data J. 2020, 8, e53720. [Google Scholar] [CrossRef]
  39. Calandra, R. I Suoli Di “Campo Imperatore” (Gran Sasso d’Italia). Braun-Blanquetia 1999, 16, 21–32. [Google Scholar]
  40. Conti, F.; Bartolucci, F. The Vascular Flora of Gran Sasso and Monti Della Laga National Park (Central Italy). Phytotaxa 2016, 256, 1–119. [Google Scholar] [CrossRef]
  41. Biondi, E.; Ballelli, S.; Allegrezza, M.; Taffetani, F.; Frattaroli, A.; Guitian, J.; Zuccarello, V. La Vegetazione Di Campo Imperatore (Gran Sasso d’Italia). In “Ricerche Di Geobotanica Ed Ecologia Vegetale Di Campo Imperatore (Gran Sasso d’Italia). Braun-Blanquetia 1999, 16, 53–119. [Google Scholar]
  42. Council Directive 2009/147/EEC. Available online: https://ec.europa.eu/environment/nature/legislation/birdsdirective/index_en.htm (accessed on 24 January 2021).
  43. Council Directive 92/43/EEC. Available online: https://ec.europa.eu/environment/nature/legislation/habitatsdirective/index_en.htm (accessed on 23 January 2021).
  44. Drusch, M.; Del Bello, U.; Carlier, S.; Colin, O.; Fernandez, V.; Gascon, F.; Hoersch, B.; Isola, C.; Laberinti, P.; Martimort, P.; et al. Sentinel-2: ESA’s Optical High-Resolution Mission for GMES Operational Services. Remote Sens. Environ. 2012, 120, 25–36. [Google Scholar] [CrossRef]
  45. Lim, C.H.; An, J.H.; Jung, S.H.; Nam, G.B.; Cho, Y.C.; Kim, N.S.; Lee, C.S. Ecological Consideration for Several Methodologies to Diagnose Vegetation Phenology. Ecol. Res. 2018, 33, 363–377. [Google Scholar] [CrossRef]
  46. Szantoi, Z.; Strobl, P. Copernicus Sentinel-2 Calibration and Validation. Eur. J. Remote Sens. 2019, 52, 253–255. [Google Scholar] [CrossRef] [Green Version]
  47. Louis, J.; Debaecker, V.; Pflug, B.; Main-Knorn, M.; Bieniarz, J.; Mueller-Wilm, U.; Cadau, E.; Gascon, F. Sentinel-2 Sen2cor: L2a Processor for Users. Proceedings Living Planet Symposium. 2016. Available online: https://elib.dlr.de/107381/1/LPS2016_sm10_3louis.pdf (accessed on 15 January 2021).
  48. Gascon, F.; Ramoino, F. Sentinel-2 Data Exploitation with ESA’s Sentinel-2 Toolbox. In Proceedings of the 19th European Geosciences Union (EGU) General Assembly, Vienna, Austria, 23–28 April 2017. [Google Scholar]
  49. Rouse, J.W.; Haas, R.W.; Deering, D.W.; Schell, J.A.; Harlan, J.C. Monitoring the vernal advancement and retrogradation (Greenwave effect) of natural vegetation. In NASA/GSFCT Type III Final Report; NASA: Washington, DC, USA, 1974. [Google Scholar]
  50. Viana-Soto, A.; Aguado, I.; Martínez, S. Assessment of Post-Fire Vegetation Recovery Using Fire Severity and Geographical Data in the Mediterranean Region (Spain). Environments 2017, 4, 90. [Google Scholar] [CrossRef] [Green Version]
  51. Wegmann, M.; Leutner, B.; Dech, S. Remote Sensing and GIS for Ecologists: Using Open Source Software; Pelagic Publishing Ltd.: Exeter, UK, 2016; ISBN 1-78427-024-5. [Google Scholar]
  52. Wood, E.M.; Pidgeon, A.M.; Radeloff, V.C.; Keuler, N.S. Image Texture as a Remotely Sensed Measure of Vegetation Structure. Remote Sens. Environ. 2012, 121, 516–526. [Google Scholar] [CrossRef]
  53. Catonica, C.; Tinti, D.; De Bonis, L.; Di Santo, D.; Calzolaio, A.; De Paulis, S. Carta Della Natura per La Zonazione Del Piano Del Parco Nazionale Del Gran Sasso e Monti Della Laga; Ente Parco Nazionale del Gran Sasso e Monti della Laga: Rome, Italy, 2015. Available online: https://www.isprambiente.gov.it/it/servizi/sistema-carta-della-natura/la-carta-della-natura-di-interesse-locale-1/la-carta-della-natura-del-parco-nazionale-del-gran-sasso-e-dei-monti-della-laga (accessed on 18 January 2021).
  54. Congedo, L.; Sallustio, L.; Munafò, M.; Ottaviano, M.; Tonti, D.; Marchetti, M. Copernicus High-Resolution Layers for Land Cover Classification in Italy. J. Maps 2016, 12, 1195–1205. [Google Scholar] [CrossRef] [Green Version]
  55. European Environmental Agency. CORINE Land Cover—Copernicus Land Monitoring Service. Available online: https://land.copernicus.eu/pan-european/corine-land-cover (accessed on 19 January 2020).
  56. Tilahun, A. Accuracy Assessment of Land Use Land Cover Classification Using Google Earth. Am. J. Environ. Prot. 2015, 4, 193. [Google Scholar] [CrossRef]
  57. Muñoz-Marí, J.; Bruzzone, L.; Camps-Valls, G. A Support Vector Domain Description Approach to Supervised Classification of Remote Sensing Images. IEEE Trans. Geosci. Remote Sens. 2007, 45, 2683–2692. [Google Scholar] [CrossRef]
  58. Breiman, L. Random Forests. Mach. Learn. 2001, 45, 5–32. [Google Scholar] [CrossRef] [Green Version]
  59. Noble, W.S. What Is a Support Vector Machine? Nat. Biotechnol. 2006, 24, 1565–1567. [Google Scholar] [CrossRef] [PubMed]
  60. Wu, X.; Kumar, V. The Top Ten Algorithms in Data Mining; CRC Press: Boca Raton, FL, USA, 2009; ISBN 978-1-4200-8965-3. [Google Scholar]
  61. Leutner, B.; Horning, N.; Schwalb-Willmann, J.; Hijmans, R.J. RStoolbox: Tools for Remote Sensing Data Analysis, 0.2.6. 2020. Available online: https://github.com/bleutner/RStoolbox (accessed on 10 December 2020).
  62. R Core Team. R: A Language and Environment for Statistical Computing, 3.6.3; R Core Team: Vienna, Austria, 2020; Available online: https://www.R-project.org/ (accessed on 7 December 2020).
  63. Li, C.; Wang, J.; Wang, L.; Hu, L.; Gong, P. Comparison of Classification Algorithms and Training Sample Sizes in Urban Land Classification with Landsat Thematic Mapper Imagery. Remote Sens. 2014, 6, 964–983. [Google Scholar] [CrossRef] [Green Version]
  64. Meyer, H.; Pebesma, E. Predicting into Unknown Space? Estimating the Area of Applicability of Spatial Prediction Models. arXiv 2020, arXiv:200507939. [Google Scholar]
  65. Meyer, H.; Reudenbach, C.; Wöllauer, S.; Nauss, T. Importance of Spatial Predictor Variable Selection in Machine Learning Applications–Moving from Data Reproduction to Spatial Prediction. Ecol. Model. 2019, 411, 108815. [Google Scholar] [CrossRef] [Green Version]
  66. Meyer, H. CAST: ‘caret’ Applications for Spatial-Temporal Models. R Package Version 0.4.2. Available online: https://CRAN.R-project.org/package=CAST (accessed on 11 December 2020).
  67. Anselin, L. Local Indicators of Spatial Association—LISA. Geogr. Anal. 1995, 27, 93–115. [Google Scholar] [CrossRef]
  68. Biondi, E.; Blasi, C.; Burrascano, S.; Casavecchia, S.; Copiz, R.; Del Vico, E.; Galdenzi, D.; Gigante, D.; Lasen, C.; Spampinato, G.; et al. Italian Interpretation Manual of the 92/43/EEC Directive Habitats. Ministero dell’Ambiente e della Tutela del Territorio e del Mare, 2009; Available online: http://vnr.unipg.it/habitat/ (accessed on 21 January 2021).
  69. QGIS Development Team. QGIS Geographic Information System; Version 3.14; Open Source Geospatial Foundation: Beaverton, OR, USA, 2020. [Google Scholar]
  70. Erdős, L.; Bátori, Z. The Moving Split Window (MSW) Analysis in Vegetation Science–An Overview. Appl. Ecol. Environ. Res. 2014, 12, 787–805. [Google Scholar] [CrossRef]
  71. Chang, Y.; Bu, R.; Hu, Y.; Xu, C.; Wang, Q. Detecting Forest Landscape Boundary between Mountain Birch and Evergreen Coniferous Forest in the Northern Slope of Changbai Mountain. J. Environ. Sci. 2003, 15, 182–186. [Google Scholar]
  72. Jacquez, G.M.; Maruca, S.; Fortin, M.-J. From Fields to Objects: A Review of Geographic Boundary Analysis. J. Geogr. Syst. 2000, 2, 221–241. [Google Scholar] [CrossRef]
  73. Elith, J.; Graham, C.H.; Anderson, R.P.; Dudík, M.; Ferrier, S.; Guisan, A.; Hijmans, R.J.; Huettmann, F.; Leathwick, J.R.; Lehmann, A. Novel Methods Improve Prediction of Species’ Distributions from Occurrence Data. Ecography 2006, 29, 129–151. [Google Scholar] [CrossRef] [Green Version]
  74. Dormann, C.F.; Elith, J.; Bacher, S.; Buchmann, C.; Carl, G.; Carré, G.; Marquéz, J.R.G.; Gruber, B.; Lafourcade, B.; Leitão, P.J. Collinearity: A Review of Methods to Deal with It and a Simulation Study Evaluating Their Performance. Ecography 2013, 36, 27–46. [Google Scholar] [CrossRef]
  75. Naimi, B.; Hamm, N.A.; Groen, T.A.; Skidmore, A.K.; Toxopeus, A.G. Where Is Positional Uncertainty a Problem for Species Distribution Modelling? Ecography 2014, 37, 191–203. [Google Scholar] [CrossRef]
  76. Iannella, M.; Cerasoli, F.; D’Alessandro, P.; Console, G.; Biondi, M. Coupling GIS Spatial Analysis and Ensemble Niche Modelling to Investigate Climate Change-Related Threats to the Sicilian Pond Turtle Emys Trinacris, an Endangered Species from the Mediterranean. PeerJ 2018, 6, e4969. [Google Scholar] [CrossRef] [PubMed] [Green Version]
  77. Leathwick, J.R.; Rowe, D.; Richardson, J.; Elith, J.; Hastie, T. Using Multivariate Adaptive Regression Splines to Predict the Distributions of New Zealand’s Freshwater Diadromous Fish. Freshw. Biol. 2005, 50, 2034–2052. [Google Scholar] [CrossRef]
  78. Elith, J.; Leathwick, J.R.; Hastie, T. A Working Guide to Boosted Regression Trees. J. Anim. Ecol. 2008, 77, 802–813. [Google Scholar] [CrossRef] [PubMed]
  79. Thuiller, W.; Georges, D.; Engler, R.; Breiner, F.; Georges, M.D.; Thuiller, C.W. Package ‘Biomod2’: Ensemble Platform for Species Distribution Modeling. Available online: https://cran.r-project.org/web/packages/biomod2/biomod2.pdf (accessed on 9 December 2020).
  80. Di Cola, V.; Broennimann, O.; Petitpierre, B.; Breiner, F.T.; D’Amen, M.; Randin, C.; Engler, R.; Pottier, J.; Pio, D.; Dubuis, A. Ecospat: An R Package to Support Spatial Analyses and Modeling of Species Niches and Distributions. Ecography 2017, 40, 774–787. [Google Scholar] [CrossRef]
  81. Mattivi, P.; Franci, F.; Lambertini, A.; Bitelli, G. TWI Computation: A Comparison of Different Open Source GISs. Open Geospat. Data Softw. Stand. 2019, 4, 1–12. [Google Scholar] [CrossRef]
  82. Peterson, E.B. Mapping Percent-Cover of the Invasive Species Bromus Tectorum (Cheatgrass) over a Large Portion of Nevada from Satellite Imagery; Nevada Natural Heritage Program: Carson City, NV, USA, 2003. [Google Scholar]
  83. Wang, A.; Chen, J.; Jing, C.; Ye, G.; Wu, J.; Huang, Z.; Zhou, C. Monitoring the Invasion of Spartina Alterniflora from 1993 to 2014 with Landsat TM and SPOT 6 Satellite Data in Yueqing Bay, China. PLoS ONE 2015, 10, e0135538. [Google Scholar] [CrossRef] [PubMed] [Green Version]
  84. Kganyago, M.; Odindi, J.; Adjorlolo, C.; Mhangara, P. Evaluating the Capability of Landsat 8 OLI and SPOT 6 for Discriminating Invasive Alien Species in the African Savanna Landscape. Int. J. Appl. Earth Obs. Geoinf. 2018, 67, 10–19. [Google Scholar] [CrossRef]
  85. Tian, Y.; Jia, M.; Wang, Z.; Mao, D.; Du, B.; Wang, C. Monitoring Invasion Process of Spartina Alterniflora by Seasonal Sentinel-2 Imagery and an Object-Based Random Forest Classification. Remote Sens. 2020, 12, 1383. [Google Scholar] [CrossRef]
  86. Rodriguez-Galiano, V.F.; Ghimire, B.; Rogan, J.; Chica-Olmo, M.; Rigol-Sanchez, J.P. An Assessment of the Effectiveness of a Random Forest Classifier for Land-Cover Classification. ISPRS J. Photogramm. Remote Sens. 2012, 67, 93–104. [Google Scholar] [CrossRef]
  87. Barrett, B.; Raab, C.; Cawkwell, F.; Green, S. Upland Vegetation Mapping Using Random Forests with Optical and Radar Satellite Data. Remote Sens. Ecol. Conserv. 2016, 2, 212–231. [Google Scholar] [CrossRef]
  88. Belgiu, M.; Drăguţ, L. Random Forest in Remote Sensing: A Review of Applications and Future Directions. ISPRS J. Photogramm. Remote Sens. 2016, 114, 24–31. [Google Scholar] [CrossRef]
  89. Stenzel, S.; Fassnacht, F.E.; Mack, B.; Schmidtlein, S. Identification of High Nature Value Grassland with Remote Sensing and Minimal Field Data. Ecol. Indic. 2017, 74, 28–38. [Google Scholar] [CrossRef]
  90. Grabska, E.; Hawryło, P.; Socha, J. Continuous Detection of Small-Scale Changes in Scots Pine Dominated Stands Using Dense Sentinel-2 Time Series. Remote Sens. 2020, 12, 1298. [Google Scholar] [CrossRef] [Green Version]
  91. Elkind, K.; Sankey, T.T.; Munson, S.M.; Aslan, C.E. Invasive Buffelgrass Detection Using High-resolution Satellite and UAV Imagery on Google Earth Engine. Remote Sens. Ecol. Conserv. 2019, 5, 318–331. [Google Scholar] [CrossRef]
  92. Corazza, M.; Tardella, F.M.; Ferrari, C.; Catorci, A. Tall Grass Invasion After Grassland Abandonment Influences the Availability of Palatable Plants for Wild Herbivores: Insight into the Conservation of the Apennine Chamois Rupicapra Pyrenaicaornata. Environ. Manag. 2016, 57, 1247–1261. [Google Scholar] [CrossRef]
  93. Catorci, A.; Cesaretti, S.; Tardella, F.M. Effect of Tall-Grass Invasion on the Flowering-Related Functional Pattern of Submediterranean Hay-Meadows. Plant Biosyst. Int. J. Deal. Asp. Plant Biol. 2014, 148, 1127–1137. [Google Scholar] [CrossRef]
  94. Catorci, A.; Ottaviani, G.; Kosić, I.V.; Cesaretti, S. Effect of Spatial and Temporal Patterns of Stress and Disturbance Intensities in a Sub-Mediterranean Grassland. Plant Biosyst. Int. J. Deal. Asp. Plant Biol. 2012, 146, 352–367. [Google Scholar] [CrossRef]
  95. Nagendra, H. Using Remote Sensing to Assess Biodiversity. Int. J. Remote Sens. 2001, 22, 2377–2400. [Google Scholar] [CrossRef]
  96. Feilhauer, H.; Dahlke, C.; Doktor, D.; Lausch, A.; Schmidtlein, S.; Schulz, G.; Stenzel, S. Mapping the Local Variability of Natura 2000 Habitats with Remote Sensing. Appl. Veg. Sci. 2014, 17, 765–779. [Google Scholar] [CrossRef]
  97. Cerrejón, C.; Valeria, O.; Mansuy, N.; Barbé, M.; Fenton, N.J. Predictive mapping of bryophyte richness patterns in boreal forests using species distribution models and remote sensing data. Ecol. Indic. 2020, 119, 106826. [Google Scholar] [CrossRef]
  98. Ahmed, N.; Atzberger, C.; Zewdie, W. Species Distribution Modelling performance and its implication for Sentinel-2-based prediction of invasive Prosopis juliflora in lower Awash River basin, Ethiopia. Ecol. Process. 2021, 10, 1–16. [Google Scholar] [CrossRef]
  99. Lassueur, T.; Joost, S.; Randin, C.F. Very High Resolution Digital Elevation Models: Do They Improve Models of Plant Species Distribution? Ecol. Model. 2006, 198, 139–153. [Google Scholar] [CrossRef]
  100. Zuccarello, V.; Allegrezza, M.; Biondi, E.; Calandra, R. Valenza ecologica di specie e di associazioni prative e modelli di distribuzione lungo gradienti sulla base della teoria degli insiemi sfocati (Fuzzy Set Theory). Braun Blanquetia 1999, 16, 121–225. [Google Scholar]
  101. Moeslund, J.E.; Arge, L.; Bøcher, P.K.; Dalgaard, T.; Ejrnæs, R.; Odgaard, M.V.; Svenning, J.-C. Topographically Controlled Soil Moisture Drives Plant Diversity Patterns within Grasslands. Biodivers. Conserv. 2013, 22, 2151–2166. [Google Scholar] [CrossRef]
  102. Pickett, S.T.A.; Bazzaz, F.A. Organization of an Assemblage of Early Successional Species on a Soil Moisture Gradient. Ecology 1978, 59, 1248–1255. [Google Scholar] [CrossRef]
  103. Buri, A.; Cianfrani, C.; Pradervand, J.N.; Guisan, A. Predicting Plant Distribution in an Heterogeneous Alpine Landscape: Does Soil Matter? In Proceedings of the EGU General Assembly Conference, Vienna, Austria, 17–22 April 2016. [Google Scholar]
  104. Bennie, J.; Huntley, B.; Wiltshire, A.; Hill, M.O.; Baxter, R. Slope, Aspect and Climate: Spatially Explicit and Implicit Models of Topographic Microclimate in Chalk Grassland. Ecol. Model. 2008, 216, 47–59. [Google Scholar] [CrossRef]
  105. Potter, K.A.; Arthur Woods, H.; Pincebourde, S. Microclimatic Challenges in Global Change Biology. Glob. Chang. Biol. 2013, 19, 2932–2939. [Google Scholar] [CrossRef]
  106. Dengler, J. Zwischen Estland Und Portugal–Gemeinsamkeiten Und Unterschiede Der Phytodiversitätsmuster Europäischer Trockenrasen. Tuexenia 2005, 25, 387–405. [Google Scholar]
  107. Galiè, M.; Casavecchia, S.; Galdenzi, D.; Gasparri, R.; Soriano, P.; Estrelles, E.; Biondi, E. Seed Germination Behavior of Two Brachypodium Species with a Key Role in the Improvement of Marginal Areas. Plant Sociol. 2013, 50, 91–107. [Google Scholar]
  108. Bricca, A.; Tardella, F.M.; Tolu, F.; Goia, I.; Ferrara, A.; Catorci, A. Disentangling the Effects of Disturbance from Those of Dominant Tall Grass Features in Driving the Functional Variation of Restored Grassland in a Sub-Mediterranean Context. Diversity 2020, 12, 11. [Google Scholar] [CrossRef] [Green Version]
  109. Allegrezza, M.; Biondi, E.; Ballelli, S.; Tesei, G.; Ottaviani, C.; Zitti, S. Brachypodium Rupestre (Host) Roem. & Schult. Herbaceous Communities of Heliophilous Edge in the Trifolio Medii-Geranietea Sanguinei Müller 1962 Class. Plant Sociol. 2016, 53, 59–76. [Google Scholar]
Figure 1. (a) Large-scale framework. (b) Regional-scale framework: digital elevation model of Abruzzo region. (c) Collected points on the field (presence/absence) and local-scale framework: views of the area’s morphology. The study area located on the Gran Sasso and Monti of Laga National Park (Central Apennine, Abruzzo, Italy) is marked in light blue in all panels.
Remotesensing 13 01904 g001
Figure 2. Summary of the workflow and methods involved in the work with focus groups.
Remotesensing 13 01904 g002
Figure 3. The cover map for Brachypodium genuense in Campo Imperatore showing this grass in light green. The background image is a false-color image by Sentinel-2 (NIR, Red, Green) highlights the most active vegetation on the date of acquisition (25 July 2019). The study area is marked in light blue. In the upper-right part, there are the target species.
Remotesensing 13 01904 g003
Figure 4. Distribution of Brachypodium genuense (B. genuense) on habitat map (Natura 2000 habitats). The numeric codes of the habitats in the legend correspond to Alpine and Boreal heaths (4060), Alpine and subalpine calcareous grasslands (6170), Semi-natural dry grasslands and scrubland facies on calcareous substrates (Festuco-Brometalia) (* important orchid sites) (6210*), Species-rich Nardus grasslands, on siliceous substrates in mountain areas and submountain areas, in Continental Europe (6230*), and Calcareous rocky slopes with chasmophytic vegetation (8210). The pie chart (top left in the figure) shows the split percentage by habitats of the B. genuense distribution identified in the study area. The study area is marked in purple.
Remotesensing 13 01904 g004
Figure 5. The inflated response curve of topographic variables for Brachypodium genuense in the study area. The green line is the average of the 100 inflates curve randomly selected. The presences (green dots) and pseudo-absences (red dots) used to calibrate the model. x-axis: Northness = cosine (aspect) and Eastness = sine (aspect); Elevation = m a.s.l.; Slope = degrees; Solar Radiation = WH/m2; Topographic Wet Index (TWI), high values indicate humid areas and low values indicates dry areas.
Remotesensing 13 01904 g005
Table 1. Accuracy of ten-fold cross-validation (cv) for all tested models.
Model NameValidation TypeOverall Accuracy (%)Kappa Index (%)
rfcv (kfold = 10)94.7988.00
svmRadialCostcv (kfold = 10)91.6682.09
rpart2cv (kfold = 10)90.6279.07
Table 2. Results from overlay analysis. From left to right in the table: habitat codes correspond to Alpine and Boreal heaths (4060), Alpine and subalpine calcareous grasslands (6170), Semi-natural dry grasslands and scrubland facies on calcareous substrates (Festuco-Brometalia) (* important orchid sites) (6210*), Species-rich Nardus grasslands, on siliceous substrates in mountain areas and submountain areas, in Continental Europe (6230*) and Calcareous rocky slopes with chasmophytic vegetation (8210); total hectares of each habitat; hectares covered by Brachypodium genuense (B. genuense) in each habitat; relative cover percentage of B. genuense; differences between realized cover and expected cover (ASEH), where the negative values indicate that the B. genuense is less than what was expected (8.26% in each habitat), while positive value indicate a higher cover compared to the expected ones; percentage of B. genuense patches in each habitat compared to the total hectares covered by the species.
Habitat CodeHabitat Cover (ha)Cover (ha)
B. genuense
Cover (%)
B. genuense
ASEH (ha)Cumulative Contribution of B. genuense %
4060197.6230.6115.4914.283.93
61703254.98112.343.45−156.5214.45
8120721.113.720.51−55.840.48
*62103874.06575.3014.85255.3074.04
*6230291.3940.2113.8016.145.17
Mosaic1063.6714.791.39−73.071.90
TOTAL9402.84776.988.26
Table 3. Results of the topographic niche model. Measures of sensitivity and specificity (Kappa, TSS, ROC).
SensitivitySpecificity
KAPPA97.5485.05
TSS97.6085.00
ROC97.6085.00
Publisher’s Note: MDPI stays neutral with regard to jurisdictional claims in published maps and institutional affiliations.

