
Identification of Typical Solid Hazardous Chemicals Based on Hyperspectral Imaging
by
 , ,
, ,
Yanlong Sun
1 ,
,
Xinming Qian
1,
Yangyang Liu
2,3,
Jianwei Wang
2,
Qunbo Lv
2,3 and
Mengqi Yuan
1,* 1
State Key Laboratory of Explosion Science and Technology, Beijing Institute of Technology, Beijing 100081, China
2
Aerospace Information Research Institute, Chinese Academy of Sciences, Beijing 100094, China
3
University of Chinese Academy of Sciences, Beijing 100049, China
*
Author to whom correspondence should be addressed.
Remote Sens. 2021, 13(13), 2608; https://0-doi-org.brum.beds.ac.uk/10.3390/rs13132608
Submission received: 25 May 2021
/
Revised: 24 June 2021
/
Accepted: 1 July 2021
/
Published: 2 July 2021
(This article belongs to the Special Issue Classification and Feature Extraction Based on Remote Sensing Imagery)
Abstract
:The identification of hazardous chemicals based on hyperspectral imaging is an important emergent means for the prevention of explosion accidents and the early warning of secondary hazards. In this study, we used a combination of spectral curve matching based on full-waveform characteristics and spectral matching based on spectral characteristics to identify the hazardous chemicals, and proposed a method to quantitatively characterize the matching degree of the spectral curves of hazardous chemicals. The results showed that the four hazardous chemicals, sulfur, red phosphorus, potassium permanganate, and corn starch had bright colors, distinct spectral curve characteristics, and obvious changes in reflectivity, which were easy to identify. Moreover, the matching degree of their spectral curves was positively correlated with their reflectivity. However, the spectral characteristics of carbon powder, strontium nitrate, wheat starch, and magnesium–aluminum alloy powder were not obvious, with no obvious characteristic peaks or trends of change in reflectivity. Except for the reflectivity and the matching degree of the carbon powder being maintained at a low level, the reflectivity of the remaining three samples was relatively close, so that it was difficult to identify with the spectral curves alone, and color information should be considered for further identification.
1. Introduction
In recent years, severe explosion accidents have occurred frequently, including the “8.2” explosion accident in Jiangsu Zhongrong in 2014, the “8.12” fire and explosion accident at Tianjin Port in 2015, and the “8.4” explosion accident at Beirut Port in 2020. The environment of an explosion accident site is complex, often with numerous explosives and pollutants distributed over the site. At the scene of an accident, it is important to quickly locate the core area of the explosion as well as the type and distribution of explosives and pollutants, to provide disaster scene awareness, early warning of secondary hazards and support for decision-making in post-accident rescue. Therefore, there is an urgent need to expand the study of in situ identification and detection of typical inflammable and explosive hazardous chemicals at explosion accident scenes.
Various detection techniques, equipment and methods are used for different types of explosive hazardous chemicals. Conventional methods include gas chromatography, liquid chromatography, ion chromatography, mass spectrometry, isotope ratio mass spectrometry, capillary electrophoresis, thermal analysis (thermogravimetry (TG) and differential scanning calorimetry (DSC)), molecular imprinting, general spectroscopic methods (fluorescence, luminescence, spectrophotometry, ultraviolet, and chemiluminescence), Fourier transform infrared spectroscopy, and Raman spectroscopy [1,2,3,4,5,6,7,8,9,10,11,12,13,14,15,16]. For instance, Catherine E. Hay, et al. [2] proposed a simple and robust, low-cost electrochemical device for the combined sampling and detection of the trace solid explosive 2,4,6-trinitrotoluene (TNT) from a non-porous surface, and the prototype device was able to detect TNT with a 30 min development time in different ambient environmental conditions. K. Hossny, et al. [4] developed a framework to identify explosive materials using gamma spectra, and results emphasized the pipeline ability to identify the explosives with an accuracy of 92%. Alan D. Hewitt et, al. [12] performed on-site determination of nitroaromatic and nitramine residues in soils using a field-portable gas chromatograph (GC) equipped with a thermionic ionization detector selective for compounds with nitro functional groups.
Fortunately, significant progress has been made in hyperspectral imaging in the past thirty years. As a non-contact detection method, it has attracted intensive interest in food quality evaluation, item safety evaluation, vegetation detection, precision agriculture, and medical diagnosis [17,18,19,20,21,22,23,24,25,26,27]. For example, Xin Zhao, et al. [17] utilized near-infrared hyperspectral imaging to detect low-level peanut powder contamination of whole wheat flour, with the peanut powder concentrations as low as 0.3% in spring wheat flour and as low as 0.5% in winter wheat flour. Jaafar Abdulridha, et al. [18] developed a lab- and UAV-based powdery mildew disease detection system and applied this system to detect powdery mildew disease in squash at different stages. Paul Arellano, et al. [19] detected the effects of hydrocarbon pollution in the Amazon forest using hyperspectral satellite images, and the results revealed that tropical forests exposed to hydrocarbon pollution show reduced levels of chlorophyll content, higher levels of foliar water content and leaf structural changes. Hongzhe Jiang, et al. [21] used hyperspectral imaging for detecting and visualizing leaf lard adulteration in minced pork and generated adulteration maps for different adulteration levels. Na Wu, et al. [24] proposed an effective method for RFS detection based on microscopic molecular detection technology with macroscopic spectral imaging technology, detected rice kernels with different varieties, different infection conditions and different infection status, and achieved high infection degrees as 99.33% on calibration set and 99.20% on prediction set. Jiyue Gao, et al. [27] detected pixel-level aflatoxin in maize based on feature selection and hyperspectral imaging, and used the feature selection method to classify the aflatoxin-contaminated corns and reached high accuracy of 99.38%.
In summary, the inconvenience of the traditional identification method of hazardous chemicals is the need for contact detection or returning to the laboratory for detection after sampling, and those methods do not have capabilities for non-contact or remote detection and identification. Hyperspectral imaging has a wide range of applications, can perform fine classification and identification of material properties, and has the advantages of long-distance, non-contact, and non-destructive detection. However, in the current literature, there are few research results on the identification and detection of hazardous chemicals using a hyperspectral imaging technique [28,29,30,31]. In this study, we attempted to take advantage of these two disciplines to apply refined classification with a high spectral resolution to the identification of hazardous chemicals, so as to establish a certain theoretical framework and provide a new method for long-distance and non-contact detection of hazardous chemicals. The research results are of great significance for the detection and early warning of hazardous chemicals and expansion of the applications of hyperspectral imaging.
2. Materials and Methods
2.1. Experimental Samples and Targets Preparation
We investigated 8 hazardous chemicals, red phosphorus, corn starch, carbon powder, strontium nitrate, wheat starch, sulfur, potassium permanganate, and magnesium–aluminum alloy powder in our study to cover the basic different common types of solid hazardous chemicals, including flammables, strong oxidizers, metal powders, and non-metal powders. See Table 1 for the physical properties of the 8 target hazardous chemicals, including density, color and purity, in which color was the most important indicator.
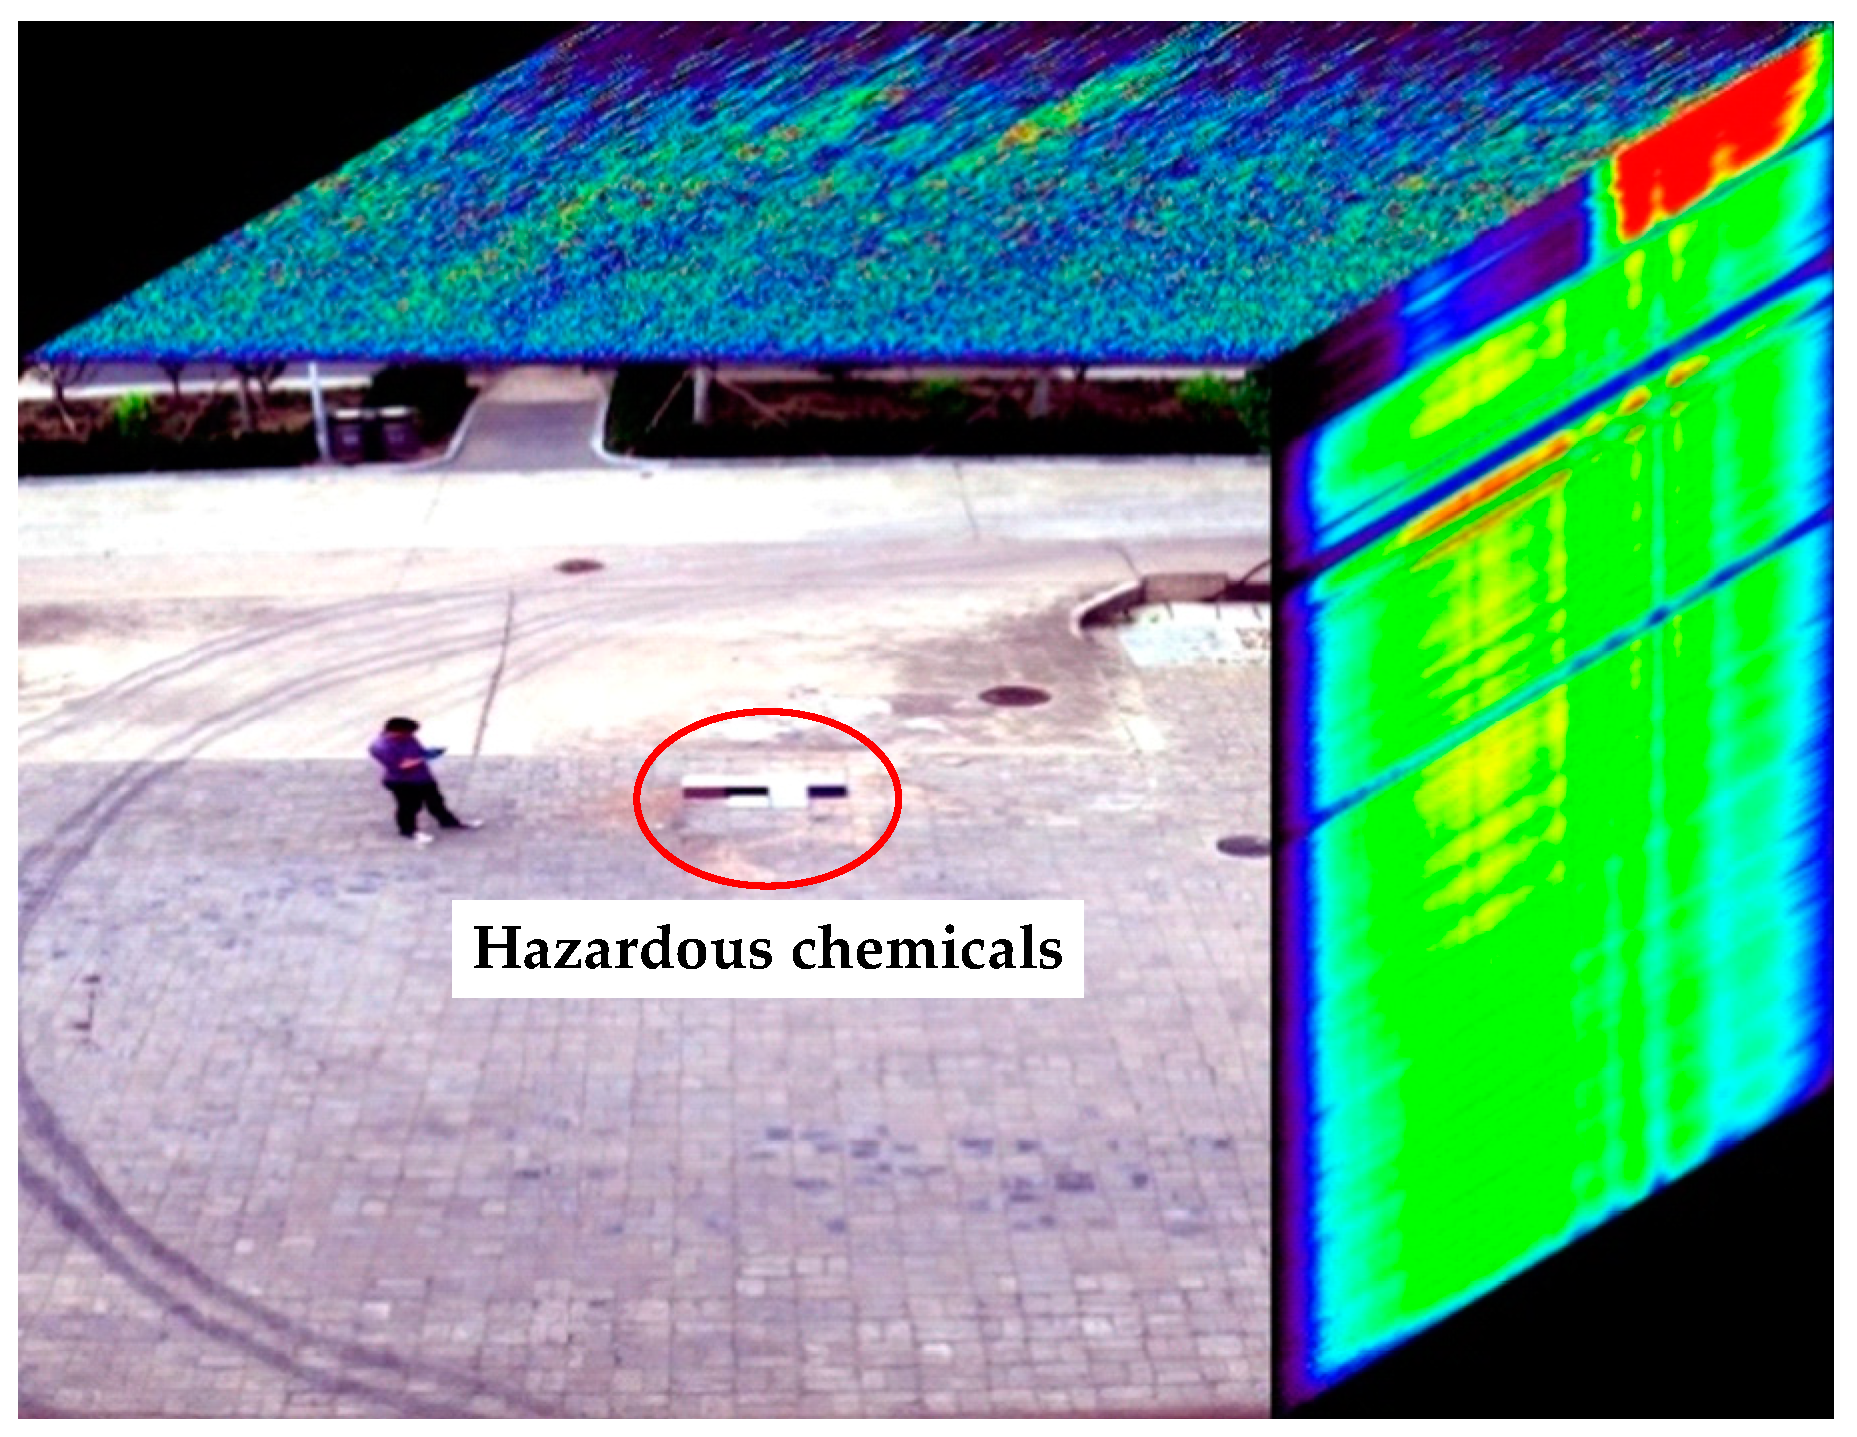
Samples were individually adhered to a stainless-steel plate for the experiment. The target plate (Figure 1) was 300 × 300 × 10 mm, with one open side and a thickness of 1 mm. Photosensitive adhesive was evenly applied on the plate, the hazardous chemical powder was evenly distributed onto the photosensitive adhesive, and the plate was irradiated for 12 h with a UV lamp to solidify the sample and obtain the prepared target for the experimental work (Figure 2). Here we assumed that the variability for different samples of the same material is insignificant, and especially for long-distance remote sensing detection, this difference can be ignored.
2.2. Test Equipment and Spectrum Collection Method
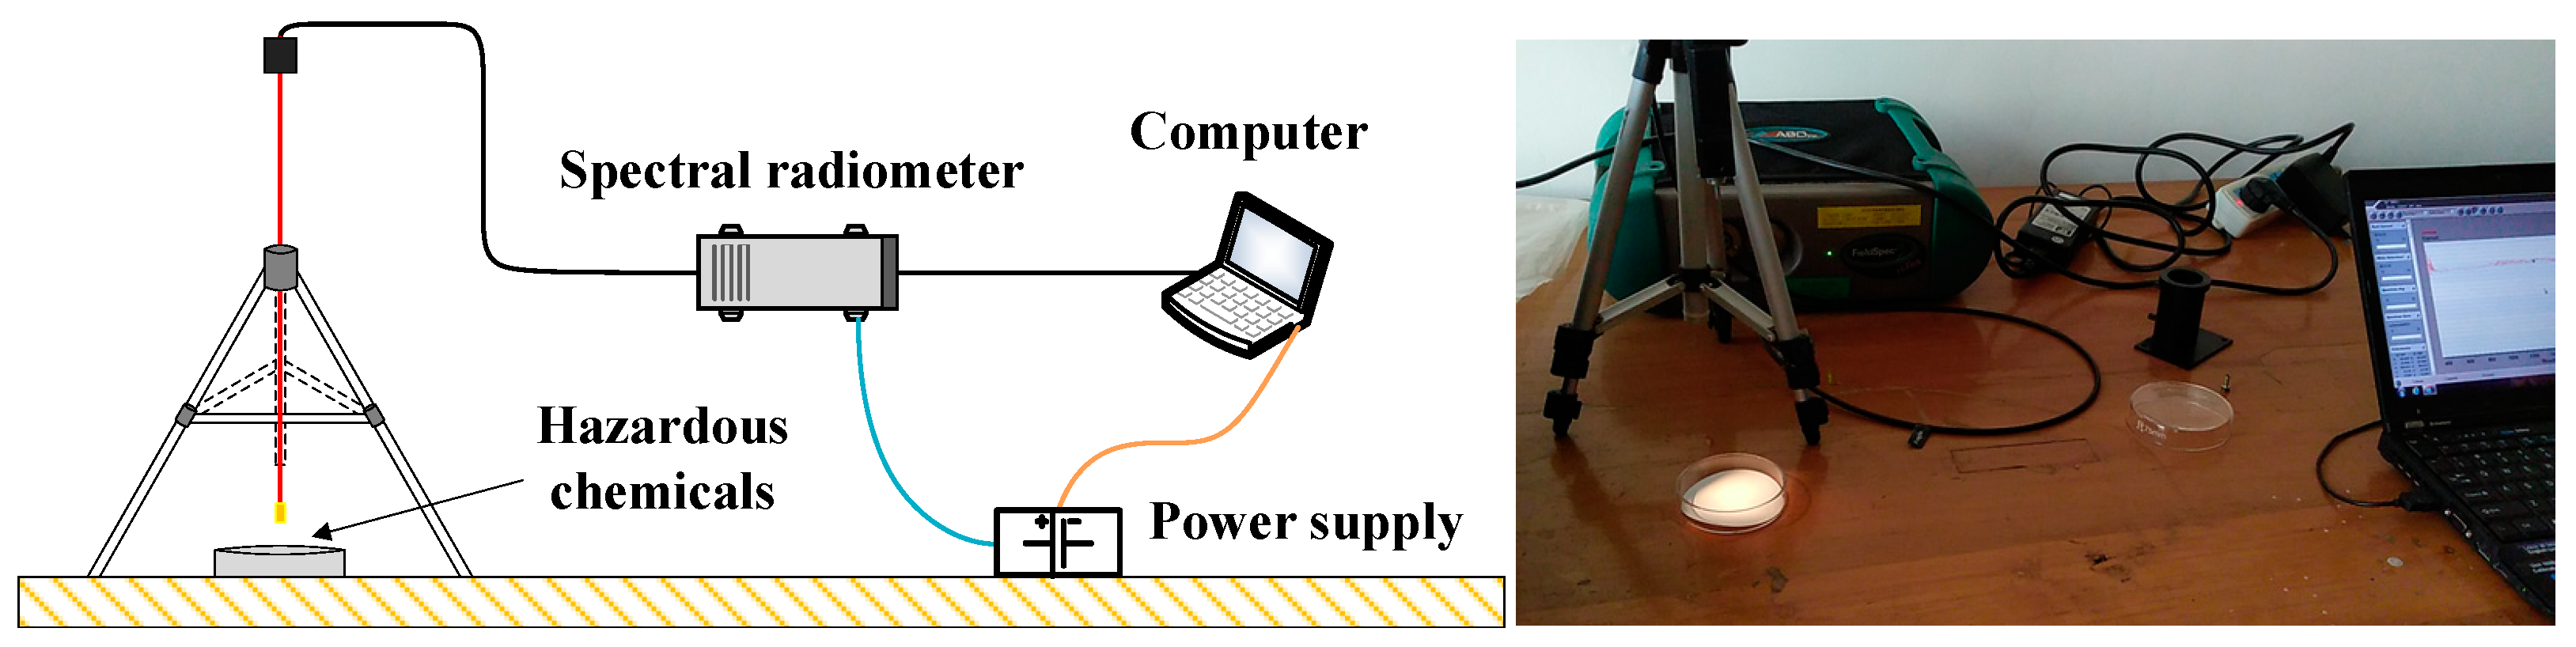
The Ocean Optics fiber optic spectrometer (American Ocean Optics; USB4000+; spectral range 380–1100 nm; 3648–element linear silicon CCD array) was used to establish a spectral database of typical hazardous chemicals in the laboratory. The spectrum collection process is shown in Figure 3. After the equipment and the samples were ready, the sample was placed on a glass dish with a diameter of 100 mm and a filter paper on it, and then the Ocean Optics fiber optic spectrometer was used to measure the reflectivity–wavelength spectrum curves of the samples and the whiteboard (reference board, reflectivity of each band is 50%). The distance between the detector and the sample was 150 mm, the above steps were repeated 3 times, and the average value of the obtained spectrum data was taken as the standard spectrum curve of the sample.
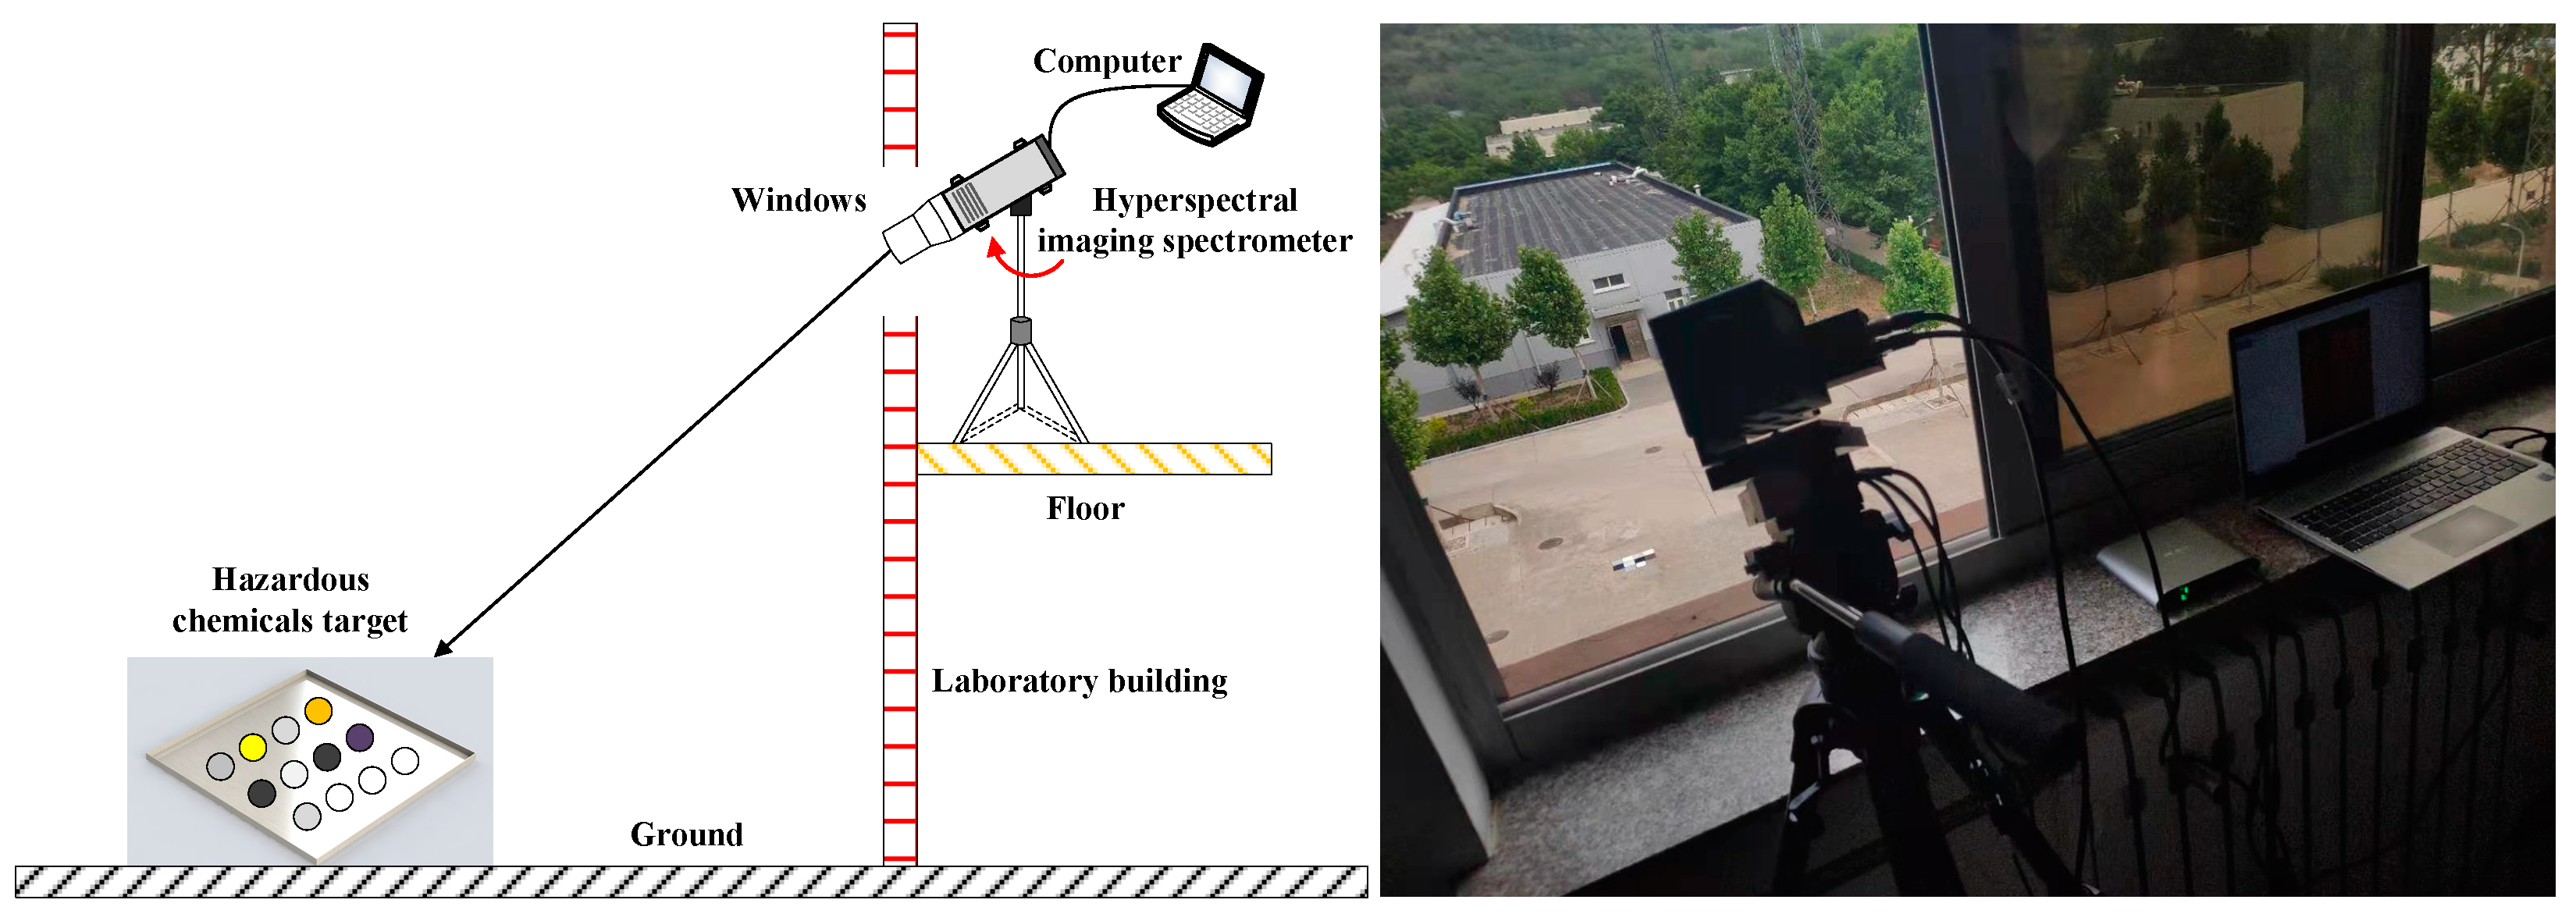
In addition, a self-developed visible light imaging spectrometer (self-developed equipment; Aerospace Information Research Institute, Chinese Academy of Sciences; Dyson optical structure; Fery prism as a light splitting element; spectral range 400–1000 nm; average spectral resolution 5 nm; 240 bands; instantaneous angular resolution 0.5 mrad; field of view 30°; frame rate 50 fps) was used to collect the spectral data of hazardous chemicals in the actual environment, as shown in Figure 4. The hazardous chemicals targets were placed horizontally adjacent to the ground in front of the laboratory in the Xishan test area of Beijing Institute of Technology, and the visible light imaging spectrometer was placed on the floor of the fourth floor of the laboratory (the distance between the equipment and the hazardous chemicals target is about 30 m). The standard reflector and the hazardous chemical targets were placed in the same area to ensure that both appear in the push-broom field of view at the same time. Push-broom imaging was achieved by controlling the rotation of the turntable. The above steps were repeated 3 times to obtain 3 hyperspectral data cubes of hazardous chemicals. Based on the hyperspectral data cubes, the reflectivity–wavelength spectrum curves of hazardous chemicals in the actual environment can be obtained. It should be noted that this spectrum collection test was carried out at 2 pm on May 24, 2019. The weather condition was cloudy, but the sunlight was not blocked by clouds. It can be considered that the spectrum collection test for all hazardous chemicals was carried out under the same weather conditions.
2.3. Fast Extraction Technology of Spectral Information and Identification Method
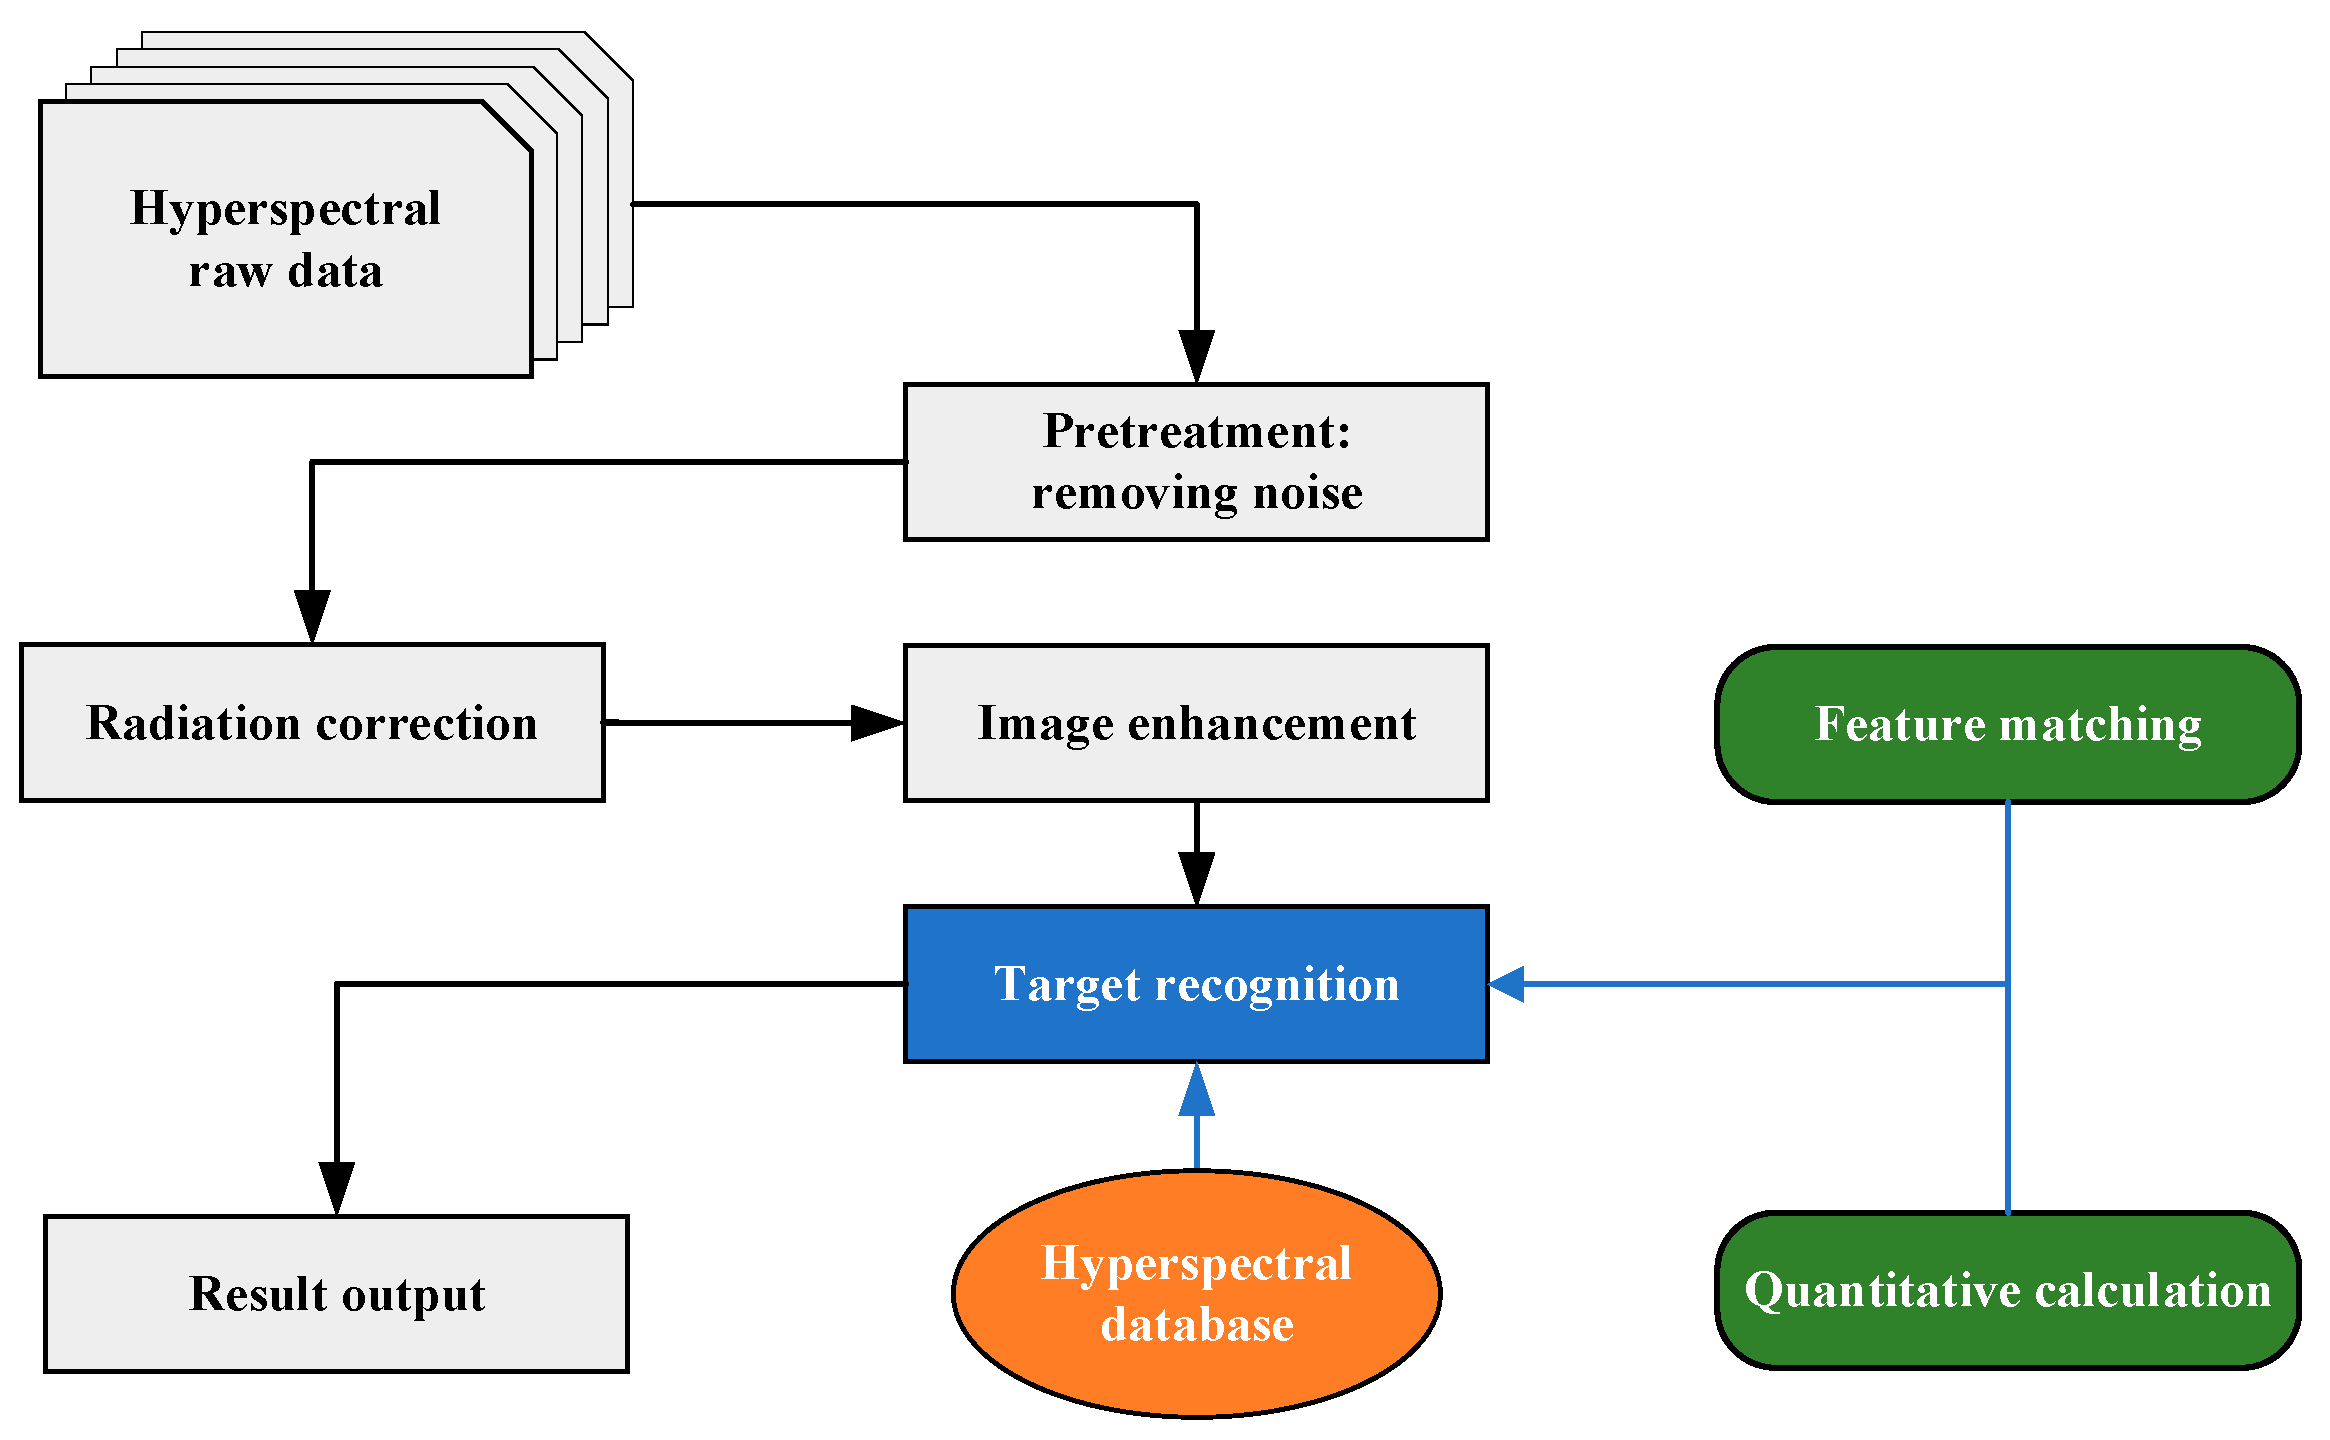
Through the method in Section 2.2 above, a spectral database of hazardous chemicals was established, and then hyperspectral images of the target samples were collected in the actual environment. The target hazardous chemicals were identified by analyzing the spectral characteristics of the spectral curve of hazardous chemicals in the actual environment and comparing them with that in the spectral database. The flowchart of the principle of the identification method is shown in Figure 5.
The extraction and identification of the spectral information of the hazardous chemicals began with spectral curve preprocessing. In the preprocessing of the spectral curve, smoothing or weighted smoothing was used to remove noise, and spectral characteristics were highlighted by the method of continuum removal. In addition, reflection characteristics were highlighted and the accuracy of identification was improved through radiometric calibration and image enhancement. Next, background and sample spectra were analyzed and compared to extract characteristic bands to determine the optimal combination of bands for later calculation. Finally, the known spectral data in the spectrum library and the target matching algorithm were used to identify hazardous chemicals, using either the spectral curve based on the whole waveform feature for matching, or using the spectral characteristics based on the band of interest for matching.
In this paper, firstly, the hazardous chemicals were identified and classified qualitatively based on the spectral curve of the whole waveform feature and the matching degree of the spectral characteristics of the band of interest. The specific method was to compare the spectral curve of any hazardous chemical in the actual environment with that of all samples in the spectral database one by one, and then find out the most similar spectral curve. As the samples in the spectral database were known, therefore, the hazardous chemicals could be identified according to the principle that the most similar spectral curve corresponded to the same sample. In order to further study the similarity of spectral curves from a quantitative point of view, a method to characterize the matching degree of spectral curves was proposed. In the same coordinate system, the more similar the shape of the spectral curve of the sample in the actual environment was to that in the spectral database, and the closer their reflectivity was, the smaller the area of the graph enclosed by the two curves was, indicating that the higher the matching degree of the two curves was. Based on this principle, the method to characterize the matching degree of spectral curves of hazardous chemicals by “area ratio” was proposed, as shown in Formula (1):
where p represents the matching degree of the spectral curves and the unit is “%”, Se represents the graph area formed by the spectral curve of the hazardous chemicals in the actual environment and the coordinate axis within the wavelength range in the coordinate system, and Sd represents the graph area formed by the spectral curve of the sample in the spectral database and the coordinate axis within the wavelength range in the coordinate system. Since the matching degree of the spectral curves was characterized by the ratio of graph area, the wavelength and reflectivity of horizontal and vertical coordinates could be treated as dimensionless in the calculation, and only the numerical value was considered, not the unit. Absolute value was used to calculate the area difference, which could eliminate the positive and negative compensation of some intersection areas. In addition, the cross coordinates (wavelength) of all curves were the same, so the “area ratio” was equivalent to the ratio of the difference of reflectivity to the reflectivity of the sample in the spectral database, which included two aspects of measurement, namely, the difference of reflectivity and the reflectivity value itself.
The above methods were suitable for the identification of hazardous chemicals with obvious spectral characteristics. For the hazardous chemicals with similar spectral curves, that is, the phenomenon of “different object with the same spectrum”, which is also a common problem faced by all spectrum matching methods, the color can be used as a reference indicator to assist in the identification and classification of hazardous chemicals. The color here referred to the appearance color of the sample itself, for example, the color of red phosphorus is reddish-brown, the color of corn starch is pale yellow, and the color of carbon powder is black. When establishing the spectral database, we considered that the appearance color of samples may be one of the characteristics used to identify different samples. In the actual environment, for unknown samples, the color of the samples could be obtained by taking photos with a common visible light camera, or by synthesizing the false-color image from the image collected by the hyperspectral imager. In short, the hazardous chemicals can be identified accurately and quickly by comprehensively considering all kinds of information.
3. Results and Discussion
3.1. Establishment of Spectral Database
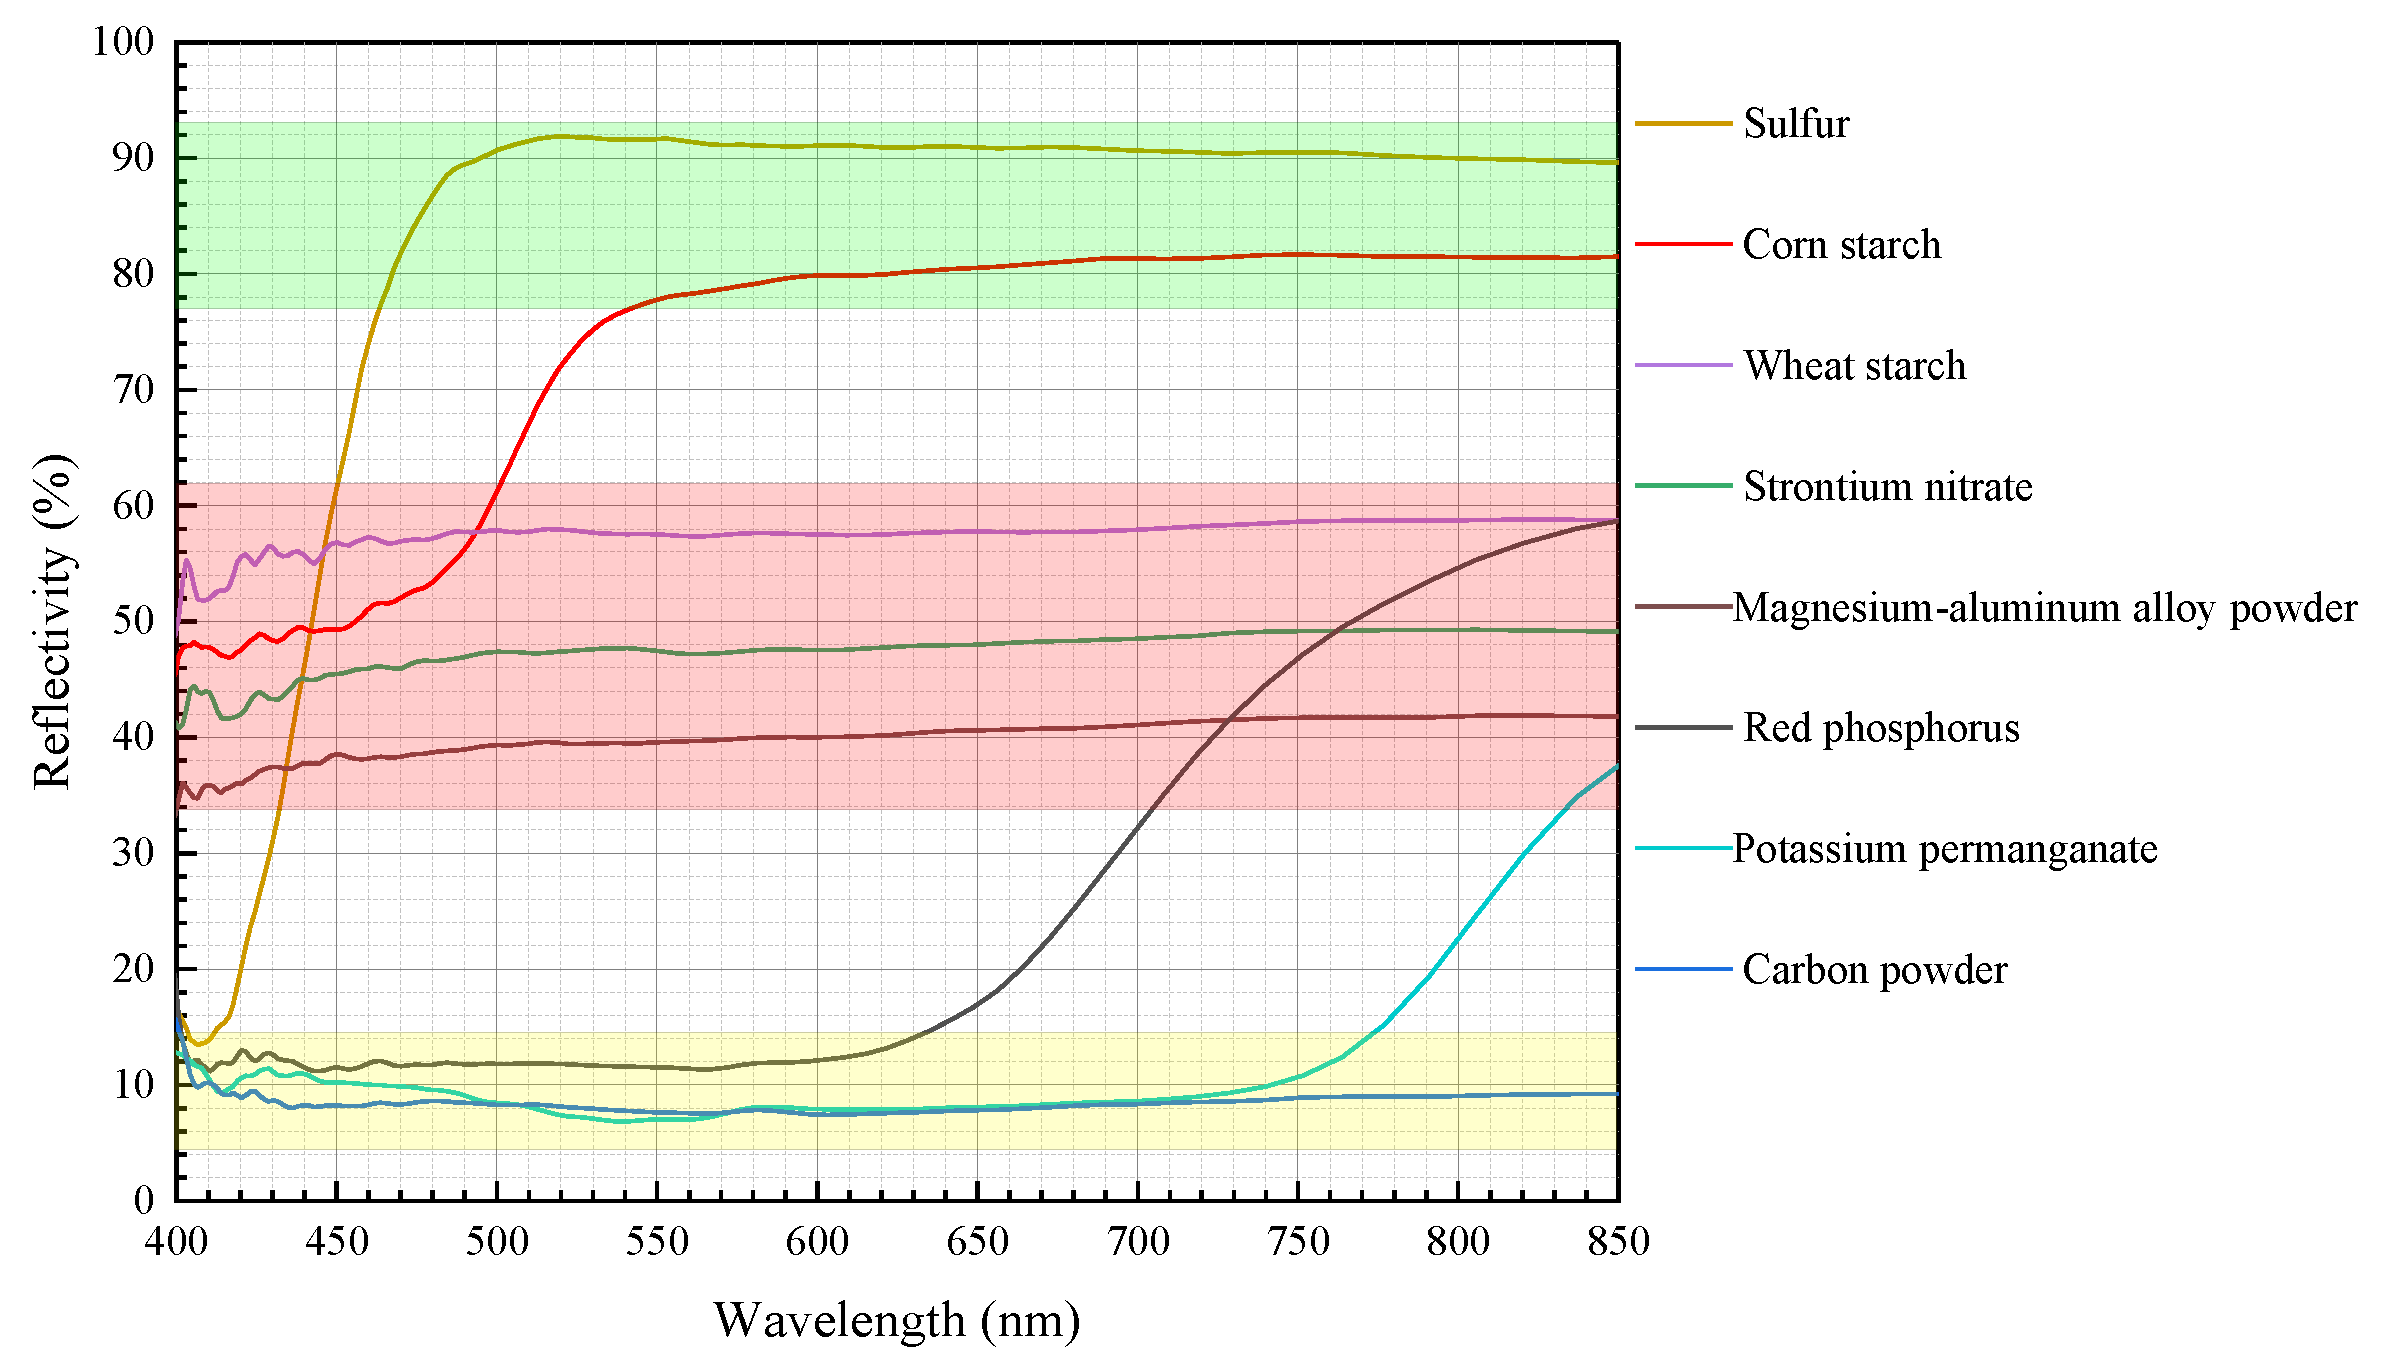
The establishment of the spectral database of known hazardous chemicals was the basis for the identification of hazardous chemicals. Figure 6 was the spectral curve of the samples studied in this paper in the spectral database. Therefore, for this paper, Figure 6 was the spectral database of the target samples.
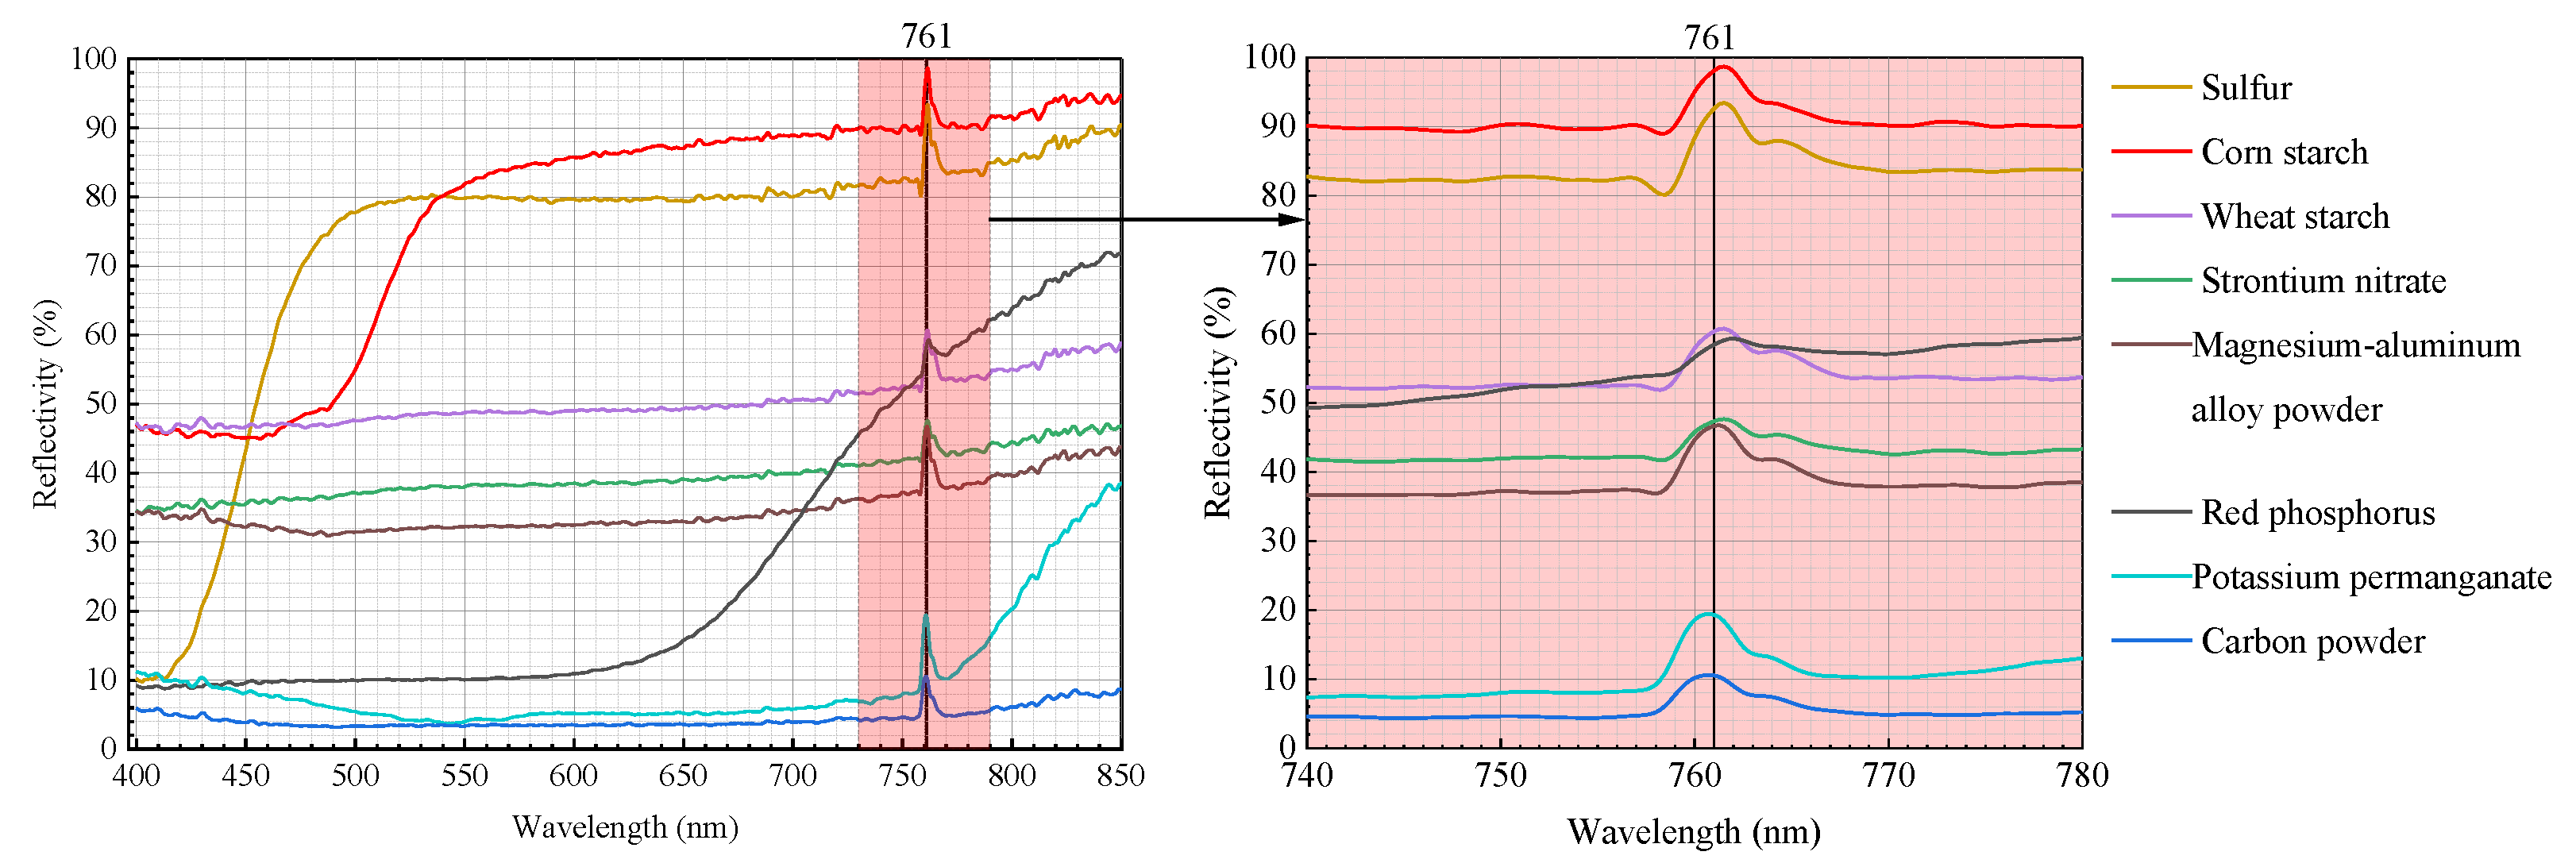
An analysis of the spectral curves in Figure 6 showed different spectral trends and spectral characteristics for different samples. For example, the reflectivity of sulfur in the visible light range increased rapidly with wavelength, and then the curve flattened at about 500 nm. The reflectivity of red phosphorus was low and basically stable in the range of 400–600 nm and slowly increased after 600 nm. Obvious spectral characteristics of sulfur, corn starch, red phosphorus, and potassium permanganate appeared around 500 nm, 550 nm, 600 nm, and 750 nm, respectively. The reflectivity of carbon powder was very low, less than 10% in the visible light range. The reflectivity values of strontium nitrate, wheat starch, and magnesium–aluminum alloy powder varied only slightly with wavelength. Notably, the reflectivity of magnesium–aluminum alloy powder first decreased and then increased with increasing wavelength. Generally speaking, the key characteristic wavelengths of different samples and their corresponding peaks were different, which can be used as one of the important bases for spectra matching. In summary, different samples had different spectral characteristics and curve-changing trends. This was due to the molecular or atomic structures of different hazardous chemicals were different, and the energy required for electronic transitions was different, resulting in different absorption or reflection of electromagnetic waves at different wavelengths. Macroscopically, different wavelengths corresponded to different reflectivity, and the reflectivity–wavelength curves of each hazardous chemical were different and unique, that was the principle of identifying hazardous chemicals through spectral curves.
Furthermore, it can be found from Figure 6 that the reflectivity of all samples had an “abnormal” peak between 750 nm and 770 nm (corresponding to a wavelength of about 761 nm), which was manifested as a sudden increase and then a sudden decrease in reflectivity, with a change of about 10%. Before and after the sudden change in reflectivity, the reflectivity of the samples was consistent with the trend of the curve, and there is no large difference due to the sudden change in reflectivity. The wavelength range corresponding to this phenomenon was about 750–770 nm, and the characteristic absorption peak of oxygen in the infrared region A-band is located at 760 nm. Therefore, this phenomenon may be caused by the oxygen absorption peak. In addition, this phenomenon was a common feature of all samples, so from the perspective of spectral matching, it would not interfere with the identification of target samples.
3.2. Spectral Data for the Hazardous Chemicals in the Actual Environment
Figure 7 shows the hyperspectral data cube of hazardous chemicals in the actual environment, including both the spatial information in the two-dimensional plane and the spectral information in the spectral dimension. The ENVI software was used to extract the spectral data of hazardous chemicals and whiteboard from the hyperspectral data cube (relationship curve between DN value and wavelength), and then the reflectivity of hazardous chemicals was calculated according to Formula (2). Finally, the reflectivity–wavelength spectral curves of hazardous chemicals were drawn, as shown in Figure 8.
where Rh represents the reflectivity of the hazardous chemicals, Rw represents the reflectivity of the whiteboard, and Dh and Dw represent the digital number (DN) values of the hazardous chemicals and the whiteboard, respectively.
Rh = (Dh/Dw) ∗ Rw
Through the comparison, it is found that the spectral curve of hazardous chemicals in the actual environment was consistent with that in the spectral database, which indicated that the spectral curve collected by the self-developed spectrometer in the actual environment was reliable. With the spectral data of hazardous chemicals in the actual environment, the identification and classification of hazardous chemicals can be further carried out by matching with the data in the spectral database. As described below, this article would study the identification and classification methods of hazardous chemicals from the perspective of qualitative, quantitative and color aided identification.
3.3. Identification of Hazardous Chemicals Based on Spectral Feature Matching
As mentioned earlier, the hazardous chemicals in the actual environment could be identified by comparing their spectral data with the spectral database. To better evaluate the degree of matching and improve the accuracy of identification, the spectral curves using the data from sulfur, red phosphorus, potassium permanganate and corn starch collected in the actual environment were overlaid with the spectral curves using data from the database, as shown in Figure 9. The spectral characteristics of sulfur, red phosphorus, potassium permanganate, and corn starch were obvious, and the reflectivity changes were significant. Moreover, the spectral characteristics and the trends of change in reflectivity shown in the overlay of the two curves are very similar. Therefore, these four hazardous chemicals can be identified by the way of matching the whole waveform and spectral characteristics.
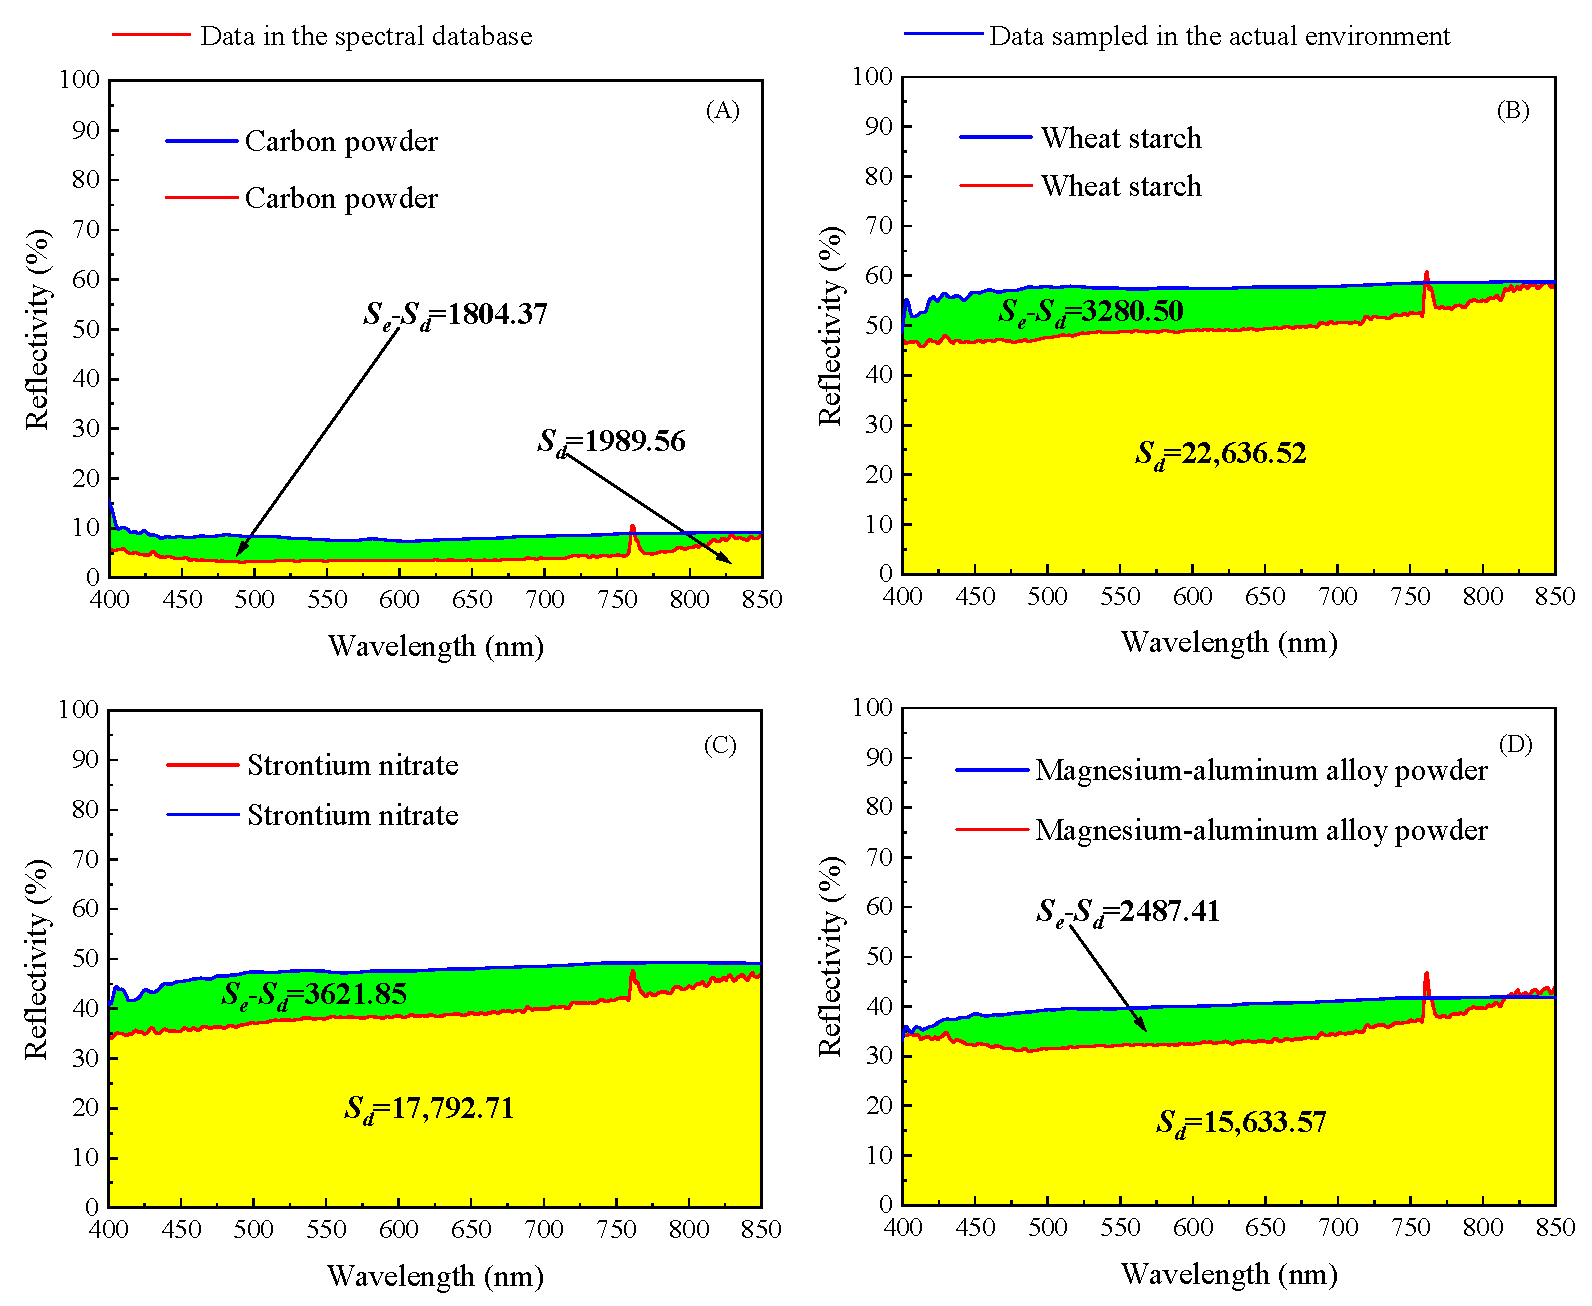
Similarly, the spectral curves using data from carbon powder, strontium nitrate, wheat starch and magnesium–aluminum alloy powder collected in the actual environment were overlaid with the spectral curves using data from the database, as shown in Figure 10. The spectral characteristics of carbon powder, strontium nitrate, wheat starch, and magnesium–aluminum alloy powder were not obvious, and there were no characteristic peaks, and no distinct changes in reflectivity with wavelength. Additionally, except for the reflectivity of the carbon powder target being maintained at a low level, the reflectivity values of the remaining three sample targets were relatively close. As a result, it was relatively difficult to identify only from spectral matching.
For these types of hazardous chemicals with relatively similar reflectivity–wavelength curves, strontium nitrate, wheat starch, and magnesium–aluminum alloy powder, a combination of reflectivity value and color can be additionally considered for identification. Magnesium–aluminum alloy powder is silver-grey, while strontium nitrate and wheat starch powders are white. Therefore, color can be used to distinguish magnesium–aluminum alloy powder from the other two. The reflectivity of wheat starch in the actual environment was about 50–60%, while the reflectivity of strontium nitrate was about 40–50%. Therefore, starch and strontium nitrate can be further distinguished via the reflectivity value. In short, various information should be comprehensively considered for the accurate identification of hazardous chemicals.
The samples fell into two categories, as the first group, sulfur, red phosphorus, potassium permanganate, and corn starch had differences in their spectral curves and their spectral characteristics, while the second group, carbon powder, strontium nitrate, wheat starch, and magnesium–aluminum alloy powder did not. Additionally, the two categories included a difference in color, with bright colors in the first group (light yellow, purple and red), while the second group was achromatic (black, white, gray). The correspondence between sample reflectivity and color is an interesting research topic, but is not the focus of this paper and thus is not discussed in detail.
3.4. Matching Degree of Spectral Curves of Hazardous Chemicals
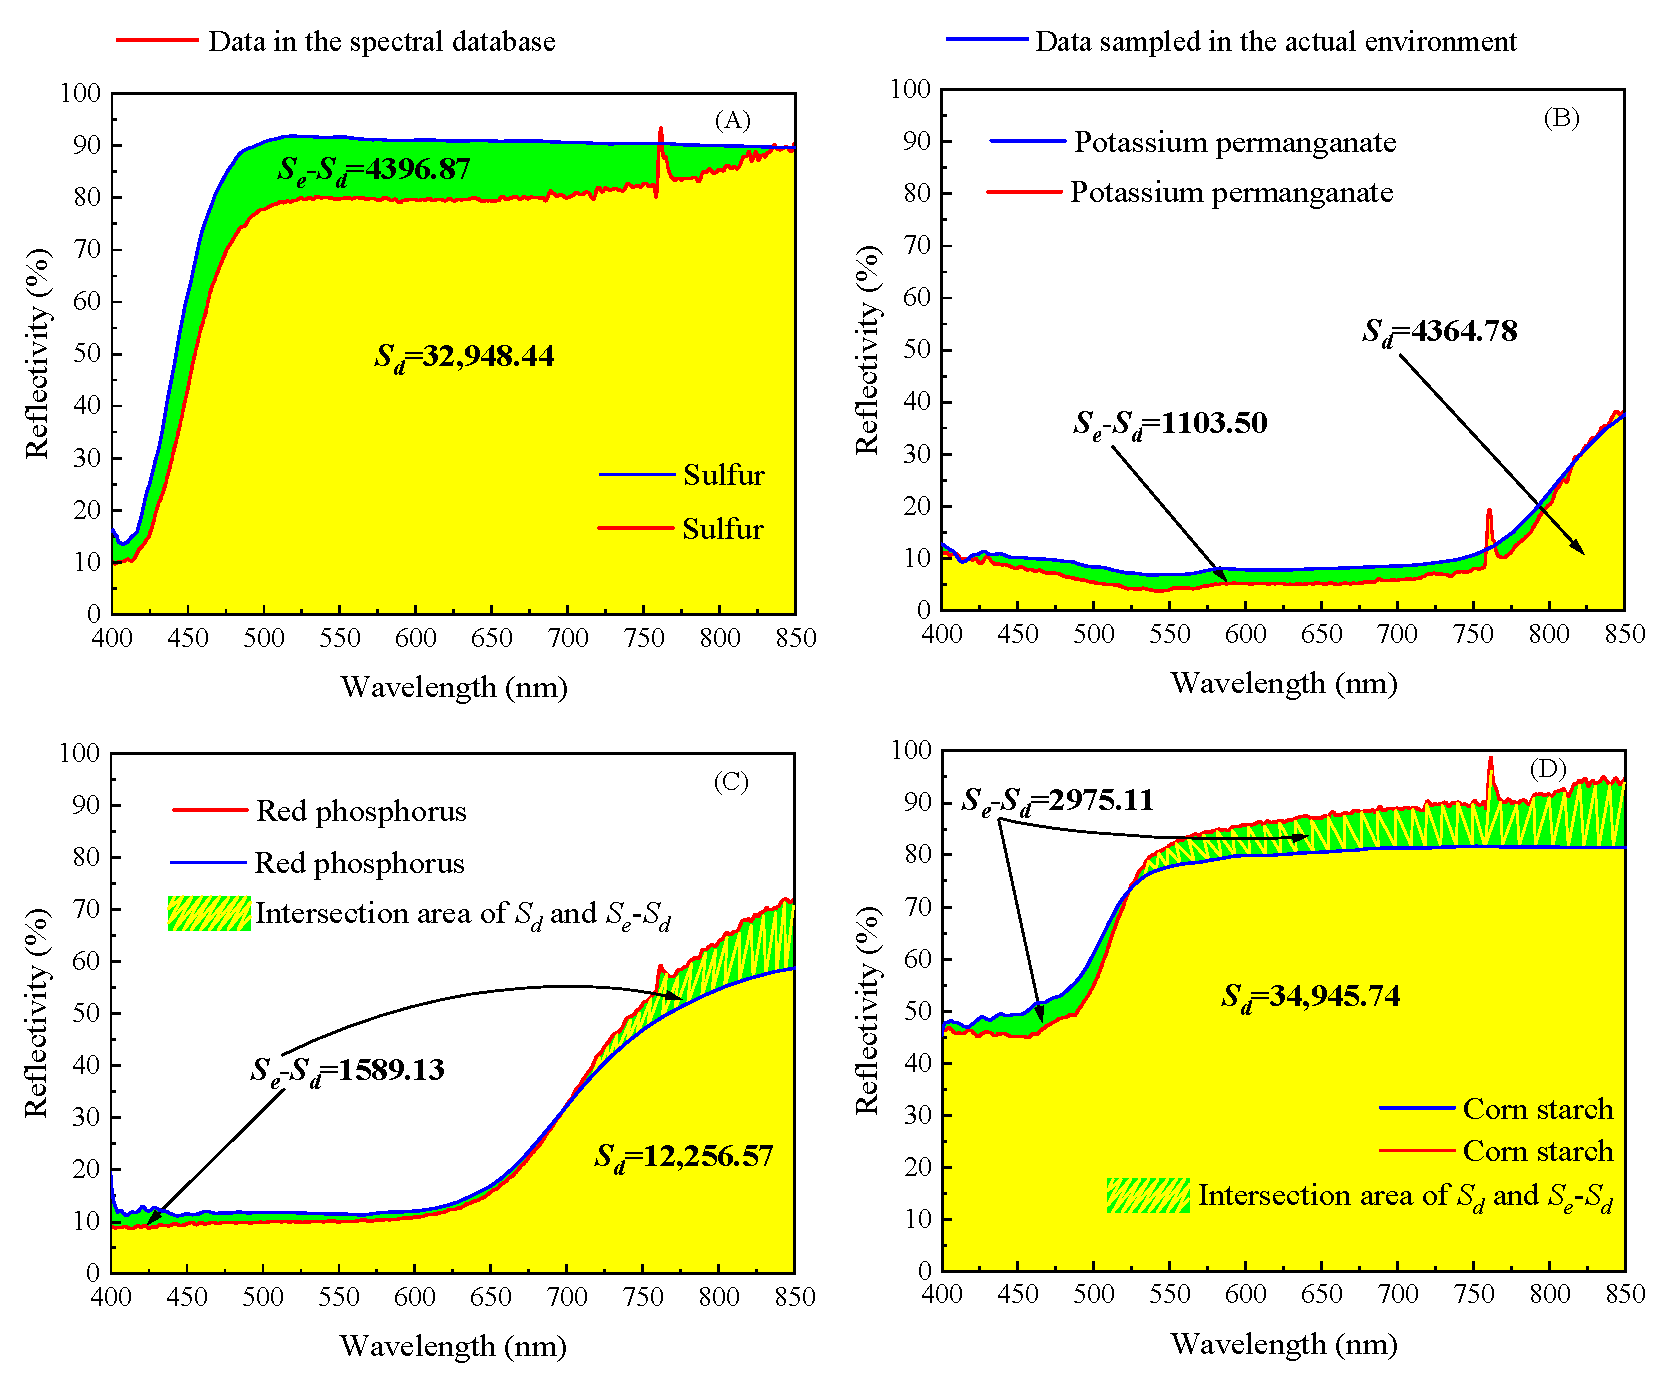
Based on the whole waveform and spectral characteristics matching method, hazardous chemicals were classified and identified from the perspective of qualitative description. Next, from the quantitative point of view, Formula (1) was used to characterize the matching degree of spectral curves of hazardous chemicals. Firstly, the area of the graph enclosed by the spectral curves of four kinds of hazardous chemicals (the first group, sulfur, red phosphorus, potassium permanganate, and corn starch) with obvious spectral characteristics was obtained. Here, the area could be directly calculated by integration with the help of Origin 2021b software, as shown in Figure 9. In the same way, the graph area enclosed by the spectral curves of the other four kinds of hazardous chemicals (the second group, carbon powder, strontium nitrate, wheat starch, and magnesium–aluminum alloy powder) with relatively insignificant spectral characteristics could be obtained, as shown in Figure 10. The matching degree of spectral curves of all hazardous chemicals can be obtained by Formula (1), as shown in Table 2.
From the analysis of the data in Table 2, it can be seen that in the first group of hazardous chemicals with obvious spectral characteristics, three hazardous chemicals had relatively high matching degrees of spectral curves, which are 86.66% of sulfur, 87.03% of red phosphorus, and 91.49% of corn starch with the highest matching degree. The matching degree of the above three kinds of hazardous chemicals (except Potassium permanganate) was higher than that of the second group (carbon powder, strontium nitrate, wheat starch, and magnesium–aluminum alloy powder) with relatively insignificant spectral characteristics. In addition, among all hazardous chemicals, carbon powder had the lowest matching degree of 9.31%, followed by potassium permanganate with 74.72%. It is worth noting that the reflectivity of these two hazardous chemicals was also the smallest. Furthermore, in terms of the relationship between matching degree and reflectivity, it can be known by calculation that for the four hazardous chemicals with obvious spectral characteristics, sulfur, red phosphorus, potassium permanganate, and corn starch, the matching degree of their spectral curves was positively correlated with their reflectivity.
4. Conclusions
The long-distance and non-contact detection and identification of hazardous chemicals based on hyperspectral imaging are important emergent means for the prevention of explosion accidents and the early warning of secondary hazards. In the study, we explored the possibility of detecting and identifying hazardous chemicals using hyperspectral imaging, and draw the following conclusions:
- The four hazardous chemicals of sulfur, red phosphorus, potassium permanganate and corn starch had bright colors, obvious spectral curve characteristics, and obvious changes in reflectivity with wavelength. They were relatively easy to identify through the whole waveform and spectral characteristics matching method, although the relationship between the richness of sample color and the spectral characteristics needs to be further studied.
- The spectral characteristics of the targets carbon powder, strontium nitrate, wheat starch, and magnesium–aluminum alloy powder were not obvious, with no characteristic peaks, and no distinct changes in reflectivity with wavelength. Moreover, except for the reflectivity of the target carbon powder remaining at a low level, the reflectivity values of the remaining three sample targets were relatively close and it was difficult to identify them only from spectral matching. For these types of hazardous chemicals with similar reflectivity–wavelength curves, a combination of reflectivity value and color should be additionally considered for further identification.
- A quantitative method to characterize the matching degree of the spectral curves of hazardous chemicals was proposed, which can well characterize the matching degree of the spectral curves with the consideration of the difference between the reflectivity of the spectral curves and the reflectivity of the sample in the spectral database. It can be known by calculation that for the four hazardous chemicals with obvious spectral characteristics, sulfur, red phosphorus, potassium permanganate, and corn starch, the matching degree of their spectral curves was positively correlated with their reflectivity.
- In summary, this research provided a means and method to identify hazardous chemicals using hyperspectral imaging and comparison of spectral characteristics, and demonstrated its feasibility and presented identification results. Moreover, the spectral matching degree of hazardous chemicals was characterized by a quantitative method. Based on this, a certain theoretical framework and experimental results are established, which are of great significance for the detection and early warning of hazardous chemicals and expansion of the applications of hyperspectral imaging. Future works can focus on further increasing the types of typical hazardous chemicals to expand the spectral database.
Author Contributions
Conceptualization, Y.S., X.Q. and Y.L.; investigation, Y.S. and M.Y.; methodology, Y.L. and J.W.; visualization, Y.S., J.W. and Q.L.; writing—original draft, Y.S. and X.Q.; funding acquisition, X.Q.; writing—review and editing, M.Y., Y.L., J.W. and Q.L. All authors have read and agreed to the published version of the manuscript.
Funding
This research was funded by the National Key R&D Program of China (Grant Nos.: 2018YFC0809900, 2017YFC0804700).
Data Availability Statement
The authors confirm that the data supporting the findings of this study are available within the article.
Conflicts of Interest
The authors declare no conflict of interest.
References
- Yang, S.; Fan, W.; Cheng, H.; Gong, Z.; Wang, D.; Fan, M.; Huang, B. A dual functional cotton swab sensor for rapid on-site naked-eye sensing of nitro explosives on surfaces. Microchem. J. 2020, 159, 105398. [Google Scholar] [CrossRef]
- Hay, C.E.; Lee, J.; Silvester, D.S. A methodology to detect explosive residues using a gelled ionic liquid based field-deployable electrochemical device. J. Electroanal. Chem. 2020, 872, 114046. [Google Scholar] [CrossRef]
- Schachel, T.D.; Stork, A.; Schulte-Ladbeck, R.; Vielhaber, T.; Karst, U. Identification and differentiation of commercial and military explosives via high performance liquid chromatography–high resolution mass spectrometry (HPLC-HRMS), X-ray diffractometry (XRD) and X-ray fluorescence spectroscopy (XRF): Towards a forensic s. Forensic Sci. Int. 2020, 308, 110180. [Google Scholar] [CrossRef]
- Hossny, K.; Magdi, S.; Soliman, A.Y.; Hossny, A.H. Detecting explosives by PGNAA using KNN Regressors and decision tree classifier: A proof of concept. Prog. Nucl. Energy 2020, 124, 103332. [Google Scholar] [CrossRef]
- Al-Mousawi, A.J. Magnetic Explosives Detection System (MEDS) based on wireless sensor network and machine learning. Measurement 2020, 151, 107112. [Google Scholar] [CrossRef]
- Zhao, Y.; Guan, Q.L.; Bai, F.Y.; Xing, Y.H.; Sun, L.X. An inorganic-organic hydrogen cluster: Fluorescence response of the high efficient detection of Fe3+, OH− and nitro explosives. J. Mol. Struct. 2021, 1225, 129115. [Google Scholar] [CrossRef]
- Frazier, J.; Benefield, V.; Zhang, M. Practical investigation of direct analysis in real time mass spectrometry for fast screening of explosives. Forensic Chem. 2020, 18, 100233. [Google Scholar] [CrossRef]
- Diaz, D.; Hahn, D.W. Raman spectroscopy for detection of ammonium nitrate as an explosive precursor used in improvised explosive devices. Spectrochim. Acta Part A Mol. Biomol. Spectrosc. 2020, 233, 118204. [Google Scholar] [CrossRef]
- Kumari, A.; Chaudhary, A.K.; Rajasekhar, K. Study of charge transfer mechanism of PEDOT polymer for detection of solid TEX and CL-20 explosives using pulsed photoacoustic technique. Spectrochim. Acta Part A Mol. Biomol. Spectrosc. 2020, 241, 118597. [Google Scholar] [CrossRef]
- Elbasuney, S.; El-Sharkawy, Y.H.; El-Sayyad, G.S.; Gobara, M. Surface modified colloidal silica nanoparticles: Novel aspect for complete identification of explosive materials. Talanta 2020, 211, 120695. [Google Scholar] [CrossRef] [PubMed]
- Gulia, S.; Gulati, K.K.; Gambhir, V.; Sharma, R.; Reddy, M.N. Trace detection of explosive and their derivatives in stand-off mode using time gated Raman spectroscopy. Vib. Spectrosc. 2016, 87, 207–214. [Google Scholar] [CrossRef]
- Hewitt, A.D.; Jenkins, T.F.; Ranney, T.A. On-site gas chromatographic determination of explosives in soils. Field Anal. Chem. Technol. 2001, 5, 228–238. [Google Scholar] [CrossRef]
- Klapec, D.J.; Czarnopys, G.; Pannuto, J. Interpol review of detection and characterization of explosives and explosives residues 2016–2019. Forensic Sci. Int. Synerg. 2020, 2, 670–700. [Google Scholar] [CrossRef]
- Liszewska, M.; Bartosewicz, B.; Budner, B.; Nasiłowska, B.; Szala, M.; Weyher, J.L.; Dzięcielewski, I.; Mierczyk, Z.; Jankiewicz, B.J. Evaluation of selected SERS substrates for trace detection of explosive materials using portable Raman systems. Vib. Spectrosc. 2019, 100, 79–85. [Google Scholar] [CrossRef]
- Wang, M.; Wang, C.; Ma, R. Explosive detection and identification using X-ray fluorescence and thermal fingerprint of silica encapsulated nanoparticles. Colloids Surfaces A Physicochem. Eng. Asp. 2020, 601, 125027. [Google Scholar] [CrossRef]
- Wojtas, J.; Bogdanowicz, R.; Kamienska Duda, A.; Pietrzyk, B.; Sobaszek, M.; Prasuła, P.; Dettlaff, A.; Achtenberg, K. Fast-response optoelectronic detection of explosives’ residues from the nitroaromatic compounds detonation: Field studies approach. Measurement 2020, 162, 107925. [Google Scholar] [CrossRef]
- Zhao, X.; Wang, W.; Ni, X.; Chu, X.; Li, Y.-F.; Lu, C. Utilising near-infrared hyperspectral imaging to detect low-level peanut powder contamination of whole wheat flour. Biosyst. Eng. 2019, 184, 55–68. [Google Scholar] [CrossRef]
- Abdulridha, J.; Ampatzidis, Y.; Roberts, P.; Kakarla, S.C. Detecting powdery mildew disease in squash at different stages using UAV-based hyperspectral imaging and artificial intelligence. Biosyst. Eng. 2020, 197, 135–148. [Google Scholar] [CrossRef]
- Arellano, P.; Tansey, K.; Balzter, H.; Boyd, D.S. Detecting the effects of hydrocarbon pollution in the Amazon forest using hyperspectral satellite images. Environ. Pollut. 2015, 205, 225–239. [Google Scholar] [CrossRef]
- Zhang, J.; Pu, R.; Huang, W.; Yuan, L.; Luo, J.; Wang, J. Using in-situ hyperspectral data for detecting and discriminating yellow rust disease from nutrient stresses. Field Crop. Res. 2012, 134, 165–174. [Google Scholar] [CrossRef]
- Jiang, H.; Jiang, X.; Ru, Y.; Wang, J.; Xu, L.; Zhou, H. Application of hyperspectral imaging for detecting and visualizing leaf lard adulteration in minced pork. Infrared Phys. Technol. 2020, 110, 103467. [Google Scholar] [CrossRef]
- Wang, W.; Lawrence, K.C.; Ni, X.; Yoon, S.-C.; Heitschmidt, G.W.; Feldner, P. Near-infrared hyperspectral imaging for detecting Aflatoxin B1 of maize kernels. Food Control 2015, 51, 347–355. [Google Scholar] [CrossRef]
- Shao, Y.; Li, Y.; Jiang, L.; Pan, J.; He, Y.; Dou, X. Identification of pesticide varieties by detecting characteristics of Chlorella pyrenoidosa using Visible/Near infrared hyperspectral imaging and Raman microspectroscopy technology. Water Res. 2016, 104, 432–440. [Google Scholar] [CrossRef] [PubMed]
- Wu, N.; Jiang, H.; Bao, Y.; Zhang, C.; Zhang, J.; Song, W.; Zhao, Y.; Mi, C.; He, Y.; Liu, F. Practicability investigation of using near-infrared hyperspectral imaging to detect rice kernels infected with rice false smut in different conditions. Sensors Actuators B Chem. 2020, 308, 127696. [Google Scholar] [CrossRef]
- Mehdorn, M.; Köhler, H.; Rabe, S.M.; Niebisch, S.; Lyros, O.; Chalopin, C.; Gockel, I.; Jansen-Winkeln, B. Hyperspectral Imaging (HSI) in Acute Mesenteric Ischemia to Detect Intestinal Perfusion Deficits. J. Surg. Res. 2020, 254, 7–15. [Google Scholar] [CrossRef]
- Yang, C.; Lee, W.S.; Gader, P. Hyperspectral band selection for detecting different blueberry fruit maturity stages. Comput. Electron. Agric. 2014, 109, 23–31. [Google Scholar] [CrossRef]
- Gao, J.; Ni, J.; Wang, D.; Deng, L.; Li, J.; Han, Z. Pixel-level aflatoxin detecting in maize based on feature selection and hyperspectral imaging. Spectrochim. Acta Part A Mol. Biomol. Spectrosc. 2020, 234, 118269. [Google Scholar] [CrossRef] [PubMed]
- Dubroca, T.; Brown, G.; Hummel, R.E. Detection of explosives by differential hyperspectral imaging. Opt. Eng. 2014, 53, 21112. [Google Scholar] [CrossRef] [Green Version]
- Ayoub, H.S.; El-Sherif, A.F.; Elbeih, A. Hyperspectral imaging and remote trace detection of cis-1,3,4,6-tetranitrooctahydroimidazo-[4,5d] imidazole (BCHMX) compared with traditional explosives using laser induced fluorescence. Def. Technol. 2020, in press. [Google Scholar] [CrossRef]
- Blake, T.A.; Kelly, J.F.; Gallagher, N.B.; Gassman, P.L.; Johnson, T.J. Passive standoff detection of RDX residues on metal surfaces via infrared hyperspectral imaging. Anal. Bioanal. Chem. 2009, 395, 337–348. [Google Scholar] [CrossRef]
- Bernacki, B.E.; Blake, T.A.; Mendoza, A.; Johnson, T.J. Visible hyperspectral imaging for standoff detection of explosives on surfaces. Proc. SPIE 2010, 7838, 78380C. [Google Scholar]
Figure 1.
Target plate for making hazardous chemical targets.

Figure 2.
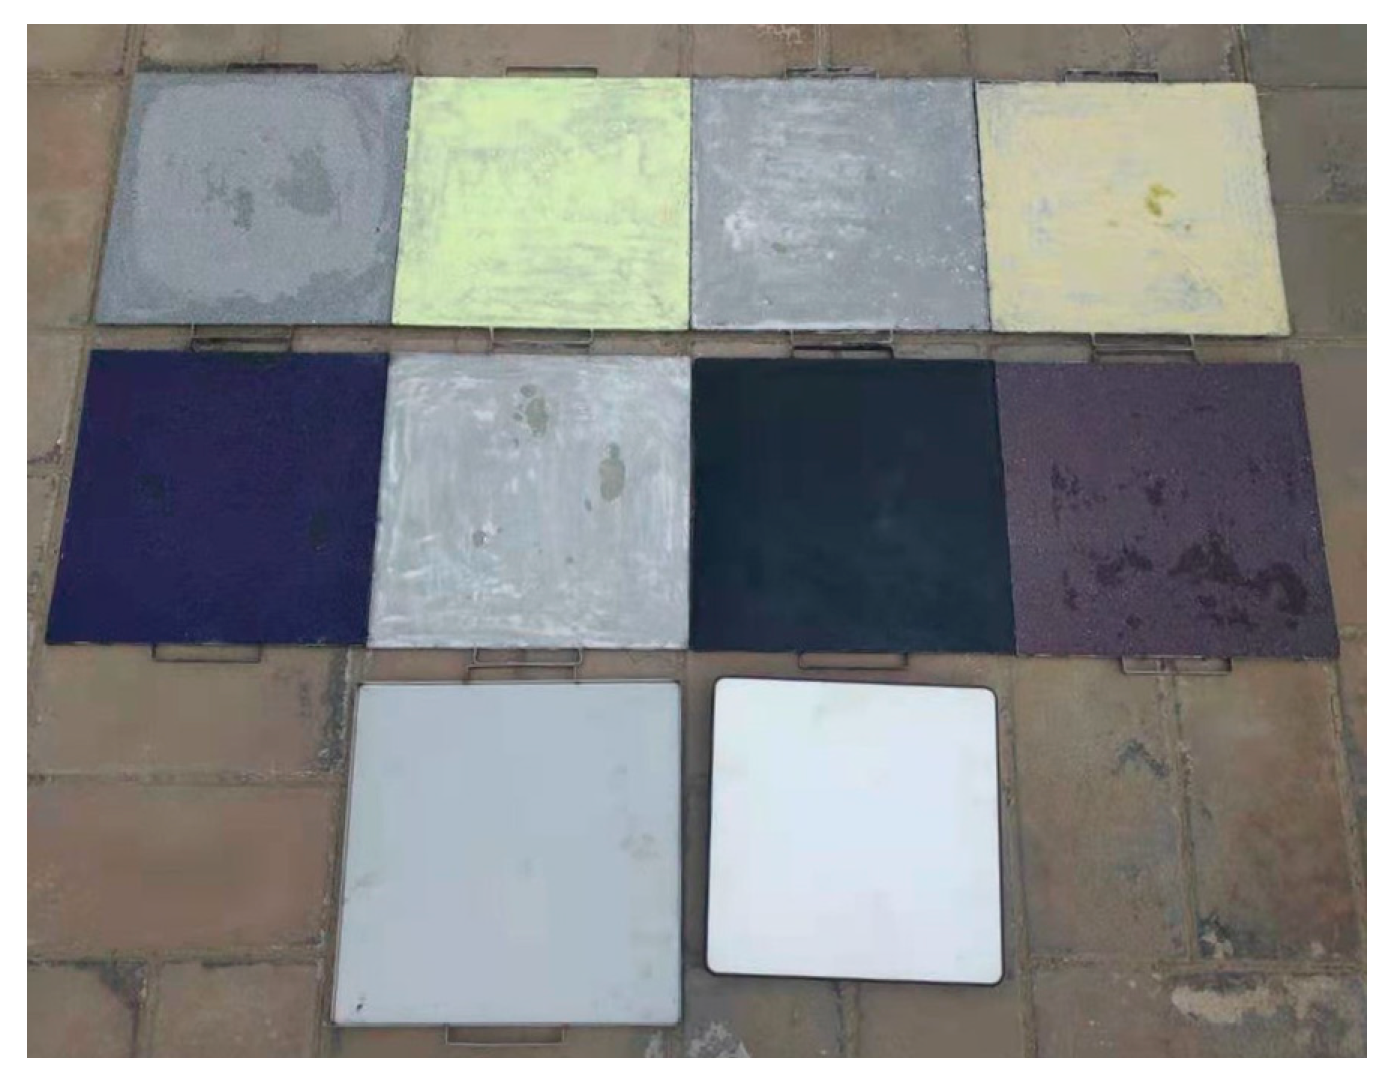
Targets of hazardous chemicals in the actual environment: Red phosphorus, Corn starch, Carbon powder, Strontium nitrate, Wheat starch, Sulfur, Potassium permanganate, Magnesium-aluminum alloy powder.
Figure 2.
Targets of hazardous chemicals in the actual environment: Red phosphorus, Corn starch, Carbon powder, Strontium nitrate, Wheat starch, Sulfur, Potassium permanganate, Magnesium-aluminum alloy powder.

Figure 3.
Schematic diagram of data collection of the spectral database of hazardous chemicals.

Figure 4.
Schematic diagram of the spectrum data collection of hazardous chemical targets in the actual environment.
Figure 4.
Schematic diagram of the spectrum data collection of hazardous chemical targets in the actual environment.

Figure 5.
Flowchart of the principle of identifying hazardous chemicals.

Figure 6.
Spectral curves of hazardous chemicals in the spectral database.

Figure 7.
Hyperspectral data cube of hazardous chemicals in the actual environment.

Figure 8.
Reflectivity–wavelength spectral curves of hazardous chemicals in the actual environment.

Figure 9.
Matching degree of spectral curves of hazardous chemicals: (A) for sulfur, (B) for potassium permanganate, (C) for red phosphorus, and (D) for corn starch.
Figure 9.
Matching degree of spectral curves of hazardous chemicals: (A) for sulfur, (B) for potassium permanganate, (C) for red phosphorus, and (D) for corn starch.

Figure 10.
Matching degree of spectral curves of hazardous chemicals: (A) for carbon powder, (B) for wheat starch, (C) for strontium nitrate, and (D) for magnesium–aluminum alloy powder.
Figure 10.
Matching degree of spectral curves of hazardous chemicals: (A) for carbon powder, (B) for wheat starch, (C) for strontium nitrate, and (D) for magnesium–aluminum alloy powder.


Table 1.
Physical properties of the hazardous chemicals.
| No. | Sample | Density (g·cm−3) | Color | Purity |
|---|---|---|---|---|
| 1 | Red phosphorus | 2.34 | Reddish-brown | AR |
| 2 | Corn starch | 0.55 | Pale yellow | LR |
| 3 | Carbon powder | 0.45 | Black | AR |
| 4 | Strontium nitrate | 2.99 | White | AR |
| 5 | Wheat starch | 0.48 | White | LR |
| 6 | Sulfur | 2.07 | Yellow | CP |
| 7 | Potassium permanganate | 2.70 | Black purple | AR |
| 8 | Magnesium–aluminum alloy powder | 2.66 | Silver gray | CP |
Table 2.
Matching degree of spectral curves of hazardous chemicals.
| No. | Hazardous Chemicals | Se-Sd | Sd | p |
|---|---|---|---|---|
| 1 | Sulfur | 4396.87 | 32,948.44 | 86.66% |
| 2 | Potassium permanganate | 1103.50 | 4364.78 | 74.72% |
| 3 | Red phosphorus | 1589.13 | 12,256.57 | 87.03% |
| 4 | Corn starch | 2975.11 | 34,945.74 | 91.49% |
| 5 | Carbon powder | 1804.37 | 1989.56 | 9.31% |
| 6 | Wheat starch | 3280.50 | 22,636.52 | 85.51% |
| 7 | Strontium nitrate | 3621.85 | 17,792.71 | 79.64% |
| 8 | Magnesium–aluminum alloy powder | 2487.41 | 15,633.57 | 84.09% |
Publisher’s Note: MDPI stays neutral with regard to jurisdictional claims in published maps and institutional affiliations. |
© 2021 by the authors. Licensee MDPI, Basel, Switzerland. This article is an open access article distributed under the terms and conditions of the Creative Commons Attribution (CC BY) license (https://creativecommons.org/licenses/by/4.0/).
Share and Cite
MDPI and ACS Style
Sun, Y.; Qian, X.; Liu, Y.; Wang, J.; Lv, Q.; Yuan, M. Identification of Typical Solid Hazardous Chemicals Based on Hyperspectral Imaging. Remote Sens. 2021, 13, 2608. https://0-doi-org.brum.beds.ac.uk/10.3390/rs13132608
AMA Style
Sun Y, Qian X, Liu Y, Wang J, Lv Q, Yuan M. Identification of Typical Solid Hazardous Chemicals Based on Hyperspectral Imaging. Remote Sensing. 2021; 13(13):2608. https://0-doi-org.brum.beds.ac.uk/10.3390/rs13132608
Chicago/Turabian StyleSun, Yanlong, Xinming Qian, Yangyang Liu, Jianwei Wang, Qunbo Lv, and Mengqi Yuan. 2021. "Identification of Typical Solid Hazardous Chemicals Based on Hyperspectral Imaging" Remote Sensing 13, no. 13: 2608. https://0-doi-org.brum.beds.ac.uk/10.3390/rs13132608
Note that from the first issue of 2016, this journal uses article numbers instead of page numbers. See further details here.