1. Introduction
Pests and disease are the main causes of yield loss and reduced grain quality in global agriculture production. In addition to economic losses, pests and diseases can also endanger global food security [
1,
2]. Pesticide application following the onset of infestation is an effective method of pest control; however, the timing of pesticide application is very important and can directly impact the outcome. In addition, abuse of pesticides will increase the economic cost for farmers and cause environmental pollution (such as water and soil pollution) [
1,
3]. Therefore, an automated and nondestructive approach to monitoring crop pests is urgently needed to support sustainable agricultural production by reducing the application of pesticides and chemical fertilizers [
4].
The development of remote sensing technology brings a promising solution for pest and disease monitoring that is favored by more researchers and farming communities [
5,
6,
7,
8]. Researchers used unmanned aerial vehicle (UAV) RGB images combined with machine learning algorithms to identify yellow sigatoka in banana and achieved satisfactory accuracy [
9]. In addition to UAV RGB images, UAV multispectral images are also widely used in pest and disease monitoring. Several studies on the use of UAV multispectral remote sensing for spatiotemporal monitoring of wheat yellow rust achieved excellent accuracy [
1,
10]. In addition to UAV RGB images and multispectral remote sensing data, hyperspectral remote sensing technology is also an effective means of monitoring crop diseases and pests. Based on hyperspectral data, scholars have done a lot of research and achieved encouraging results [
11,
12,
13,
14]. However, in studies that monitor crop diseases and pests based on hyperspectral data, the data are mostly collected by field spectroradiometers, and UAV hyperspectral imagery is rare, which makes it difficult to obtain the spatial distribution of crop diseases and pests over large areas. Furthermore, it is difficult to evaluate the potential of using UAV hyperspectral remote sensing data in the monitoring of crop diseases and pests.
In addition, the crops in previous studies have usually been inoculated with diseases or insect inoculum, which can make the degree of infection relatively uniform. However, in natural settings, crop diseases and pests usually originate from one place and then spread to other areas. Among the existing methods for monitoring crop diseases and insect pests, spectral indices and spectral reflectance combined with threshold segmentation [
11] or machine learning technology, especially random forest (RF) [
1,
10,
12], convolutional neural network (CNN) [
13], maximum likelihood classifier (MLC) [
15], and support vector machine (SVM) [
14], are gaining popularity. In summary, spectral indices are commonly used to monitor crop diseases and pests, and machine learning is a popular technology in such monitoring.
There have been various studies on pests and diseases covering a wide range of crops, such as wheat yellow rust [
1,
10], fusarium head blight in wheat [
16],
Pyricularia grisea Sacc,
Bipolaris oryzae Shoem,
Aphelenchoides besseyi Christie, and
Cnaphalocrocis medinalis Guen in rice [
17], phaeosphaeria and leaf spot infestation in maize [
12], Huang Long Bing in citrus [
18], and yellow leaf curl disease in tomato [
11]. However, studies on the use of remote sensing technology to monitor rice false smut have been limited [
19]. In recent years, rice false smut, caused by
Ustilaginoidea virens, has become one of the most severe diseases worldwide [
20,
21,
22,
23,
24]. Especially in China, Japan, India, and the USA, rice false smut has been reported as a devastating disease [
19,
21]. The few studies on monitoring this disease by remote sensing technology [
19,
25] mainly relied on in situ hyperspectral data, which makes it difficult to obtain continuous spatial distribution information. The development of UAV hyperspectral technology would make it possible to monitor rice false smut in time and space.
In summary, there are some research issues and operational gaps in monitoring rice false smut. Primarily, there is little or no research on UAV remote sensing technology, which not only makes it difficult to obtain spatiotemporal distribution information but also means that monitoring methods based on UAV imagery have not been developed. Therefore, this study was designed to achieve two objectives: (1) explore the potential of using UAV hyperspectral remote sensing data to extract areas of rice false smut infection, and (2) investigate and compare the performance of two methods, based on spectral similarity analysis and on spectral and temporal features.
2. Materials and Methods
2.1. Experimental Design and UAV Flight Campaigns
Field experiments were conducted at the Modern Agricultural Science and Technology Innovation Demonstration Park of Sichuan Academy of Agricultural Sciences, Chengdu, Sichuan, China. In the experimental field, the planting density of rice is 26.67 cm × 20.00 cm. All rice received the same irrigation and field management. In this study, the rice cultivar for extracting areas of rice false smut infection was You Liang You 2152.
The hyperspectral imaging sensor (Nano-Hyperspec®, Headwall, Bolton, MA, USA), some technical properties of which are listed in
Table 1, integrated with three groups of GNSS/IMU inertial navigation systems and combined with one PAN/TILT (Ronin-MX, SZ DJI Technology Co., Ltd., Shenzhen, China), was mounted on a UAV (Matric 600 Pro, SZ DJI Technology Co., Ltd., Shenzhen, China) to capture the hyperspectral information of rice from 10:00–14:00 during the growing season (from milk ripening to yellow maturity stage). The UAV imaging system is shown in
Figure 1.
Table 2 shows some information about the four UAV field campaigns. In all four campaigns, the flight altitude was 100 m above the ground and the spatial resolution of the UAV hyperspectral imagery was about 9.2 cm. The flight speed depends on the exposure time of the imaging sensor (see Equation (1)), and the exposure time depends on the intensity of sunlight at the time of imaging. The process of setting the exposure time is as follows: First, the hyperspectral imaging sensor is opened and the lens of the sensor is aligned with the calibration tarp. Then, the exposure time is adjusted until the DN value of the sensor is around 70% of the sensor’s measurable range, so as to avoid overexposure.
here, v is the flight speed of the UAV imaging system, t is the exposure time,
FOV is the field of view,
h is the flight altitude, and n is the number of pixels per row.
Before each fight, a calibration tarp with an average reflectance of 32% was placed on the ground within the flight path for radiometric calibration. The hyperspectral imagery acquired by the UAV was preprocessed, which includes radiometric calibration and geometric correction. Spectral smoothing was also performed using the Savitzky–Golay (S–G) [
26] filter to remove high-frequency noise. In this study, the order and window size of the S–G filter were 2 and 5, respectively.
Figure 2 shows the effects of the S–G filter.
2.2. Field Investigation
In this study, healthy and infected areas were identified by visual interpretation; rice was infected with rice false smut derived from natural settings, and no false inoculum was introduced. The acquisition date of the infected area was 14 August 2020 (one area was infected on that date, which indicates it was also infected after that date), that is, we collected the shape file of the infected area on 14 August 2020, and at the same time, obtained the shape files on the other three dates. The acquisition date of the healthy area was 2 September 2020 (one area was healthy on that date, which indicates it was also healthy before that date), that is, we collected the shape file of the healthy area on 2 September 2020, and at the same time, obtained the shape files on the other three dates.
Figure 3 shows the results of the field investigation, which includes healthy and infected areas. In the figure, healthy areas are marked in green and infected areas in red. The center coordinates of the experimental field are Lat: 30°47′13″, Lon: 104°12′16″.
The chlorophyll content (often represented by the soil–plant analysis development (SPAD) value [
27]) of rice was collected. In this study, a SPAD meter (SPAD-502 Plus, Konica Minolta Sensing Inc., Osaka, Japan) was used to collect measurements of the light absorption of the leaves at two wavelengths, 650 and 940 nm, in order to obtain SPAD values. Six leaves from the top layer of each sample were selected. For each leaf, two SPAD values were obtained; the SPAD value of one sample is the average of 12 measurements [
27,
28].
2.3. Spectral Analysis of Rice False Smut
In this section, the analysis of the sensitivity of each spectral band to rice false smut and the identifications of the ranges of sensitive wavelengths are presented.
When a crop is infected by disease, its structure, moisture, morphology, and pigment will change. Subsequently, the spectral response curve of the crop will also change [
4,
29,
30,
31]. It is worth noting that because the spectral changes caused by crop disease may be small, if the system error of the data collected by the hyperspectral sensor is large (the signal-to-noise ratio is low) in a certain wavelength range, the system error will overshadow the spectral changes caused by the crop disease. Therefore, it is necessary to eliminate some bands with a low signal-to-noise ratio (SNR) before selecting the sensitive bands.
The SNR of remote sensing images can be obtained by a variance method [
32], that is, the ratio between the mean value of pixels and the standard deviation of homogeneous areas in the image (the calibration tarp selected in this study); the calculation formula is shown in Equation (2).
Figure 4 shows the SNR of hyperspectral remote sensing images covering the range of 400–1000 nm. It can be seen from the figure that the SNRs of the hyperspectral images at 400–410 and 880–1000 nm are relatively low (SNR < 40), so the reflectance values at 400–410 nm and 880–1000 nm are not included in the subsequent analysis of bands sensitive to rice false smut.
where
is the value of the
ith pixel in the homogeneous surface area, N is the total number of pixels in the homogeneous surface area, and
is the mean of all pixel values.
In this study, the difference between the mean reflectance of healthy rice and the mean reflectance of diseased rice (D-MRH&MRD), defined by Equation (3), was used to measure the sensitivity of each waveband. The higher the D-MRH&MRD, the stronger the sensitivity of the band to rice false smut.
Here, is the difference between the mean spectral reflectance of healthy and infected rice at wavelength a, and and represent the mean reflectance values of healthy and diseased rice, respectively, at wavelength a.
However, at different wavelengths, the value and range of spectral reflectance of rice are very different, so it is unreasonable to directly compare the D-MRH&MRD at different wavelengths to measure the sensitivity of bands. In order to ensure consistency at different wavelengths, maximum and minimum normalization was applied to each band before calculating the D-MRH&MRD by using Equation (4):
where
and
are the reflectance values before and after normalization, respectively, and
and
are the minimum and maximum reflectance values at one wavelength, respectively.
Figure 5 shows the D-MRH&MRD and the sum of |D-MRH&MRD| (labeled as Sum-|D-MRH&MRD|) at each band for the four dates. It can be seen from the figure that the values of |D-MRH&MRD| in the near-infrared and red-edge bands are much higher than in the other bands, which proves that these two bands are more sensitive to RFS. A positive value of D-MRH&MRD indicates that the reflectance of the infrared region will decrease when rice is infected with false smut, but there is also a peak at the red band of visible light, which indicates that this band is useful for extracting information on rice false smut occurrence to a certain extent. A negative value of D-MRH&MRD indicates that when rice is infected with false smut, the reflectance in the red band region will increase.
According to the sum of |D-MRH&MRD| of the four dates and the above analysis, the bands with a sum greater than 0.15 (665–685 and 705–880 nm) were selected as the sensitivity bands of rice false smut.
2.4. Extraction of Areas of Rice False Smut Infection Based on Spectral Similarity Analysis
In this section, we introduce the detailed building process of extracting areas of rice false smut infection by using the similarities between the spectra.
According to
Section 2.3, the spectrum of rice infected with false smut is different from that of healthy rice in both the red and infrared bands (665–685 and 705–880 nm). Therefore, areas of rice false smut infection can be extracted by calculating the similarities (this experiment uses the correlation coefficient, R) between the spectra of pixels with unknown infection status and healthy rice pixels; high similarity indicates healthy rice and low similarity indicates infected rice. Naturally, the focus of this experiment was to find the threshold of similarity to be used as the segmentation benchmark.
Rice growth is a complex physiological process with specific morphology and structure during each growth period. Therefore, if a threshold is used to extract areas of RFS infection on multiple dates, the applicability of the threshold may be greatly weakened. Thus, in this experiment, different thresholds were used to extract the areas of rice false smut occurrence on different dates. In the following steps, taking the data from 14 August 2020 as an example, the process of selecting the threshold for the occurrence of rice false smut, that is, the construction process of the extraction model for areas of rice false smut occurrence based on spectral similarity analysis (
Figure 6 gives the workflow of the proposed methodology) is described in detail:
Step 1: According to
Section 2.3, 665–685 and 705–880 nm (labeled as Spectral
665–685+Spectral
705–880, or S
665–685+S
705–880) were chosen as the sensitive spectral ranges of rice false smut.
Step 2: From the spectral data of healthy rice, 50 pieces of data were randomly selected and S665–685+S705–880 were extracted to construct the standard spectral database of healthy rice (labeled as Database-Healthystandard).
Step 3: S665–685+S705–880 of the remaining spectral data of healthy rice (Database-Healthy) and of spectral data of rice false smut (Database-Unhealthy) were extracted.
Step 4: The similarity (correlation coefficient, R) between the spectral data in Database-Healthy + Database-Unhealthy and Database-Healthy
standard, that is, the mean value of similarity of R
i in relation to R, was calculated by Equations (5) and (6):
where R
i is the Pearson correlation coefficient between one piece of spectral data in Database-Healthy or Database-Unhealthy and the
ith piece of spectral data in Database-Healthy
standard; N is the amount of data in Database-Healthy
standard (N = 50 in this experiment); n is the number of bands in S
665–685+S
705–880; ref
std,i,j is the
jth reflectance value of the
ith piece of spectral data in Database-Healthy
standard;
is the mean value of the
ith piece of spectral data in Database-Healthy
standard; ref
j is the
jth reflectance value of one piece of spectral data in Database-Healthy or Database-Unhealthy; and
is the mean value of one piece of spectral data in Database-Healthy or Database-Unhealthy.
Step 5: The similarity (R) between each S665–685+S705–880 in Database-Healthy + Database-Unhealthy and Database-Healthystandard was obtained, then Database-R was obtained. Next, the maximum and minimum values of Database-R were obtained, which are labeled Rmax and Rmin, respectively.
Step 6: One one-hundredth of the difference between R
max and R
min was taken as the step size, and then, based on Database-Healthy, Database-Unhealthy, and Database-R, Threshold
i of Equation (7) was taken as the threshold value to predict RFS occurrence or not, i.e., if R
k (k = 1, 2, 3, …, M+N−50) in Database-R is greater than Threshold
i, the pixel corresponding to the S
665–685+S
705–880 corresponding to R
k was predicted to be healthy, otherwise it was predicted to be infected. Finally, the corresponding accuracy of each Threshold
i was calculated:
Step 7: When the overall accuracy was the highest, the corresponding threshold was the final threshold to determine whether rice was infected by rice false smut or not.
Step 8: Steps 2 to 7 were applied to the spectral data from other dates, and then the corresponding thresholds of those dates were obtained.
2.5. Extraction of Areas of Rice False Smut Infection Based on Spectral and Temporal Features
In this section, we introduce the detailed building process of extracting areas of rice false smut infection by using spectral and temporal features, including feature selection and model building.
As described in
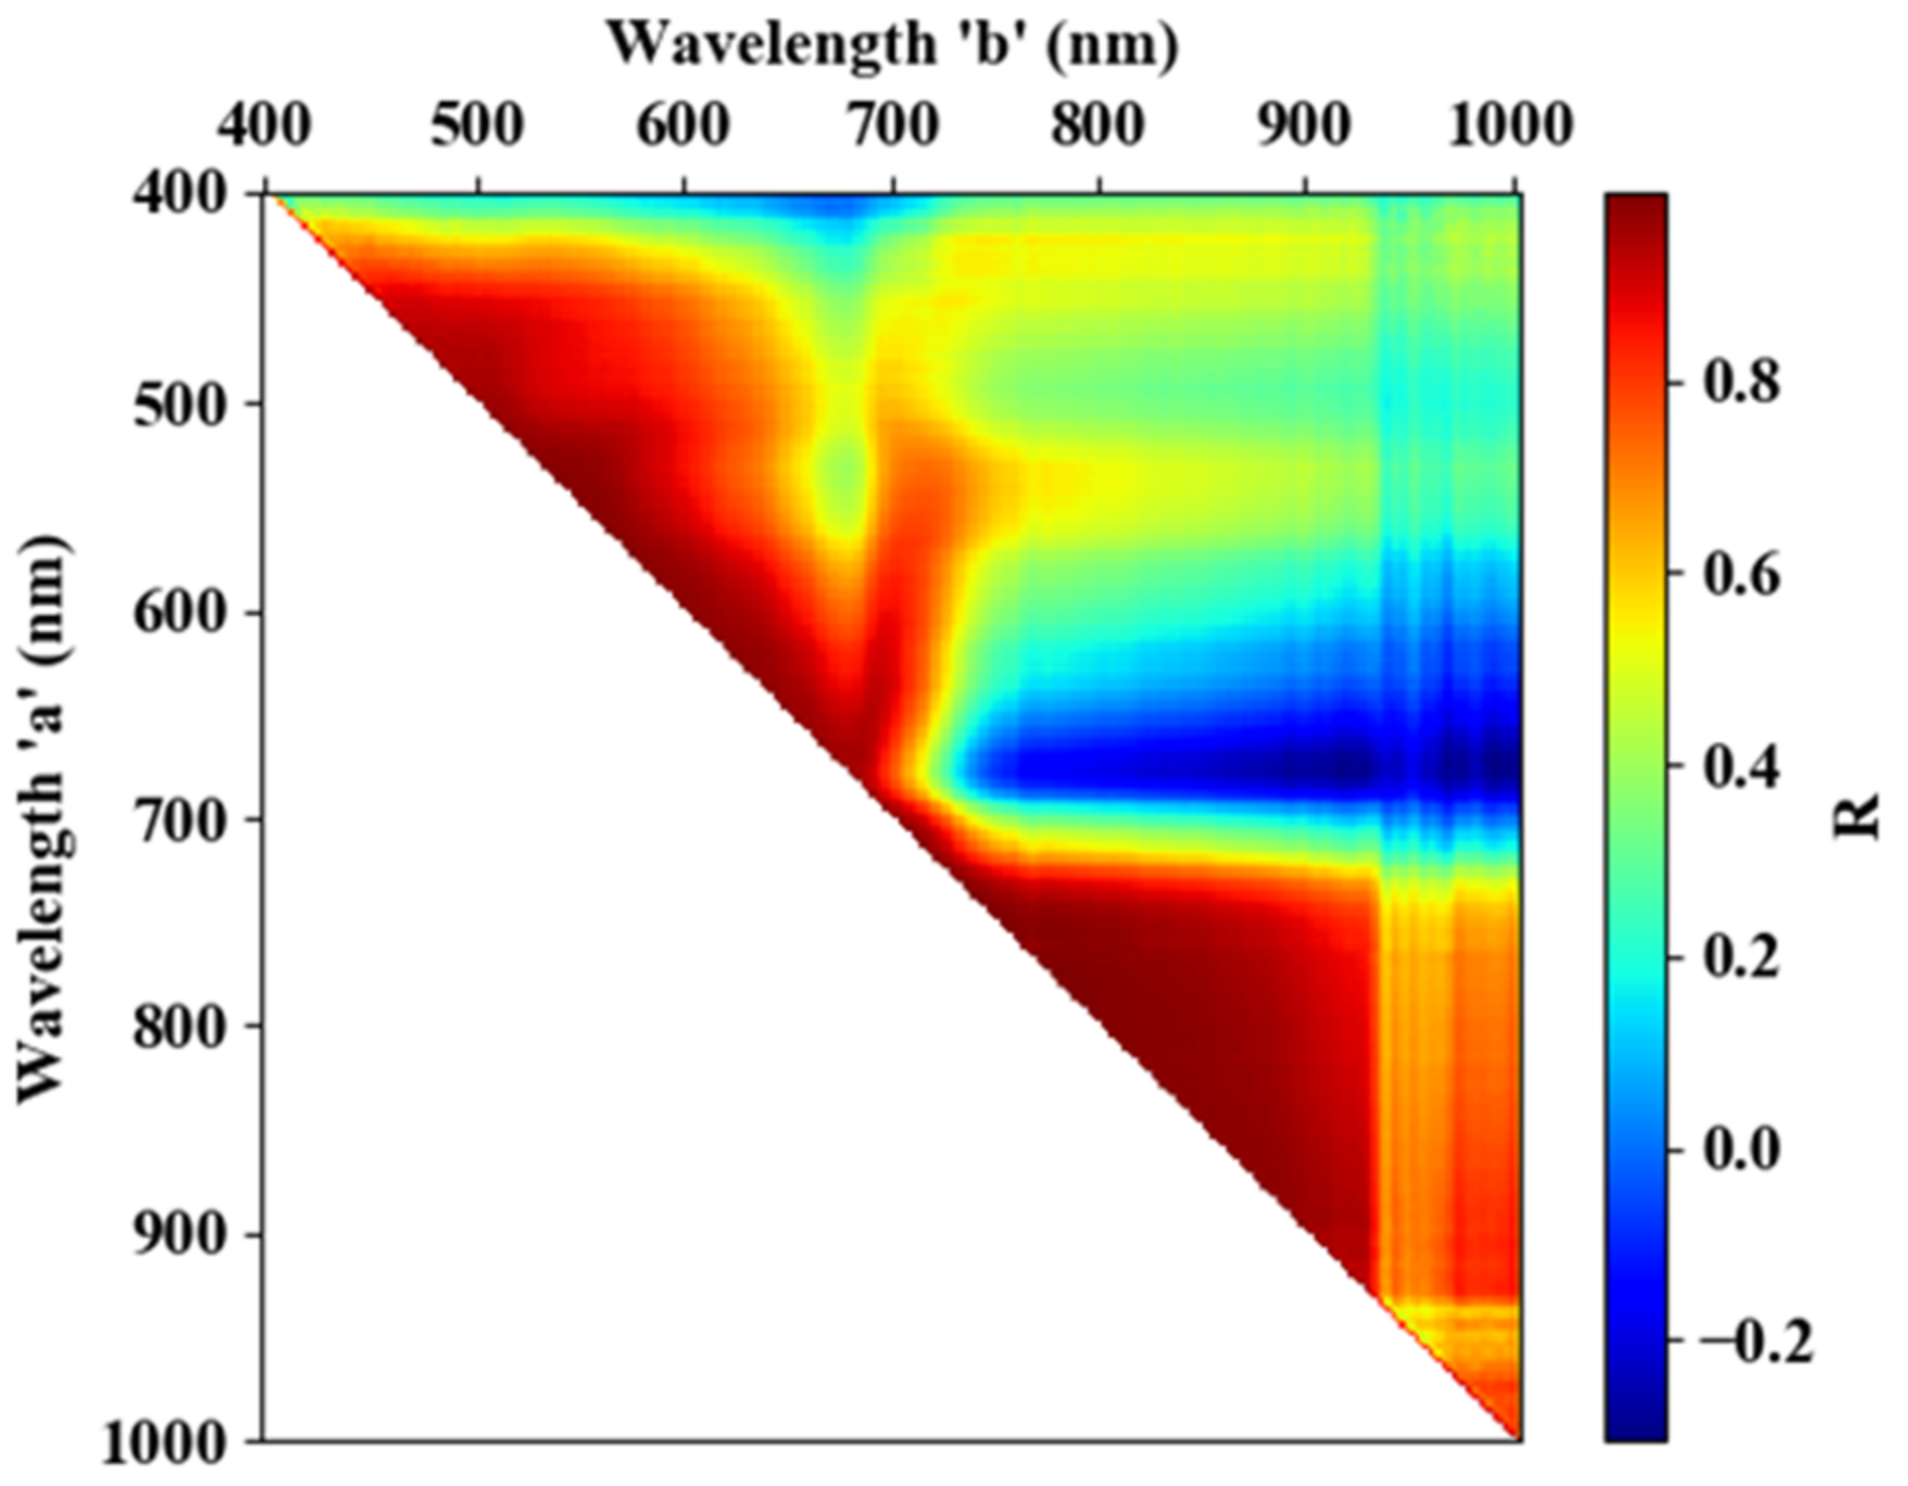
Section 2.3, 665–685 and 705–880 nm are the sensitive spectral regions of RFS. To reduce data redundancy, the correlation coefficient between every two bands was calculated (see
Figure 7). During this process, all samples, including healthy and infected spectral data, were used. It can be seen from the figure that there is a strong correlation between 705–880 and 665–685 nm, suggesting that there is a lot of data redundancy in this wavelength range, which is consistent with previous studies [
28,
33]. Finally, 680 nm, within the wavelength range of 665–685 nm (because the Sum-|D-MRH&MRD| of 680 nm is the maximum within that range; see
Figure 5), and 755 nm, within the range of 705–880 nm (because the Sum-|D-MRH&MRD| of 755 nm is the maximum within that range; see
Figure 5), were selected as the sensitive wavelengths to extract areas of RFS infection.
Figure 8 and
Figure 9 show the reflectance of healthy and infected rice at 755 and 680 nm. It can be seen from
Figure 8 that at all growth stages, the statistics of the reflectance of healthy rice at 755 nm (mean and median) are higher than that of infected rice. This further proves that rice infected with false smut will have reduced reflectance in the near-infrared region. It can be seen from
Figure 9 that regardless of the growth stage, the statistics of the reflectance of healthy rice (mean and median) are lower than that of rice infected with false smut at 680 nm, which proves that rice infected with false smut will increase reflectance in the red band.
According to
Figure 8 and
Figure 9, whether the rice is infected with rice false smut or not, the reflectance at 755 nm will decrease and the reflectance at 680 nm will increase slightly over time. Therefore, time is also an important factor in monitoring rice false smut occurrence.
To sum up, three features were extracted for monitoring the occurrence of rice false smut in this experiment: the reflectance at 755 nm and 680 nm (ref755 and ref680, respectively) and the date.
In this study, the dataset was randomly divided into a training set and a test set with a ratio of 70 and 30%. Then, based on the three features extracted, a random forest algorithm [
34] was used to build a monitoring model of rice false smut.
Random forest is an ensemble learning method that combines Breiman’s idea of “bagging” and the random selection of features [
34,
35]. A random forest model was built according to the following steps. First, based on the training dataset, the bootstrap aggregation algorithm was used to generate homogeneous subsets. Then, each sub-decision tree was grown to its maximum depth by selecting random samples and variables from the calibration dataset, and the growth process of the sub-decision tree can be executed in parallel. Finally, the random forest model was generated by integrating all sub-decision trees [
35,
36]. When building a random forest model, it is necessary to determine two parameters, the number of decision trees (n_estimators) in the bagging framework and the number of variables (max_features) in the decision tree framework [
36]. In this paper, n_estimators (range of 10–300, step size of 10) of the random forest had an optimal value of 220 through a grid search and cross-validation [
28], and the max_features was set as 3, equal to the number of features [
37].
2.6. Estimating Rice SPAD based on RCRWa-b
In a previous study, we proposed the parameter rate of change in reflectance between wavelengths a and b (RCRW
a-b) to estimate the chlorophyll content of rice [
28]. In this study, four RCRW
a-b parameters (RCRW
532–550, RCRW
665–674, RCRW
691–698, and RCRW
738–747) were determined by the same method. Based on the four selected RCRW
a-b, combined with the gradient boosting regression tree (GBRT) algorithm [
38,
39], we obtained the spatiotemporal distribution of SPAD values in Plot 1 and Plot 2.
GBRT is a machine learning technique that can solve regression problems [
38]. The core idea of GBRT is that each calculation is completed by a basic model, and the subsequent calculation is done to reduce the residual of the previous model and create a new basic model with the reduced residual in the gradient direction. By adjusting the weight of the weak prediction model, the final strong prediction model can be obtained [
38,
39]. The contributions of decision trees (learning_rate), the number of sub-decision trees (n_estimators), and the maximum depth of each decision tree (max_depth) are the important parameters in GBRT [
28]. In this study, through grid search and cross-validation, n_estimators and learning_rate had optimal values of 600 and 0.01, respectively, and the other parameters reference our previous study [
28].
3. Results
In this study, two methods were used to extract areas of rice false smut infection, one based on spectral similarity analysis (Method-SSA) and one based on spectral and temporal features (Method-STF).
3.1. Results of Method-SSA
According to Method-SSA, four thresholds used to extract areas of rice false smut infections on different dates were determined. The overall accuracy of Method-SSA is 74.23% (see confusion matrix in
Table 3).
Table 4,
Table 5,
Table 6 and
Table 7 show the results (confusion matrix) of these four thresholds in extracting areas of rice false smut occurrence, with accuracies of 77.41, 74.70, 71.52, and 73.21% for the four dates. In general, the classification accuracy of Method-SSA in different rice growth seasons is stable.
In order to obtain the spatial and temporal distribution information of rice false smut, the threshold of each date was applied to the corresponding date of UAV hyperspectral imagery pixel by pixel.
Figure 10 and
Figure 11 show the spatial and temporal distribution information of rice false smut in Plot 1 and Plot 2, respectively. According to these figures, qualitatively, the spatial distribution of rice false smut in the two plots was relatively small on 14 August 2020 compared to the other dates, and the occurrence area gradually became denser over time. In addition, the occurrence area of rice false smut gradually expanded over time, which was consistent with the natural development law of rice false smut.
3.2. Results of Method-STF
Table 8 shows the confusion matrix of Method-STF. It can be seen that the overall accuracy of the method is 85.19%. The user accuracy of the healthy area predicted by Method-STF is slightly lower than that of the infected area, but the difference between them is small, 84.81 and 85.59%, respectively. The mapping accuracy of the healthy area is slightly higher than that of the infected area, and the difference between them is also small, 86.27 and 84.07%, respectively.
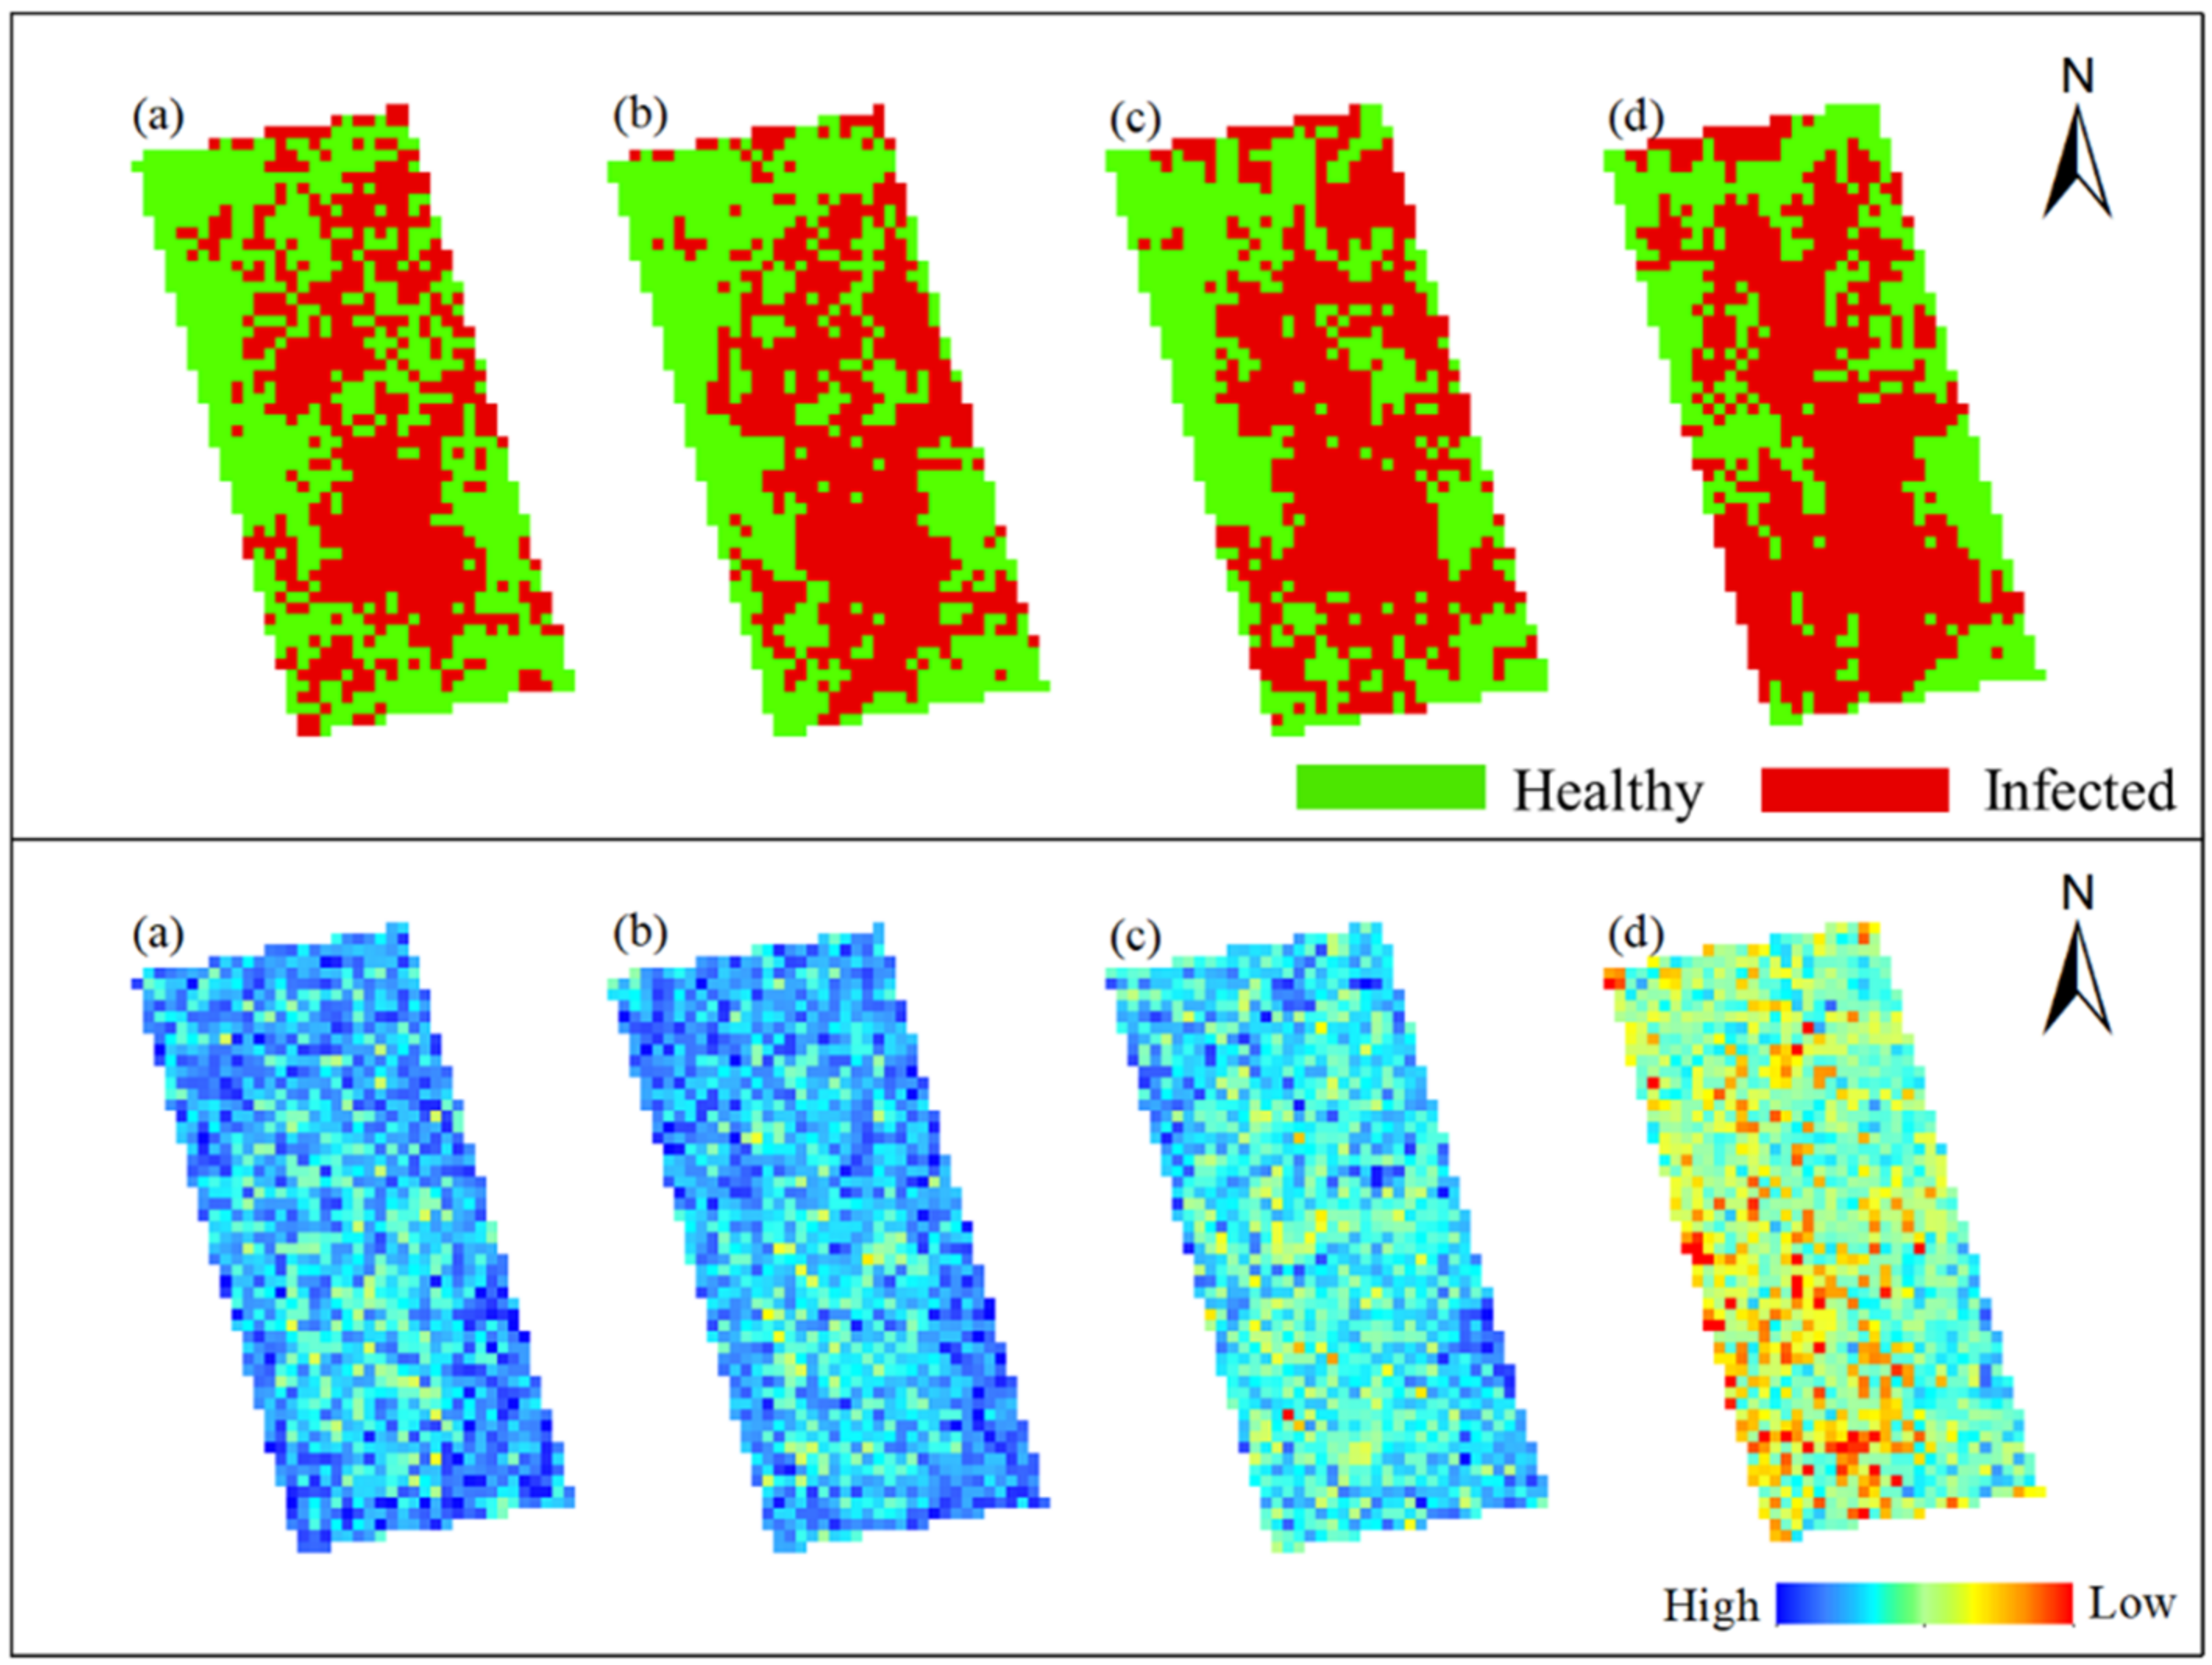
In this study, Method-STF was applied to the hyperspectral imagery of each phase pixel by pixel to obtain the spatiotemporal distribution map of rice false smut (see
Figure 12 and
Figure 13). It can be seen from the figures that qualitatively, the spatial distribution of rice false smut in the two plots was relatively sparse on 14 August 2020 compared to the other dates; the occurrence area gradually became denser over time, and, with the growth of rice, the occurrence area of rice false smut gradually expanded. In short, the temporal and spatial variation trend was consistent with the natural development law of rice false smut.
The above phenomenon shows that Method-STF not only has high accuracy, but also has a stable effect, and can effectively monitor the occurrence area of rice false smut.
3.3. Comparison of Methods
In this study, two methods, Method-SSA and Method-STF, were used to extract areas of rice false smut infection on different dates. Comparing the two methods, in terms of physical meaning, Method-STF uses machine learning technology and Method-SSA uses spectral similarity analysis and considers the difference between the spectra of infected and healthy rice; thus, Method-SSA has stronger physical interpretability. With regard to prediction accuracy, which is crucial for the evaluation of the model, the accuracy of Method-STF is higher, with overall prediction accuracy reaching 85.19%, compared to 74.23% for Method-SSA. In addition, both methods take temporal features into account.
3.4. Relationship between Rice False Smut and Canopy Chlorophyll Content of Rice
Figure 14 and
Figure 15 show the spatiotemporal variation of occurrence area of rice false smut and corresponding SPAD values in Plot 1 and Plot 2, respectively. According to
Figure 14, in the upper left and lower right of Plot 1, rice was healthy, and the corresponding SPAD value was relatively high, especially on 14 August 2020 and 20 August 2020.
Figure 15 shows that rice in the middle of Plot 2 was healthy, and the corresponding SPAD value was relatively high. In conclusion, in both plots, the SPAD values of rice were lower in the infected area and higher in the healthy area. This may be because after rice is infected with false smut, part of the chlorophyll in the plants is destroyed, resulting in decreased chlorophyll content.
By comparing the sensitive bands of rice false smut and chlorophyll (see
Figure 16), it was found that the two sensitive bands (red and near-infrared) overlapped, further proving that rice false smut infection has an impact on chlorophyll content.
4. Discussion
There have been many studies on crop diseases and pests. Most of them have treated the crops with diseases or insect inoculum, so that the degree of infection of the treated crops is more uniform [
1,
10], which makes it easier to extract the occurrence area of diseases and pests. In this study, the rice was in a natural setting and the rice false smut was the result of natural processes, without inoculum treatment, which is a huge difference between this study and other studies with regard to the experimental scenario. In addition, most studies monitoring crop diseases and insect pests use vegetation indices, the physical interpretability of which is poor. In this study, Method-SSA and Method-STF were used to extract areas of rice false smut infection based on UAV hyperspectral imagery. According to the selected sensitive wavebands and the prediction results, the following outcomes were observed.
In this study, 665–685 and 705–880 nm were selected as the sensitive wavebands of rice false smut; for infected rice, the reflectance will decrease at 705–880 nm and increase at 665–685 nm, which may be because the rice false smut can destroy the physiological structure of rice, cause changes to pigment and water content, and then changes to the crop canopy spectrum. Previous studies have reported that the reflectance of crops will decrease in the red bands and increase in the near-infrared bands if the crop has been infected by diseases or pests, which is consistent with the finding in our study [
2,
29].
As far as Method-SSA (extraction of infected areas based on spectral similarity analysis) is concerned, the prediction results on the four dates were 77.41, 74.70, 71.52, and 73.21%, and the overall accuracy was 74.23%. This method can extract areas of rice false smut occurrence effectively, and the performance is stable at different growth periods. The accuracy for August 14, 2020 was slightly higher than for the other dates, and the classification accuracy shows a downward trend. This may be because, during the natural growth of rice (from milk ripening to yellow maturity stage), the chlorophyll content in the leaves gradually decreases [
28], and decreased chlorophyll content in crops will lead to decreased near-infrared reflectance [
40,
41], which may have a certain impact on the monitoring of rice false smut (rice false smut also leads to decreased near-infrared reflectance; see
Figure 5. In other words, the lower the chlorophyll content in rice, the more difficult it is to monitor rice false smut.
As shown in
Table 4,
Table 5,
Table 6 and
Table 7, the producer’s accuracy of healthy samples is significantly lower than that of infected samples; that is, more healthy samples were wrongly assigned to the infected group. This may be because of the following: (1) When constructing the model, since there were somewhat fewer healthy samples than infected samples, the optimal threshold value moved in the direction of improving the accuracy of classifying infected samples when the threshold was calibrated, which led to lower producer’s accuracy for healthy samples than infected samples. (2) The sensitive wavebands selected in this experiment were near-infrared and infrared, and the near-infrared band is sensitive to water content. When the water content is higher, the spectral reflectance of the crop canopy at near-infrared will decrease [
42], which is consistent with the spectral change trend of rice false smut. Therefore, the difference in soil moisture in the plots may have led to the wrong classification of healthy samples as infected.
Method-STF achieved satisfactory overall accuracy, with stable performance in producer’s and user’s accuracy (see
Table 8). The upper left part of
Figure 13a shows the infected area on 14 August 2020, but the degree of infection was weakened after 20 August 2020 (see
Figure 13b–d); that is, the change in the occurrence area of rice false smut in this part does not conform to the natural development law. After verification, the terrain of Plot 2 is slightly higher in the south than in the north, and in this case, there may have been water accumulation or soil moisture in the north of the plot. With different soil moisture content, the reflectance of high soil moisture areas will decrease to a certain extent in the near-infrared band [
42]. As shown in
Figure 8, the reflectance at 755 nm was lower for infected than healthy rice. Therefore, healthy rice under relatively high soil moisture conditions may be mistakenly classified as infected rice. On 14 August 2020, the difference in water content between the north of Plot 2 and other parts was greater than on the other days, so the pixels in the northern part on 14 August 2020 were more likely to be wrongly classified as infected. This shows that although Method-STF has good classification accuracy, it also has some limitations.
Comparing the performance of the two methods, we found that the Method-STF had higher overall accuracy and the difference between the user’s and producer’s accuracy of Method-STF is smaller. This may be because more near-infrared bands are used in Method-SSA, which are more susceptible to soil moisture interference, while Method-STF only uses one near-infrared band, which is more resistant to soil moisture. However, Method-STF uses machine learning technology, while Method-SSA uses spectral similarity analysis; therefore, Method-SSA may have stronger physical interpretability.
In this study, through field investigation, although only one rice disease (rice false smut) was found, it does not mean that some rice diseases and pests (other stress types) that cannot be seen visually did not affect the reflectance data, especially when other types overlap with the sensitive wavelength range of rice false smut. Therefore, this study still has some limitations.
5. Conclusions and Recommendations
This study investigated the potential of using UAV hyperspectral imagery to identify the occurrence of rice false smut. Results from two methods for the extraction of infected areas, one based on spectral similarity analysis and one based on spectral and temporal features, were evaluated and compared, and the following conclusions are drawn:
The spectral difference between healthy rice and rice infected by rice false smut is useful information for assessing the sensitivity of wavebands to RFS.
RFS can reduce the chlorophyll content of rice plants.
The spectral regions of 665–685 and 705–880 nm are useful to extract areas of RFS occurrence.
Both Method-SSA and Method-STF are effective for extracting areas of RFS occurrence, with the former showing stronger physical interpretability and the latter being more accurate.
Compared with Method-STF, Method-SSA seems to be more affected by soil moisture variations.
Although the results of this study are encouraging, there are still limitations. The feature used to extract areas infected by rice false smut was reflectance, which may have been affected by soil moisture. Therefore, some vegetation indices, for example, NDVI, that can reduce the influence of the soil background [
43,
44], combined with reflectance, may be helpful for improving the accuracy of the extraction of infected areas. Furthermore, the methods used in this study should be tested on other rice cultivars. In addition, the flight speed of the UAV should be the same on different dates, so as to reduce the effect caused by different flight speeds on the positional precision.


 ,
, 


