
Simulation of a Wideband Radar Echo of a Target on a Dynamic Sea Surface


1
School of Physics and Optoelectronic Engineering, Xidian University, Xi’an 710071, China
2
Xi’an Research Institute of High Technology, Xi’an 710025, China
3
China Academy of Space Technology, Xi’an Branch, Xi’an 710100, China
*
Author to whom correspondence should be addressed.
Remote Sens. 2021, 13(16), 3186; https://0-doi-org.brum.beds.ac.uk/10.3390/rs13163186
Submission received: 17 June 2021
/
Revised: 2 August 2021
/
Accepted: 9 August 2021
/
Published: 11 August 2021
(This article belongs to the Special Issue Integrated Applications of Geo-Information in Environmental Monitoring)
Abstract
:Unlike a generally rough ground surface, the sea surface varies over time. To analyze the impact of the motion of sea waves on the synthetic aperture radar (SAR) image of a target, the wideband echo simulation method based on a frequency domain is used. For the wideband echo, the electromagnetic (EM) scattering properties of the main frequency components are analyzed by the simulation method. Based on the EM scattering properties, the echo can be accurately simulated by using the inverse fast Fourier transformation (IFFT). Combined with the flight path of the radar, the echo of each pulse can be simulated to obtain the SAR image. The correct evaluation of the EM scattering properties is indispensable to the acquisition of an accurate SAR image. For complex targets, such as ships, the multiple scattering effects have a significant influence on the EM scattering properties. Thus, a rectangular wave beam-based geometrical optics and physical optics (GO/PO) method is introduced to calculate the EM scattering properties, which is more efficient than the traditional GO/PO. The GO/PO method is suitable to simulate SAR images in which the EM scattering properties of each pulse need to be calculated. With these methods, the SAR images of the target on the sea surface are simulated. Based on the comparison of the SAR images between a static and dynamic sea surface, it is found that the region corresponding to the target is blurred and the texture of the dynamic sea is blurrier. The impact of multiple scattering and sea wave motion on target recognition are also analyzed with the SAR images that were generated under different conditions. Some strong scattering points appear when multiple scattering effects are considered. It is also found that the texture of the SAR images, corresponding to the sea surface, changes with the synthetic aperture time.
1. Introduction
Target recognition based on synthetic aperture radar (SAR) images is a hot topic in the remote sensing field [1,2]. With the development of technology, the bandwidth is increased to improve the range resolution and more details can be obtained from the SAR image [3,4]. The strong scattering points in SAR images are usually used to detect the target. However, the background may affect the accuracy of the target detection. The objective of the paper is to efficiently provide reliable simulation data for ship target recognition in the dynamic sea. In general, the sea surface is stirred up when the wind grows fierce, and the strong scattering points of the ship may be submerged in the background noise caused by scattering from the sea surface. Thus, many researchers have worked against a complex and noisy background [5,6]. The traditional methods are usually based on a prior detection window, such as the constant false alarm rate methods [7,8]. Because the prior detection window needs to be initialized, the application of the traditional method is limited for a complex background. To detect a target against a complex background, the self-adaptive method based on the local variance weighted information entropy (VWIE) has been developed [9,10]. In recent years, a ship detection method based on convolutional neural networks (CNN) has been proposed [11,12]. The method is conventional and performs well. Thus, it is widely used in the field of target recognition. However, its precision relies on a large-scale, high-quality training dataset. As we all know, accurately measured data are difficult to obtain. However, it is much easier to acquire simulation data. To ensure the accuracy of the simulation data, the SAR imaging process follows the practical situation. Thus, the simulated sea surface has changed over time during the flight of the radar, and the multiple scattering effects have been taken into account for a complex target, such as a ship, to enhance the electromagnetic (EM) scattering echo. Moreover, it takes lots of time to calculate the EM scattering properties of all the pulses during the SAR imaging process. Thus, the geometrical optics and physical optics (GO/PO) method, which is efficient and accurate enough, is employed to simulate the SAR image of a target on a dynamic sea surface for a wideband signal.
In terms of the general time-domain simulation method of the SAR echo, the SAR scene is divided into many scattering units, and the total echo is the sum of the echo from each unit. In addition, the echo from each unit is approximated by the scattering properties of the center-frequency EM wave [13,14]. However, for the wideband signal, the differences in scattering properties between the main frequency components increase and the error of the traditional approximation becomes large. To accurately simulate the SAR echo, the method in the frequency domain is employed, which considers the scattering properties of all the frequency components. After the scattering properties of each frequency are obtained, the time domain scattering echo can be calculated by using the inverse fast Fourier transformation (IFFT). Then, the SAR image of the whole scene can be generated by using the simulated echo.
To calculate the scattering properties, frequency domain EM scattering algorithms can be used, such as method of moment (MoM), equivalent edge currents (EEC), finite element method (FEM), and physical optics (PO) [15]. However, as the scattering properties of all the frequency components need to be analyzed, the calculation load is quite heavy. To reduce the simulation time, a high-efficiency method would be a better choice. Here, the GO/PO hybrid method, which has high efficiency and considers the multiple scattering effects, is employed to simulate the scattering fields. Although the efficiency of the GO/PO method is high, it still takes a lot of time to search for the reflected rays. Moreover, the calculation is mainly focused on the ray tracing process. To accelerate the ray tracing process, the kd-tree method is usually used [16]. The method of hardware acceleration is frequently used too. For instance, the graphical electromagnetic computing method uses a graphics processing unit (GPU) to estimate the illuminated area [17]. In recent years, the parallel acceleration method has been very popular because of the significant improvement in the parallel computing capability of the GPU [18]. However, most of these methods trace the ray according to the facets, e.g., the traditional GO/PO method, which calculates the EM scattering properties by analyzing the EM scattering fields of the illuminated facets [17]. Thus, these methods require the density of rays to be higher than the density of the facets. Their efficiency depends on the number of facets and their accuracy is affected by the size of the facet; thus, the size of the facet should be small enough to ensure accuracy. Of course, this will increase the number of facets and calculation load. To further improve the efficiency, the rectangular wave beam-based GO/PO method can be used. It calculates the EM scattering properties by analyzing the EM scattering fields of the area illuminated by a small rectangular wave beam. Furthermore, it does not have a requirement for the facet size as the traditional GO/PO method does. Thus, the same level of efficiency and accuracy can be achieved with a lower number of pixels [19].
During the process of the SAR platform movement, the fluctuation of the dynamic sea surface changes. The longer the time, the more obvious the change. Unlike the static rough surface, the dynamic sea surface at a different time, corresponding to each pulse will change. Thus, the impact of the sea surface movement on SAR imaging will be discussed. After the analysis, it was found that it is more difficult to recognize the shape of the ship on a dynamic sea surface than a static one. The longer the synthetic aperture time, the more blurred the shape of the ship. It means that the SAR images of a target ship on a dynamic sea are affected by the synthetic aperture time.
2. Materials and Methods
2.1. Scattering Echo Simulation
For many emission signals of radar, the energy concentrates on the frequency components near the center frequency , with a range between and , as shown in Figure 1a. In addition, the frequency components out of this range are so weak that the components can be ignored. Its spectrum, , can be written as follows [20]:
where is the complex amplitude corresponding to frequency .
Figure 1a shows the normalized spectrum of the emission signal for a linear frequency-modulated (LFM) signal. As shown in Figure 1a, the energy mainly distributes near the center frequency, , with bandwidth . Figure 1b shows the normalized spectrum of the corresponding scattering echo. Its energy is also mainly distributed near the center frequency, . Then, the frequency-domain form of the scattering echo signal can be written as follows [20]:
where is the radar cross section (RCS) and is the phase delay corresponding to the frequency of . Before the scattering echo processing, it should be demodulated to the baseband. Its corresponding spectrum can be written as follows [20]:
where is the light speed and is the distance between the target and the radar sensor.
With , the demodulated scattering echo in the time domain is obtained by using IFFT:
During irradiation, the radar emits a pulse periodically. The demodulated scattering echo of the ith pulse is marked as . Then, the SAR echo can be written as follows:
where represents the time when the radar emits the pulse, and is the time when the radar emits the ith pulse.
With the SAR echo, the SAR image can be calculated using imaging algorithms, such as the Range–Doppler (RD) algorithm [21] or the Back Projection (BP) algorithm [22,23]. Here, the RD algorithm is applied to calculate the SAR image with the simulated echoes.
In order to verify the reliability of the simulation method, the radar moves along the same designed trajectory as the actual illuminating process. A scene of five cubes is presented to demonstrate that the simulated echo with different parameters is in accordance with the actual situation. For example, the simulated echo with a wider bandwidth can generate a SAR image with a higher range resolution. Figure 2 shows a schematic diagram of the scene. The airborne radar moves along the flight path with the height of H; see the red line in Figure 2. R is the distance between the target and radar. is the incident angle. The five cubes in Figure 2 have a volume of 1 m3. The five cubes are placed on the XOY plane, as shown in Figure 2.
While the radar moves along the flight path, it emits pulses periodically. The echo from the cubes corresponding to each pulse is simulated by the proposed method. With these echoes, the SAR images of the five cubes can be generated. Figure 3 gives the SAR images of the five cubes with different bandwidths B and azimuth resolution . The antenna lengths of Figure 3a–d are 4 m, 2 m, 1 m, and 0.5 m, respectively. The corresponding bandwidths are 0.0375 GHz, 0.075 GHz, 0.15 GHz, and 0.3 GHz, respectively. The incident angle is 57°. The carrier frequency is 9.375 GHz. The range resolution is C/(2B). As shown in Figure 3, when the azimuth resolution and the range resolution are both low, it is difficult to detect the cubes, shown in Figure 3a, where the resolution is 4.0 m. When the resolution is improved, the cubes can be gradually identified in the SAR image, as shown in Figure 3b–d, with increasing bandwidth B.
2.2. Rectangular Wave Beam-Based GO/PO Method
According to Equation (3), the scattering echo can be calculated when obtaining the RCS of all the frequency components. Because the multiple scattering effect of the complex target is obvious, the GO/PO method is used to calculate the RCS from the target on the sea surface.
The GO/PO method is based on the PO method, and also considers the scattering fields of the facets illuminated by the reflected rays that are traced according to the GO method. For the traditional GO/PO method, the scattering property is the sum of the contribution of each illuminated facet. The total RCS can be obtained by the formula below.
where is the wave number and is the imaginary unit; is the direction of the incident wave; and are the directions of the first-order and second-order reflected waves, respectively; is the polarization direction of the incident wave; and are the polarization direction of the first-order and second-order reflected waves, respectively; is the scattering direction; is the polarization direction of the receiver; is the normal vector of the mth facet; and is the area of the mth facet.
To accurately determine which facets are illuminated requires a larger density of rays than that of facets. If the density of rays is low, some facets will be missed. The accuracy of the traditional GO/PO method depends on the size of the facets. To ensure accuracy requires that the size of facet be small enough. However, this will increase the number of facets and the density of the rays. Thus, the calculation load is large.
To improve the efficiency, it is an effective way to reduce the density of the rays, but the problem of the facets missing must be solved when the density of the rays is low. Here, the rectangular wave beam-based GO/PO method is used [19]. The improved method treats the ray as a rectangular wave beam, and analyzes the EM scattering properties of the area illuminated by the rectangular wave beam. Each rectangular wave beam corresponds to an illuminated area, and these areas just fill the whole illuminated area. For the improved GO/PO method, there is no illuminated area missed, with the same density of rays. Thus, it is more accurate than the traditional GO/PO method with the same density of rays. Since the density of the rays is lower, its computational load is lower, and the improved method is more efficient than the traditional method.
To calculate the EM scattering properties, the contribution of each rectangular wave beam should be considered. According to the ray direction, the illuminated area is mapped to a picture with pixel matrix (see Figure 4). Then the beam is divided into many small rectangular wave beams according to the pixel matrix. Each small rectangular wave beam corresponds to one pixel. For example, the nth rectangular wave beam corresponds to the nth pixel. Furthermore, the boundary of the cross-section corresponding to the nth rectangular wave beam is rectangular with two edge vectors of and , as shown in Figure 4.
The nth rectangular wave beam illuminates an area. The RCS of this illuminated area is marked as , which satisfies the equation below:
where is the normal vector of the facet illuminated by the nth ray, and its number is marked as m; and is the center position of the area illuminated by the nth ray, with a ray direction of . The expression of is shown in [19].
The total RCS is the sum of the contribution of all rays. In addition, multiple scattering effects are considered. Thus, the nth ray, which illuminates the facet, may be part of the incident wave or the reflected wave. To determine the distribution of the different kinds of waves, the RCS caused by the nth ray of the incident wave is marked as , and the corresponding number is marked as . Similarly, the RCS, which is caused by the nth ray of the first-order reflected wave, is marked as , and the corresponding number is marked as . The RCS, which is caused by the nth ray of the second-order reflected wave, is marked as , and the corresponding number is marked as . Thus, the total RCS of the scene satisfies the equation below:
where , , and are operated on the small rectangular wave beams of the incident wave as well as the first time and the second time reflected ray, respectively.
2.3. Scene of Ship and Sea
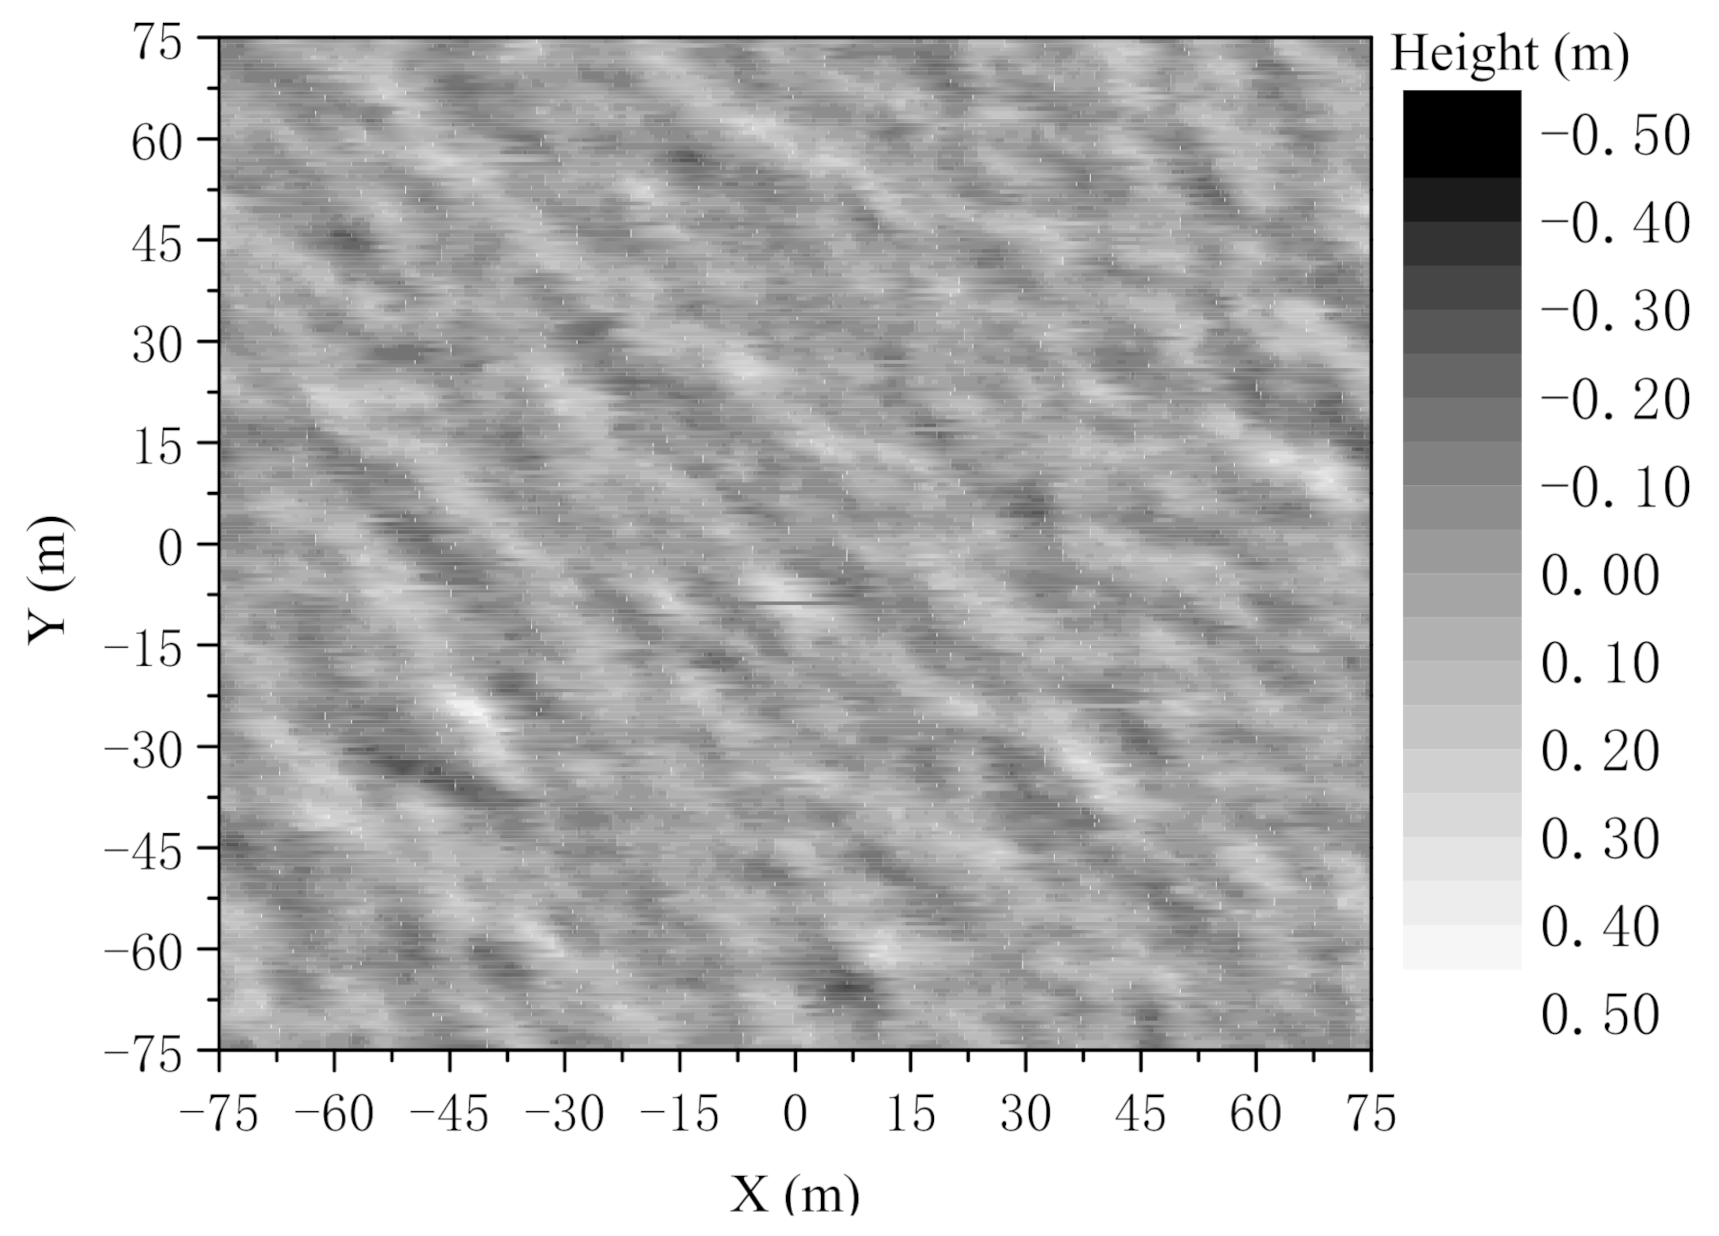
Generally, a rough surface is simulated by a superposition of harmonic waves. Thus, the surface can be generated by the given spectrum. For a dynamic sea surface, the height of the sea surface at time t can be expressed as follows:
where is the Elfouhaily sea spectrum used to simulate the dynamic sea surface with a wind speed of [24]. In addition, there is an obvious orientation for the dynamic sea surface along the direction of the wind. Then, the angular spreading function [25] is added to modify Equation (8):
where is the angle between the wave vector and the direction of the wind.
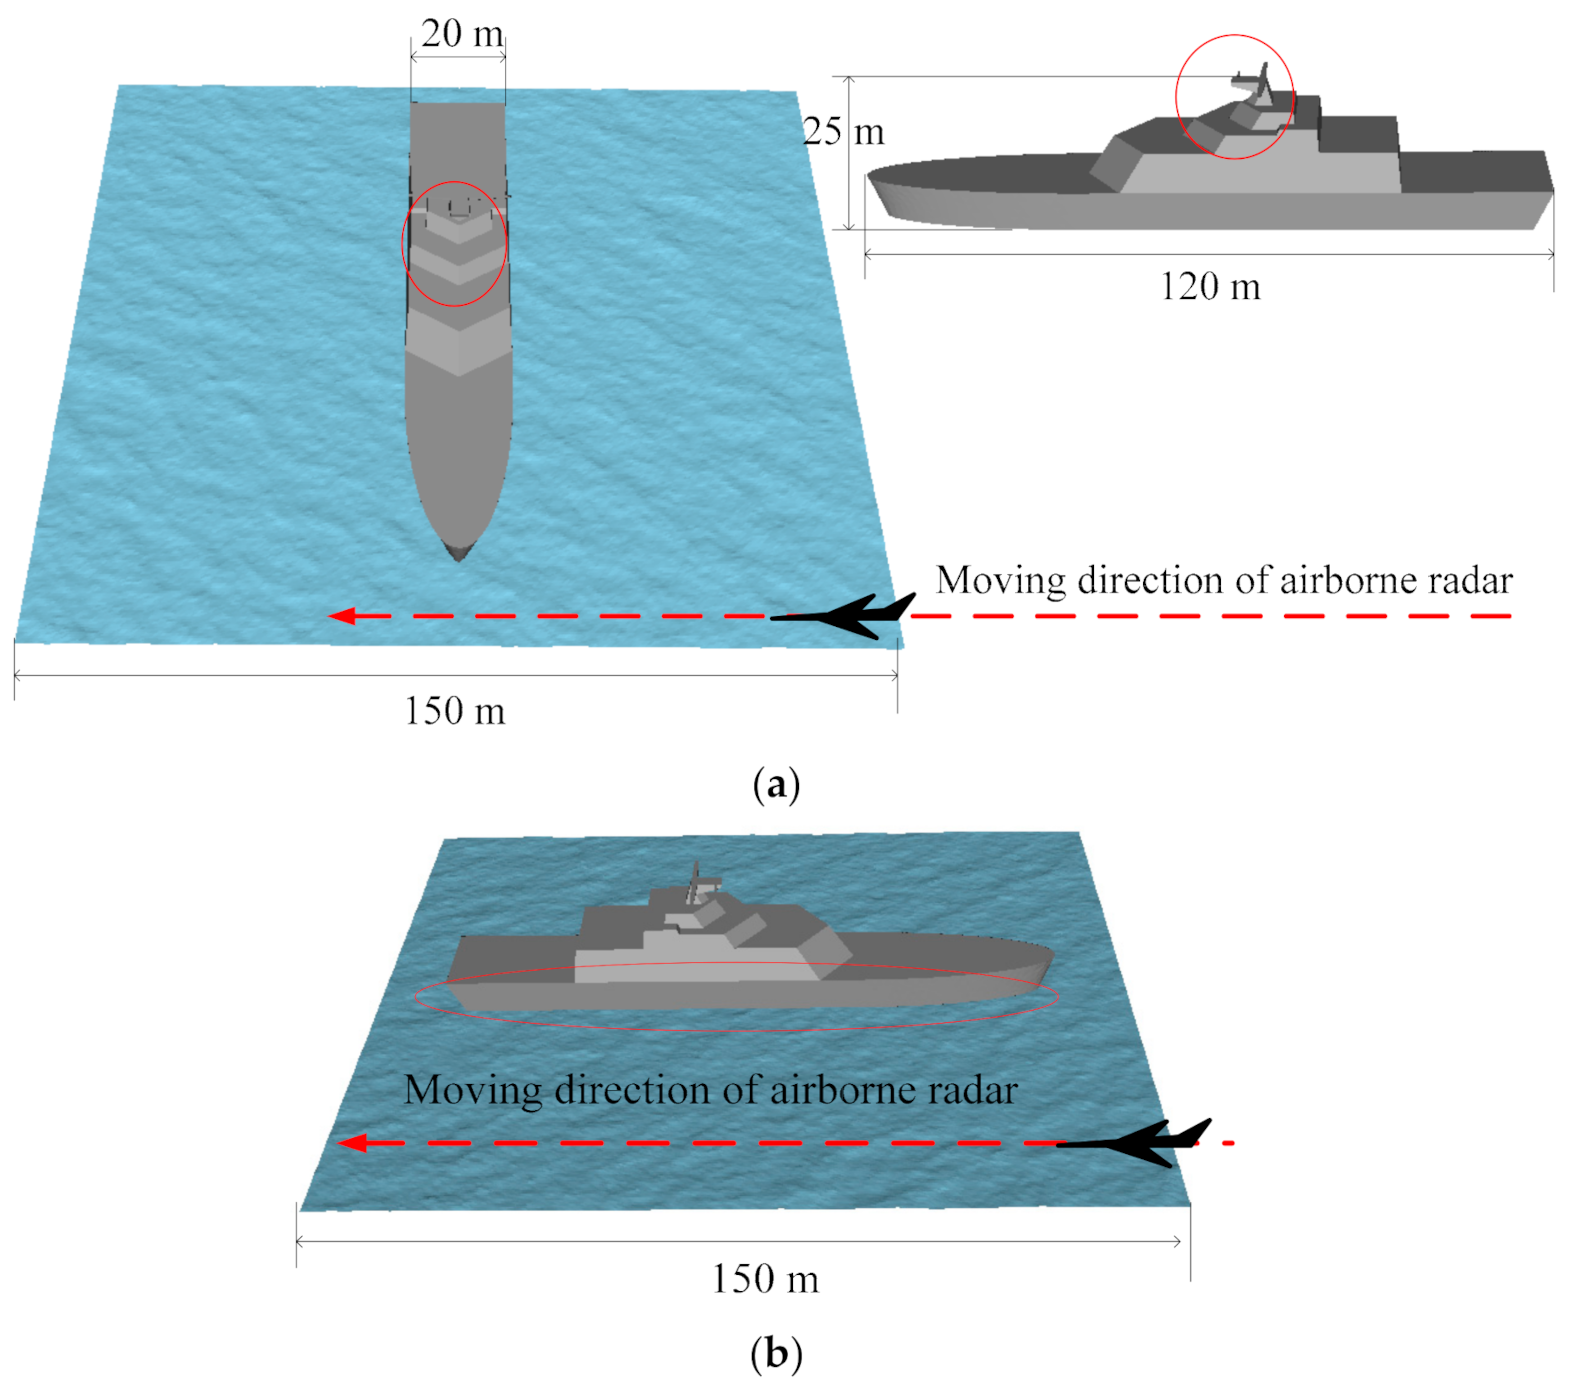
Figure 5 shows the sea surface simulated with a wind speed of 5 m/s and a wind direction of 45°. As shown in Figure 5, the direction of the sea surface is obvious along the wind direction. The size of the sea surface is m2, which is large enough to put a general ship on it. As shown in Figure 6, the ship model is 120 m long, 20 m wide, and 25 m high. Generally, the scattering properties of a ship change obviously with the azimuth. Here, two typical orientations are considered. One orientation is that the ship’s bow is perpendicular to the moving direction of the airborne radar (see Figure 6a). The other is that the ship’s bow is parallel to the moving direction of the airborne radar (see Figure 6b).
The incident angle is 45°. The carrier frequency is 9 GHz. The bandwidth is 0.15 GHz and its corresponding range resolution is 1 m. The azimuth is along the direction of motion of the airborne radar. The range direction is perpendicular to the azimuth. The antenna length is 2 m and its corresponding azimuth resolution, , is 1 m.
3. Results
3.1. Results of the SAR Simulation
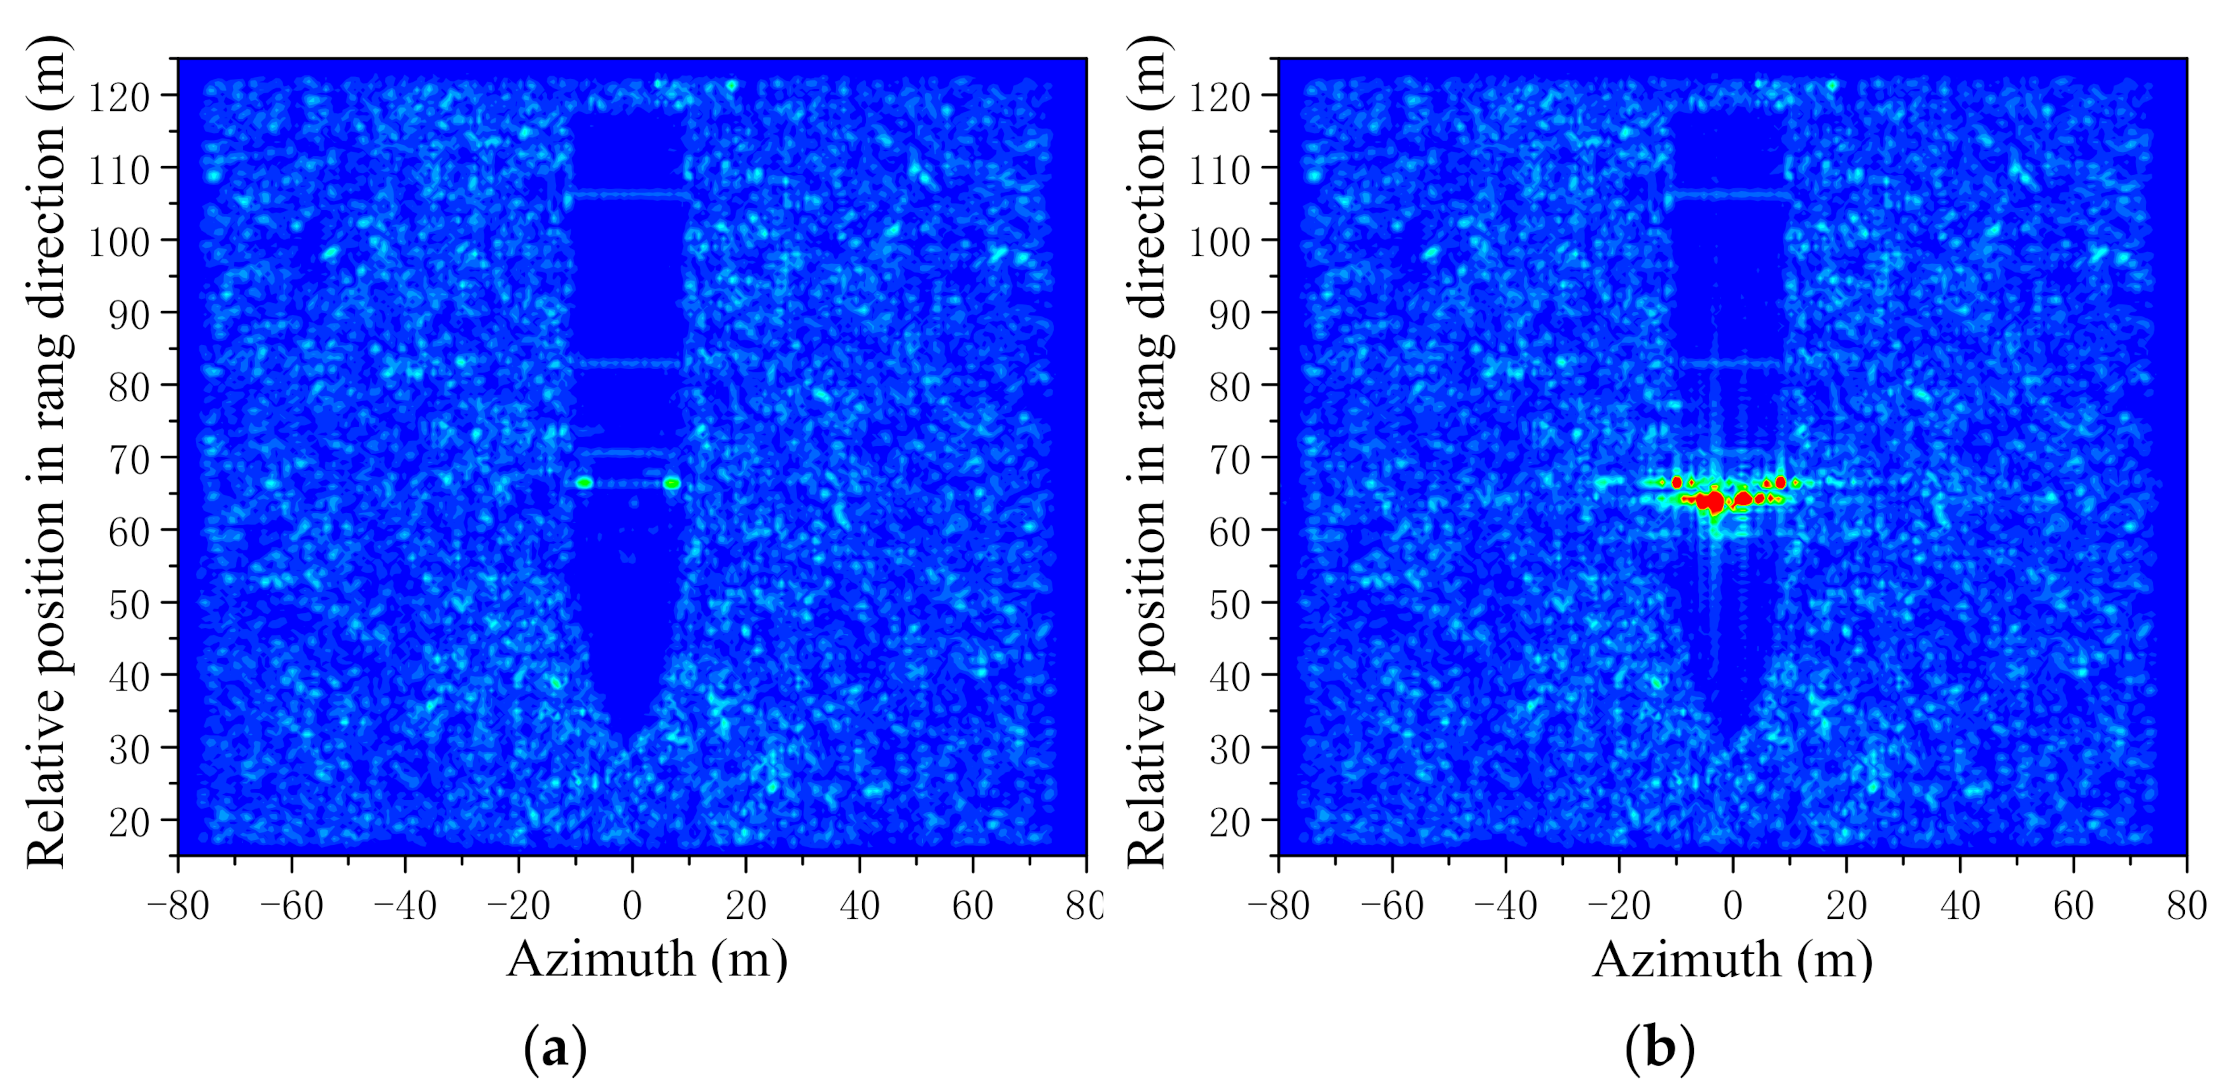
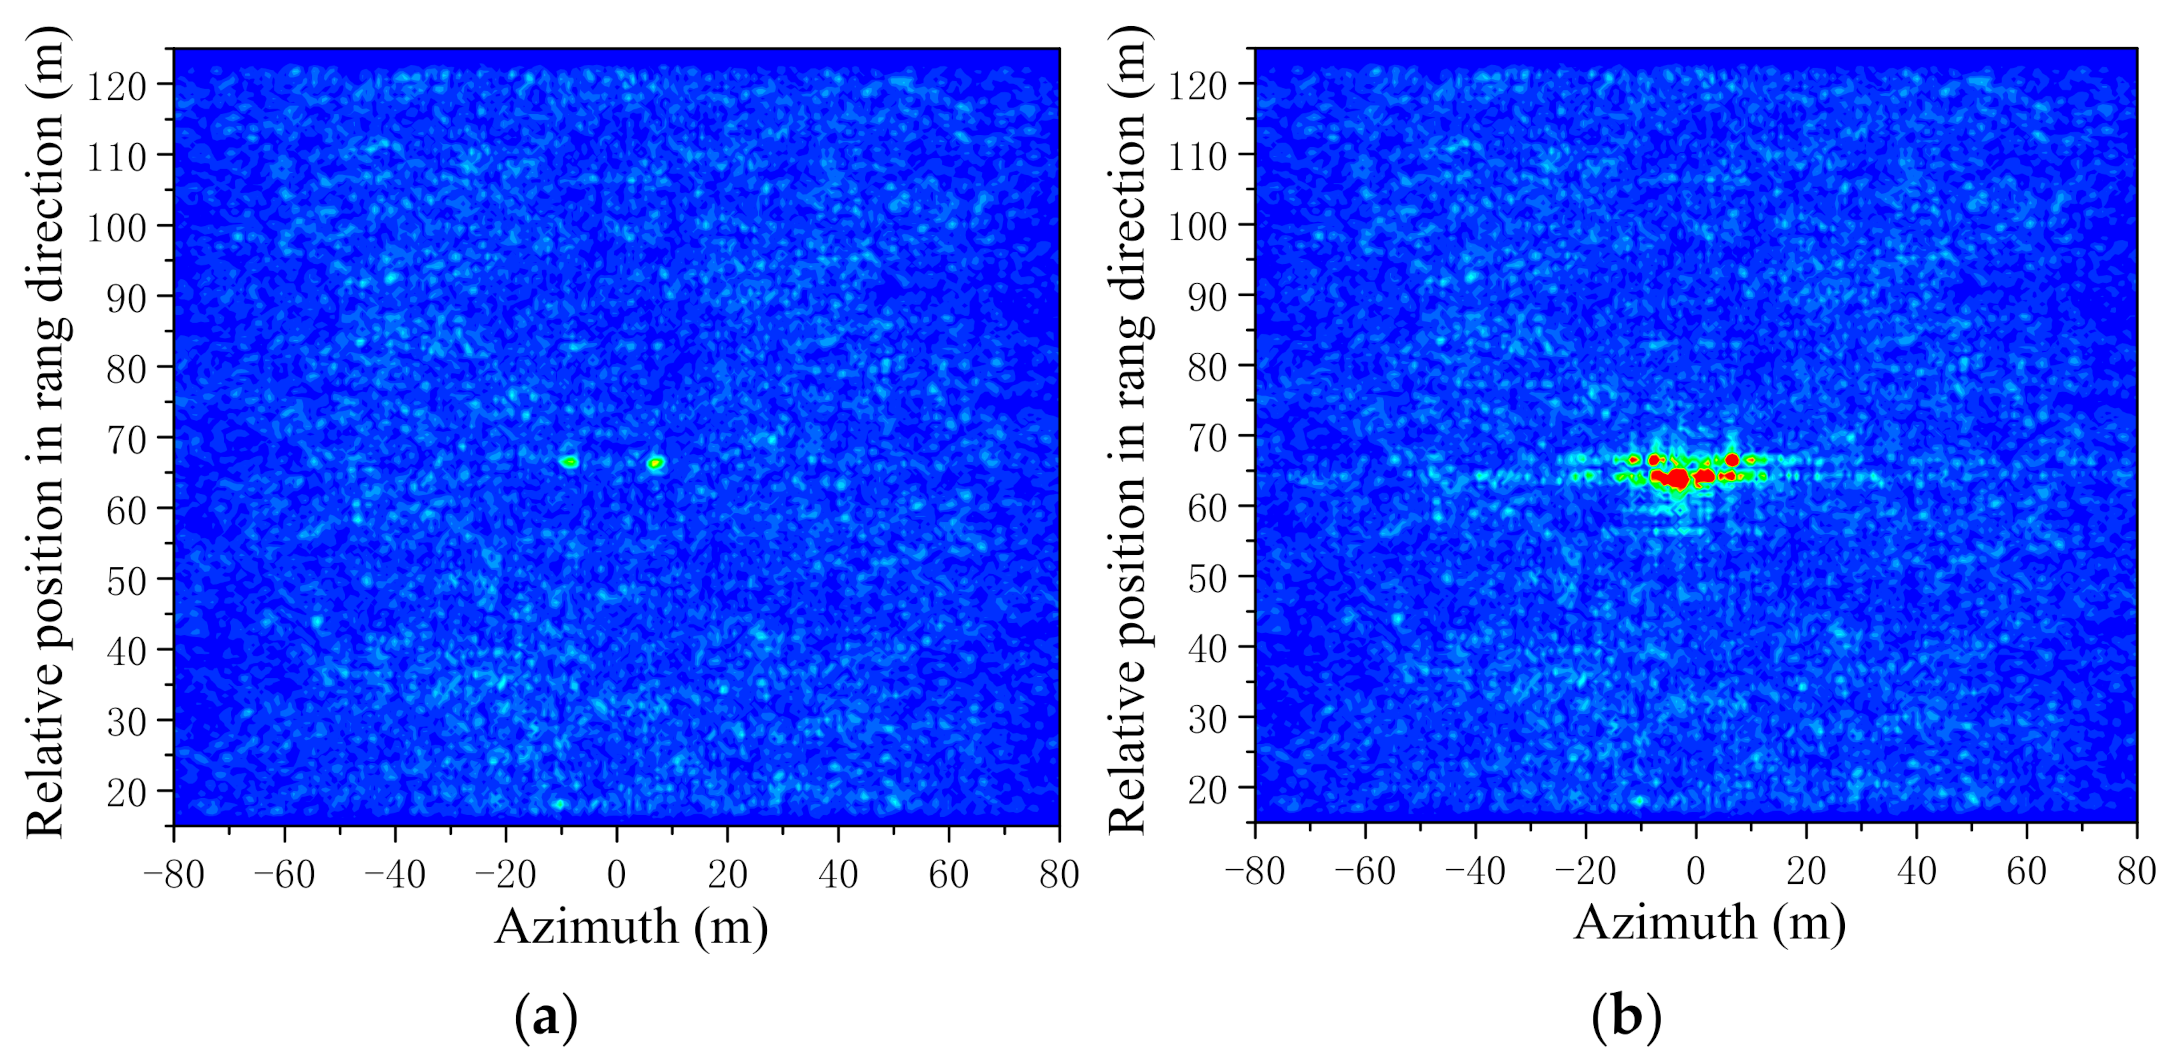
Figure 7a shows the SAR image of the scene corresponding to Figure 6a, when the sea surface is static. The velocity of the airborne radar, , is 300 m/s and the synthetic aperture time, , is about 0.62 s. Figure 7b shows the SAR image where the multiple scattering effects are considered. Comparing to Figure 7a, some regions in Figure 7b become brighter where multiple scattering is considered. These brighter regions correspond to the place marked with the red elliptical frame in Figure 6a and make the ship more obvious in the SAR image. Thus, it is necessary to analyze multiple scattering effects, which have an important impact on target recognition. Because the deck of the ship is flat and the EM wave is reflected to the mirror direction, its back scattering is weaker and its corresponding regions in the SAR image are obviously darker than the other regions. The shape of the darker regions is also close to the shape of the ship, which can serve as another feature for detecting the ship from the sea background.
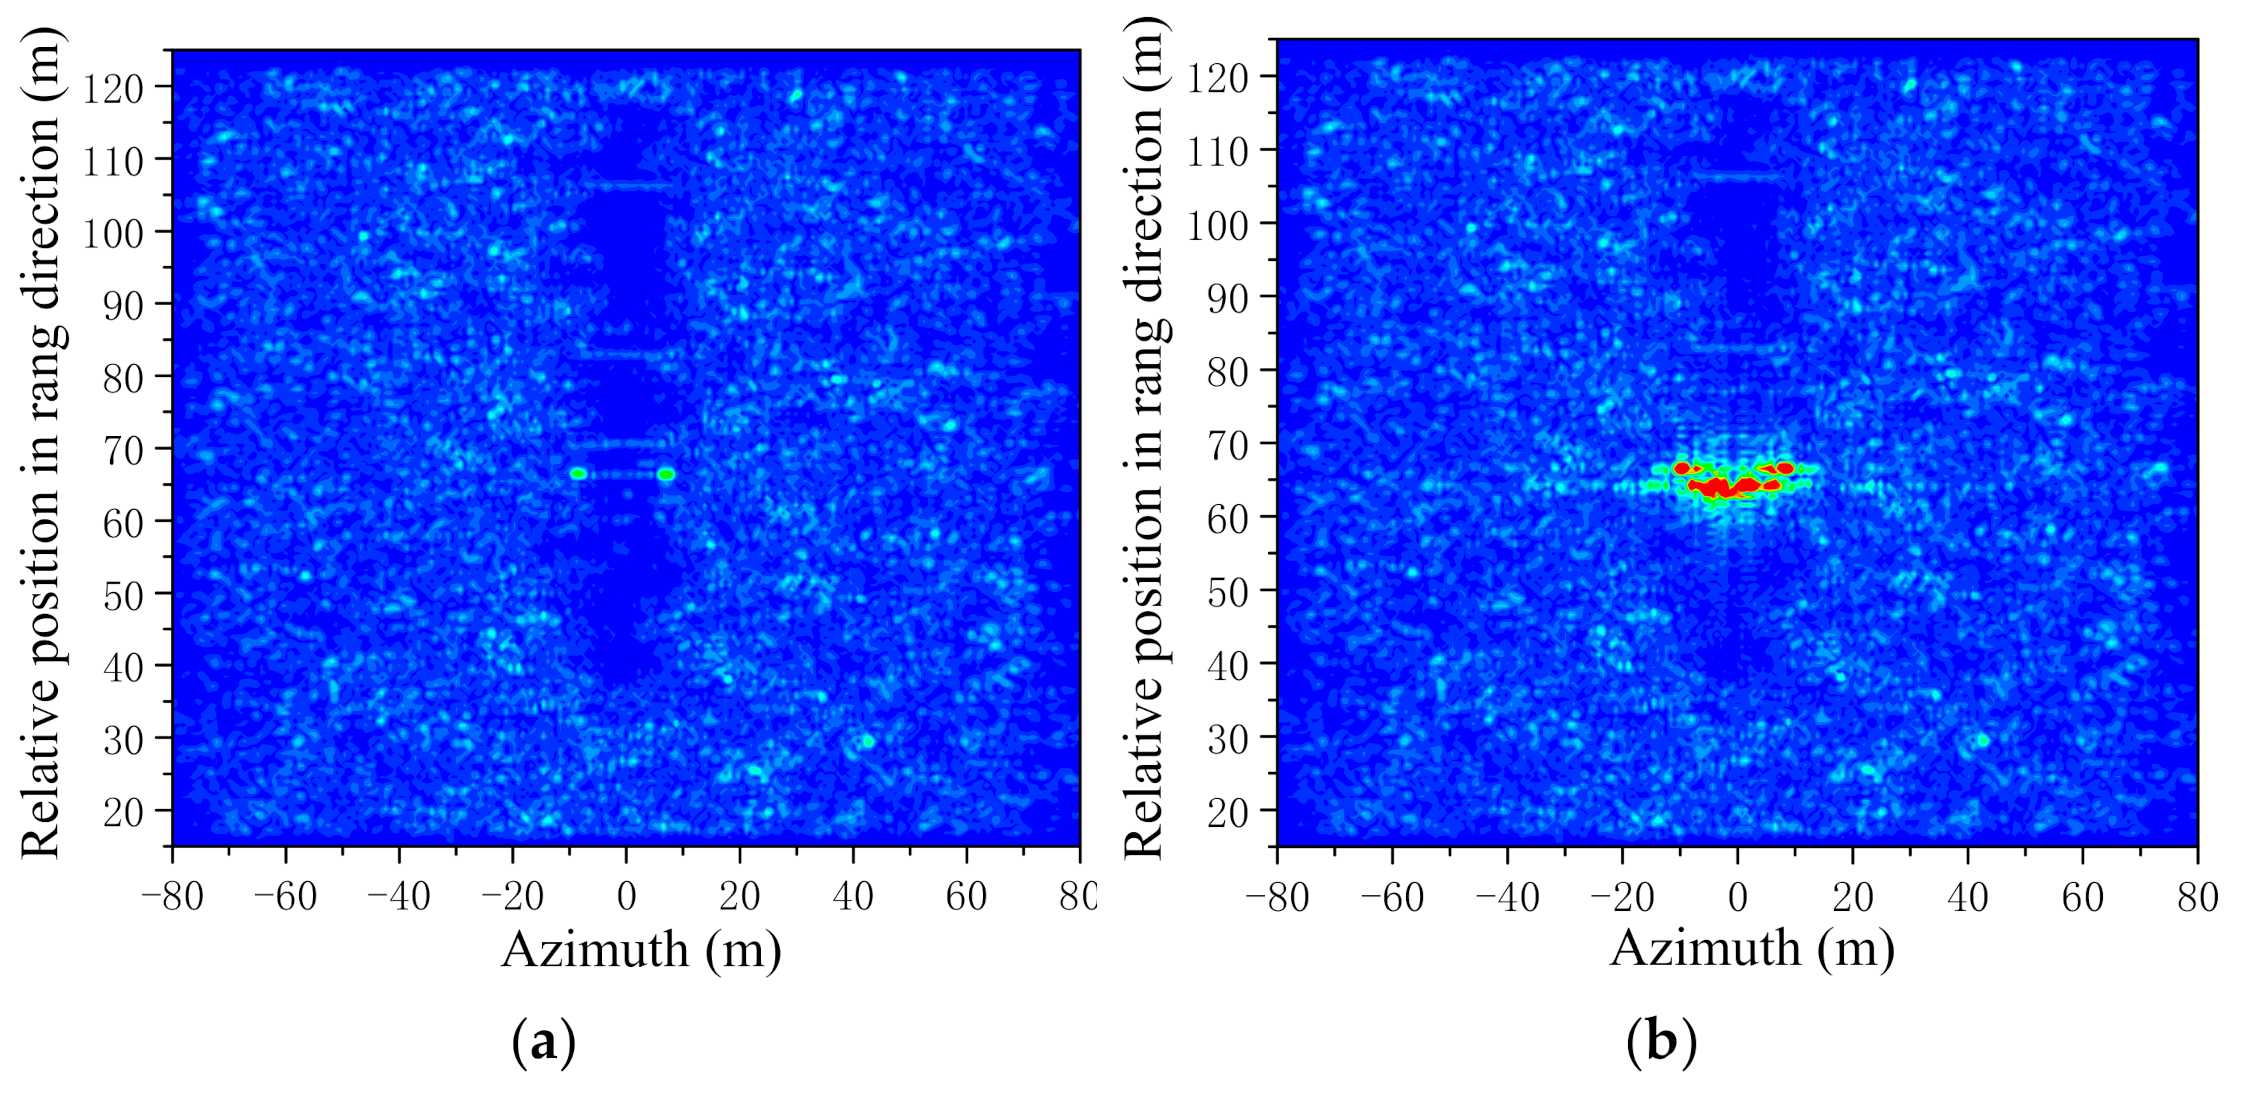
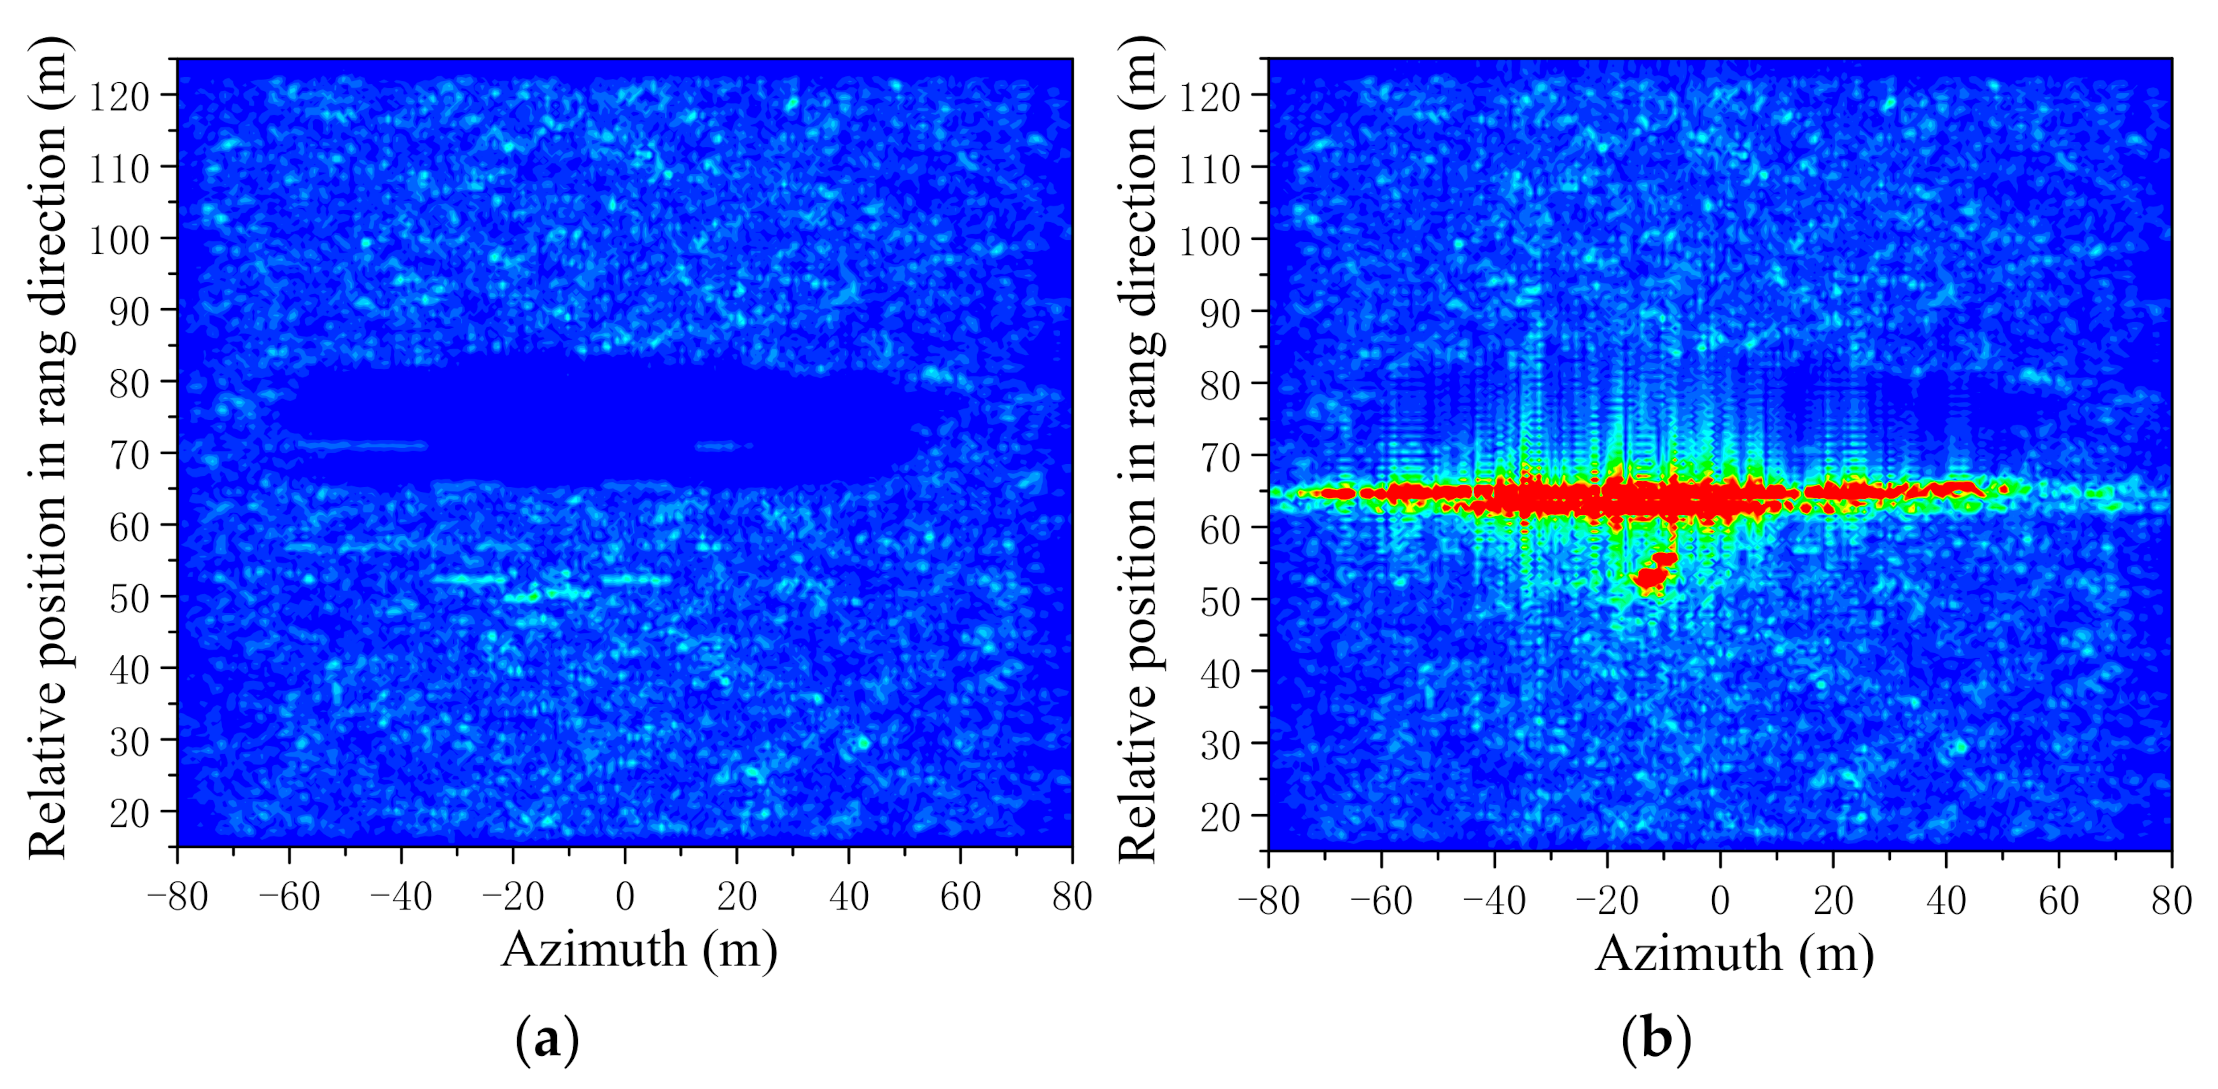
Figure 8 shows the SAR images with the same conditions as in Figure 7, but with the sea surface being dynamic. The synthetic aperture time, , is 0.62 s. Compared to the static one shown in Figure 7, the boundary of the region for the deck is not as clear as the static one. Thus, it is not as easy to detect the shape of the ship as with the static one.
Figure 9 shows the SAR image of the ship on a dynamic sea surface with a longer synthetic aperture time . Because the synthetic aperture time gets longer, the sea surface changes much more and the SAR image of the dynamic sea is blurrier than the one shown in Figure 7. As shown in Figure 7, the dark region corresponding to the ship looks close to the ship’s shape. In this case, it is a feasible method to recognize the ship by analyzing the shape of the dark region. However, this method fails when the dark region is disturbed by the dynamic sea surface. As shown in Figure 9, the area corresponding to the dark region in Figure 7 has a similar texture to the sea surface. In this situation, the strong scattering points are reliable features to recognize the ship. The strong scattering points are caused by the multiple scattering effects, which are considered in the GO/PO method. Comparing Figure 9a,b, there are some scattering points much stronger than the background. These strong scattering points are caused by the multiple scattering effects of the structure marked with the red elliptical frame in Figure 6a. Thus, it is necessary to use the GO/PO method to calculate the multiple scattering effects. Furthermore, the bright region caused by the multiple scattering plays an import role in target recognition, especially for a long synthetic aperture time.
3.2. Efficiency of the Rectangular Wave Beam-Based GO/PO Method
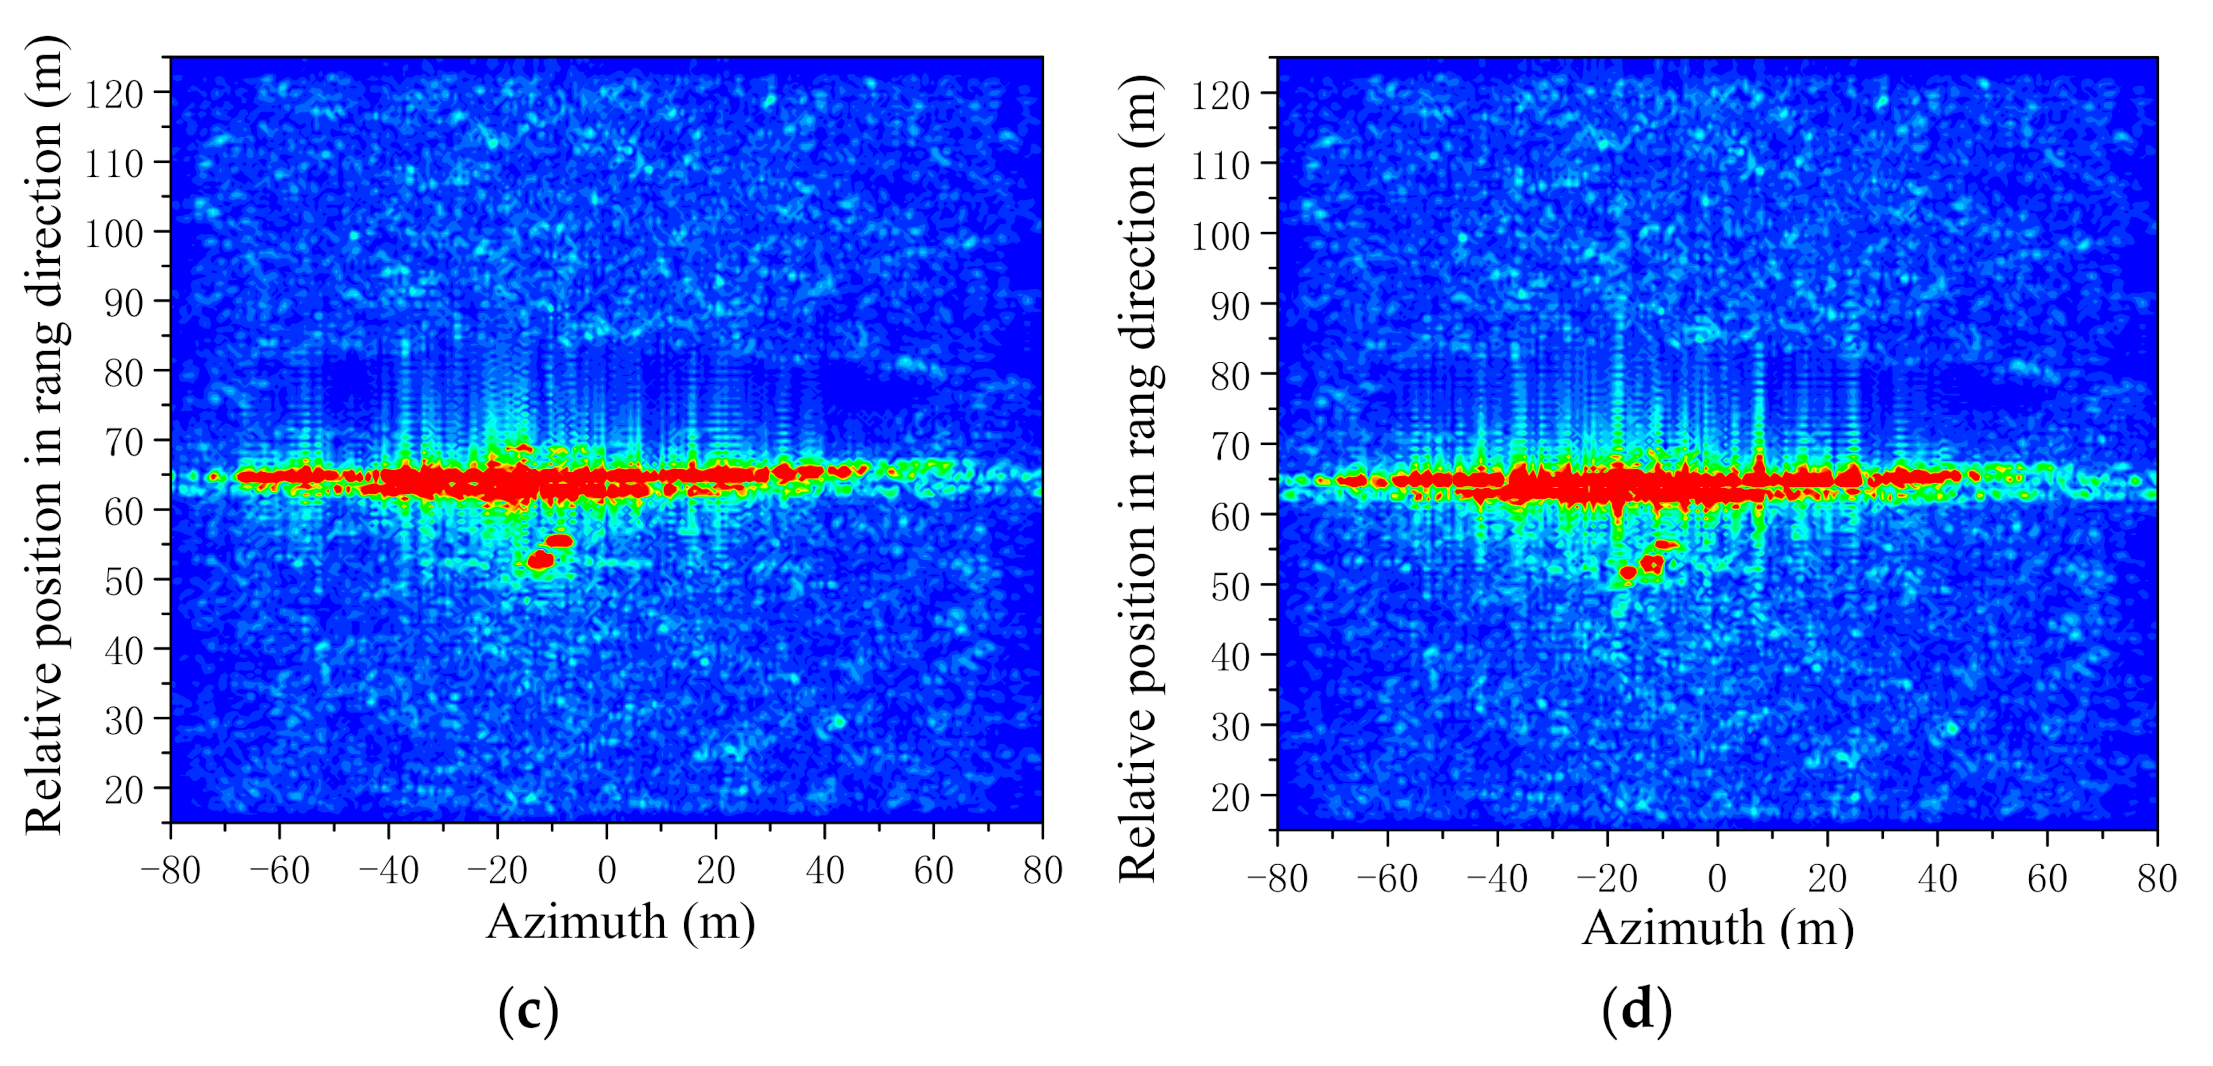
Figure 10a,b shows the SAR images of the scene corresponding to Figure 6b, with the sea surface being dynamic. The SAR imaging conditions are the same as in Figure 8. Comparing these two SAR images, the region below the ship gets brighter when multiple scattering is considered. This is because that the side of the ship and the sea surface form an angular structure marked with the red elliptical frame in Figure 6b. It means that the multiple scattering effects between the target and the background may enhance the scattering echo under special conditions when forming some special structures.
Figure 10 shows the SAR images with different sizes of the pixel matrix. It takes more time to calculate the scattering echoes from the ship when the size of the pixel matrix is larger. Table 1 gives the time to calculate the scattering echo with different matrix sizes. There are 256 frequency components calculated. The time required drastically increases when the size of the matrix is larger. Fortunately, the proposed method is accurate enough with a small size pixel matrix. As shown in Figure 10b,d, the SAR image obtained with the pixel matrix size of 128 × 128 is almost the same as the SAR image with a size of 512 × 512. The proposed rectangular wave beam-based GO/PO method has the ability to improve the efficiency with low errors when the pixel matrix size is small.
4. Conclusions
The scattering echo simulation method in the frequency domain was used to calculate the echo from a ship on a dynamic sea surface. The method introduced considers the EM scattering properties of all the frequencies. Thus, the method is able to simulate the scattering echo for a wideband signal. For a complex ship with many corners, the rectangular wave beam-based GO/PO method can accurately calculate the EM scattering properties when considering multiple scattering effects. The improved GO/PO method is efficient and accurate when the size of the pixel matrix is small. Combined with the SAR imaging process, the rectangular wave beam-based GO/PO method was used to calculate the EM scattering properties of all the frequency components when the radar emits a wideband pulse. With these EM scattering properties, the scattering echo of each pulse can be calculated by using the introduced echo simulation method. The sea surface is dynamic when the radar emits a pulse periodically. The SAR image results show that the static sea surface is quite different from the dynamic sea surface, which gets blurrier as the synthetic aperture time increases. In addition, multiple scattering, which increases the back scattering, has an important impact on the SAR image of a complex target. Therefore, the proposed method can simulate the SAR image of a target on a sea surface. Lastly, the method can improve the simulation efficiency with good accuracy by using a small pixel matrix size.
Author Contributions
Conceptualization, W.-Q.J. and M.Z.; methodology, W.-Q.J.; software, X.-Z.L.; validation, W.-Q.J., and M.Z.; formal analysis, M.Z.; investigation, W.-Q.J.; resources, L.-Y.W.; data curation, G.L.; writing—original draft preparation, W.-Q.J.; writing—review and editing, M.Z.; visualization, W.-Q.J.; supervision, M.Z.; project administration, M.Z.; funding acquisition, W.-Q.J. and M.Z. All authors have read and agreed to the published version of the manuscript.
Funding
This work was supported in part by the National Natural Science Foundation of China under Grant Nos. 61771355 and 41701386, and the National Key Laboratory Foundation under Grant No. 614241103010417/6142A01180206/JCKYS2019204020.
Institutional Review Board Statement
Not applicable.
Informed Consent Statement
Not applicable.
Data Availability Statement
Not applicable.
Conflicts of Interest
The authors declare no conflict of interest.
References
- Dong, G.; Kuang, G. Classification on the Monogenic Scale Space: Application to Target Recognition in SAR Image. IEEE Trans. Image Process. 2015, 24, 2527–2539. [Google Scholar] [CrossRef] [PubMed]
- Zhao, P.; Liu, K.; Zou, H.; Zhen, X. Multi-Stream Convolutional Neural Network for SAR Automatic Target Recognition. Remote Sens. 2018, 10, 1473. [Google Scholar] [CrossRef] [Green Version]
- Kajbaf, H.; Case, J.T.; Yang, Z.; Zheng, Y.R. Compressed Sensing for SAR-based Wideband Three-dimensional Microwave Imaging System Using Non-uniform Fast Fourier Transform. IET Radar Sonar Navig. 2013, 7, 658–670. [Google Scholar] [CrossRef]
- Peng, X.; Wang, Y.; Hong, W.; Tan, W.; Wu, Y. Autonomous Navigation Airborne Forward-Looking SAR High Precision Imaging with Combination of Pseudo-Polar Formatting and Overlapped Sub-Aperture Algorithm. Remote Sens. 2013, 5, 6063–6078. [Google Scholar] [CrossRef] [Green Version]
- Gao, G.; Liu, L.; Zhao, L.; Shi, G.; Kuang, G. An adaptive and fast CFAR algorithm based on automatic censoring for target detection in high-resolution SAR images. IEEE Trans. Geosci. Remote Sens. 2009, 47, 1685–1697. [Google Scholar] [CrossRef]
- Pourmottaghi, A.; Gazor, S. A CFAR detector in a nonhomogenous Weibull clutter. IEEE Trans. Aerosp. Electron. Syst. 2012, 48, 1747–1758. [Google Scholar] [CrossRef]
- Hou, B.; Chen, X.; Jiao, L. Multilayer CFAR detection of ship targets in very high resolution SAR images. IEEE Geosci. Remote Sens. Lett. 2015, 12, 811–815. [Google Scholar]
- Leng, X.; Ji, K.; Yang, K.; Zou, H.X. A bilateral CFAR algorithm for ship detection in SAR images. IEEE Geosci. Remote Sens. Lett. 2015, 12, 1536–1540. [Google Scholar] [CrossRef]
- Wang, X.; Chen, C. Adaptive ship detection in SAR images using variance WIE-based method. Signal, Image Video Process 2016, 10, 1219–1224. [Google Scholar] [CrossRef]
- Wang, X.; Chen, C. Ship Detection for Complex Background SAR Images Based on a Multiscale Variance Weighted Image Entropy Method. IEEE Geosci. Remote Sens. Lett. 2017, 14, 184–187. [Google Scholar] [CrossRef]
- Geng, X.; Shi, L.; Yang, J.; Li, P.; Zhao, L.; Sun, W.; Zhao, J. Ship Detection and Feature Visualization Analysis Based on Lightweight CNN in VH and VV Polarization Images. Remote Sens. 2021, 13, 1184. [Google Scholar] [CrossRef]
- You, J.; Hu, Z.; Peng, C.; Wang, Z. Generation and Annotation of Simulation-Real Ship Images for Convolutional Neural Networks Training and Testing. Appl. Sci. 2021, 11, 5931. [Google Scholar] [CrossRef]
- Zhao, Y.W.; Zhou, P.; Zhang, X.; Zhang, M. Application of improved equivalent edge currents in synthetic aperture radar imaging. J. Syst. Eng. Electron. 2010, 21, 556–571. [Google Scholar] [CrossRef]
- Chen, H.; Zhang, M.; Zhao, Y.W.; Luo, W. An Efficient Slope-deterministic Facet Model for SAR Imagery Simulation of Marine Scene. IEEE Trans. Antennas Propag. 2010, 58, 3751–3756. [Google Scholar] [CrossRef]
- Ghavidel, A.; Camps, A. Time-domain Statistics of the Electromagnetic Bias in GNSS-Reflectometry. Remote Sens. 2013, 7, 11151–11162. [Google Scholar] [CrossRef] [Green Version]
- Tao, Y.B.; Lin, H.; Bao, H.J. Kd-tree Based Fast Ray Tracing for RCS Prediction. Prog. Electromagn. Res. 2008, 81, 329–341. [Google Scholar] [CrossRef] [Green Version]
- Rius, J.M.; Ferrando, M.; Jofre, L. GRECO: Graphical Electromagnetic Computing for RCS Prediction in Real Time. IEEE Antennas Propag. Mag. 1993, 35, 7–17. [Google Scholar] [CrossRef] [Green Version]
- Wei, P.B.; Zhang, M.; Niu, W.; Jiang, W.Q. GPU-Based Combination of GO and PO for Electromagnetic Scattering of Satellite. IEEE Trans. Antennas Propag. 2012, 60, 5278–5285. [Google Scholar] [CrossRef]
- Jiang, W.Q.; Zhang, M.; Zhao, Y.; Nie, D.; Jiao, Y.C. Rectangular Wave Beam Based GO/PO Method for RCS Simulation of Complex Target. Prog. Electromagn. Res. M 2017, 53, 53–65. [Google Scholar] [CrossRef] [Green Version]
- Jiang, W.Q.; Zhang, M.; Nie, D.; Jiao, Y.C. Improved GO/PO method and its application to wideband SAR image of conducting objects over rough surface. Waves Random Complex Media 2018, 28, 310–325. [Google Scholar] [CrossRef]
- Neo, Y.L.; Wong, F.H.; Cumming, I.G. Processing of Azimuth-Invariant Bistatic SAR Data Using the Range Doppler Algorithm. IEEE Trans. Geosci. Remote Sens. 2008, 46, 14–21. [Google Scholar] [CrossRef] [Green Version]
- Li, Z.; Wang, J.; Liu, Q.H. Frequency-domain backprojection algorithm for synthetic aperture radar imaging. IEEE Geosci. Remote Sens. Lett. 2015, 12, 905–909. [Google Scholar]
- Tong, X.; Bao, M.; Sun, G.; Han, L.; Zhang, Y.; Xing, M. Refocusing of Moving Ships in Squint SAR Images Based on Spectrum Orthogonalization. Remote Sens. 2021, 13, 2807. [Google Scholar] [CrossRef]
- Elfouhaily, T.; Chapron, B.; Katarsos, K. A unified directional spectrum for long and short wind-driven waves. J. Geophys. Res. 1997, 102, 15781–15796. [Google Scholar] [CrossRef]
- Longuet-Higgins, M.S.; Cartwright, D.E.; Smith, N.D. Observations of the directional spectrum of sea waves using the motions of a floating buoy. In Ocean Wave Spectra; Prentice-Hall: Hoboken, NJ, USA, 1963; pp. 111–132. [Google Scholar] [CrossRef]
Figure 1.
Normalized spectrum of a signal: (a) emission signal; (b) scattering echo.

Figure 2.
Schematic diagram of the scene.

Figure 3.
SAR images of the cubes: (a) = 4 m, B = 0.0375 GHz; (b) = 2 m, B = 0.075 GHz; (c) = 1 m, B = 0.15 GHz; (d) = 0.5 m, B = 0.3 GHz.
Figure 3.
SAR images of the cubes: (a) = 4 m, B = 0.0375 GHz; (b) = 2 m, B = 0.075 GHz; (c) = 1 m, B = 0.15 GHz; (d) = 0.5 m, B = 0.3 GHz.

Figure 4.
Schematic diagram of a small rectangular ray.

Figure 5.
Sea surface with a wind speed of 5 m/s.

Figure 6.
Model of a ship on a dynamic sea surface with different orientations: (a) perpendicular to the moving direction of the airborne radar; (b) parallel to the moving direction of the airborne radar.
Figure 6.
Model of a ship on a dynamic sea surface with different orientations: (a) perpendicular to the moving direction of the airborne radar; (b) parallel to the moving direction of the airborne radar.

Figure 7.
SAR images of the ship on a static sea surface: (a) single scattering; (b) multiple scattering.
Figure 7.
SAR images of the ship on a static sea surface: (a) single scattering; (b) multiple scattering.

Figure 8.
SAR images of a ship on a dynamic sea surface (0.62 s): (a) single scattering; (b) multiple scattering.
Figure 8.
SAR images of a ship on a dynamic sea surface (0.62 s): (a) single scattering; (b) multiple scattering.

Figure 9.
SAR images of a ship on a dynamic sea surface (1.86 s): (a) single scattering; (b) multiple scattering.
Figure 9.
SAR images of a ship on a dynamic sea surface (1.86 s): (a) single scattering; (b) multiple scattering.

Figure 10.
SAR images with different sizes of the pixel matrices: (a) single scattering (128×128); (b) multiple scattering (128×128); (c) multiple scattering (256×256); (d) multiple scattering (512×512).
Figure 10.
SAR images with different sizes of the pixel matrices: (a) single scattering (128×128); (b) multiple scattering (128×128); (c) multiple scattering (256×256); (d) multiple scattering (512×512).


Table 1.
Simulation time of the EM scattering field for one pulse (256 frequency components) *.
| Pixel Matrix Size | Time Needed with Proposed Method (s) |
|---|---|
| 128×128 | 16.364 |
| 256 × 256 | 65.224 |
| 512×512 | 260.925 |
* Calculated by computer with Intel CoreTM i7-6700K CPU and NVIDIA GeForce GTX 1080 display card.
Publisher’s Note: MDPI stays neutral with regard to jurisdictional claims in published maps and institutional affiliations. |
© 2021 by the authors. Licensee MDPI, Basel, Switzerland. This article is an open access article distributed under the terms and conditions of the Creative Commons Attribution (CC BY) license (https://creativecommons.org/licenses/by/4.0/).
Share and Cite
MDPI and ACS Style
Jiang, W.-Q.; Wang, L.-Y.; Li, X.-Z.; Liu, G.; Zhang, M. Simulation of a Wideband Radar Echo of a Target on a Dynamic Sea Surface. Remote Sens. 2021, 13, 3186. https://0-doi-org.brum.beds.ac.uk/10.3390/rs13163186
AMA Style
Jiang W-Q, Wang L-Y, Li X-Z, Liu G, Zhang M. Simulation of a Wideband Radar Echo of a Target on a Dynamic Sea Surface. Remote Sensing. 2021; 13(16):3186. https://0-doi-org.brum.beds.ac.uk/10.3390/rs13163186
Chicago/Turabian StyleJiang, Wang-Qiang, Liu-Ying Wang, Xin-Zhuo Li, Gu Liu, and Min Zhang. 2021. "Simulation of a Wideband Radar Echo of a Target on a Dynamic Sea Surface" Remote Sensing 13, no. 16: 3186. https://0-doi-org.brum.beds.ac.uk/10.3390/rs13163186
Note that from the first issue of 2016, this journal uses article numbers instead of page numbers. See further details here.