Article

Study on the Creep-Sliding Mechanism of the Giant Xiongba Ancient Landslide Based on the SBAS-InSAR Method, Tibetan Plateau, China

1
Institute of Geomechanics, Chinese Academy of Geological Sciences, Beijing 100081, China
2
Key Laboratory of Active Tectonics and Geo-Safety, Ministry of Natural Resources, Beijing 100081, China
3
School of Earth Sciences and Resources, China University of Geosciences, Beijing 100083, China
4
Institute of Hydrogeology and Environmental Geology, Chinese Academy of Geosciences, Shijiazhuang 050061, China
*
Author to whom correspondence should be addressed.
Remote Sens. 2021, 13(17), 3365; https://0-doi-org.brum.beds.ac.uk/10.3390/rs13173365
Submission received: 13 July 2021 / Revised: 17 August 2021 / Accepted: 18 August 2021 / Published: 25 August 2021
(This article belongs to the Special Issue SAR Imagery for Landslide Detection and Prediction)

Abstract

:
The geohazards associated with strongly deformed and reactivated large-scale ancient landslide are analyzed through a study of the Xiongba ancient landslide. The SBAS-InSAR method, combined with remote sensing interpretation, was used to obtain the Xiongba ancient landslide surface deformation characteristics, on the western bank of the Jinsha River, during the period from October 2017 to June 2020. Two large strong deformation zones were discovered in this study, H1 and H2, which were located at the front edge of the Xiongba landslide. The maximum cumulative deformation in the H1 deformation zone was approximately 204 mm, and the deformation in the H2 deformation zone was approximately 302 mm. Influenced by the Jinsha River erosion, the Baige landslide-dammed lake-dam breakage-debris (LDLDB) flow/flood hazard chains, which occurred 75 km upstream reaches in October and November 2018, and the erosion of the foot of the Xiongba ancient landslide foot resulted in notably enhanced deformation. The creep rate in the H1 deformation zone was 14~16 times that before the Baige landslide hazard chains occurred, and the hazard chains caused sliding in the H2 zone. The Xiongba ancient landslide is undergoing retrogressive reactivation. The Xiongba ancient landslide is currently experiencing continuously creep-sliding, and the deformation rate in some areas is accelerating, which may induce a large-scale reactivation of the Xiongba ancient landslide and an LDLDB hazard chain.

Graphical Abstract

1. Introduction

The upper Jinsha River is located on the eastern edge of the Tibetan Plateau, which features a complex geological structure, such as dense faults and folds, deep-cutting valleys and strong neotectonic movements. A series of large to giant ancient landslides and newly occurring landslides are densely developed in this area, especially under the combined effect of internal and external dynamics [1,2,3,4,5]. Typical ancient landslides, such as the Temi [6] and Zhubalong ancient landslides [7], have caused dammed lake-dam breakage-debris flow hazard chains. In addition to the ancient landslides developed in this area, some newly occurring landslide-dammed lake-dam breakage (LDLDB) hazard chains have caused many episodes of heavy economic losses in recent years. For example, in October and November 2018, two landslides occurred successively in Baige village, Jiangda County, Tibet, China, which successively dammed the main stream of the Jinsha River and formed a barrier lake that broke after several days [8,9,10].
The Xiongba giant ancient landslide is located on the western bank of the Jinsha River, Xiongba village, Gongjue County, Tibet, and is also located in the Jinsha River active tectonic zone [11]. The topography and geological structures in this area are very complex, with quite variable lithologies. Remote sensing interpretation and field investigation revealed the Xiongba ancient landslide to be a circular chair-like landform, with a length of 2.13 km, a width of 2.68 km, a plane area of approximately 5.33 km2, and a thickness of approximately 50~110 m [12]. The volume of the landslide is estimated to be approximately 2.6 × 10⁸~6.0 × 10⁸ m3. The front edge of the landslide has been locally deformed and slipped under gravity and river erosion, and the middle and front edges of the landslide have deformational features, such as tensile cracks. The stability and development characteristics of the Xiongba ancient landslide have an important impact on the safety of some large construction projects, such as the Sichuan-Tibet Railway and hydropower stations that have recently been planned and constructed in this area [13,14].
Large ancient landslide formation, reactivation mechanisms, and stability have long been key research issues, especially in hazard prevention and mitigation worldwide. Many methods have been used to study large ancient landslide deformation study, such as field geological surveys, remote sensing monitoring, and global navigation satellite system (GNSS) displacement monitoring. Technical methods have been developed and applied in recent years, such as differential interferometric synthetic aperture radar (D-InSAR) [15], permanent scatterer interferometric synthetic aperture radar (PS-InSAR) [16], and small baseline subset interferometric synthetic aperture radar (SBAS-InSAR) [17,18]. Compared with traditional monitoring methods, such as GNSS, optical remote sensing, and geophysical prospecting [19,20,21], the InSAR technology has the advantages of a wide monitoring range, high point density and high accuracy, and is less dependent on natural geography and weather conditions [22,23]. After the Baige LDLDB hazard chains occurred in 2018, the debris flow/flood impact area reached Hutiao Gorge in Yunnan, 700 km downstream of the Baige landslide location. Large displacements and deformations occurred locally in the Xiongba ancient landslide, which is located 75 km downstream the Baige landslide, and the Xiongba landslide position please find in the Supplementary Materials. Local villages have been relocated, and residents have been resettled under the action of the government. However, the deformation of these ancient landslides, especially another violent slide, might dam the Jinsha River again, and the resulting dammed lake-dam breakage-debris flow hazard chains could have serious consequences. Therefore, based on the SBAS-InSAR deformation analysis method, this study carried out remote sensing and field geological surveys to determine the deformation characteristics of the Xiongba ancient landslide, during the period from October 2017 to June 2020. This paper analyzes the deformational trend of the Xiongba ancient landslide and discusses the effects of the outburst flood caused by the breach of the upstream landslide dam. The research results and understanding could provide basic data and scientific support for major project planning and construction in this area and geohazard prevention and mitigation throughout the watershed.

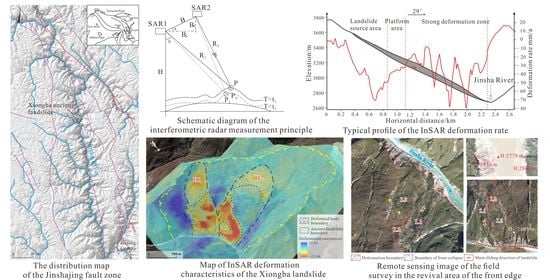
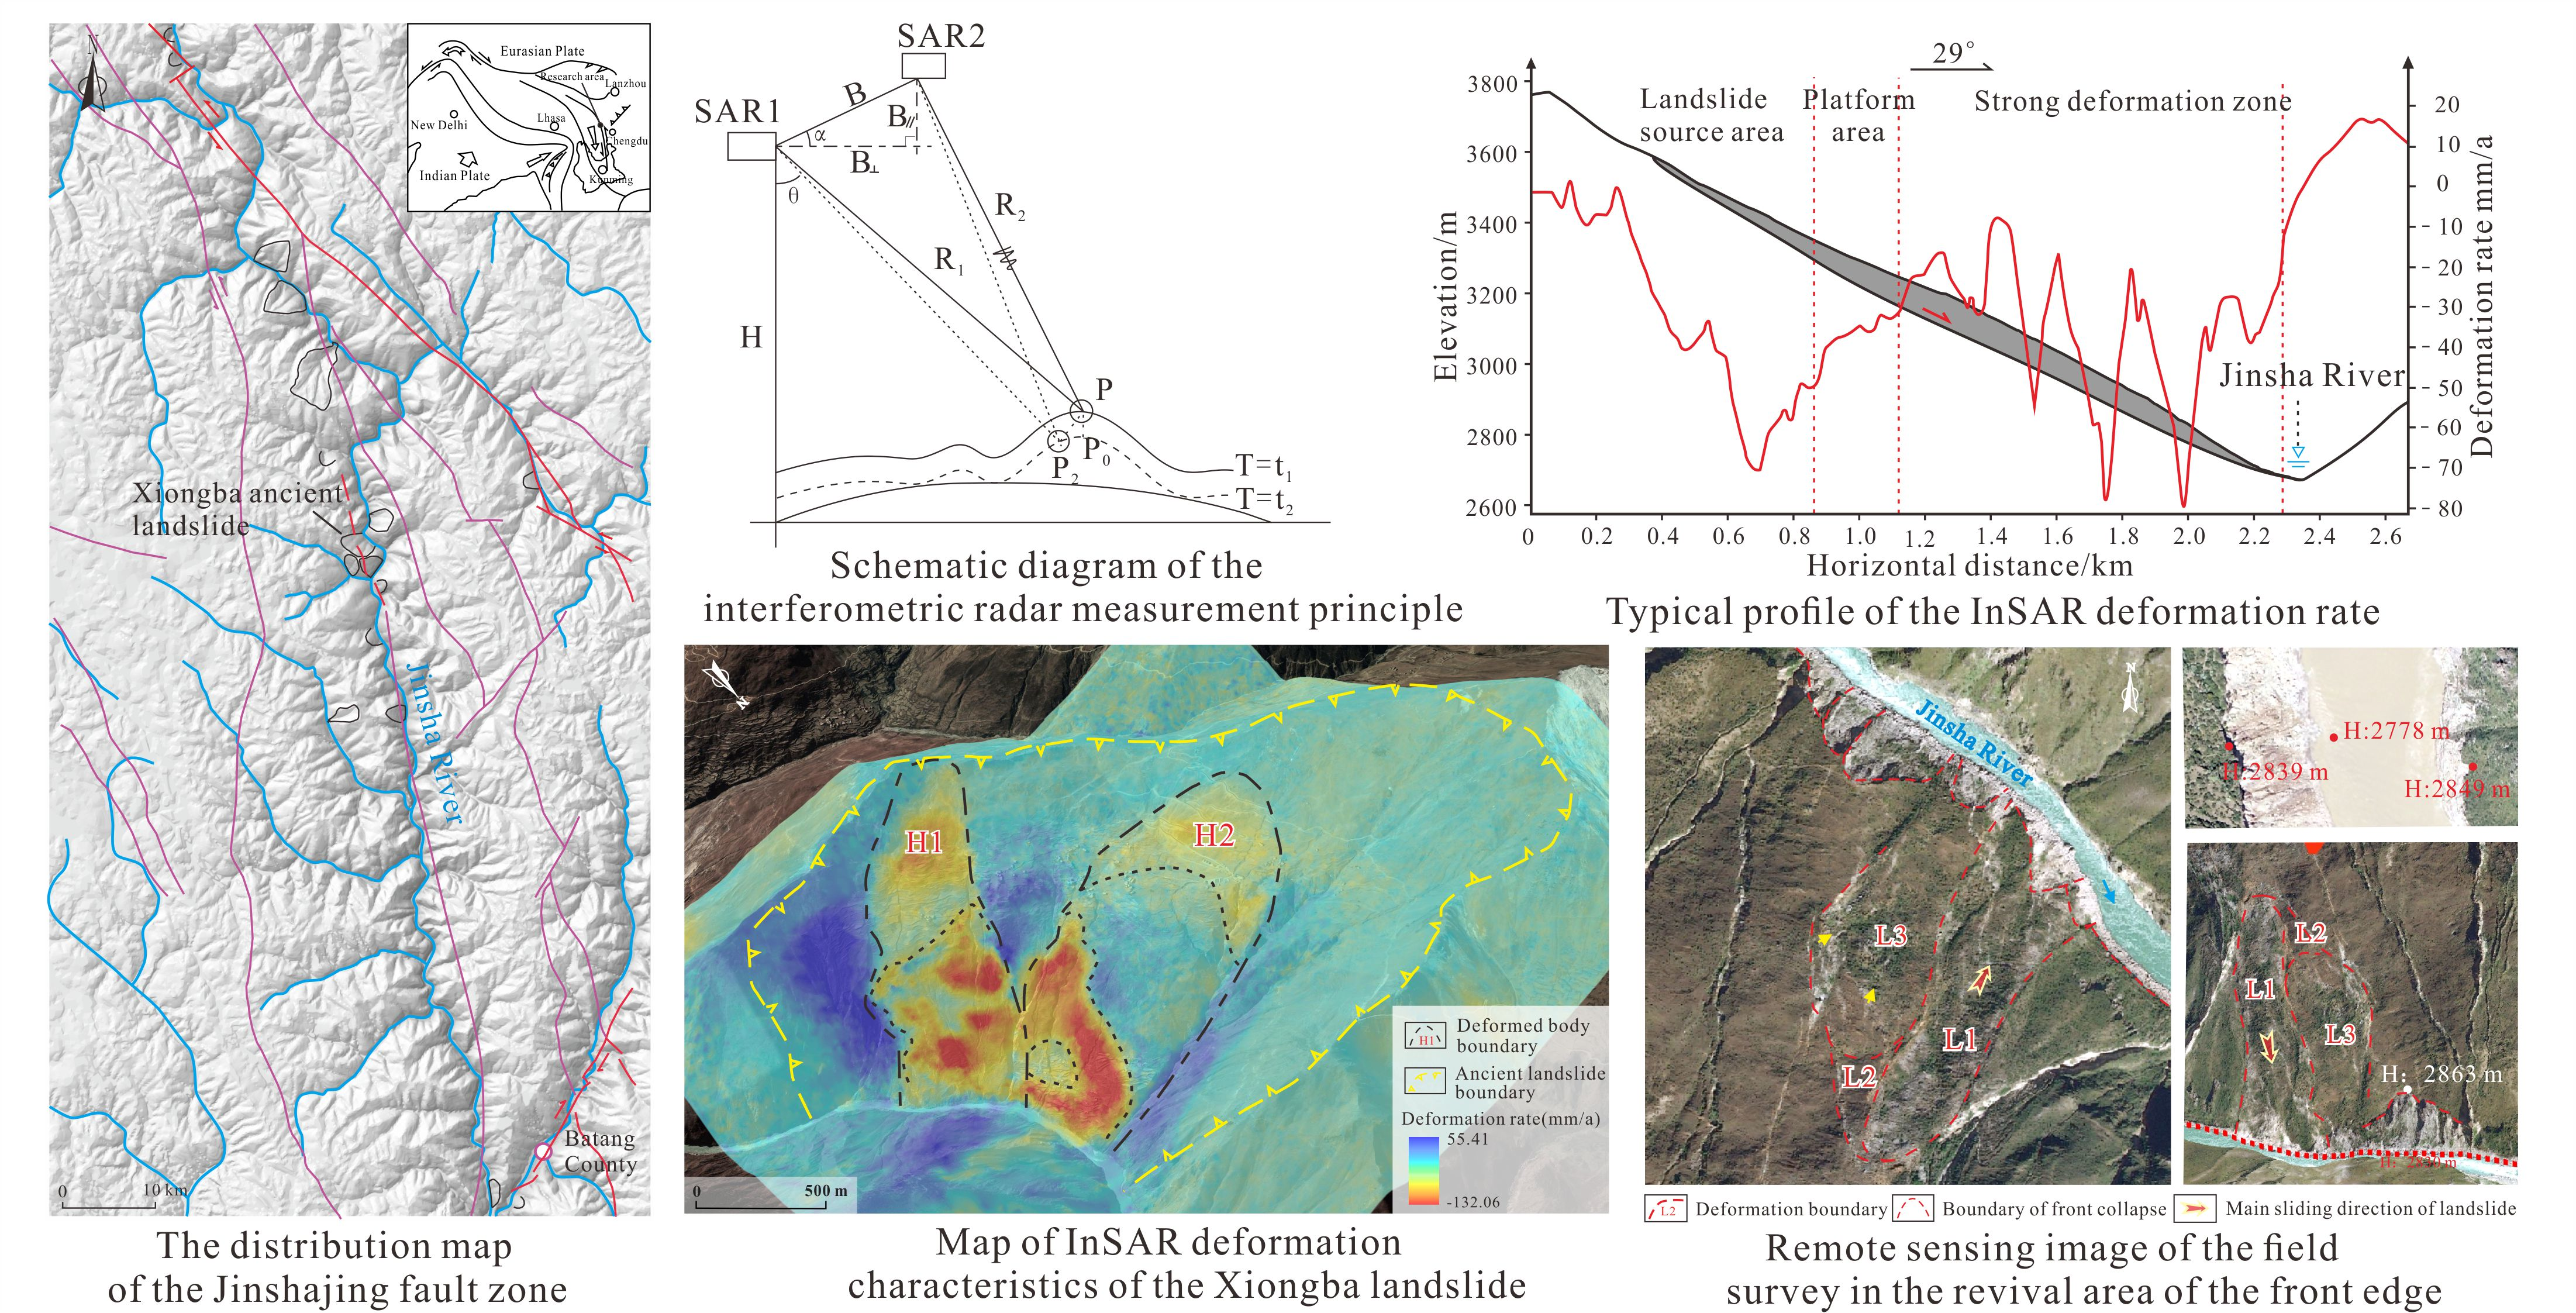
2. Geology Background

The Jinsha River fault zone is located on the eastern Tibetan Plateau, and the Baige-Batang section along the Jinsha River has extremely complex topography, geomorphology and geological structures, as well as high terrain relief. The elevation of the Jinsha River is approximately 2600~2800 m, and the highest elevations on both sides of the river are approximately 3652~4100 m. The valley height difference is approximately 900~1300 m, with average slopes of 15~30°, and the maximum slope exceeds 60° at the steep toe of the slope. Due to neotectonic movements and river erosion, geohazards in this area are extremely developed. For example, the Baige landslide with a volume of 2 × 10⁷~2.5 × 10⁷ m3 occurred in 2018, and two successive LDLDB hazard chains occurred.
More than 20 large-scale landslides and debris flows are developed in the section from Baiyu County to Batang County in the upper reaches of the Jinsha River; for example, the Guili landslide, Sela landslide, Rina landslide, Xiongba ancient landslide and Muruxue debris flow are all large to giant geohazards distributed along the Jinsha River (Figure 1). Some landslides are active, with deep creeping and sliding and large amounts of local deformation.
The Xiongba ancient landslide is located in Xiongba village, Shadong town, Gongjue County, Tibet, China, on the western bank of the Jinsha River. The Jinsha River fault zone and the Luona-Buxu fault pass through the middle and rear of the Xiongba ancient landslide. The stratum exposed in the landslide body is mainly mica quartz schist of the Lower Permian Gangtuoyan Formation (PT1g). The Quaternary gravel soil and a residual gravel soil layer are exposed at the surface. Due to the historical Jinsha River fault zone activities, the rock masses are broken in this area, with quite variable stratum occurrences. The local structural breccias have strong silicification and limonite mineralization in this area.

3. Engineering Geological Characteristics of the Xiongba Ancient Landslide

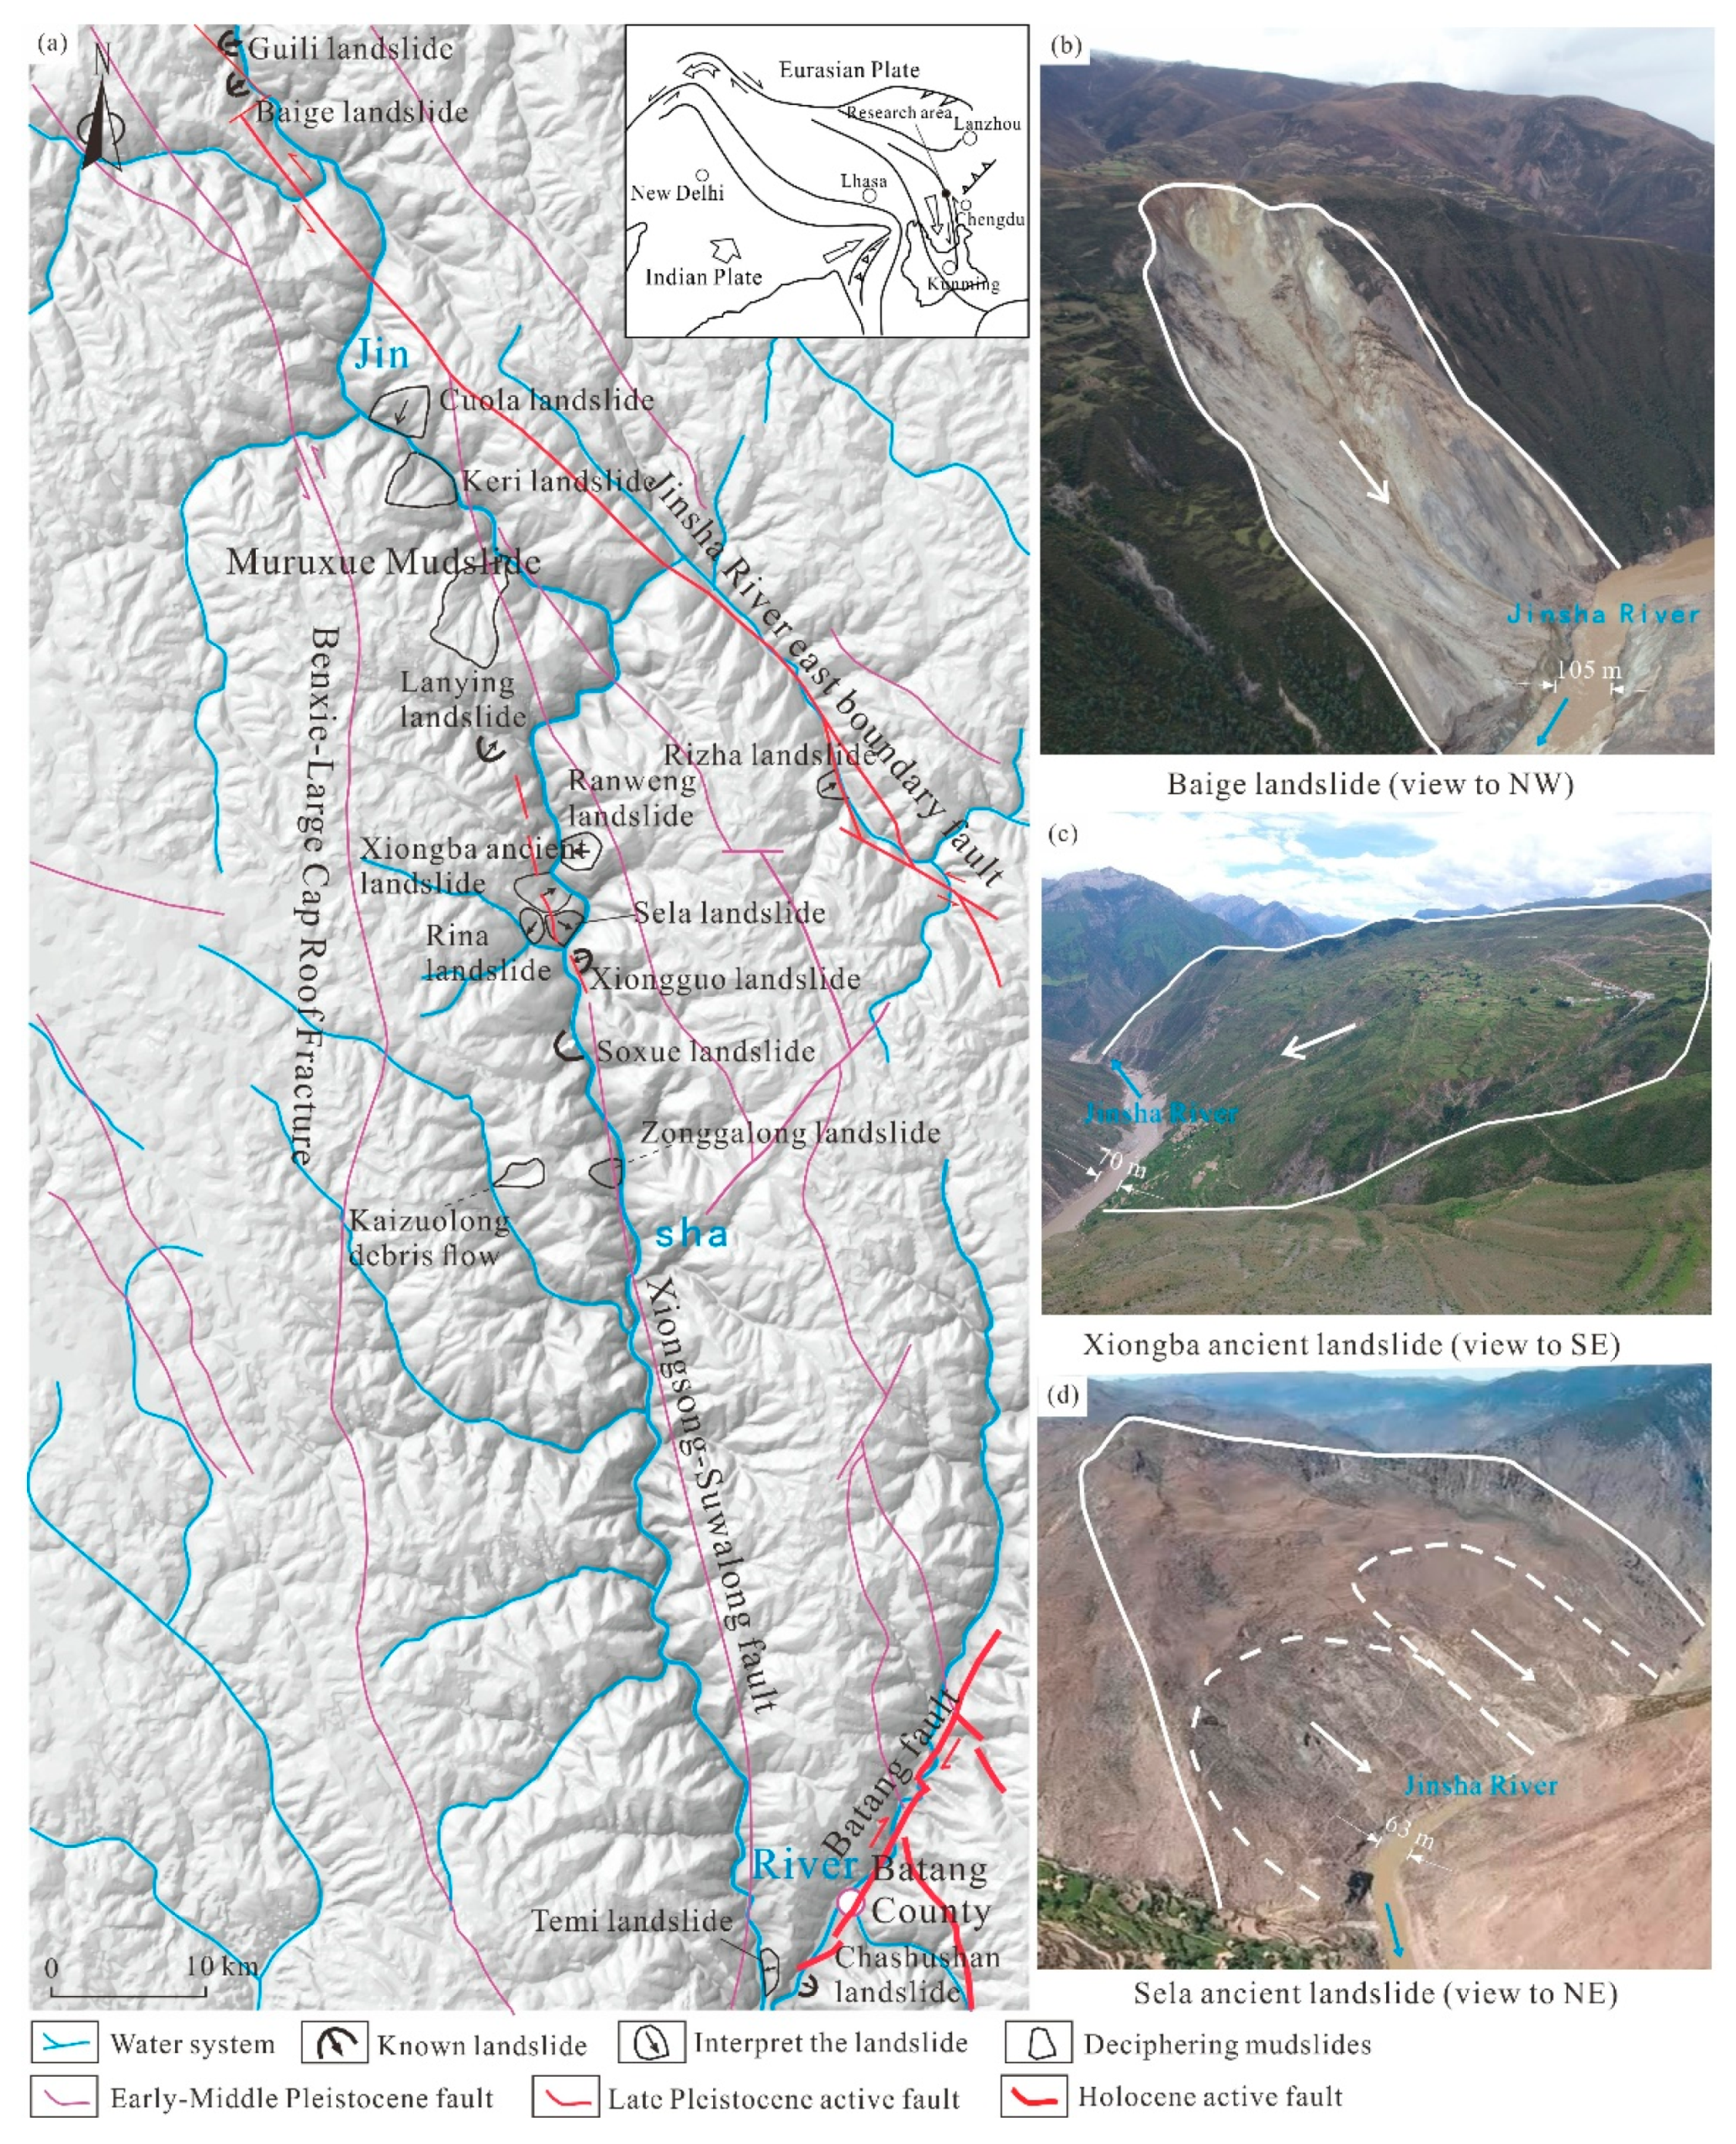
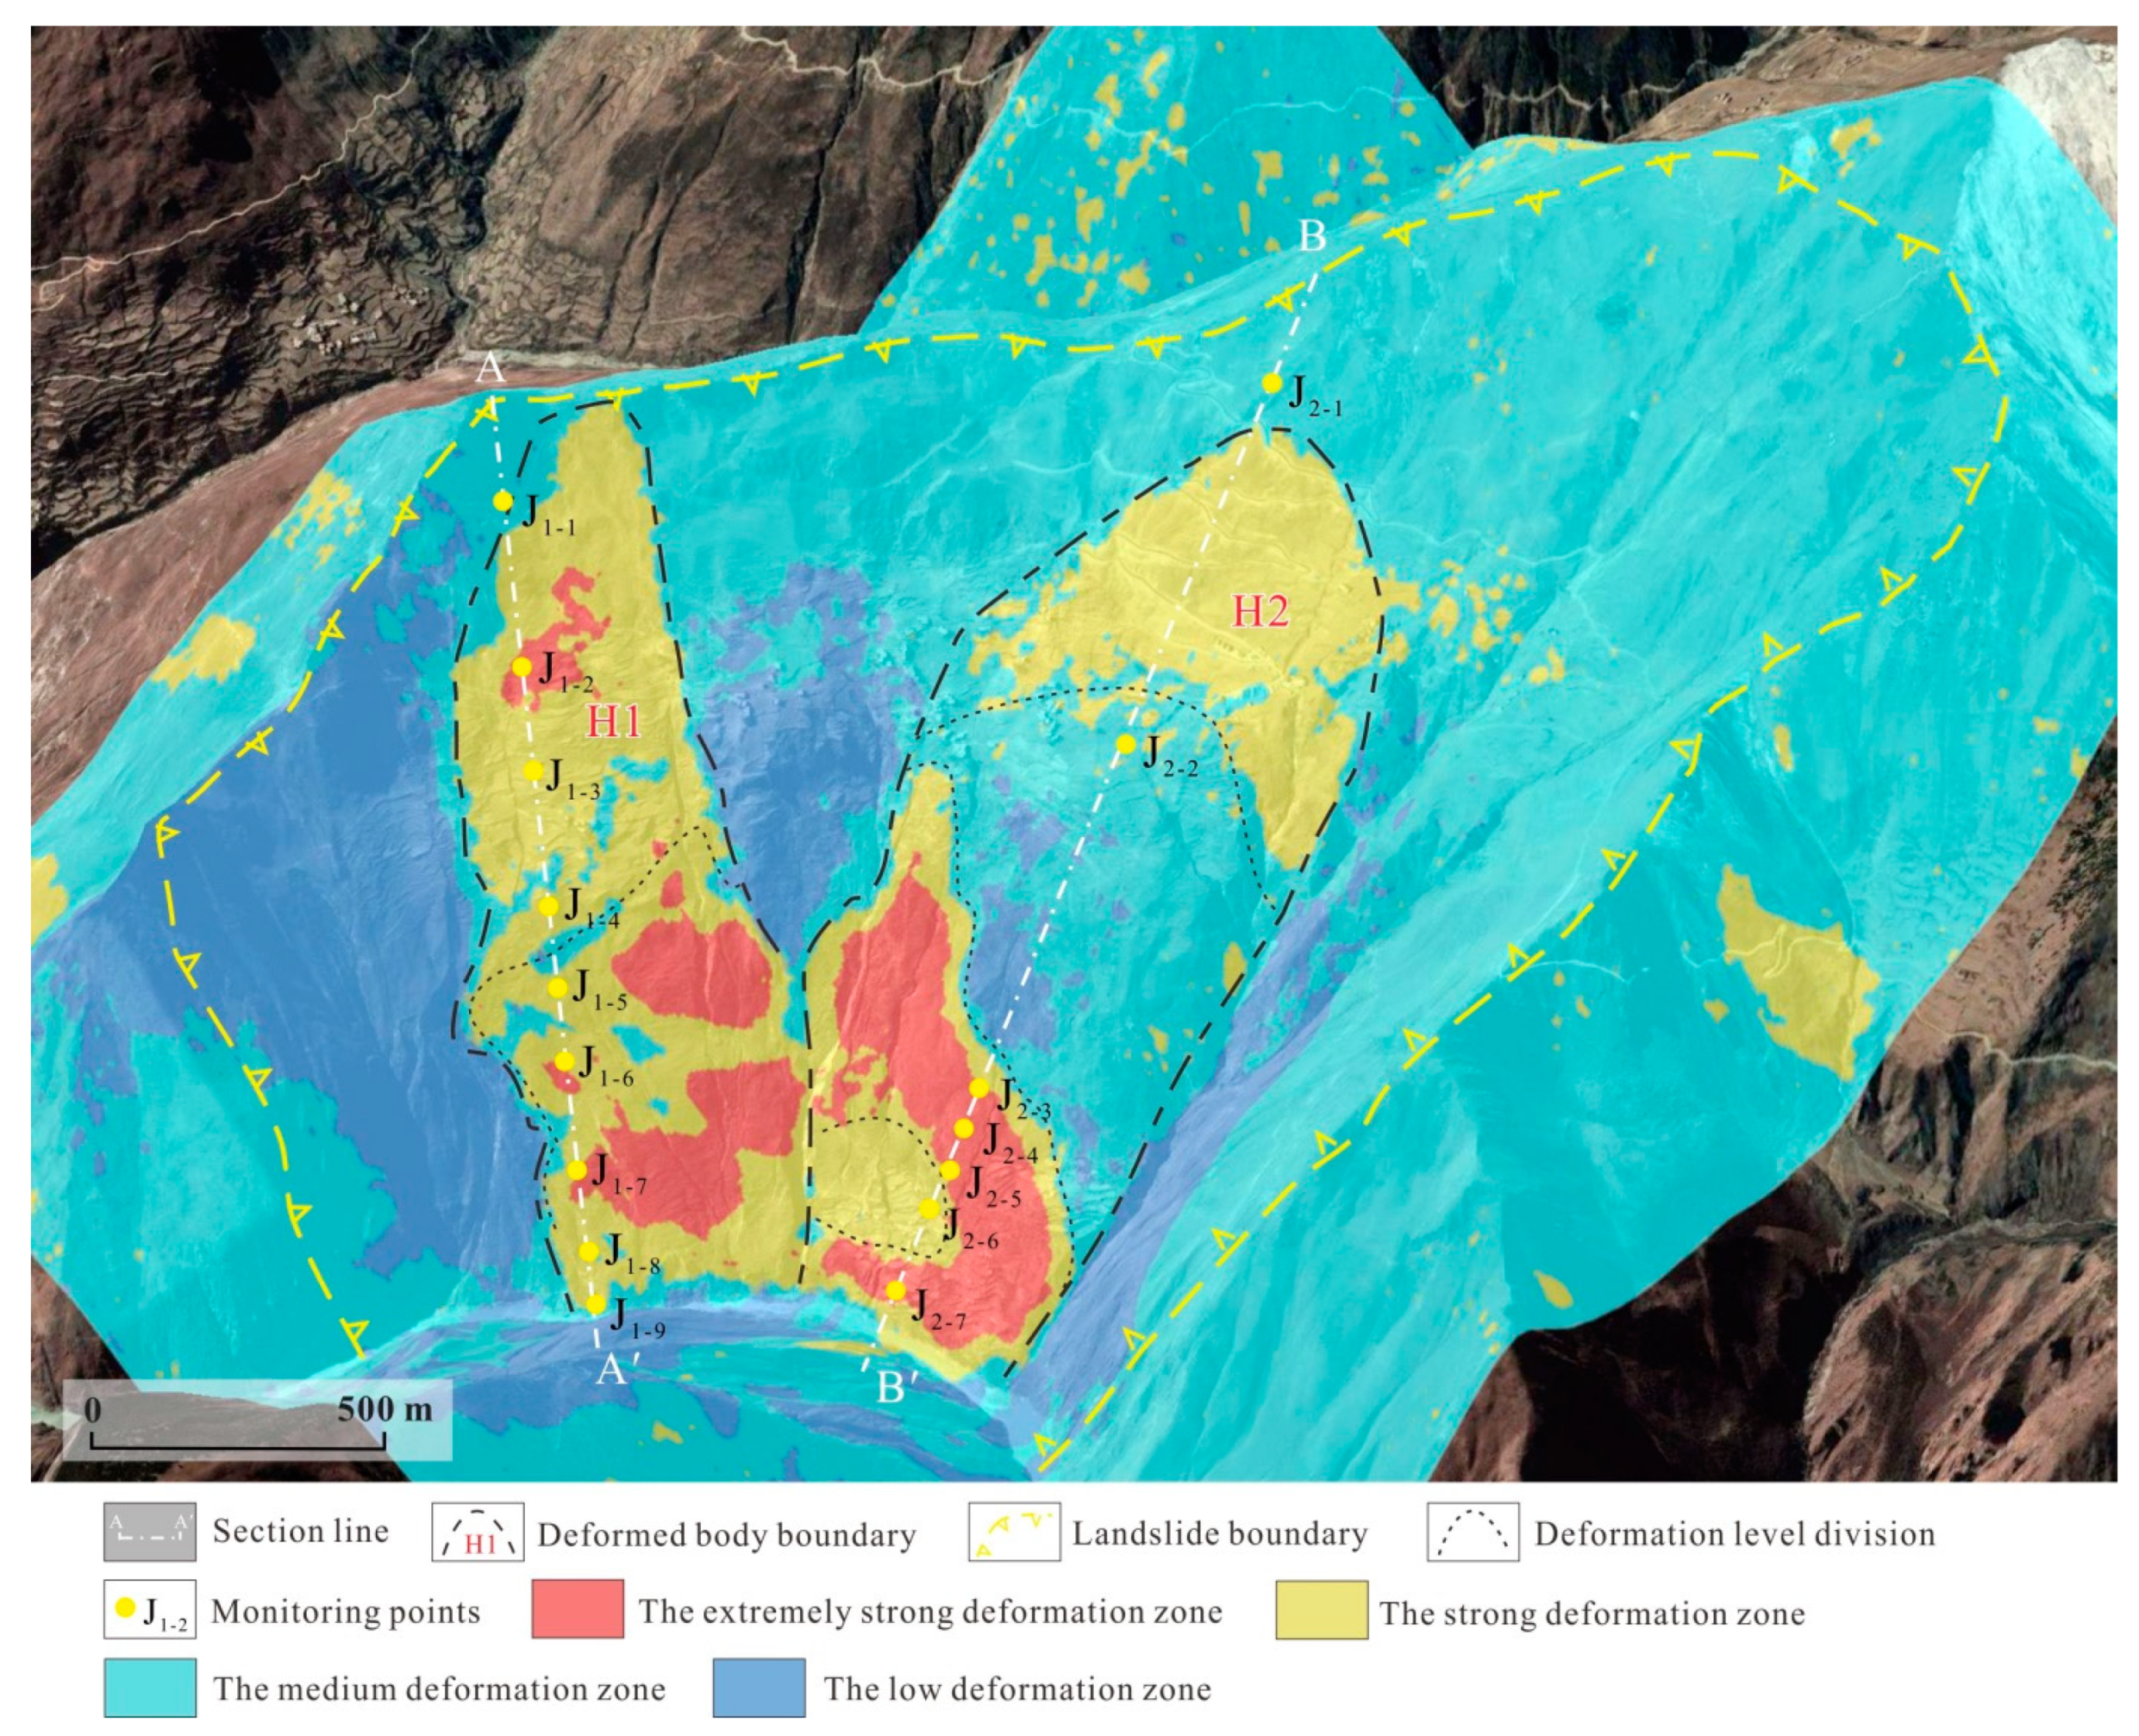
3.1. Development Characteristics of the Landslide

The Xiongba ancient landslide has an armchair shape in cross-section. The maximum elevation of the back edge of the landslide is 3800 m, while the front edge of the landslide has an elevation of 2763 m and is located near the Jinsha River bank. The overall slope of the landslide is 20~30°. Based on the remote sensing interpretation and field investigation, the steep wall at the back edge of the landslide is clear, and a platform is developed in the middle of the landslide, where the residents of Xiongba village live. The landslide body has a length of 2.13 km and a width of 2.68 km. According to the development characteristics of different parts of the body, the Xiongba ancient landslide is divided into three parts on the surface (Figure 2), e.g., the source area (I), the platform area (II) and the strongly deformed frontal edge area (III). The latter two areas of section II and section III constitute the main accumulation body of the Xiongba ancient landslide.

3.1.1. Characteristics of the Source Area (I)

The source area (I) is mainly located in the upper part of the landslide body, with an elevation of approximately 3359~3800 m. The terrain is relatively steep, with an average slope of 42~45°, and can reach nearly 60~70° locally. The scarp at the back edge is approximately 250~320 m high. The source area of the landslide is stable except for some local slides ① and ② that are developed on the northern side (Figure 2a). Slides ① is approximately 670 m long, 420 m wide and 300 m high, and is basically stable state at present. The potential landslide ② has a clear steep wall, with a length of 1200 m, a width of 600 m and a slope of 20°, which is stable at present, without obvious development of fractures.

3.1.2. Characteristics of the Platform Area (II)

The landslide platform area (II) is at the elevations of 3326~3534 m, and the terrain slopes gently with at approximately 10~15°. Vertical gullies are partially developed perpendicular to the Jinsha River, while the deformation of the surface and buildings on the landslide is not obvious. Overall, the landslide platform area is in a relatively stable state.

3.1.3. Characteristics of the Strongly Deformed Frontal Edge Area (III)

The strongly deformed frontal edge area (III) is the main area of the ancient landslide body and is located in the lower middle part of the landslide accumulation body, at elevations of approximately 2692~3216 m. This area is slowly creeping and deforming, and can be divided into two secondary deformation zones, i.e., the III1 and III2. Five large gullies, scarps and many vertical fractures are developed in this region (Figure 2b,c), among which the maximum fracture is 50~150 m long. The remote sensing images show that the front edge of the landslide is strongly deformed and that collapses have occurred at the front edge due to the erosion by the Jinsha River (Figure 2a). This area has becomes a strong deformation area (III3 and III4) near the river. The front edge has pushed the Jinsha River channel, causing a “water drop” in the water level.

3.2. Landslide Volume

The area of the Xiongba ancient landslide is approximately 5.33 km2. By drilling the landslide body, Li et al. (2021) [12] revealed that there are two sliding zone levels at the depths of 51~56 m (sliding zone S1) and 101~115 m (sliding zone S2). Specifically, the total volume of the Xiongba ancient landslide is approximately 2.6 × 10⁸~6.0 × 10⁸ m3, and the total volume of the landslide accumulation body corresponding to the potential sliding zone S1 is approximately 2.67 × 10⁸~2.88 × 10⁸ m3. The volume of the III1 secondary strong deformation zone is approximately 0.85 × 10⁸~0.92 × 10⁸ m3, and that of the III2 secondary strong deformation zone is approximately 0.61 × 10⁸~0.66 × 10⁸ m3. The total volume of the landslide accumulation body corresponding to the potential sliding zone S2 is approximately 5.28 × 10⁸~6.02 × 10⁸ m3, among which the volume of the III1 secondary strong deformation zone is approximately 1.68 × 10⁸~1.92 × 10⁸ m3, and the volume of the III2 secondary strong deformation zone is approximately 1.21 × 10⁸~1.37 × 10⁸ m3.

4. Methods

The interferometric synthetic aperture radar (InSAR), refers to the acquisition of surface deformation characteristics through the phase information of radar image data [15,24,25]. Due to its superior full-time, high precision, and large-scale data, InSAR can provide continuous surface deformation information in a certain area on the order of centimeters or even less [26,27]. The InSAR has been widely used in land subsidence monitoring [28,29], ground fissure deformation monitoring [30], coseismal deformation observation [31] and landslide deformation monitoring [32,33,34]. The application of InSAR to landslides studies was first used in the 1990s, when the French scholar J. Achache (1996) [35] used SAR data obtained from the European Remote Sensing (ERS)-1 satellite to obtain ground deformation interferograms by D-InSAR technology processing, and they conducted a study on the Saint-Etienne-de-Tinee landslide in southern France, thereby demonstrating the accuracy and reliability of D-InSAR technology for monitoring landslide deformation. Subsequently, InSAR deformation studies of landslides have been carried out around the world.
At present, the methods of landslide monitoring research based on InSAR mainly include D-InSAR [15,36,37,38], PS-InSAR [16,39,40], and SBAS-InSAR [17,41,42,43]. In recent years, the SBAS-InSAR method has achieved outstanding progress in phase unwrapping algorithms, error removal algorithms, and time series model improvements. There are significant advantages in landslide deformation monitoring research with high measurement accuracy by the SBAS-InSAR method. Therefore, in this study, the SBAS-InSAR method was used to analyze the deformation monitoring of the Xiongba ancient landslide.

4.1. Principles of Surface Deformation Analysis Based on SBAS-InSAR

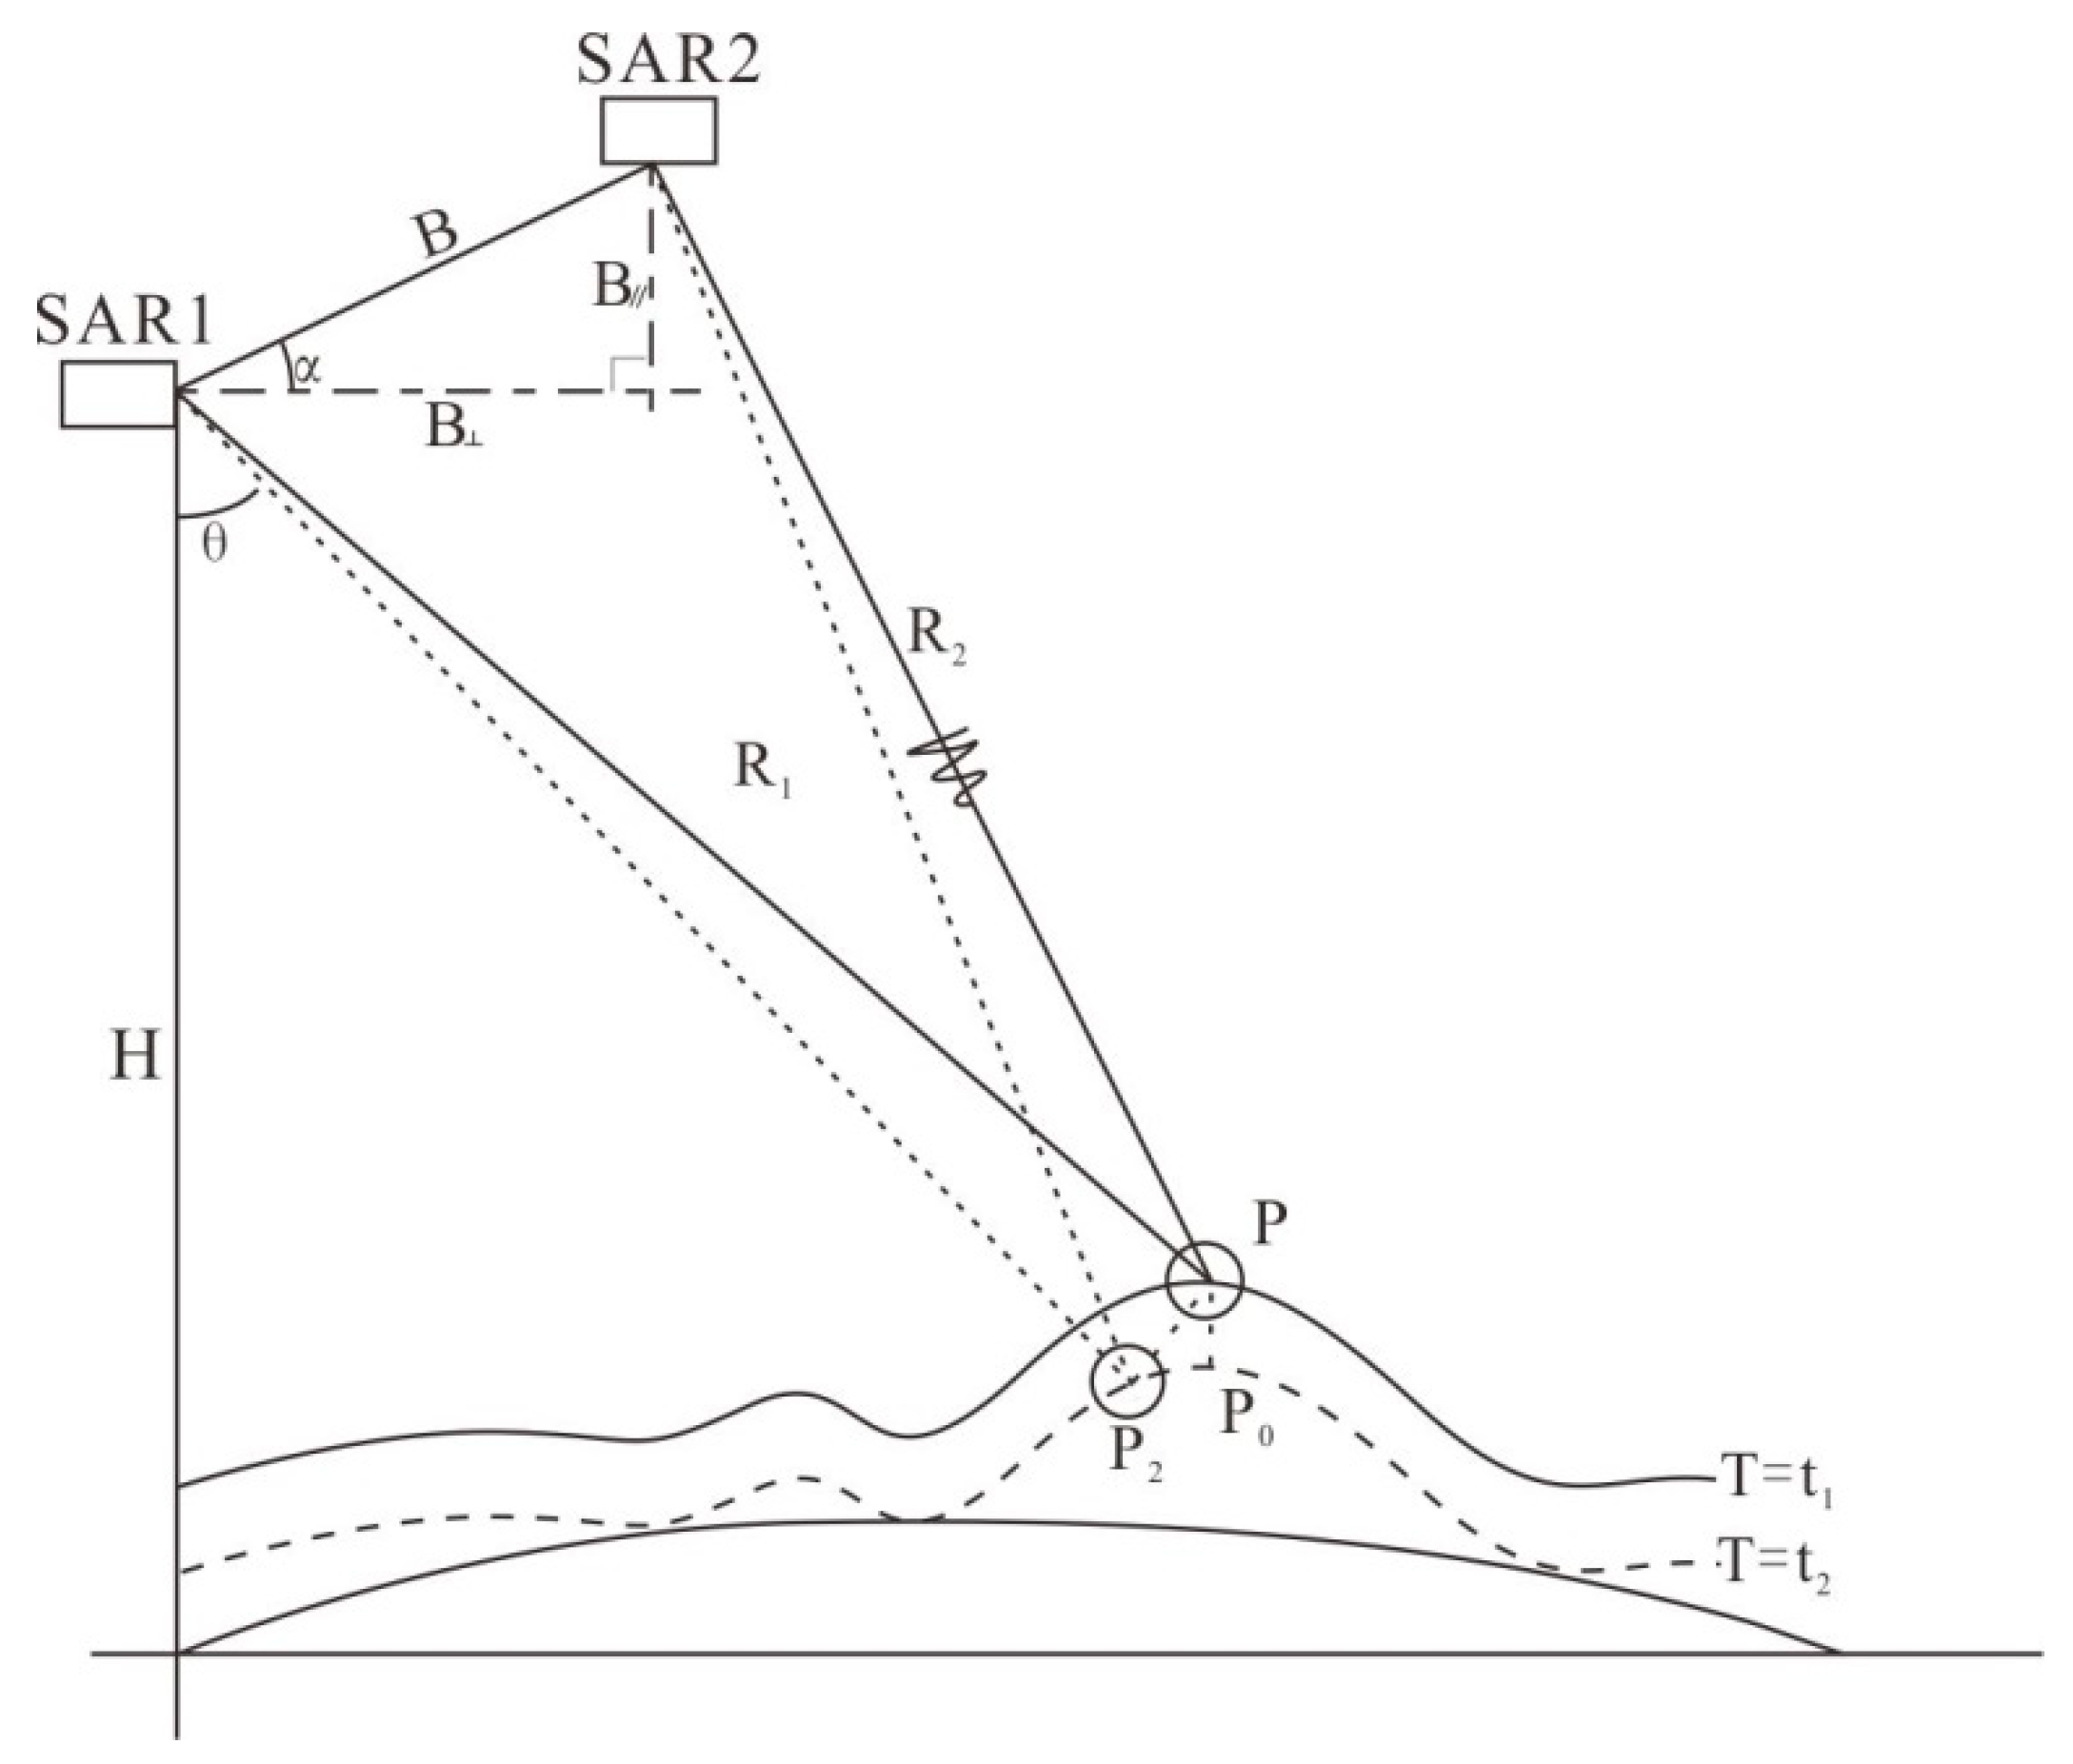
4.1.1. InSAR Deformation Calculation Principle

Differential interferometry is a measurement technology that refers to the use of two InSAR interferometric images in the same area, namely, the pre-deformation and post-deformation interferograms SAR1 and SAR2, and the two interferograms are differentially processed to obtain small surface deformations [44]. The SAR1 and SAR2 represent the two imaging positions of the same satellite (Figure 3). Parameter B in Figure 3 represents the baseline distance between the two images. Baseline distance B is decomposed along the radar line-of-sight, from which the component B//, which is parallel to the line-of-sight, and the component B, which is perpendicular to the line-of-sight, can be obtained.

4.1.2. SBAS-InSAR Small Baseline Set Deformation Analysis Method
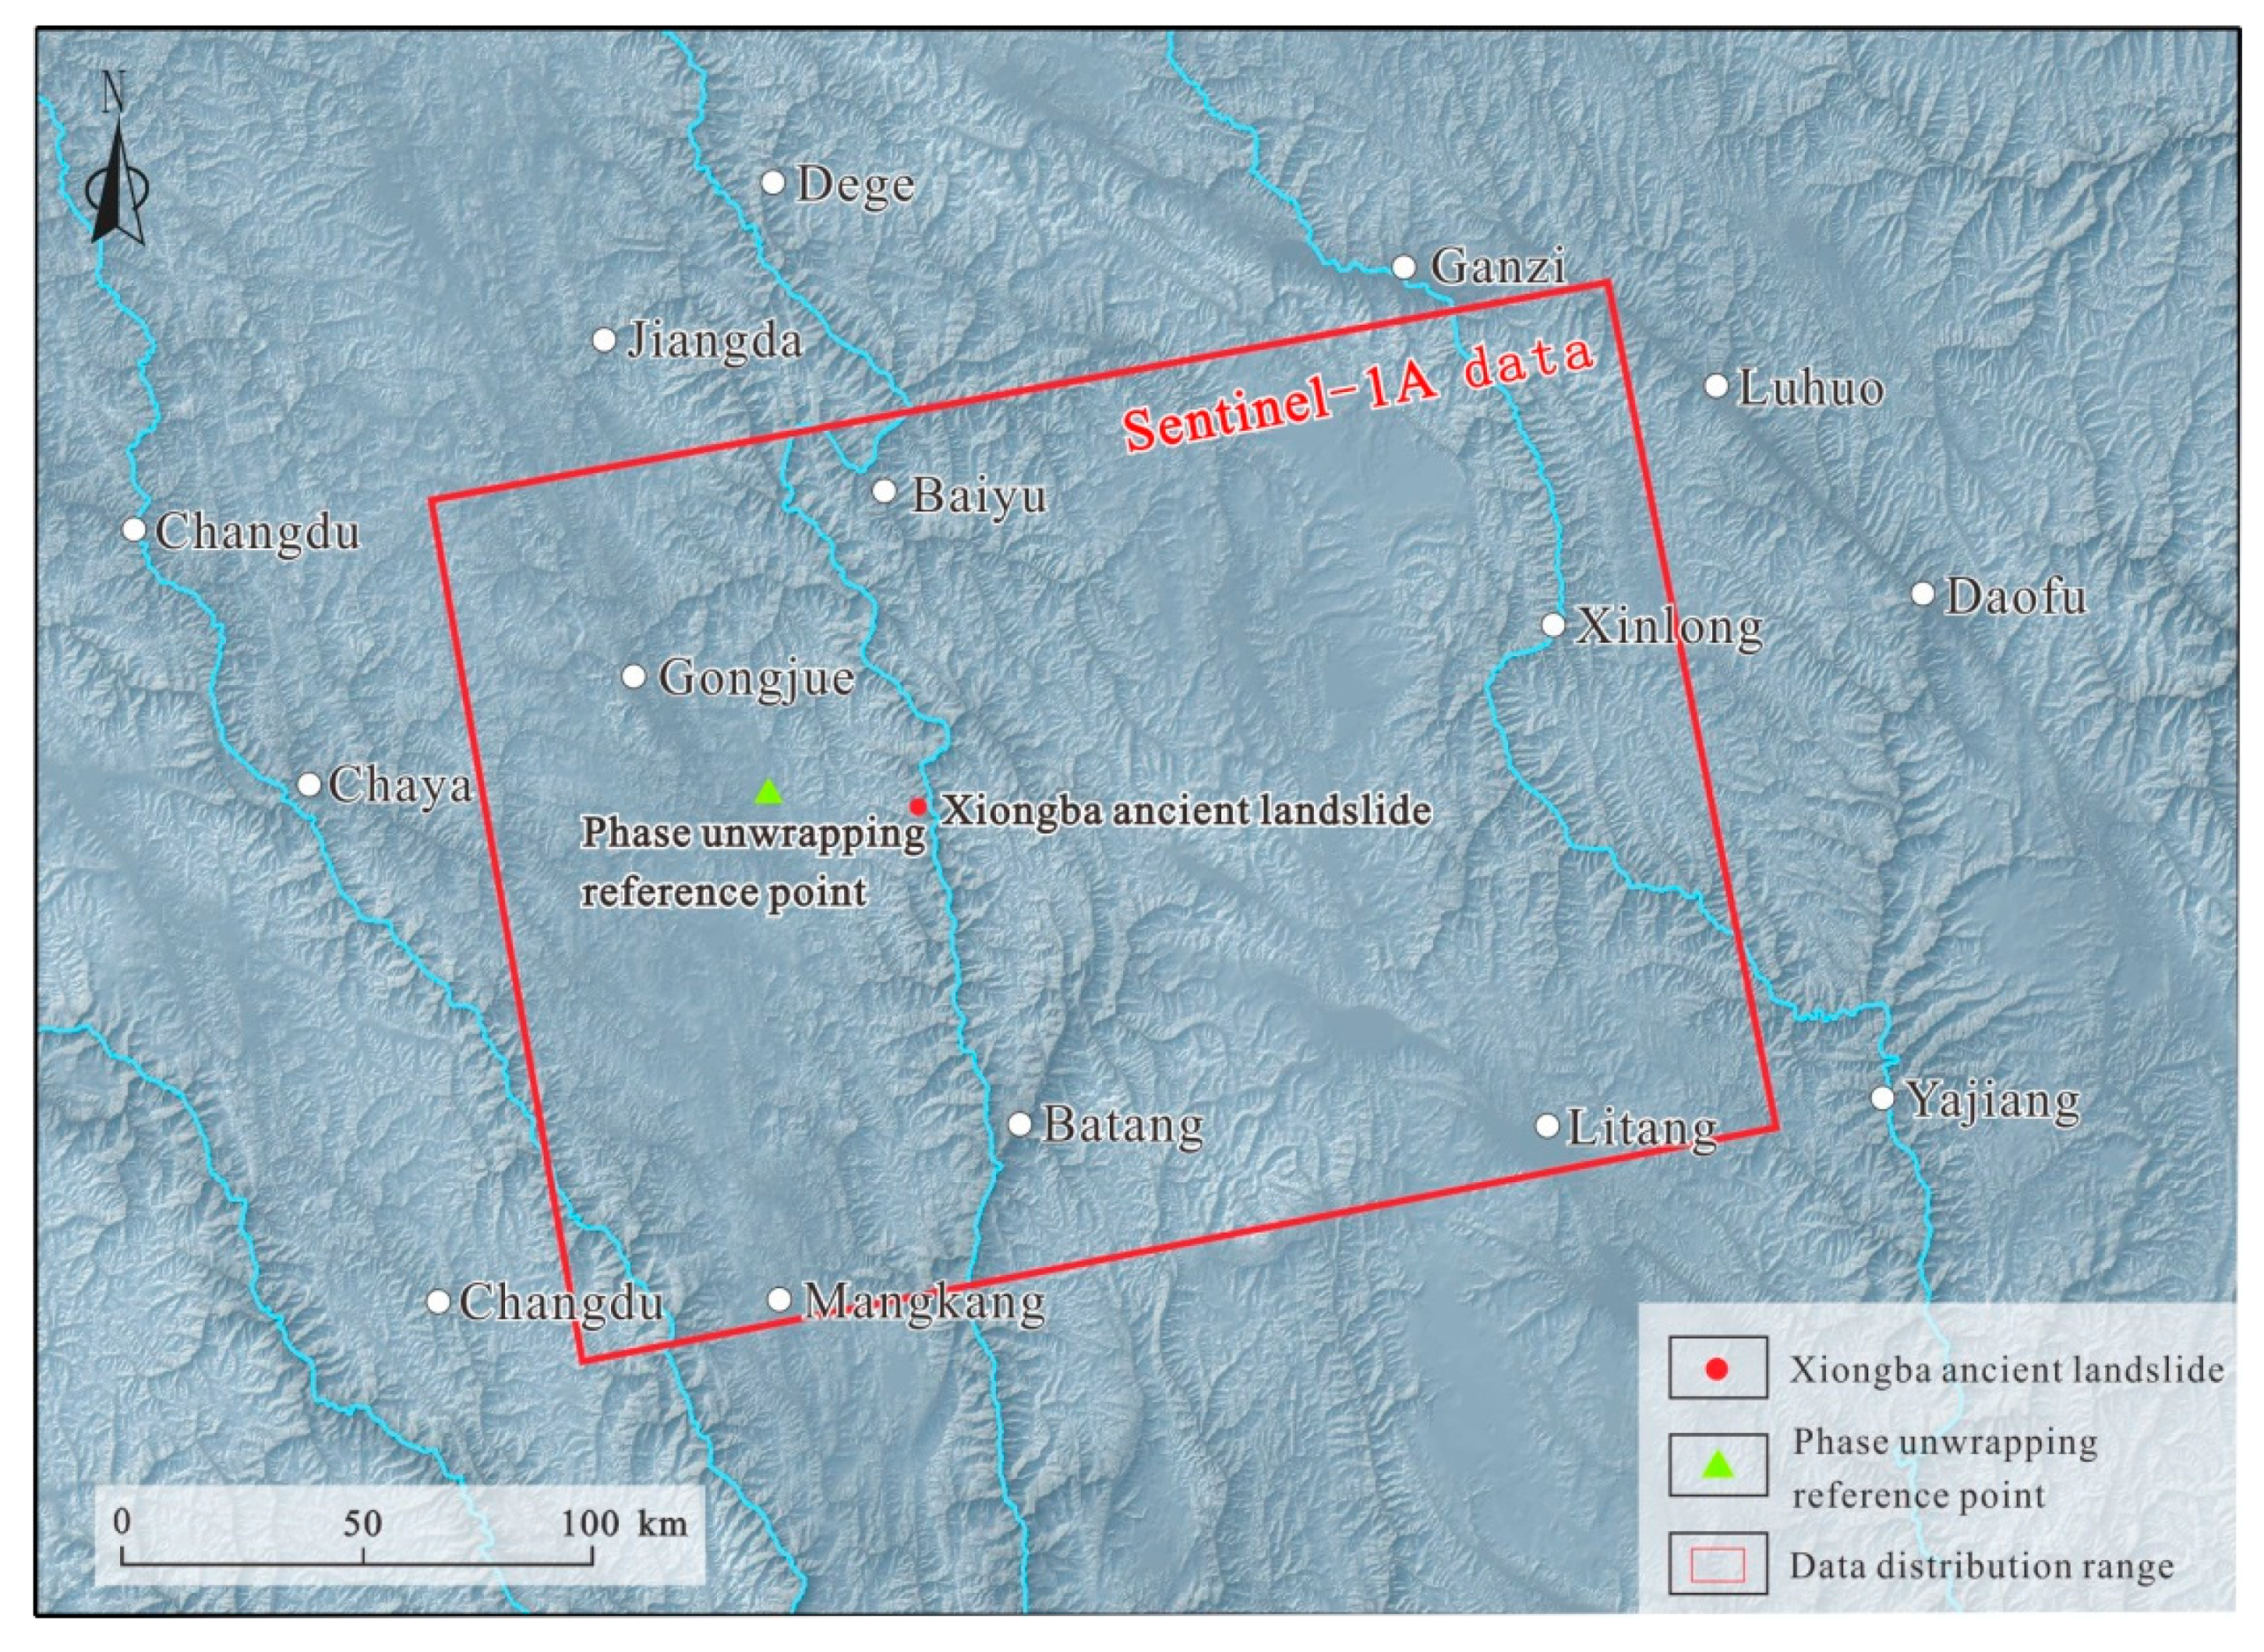
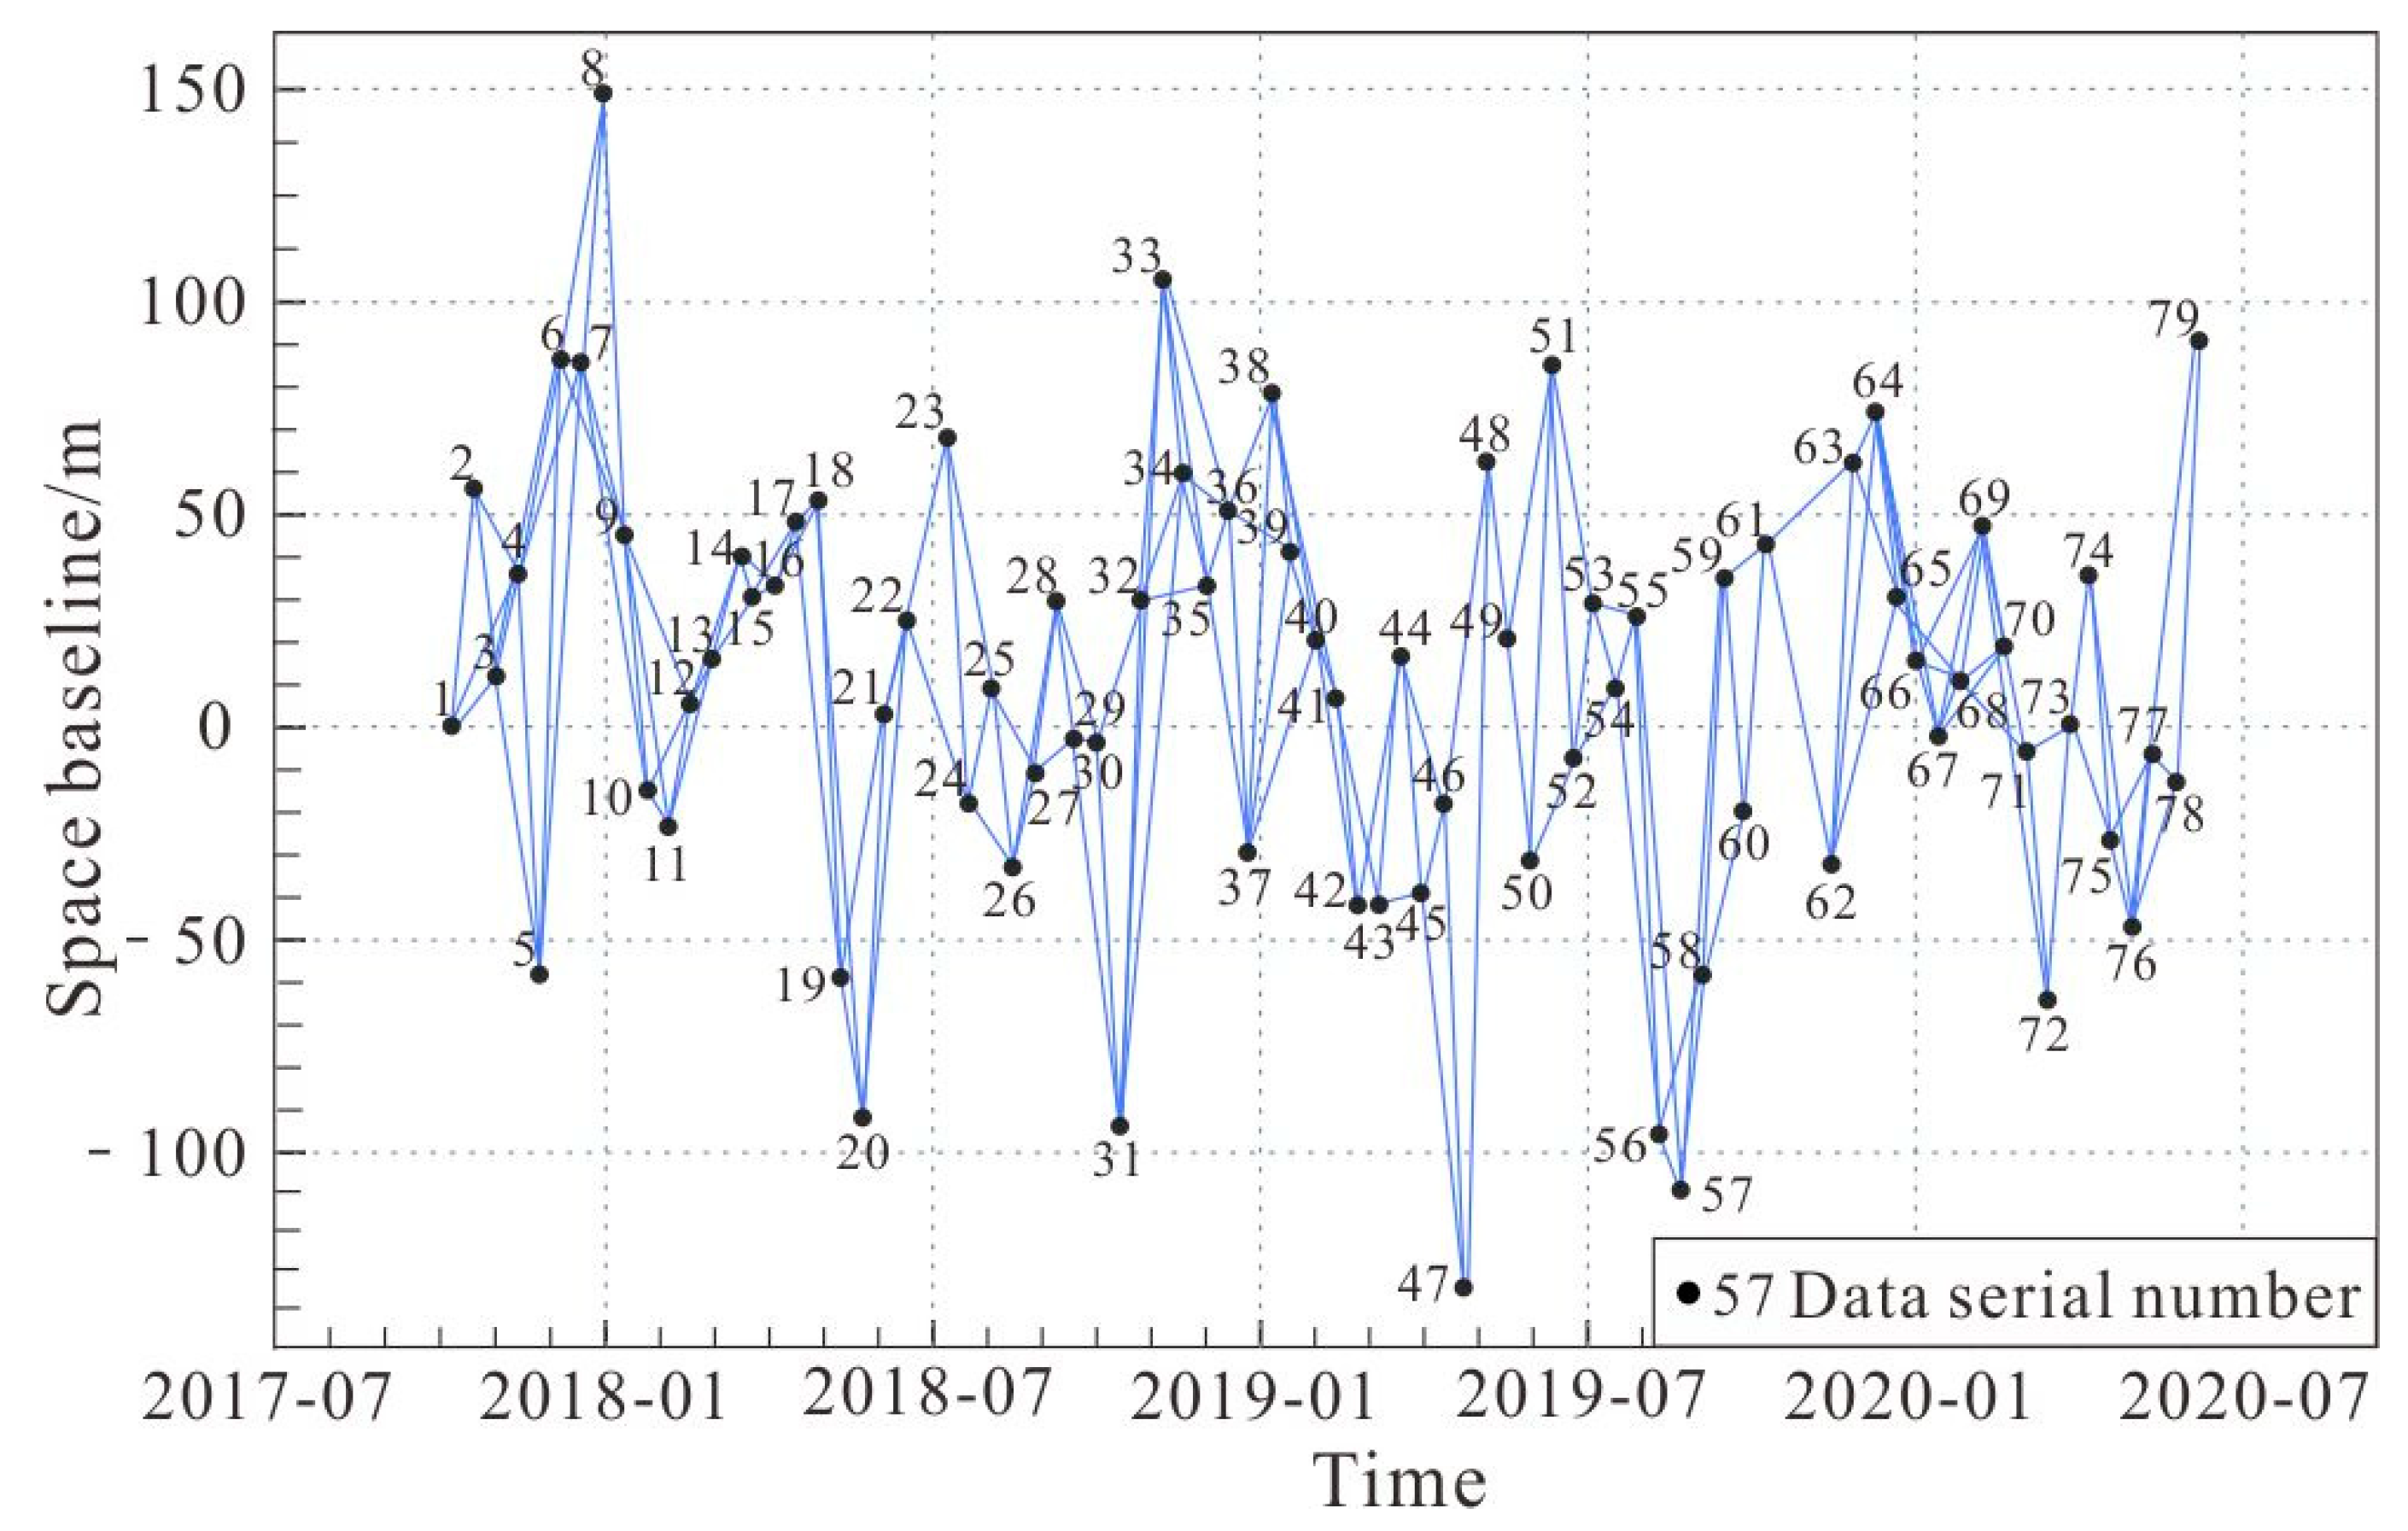
The Italian scholar Berardino (2002) [17] first proposed SBAS-InSAR and carried out surface deformation monitoring. The SBAS-InSAR technology has effectively alleviated the errors, which are due to the decoherence and atmospheric delay caused by the traditional D-InSAR technology in the spatial baseline. The land surface deformation time series are obtained through the least squares method, and the singular value decomposition (SVD) method is used for time-space fitting [45], so the accuracy of InSAR surface deformation monitoring could reach the mm level [46,47].
The basic principle is as follows.
On the basis of acquiring N + 1 SAR images in the study area, the appropriate primary and secondary images are determined for registration, and M interferograms are obtained. Suppose t is the acquisition time of the images (sorted by time). After removing the flat ground effect and terrain phase, the interference phase of the image is generated by the pixel point (x, r) (x is the azimuth coordinate, r is the distance coordinate) at two moments, tA and tB, and then Formula (1) can be determined:
δ φ j ( x , r ) = φ ( t B , x , r ) φ ( t A , x , r ) 4 π λ [ Δ d d i s p ( t B A , x , r ) ] + 4 π λ B j Δ h r sin θ + 4 π λ [ Δ d a t m ( t B A , x , r ) ] + Δ n j ( j = 1 , , M )
In Formula (1), δφj(x, r) is the interference phase at the pixel; φ(tB, x, r) and φ(tA, x, r) are the phases of the pixels at times tA and tB, respectively; j is the number of differential interferograms; λ is the center wavelength; ∆ddisp is the deformation phase difference; ∆h is the terrain phase difference; ∆datm is the atmospheric phase error.
After removing the terrain phase error and the atmospheric phase error, an equation group can be obtained from Formula (1), in which there are M equations and N unknowns, φ(ti, x, r) (I = 1, …, M), and then Formula (2) can be constructed:
A φ = δ φ
In Formula (2), A is an M × N matrix and φ represents an unknown deformation phase vector. At the same time, the format of Formula (2) can be converted, the unknown phase parameter can be replaced by the average velocity v between two time points, and Formula (3) can be obtained:
B v   =   δ φ
In Formula (3), B represents the M × N matrix. If the SAR data are divided into several independent small baseline sets, it causes the rank deficit of matrix B and leads to infinite solutions of matrix Equation (3). However, using the SVD method in the SBAS processing procedures to perform a pseudo-inverse operation on matrix B, the least squares solution of Equation (3) can be obtained [17]. If SVD is used to solve Equation (3), to a certain extent, a linear assumption is made to find the average velocity. At the same time, before Equation (3) is solved, it is necessary to perform orbit error removal, digital elevation model (DEM) error removal and atmospheric error removal. The SBAS-InSAR technical process is shown in Figure 4.

4.2. InSAR Data

The SAR satellites now used in geoscience analysis mainly include Japan’s J-RES and ALOS, ESA’s ERS1/2, Envisat, and Sentinel-1; and Germany’s TerraSAR-X, and TanDEM-X, among which the Sentinel-1 satellite is a new generation of ground observation radar data satellite launched by the European Space Agency in 2014. It consists of two satellites, Sentinel-1A and Sentinel-1B, which form a constellation. It has multiple polarization modes and uses the terrain observation by progressive scans (TOPS) mode for imaging. The revisit period is 12 days, the working band is the C-band, and the wavelength is 5.6 cm (Table 1). The Sentinel-1 data have been widely used in landslide deformation analysis research [48,49] and have achieved outstanding results.
The Xiongba ancient landslide generally tends in the NE direction, and is located in a deep valley with steep terrain, and terrain slopes of approximately 20~40°. According to the ascending orbit data, the landslide is suitable for analyzing the slope deformation in the east, southeast, and northeast directions, while the descending orbit data are not available for the slope deformation in the east, southeast, and northeast directions [50,51]. Moreover, the slope of the Xiongba ancient landslide is smaller than the complementary angle of the incident angle of the Sentinel-1A ascending data used in this study (Table 1), which is conducive to identifying the deformation of the slope. Therefore, the Sentinel-1A ascending image data are used in this study (Figure 5). The image acquisition data time period ranges from 8 October 2017, to 6 June 2020, and a total of 79 scenes were used in this study.

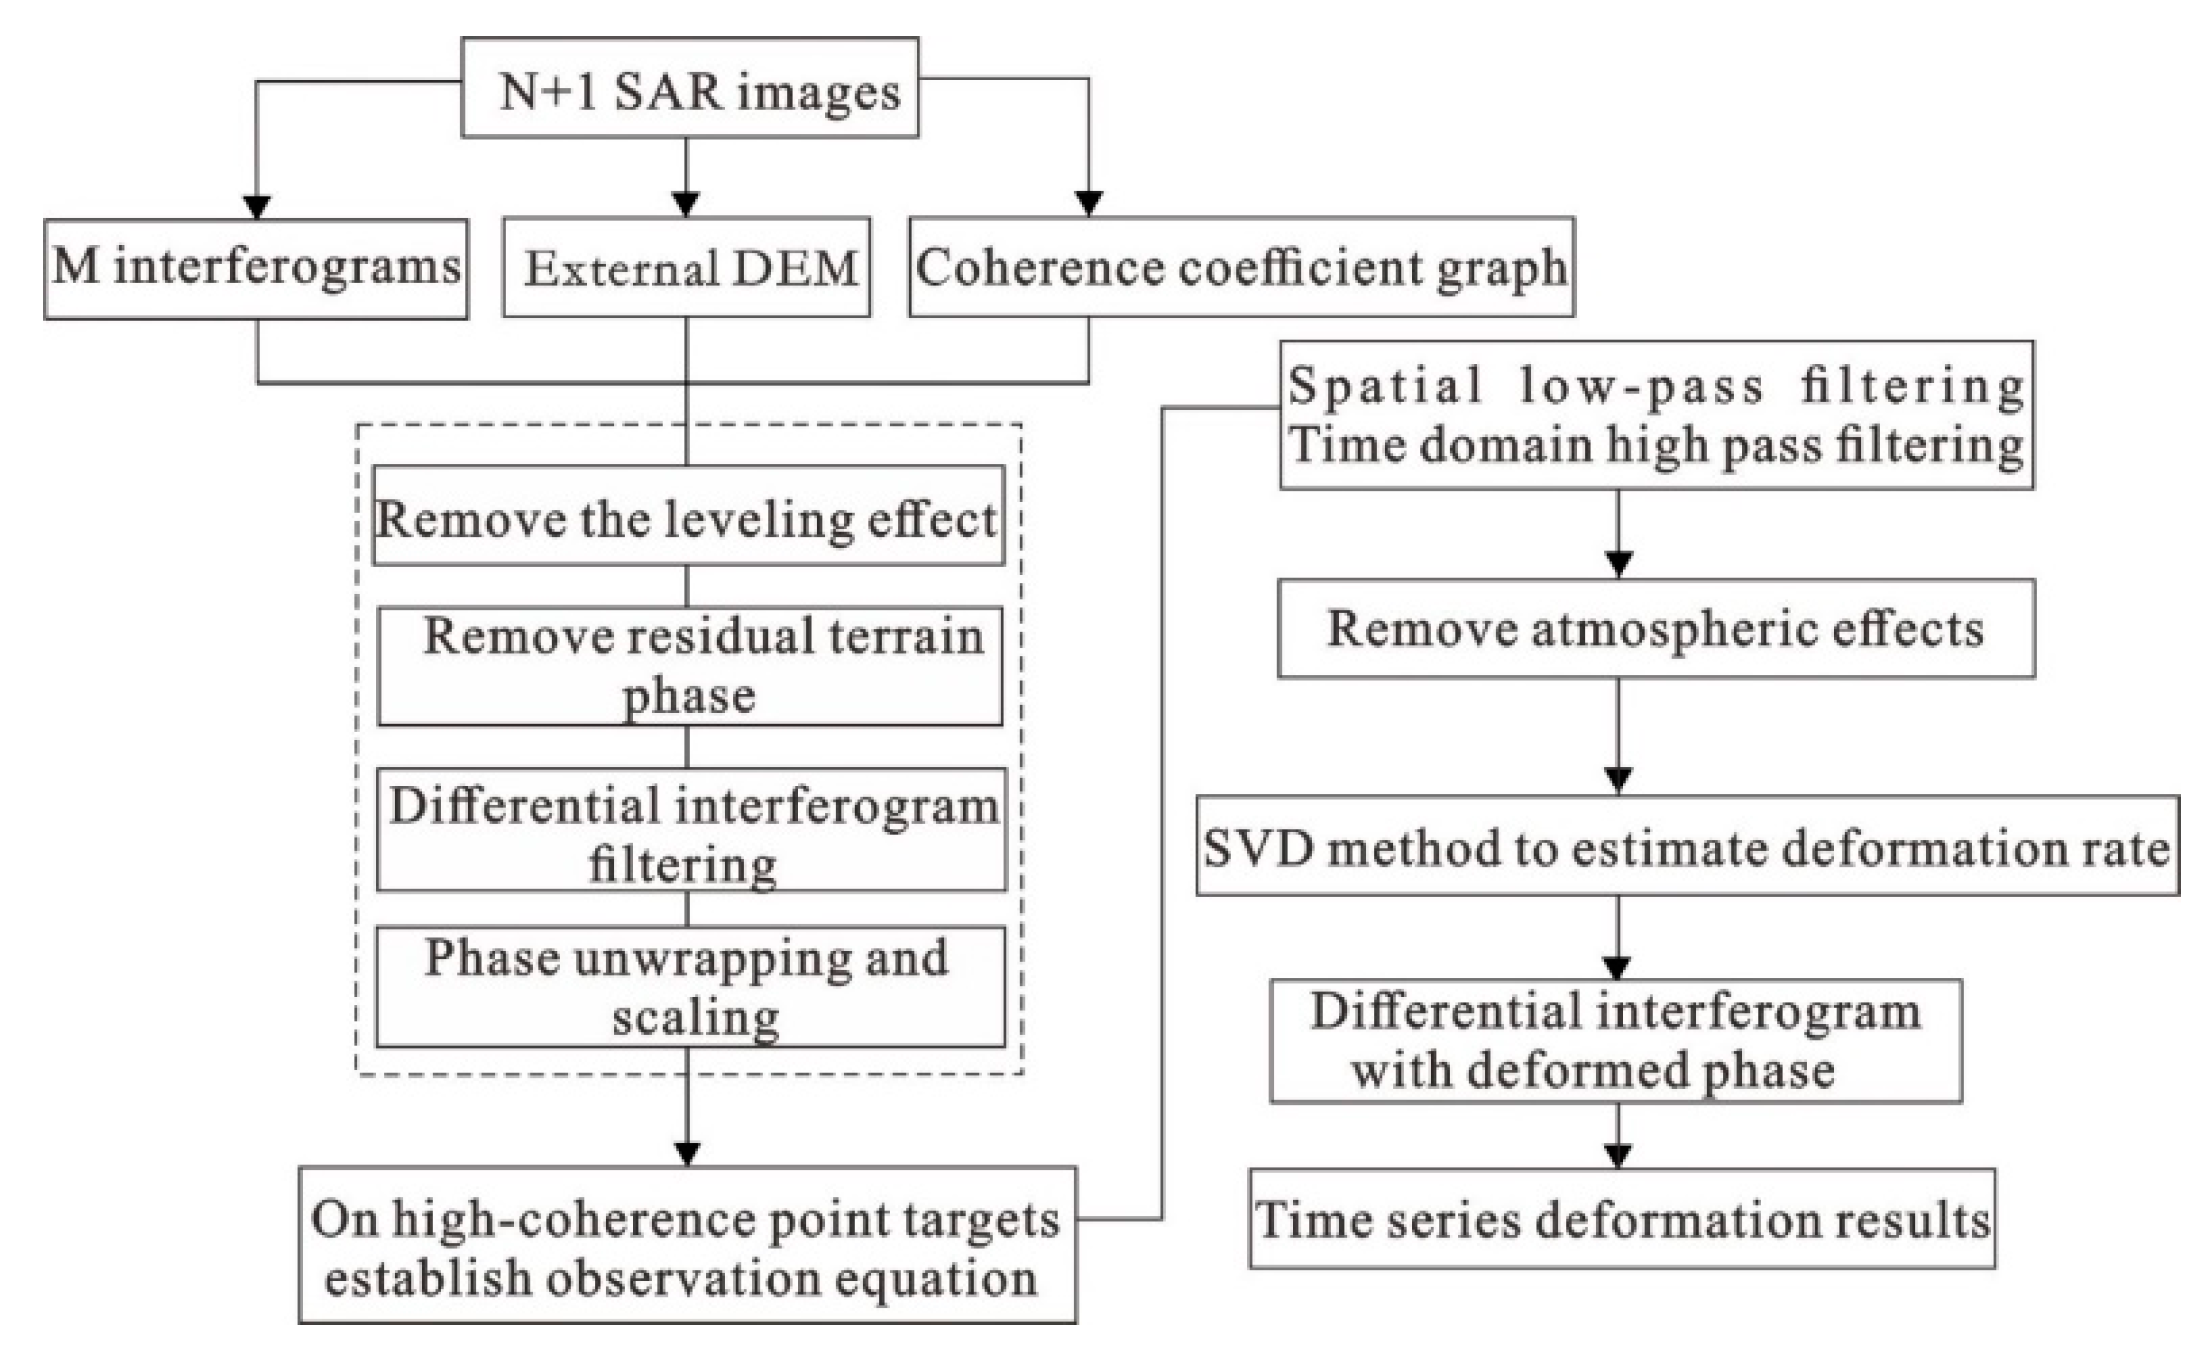
4.3. Data Processing Procedures

The SBAS-InSAR method was used in this study, and 79 Sentinel-1A radar images were analyzed based on Gamma software to study the deformation characteristics of the Xiongba ancient landslide. Interference pairs were combined by setting time baselines and spatial baselines with different thresholds. In order to improve the quality of data interference and ensure that the data have good coherence, the registered data were paired with a time baseline of 36 days and a spatial baseline of 150 m as a threshold, and a total of 171 interference pair combinations were generated (Figure 6).
In order to obtain the differential interference phase, the flat ground effect and terrain phase error were removed from the acquired 171 interference pairs, and we used the adaptive filtering method to filter the differential interferogram (Figure 4). As the study area is surrounded by mountains and valleys, the surface is undulating. In addition, the radar system is based on the principle of side-view imaging, and the acquired data have overlaps and shadows. Therefore, this paper introduces 30 m Shuttle Radar Topography Mission (SRTM)-DEM data to mask the differential interferogram to remove overlaps and shadow areas. Phase unwrapping adopts the minimum cost flow (MCF) method, selects relatively stable residential areas and buildings as reference points, with a threshold of 0.3, and eliminates areas with poor coherence. The phase unwrapping reference point is a relatively stable building (Figure 5), which is located in a stable area with a 25 × 25 m grid and is 32.8 km west of the Xiongba ancient landslide, and the coherence remains above 0.8. Through the establishment of a function model, the obtained high-quality unwrapping phase is decomposed, high- and low-pass filtering is used to remove the atmospheric phase, and then the deformation rate is solved according to the SVD method. Finally, a deformation interferogram of the Xiongba landslide is generated.

5. Results

After being processed with the SBAS-InSAR data processing method, a total of 79 Sentinel-1A datapoints covering the Xiongba ancient landslide area were calculated, and the results of the surface deformation monitoring from October 2017 to June 2020 were obtained.

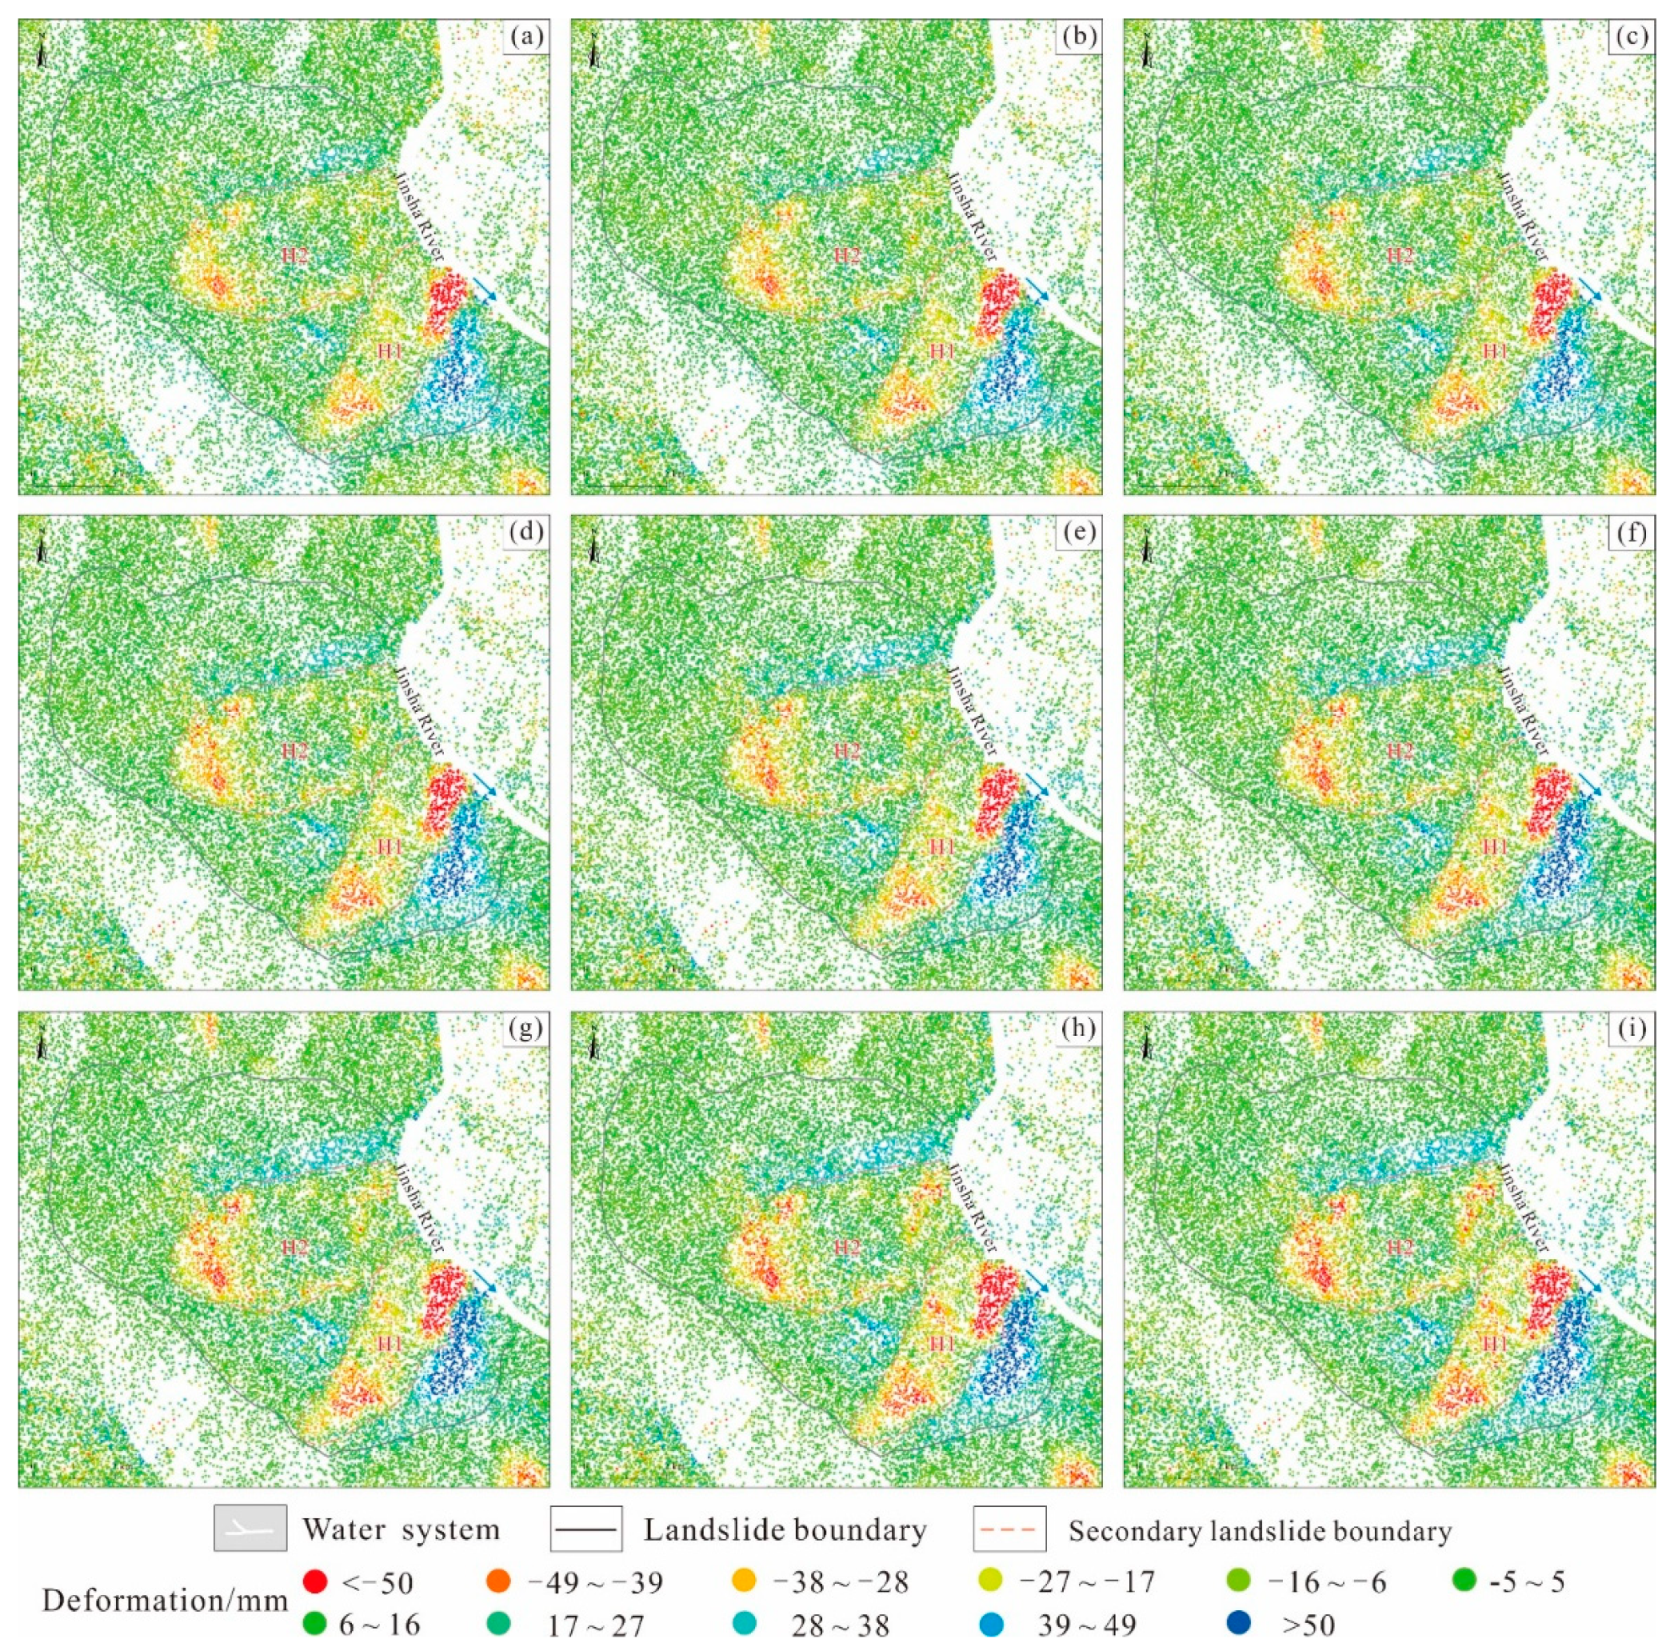
5.1. Overall Landslide Deformation

5.1.1. Analysis of Deformation as a Whole of the Xiongba Ancient Landslide

The surface vegetation coverage on the Xiongba ancient landslide area is relatively low and dominated by low shrubs. Section 4.2 of this paper shows that using ascending SAR data to study NE-directed landslides has advantages. Therefore, there are many coherent points calculated based on SBAS-InSAR. Importantly, the interference results of these points are better, with a very remarkable rate accumulation.
According to the deformation results from October 2017 to June 2020 in the direction of the radar line-of-sight (Figure 7), the landslide undergoes strong deformation. Specifically, a negative value of the deformation rate VLOS indicates that the points move away from the satellite sensor. However, the positive value of the deformation points moves toward the satellite sensor. Figure 7 shows the deformation rate VLOS of the lower part of the landslide accumulation area is negative as a whole, which indicates that the Xiongba ancient landslide is sliding below the surface and toward the Jinsha River.
The InSAR monitoring results reveal that the most serious deformation was distributed in the middle and lower parts of the landslide deposits (III1 and III2), with a deformation rate exceeding −100 mm/a, and a maximum deformation rate of −132 mm/a. On the basis of the InSAR surface deformation classification scheme proposed by Feng et al. (2020) [52] and the field survey in this area, we divided the deformation of the Xiongba ancient landslide into four levels, that is, the extremely strong deformation zone (−132 mm/a ≤ VLOS < −59 mm/a), strong deformation zone (−59 mm/a ≤ VLOS < −20 mm/a), medium deformation zone (−20 mm/a ≤ VLOS < 2 mm/a) and low deformation zone (2 mm/a ≤ VLOS < 55 mm/a) (Figure 7).
According to the remote sensing interpretation (Figure 2) and the distribution characteristics of the landslide deformation rate, the Xiongba ancient landslide could be divided into two secondary sliding deformation bodies, H1 and H2 (Figure 7). Specifically, the H1 deformation body is located on its southeastern side. The maximum cumulative deformation reached 204 mm from October 2017 to June 2020. The H2 deformation body is located on the northeastern side of the landslide, and the maximum cumulative deformations was approximately 302 mm.

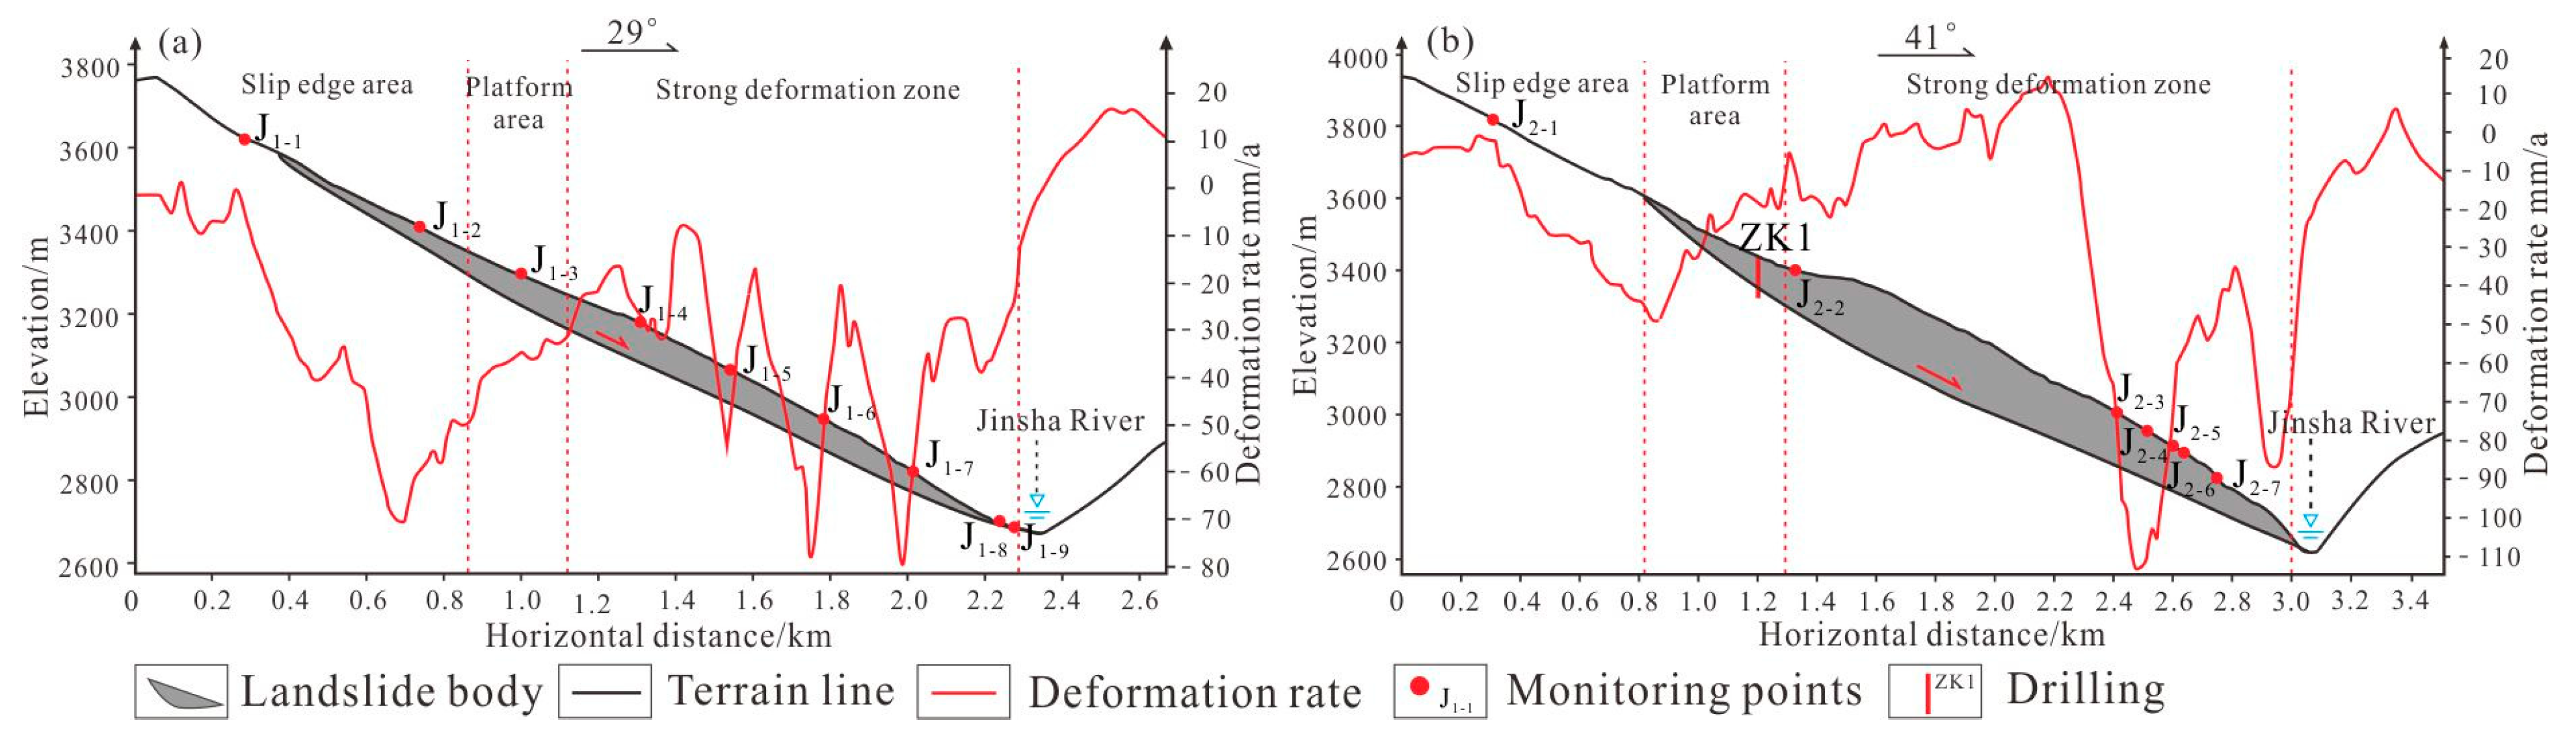
5.1.2. Deformation Analysis of Typical Sections of the Xiongba Ancient Landslide

In order to further analyze the deformation and failure modes of the Xiongba ancient landslide, the deformation rate profiles along the main sliding directions of the two creeping bodies were drawn (Figure 8 and Figure 9). These profiles show that the VLOS varies greatly in the direction of the landslide section. The high rate (negative value) mainly occurs from the middle part of the slope to the toe. The maximum rate could reach −80 mm/a (Figure 9a). In addition, the deformation rate is greatly affected by the local topography of the landslide area. There is a local uplift in the strong deformation zone in the 1.9~2.2 km section of the H2 deformation body (Figure 9b), which may be newly strongly deformed along with the front edge of the zone; in addition, the interior of the slope is creeping, resulting in significant differences in the deformation of the entire slope. Geological phenomena, such as reverse warping of landslides, local formation of landslides, drums, unevenness, gentle grooves and steep ridges appear on the platform [53,54], and the landslide exhibits spatially uneven movement. The difference between the movement rate and ground surface is a common geological feature in the process of deformation of large and deep creeping landslides. Furthermore, the magnitude of the rate is related to the radar data acquisition and processing results. Finally, the trend of the overall movement indicates that the two secondary sliding bodies are creeping. Both of these bodies are undergoing retrogressive sliding, and the sliding rate is within the range of −80~−110 mm/a.

5.2. Field Investigation and Verification of the Xiongba Ancient Landslide Deformation

In order to further review the InSAR deformation monitoring results, we conducted field investigation and verification. The field investigation shows that the Xiongba ancient landslide mainly occurs in the creeping slide state. The transverse and lateral tension cracks also developed in the middle and front of the landslide accumulation area. Moreover, fault scarps are locally developed. Additionally, the front edge of the landslide is eroded by the Jinsha River. As a result, a series of steep walls are formed, and the slope collapses locally (Figure 10).

5.2.1. Field Survey of Deformation Characteristics in the H1 Deformation Area

The H1 deformation part is located in the southeastern section of the landslide, and is approximately 1400 m long and 650 m wide. During the deformation of the landslide, the front edge compresses the Jinsha River channel, and there are many secondary slips in the middle and lower parts of the south side. Furthermore, InSAR monitoring results show that the landslide deformation rate in the area ranges from −131 mm/a to 17 mm/a. In addition, field surveys and unmanned aerial vehicle (UAV) surveys show that the front edge of the area has undergone large displacement and deformation, and there are seven collapsed bodies ①~⑦ located at the foot of the slope (Figure 10a). The height of the largest collapse ③ is approximately 86 m, and the horizontal length is approximately 90~110 m. Two large, deformed landslide bodies have also developed. First, landslide L1 is shaped like a long tongue, of 500 m in length and 140 m in width, and the estimated thickness is approximately 50~60 m (Figure 10c). The potential sliding direction of the landslide is 35°, and the potential instability volume is approximately 3.5 × 10⁶~4.2 × 10⁶ m3. Second, the cracks on the trailing edges of potential sliding bodies have penetrated through landslide L2 and landslide L3. The potential sliding volume is approximately 8.2 × 10⁶ m3. Therefore, if the Xiongba landslide slides again, a large landslide-dammed lake could form.

5.2.2. Field Survey of Deformation Characteristics in the H2 Deformation Area

The H2 deformation area is located on the northeastern side of the landslide. The elevation of the deformation area is approximately 2705~3241 m, and the area is approximately 1200 m long and 900 m wide. The main direction of creeping deformation is approximately 60°. It is worth noting that there is one scarp ridge and 7 large cracks. According to the InSAR monitoring results, the landslide deformation rate in this area is in the range of −132 mm/a~24 mm/a. In addition, the field survey and UAV survey show that the displacement and deformation of the front edge of the area are both large. The height of the collapse at the foot of the slope is approximately 61 m (Figure 10b), and the horizontal extension length is approximately 280~420 m.

5.3. Analysis of the Deformational Trend of the Xiongba Ancient Landslide

According to the field geological survey and the distribution map of the deformation rate (Figure 7), the cumulative deformation values of different stages of the Xiongba ancient landslide from August 2018 to December 2018 were determined (Figure 11). According to Figure 11, the creep rate accelerated during and after the formation of the Baige landslide on 10 October 2018, and when the first dam broke on 12 October. Compared with those on October 3 (Figure 11d), the creep rate and area increased on 15 October 2018 (Figure 11e). Beginning on 27 October, the creep rate of the H2 sliding body began to accelerate.
To quantitatively analyze the spatiotemporal deformation patterns and characteristics of the Xiongba ancient landslide, two typical profile lines, namely, A-A’ and B-B’, were selected on the slope body. The cumulative deformation curve diagrams were drawn by all the monitoring points (Figure 12 and Figure 13).

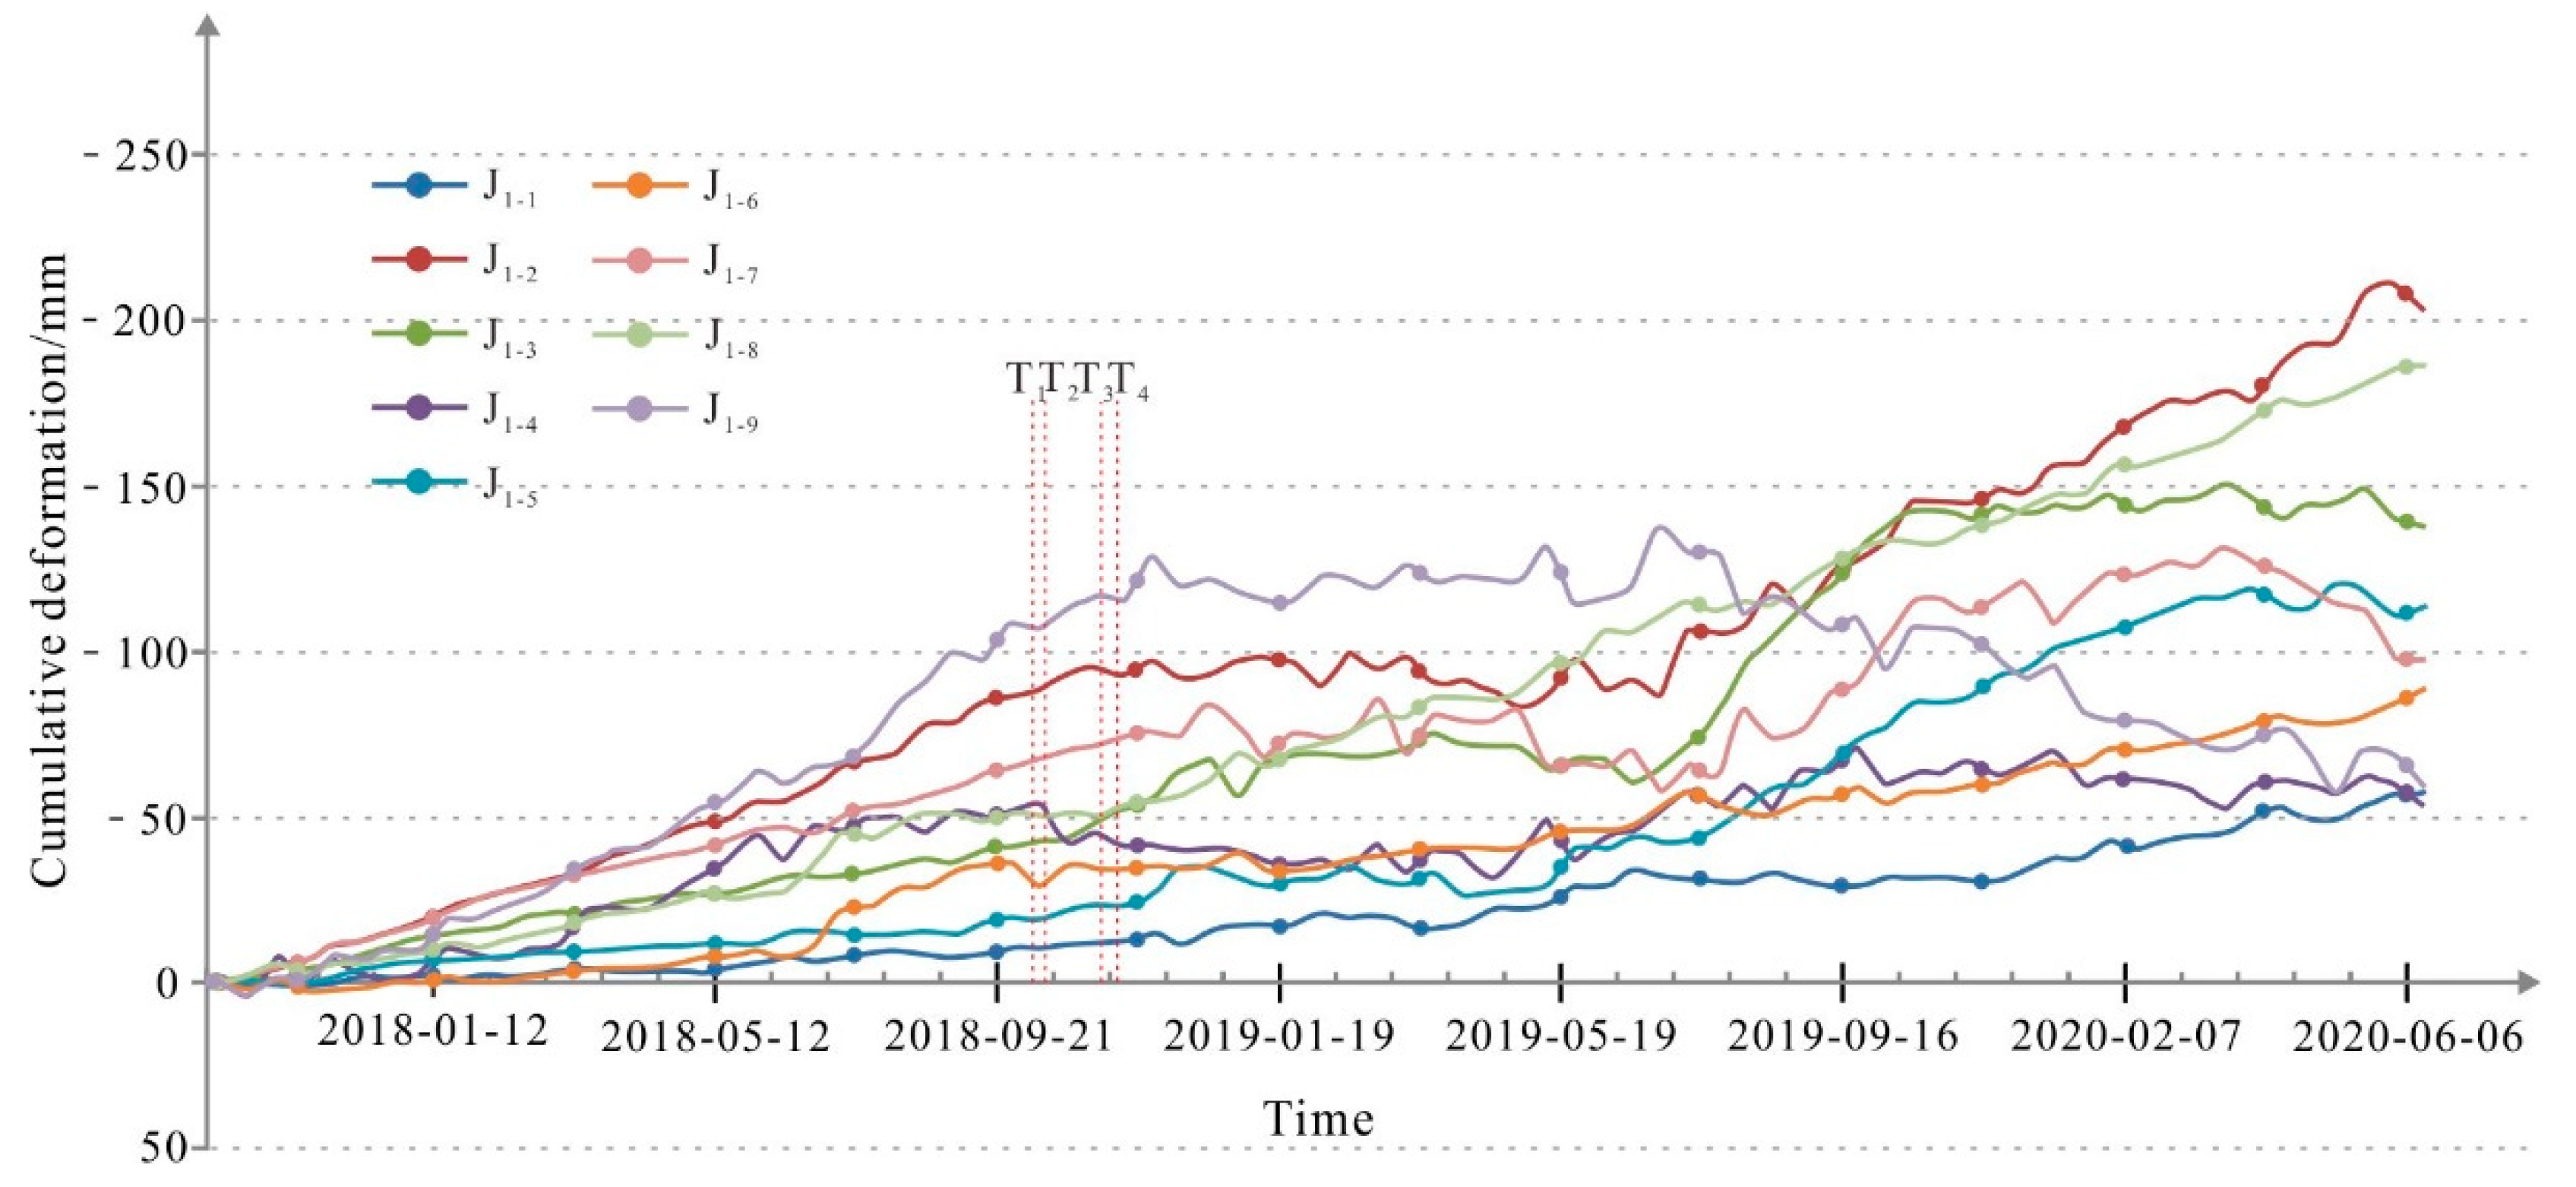
5.3.1. Analysis of the Deformational Trend of the H1 Sliding Body

The A-A’ profile line is taken from the H1 sliding body, and monitoring point #2 is located in the middle and rear parts of the slope, with a maximum cumulative deformation of 203.8 mm. According to the cumulative deformation curve of the A-A’ profile line (Figure 12), before 10 October 2018, the H1 sliding body was in a slow creeping state, the creep rate was approximately 8~9 mm/a, and the cumulative deformation over 12 months was less than 100 mm. After October 2018, the deformation rate of the H1 sliding body has an obvious trend of accelerated deformation. The deformation rate of the central part was the fastest overall. On the northeastern side of the A-A’ profile line, the deformation rate of the slope was relatively low due to the large deformation, the leading edge of the landslide had the second highest deformation rate, the deformation rate of the trailing edge of the landslide was the slowest and the deformation rate of the leading edge of the slope was lower. On 6 June 2020, the maximum cumulative deformation reached 203.8 mm, which was an increase of 134 mm compared with the Baige landslide before the occurrence. The deformation rate reached −131 mm/a, which was 14~16 times that before the Baige landslide occurred in 2018, which shows that the area has multiple levels of deformation or sliding.

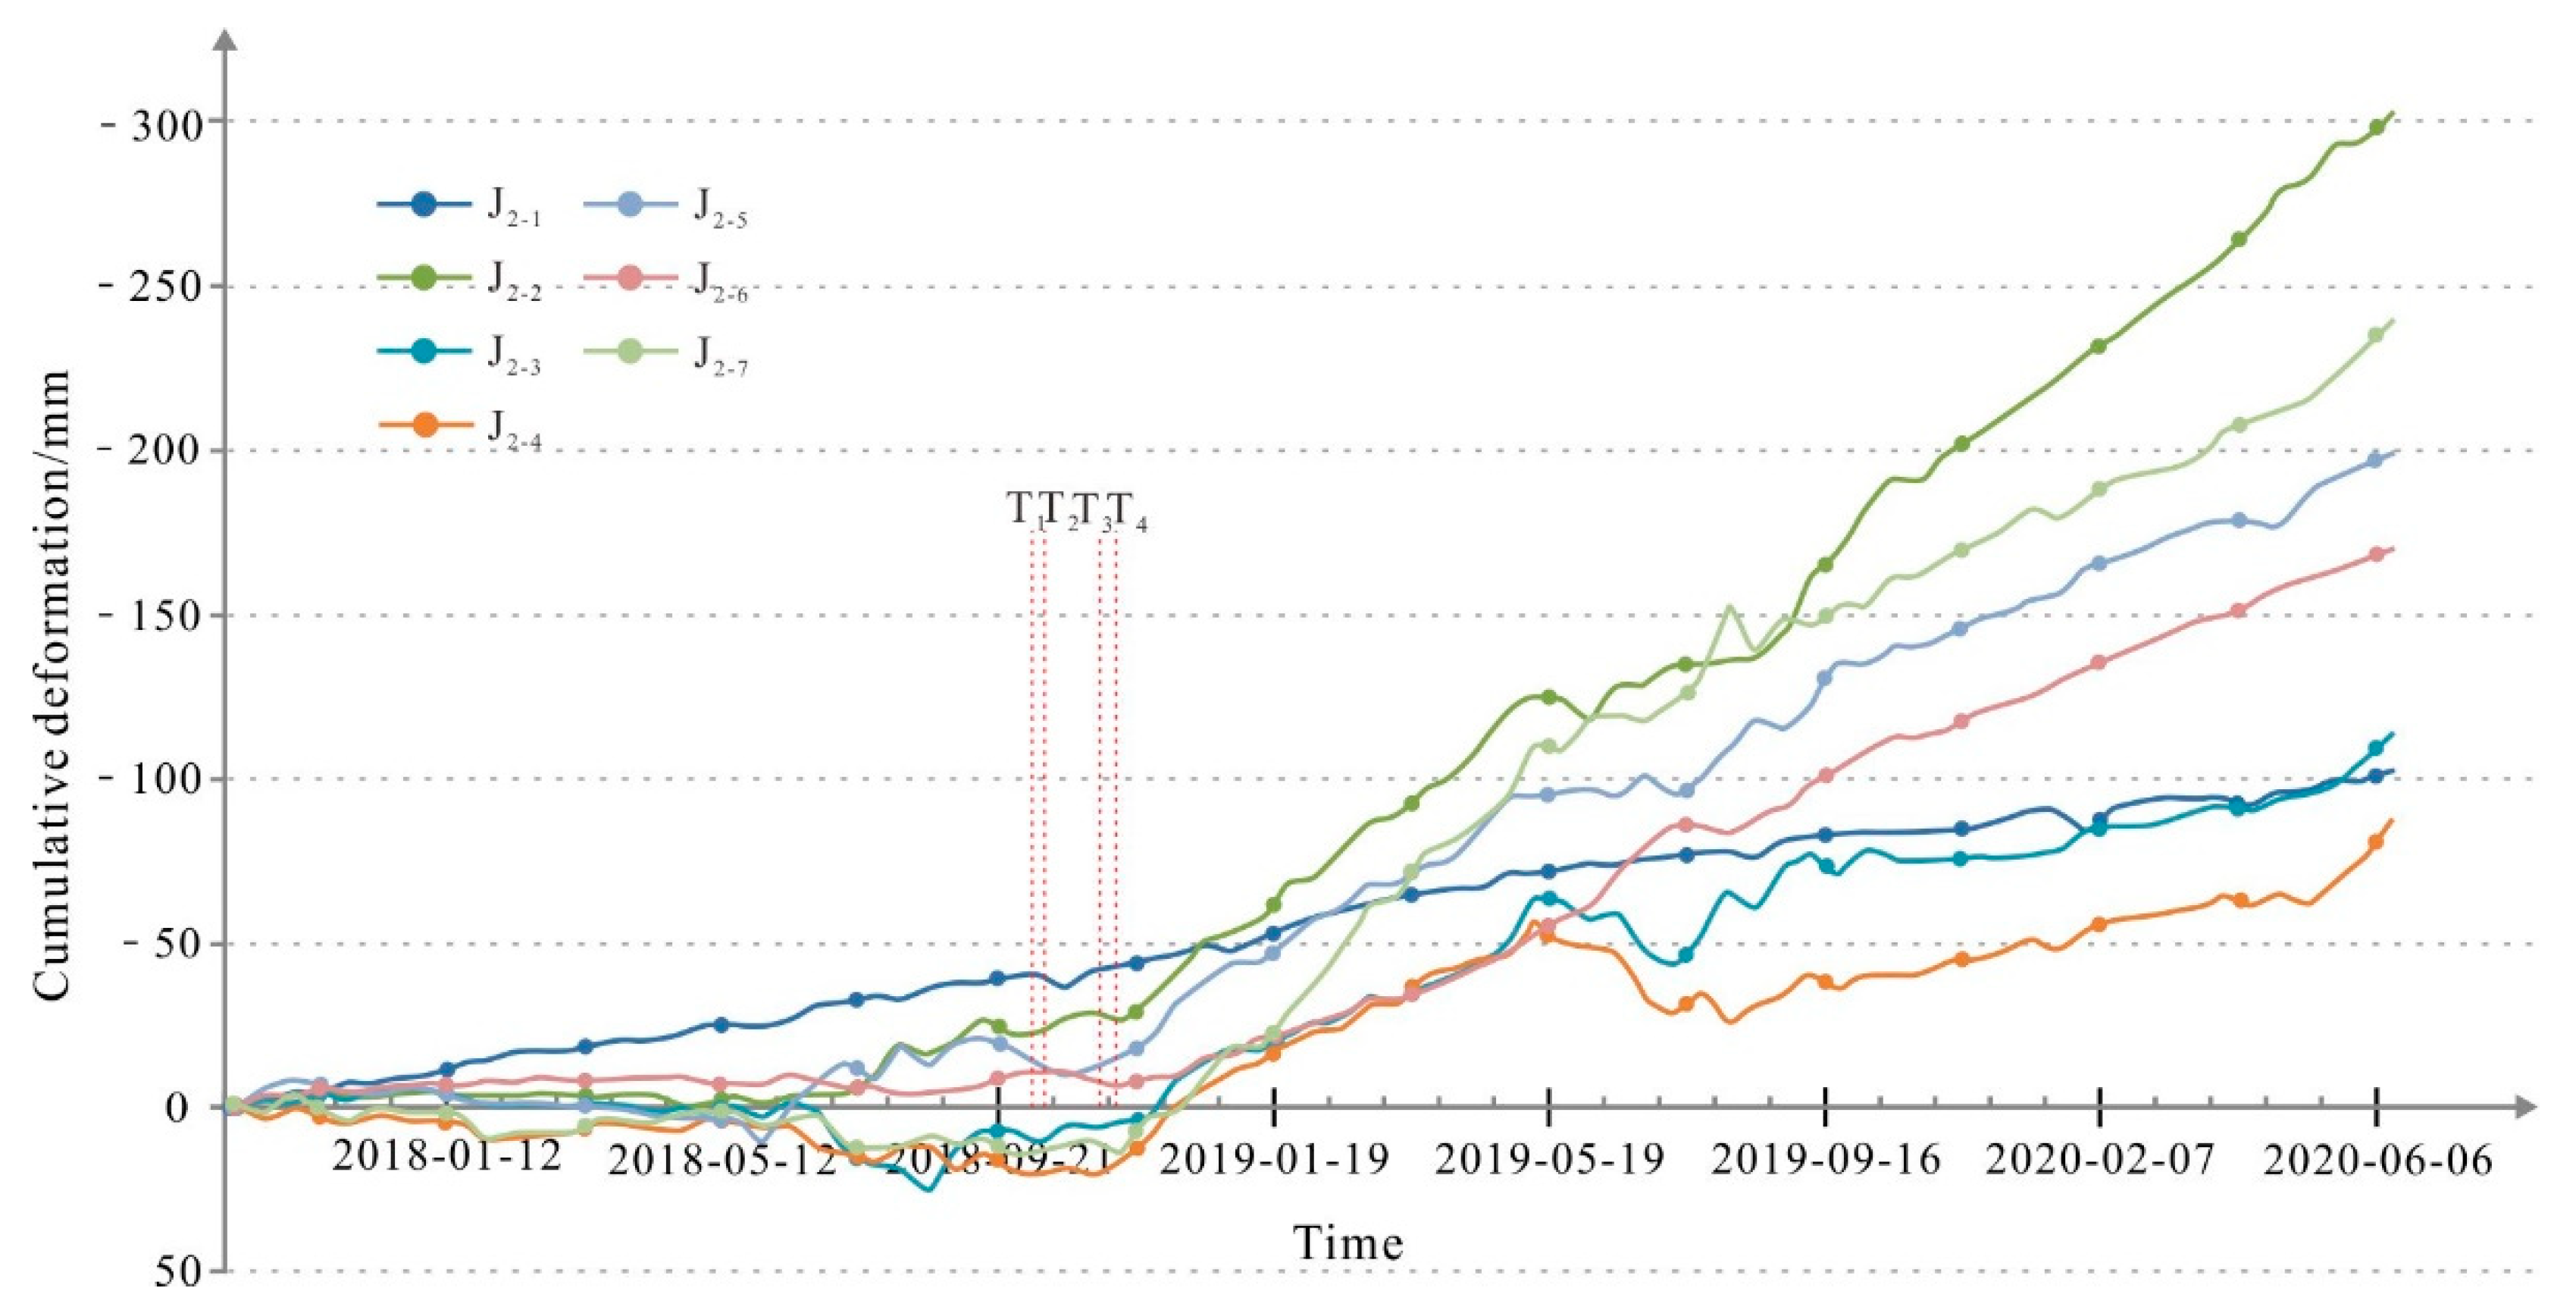
5.3.2. Analysis of the Deformation Trend of the H2 Deformation Body

According to the cumulative deformation curve of the selected monitoring points (Figure 13), before September 2018, the H2 deformation body was stable, and the cumulative deformation for 11 months was less than 30 mm. Taking point #6 as an example, the displacement of some monitoring points was staggered, with low positive–negative deformation values, which indicates that it was in a stable state. After October 2018, the H2 deformation body began to slide abruptly, and all the characteristic points in the selected section line were strongly creeping and sliding. In the B-B’ landslide profile, characteristic point #7 was severely affected by flood erosion from the Jinsha River. After 10 October 2018, especially after the second dammed lake broke on November 12, the deformation values of the B-B’ profile line show that the deformation increased rapidly from December 2018 until June 2020. The maximum deformation reached 302 mm, which was an increase of 274 mm compared to that on 10 October 2018. When the Baige landslide occurred, the deformation rate reached −132 mm/a, which was more than 40 times the deformation rate before the Baige landslide hazard chain occurred upstream.

6. Discussion

6.1. Discussion on the Overall Deformation Characteristics and Trends

Two floods produced by dam breaches at the Baige site in October and November 2018 strongly eroded the foot of the Xiongba ancient landslide 75 km downstream. As a result, the stability of the ancient landslide was reduced, and retrogressive deformation occurred. The results of the InSAR deformation analysis reveal that the deformation rates of the H1 and H2 deformation bodies increased from October 2017 to June 2020. The extremely strong deformation zone and the strong deformation zone of the H1 sliding body have an area of 8.85 × 10⁵ m2, with creep rates of −131 mm/a to 17 mm/a. Before the Baige landslide occurred, the H2 deformation body was basically stable. In December 2018, one month after the second dam breach, the H2 deformation body began to accelerate due o landslide toe erosion by the Jinsha River. Under the effects of river erosion, the tectonic activity and heavy rainfall, the deformation rates of these two deforming bodies are expected to continue to increase. It was shown that the shear strength of the sliding zone soil decreases when the sliding rate increases. Therefore, the strong deformation bodies L1, L2 and L3 at the front edge of the H1 deformation body might continue to slide, which could induce erosion of the front edge, forming steep ridges and rear edge tears. Once this body loses stability, a new landslide-dammed lake with a volume of 6 × 10⁶~10 × 106 m3 or more may occur. The new landslide might cause a wider range of slides, forming a chain of dammed lakes, dam breakages, debris flows and flood geohazards, thereby affecting the safety of downstream bridges and towns.

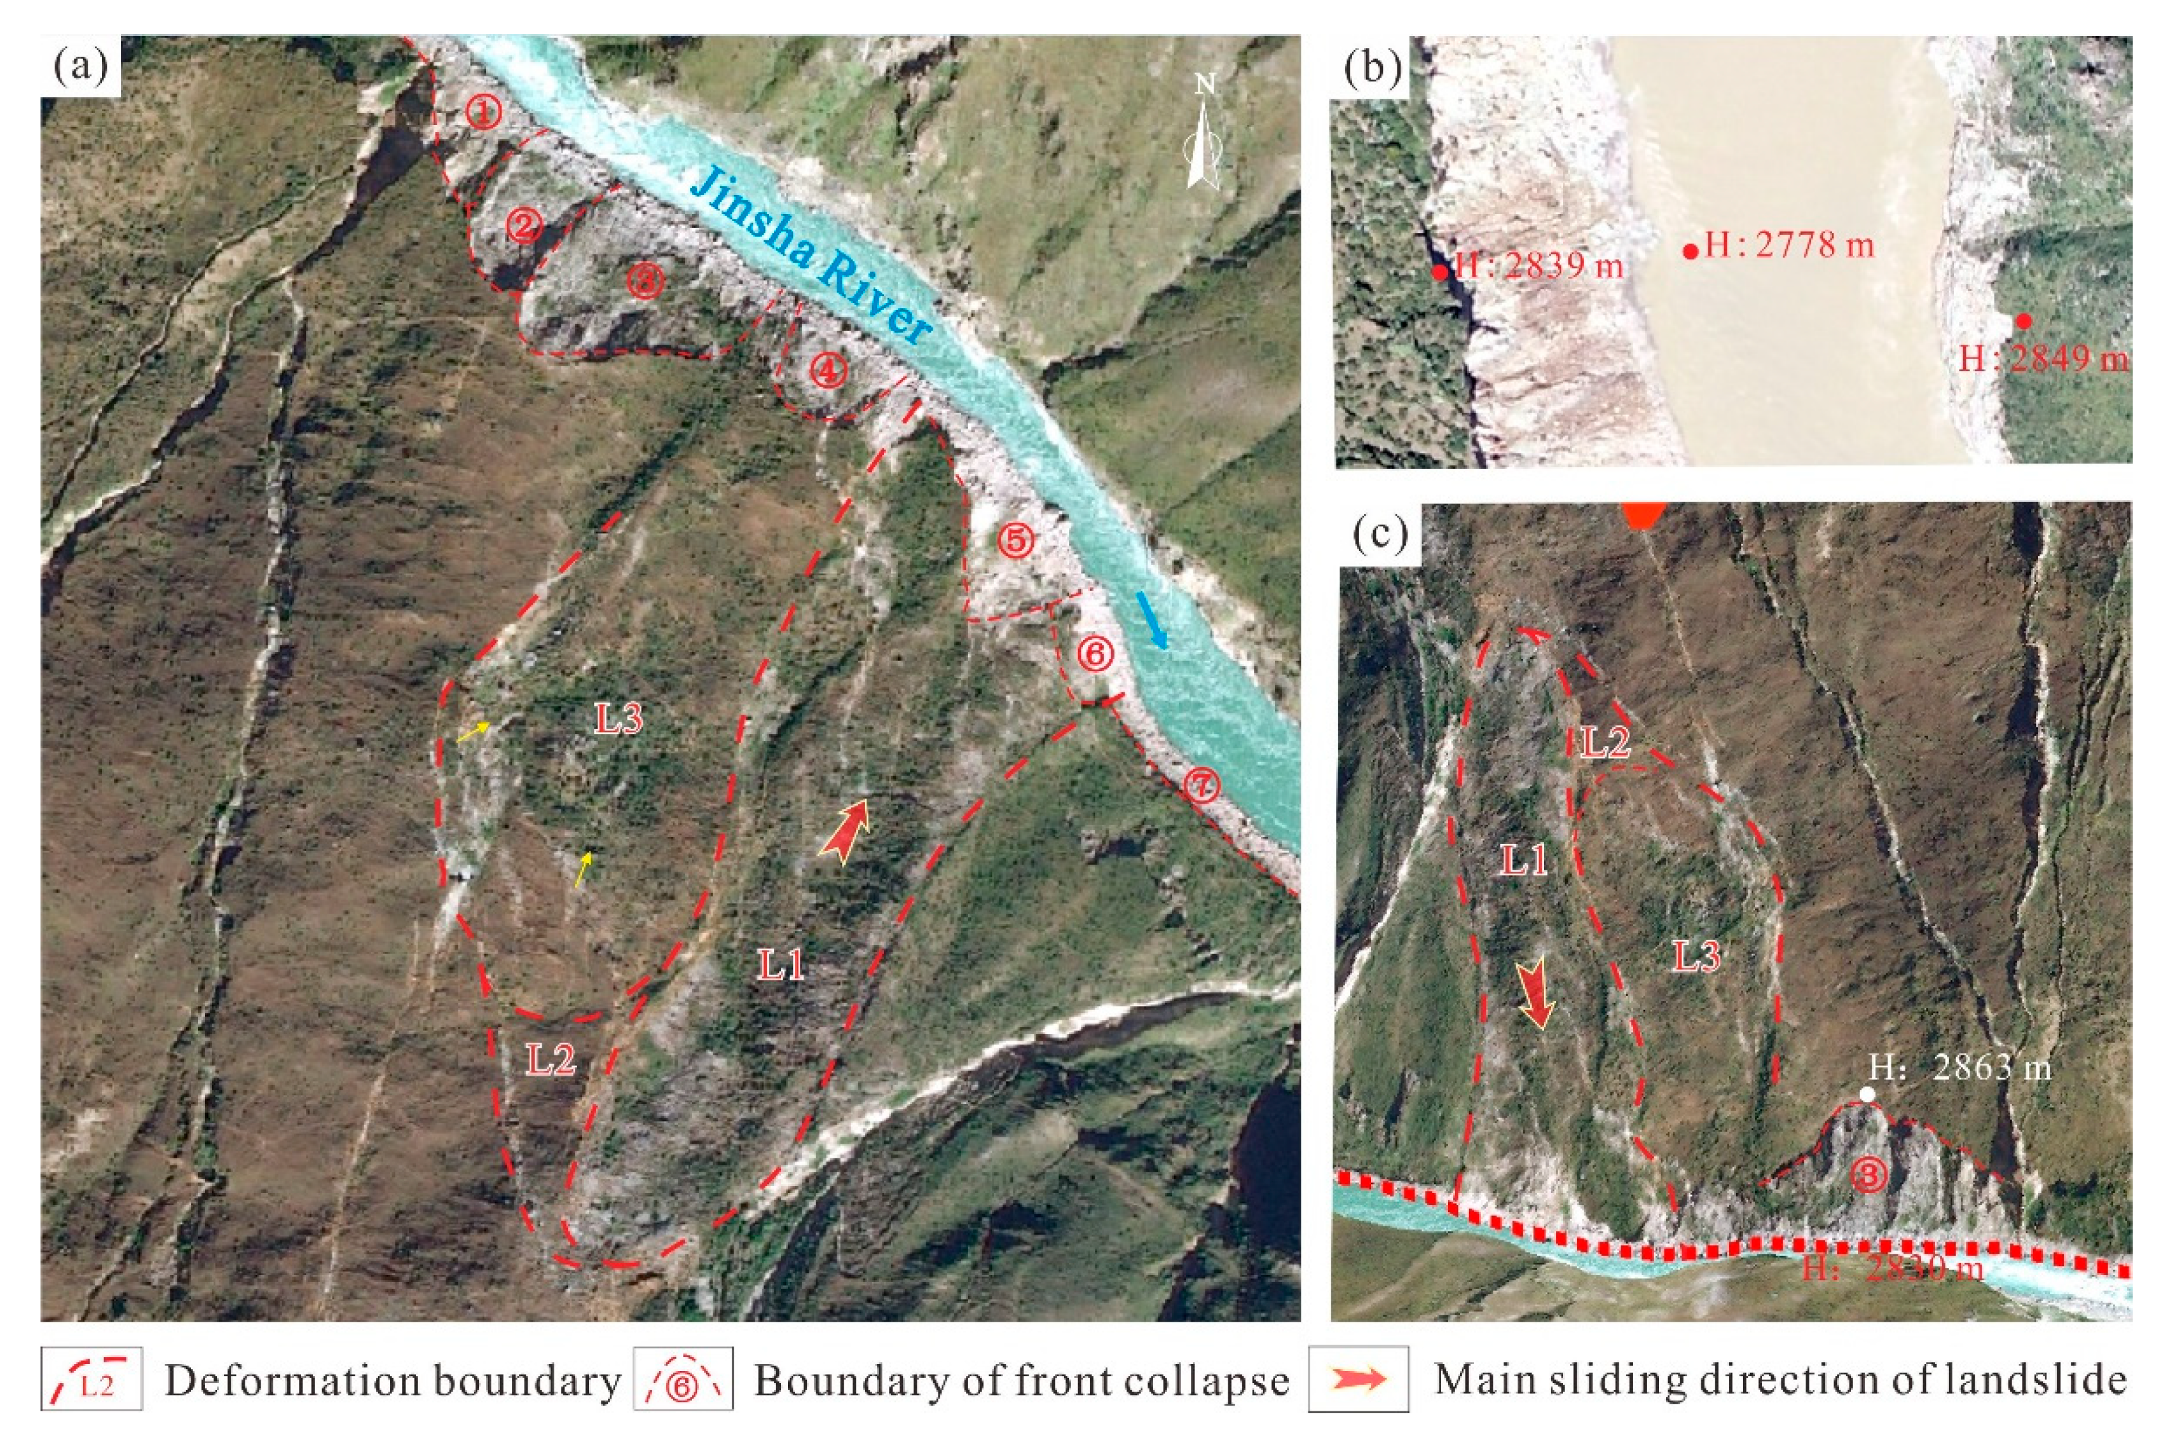
6.2. Discussion on the Influence of the LDLDB Hazard Chain on Downstream Landslide Deformation

The geohazard chains formed by large-scale river-damming landslides, the subsequent breaches of the dammed lakes, and the resulting powerful floods are characterized by fast movement, high energy and strong erosiveness, which might influence slope deformation and instability and cause ancient landslides to be reactivated downstream [55,56]. For example, the Yigong long run-out landslide occurred in 2000 in Tibet, China, dammed the Yigong Tsangpo River and formed a dammed lake with a volume of 30 × 108 m3. The dammed lake broke after a month, and the mudslides and floods influencing the area reached the Indian South Asian Plain 500 km downstream. The mudslides and floods washed away the bridges, transportation and communication facilities on both sides of the Yigong Tsangpo, Parlung Tsangpo and Yarlung Tsangpo Rivers. When the flood passed through the Tongmai Bridge 17 km downstream of the Yigong landslide dam, the peak flow reached 124,000 m3/s [57,58], which was 2.4 times the flood peak of 50,000 m3/s at the Wuhan Yichang hydrological station during the Great Flood of the Yangtze River in 1998, China [59], and 73 times the maximum measured flow of 1700 m3/s in normal years along the Yigong Tsangpo River [60]. The highest flood level was 45 m higher than the normal water level of the Yigong Tsangpo River and 32 m above the destroyed Tongmai Bridge. In addition to the landslide hazard chain directly damaging bridges and other engineering facilities by debris flow floods, Liu et al. (2002) [58] and Lv et al. (2003) [61] concluded that the Yigong hazard chain also caused strong erosion on both banks of the river 130 km downstream and caused slope instability based on remote sensing image interpretation and analysis. Approximately 15 to 36 landslides or collapses, with volumes ranging from hundreds to thousands of m3, were caused by the geohazard chain.
Large-scale landslides, -dammed lakes, and -dam breakages formed hazard chains, causing downstream landslide deformation to increase, which also occurred in other areas. For example, in October and November 2018, in Baige, Tibet, China, an LDLDB hazard chain occurred twice within one month. The debris flow and flood formed by the broken dam rushed 700 km downstream along the Jinsha River, reaching the Tiger Leaping Gorge area of Yunnan. The peak flow of the debris flow and flood formed by the hazard chain was 10,000 m3/s [62], and destroyed the Zhubalong Bridge and other bridges downstream. The peak flood water level was 77.65 m higher than the long-term annual flood water level of the Jinsha River. The mudslide and flood formed by the geohazard chain might have caused acceleration of the creep rate of a large number of ancient landslides to accelerate the creep rate and local landslide reactivation on both sides of the Jinsha River downstream. Zhu et al. (2021) [56] believed that the geohazard chain caused acceleration of the creep rate of the Sela ancient landslide, which is on the western bank of the Jinsha River 80 km downstream. The creep rate increased 6~7 times before and after this hazard chain, from 48–55 mm/a to 319–338 mm/a. Lu et al. (2019) [34] believed that the Baige landslide geohazard chain caused the H31 and H34 landslides to partially collapse and become unstable downstream along the Jinsha River. The H34 landslide had a deformation of 20 mm over 11 days from 22 October to 3 November 2018, and the creep rate reached 660 mm/a, which is 6.6 times the creep rate of 100 mm/a before the Baige landslide geohazard chain occurred.
It is considered that the abrupt changes caused by flood erosion could accelerate the local deformation of large to giant landslides, which might also lead to the overall reactivation of these large ancient landslides and cause serious hazards, such as the damming of rivers.
The Xiongba ancient landslide studied in this research is located 75 km downstream of the Baige landslide along the Jinsha River. The study results showed that the Xiongba ancient landslide creep rate accelerated to more than 132 mm/a, and the creep rate was 14~16 times that before the hazard chain occurred under the influence of two Baige LDLDB hazard chains in 2018, which caused strong erosion of the slope foot.
It was shown that along regional large rivers, after the occurrence of large to giant landslides, the large debris flows and floods formed by LDLDB hazard chains might aggravate slope deformation and instability, and accelerate the creep rates of downstream landslides. The landslide creep rate could be accelerated up to 6~18 times, and it might cause large–giant ancient landslides to slide as a whole, which could form another LDLDB hazard chain. Therefore, it is necessary to monitor the downstream slope and landslide stability after the occurrence of a large-giant LDLDB hazard chain. In particular, advanced technical methods of InSAR, UAVs, and field surveys with geophysical detection should be carried out to conduct large-scale landslide deformation monitoring and early warning research in the whole river watershed.

7. Conclusions

The SBAS-InSAR method, based on a small baseline set, and Sentinel-1A radar data methods were used to study the deformation characteristics of the Xiongba ancient landslide in Tibet, China. The following main conclusions were reached.
First, the Sentinel-1A radar data processed based on SBAS-InSAR technology revealed the deformation characteristics of the Xiongba ancient landslide. From October 2017 to June 2020, the study results showed that the maximum cumulative deformation of the H1 deformation zone of the Xiongba ancient landslide was approximately 204 mm, and the maximum deformation rate was −131 mm/a; the maximum cumulative deformation of the H2 deformation zone was 302 mm, and the maximum deformation rate was −132 mm/a.
Second, the deformation rate of the Xiongba ancient landslide is divided into 4 levels, the extremely strong deformation zone (−132 mm/a ≤ VLOS < −59 mm/a), the strong deformation zone (−59 mm/a ≤ VLOS < −20 mm/a), the medium deformation zone (−20 mm/a ≤ VLOS < 2 mm/a) and the low deformation zone (2 mm/a ≤ VLOS < 55 mm/a). The extremely strong deformation zone is mainly located in the middle of the H1 deformation body, and the local deformation is incoherent due to the large displacement. The strong deformation zone is mainly located in the middle and front edge of the H1 and H2 deformation bodies. The division results are strongly consistent with the actual landslide situation by field survey verification.
Third, the Baige landslide occurred 75 km upstream of the Xiongba ancient landslide. After the Baige landslide resulted in two LDLDB hazard chain events in October and November 2018, debris flows and floods eroded the foot of the Xiongba ancient landslide. The strong erosion accelerated the creep rate of the H1 deformation body and triggered the deformation of the H2 zone. Additionally, the deformation rate of the Xiongba ancient landslide III1 reactivation area accelerated by 14~16 times. After October 2018, the cumulative deformation reached 134 mm. The III2 deformation zone was reactivated, and the deformation rate reached 132 mm/a, which was more than 40 times that before the Baige landslide hazard chain occurred. The deformation rates of the H1 and H2 regions both show an accelerating trend at present.
Fourth, under the continuous influence of river erosion and the LDLDB hazard chain upstream, the deformation of the Xiongba ancient landslide appears to be undergoing retrogressive sliding. Under the condition of an increasing deformation rate, the shear strength of the landslide soil will further decrease. The Xiongba ancient landslide might be reactivated as a whole, which may dam the Jinsha River, resulting in eventual breakage and the occurrence of another geohazard chain. Strengthening the monitoring method of the Xiongba ancient landslide deformation is recommended.

Supplementary Materials

The following are available online at https://0-www-mdpi-com.brum.beds.ac.uk/article/10.3390/rs13173365/s1, Xiongba landslide position.kmz: where the geography position of the Xiongba ancient landslide could be found.

Author Contributions

C.G. proposed the research concept, designed the framework of this research and participated in data analysis. Y.Y. and Y.Z. (Yueze Zheng) processed the InSAR data; Y.Y. and C.G. wrote the manuscript. Y.Z. (Yongshuang Zhang) participated in data analysis and revised the manuscript. X.L., R.W. and Z.Y. make the field geology survey; X.Z., Y.Z. (Yongshuang Zhang) and C.G. reviewed and edited the paper. All authors have read and agreed to the published version of the manuscript.

Funding

This research was funded by the National Natural Science Foundation of China (Nos. 41731287, 41877279, 41941017, 42007280), China Geological Survey Project (Nos. DD20190319, DZLXJK202009) and the Outstanding Young Talent Project, the Ministry of Natural Resources of China (No. 12110600000018003911).

Institutional Review Board Statement

Not applicable.

Informed Consent Statement

Not applicable.

Data Availability Statement

Thanks to the global availability of free and open Sentinel-1 SAR data with Europe Space Agency (ESA), the SAR data be accessible in https://sentinel.esa.int/web/sentinel/missions/sentinel-1, accessed on 18 August 2020.

Acknowledgments

We are very grateful to the reviewers who significantly contributed to the improvement of this paper. The authors would like to thank undergraduate students Dingtao Liu, Yiying Zhang, Jijun Jin, and Hao Yuan for their kind help with field work and data processing.

Conflicts of Interest

The authors declare that there are no conflicts of interest.

References

  1. Wang, S.J. Coupling of earth’s endogenic and exogenic geological processes and origins on serious geological disasters. J. Eng. Geol. 2002, 2, 115–117, (In Chinese with English abstract). [Google Scholar]
  2. Huang, R.Q. Mechanism of large scale landslides in western China. Adv. Earth Sci. 2004, 19, 443–450, (In Chinese with English abstract). [Google Scholar]
  3. Guo, C.B.; Zhang, Y.S.; Jiang, L.W.; Shi, J.S.; Meng, W.; Du, Y.B.; Ma, C.T. Discussion on the environmental and engineering geological problems along the Sichuan Tibet Railway and its adjacent area. Geoscience 2017, 31, 877–899, (In Chinese with English abstract). [Google Scholar]
  4. Zhang, Y.S.; Wu, R.A.; Guo, C.B.; Wang, L.C.; Yao, X.; Yang, Z.H. Research progress and prospect on reactivation of ancient landslides. Adv. Earth Sci. 2018, 33, 728–740, (In Chinese with English abstract). [Google Scholar]
  5. Ma, S.; Xu, C.; Shao, X.; Xu, X.; Liu, A. A Large Old Landslide in Sichuan Province, China: Surface Displacement Monitoring and Potential Instability Assessment. Remote Sens. 2021, 13, 2552. [Google Scholar] [CrossRef]
  6. Long, W.; Chen, J.; Wang, P.F.; Xu, C.; Liu, H.; Sun, J.Z. Formation mechanism and back analysis of paleoseismic parameters of the Temi large-scale ancient landslide in the upper Jinsha River. Earthq. Res. 2015, 38, 568–575, (In Chinese with English abstract). [Google Scholar]
  7. Li, Y.C.; Chen, J.P.; Zhou, F.J.; Song, S.Y.; Zhang, Y.W.; Gu, F.F.; Cao, C. Identification of ancient river-blocking events and analysis of the mechanisms for the formation of landslide dams in the Suwalong section of the upper Jinsha River, SE Tibetan Plateau. Geomorphology 2020, 368, 107351. [Google Scholar] [CrossRef]
  8. Xu, Q.; Zheng, G.; Li, W.L.; He, C.Y.; Dong, X.J.; Guo, C.; Feng, W.K. Study on successive landslide damming events of Jinsha River in Baige village on Octorber 11 and November 3, 2018. J. Eng. Geol. 2018, 26, 129–146, (In Chinese with English abstract). [Google Scholar]
  9. Deng, J.H.; Gao, Y.J.; Yu, Z.Q.; Xie, H.P. Analysis on the formation mechanism and process of Baige landslides damming the upper reach of Jinsha River, China. Eng. Sci. Technol. 2019, 51, 9–16, (In Chinese with English abstract). [Google Scholar]
  10. Wang, L.C.; Wen, M.S.; Feng, Z.; Sun, W.F.; Wei, Y.J.; Li, J.F.; Wang, W.P. Researches on the Baige landslide at Jinshajiang River, Tibet, China. The Chinese, J. Geol. Hazard Control 2019, 30, 5–13, (In Chinese with English abstract). [Google Scholar]
  11. Xu, X.X.; Ji, L.Y.; Jiang, F.Y.; Zhang, W.T. Study on Current Activity Feature of Jinshajiang Fault Zone Based on GPS and Small Earthquakes. J. Geod. Geodyn. 2020, 40, 1062–1067, (In Chinese with English abstract). [Google Scholar]
  12. Li, X.; GUO, C.B.; Yang, Z.H.; Liao, W.; Wu, R.A.; Jin, J.J.; He, Y.X. Development characteristics and formation mechanism of the Xiongba giant ancient landsilde in the Jinshajiang tectonic zone. Geoscience 2021, 35, 47–55, (In Chinese with English abstract). [Google Scholar]
  13. Wu, R.A.; Zhang, Y.S.; Guo, C.B.; Yang, Z.H.; Liu, X.Y. Characteristics and formation mechanisms of the Lagangcun giant ancient landslide in Jiacha, Tibet. Acta Geol. Sin. 2018, 92, 1324–1334, (In Chinese with English abstract). [Google Scholar]
  14. Zhang, Y.S.; Du, G.L.; Guo, C.B.; Li, X.Q.; Ren, S.S.; Wu, R.A. Research on typical geomechanical model of high-position landslides on the Sichuan-Tibet traffic corridor. Acta Geol. Sin. 2021, 95, 605–617, (In Chinese with English abstract). [Google Scholar]
  15. Fruneau, B.; Achace, J.; Delacourt, C. Observation and modeling of the Saint-Etienne-de-Tinee landslide using SAR interferometry-ScienceDirect. Tectonophysics 1996, 265, 181–190. [Google Scholar] [CrossRef]
  16. Ferretti, A.; Prati, C.; Rocca, F. Permanent scatterers in SAR interferometry. IEEE Trans. Geosci. Remote Sens. 2001, 39, 8–20. [Google Scholar] [CrossRef]
  17. Berardino, P.; Fornaro, G.; Lanari, R.; Sansosti, E. A new algorithm for surface deformation monitoring based on small baseline differential SAR interferograms. IEEE Trans. Geosci. Remote Sens. 2002, 40, 2375–2383. [Google Scholar] [CrossRef] [Green Version]
  18. Usai, S. A least squares database approach for SAR interferometric data. IEEE Trans. Geosci. Remote Sens. 2003, 41, 753–760. [Google Scholar] [CrossRef] [Green Version]
  19. Pearsall, S.H.; McCrodden, B.J.; Townsend, P.A. Adaptive management of flows in the lower Roanoke River, North Carolina, USA. Environ. Manag. 2005, 35, 353–367. [Google Scholar] [CrossRef]
  20. Racoviteanu, A.E.; Williams, M.W.; Barry, R.G. Optical Remote Sensing of Glacier Characteristics: A Review with Focus on the Himalaya. Sensors 2008, 8, 3355–3383. [Google Scholar] [CrossRef] [PubMed] [Green Version]
  21. Giordan, D.; Allasia, P.; Dematteis, N.; Dell’Anese, F.; Vagliasindi, M.; Motta, E. A Low-Cost Optical Remote Sensing Application for Glacier Deformation Monitoring in an Alpine Environment. Sensors 2016, 16, 1750. [Google Scholar] [CrossRef] [Green Version]
  22. Ge, D.Q.; Wang, Y.; Fan, J.H.; Liu, S.W.; Guo, X.F.; Wang, Y. A study of surface deformation monitoring using differential SAR interferometry technique and an analysis of its key problems. Remote Sens. Land Resour. 2007, 4, 14–22, (In Chinese with English abstract). [Google Scholar]
  23. Zhang, Y.S.; Liu, X.Y.; Yao, X. InSAR-based method for early recognition of ancient landslide reactivation in Dadu River, China. J. Hydraul. Eng. 2020, 51, 545–555, (In Chinese with English abstract). [Google Scholar]
  24. Hu, J.; Li, Z.W.; Ding, X.L.; Zhu, J.J.; Zhang, L.; Sun, Q. Resolving three-dimensional surface displacements from InSAR measurements: A review. Earth Sci. Rev. 2014, 133, 1–17. [Google Scholar] [CrossRef]
  25. Aslan, G.; Foumelis, M.; Raucoules, D.; Michele, M.D.; Bernardie, S.; Cakir, Z. Landslide mapping and monitoring using persistent scatterer interferometry (PSI) technique in the French Alps. Remote Sens. 2021, 12, 1305. [Google Scholar] [CrossRef] [Green Version]
  26. Ge, D.; Zhang, L.; Li, M.; Liu, B.; Yan, W. Beijing subway tunnelings and high-speed railway subsidence monitoring with PSInSAR and TerraSAR-X data. In Proceedings of the 2016 IEEE International Geoscience and Remote Sensing Symposium (IGARSS), Beijing, China, 10–15 July 2016. [Google Scholar]
  27. Yao, X.; Zhang, Y.S.; Li, L.J.; Ling, S.; Wang, Z.S.; Zhou, Z.K. InSAR-based recognition of slow-moving slop disasters along the Xianshuihe active fault in the Qinghai-Tibetan Plateau. Acta Geol. Sin. 2017, 91, 1694–1705, (In Chinese with English abstract). [Google Scholar]
  28. Li, Y.; Zhang, J.; Luo, Y. Monitoring of surface deformation in Dangxiong using PSInSAR technique. J. Appl. Geod. 2012, 6, 215–220. [Google Scholar] [CrossRef]
  29. Ge, D.Q.; Yin, Y.P.; Wang, Y.; Zhang, L.; Guo, X.F.; Wang, Y. Seasonal subsidence—Rebound and ground water level changes monitoring by using coherent target InSAR technique: A case study of Dezhou, Shandong. Remote Sens. Land Resour. 2014, 26, 103–109, (In Chinese with English abstract). [Google Scholar]
  30. Zhao, C.Y.; Zhang, Q.; Zhang, J. Deformation monitoring of ground fissure with SAR interferometry in Qingxu, Shanxi Province. J. Eng. Geol. 2011, 19, 70–75, (In Chinese with English abstract). [Google Scholar]
  31. Zhou, Z.K.; Yao, X. Tectonic deformation study of Nov.25, 2016 Mw6.6 earthquake in west Kunlun mountain based on InSAR technology. Acta Geol. Sin. 2018, 92, 232–243, (In Chinese with English abstract). [Google Scholar]
  32. Gostelow, P.; Wasowski, J. Ground surface changes detectable by earth observation and their impact on the stability of slopes. Pol. Geol. Inst. Spec. Pap. 2004, 15, 43–52. [Google Scholar]
  33. Hilley, G.E.; Burgmann, R.; Ferretti, A.; Novali, F.; Rocca, F. Dynamics of slow-moving landslides from permanent scatterer analysis. Science 2004, 304, 1952–1955. [Google Scholar] [CrossRef] [Green Version]
  34. Lu, H.Y.; Li, W.L.; Xu, Q.; Dong, X.J.; Dai, C.; Wang, D. Early detection of landslides in the upstream and downstream areas of the Baige landslide, the Jinsha River based on optical remote sensing and InSAR technologies. J. Wuhan Univ. 2019, 44, 1342–1354, (In Chinese with English abstract). [Google Scholar]
  35. Achache, J.; Fruneau, B.; Delacourt, C. Applicability of SAR interferometry for operational monitoring of landslides. Proc. Second. ERS Appl. Workshop. 1996, 383, 165–168. [Google Scholar]
  36. Xie, M.W.; Wang, Z.F.; Hu, M.; Huang, J.H. The characteristic analysis of D-InSAR data for landslides monitoring in alpine and canyon region. Surv. Mapp. Bull. 2012, 4, 18–21, (In Chinese with English abstract). [Google Scholar]
  37. Herrera, G.; Gutiérrez, F.; García-Davalillo, J.C.; Guerrero, J.; Notti, D.; Galve, J.P.; Fernández-Merodo, J.A.; Cooksley, G. Multi-sensor advanced DInSAR monitoring of very slow landslides: The Tena valley case study (Central S panish Pyrenees). Remote Sens. Environ. 2013, 128, 31–43. [Google Scholar] [CrossRef]
  38. Calvello, M.; Peduto, D.; Arena, L. Combined use of statistical and D-InSAR data analyses to define the state of activity of slow-moving landslides. Landslides 2017, 14, 1–17. [Google Scholar] [CrossRef]
  39. Ge, D.; Wang, Y.; Zhang, L.; Zhang, X.; Yan, D.; Man, L. Integrating corner reflectors and PSInSAR technique to monitor regional land subsidence. In Proceedings of the 2011 IEEE International Geoscience and Remote Sensing Symposium, Vancouver, BC, Canada, 24–29 July 2011. [Google Scholar]
  40. Lu, W.D.; Han, C.M.; Yue, X.J.; Zhao, Y.H.; Zhou, G.Y. Land subsidence monitoring in Tianjin with PS-InSAR technique based on Sentinel -1 data. Remote Sens. Technol. Appl. 2020, 35, 416–423, (In Chinese with English abstract). [Google Scholar]
  41. Usai, S. A New Approach for Long Term Monitoring of Deformations by Differential SAR Interferometry; Delft University of Tech: Delft, The Netherlands, 2001. [Google Scholar]
  42. Li, Y.S.; Zhang, J.F.; Luo, Y.; Jiang, W.L. Monitoring land deformation using PSInSAR with TerraSAR-X high resolution spotlight SAR images. J. Wuhan Univ. 2012, 37, 1452–1455, (In Chinese with English abstract). [Google Scholar]
  43. Dai, C.; Li, W.L.; Lu, H.Y.; Yang, F.; Xu, Q.; Jian, J. Landslides detection using InSAR technology, a cast study in Zhouqu County, Gansu Province, China. Geomat. Inf. Sci. Wuhan Univ. 2020, 46, 994–1002, (In Chinese with English abstract). [Google Scholar]
  44. Zebker, H.A.; Rosen, P.A.; Hensley, S. Atmospheric effects in interferometric synthetic aperture radar surface deformation and topographic maps. J. Geophys. Res. 1997, 102, 7547–7563. [Google Scholar] [CrossRef]
  45. Li, S.S.; Li, Z.W.; Hu, J.; Sun, Q.; Yu, X.Y. Investigation of the seasonal oscillation of the permafrost over Qinghai-Tibet Plateau with SBAS-InSAR algorithm. J. Geophys. 2013, 56, 1476–1486, (In Chinese with English abstract). [Google Scholar]
  46. Hu, L.Y.; Zhang, J.F.; Shang, X.Q. SBAS-InSAR Technology and its application in monitoring the crustal deformation. Bull. Inst. Crustal Dyn. 2010, 0, 82–89, (In Chinese with English abstract). [Google Scholar]
  47. Li, Y.S.; Zhang, J.F.; Li, Z.H.; Luo, Y. Land subsidence in Beijing city from InSAR time series analysis with small baseline subset. J. Wuhan Univ. 2013, 38, 1374–1377, (In Chinese with English abstract). [Google Scholar]
  48. Dai, K.; Li, Z.H.; Tomás, R.; Liu, G.X.; Yu, B.; Wang, X.W.; Cheng, H.Q.; Chen, J.J.; Stockamp, J. Monitoring activity at the Daguangbao mega-landslide (China) using Sentinel-1 TOPS time series interferometry. Remote Sens. Environ. 2016, 186, 501–513. [Google Scholar] [CrossRef] [Green Version]
  49. Jin-Woo, K.; Lu, Z.; Kimberly, D. Ongoing deformation of Sinkholes in Wink, Texas, observed by time-series Sentinel-1A SAR interferometry (Preliminary Results). Remote Sens. 2016, 8, 313. [Google Scholar]
  50. Wasowski, J.; Bovenga, F. Investigating landslides and unstable slopes with satellite Multi Temporal Interferometry: Current issues and future perspectives. Eng. Geol. 2014, 174, 103–138. [Google Scholar] [CrossRef]
  51. Wen, H. Study on Landslide Recognition in Minjiang Basin Based on MTI Technology; Nanjing Normal University: Nanjing, China, 2015; (In Chinese with English abstract). [Google Scholar]
  52. Feng, W.K.; Dun, J.W.; Yi, X.Y.; Zhang, G.Q. Deformation analysis of Woda village old landslide in Jinsha river basin using SBAS-InSAR technology. J. Eng. Geol. 2020, 28, 384–393, (In Chinese with English abstract). [Google Scholar]
  53. Wang, Z.H.; Yang, R.H. The activity characteristics and movement style of Qianjiangping Landslide in the Three Gorges Reservoir region. Chin. J. Geol. Hazard Control 2005, 16, 8–14, (In Chinese with English abstract). [Google Scholar]
  54. Wang, J.P. Resaerch on formation mechanism and motion characteristics of Lamuajue landslide in Meigu county. Sichuan: Chengdu Univ. Technol. 2016. (In Chinese with English abstract). [Google Scholar]
  55. Chen, Z.S.; Zhang, X.Q. A hazard-chain of landslide-collapse-debris flow-river stoppage in Wulong county, Sichuan province on April 30, 1994. Mt. Res. 1994, 4, 225–229, (In Chinese with English abstract). [Google Scholar]
  56. Zhu, S.N.; Yin, Y.P.; Wang, M.; Zhu, M.; Wang, C.H.; Wang, W.P.; Li, J.F.; Zhao, H. Instability mechanism and mitigation countermeasures of long run-out landslide at high location in Jinshajiang suture: A case study of the Sela Landslide in Jinsha River, Tibet. Chin. J. Geotech. Eng. 2021, 43, 688–697, (In Chinese with English abstract). [Google Scholar]
  57. Yin, Y.P. Study on characteristics and disaster reduction of giant landslides on Bomi-Yigong Expressway in Tibet. Hydrogeol. Eng. Geol. 2000, 4, 8–11, (In Chinese with English abstract). [Google Scholar]
  58. Liu, W. Study on the characteristics of huge scale-super highspeed-long distance landslide chain in Yigong, Tibet. Chin. J. Geol. Hazard Control 2002, 13, 11–20, (In Chinese with English abstract). [Google Scholar]
  59. Wang, L.K.; Tao, Z.Y.; Yang, Y.; Ma, Y.; Wang, X. Analysis of satellite image characters of severe storm rainfall during the flood of Yangtze River in 1998. Acta Sci. Nat. Univ. Pekin. 2000, 36, 87–94, (In Chinese with English abstract). [Google Scholar]
  60. Wan, H.B. Extraordinary mountain slide in Yigong of Xizang and its measures for disaster mitigation. Adv. Water Sci. 2000, 10, 321–324. [Google Scholar]
  61. Lv, J.T.; Wang, Z.H.; Zhou, C.H. Discussion on the occurrence of Yigong landslide in Tibet. Ear. Sci. J. Chin. Uni. Geosci. 2003, 28, 107–110, (In Chinese with English abstract). [Google Scholar]
  62. Yu, Z.Q.; Deng, J.H.; Gao, Y.J.; Yang, Z.K.; Ge, H. Analysis on Baige landslide and barrier lake flood disasters in Jinsha River. J. Disaster Prev. Mitig. Eng. 2020, 40, 286–292, (In Chinese with English abstract). [Google Scholar]
Figure 1. Typical giant landslide distribution along the Jinsha River fault zone. (a)—The distribution map of the Jinshajiang fault zone; (b)—Baige landslide (view to NW); (c)—Xiongba ancient landslide (view to SE); (d)—Sela ancient landslide (view to NE).
Remotesensing 13 03365 g001
Figure 2. Remote sensing interpretation of the Xiongba ancient landslide and surface deformation feature map. (a) Remote sensing interpretation map of the Xiongba ancient landslide (base map according to Google Earth); (b) characteristics of the landslide front ridge and surface deformation (view to NW); (c) development characteristics of surface cracks in front of the landslide (view to NE).
Remotesensing 13 03365 g002
Figure 3. Schematic diagram of the interferometric radar measurement principle (After Usai et al., 2001 [41]).
Remotesensing 13 03365 g003
Figure 4. Processing flow of SBAS-InSAR data (After Berardino, 2002 [17]).
Remotesensing 13 03365 g004
Figure 5. Data coverage map of Sentinel-1A in this study.
Remotesensing 13 03365 g005
Figure 6. Spatiotemporal baseline map of SBAS-InSAR interferometric data of the Xiongba ancient landslide.
Remotesensing 13 03365 g006
Figure 7. Deformation rate distribution map of the Xiongba ancient landslide based on SBAS-InSAR technology.
Remotesensing 13 03365 g007
Figure 8. Map of InSAR deformation characteristics of the Xiongba landslide.
Remotesensing 13 03365 g008
Figure 9. Typical profile of the InSAR deformation rate of the Xiongba ancient landslide. (a) Deformation rate profile of the H1 deformable body; (b) deformation rate profile of the H2 deformable body.
Remotesensing 13 03365 g009
Figure 10. Remote sensing image of the field survey in the revival area of the front edge of the Xiongba ancient landslide. (a) Deformation characteristics of the H1 front edge (based on UAV images); (b) erosion characteristics of rivers in the H2 front; (c) three-dimensional image of deformation characteristics of H1 front.
Remotesensing 13 03365 g010
Figure 11. Deformation results of the Xiongba ancient landslide in different time periods (line-of-sight direction). Cumulative deformation time, (a) 28 August 2018; (b) 9 September 2018; (c) 21 September 2018; (d) 3 October 2018; (e) 15 October 2018; (f) 27 October 2018; (g) 8 November 2018; (h) 20 November 2018; (i) 26 December 2018.
Remotesensing 13 03365 g011
Figure 12. Time series deformation curve of characteristic section A-A’ of the H1 deformation body from October 2017 to June 2020. T1—10 October 2018; T2—12 October 2018; T3—3 November 2018; T4—12 November 2018.
Remotesensing 13 03365 g012
Figure 13. Time series deformation curve of characteristic section B-B’ of the H1 deformation body from October 2017 to June 2020. T1—10 October 2018; T2—12 October 2018; T3—3 November 2018; T4—12 November 2018.
Remotesensing 13 03365 g013
Table 1. The basic parameters of SAR image data.
SAR SensorSentinel-1A
Orbital directionAscending
Path99
Frame1280
Wave bandC
Radar wavelength/cm5.6
Incident angle/(°)33.85
Complementary angle of Incidence/(°)56.15
Time interval for image acquisition(day)12
Image acquisition time8 October 2017 to 6 June 2020
Quantity of captured images79
Publisher’s Note: MDPI stays neutral with regard to jurisdictional claims in published maps and institutional affiliations.

