
A Novel Slip Sensory System for Interfacial Condition Monitoring of Steel-Concrete Composite Bridges

1
School of Civil and Environmental Engineering, Faculty of Engineering and Information Technology, University of Technology Sydney, Ultimo, NSW 2007, Australia
2
Centre for Infrastructure Engineering, School of Engineering, Design and Built Environment, Western Sydney University, Penrith, NSW 2751, Australia
*
Author to whom correspondence should be addressed.
Remote Sens. 2021, 13(17), 3377; https://0-doi-org.brum.beds.ac.uk/10.3390/rs13173377
Submission received: 28 May 2021
/
Revised: 22 August 2021
/
Accepted: 23 August 2021
/
Published: 25 August 2021
(This article belongs to the Special Issue Bridge Monitoring Using Remote Sensors)
Abstract
:Steel-concrete composite (SCC) beams are widely employed in bridge decks. The interfacial shear transfer between the top concrete slab and the supporting steel beams significantly affects the overall load carrying capacity and performance of a bridge deck. The inaccessibility of the connection system makes the visual inspection difficult, and the traditional vibration-based methods are insensitive to this type of local damage. In this study, a novel interlayer slip monitoring system has been developed for interfacial condition assessment of SCC beams. The monitoring system is mainly based on the Ultra-flat Industrial Potentiometer Membrane (UIPM). The sensor film that is glued on a steel base is mounted on the concrete slab, and the wiper is installed on the steel beam. The interlayer slip between the concrete slab and steel beam is monitored by the relative displacement between the sensor film and the wiper. An experimental study has been carried out on a 6-m long composite bridge model in the laboratory. In the model, the concrete slab and the steel beams are bolt-connected, and the bolts could be loosened to simulate the defects in the shear connection system. Seven slip sensors are evenly installed along the bridge model. The sensors are calibrated using the testing machine before they are installed on the bridge model. Three damage scenarios are simulated by loosening bolts at different locations. Different loadings are also applied on the bridge to simulate the operational conditions. Undamaged and damaged scenarios have been considered within load increments, and data are collected and interpreted to find out how the slip changes. The results show that this system is reliable and efficient to monitor the interlayer slip for assessing the interface condition of composite structures.
1. Introduction
Structural health monitoring (SHM) refers to applying non-destructive techniques for condition assessment and damage detection of structures. Damage detection aims to find out possible damage caused by structural ageing in operational and environmental conditions. Condition assessment is to evaluate the characteristics that affect structural performance and reliability by considering uncertainties in measurements, defining the baseline of condition indices, evaluating sensitive features to damage and identifying ill-conditioned variations [1,2]. Increasing demands on safety and reliability of the civil-infrastructure such as bridges have put forward employing advanced sensing technologies and monitoring systems for their condition assessment [3,4]. Bridges are subjected to various operational and environmental loads within their long-term service life, and these external loads are undesirable and prone to accelerate structural damage. Thus, it is essential to assess their condition to ensure safety. Depending on the structural type and loading condition, different monitoring systems are installed to acquire real-time data for structural condition assessment [5].
Composite structures are widely used in buildings and bridges and the performance of the connection system between two composite components significantly affects its load carrying capacity [6]. There are two main types of structural composite systems often used for beams including timber-concrete composite (TCC) and steel-concrete composite (SCC) which are made of different materials and shear connections [7,8]. The TCC structures are often used for retrofitting and strengthening of existing timber floors, new and prefabricated floors, footbridges, bridges and walls [9]. The composite action between the concrete and timber in the TCC beams enables us to increase the stiffness and reduce the natural frequency while keeping the structure lightweight. The behaviour of TCC beams under bending load is complicated because it depends on the composite action between the concrete and timber, and the slip distribution along the timber-concrete interface. The connection system transfers the shear force which results axial forces in the composite components, and the axial forces contribute in their resistant moments. Thus, the analysis of TCC structures is challenging due to those non-linearities of the materials and connections under loading.
The SCC beams are widely used structural members in the existing and large-scale bridges. This is due to their unique characteristics, such as lightweight, high stiffness and high strength [2,10,11]. More than seventy percent of bridges in Australia were constructed before 1976 [12], while the majority of bridges in Europe were built before 1965 [13], and more than eleven percent of bridges in the United States constructed before 1950 have structural defects [14]. These lead to costly assessment and maintenance of existing bridges, and consequently show the importance of the SCC beam structures. An SCC beam structure consists of a concrete slab on the top of a steel girder with a shear connection at the interface. The operational life of a composite structure is affected by the integrity of its shear connection. Since the shear connection governs the composite action, the interconnection behaviour between the concrete and steel layers becomes complex [15,16]. Thus, the interfacial integrity and overall condition monitoring of the SCC beam confront difficulties. Besides, the severity of external loads is a crucial factor in SCC beam behaviour [17,18]. If the applied load exceeds its load-bearing capacity, massive displacements will take place that could lead to failure and visible damages. It is important to prevent such collapses by predicting and identifying early damages. Therefore, the concerns are about their future condition that may change due to small and invisible damages.
When an external load overcomes the friction forces at an SCC beam interface, its bond strength may fail, which declines its overall rigidity and ultimate strength [19,20]. The bond strength failure leads to shear slip that is an inherent relative displacement (sliding) between the composite layers. Damage on the shear connections due to fatigue, corrosion, or overstressing is a further reason for failure in the bond strength that causes excessive interface shear slip and loss in the composite action [21,22]. Therefore, the shear slip causes the concrete slab and steel girder to respond independently to loading that significantly affects the SCC beam load-bearing capacity and performance [23]. Nie and Cai [7] showed that damage on the shear connectors causes shear slip between concrete and steel, resulting in a stiffness degradation of 17% in an SCC bridge deck. The interlayer condition assessment of the SCC beams is challenging because the shear slip depends on the load that causes nonlinearity in the composite beam responses. Besides, the direct inspection is impossible as the shear connections are inaccessible. Traditional vibration-based methods have been employed for the condition assessment of SCC beam structures. Xia et al. [24] showed that the global vibration parameters of SCC beam structures such as natural frequencies, mode shapes and the derivations of mode shapes are not sensitive to the interface slip and do not apply to this type of local damage. Thus, selecting a useful feature less affected by environmental uncertainties such as noise is an extra challenge.
In recent years, non-contact displacement sensors such as GPS [25], laser Doppler vibrometer [26], microwave interferometer [27], digital image processing, Terrestrial Laser Scanners (TLSs) [28,29] and Linear variable differential transformer (LVDT) [30] have been employed. Although Thomson et al. [31] showed that LVDT could measure displacement, it limits the measurement range and is sensitive to temperature. Besides, LVDT is not practical in real structures as a stable reference location close to the structure is required. Laser optic sensors are utilized as an alternative as they have a 100 to 500 mm measurement range and a sampling rate of 1 Hz to 50 kHz. However, laser optic sensors are not accurate enough and difficult to install in the filed as they are usually used to measure the displacement of structure based on a fixed foundation [32].
For measuring relative displacement, the current research focuses on the displacement of structural components, foundations and adjoining structures conducted by different sensors such as optical sensors and laser displacement sensors [33,34,35,36,37,38]. Hua et al. [39] were reviewed the recent applications of smart sensors such as piezoelectric sensors and fibre optic sensors for SHM of concrete structures using the interlayer slip. Li et al. [40] presented a literature review on damage assessment of structures using relative displacement measured from vision and image processing techniques. Such systems are costly and difficult to install in practice and they cannot be used for interlayer slip monitoring. The interlayer condition monitoring using the shear slip is more reliable because the relative displacement between the composite layers is a static parameter and less affected by noise. Besides, concerns are about their application as environmental conditions may limit them. Therefore, the factors that should be considered in the interlayer monitoring systems are the accuracy and bandwidth of sensors [41], the number of required measurements, environmental effects, cost and ease of set up in civil structures. The damage in the bolt connection of the composite beam is a local phenomenon and the global vibration is very insensitive to the local damage [42]. Besides, the frequency change is very small even though all bolts are loosened. Hence, the traditional vibration-based structural damage detection methods cannot be used to detect the damage in the bolt connection. The interlayer slip between the steel beam and the concrete slab is very sensitive to the local damage. To the authors’ best knowledge, there is no existing sensory system to continuously monitor the interlayer slip of composite structures. To address this issue, developing novel interlayer slip monitoring systems based on shear slip measurements is essential for the SCC beams interfacial condition assessment.
This paper presents a novel interlayer slip monitoring system for interfacial condition assessment of SCC beams. The Ultra-flat Industrial Potentiometer Membrane (UIPM) sensor is employed in the monitoring system. The sensor film is glued on a steel plate and mounted on the concrete slab, and the wiper is installed on the steel beam. The aim is to monitor the interlayer slip between the concrete slab and steel beam by the relative displacement between the sensor film and the wiper. To this end, experimental studies were conducted in the laboratory on a 6-m long composite bridge model. The concrete slab and the steel beams are bolt-connected in the model, and the bolts are removed to simulate the defects in the shear connection system. Seven slip sensors are evenly set up along half of the bridge model. The sensors are calibrated using the testing machine before they are installed on the bridge model, and a constant calibration coefficient was obtained. The inherent relative displacements from the undamaged bridge were obtained as a baseline for the interlayer monitoring. Then, two different damage scenarios are simulated by removing bolts, and the relative displacements are compared with those obtained from the undamaged beam. Different loadings are also applied on the bridge to simulate the operational conditions. Undamaged and damaged scenarios were considered within three main load increments, and data are collected and interpreted to find out how the slips change.
2. Interface Monitoring System
2.1. Slip Sensory System
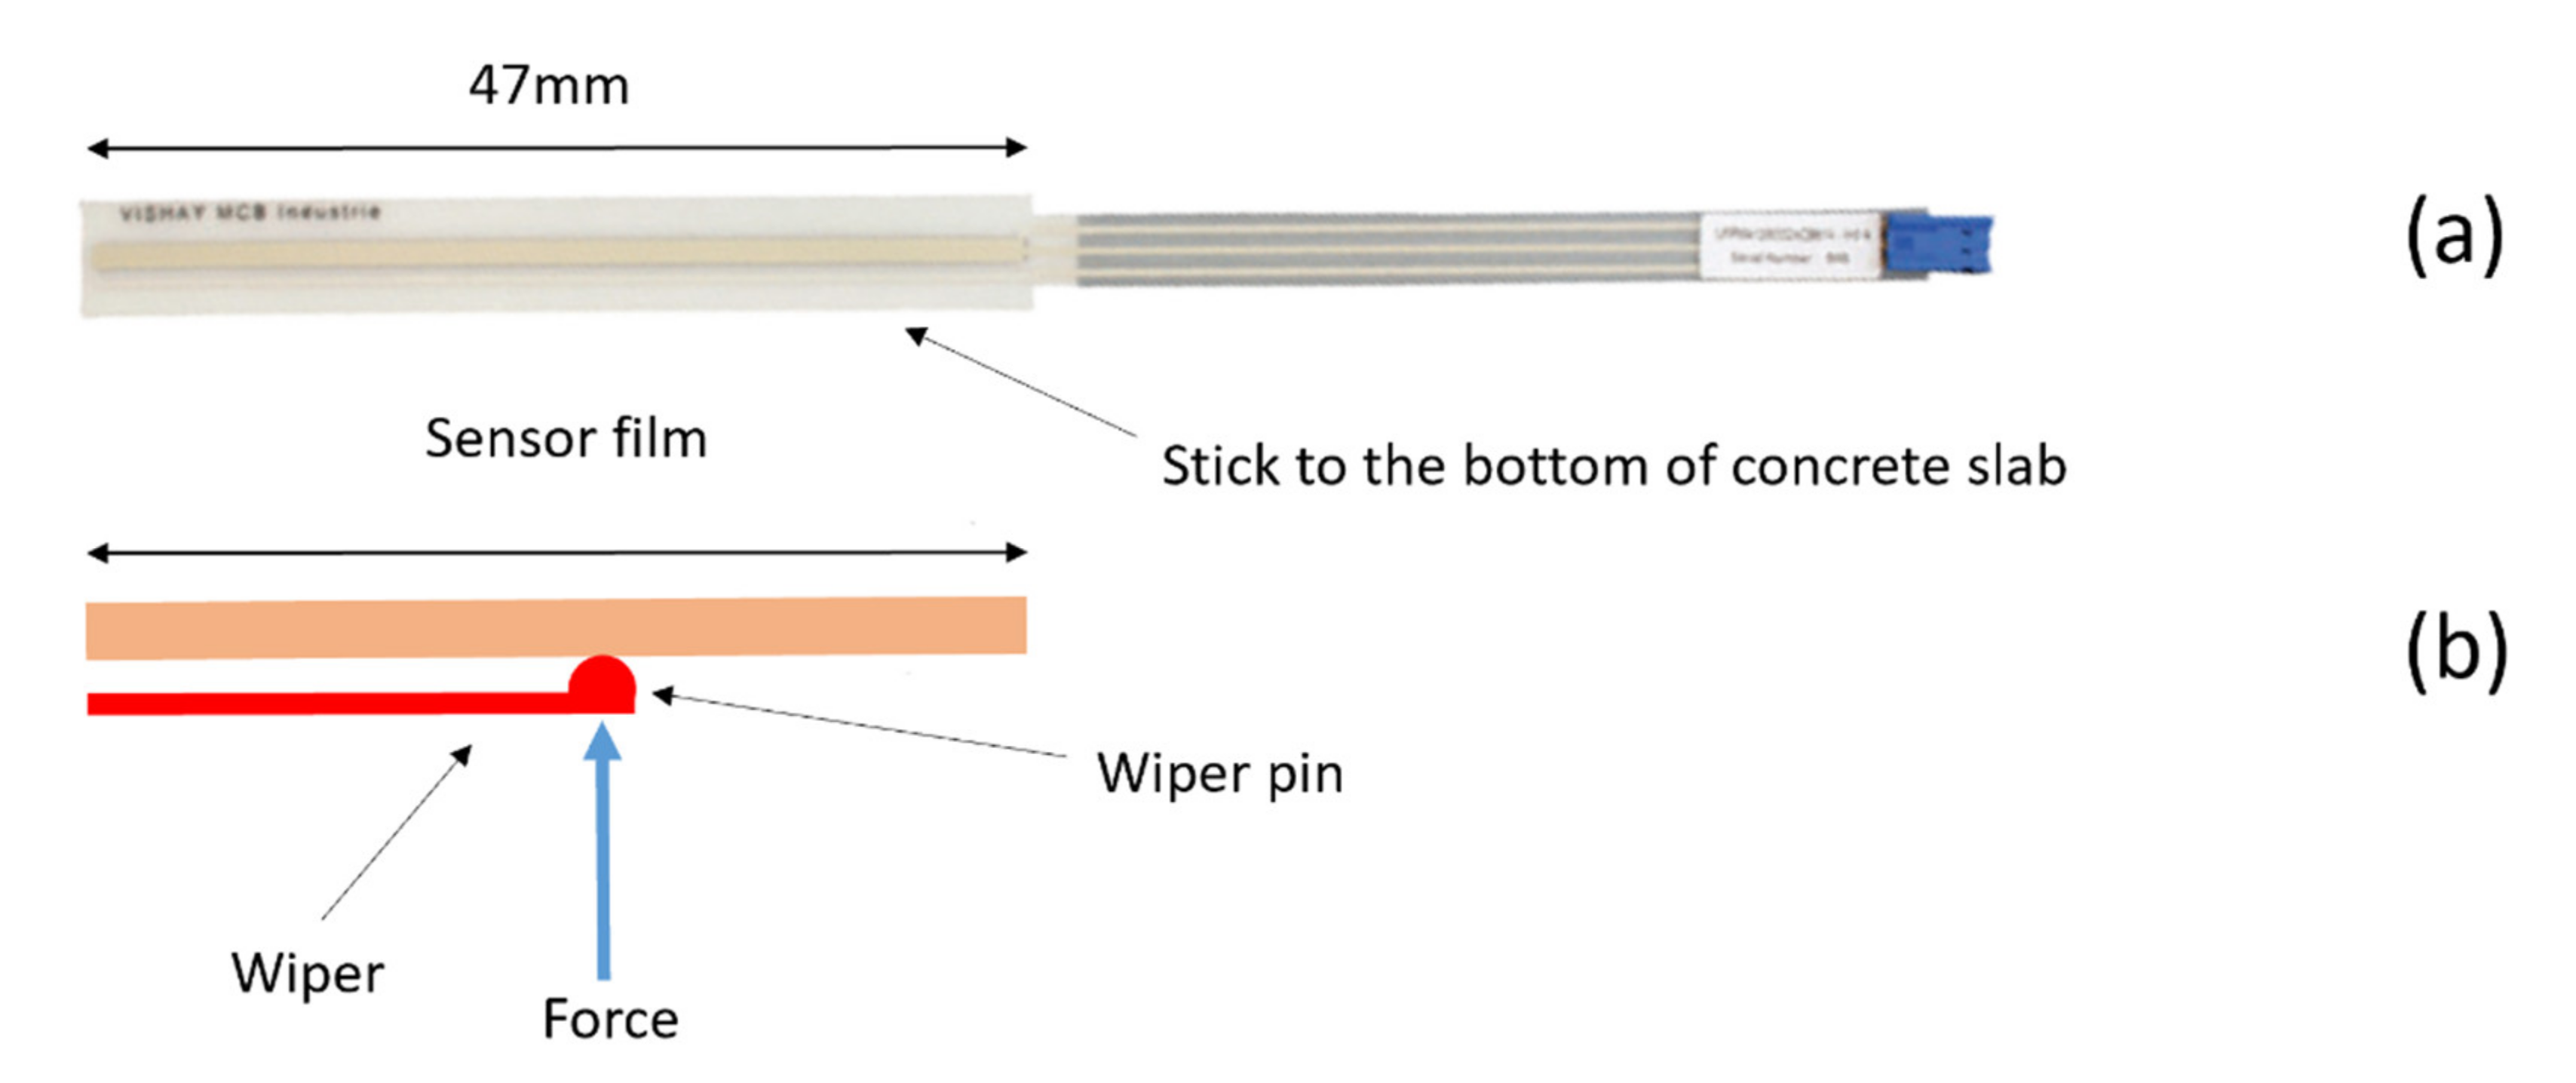
The slip sensory system mainly includes the sensor film and the wiper, as shown in Figure 1b. The sensor film shown in Figure 1a consists of resistive and collector tracks separated by a spacer. It has an adhesive zone to fix the master surface of the film to a layer of composite. On the other side of the master surface, there is a film track known as UIPM. A pin connected to the slave surface of another layer of composite by a manufactured steel wiper in Figure 2b is in touch with the film track surface. When the composite layers move due to external loading, the electrical output is realised by a connector. A UIPM aims to convert a mechanical position (angular or linear) into an electrical signal. The contact is achieved by the elastic deformation of the upper membrane, which comes into contact with the lower membrane. The contact between the film track and pin leads to the estimate of the wiper exact position in terms of the voltage value. The voltage varies depending on the position of the presser on the deformable membrane. The slip sensor is categorised as the linear type with infinite resolution, high integration capacity and durability. The sensor’s key benefits include being sealed, ultrathin (more compact than typical motion sensors, about 0.5 mm for the active area) and ease of assembly (adhesive layer). As shown in Figure 1a,b, the slip film length is 47 mm, and when the wiper pin moves along the film, the sensor records the relative displacements in a defined time interval.
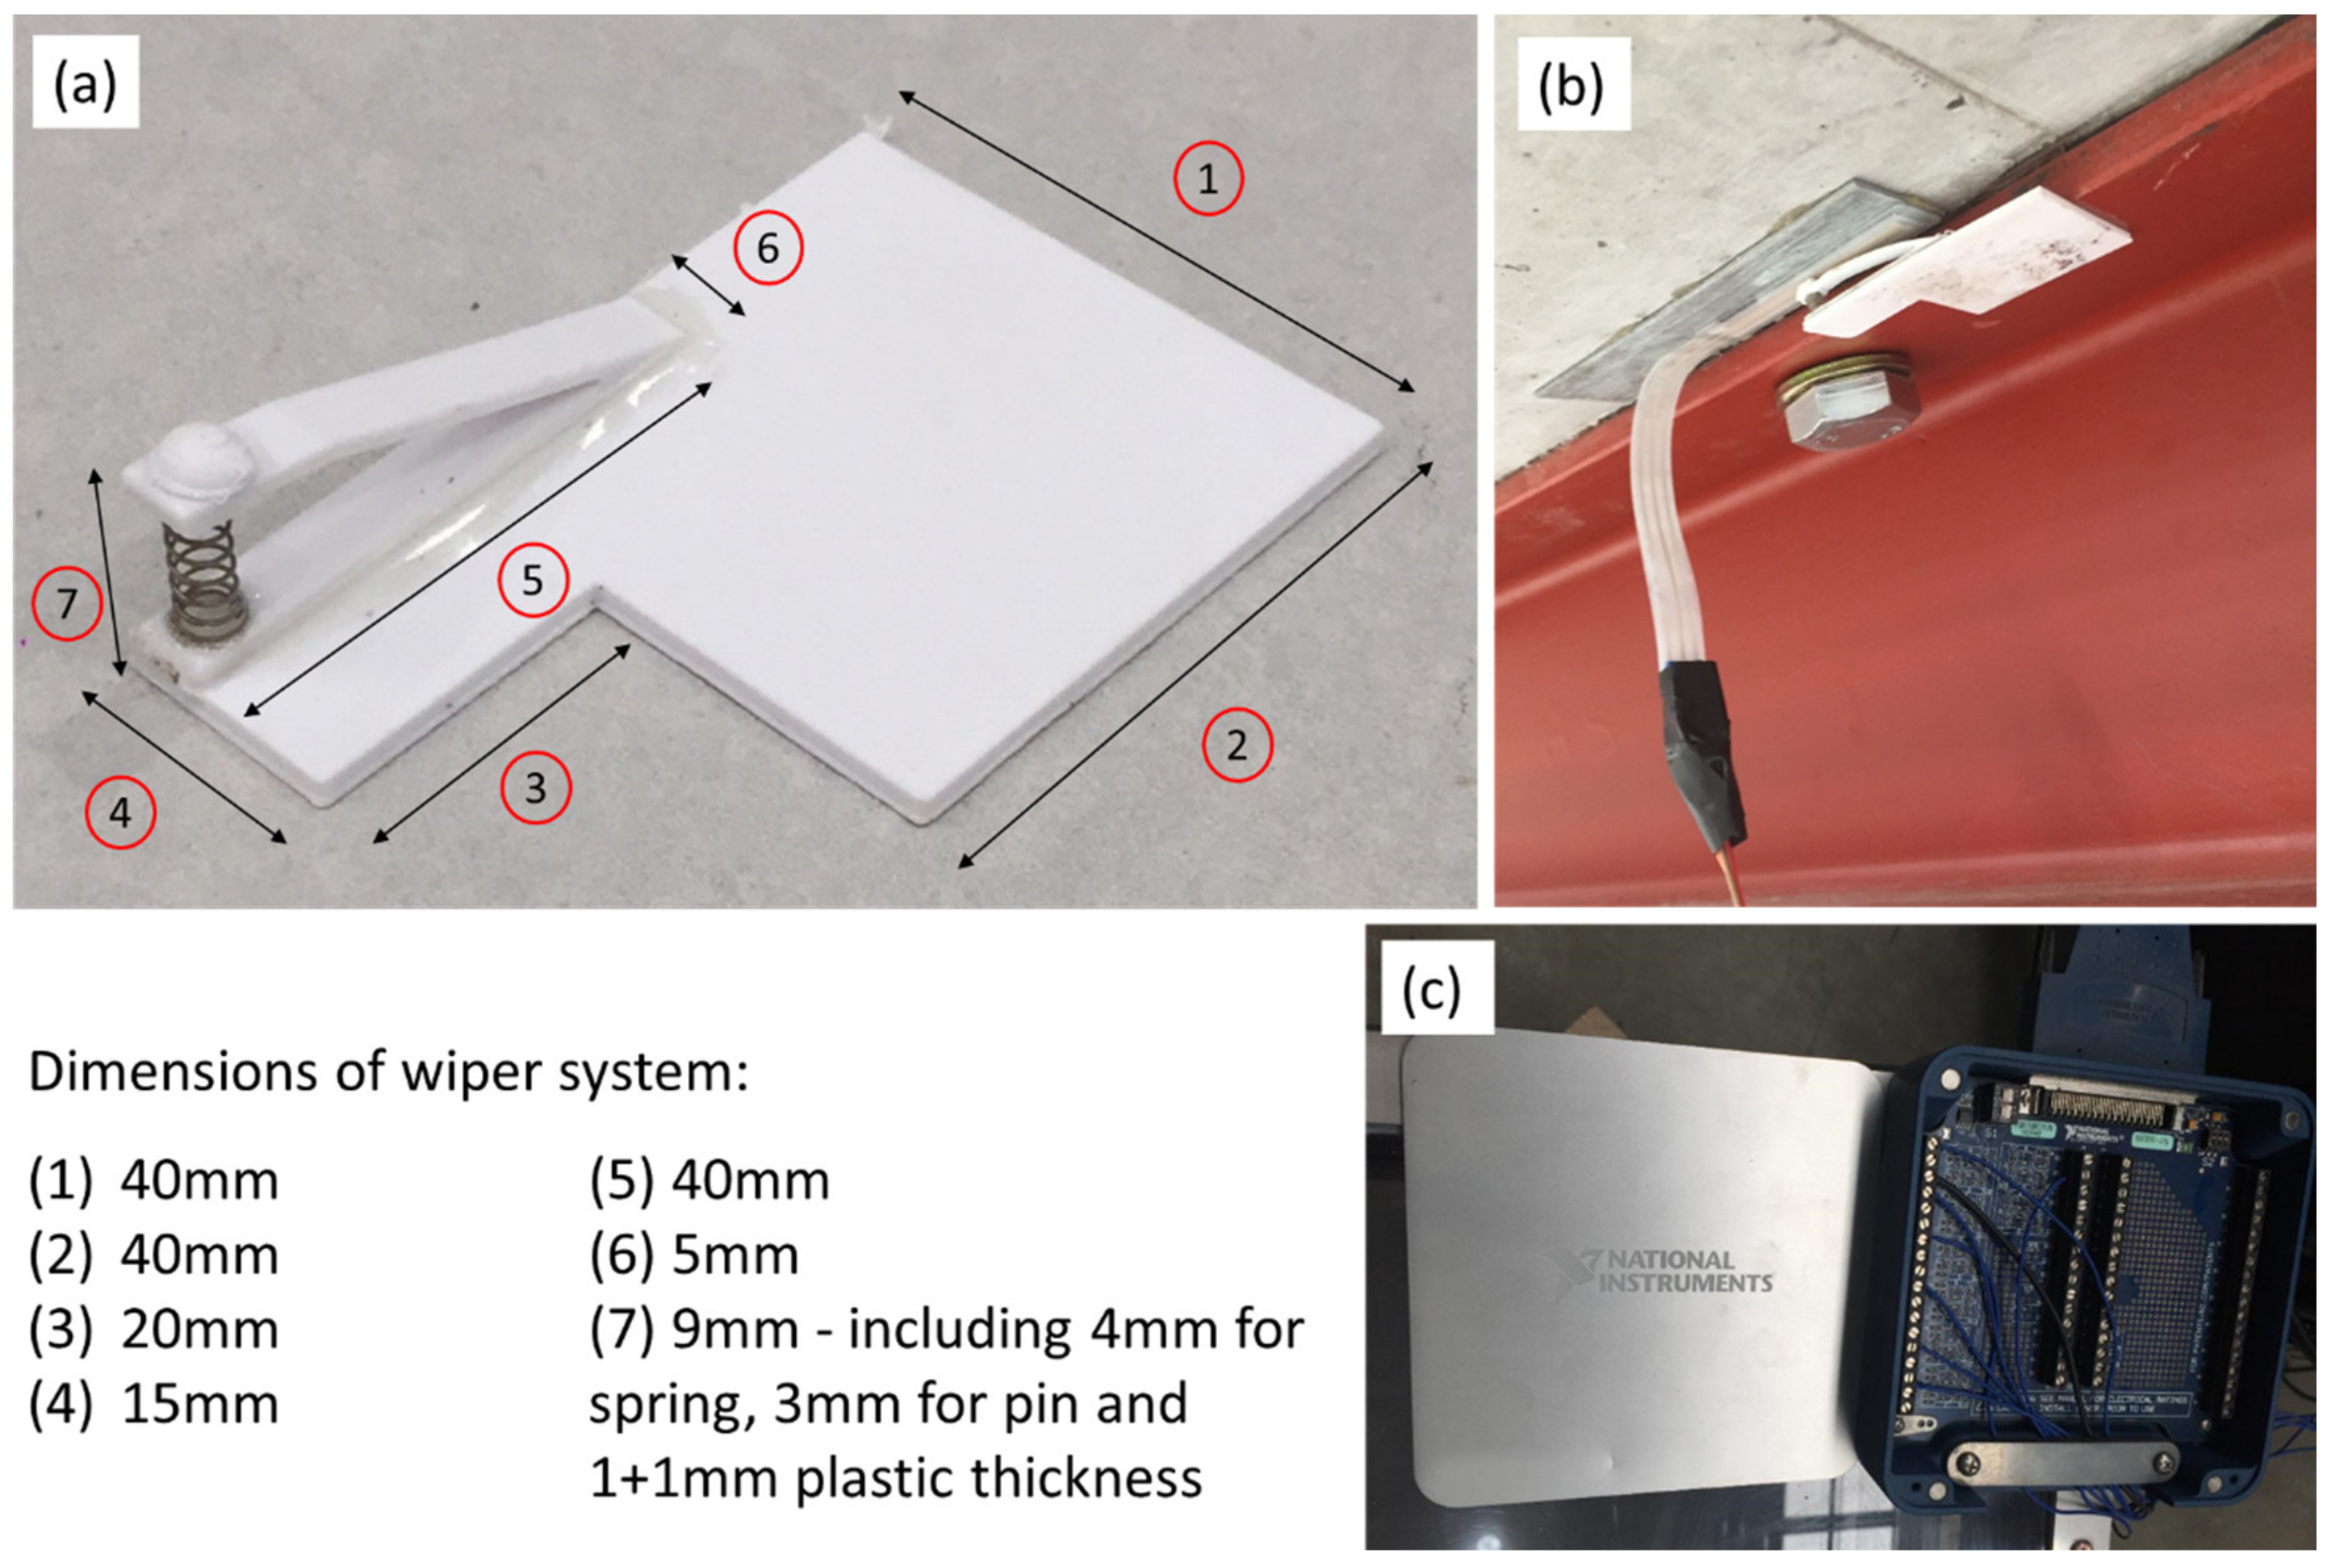
The wiper system has three separate 3D printed parts, including a plate, clipper and pin, which are glued together, as shown in Figure 2a. Although the spring height is 8 mm, it is compressed to 4 mm in the wiper to contact the sensor film properly. The spring is also glued to the wiper. The dimension of the plate could be changed based on the steel girder flange thickness. The slip film and the wiper are installed on the concrete slab and the supporting steel beam of the composite structure, respectively. The relative displacement between the slab and the steel beam can be monitored by the slip sensory system, as shown in Figure 2b. The sensors record using National Instruments PXIe data acquisition system with 16-bit resolution, and the time-domain data are collected (Figure 2c).
2.2. Sensor Calibration
In this section, the calibration of the slip sensor is presented. The calibration aims to determine the sensitivity of the slip sensor and its properties. Through the calibration, sensitivity coefficient can be calculated based on linear regression as follow
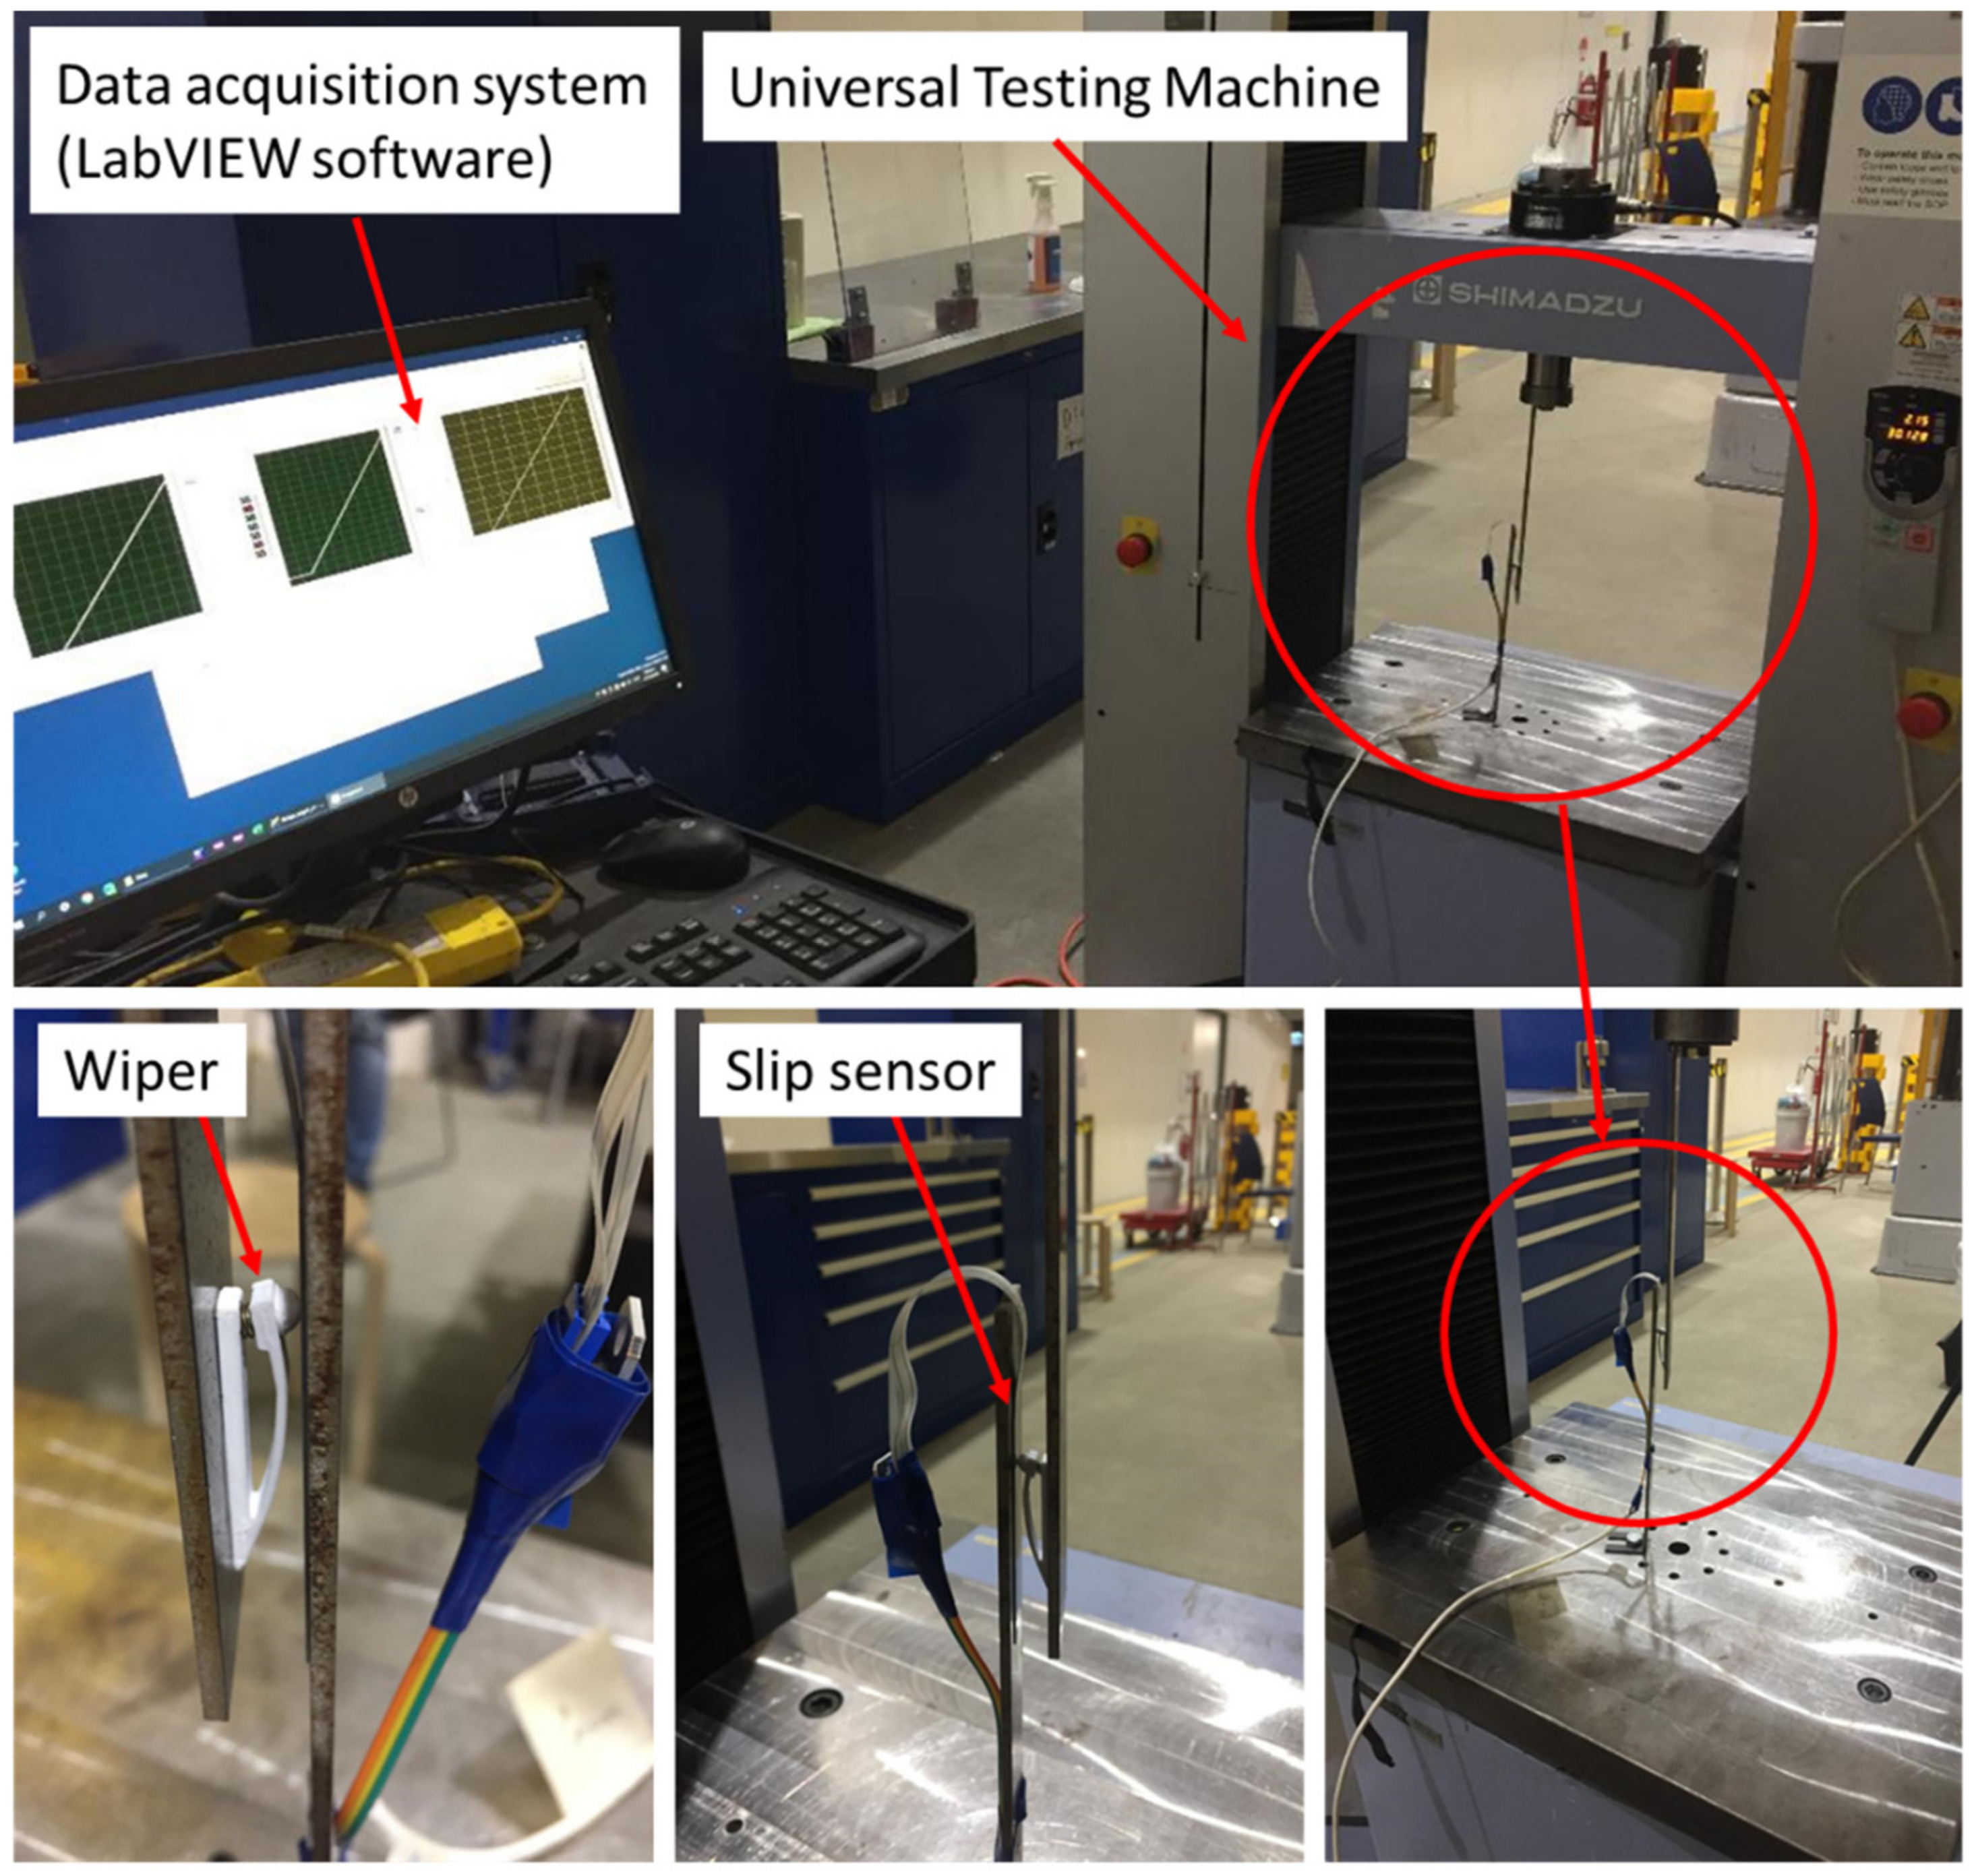
where , is the output of slip sensor (in voltage), is the calibration coefficient which is the slop of straight fitting line of the calibration data curve, is the error from the straight line and is the relative displacement (in mm) for calibration. The calibration test has been repeated four times for each sensor to check the repeatability. For each test, the time duration is set as 2 min, and the displacement by the universal testing machine (UTM) was from 0 mm to 50 mm. Figure 3 shows the calibration system set up on the UTM. Two L-shaped steel plates have been fabricated, and installed on the top and bottom parts of the UTM. The sensor film is placed on the bottom plate, and the 3D-printed wiper mounted on the top part is used as the contact point moving along the sensor film. The pin of the wiper is moving freely in the vertical direction. The relative displacements from the UTM are recorded, and the measured data from slip sensor are collected using the data acquisition system [43].
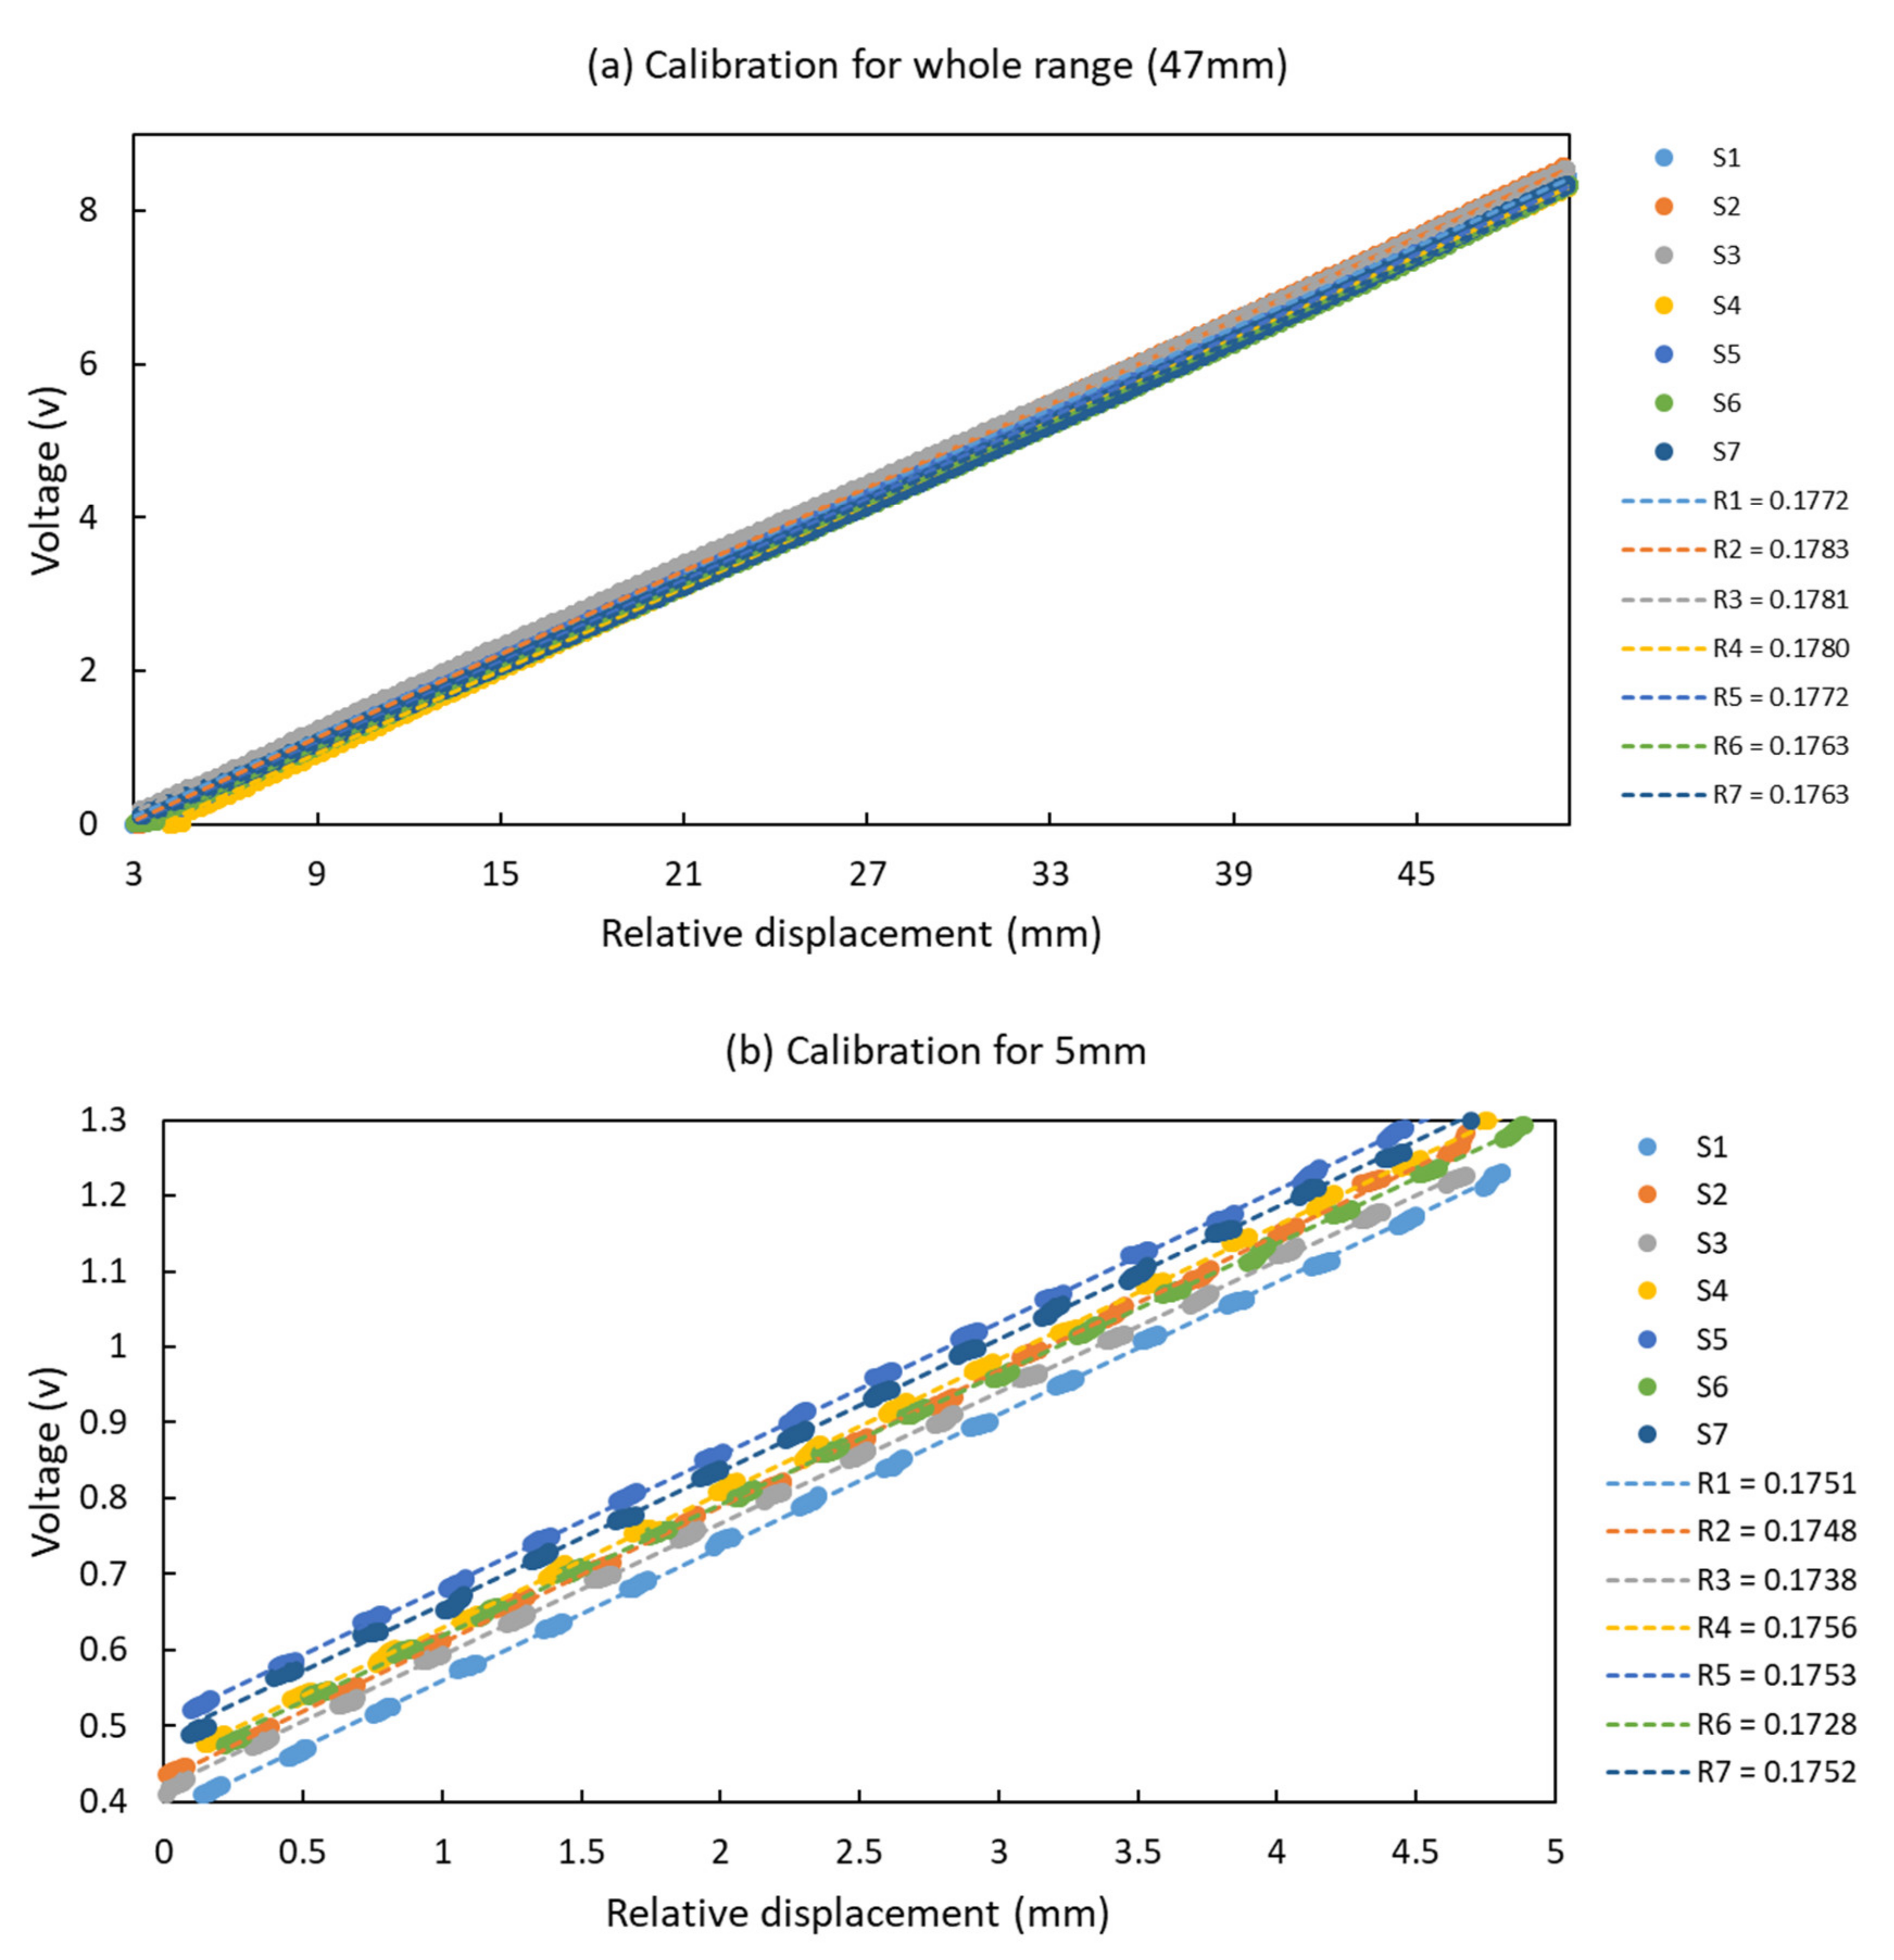
Figure 4 shows the calibration results of seven sensors in terms of relative displacement and voltage. The relative displacement is the input data from the UTM, and the output from the slip sensor is recorded by the data acquisition system with the voltage range ±10 V. The calculated calibration coefficients for each sensor are the slope of the trendline of measured data. The calibration coefficients are later used for the interlayer condition monitoring of the SCC beam using these slip sensors. Figure 4a,b show the calibration results of seven sensors with the range of 47 mm and 5 mm, respectively. To disregard abnormal measurements at the starting and ending point of each test, all sensors are collaborated within the range from 3 to 50 mm. Figure 4a shows the relative displacements in terms of voltage for the sensor film length 47 mm, starting from 3 to 50 mm. The results demonstrate that the sensors are very sensitive to the slip and the maximum differences of calibration coefficients among seven sensors for 5 mm and 47 mm are 1.9% and 1.6%, respectively.
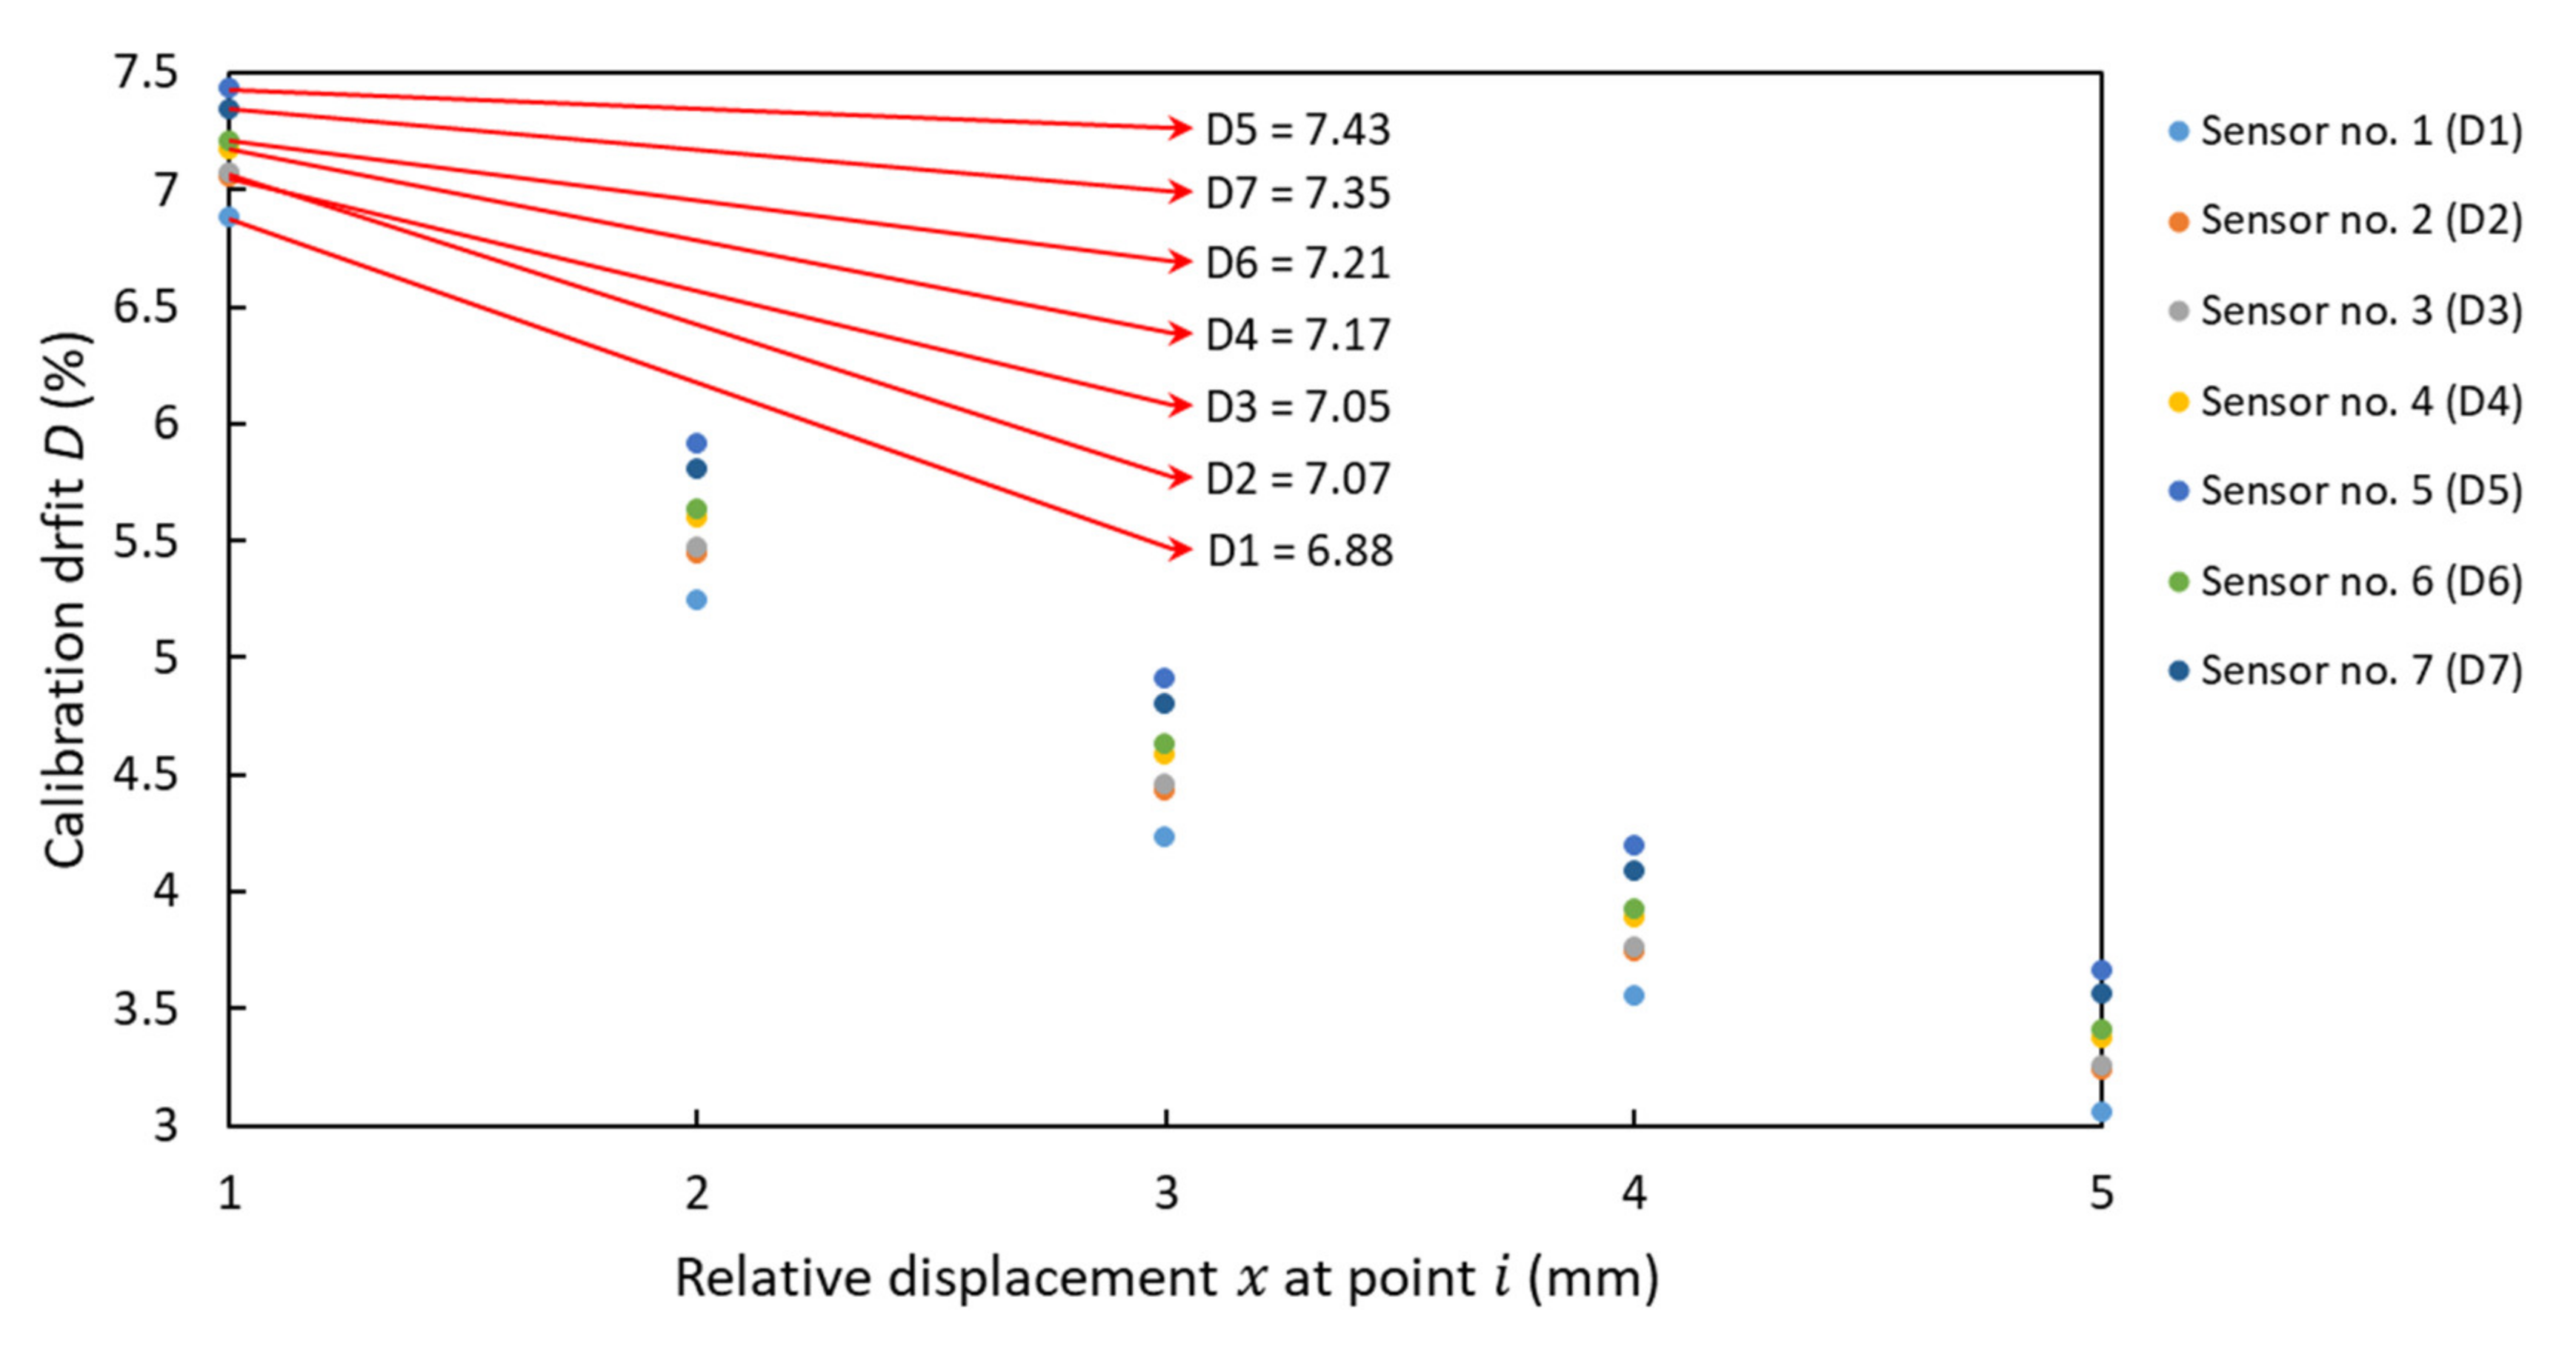
Moreover, the drift in calibrations for each sensor is calculated for all sensors. The relative displacements and the output of sensor at point ( is the number of measured data) are used to calculate the error as follows:
where is the drift in the calibrations of the ith sensor.
Figure 5 shows the calculated drifts in the calibration of each sensor at five points of the relative displacement. The maximum drift is shown in the graph. These drifts could be adjusted by removing the initial values. The calibration results show that the UIPM displacement sensors can be used in practice with a constant calibration coefficient of . The accuracy (linearity) of the sensor is ±2% according to the manufacture datasheet for the UIPM. In this study, the measurement range is set as ±10 V and the resolution of the sensory system will be about . The resolution could be increased when the measurement range reduces.
3. Experimental Setup
3.1. The Bridge Model
The usability and sensitivity of slip sensor in the interlayer condition assessment of SCC beams were investigated on a full-scale bridge model consisting of SCC beams with removable shear connectors. The composite bridge model was designed according to Australian standards [44,45] and consists of three independent spans; a 2 m cantilever beam on the left-hand side, a 6 m span in the middle (main span) and a 2 m span on the right-hand side. The overall length of the bridge is 10 m with two parallel steel girders and the reinforced concrete slab on the top of steel girders for each span. In this study, the 6 m main span is used. Grade 40 concrete was used and the concrete slab is connected to the steel girders by shear connectors marked as SC32. Elastic Modules and densities of the concrete and steel are , , , , respectively.
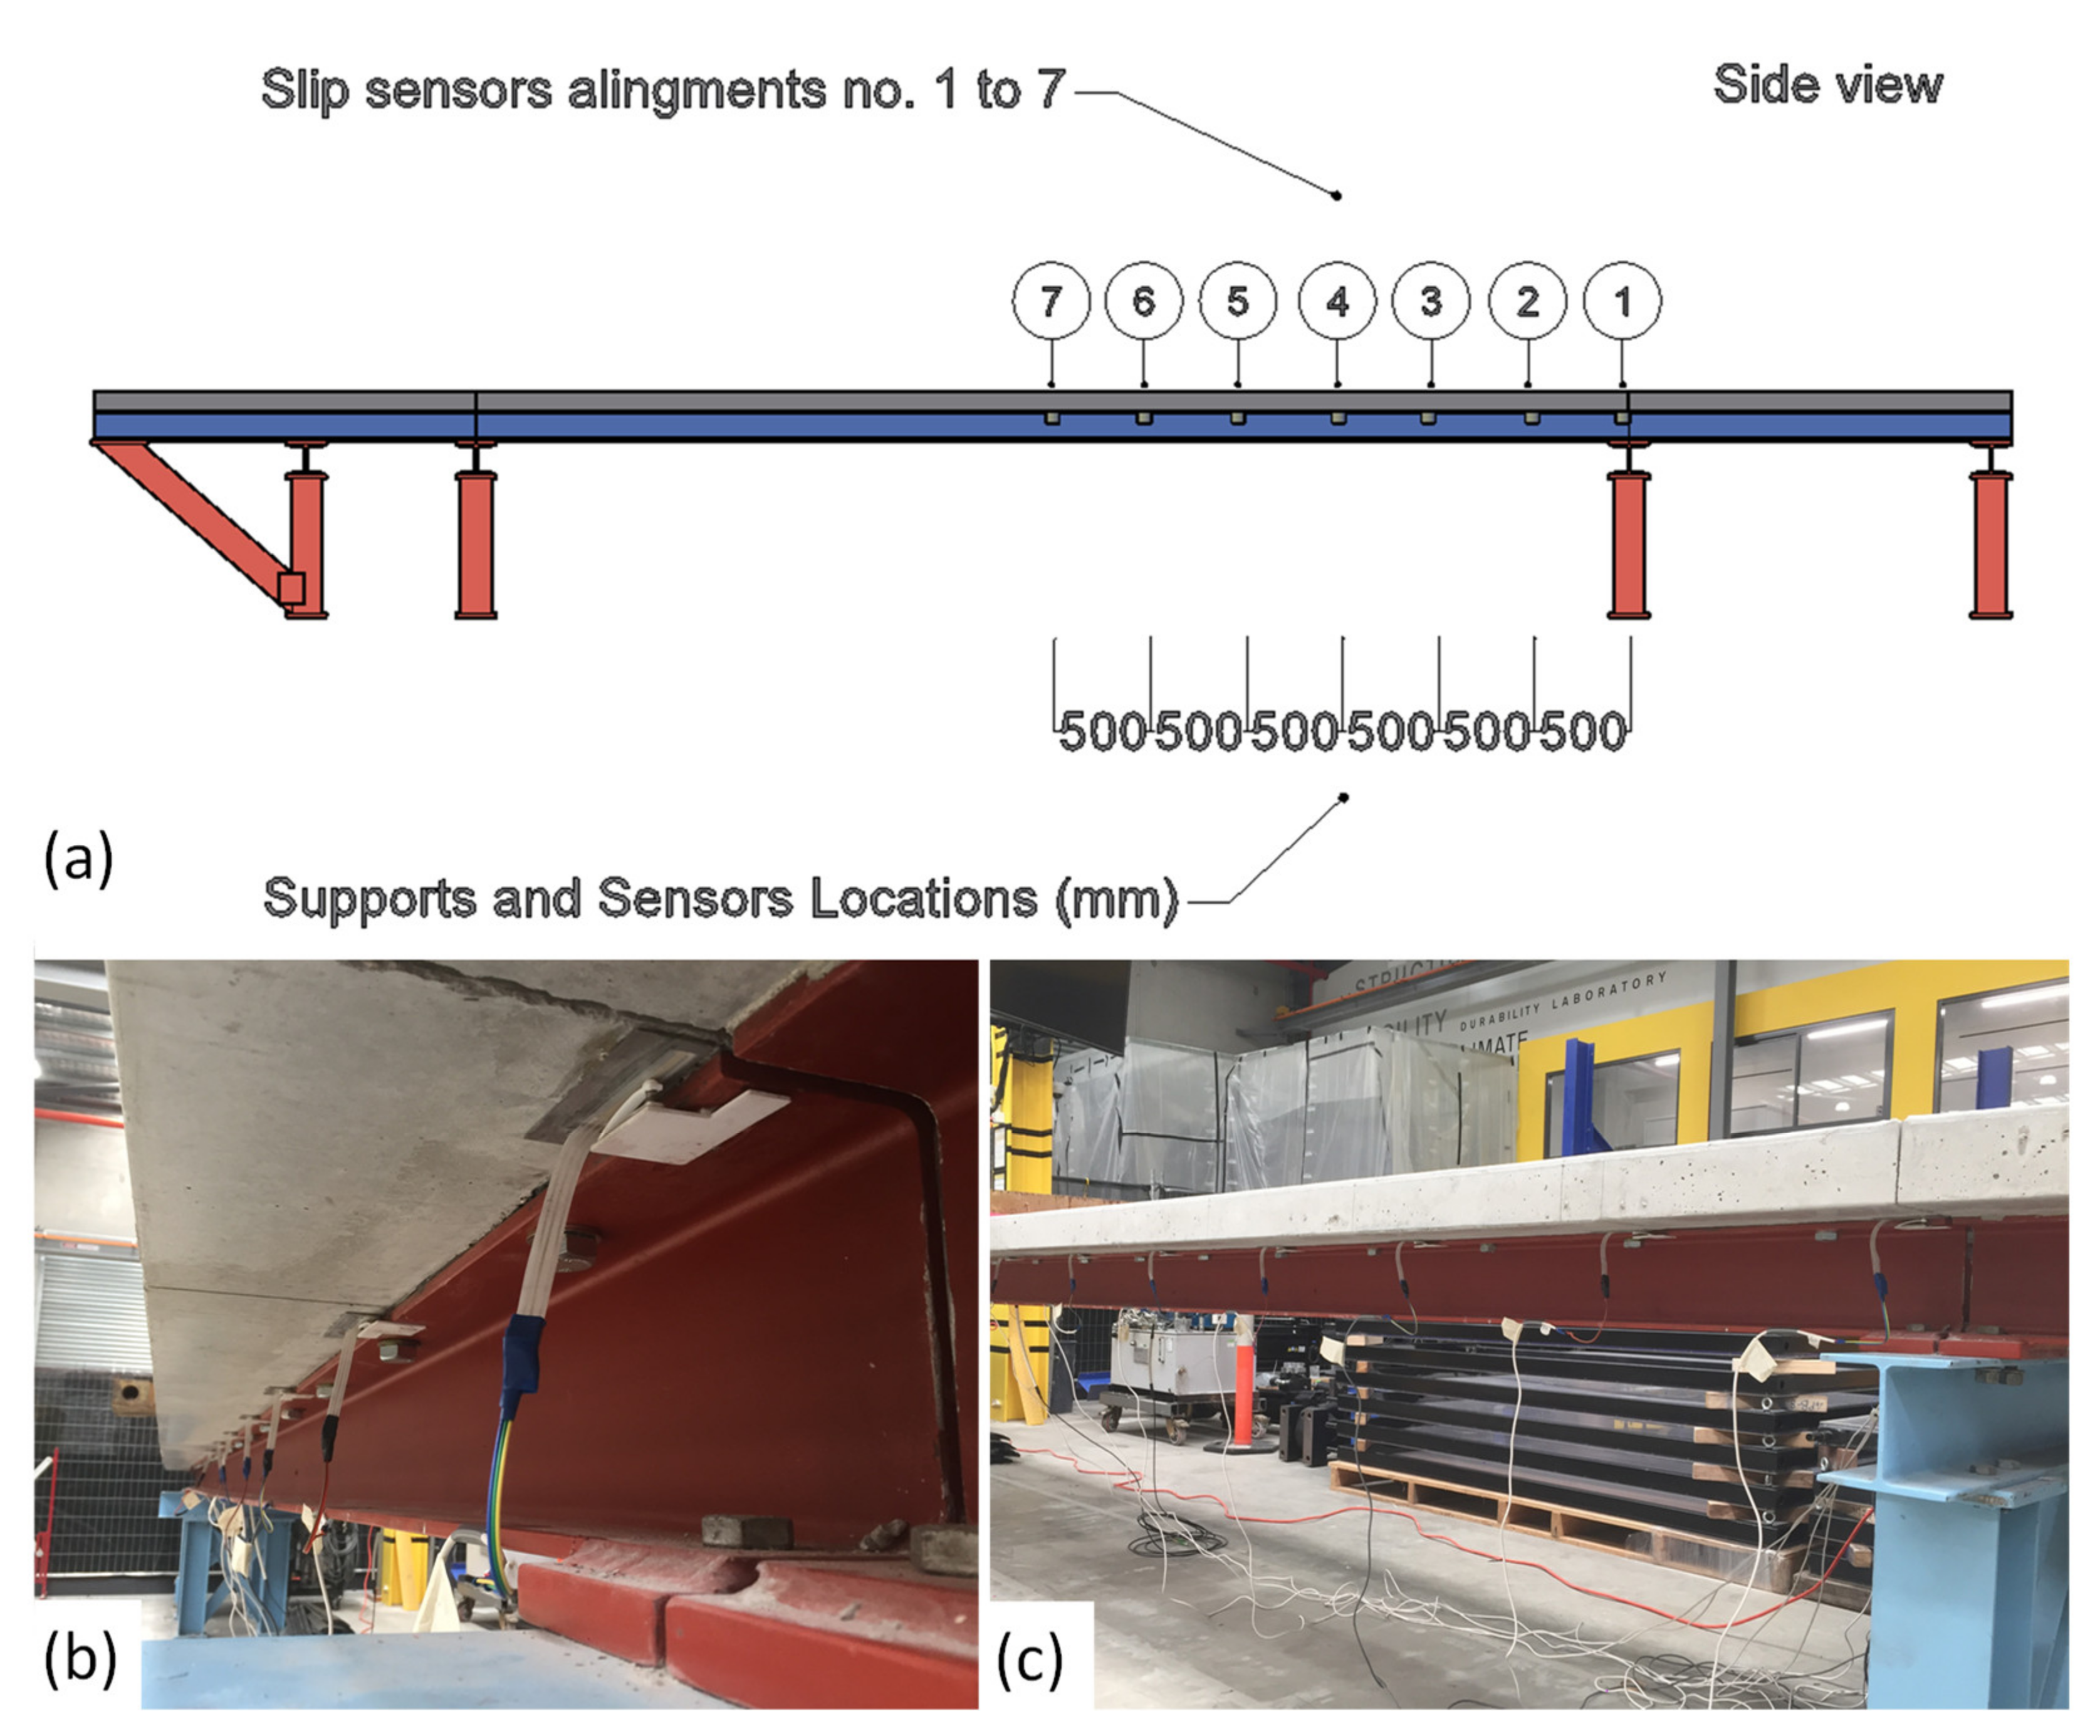
The experimental studies have been carried out on the main span as the removable shear connectors are available only in the main span. Due to the availability of slip sensors, seven calibrated slip sensors are installed equally along the half of one girder. Although the maximum relative displacements between the composite layers are expected to occur at the ends of the span (at supports), sensors were set up along half of a beam to accurately evaluate how relative displacements change when damage occurs in different locations. The design of shear connectors makes it possible to simulate the damage failure and re-do the undamaged bond. On each side of a steel girder, 13 bolts are screwed into covers embedded in the concrete slab. If all bolts are engaged in the nuts and then tightened, the structure condition corresponds to the undamaged state. The damage of shear connectors is introduced into the structure by unscrewing specific bolts to simulate the failure of shear links. Figure 6 shows the details of composite bridge during construction, after construction, and dimensions. The rows of bolts are labelled with numbers 1 to 13 from the support to the mid-span (right to left-hand-side), and each row has two volts on one girder. Figure 6a is the main span drawing and dimensions in plan-view. As shown in Figure 6b, the main span has a discontinuous slab at both ends. The covers for bolts and steel bar alignments embedded in the main concrete slab are also shown in Figure 6c,d.
3.2. Interface Monitoring System
Structural damage detection of the SCC bridge model was established by monitoring its shear connections and interlayer slip under loading. The seven slip sensors attached to the half of a steel girder are connected to 7 channels (in one Module) in National Instrument data acquisition system, and the time-domain data are collected using LabVIEW data collection software. Figure 7 shows the alignments of slip sensors on the SCC bridge.
3.3. Experimental Procedure
To investigate the sensitivity of slip sensors to inherent interlayer slip and possible damage in composite, three main levels of load increments, including 375, 750 and 1100 kg, are considered as three loading scenarios such as small, medium and large loading weights. At the first stage, the composite bridge without damage is considered for testing to study the inherent interlayer slip under different loadings. In practice, damage on shear connection can be due to either the loosening or failure of bolts. The former will result in a small or partial damage on a bolt. However, the latter is considered in this study by removing the bolts to simulate complete damage at any location. The damage at one single location is then introduced by removing the second row of bolts from both sides of the steel girder top flange, and the changes of the interlayer slips due to loads are monitored. In the last stage, the damage at two locations is simulated by removing the second and fifth rows of bolts from both sides of the steel girder top flange. The bridge is subjected to the same loads to study the trend of interlayer slips when the severe damage occurs at the interface. The time-domain data obtained from the slip-sensors were collected through 7 channels in the National Instrument data acquisition system using LabVIEW software.
4. Experimental Results and Discussion
4.1. Inherent Interlayer Slip
The performance of the slip sensors for inherent interlayer slip is studied when there is no damage on the shear connectors. To this end, all shear connectors are tied with standard torque for 30 mm bolts, and then loads are applied on the mid-span of the bridge in three main increments. The considered loads are much less than the load-bearing capacity of the bridge. The reason for doing this is to explore the sensitivity of the slip sensor to tiny slides of composite layers, which can be due to damage in a shear connector. Traditional methods may not be able to measure this small slip. Besides, extreme loads are not practical in SHM tests as they may lead to large damage or failure in the structure.
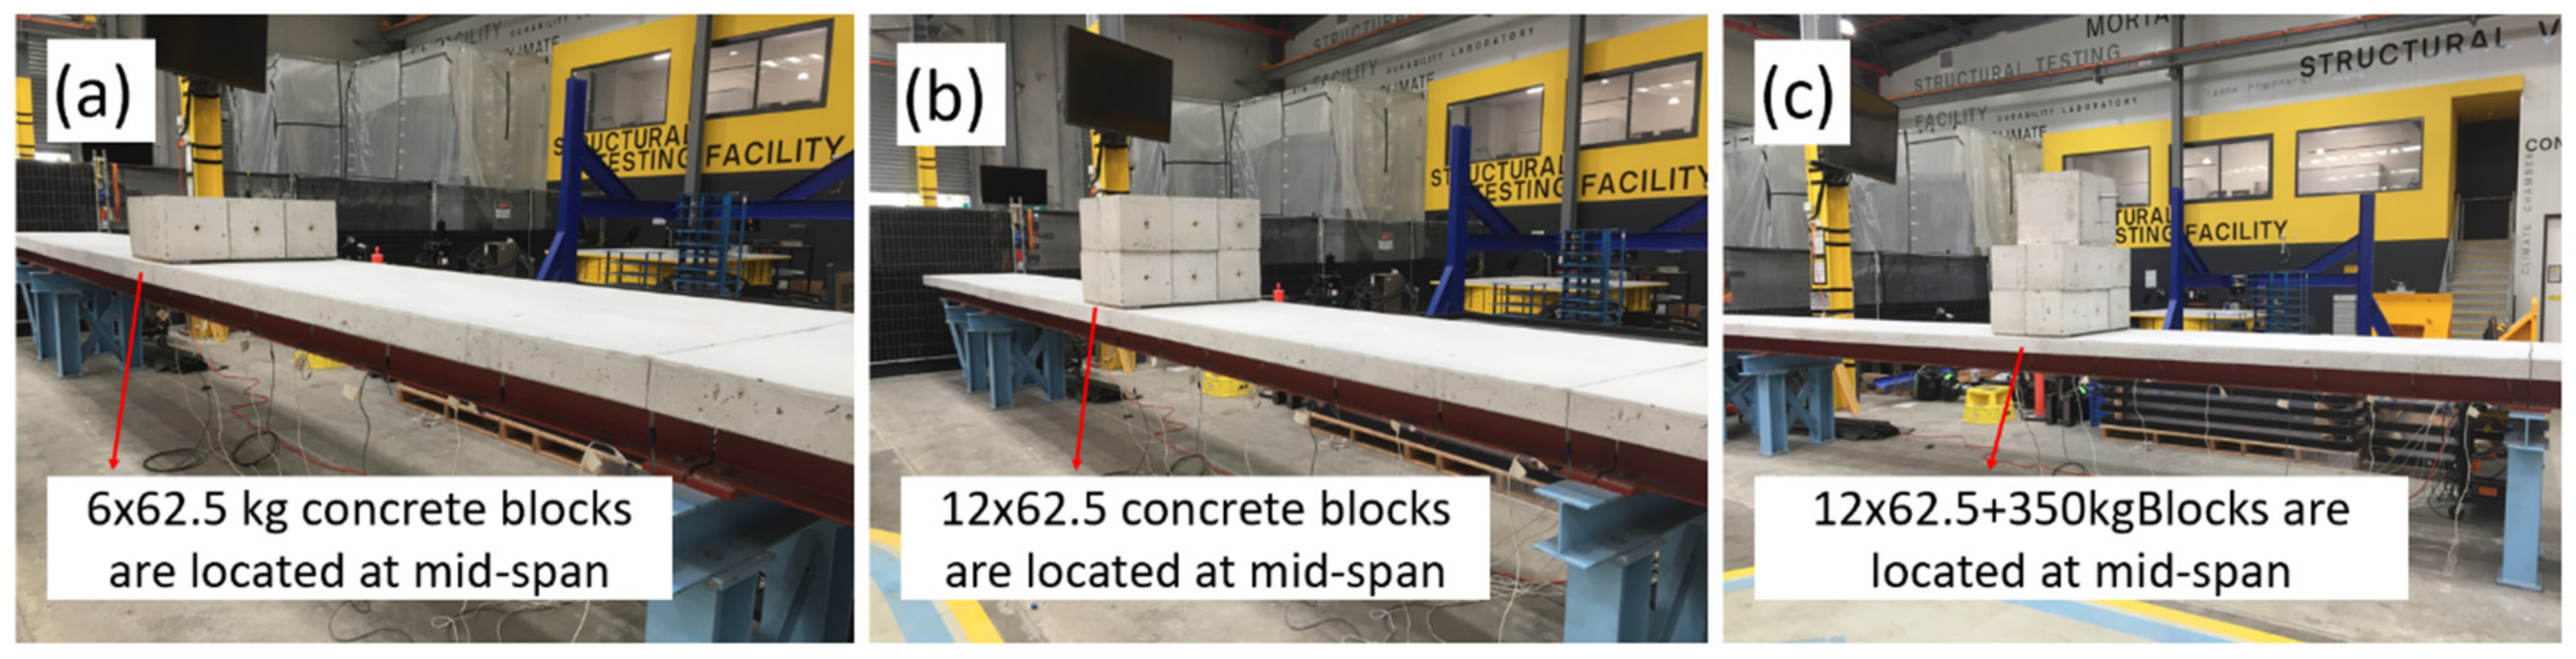
Figure 8 shows the bridge subjected to loads by concrete blocks placed on the middle of main span. The first load was applied by putting six concrete blocks (Dimension and weight of each concrete block are 30 × 30 × 30 cm and 62.5 kg, respectively) on the bridge deck with an overall weight of 375 kg as shown in Figure 8a. Figure 8b shows the second load increment where six more similar concrete blocks were added to increase the overall load to 750 kg. Figure 8c shows the last increment in which a 350 kg concrete block (55 × 55 × 55 cm) was added to attain the large load. A reasonable overall time of loading is spent to let the interlayer slip occur sufficiently. In fact, seven load increments were carried out in the laboratory. In the first three increments, a couple of 62.5 kg concrete blocks (125 kg load in each increment) were put on the bridge in three stages starting from an edge of mid-span to another edge, and for this reason it is considered as the first main increment. The second main increment was similar to the first and achieved by adding couple of concrete blocks in three stages. In this way, load applied equally in the mid-span width and consequently, torsion effect due to loading in a side of mid-span was avoided. In the last main increment, the 350 kg concrete block was placed in the centre of the mid-span. Subsequently, three main increments are incorporated into the data analysis.
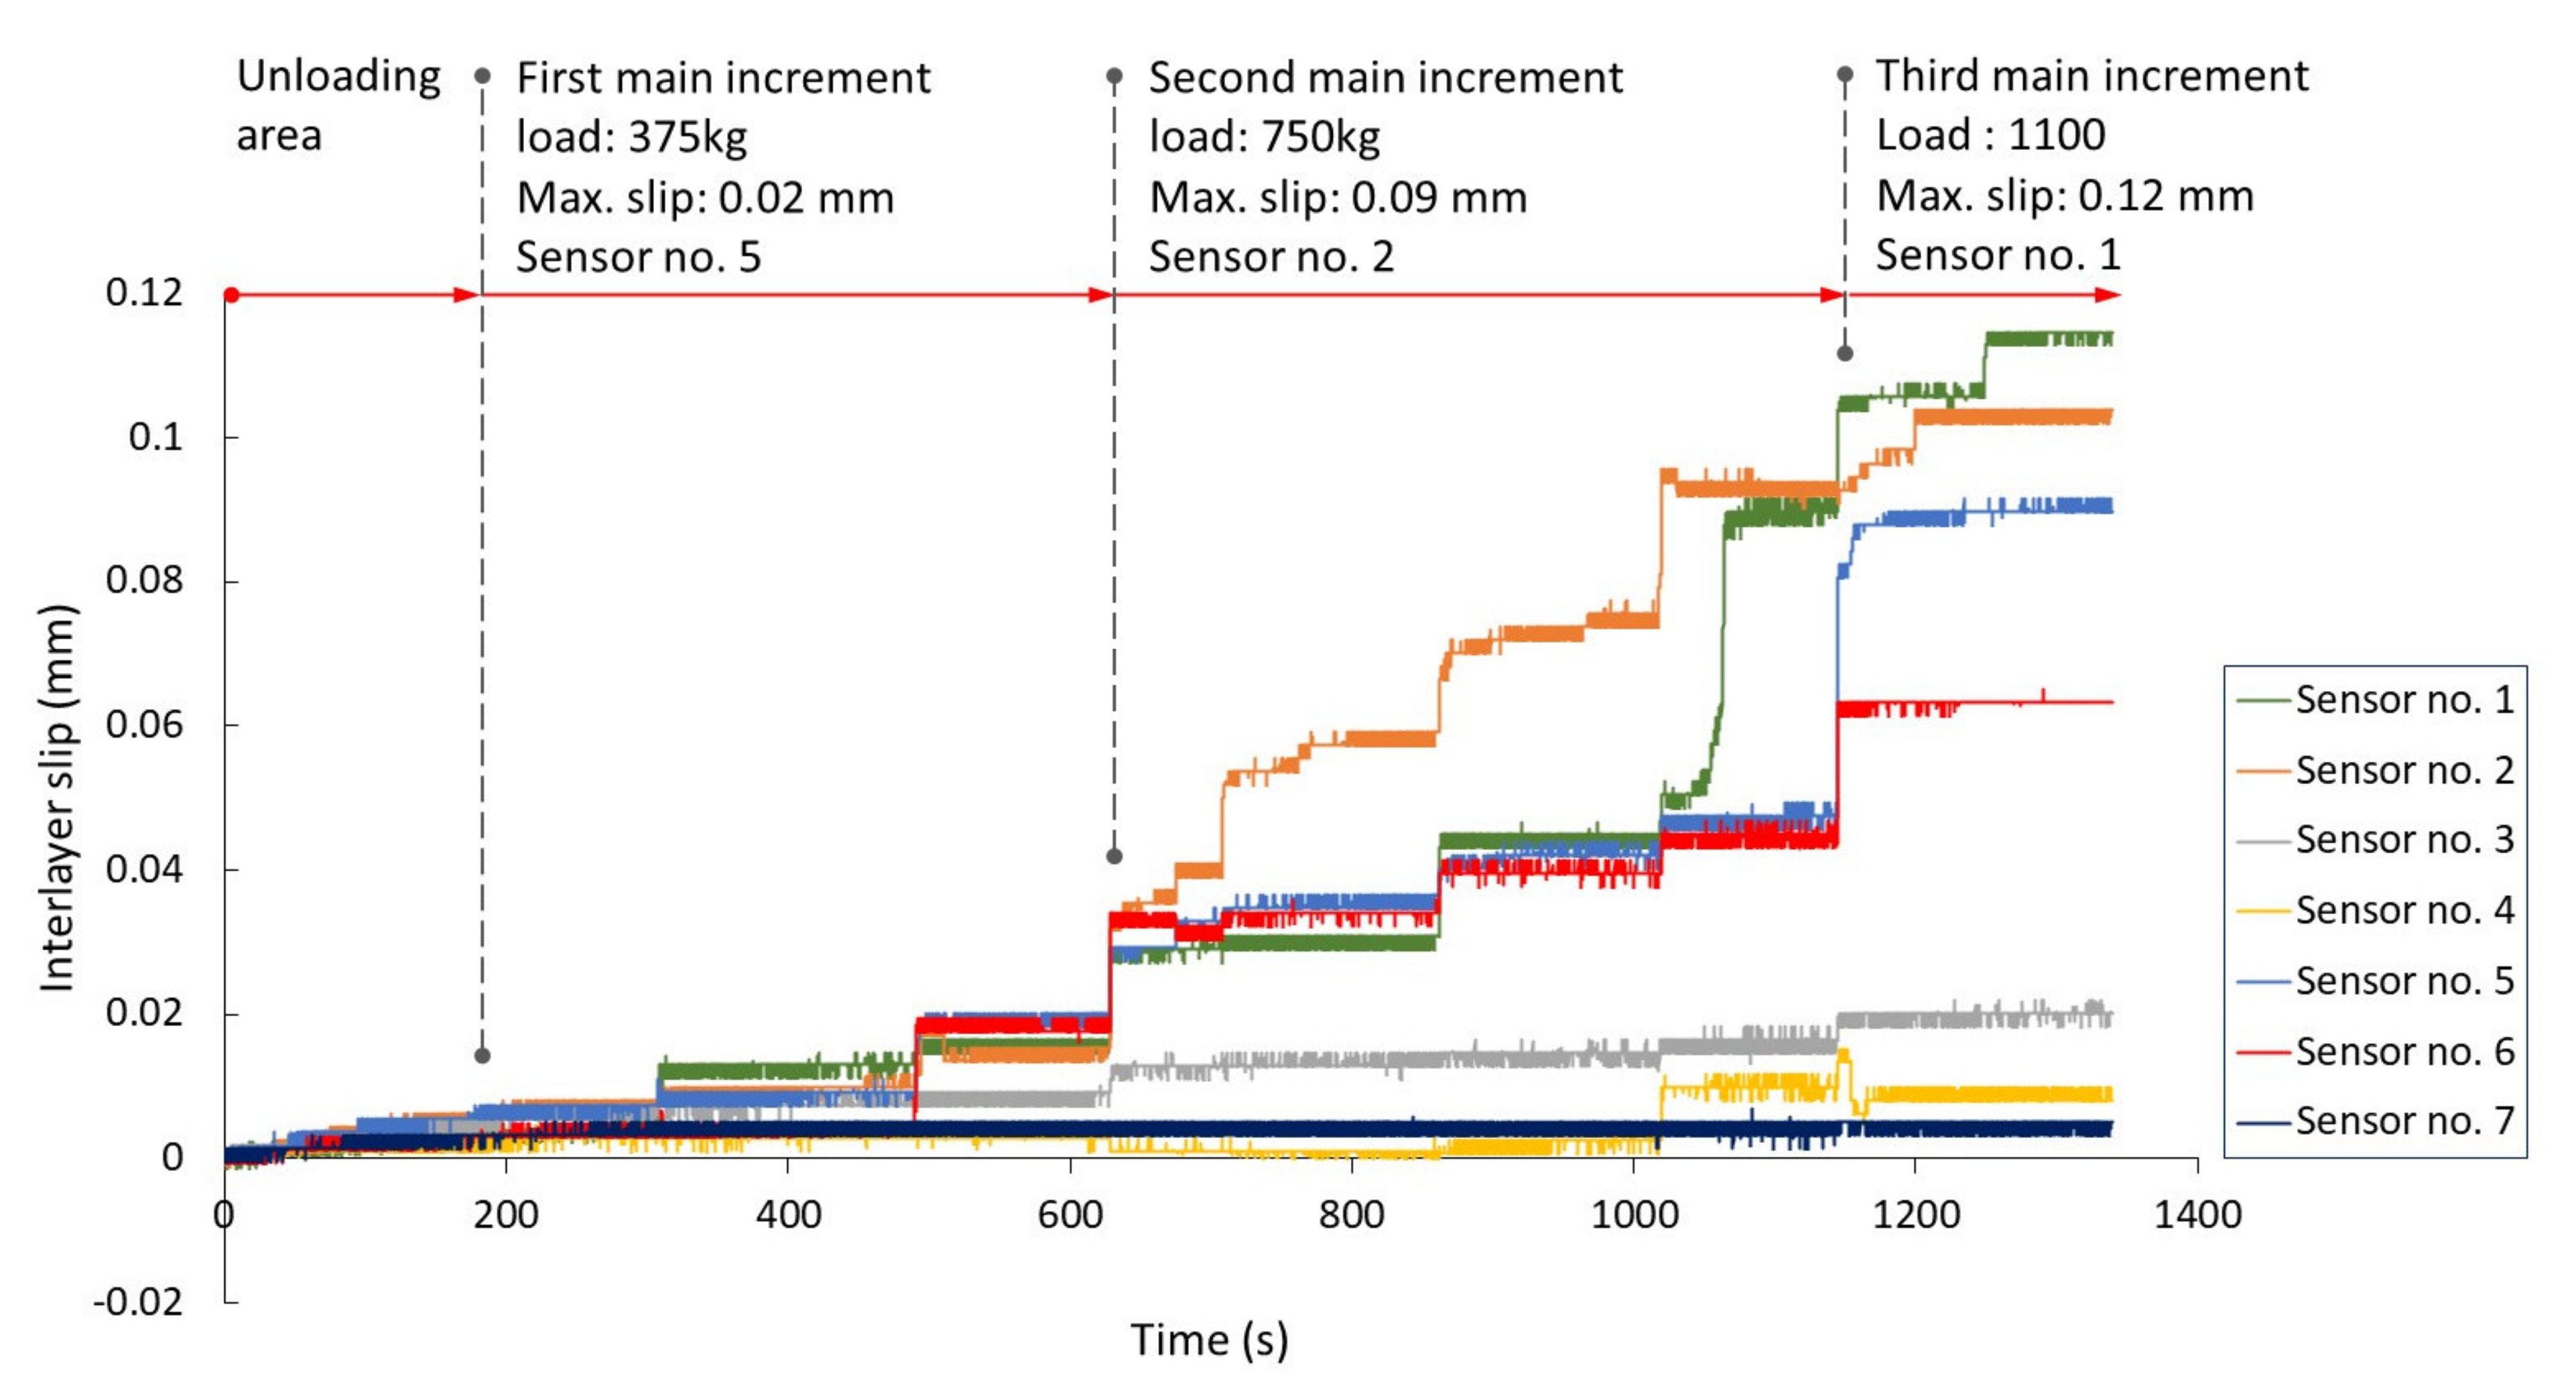
Figure 9 shows the interlayer slip (relative displacement between the layers) of the composite beam under loading collected from seven sensors. The sensors are labelled 1 to 7 from the support to the mid-span (right to left-hand-side). In the unloading area, a minimal movement of the composite layers is recorded, which could be due to the self-weight of the structure. There are three remarkable elevations in the first two main increments, which are caused by the three load increments of each main increment. After each elevation, the straight lines show the times spent to allow the bridge to become stable for the next loading.
In the first main increment, the maximum slip of 0.02 mm is recorded by Sensor 5, where it is closed to the loading area. In the second increment, Sensor 2 recorded the maximum slip of 0.09 mm while Sensor 1 (nearest to support) and Sensor 5 (close to loading) also recorded almost similar values. In the last increment, the maximum slip of 0.12 mm was recorded by Sensor 1 as expected. These results show that on the mid-span where the load was also applied, there is no slip recorded by Sensor 7. In the undamaged state, the interlayer slips are expected to start from zero at the mid-span and then reach maximum value at the supports. At the first load increments, this expectation was not achieved as the quantity of load is small. However, the sensors near the support recorded the maximum interlayer slip by increasing the load. The graph shows that the trend for Sensor 1 remains smooth until the end of the second increment. After that, however, a noticeable increase occurs by the load increment, demonstrating that when the mid-span deflection increases, the slip will also rise with the maximum values in the boundary condition.
4.2. Scenario 1: Damage at One Location by Removing One Row of Bolts
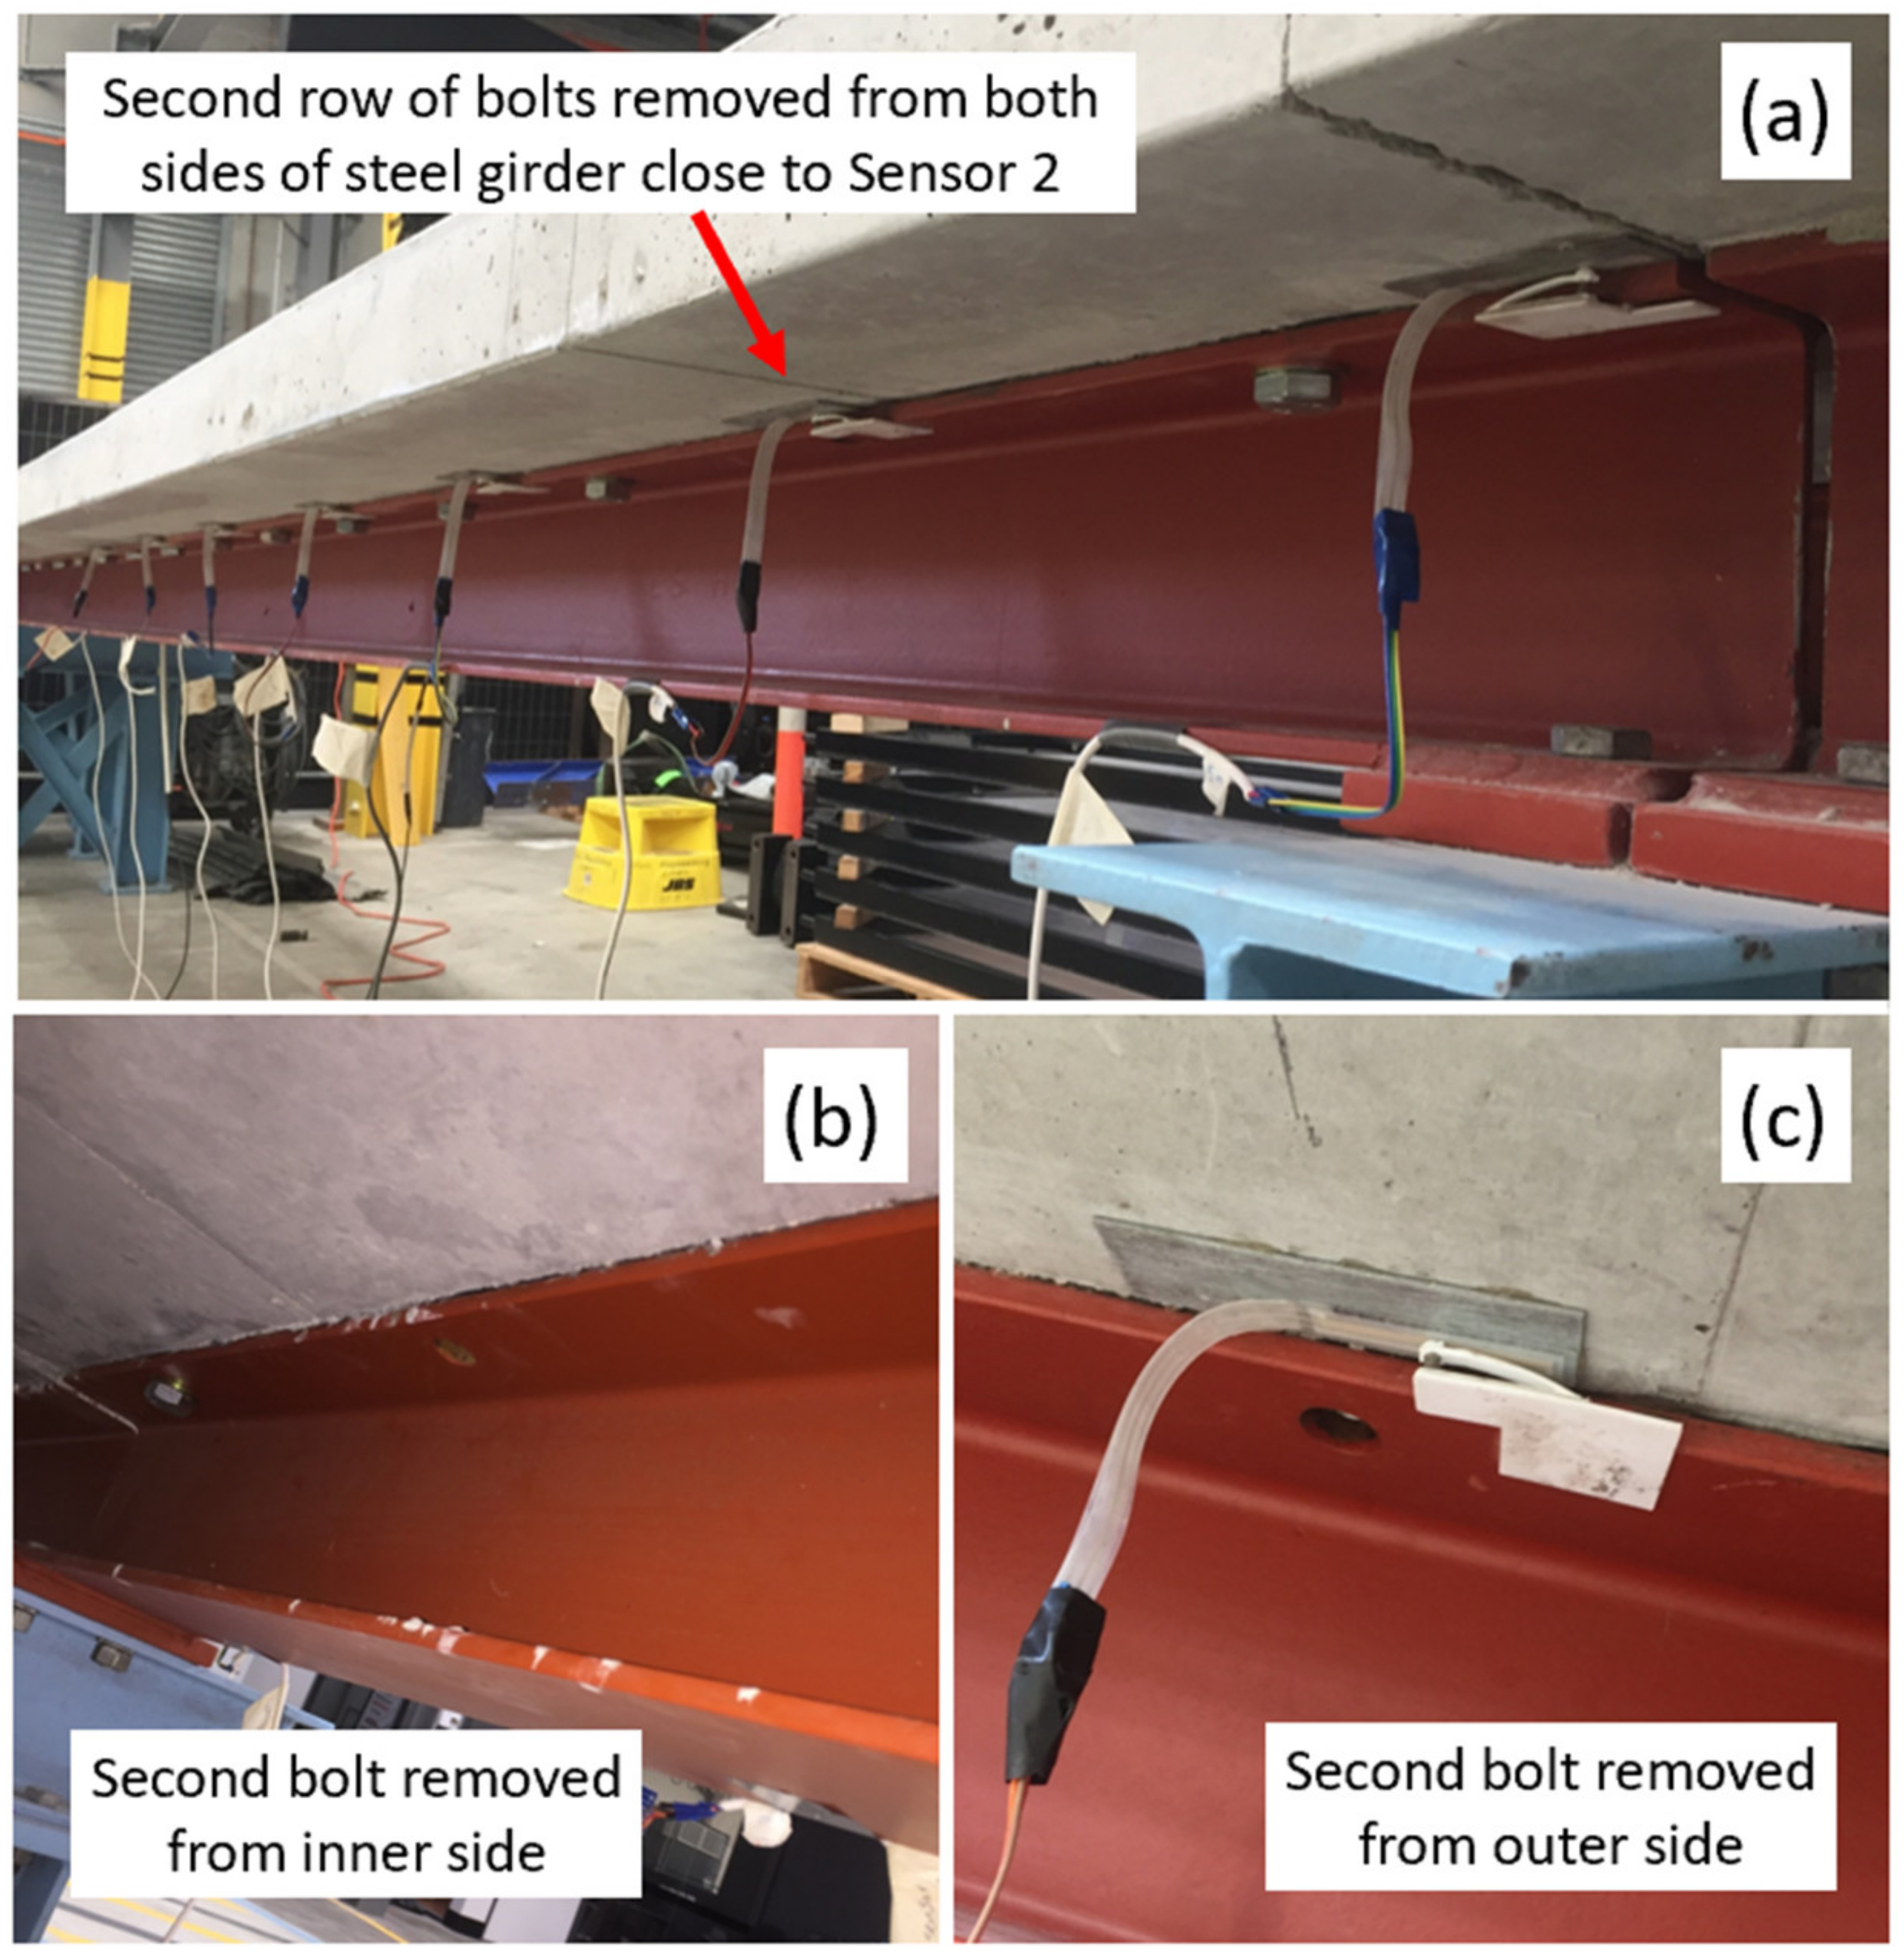
In this scenario, single damage is simulated by removing the second row of bolts from both sides of the steel girder top flange, as shown in Figure 10. The same loading conditions were applied within three main increments, and data were collected from the sensors to analysis the interlayer slips. The measurements from the damaged state are compared with those from the undamaged state to demonstrate the slip sensor sensitivity against the interlayer slip changes and hence, its performance for structural damage detection.
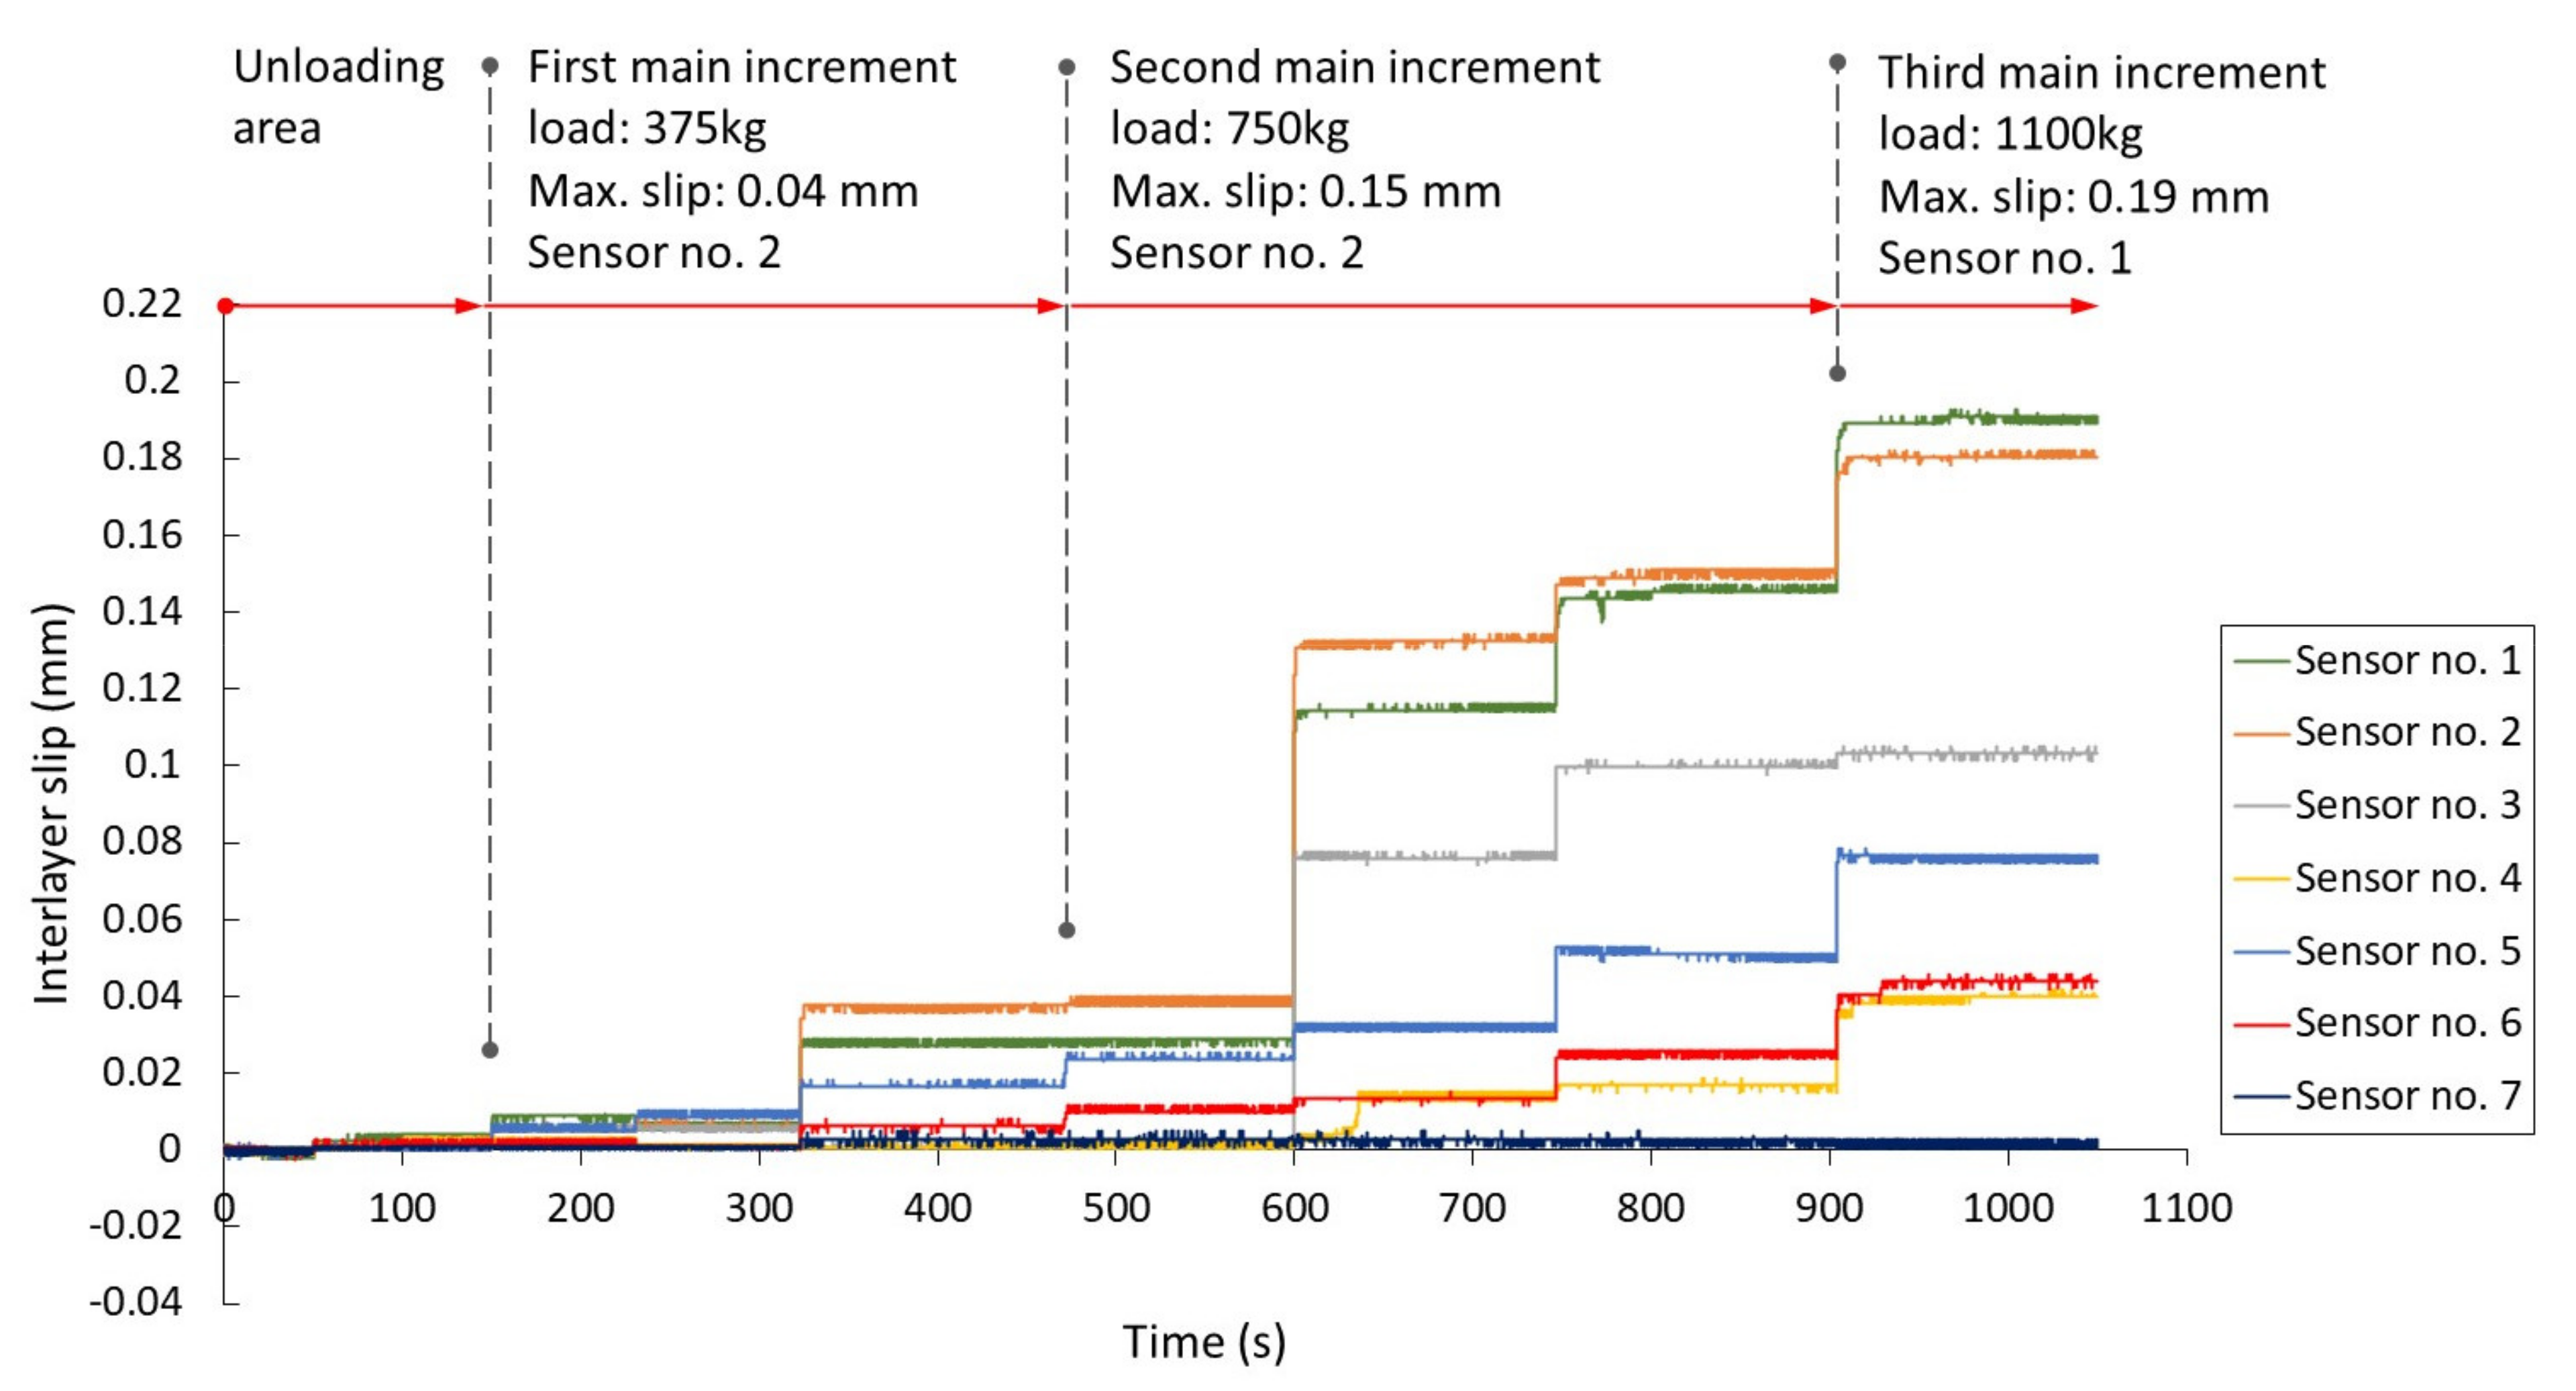
Figure 11 shows the interlayer slip of the composite beam subjected to load obtained from Sensors 1 to 7. In the first main increment, the maximum slip of 0.04 mm is recorded by Sensor 2, where the damage is occurred. In the second increment, Sensor 2 recorded the maximum slip of 0.15 mm, while Sensor 1 recorded the highest slip. In the third and last increment, the maximum slip of 0.19 mm was recorded by Sensor 1. In the mid-span, there is no slip recorded by Sensor 7, even though there is a damage in the beam. The slip at the location of Sensor 3 is remarkably increased compared to the undamaged state, which could be due to damage in that area. Sensor 5 is the next highest slip, which is near the loading area. Therefore, the sensors near the boundary condition show the maximum interlayer slip since damage also exists in that area.
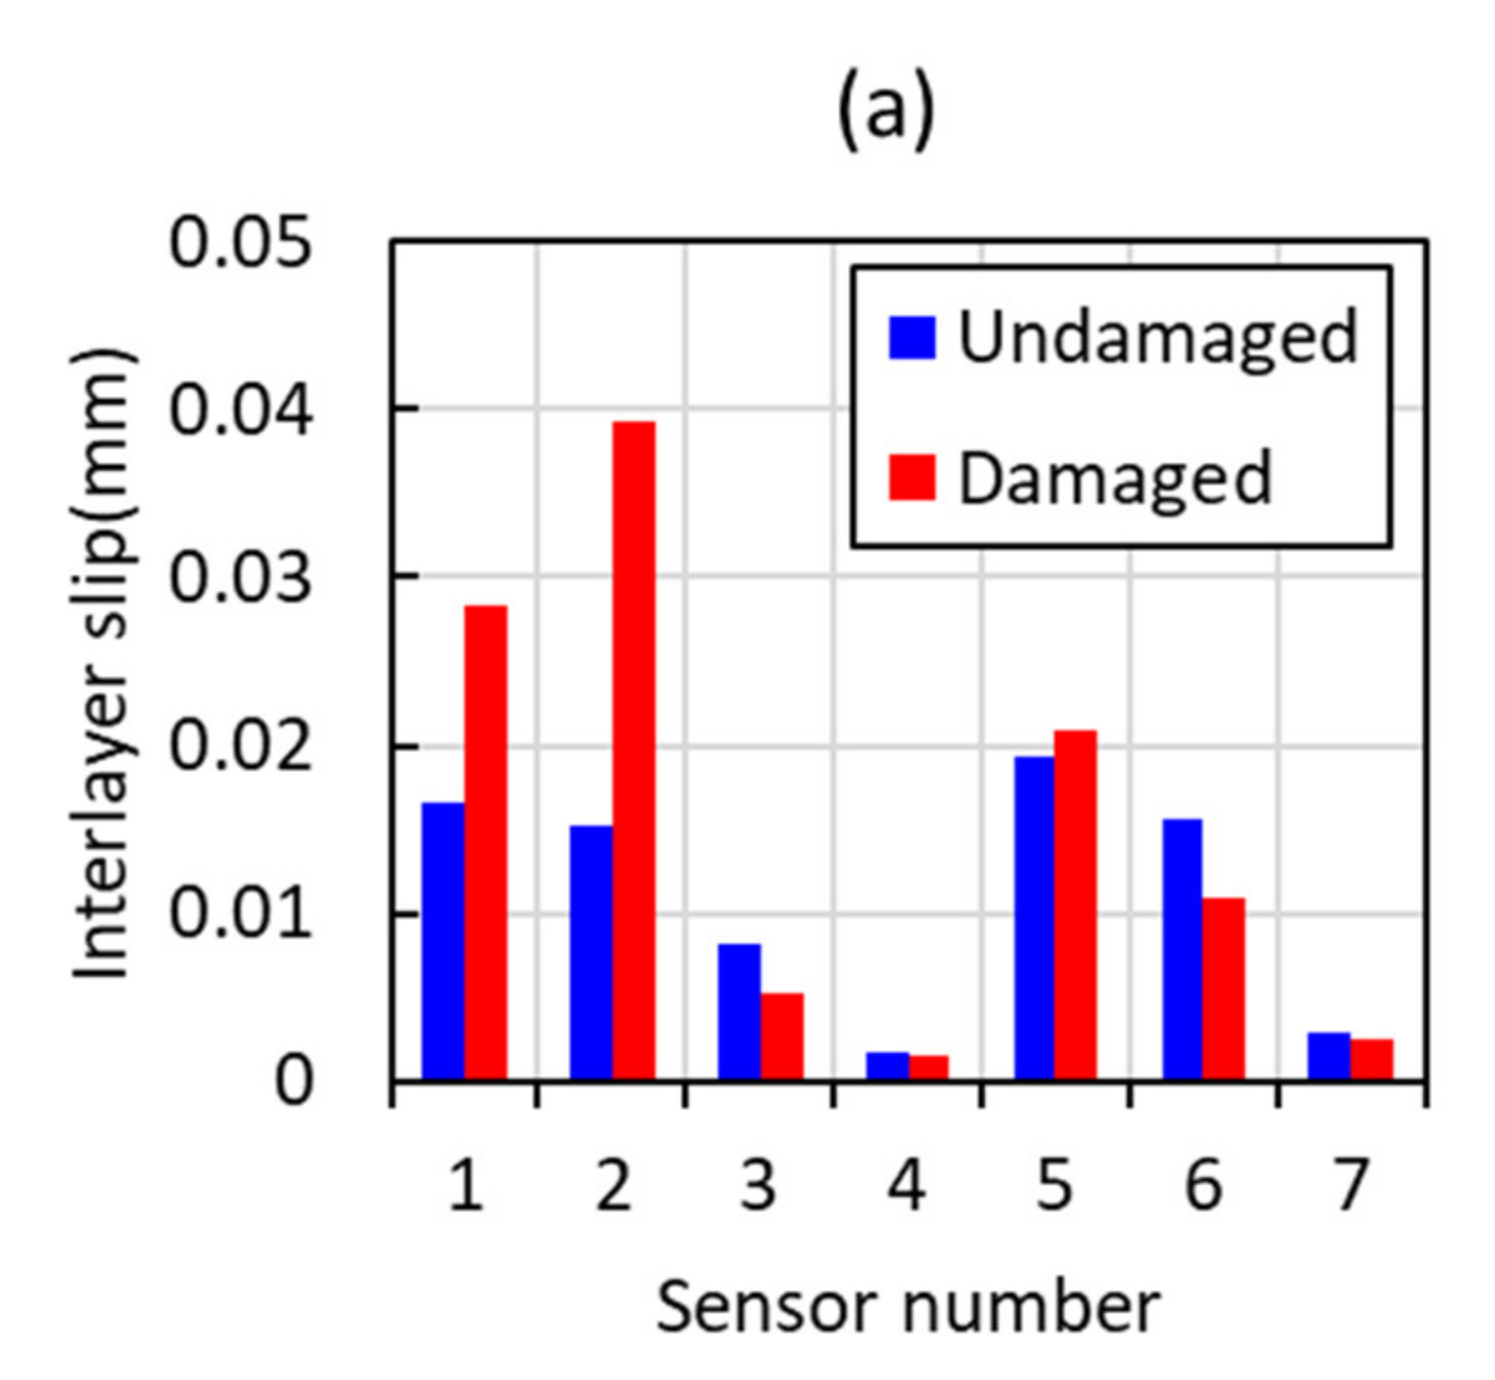
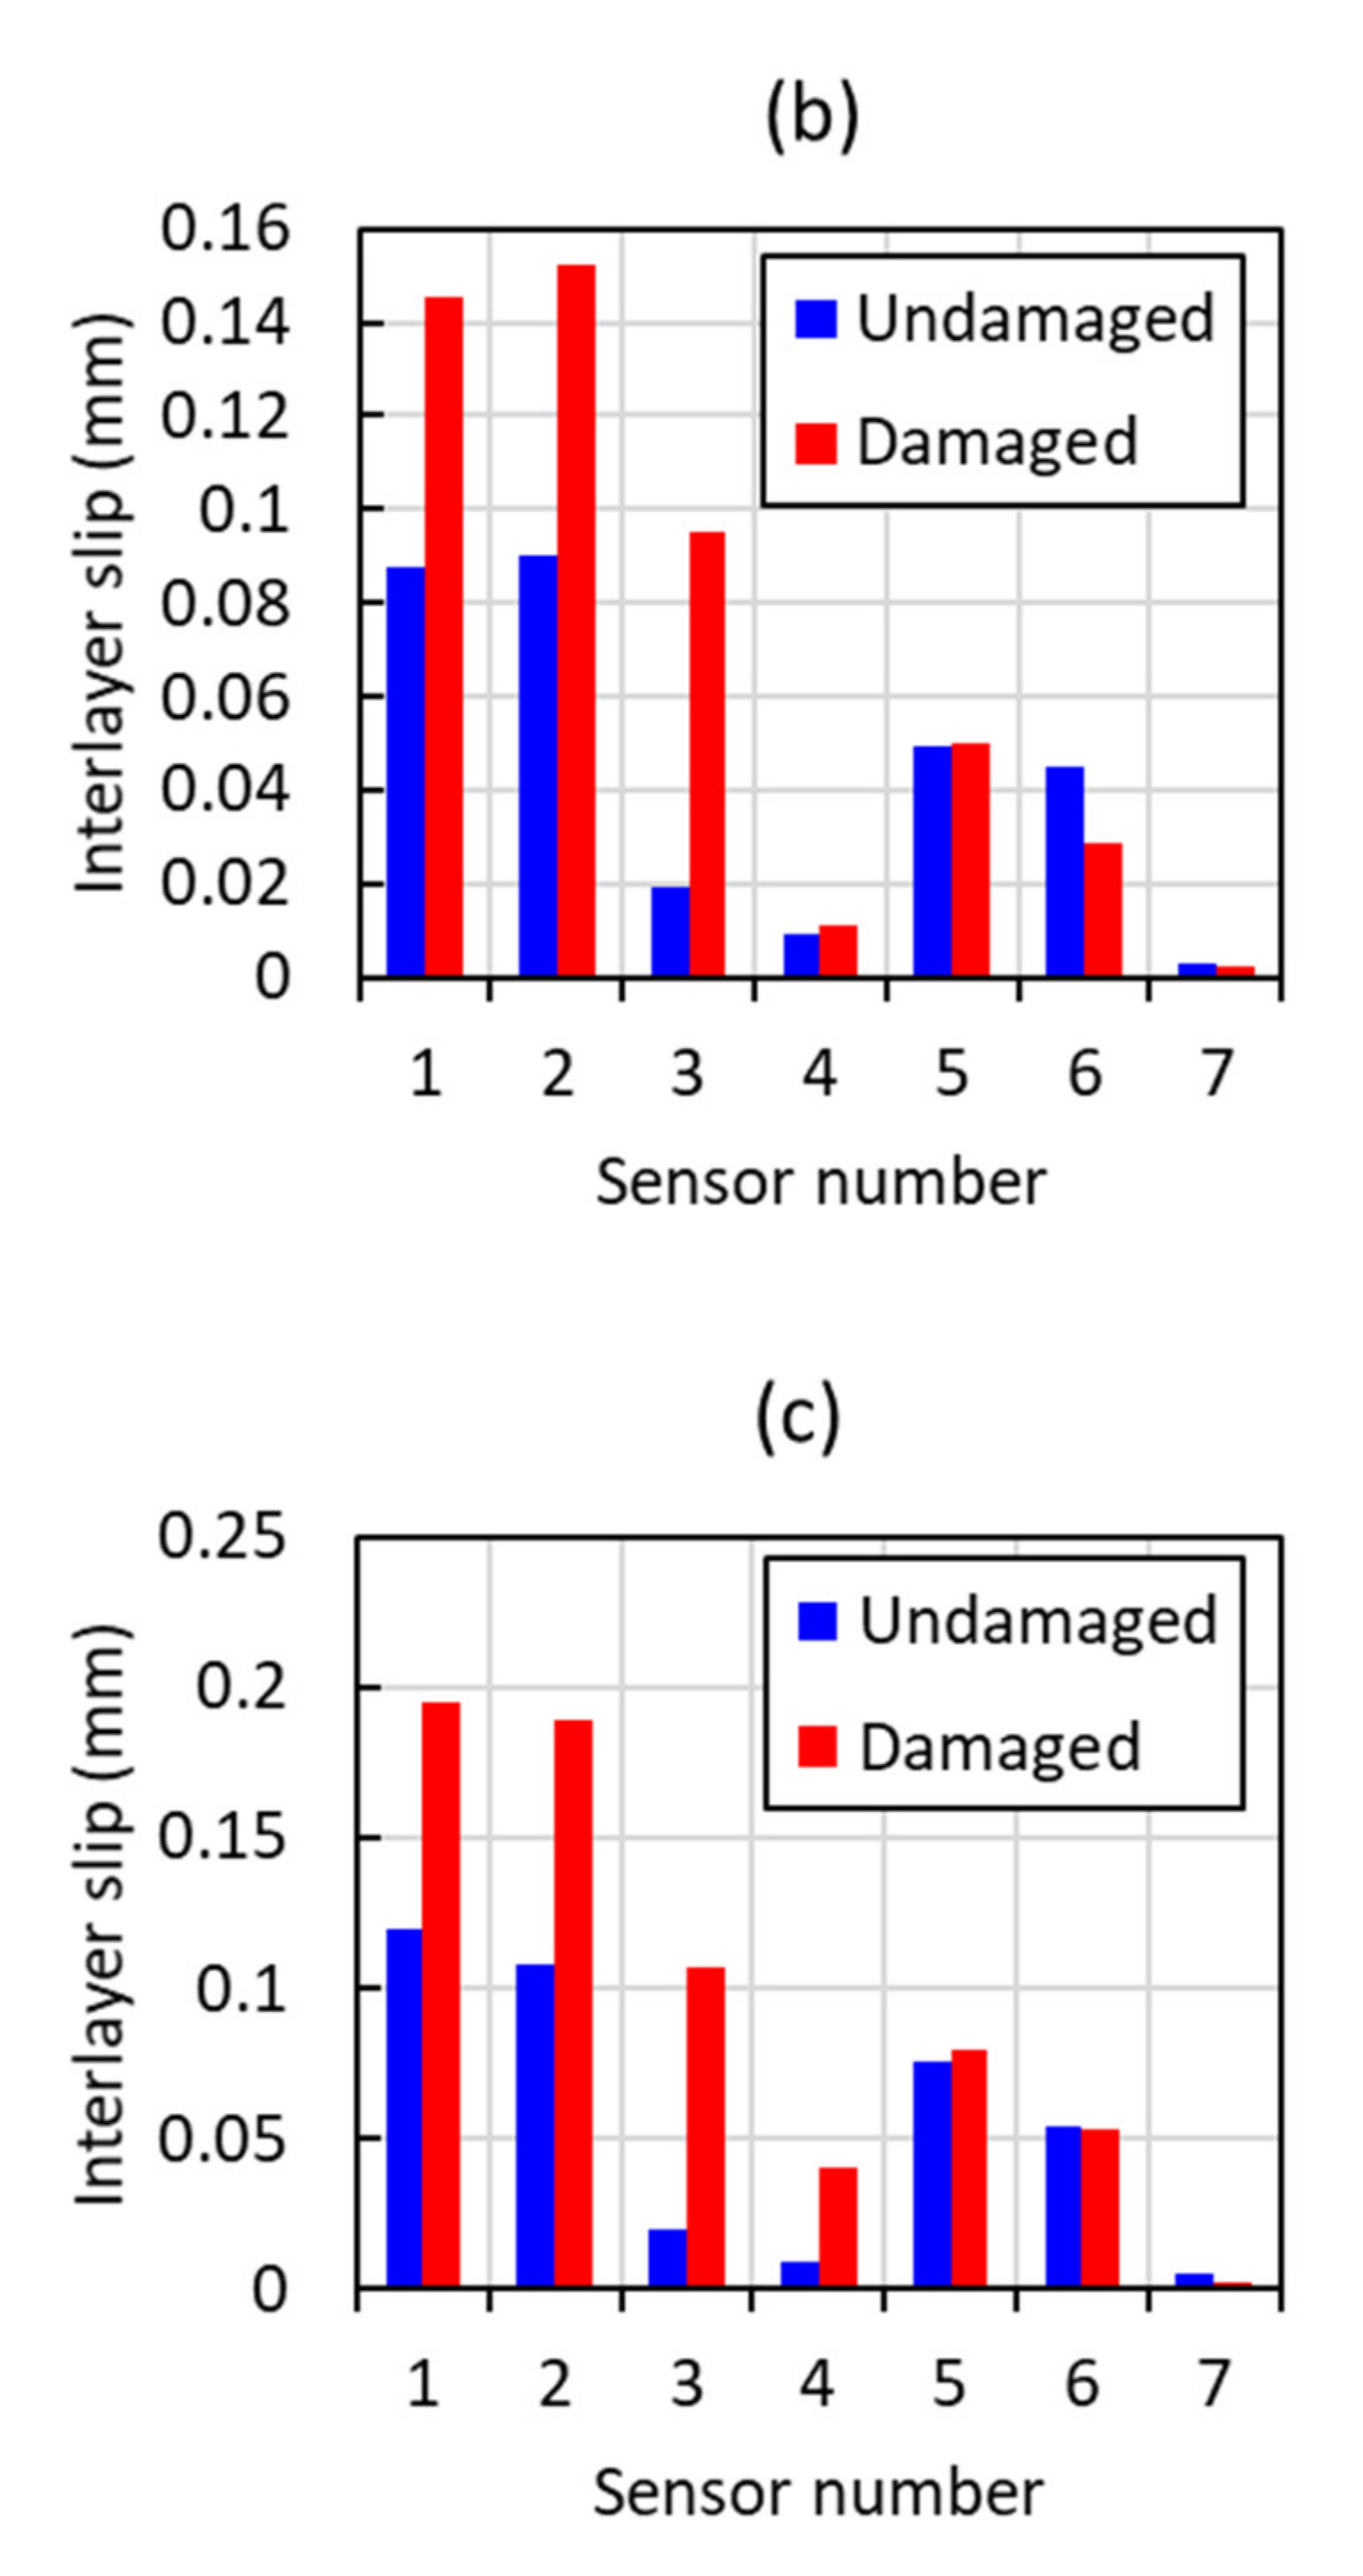
Figure 12 shows structural damage detection by comparing the interlayer slips obtained from seven sensors for the undamaged and damaged composite bridge. Figure 12a shows that the highest difference between undamaged and damaged slip is recorded by Sensor 2 in the first main load increment. The slips from Sensor 1 also show a remarkable difference. Other sensor variations are small, which demonstrates the existence of damage near support. Figure 12b shows that the damaged area is more highlighted by the load increment as the highest variation is detected by Sensor 2. The slips recorded by Sensors 1 and 3 have more variation than those obtained from Sensors 4, 5, 6 and 7. Figure 12c shows that the interlayer slips in damaged areas are remarkable for Sensors 1, 2 and 3, while other sensors do not demonstrate a notable difference. The results indicate that the interlayer slips obtained from the damaged composite beam could reveal the damage location without undamaged data being considered. Therefore, the damage can be localised by the location of the sensor with the largest change of interlayer slip.
4.3. Scenario 2: Damage at Two Locations by Removing the Second and Fifth Rows of Bolts
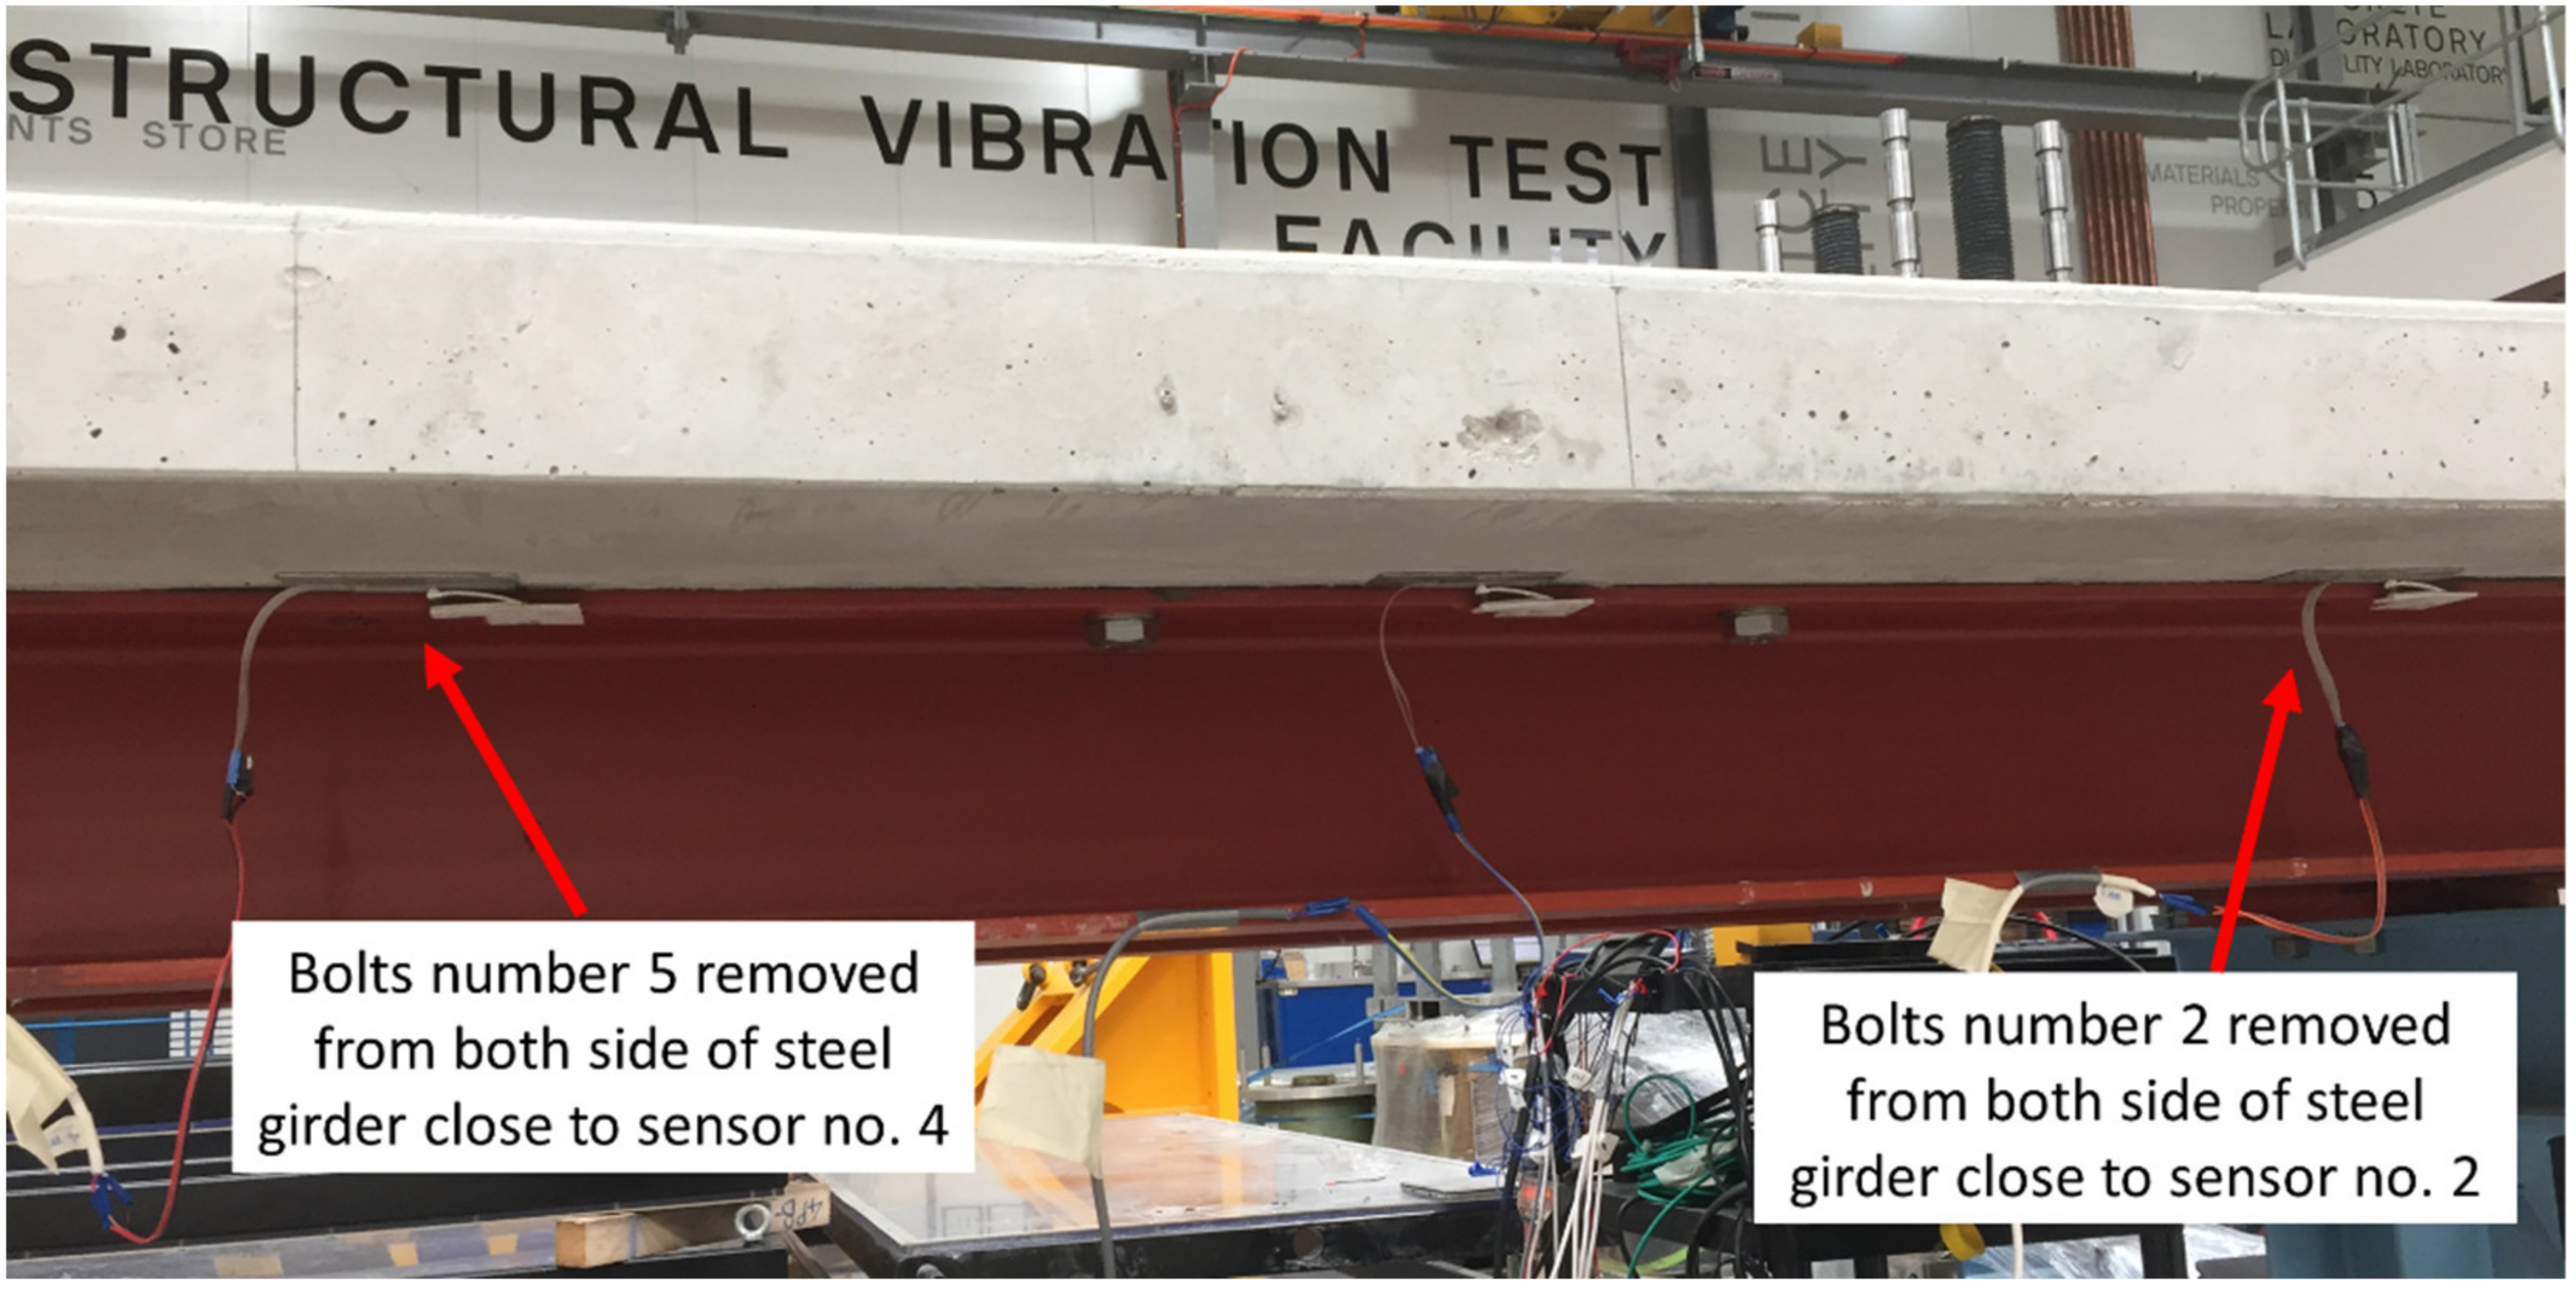
A large damage scenario is simulated by removing bolts at two locations. Here, the second and fifth rows of bolts from both sides of the steel girder top flange are removed, as shown in Figure 13. Under the same loading conditions, data are collected to investigate the interlayer slips variations due to damage.
Figure 14 depicts the interlayer slips obtained from the sensors. The maximum slip of 0.14 mm in the first main increment is recorded by Sensor 2, close to the removed second bolts. Sensor 2 recorded the maximum slip of 0.22 mm in the second main increment, while Sensors 1 and 5 also recorded noticeable slips. Sensors 1 and 2 recorded the maximum slip of 0.32 mm in the last increment. It is shown that from the first increment, the maximum interlayer slips have occurred at the locations of Sensors 1 and 2. Sensor 4, which is near to the removed bolt number 5, recorded a tiny slip in the first main increment. This trend continued until the last step on the second main increment, where the effect of damage on that location appeared as there are noticeable increases onwards.
Besides, Sensor 3 had a remarkable change in the last main increment compared to the undamaged state. This could be due to its location which is between two damage zones (between the removed second and fifth rows of bolts). Sensor 6, which is located near mid-span (loading zone), recorded the interlayer slip similar to that in the last step of second main increment. Another notable change was at the location of Sensor 5, where the slip increased compared with that in Scenario 1. This is due to the large quantity of damage in this context, which affects the overall interlayer slip of the bridge.
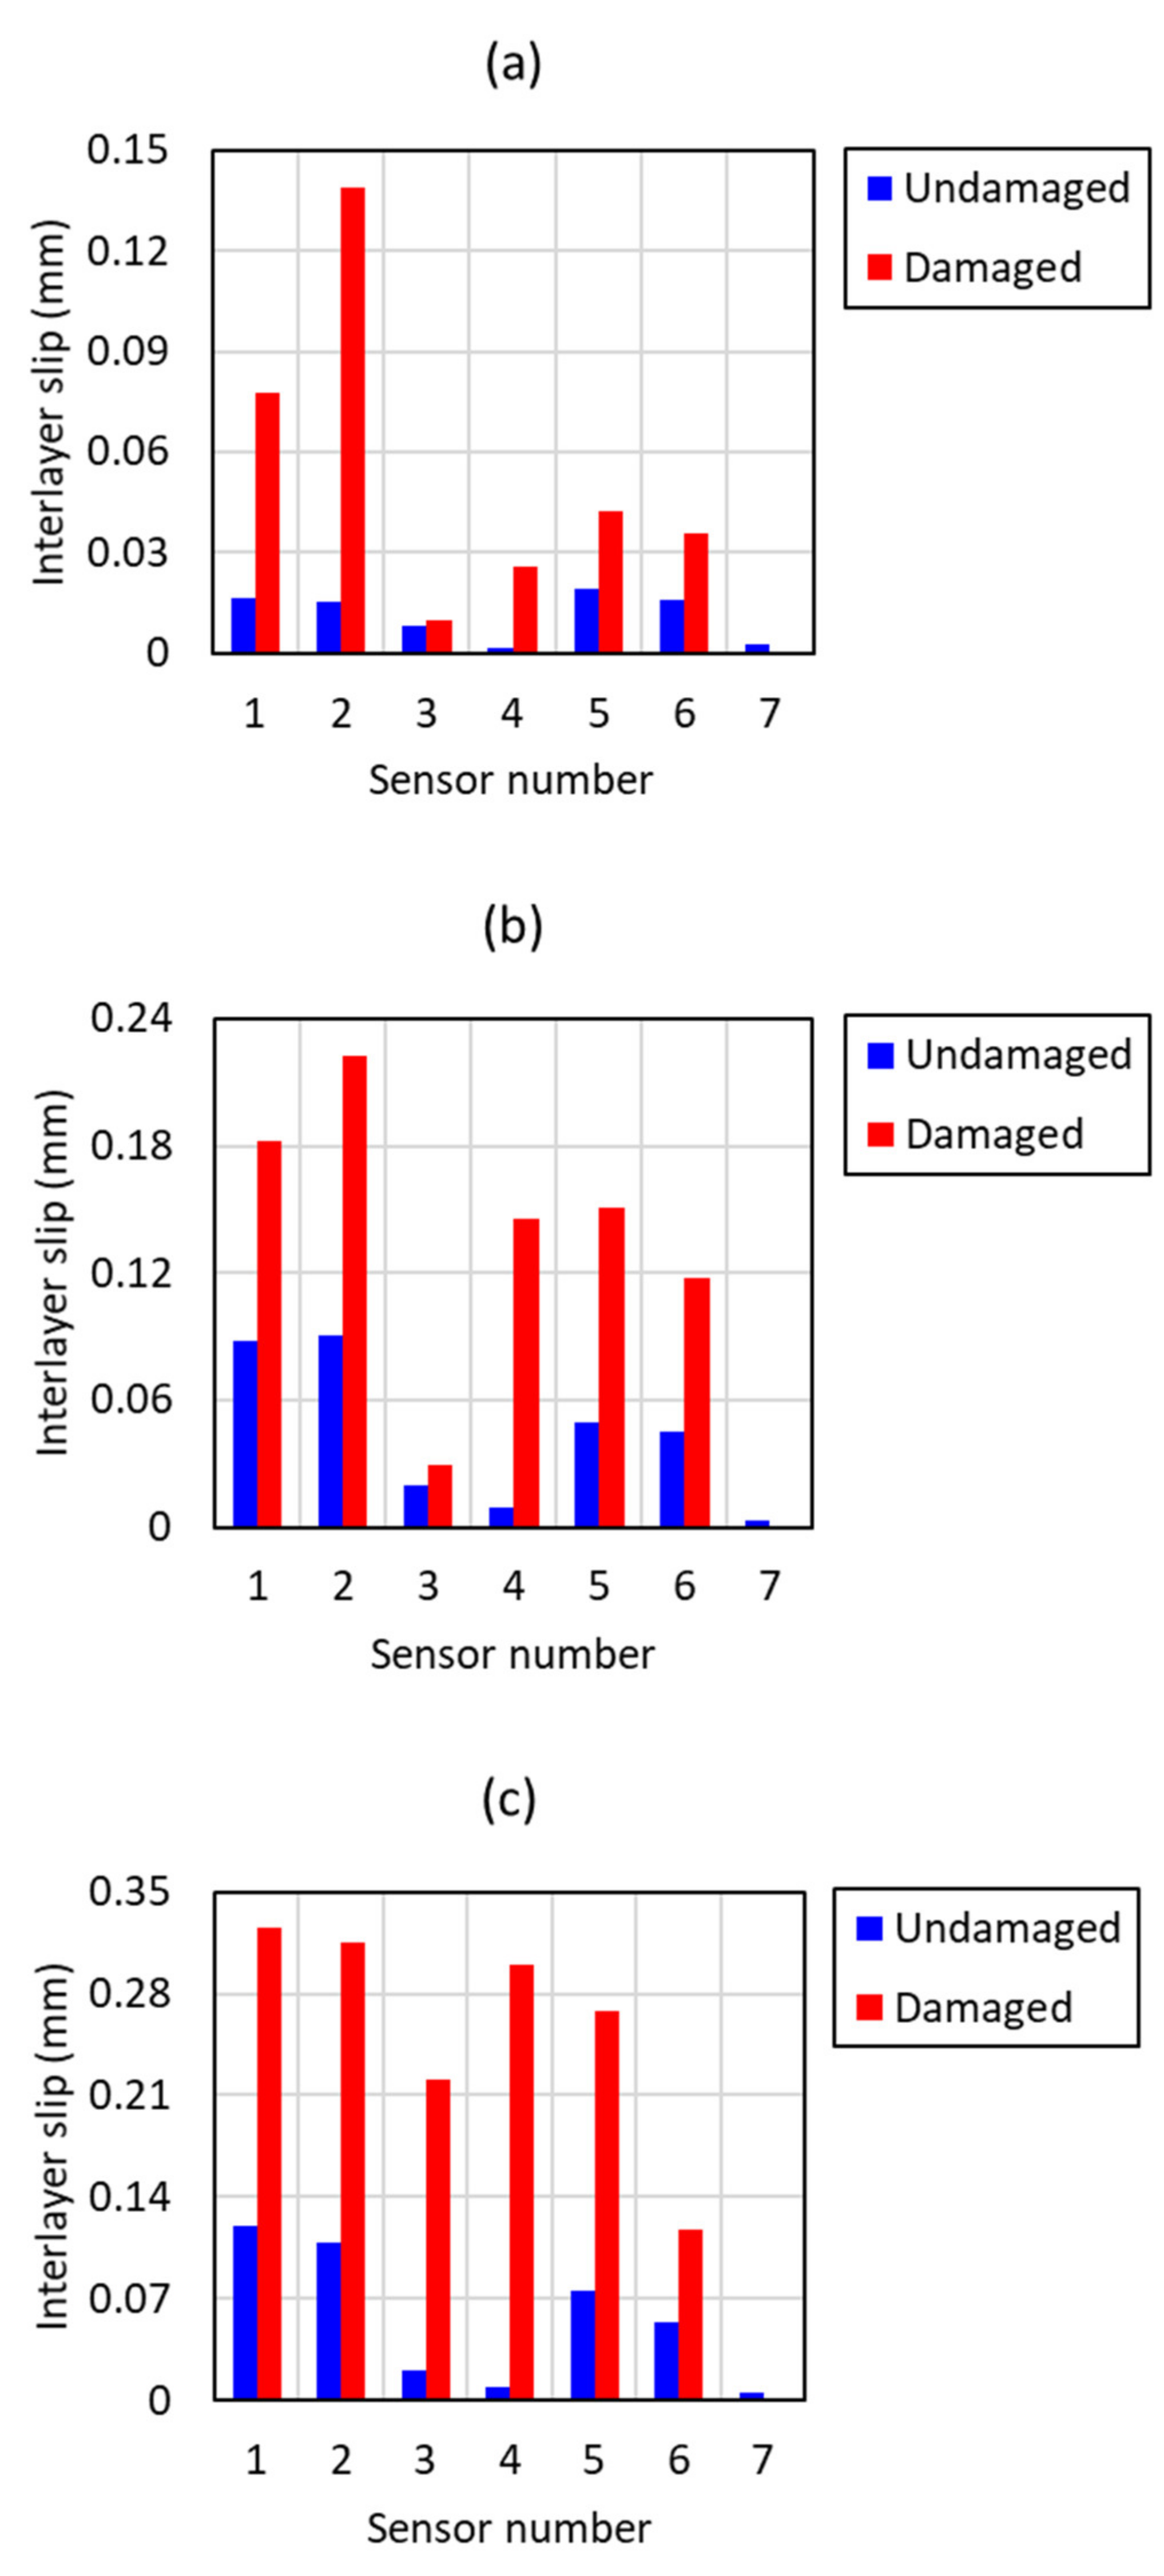
Figure 15 shows the results of damage detection based on interlayer slip monitoring. In the first main load increment, the highest difference between undamaged and damaged is achieved by Sensor 2 (Figure 15a). Other sensors do not reveal a detectable difference except Sensor 1, which is located in the boundary condition and damage zone. In the second main increment (Figure 15b), the damage effects appeared as the interlayer slips raised on the damaged zones (Sensors 2 and 4). In Figure 15c, the existence of damage in the composite beam interlayer was observable as the slips surprisingly increased the damaged surrounding zone. The maximum increase took place in the centre of damage on bolts 2 (Sensor 2) and 5 (Sensor 4). The nearby areas are also affected by damage, especially at the location of Sensor 3, where the changes are considerable compared to previous tests. This scenario also shows that the slip sensor can be used for detecting structural damage of real SCC bridges, where inherent slip data (undamaged state) are not available and condition monitoring should be done by the real-time slip data (potential damaged state). The interlayer slips condition track shows the appearance of abnormalities in the damaged zone, as well as unexpected variations in the slip from mid-span to support.
5. Conclusions
A novel interlayer slip monitoring system based on the slip sensor UIPM has been developed for interfacial condition assessment of SCC beams. Since the slip sensory system is used for the first time, the system calibration and its application for condition monitoring of the SCC beams have been conducted in a laboratory. The slip sensor sensitivity and applicability in monitoring the interlayer slip of the SCC beam is investigated. Some findings are listed as follows:
- The detailed calibration has been carried out utilising the testing machine. The calibration results demonstrate that the sensors are very sensitive to the slip and the maximum difference of calibration coefficient between 7 sensors for 5 mm and 47 mm are 1.9% and 1.6%, respectively. The results show that the UIPM displacement sensors are very stable and consistent, and they are suitable for practical application.
- The condition assessment of the SCC bridge deck was conducted by monitoring the interlayer slip between the steel beam and concrete slab. The single and double damage scenarios have been studied. The effect of the loading weight on the interlayer slip was also studied. For the single damage scenario, the results show that the interlayer slip changes around the damaged area are larger than other while other locations and the large loading weight induces the big slip change. The load increment enhanced the quality and accuracy of interlayer slip monitoring.
- For the double damage scenarios, the damage occurred at two locations. The interlayer slips increased not only around these two damaged zones but also in other areas. The change around the damage zone is much larger than that in other areas. The results show that the interlayer slip could be a good indicator of the existence and location of damage at multiple locations by the proposed method.
- In this study, a new slip sensory system has been developed and the reliability and robustness have been validated using the full-scale composite bridge deck in a laboratory. Further study is needed to develop the numerical model for structural damage identification of composite structures from slip measurements. Moreover, the maximum load weight effect for practical application will be further investigated based on scale-to-actual condition conversion.
Author Contributions
Conceptualization, F.S. and X.Z.; Data curation, F.S.; Formal analysis, F.S.; Funding acquisition, X.Z. and M.R.; Investigation, F.S. and X.Z.; Methodology, F.S. and X.Z.; Project administration, X.Z., J.L. and M.R.; Resources, X.Z. and M.R.; Software, F.S.; Supervision, X.Z. and J.L.; Validation, F.S. and X.Z.; Visualization, F.S. and X.Z.; Writing–original draft, F.S.; Writing–review & editing, F.S., X.Z., J.L. and M.R. All authors have read and agreed to the published version of the manuscript.
Funding
This research received no external funding.
Institutional Review Board Statement
Not applicable.
Informed Consent Statement
Not applicable.
Data Availability Statement
The data are not publicly available due to the confidentiality of the research project.
Conflicts of Interest
The authors declare that there is no conflict of interest.
References
- Sun, L.; Shang, Z.; Xia, Y.; Bhowmick, S.; Nagarajaiah, S. Review of Bridge Structural Health Monitoring Aided by Big Data and Artificial Intelligence: From Condition Assessment to Damage Detection. J. Struct. Eng. 2020, 146, 04020073. [Google Scholar] [CrossRef]
- Sadeghi, F.; Li, J.; Zhu, X. A steel-concrete composite beam element for structural damage identification. Int. J. Struct. Stab. Dyn. 2020, 20, 2042015. [Google Scholar] [CrossRef]
- Rashidi, M.; Ghodrat, M.; Samali, B.; Kendall, B.; Zhang, C. Remedial modelling of steel bridges through application of analytical hierarchy process (AHP). Appl. Sci. 2017, 7, 168. [Google Scholar] [CrossRef] [Green Version]
- Noori Hoshyar, A.; Rashidi, M.; Liyanapathirana, R.; Samali, B. Algorithm Development for the non-destructive testing of structural damage. Appl. Sci. 2019, 9, 2810. [Google Scholar] [CrossRef] [Green Version]
- Nagarajaiah, S.; Erazo, K. Structural monitoring and identification of civil infrastructure in the United States. Struct. Monit. Maint. 2016, 3, 51. [Google Scholar] [CrossRef]
- Chandrashekhara, K.; Krishnamurthy, K.; Roy, S. Free vibration of composite beams including rotary inertia and shear deformation. Compos. Struct. 1990, 14, 269–279. [Google Scholar] [CrossRef]
- Nie, J.; Cai, C.S. Steel–concrete composite beams considering shear slip effects. J. Struct. Eng. 2003, 129, 495–506. [Google Scholar] [CrossRef] [Green Version]
- Fragiacomo, M.; Ceccotti, A. Long-term behavior of timber–concrete composite beams. I: Finite element modeling and validation. J. Struct. Eng. 2006, 132, 13–22. [Google Scholar] [CrossRef]
- Gutkowski, R.M.; Brown, K.; Shigidi, A.; Natterer, J. Investigation of notched composite wood–concrete connections. J. Struct. Eng. 2004, 130, 1553–1561. [Google Scholar] [CrossRef]
- Nguyen, Q.-H.; Hjiaj, M.; Guezouli, S. Exact finite element model for shear-deformable two-layer beams with discrete shear connection. Finite Elem. Anal. Des. 2011, 47, 718–727. [Google Scholar] [CrossRef]
- Sadeghi, F.; Kueh, A.B.H. Serviceability assessment of composite footbridge under human walking and running Loads. J. Teknol. 2015, 74. [Google Scholar] [CrossRef] [Green Version]
- Chan, T.H.; Thambiratnam, D.P. Structural Health Monitoring in Australia; Nova Science Publishers: New York, NY, USA, 2011. [Google Scholar]
- Žnidarič, A.; Pakrashi, V.; O’Brien, E.; O’Connor, A. A Review of Road Structure Data in Six European Countries. Proc. Inst. Civ. Eng.-Urban Des. Plan. 2011, 164, 225–232. [Google Scholar] [CrossRef] [Green Version]
- Herrmann, A.W. Asce 2013 report card for america’s infrastructure. In Proceedings of the IABSE Symposium Report; International Association for Bridge and Structural Engineering: Zürich, Switzerland, 2013; pp. 9–10. [Google Scholar]
- Kumar, P.; Patnaik, A.; Chaudhary, S. Effect of bond layer thickness on behaviour of steel-concrete composite connections. Eng. Struct. 2018, 177, 268–282. [Google Scholar] [CrossRef]
- Sadeghi, F.; Zhu, X.; Li, J. Damage analysis of steel-concrete composite beams under static loads. In Proceedings of the International Conference on Structural Dynamic EURODYN, Athens, Greece, 23–26 November 2020; pp. 1053–1062. [Google Scholar]
- Chen, J.; Zhang, H.; Yu, Q.-Q. Static and fatigue behavior of steel-concrete composite beams with corroded studs. J. Constr. Steel Res. 2019, 156, 18–27. [Google Scholar] [CrossRef]
- Sadeghi, F.; Kueh, A.; Bagheri Fard, A.; Aghili, N. Vibration characteristics of composite footbridges under various human running loads. Int. Sch. Res. Not. 2013, 2013, 817384. [Google Scholar] [CrossRef] [Green Version]
- Dilena, M.; Morassi, A. Experimental modal analysis of steel concrete composite beams with partially damaged connection. J. Vib. Control. 2004, 10, 897–913. [Google Scholar] [CrossRef]
- Sadeghi, F.; Kueh, A.; Vafaei, M. Dynamic response of composite footbridges under running pedestrian load. In Proceedings of the 2013 IEEE Business Engineering and Industrial Applications Colloquium (BEIAC), Langkawi, Malaysia, 7–9 April 2013; pp. 273–278. [Google Scholar]
- Ho, S.C.M.; Ren, L.; Labib, E.; Kapadia, A.; Mo, Y.L.; Li, H.; Song, G. Inference of bond slip in prestressed tendons in concrete bridge girders. Struct. Control. Health Monit. 2015, 22, 289–300. [Google Scholar] [CrossRef]
- Li, J.; Hao, H.; Fan, K.; Brownjohn, J. Development and application of a relative displacement sensor for structural health monitoring of composite bridges. Struct. Control. Health Monit. 2015, 22, 726–742. [Google Scholar] [CrossRef] [Green Version]
- Li, J.; Hao, H. Health monitoring of joint conditions in steel truss bridges with relative displacement sensors. Measurement 2016, 88, 360–371. [Google Scholar] [CrossRef] [Green Version]
- Xia, Y.; Hao, H.; Deeks, A.J. Dynamic assessment of shear connectors in slab–girder bridges. Eng. Struct. 2007, 29, 1475–1486. [Google Scholar] [CrossRef] [Green Version]
- Yi, T.H.; Li, H.N.; Gu, M. Recent research and applications of GPS-based monitoring technology for high-rise structures. Struct. Control Health Monit. 2013, 20, 649–670. [Google Scholar] [CrossRef]
- Nassif, H.H.; Gindy, M.; Davis, J. Comparison of laser Doppler vibrometer with contact sensors for monitoring bridge deflection and vibration. Ndt E Int. 2005, 38, 213–218. [Google Scholar] [CrossRef]
- Bartoli, G.; Facchini, L.; Pieraccini, M.; Fratini, M.; Atzeni, C. Experimental utilization of interferometric radar techniques for structural monitoring. Struct. Control Health Monit. Off. J. Int. Assoc. Struct. Control. Monit. Eur. Assoc. Control Struct. 2008, 15, 283–298. [Google Scholar] [CrossRef]
- Trybała, P.; Blachowski, J.; Błażej, R.; Zimroz, R. Damage Detection Based on 3D Point Cloud Data Processing from Laser Scanning of Conveyor Belt Surface. Remote Sens. 2021, 13, 55. [Google Scholar] [CrossRef]
- Liu, X.; Wang, P.; Lu, Z.; Gao, K.; Wang, H.; Jiao, C.; Zhang, X. Damage detection and analysis of urban bridges using terrestrial laser scanning (tls), ground-based microwave interferometry, and permanent scatterer interferometry synthetic aperture radar (ps-insar). Remote Sens. 2019, 11, 580. [Google Scholar] [CrossRef] [Green Version]
- Zheng, X.; Huang, P.; Han, Q.; Chen, G. Bond behavior of interface between CFL and concrete under static and fatigue load. Constr. Build. Mater. 2014, 52, 33–41. [Google Scholar] [CrossRef]
- Thomsen IV, J.H.; Wallace, J.W. Displacement-based design of slender reinforced concrete structural walls—experimental verification. J. Struct. Eng. 2004, 130, 618–630. [Google Scholar] [CrossRef]
- Neumann, M.; Dreier, F.; Günther, P.; Wilke, U.; Fischer, A.; Büttner, L.; Holzinger, F.; Schiffer, H.-P.; Czarske, J. A laser-optical sensor system for blade vibration detection of high-speed compressors. Mech. Syst. Signal Process. 2015, 64, 337–346. [Google Scholar] [CrossRef]
- Myung, H.; Lee, S.; Lee, B. Paired structured light for structural health monitoring robot system. Struct. Health Monit. 2011, 10, 49–64. [Google Scholar] [CrossRef]
- Raghuwanshi, N.K.; Parey, A. Experimental measurement of mesh stiffness by laser displacement sensor technique. Measurement 2018, 128, 63–70. [Google Scholar] [CrossRef]
- Rahman, H.; Rahim, H.; Ahmad, H.; Yasin, M.; Apsari, R.; Harun, S.W. Fiber optic displacement sensor for imaging of tooth surface roughness. Measurement 2013, 46, 546–551. [Google Scholar] [CrossRef]
- Huang, Q.; Monserrat, O.; Crosetto, M.; Crippa, B.; Wang, Y.; Jiang, J.; Ding, Y. Displacement monitoring and health evaluation of two bridges using sentinel-1 SAR images. Remote Sens. 2018, 10, 1714. [Google Scholar] [CrossRef] [Green Version]
- Jung, J.; Kim, D.-J.; Palanisamy Vadivel, S.K.; Yun, S.-H. Long-term deflection monitoring for bridges using X and C-band time-series SAR interferometry. Remote Sens. 2019, 11, 1258. [Google Scholar] [CrossRef] [Green Version]
- Rashidi, M.; Mohammadi, M.; Sadeghlou Kivi, S.; Abdolvand, M.M.; Truong-Hong, L.; Samali, B. A decade of modern bridge monitoring using terrestrial laser scanning: Review and future directions. Remote Sens. 2020, 12, 3796. [Google Scholar] [CrossRef]
- Huo, L.; Cheng, H.; Kong, Q.; Chen, X. Bond-slip monitoring of concrete structures using smart sensors—A review. Sensors 2019, 19, 1231. [Google Scholar] [CrossRef] [PubMed] [Green Version]
- Li, H.; Dong, S.; El-Tawil, S.; Kamat, V.R. Relative displacement sensing techniques for postevent structural damage assessment. J. Struct. Eng. 2013, 139, 1421–1434. [Google Scholar] [CrossRef]
- Zhu, J.; Ho, S.C.M.; Kong, Q.; Patil, D.; Mo, Y.-L.; Song, G. Estimation of impact location on concrete column. Smart Mater. Struct. 2017, 26, 055037. [Google Scholar] [CrossRef]
- Sadeghi, F.; Yu, Y.; Zhu, X.; Li, J. Damage identification of steel-concrete composite beams based on modal strain energy changes through general regression neural network. Eng. Struct. 2021, 244, 112824. [Google Scholar] [CrossRef]
- Bitter, R.; Mohiuddin, T.; Nawrocki, M. LabVIEW: Advanced Programming Techniques; CRC Press: Boca Raton, FL, USA, 2000. [Google Scholar]
- Standards Australia. AS/NZS 2327.1:2003 Composite Structures: Simply-Supported Beams; Standards Australia: Sydney, Australia, 2003. [Google Scholar]
- Standards Australia. AS/NZS 1170.1:2002 Structural Design Actions Part 1–Permanent, Imposed and Other Actions; Standards Australia: Sydney, Australia, 2002. [Google Scholar]
Figure 1.
(a) Sensor film and (b) the sensory system.

Figure 2.
(a) 3D printed wiper, (b) the sensor installation on the SCC beam and (c) the sensors connected to the National Instruments data acquisition system.
Figure 2.
(a) 3D printed wiper, (b) the sensor installation on the SCC beam and (c) the sensors connected to the National Instruments data acquisition system.

Figure 3.
Slip-sensor calibration system.

Figure 4.
Calibration of seven sensors in terms of relative displacement (slip) and voltage; S1 to S7 are measured data, and R1, to R7 denote calibration coefficients for sensors numbers 1 to 7.
Figure 4.
Calibration of seven sensors in terms of relative displacement (slip) and voltage; S1 to S7 are measured data, and R1, to R7 denote calibration coefficients for sensors numbers 1 to 7.

Figure 5.
The drift in calibrations for seven sensors (D1 to D7) at 5 points.

Figure 6.
(a) plan view and dimensions, (b) the bridge after construction, (c) covers embedded in the concrete slab in main span for the removable shear connectors, (d) reinforced bars alignments and (e) discontinuous slabs ends.
Figure 6.
(a) plan view and dimensions, (b) the bridge after construction, (c) covers embedded in the concrete slab in main span for the removable shear connectors, (d) reinforced bars alignments and (e) discontinuous slabs ends.

Figure 7.
(a) Schematic to the bridge showing the sensors alignments and numbers, (b) the slip sensor location on the support and (c) the slip sensors locations on the half of a beam.
Figure 7.
(a) Schematic to the bridge showing the sensors alignments and numbers, (b) the slip sensor location on the support and (c) the slip sensors locations on the half of a beam.

Figure 8.
(a) first load 375 kg, (b) second load 750 kg and (c) third load 1100 kg.

Figure 9.
The interlayer slip of composite beam without damage under loading.

Figure 10.
Second row of bolts are removed to simulate the damage at a single location; (a) The location of the damage near Sensor 2, (b) the removed bolt from the outer side and (c) the removed bolt from the inner side.
Figure 10.
Second row of bolts are removed to simulate the damage at a single location; (a) The location of the damage near Sensor 2, (b) the removed bolt from the outer side and (c) the removed bolt from the inner side.

Figure 11.
The interlayer slip of composite beam for single damage (second row of bolts from the right-hand side is removed).
Figure 11.
The interlayer slip of composite beam for single damage (second row of bolts from the right-hand side is removed).

Figure 12.
Structural damage detection for single damage in terms of (a) first load increment, (b) second load increment and (c) third load increment.
Figure 12.
Structural damage detection for single damage in terms of (a) first load increment, (b) second load increment and (c) third load increment.


Figure 13.
Second and fifth rows of bolts are removed from the inner and outer sides to define double damage.
Figure 13.
Second and fifth rows of bolts are removed from the inner and outer sides to define double damage.

Figure 14.
The interlayer slip of composite beam for double damage (second and fifth rows of bolts from right hand side are removed).
Figure 14.
The interlayer slip of composite beam for double damage (second and fifth rows of bolts from right hand side are removed).

Figure 15.
Structural damage detection for double damage in terms of (a) first load increment, (b) second load increment and (c) third load increment.
Figure 15.
Structural damage detection for double damage in terms of (a) first load increment, (b) second load increment and (c) third load increment.

Publisher’s Note: MDPI stays neutral with regard to jurisdictional claims in published maps and institutional affiliations. |
© 2021 by the authors. Licensee MDPI, Basel, Switzerland. This article is an open access article distributed under the terms and conditions of the Creative Commons Attribution (CC BY) license (https://creativecommons.org/licenses/by/4.0/).
Share and Cite
MDPI and ACS Style
Sadeghi, F.; Zhu, X.; Li, J.; Rashidi, M. A Novel Slip Sensory System for Interfacial Condition Monitoring of Steel-Concrete Composite Bridges. Remote Sens. 2021, 13, 3377. https://0-doi-org.brum.beds.ac.uk/10.3390/rs13173377
AMA Style
Sadeghi F, Zhu X, Li J, Rashidi M. A Novel Slip Sensory System for Interfacial Condition Monitoring of Steel-Concrete Composite Bridges. Remote Sensing. 2021; 13(17):3377. https://0-doi-org.brum.beds.ac.uk/10.3390/rs13173377
Chicago/Turabian StyleSadeghi, Faraz, Xinqun Zhu, Jianchun Li, and Maria Rashidi. 2021. "A Novel Slip Sensory System for Interfacial Condition Monitoring of Steel-Concrete Composite Bridges" Remote Sensing 13, no. 17: 3377. https://0-doi-org.brum.beds.ac.uk/10.3390/rs13173377
Note that from the first issue of 2016, this journal uses article numbers instead of page numbers. See further details here.