Review

Design and Applications of Multi-Frequency Holographic Subsurface Radar: Review and Case Histories

by
Sergey I. Ivashov
1,
Lorenzo Capineri
2,*,
Timothy D. Bechtel
3,
Vladimir V. Razevig
1,
Masaharu Inagaki
4,
Nikolay L. Gueorguiev
5 and
Ahmet Kizilay
6
1
Remote Sensing Laboratory, Bauman Moscow State Technical University, 105005 Moscow, Russia
2
Department of Information Engineering, University of Florence, 50139 Florence, Italy
3
Department of Earth & Environment, Franklin & Marshall College, Lancaster, PA 17604-3003, USA
4
Walnut Ltd., 1-19-13, Saiwaicho Tachikawa, Tokyo 190-0002, Japan
5
Bulgarian Academy of Sciences—IMSET, 1574 Sofia, Bulgaria
6
Electronics and Communications Engineering Department, Yildiz Technical University, Istanbul 34349, Turkey
*
Author to whom correspondence should be addressed.
Remote Sens. 2021, 13(17), 3487; https://0-doi-org.brum.beds.ac.uk/10.3390/rs13173487
Submission received: 5 August 2021 / Revised: 24 August 2021 / Accepted: 26 August 2021 / Published: 2 September 2021

Abstract

:
Holographic subsurface radar (HSR) is not currently in widespread usage. This is due to a historical perspective in the ground-penetrating radar (GPR) community that the high attenuation of electromagnetic waves in most media of interest and the inability to apply time-varying gain to the continuous-wave (CW) HSR signal preclude sufficient effective penetration depth. While it is true that the fundamental physics of HSR, with its use of a CW signal, does not allow amplification of later (i.e., deeper) arrivals in lossy media (as is possible with impulse subsurface radar (ISR)), HSR has distinct advantages. The most important of these is the ability to do shallow subsurface imaging with a resolution that is not possible with ISR. In addition, the design of an HSR system is simpler than for ISR due to the relatively low-tech transmitting and receiving antennae. This paper provides a review of the main principles of HSR through an optical analogy and describes possible algorithms for radar hologram reconstruction. We also present a review of the history of development of systems and applications of the RASCAN type, which is possibly the only commercially available holographic subsurface radar. Among the subsurface imaging and remote sensing applications considered are humanitarian demining, construction inspection, nondestructive testing of dielectric aerospace materials, surveys of historic architecture and artworks, paleontology, and security screening. Each application is illustrated with relevant data acquired in laboratory and/or field experiments.

1. Introduction

The earliest (1960s/1980s) subsurface radars were developed for electromagnetic detection of objects up to several meters below the ground surface [1,2,3]. This was dictated by the achievable (at that time) operational frequency range of 100 MHz to 500 MHz for impulse radar. Depth resolution in this band was limited to 0.5 m to 1 m in the common media of soils and freshwater ice [3]. These early applications coined the now widely used name ground-penetrating radar, or the abbreviation GPR. This abbreviation is still widely used, even though modern subsurface radars have developed much wider applications deserving of the more accurate name surface-penetrating radar [2] or subsurface interface radar (SIR) [4].
All types of so-called GPR can be divided into three categories by the characteristics of the emitted signal:
  • Time-domain impulse radars
  • Frequency-modulated continuous-wave radars
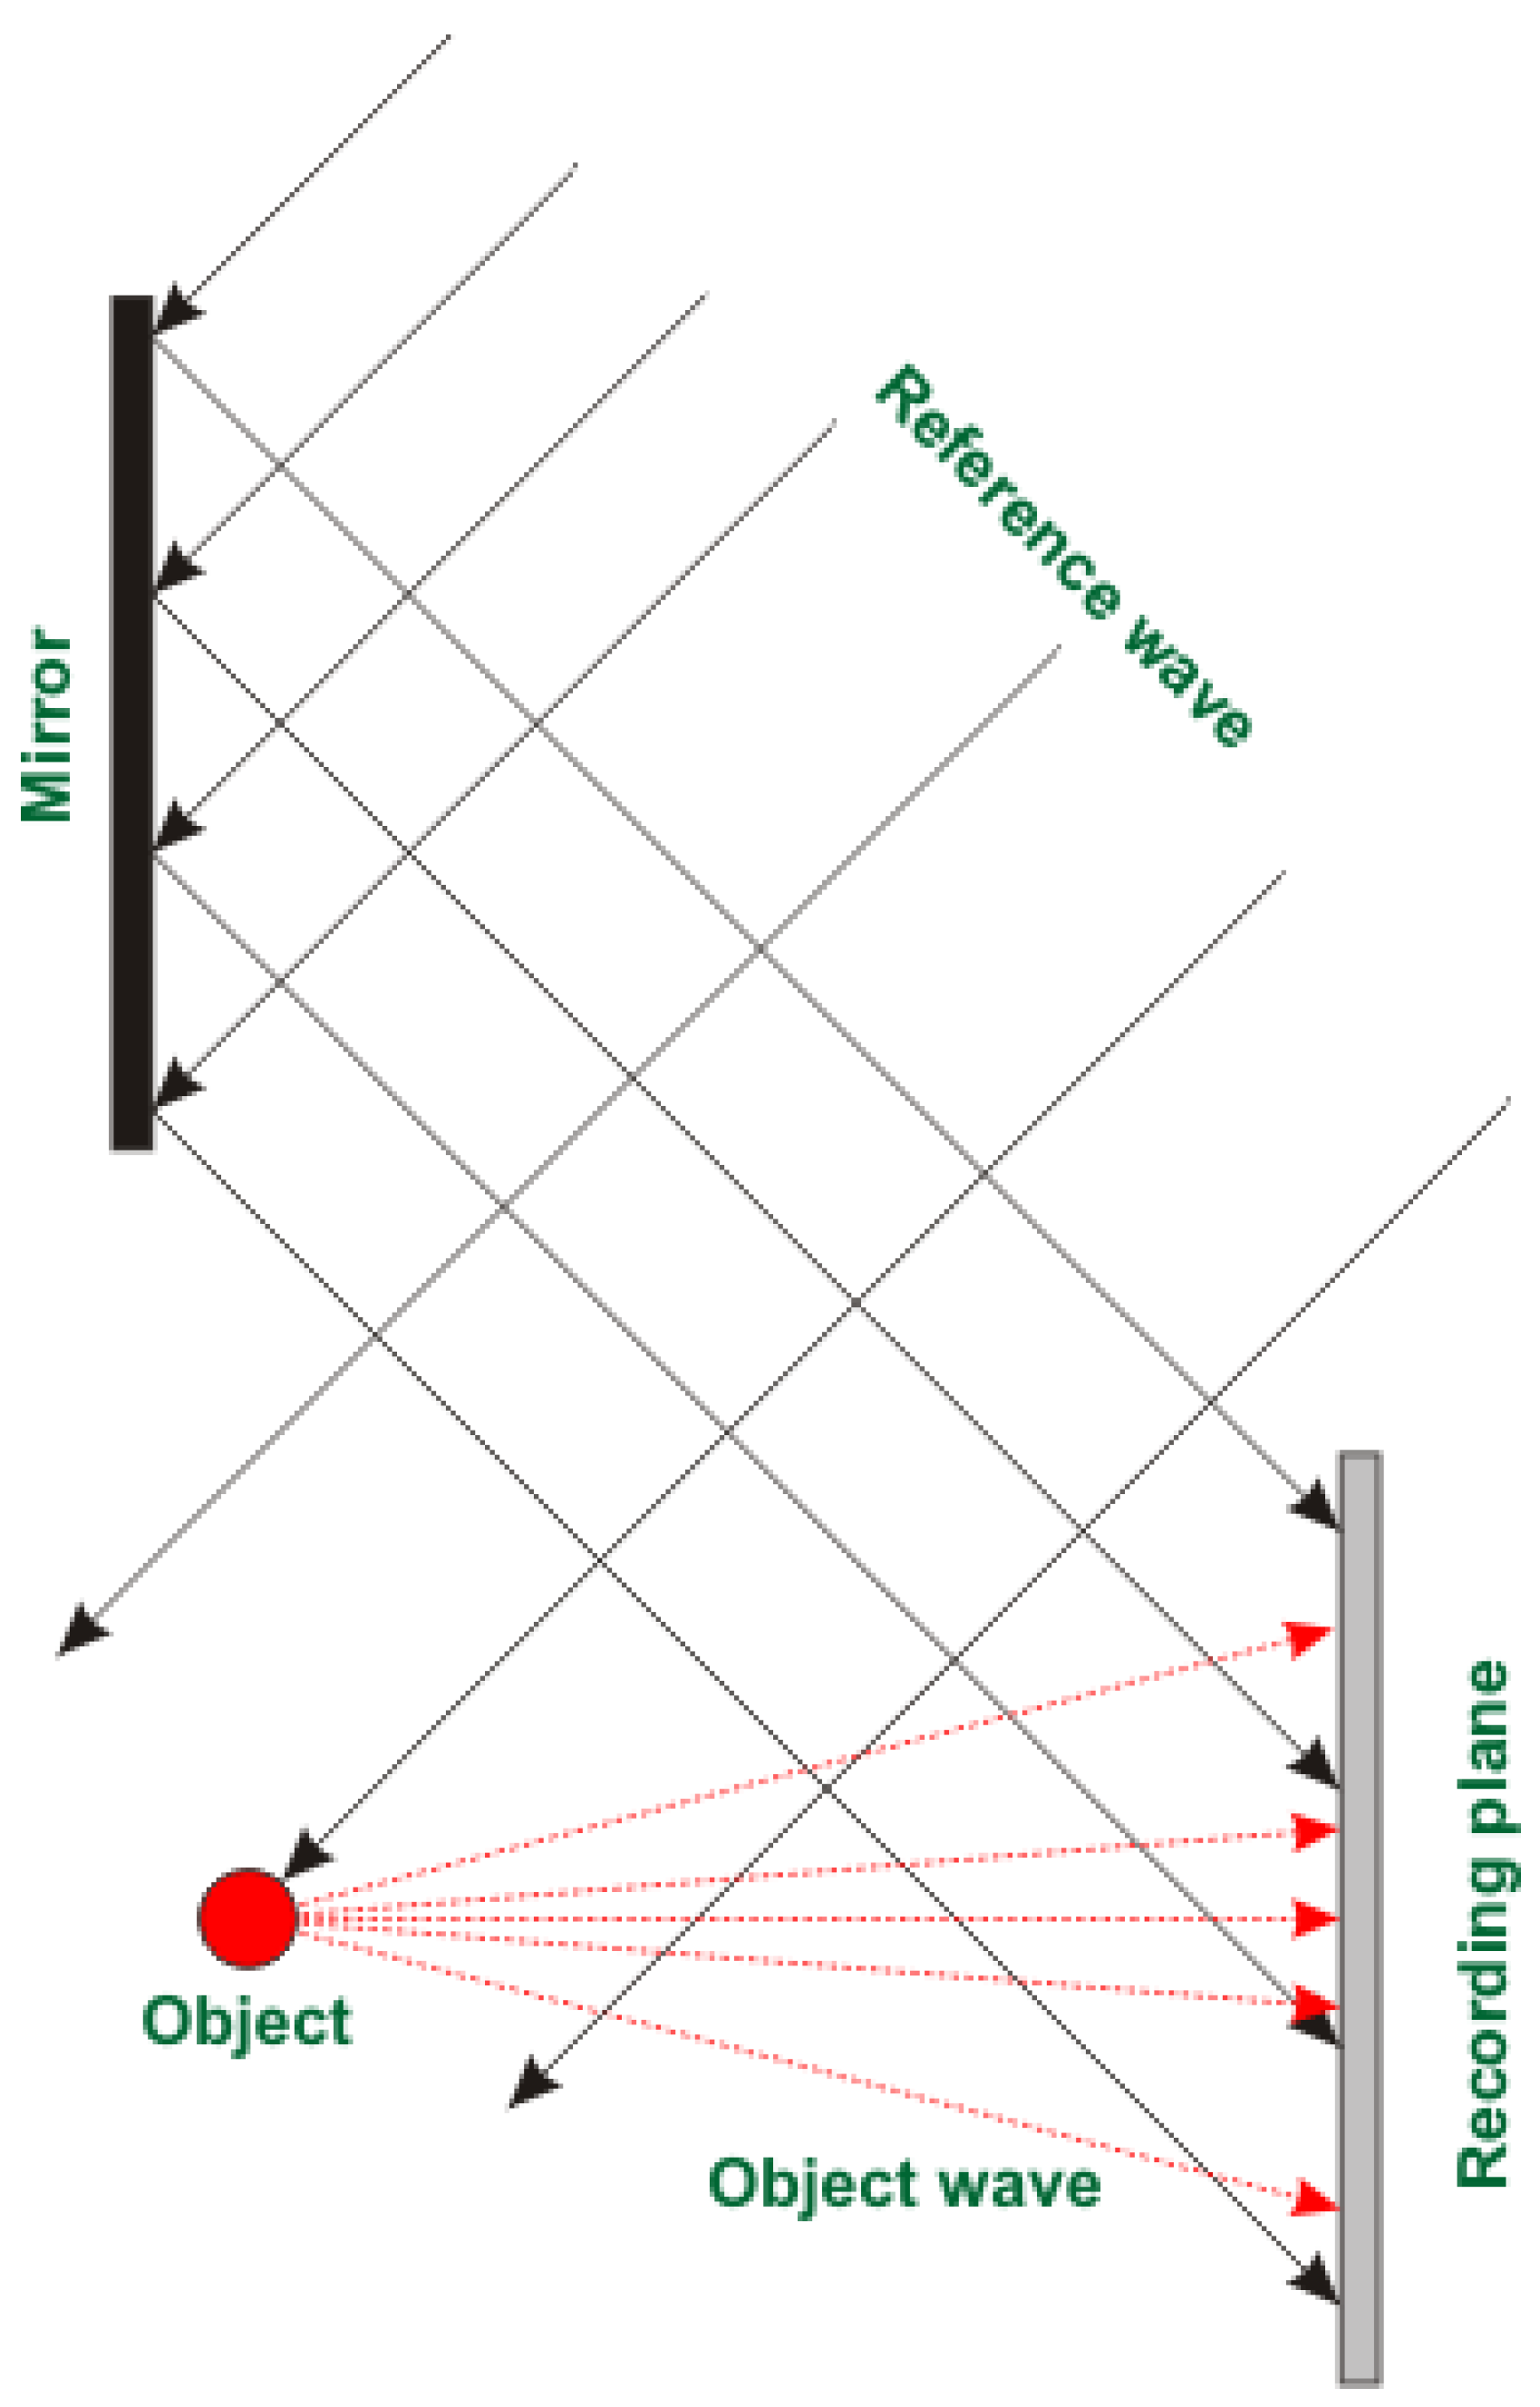
  • Holographic radars
This classification, as adapted from [2], is presented in Figure 1. The last type of subsurface radar—holographic subsurface radar (HSR)—is the topic of this review. Note that (contrary to the figure, and as described below) HST can also be multi-frequency.
In optics, the term “hologram” means an interference pattern between two electromagnetic waves, with one of them modulated by diffraction. The etymology of the term “hologram” comes from ancient Greek, with the meaning “whole description” or “whole picture”.
The first HSR may be the work of Keigo Iizuka, who, with only the rudimentary technology available in the late 1960s, used polaroid film to register holograms from signals in the millimeter range (frequency = 34 GHz) [5,6]. Due to technological limitations of the time, the first HSRs were continuous wave (CW), but it was immediately evident that for inspection of materials at great depth, signal attenuation was a serious limitation. In addition, due to the CW signal, it was not possible to compensate for attenuation with depth or distance by applying a time-varying gain using front-end electronics [2,7], as is possible for impulse subsurface radar (ISR). After later theoretical and experimental studies, a solution has been found for the realization of an HSR for inspecting low-loss media at shallow depths. The great advantage of this type of HSR is that it can record the amplitude of the interference pattern for each position of an antenna moving across the inspected surface, providing a subsurface image immediately upon completion of the scanning pattern. These images can be considered “real time” since they do not, in principle, need any processing; only a device for recording the composite interference pattern (i.e., the sensor plus memory). It will be shown that this type of radar achieves a good compromise in the trade-off between depth of investigation and spatial resolution in the image plane [8]. These characteristics of HSR (i.e., real time and high resolution) have, in particular, motivated considerable research on its use for military and humanitarian land mine detection and identification [9,10,11].
HSR differs from the two other types of GPR in that it provides (from the raw data) plan-view (as opposed to cross-sectional) radar images [8]. In this sense, HSR is analogous to the optical hologram technology first achieved by Gabor in 1948 [12]. Gabor’s method is illustrated for a point target hologram, as shown in Figure 2.
In this example, the interference between a plane wave incident perpendicular to the recording plane and the wave diffracted by the point reflector at a distance h from the plane can be recorded as a variation in amplitude by an analog or digital sensor. It is assumed by convention that the reference plane wave has constant phase and amplitude u0.
We denote by u(r) the distribution of the amplitude of the divergent hemispherical diffracted wave. This wave has an amplitude distribution defined by u1(r) on the recording plane. The variation of this amplitude on the plane forms the holographic image.
u ( r ) = u 1 ( r ) exp ( i φ ( r ) )
with phase φ given by
φ ( r ) = 2 π λ r 2 + h 2
where λ is the wavelength and r is the radius or distance on the recording plate from the axis of symmetry directly beneath the target. With interference of these two waves (uo and u), the image plane records an intensity distribution I [13,14]
I ( r ) = u 0 2 + u 1 2 ( r ) + u 0 u 1 ( r ) [ exp ( i φ ( r ) ) + exp ( i φ ( r ) ) ]
which describes a Fresnel zone plate [15] or interference pattern, as shown in the lower-right corner of Figure 2.
To reconstruct a hologram, the interference pattern is illuminated by a wave uor identical to the reference wave. So, directly behind the interference pattern, the distribution pattern or holographic image looks like
u p ( r , 0 ) = u 0 r [ u 0 2 + u 1 2 ( r ) ] + u 0 r u 0 u 1 ( r ) exp ( i φ ( r ) ) + u 0 r u 0 u 1 exp ( i φ ( r ) ) .
It is interesting to analyze the composition of the transmitted wave by evaluating the individual terms of Equation (4). The first term is the transmitted plane wave or reference, while the second and third terms correspond to the virtual and real images of the object, respectively.
Gabor’s method [13] had many limitations on the quality of images and presented complexities that make practical application difficult. Thanks to the invention of the laser and its rapid adoption in laboratories worldwide, a solution was proposed by Leith and Upatnieks [16], who solved the limitations of the Gabor system. Their method uses the coherence of incident laser light at a certain angle to the registration plate (or image plane), as shown in Figure 3. Subsequent innovations in optical holography have similarly involved the use of different combinations of mirrors and beam splitters.
The inclined reference wave configuration (Figure 3) is well suited to modern optical holography since the attenuation of air in the visible spectrum is negligible for the characteristic size of the system. In aerial or satellite remote sensing, HSR has been successful due to the low levels of attenuation and dispersion in clear air or a vacuum. However, for subsurface inspection of materials with much higher attenuation (i.e., lossy media), using typical operating frequencies below 1 GHz, applications have been limited. One of the areas where HSR has found successful applications is security. In fact, HSR scanners have been designed to detect concealed weapons at airport boarding gates in near real time [17,18].
Systems for optical holography and microwave (MW) or radar holography differ substantially in signal wavelength, and consequently the characteristic dimensions of the recording apparatus. This difference can be estimated by the ratio between the characteristic dimension of the system d and the signal wavelength λ. For an optical system, d/λ ≅ 106, while for HSR, it is <101 due to the high attenuation in lossy media requiring larger sources—almost comparable to the wavelength. Furthermore, the laws governing the propagation of electromagnetic waves also differ in the two cases: While the laws of geometric optics are valid for optical systems (see Figure 2 and Figure 3), these are not strictly valid for the analysis and development of HSR where attenuation, diffraction, and near-field coupling to the medium must be considered. Therefore, only the basic principles are common to optical holography and HSR. Nevertheless, the analogy is critical for understanding the physics of HSR, for interpretation of subsurface radar holograms, and for derivation of hologram reconstruction algorithms [8,19,20,21,22].
Although there are practical differences, it is interesting to compare optical holograms with HSR holograms. Gabor’s first published holograms [12] are presented in Figure 4. In Figure 4a (top left) is the original photomicrograph. Figure 4b (top right) is the micrograph directly photographed through the optical system used for reconstruction. The interference pattern is shown in Figure 4c (lower left). Finally, Figure 4d (lower right) shows the interference pattern illuminated to reconstruct the original, and the letters have become legible again.
To produce an MW analogy to Gabor’s original optical hologram, an HSR experiment was devised using a target of metallic letters affixed to a sheet of paper (Figure 5). The sheet with letters was covered by a 12 mm gypsum board and scanned with a CW RASCAN model HSR (4 GHz). Additional gypsum boards were added for subsequent scans, as shown in Figure 6.
To obtain an HSR image, it is necessary to perform accurate spatial sampling. Therefore, the holograms in Figure 6 were recorded as parallel lines with fixed spacing and fixed sampling step along lines. The radar head was swept manually along these parallel lines, with sampling triggered by an optical survey wheel [23]. To avoiding distortions in the HSR image, spatial sampling errors must be much smaller than the signal wavelength in the scanned medium. The time to complete a scan depends on the size of the area and the number (spacing) of raster lines. Typically, for a 4 GHz RASCAN HSR, the distance between the parallel lines is 0.5 cm, and this value is also used for the spatial sampling along the lines for a pixel size of 0.5 cm × 0.5 cm. This is a compromise between scan time and image quality, but it is also necessary to consider the spatial resolution of the radar at the depths of investigation, which in turn depends on the type of antenna and signal frequency [24].
In Figure 6, we show eight MW holograms recorded at 4 GHz frequency [8] and different depths (numbers of covering gypsum plates).
The first three images correspond to target depth increasing using one, two, and three gypsum plates. It can be seen the word “RASCAN” remains legible. When the thickness of the gypsum plates goes to four and above, the letters become increasingly blurred. This is due to first principles of the propagation of electromagnetic waves: At shallow depth, the reflection to the nadir from the metal surface of the letters has high amplitude—greater than the level of the reference signal and other oblique reflections (off-nadir).
At greater depth (thickness), the radar antenna, due to its directivity, receives off-nadir reflections from the metal letters and the signal level begins approach the reference level—see Equation (4). This phenomenon also explains the non-uniformity of the brightness (amplitude) of the letters, which manifests as an undulation. At the maximum depth of about 10 cm obtained by stacking 10 gypsum plates, the image of the hologram obtained with the RASCAN radar resembles the optical hologram of Gabor. The comparison of the images shown in Figure 4 and Figure 6 shows, albeit qualitatively, the differences between holograms in the optical and MW spectra. Due to the different ratios between characteristic dimensions and wavelength for these holograms, the number of visible Fresnel zones varies greatly, from 3 to 4 orders or more for these two types of holograms.
When using HSRs for soil inspection, the medium may have low attenuation when dry and sandy but may also have high dispersion. The variability in the dielectric properties of these natural materials has a great influence on the quality of radar holograms. Experiments have shown that in many cases, this variability makes the interpretation of holograms impossible. These studies, both theoretical and experimental, for the investigation of soils are available in various publications [7,13,19,20,25]. Since the attenuation and heterogeneity of the medium and the scale of roughness of the surface limit the maximum effective depth of penetration for HSR, the main advantage of ISR is the ability to investigate greater depths, while maintaining a high contrast and signal-to-noise ratio, thanks to the time-varying gain in a stroboscopic receiver, which amplifies deeper reflected signals that have a longer time of flight (TOF). In a CW radar system, it is not possible to discriminate reflections by their TOF, so applications for HSR are limited to reduced depths.
At the shallow depths where HSR is applicable, its main advantage is the ability to record images that have higher resolution in plan view than ISR because of the compactness of the antenna and the easy selection of frequency. High resolution in plan view at shallow depths is extremely important for many applications, including diagnostics of composite materials in aerospace and other industries [26,27,28,29,30,31,32,33,34]; determination of building details and constructions, including cultural heritage monuments [35,36,37,38,39]; archaeological and paleontological imaging [40,41,42]; land mine detection and discrimination [9,10,11,43,44,45,46]; security systems [47,48,49,50,51,52,53]; detection of wood-boring insect damage [54]; and medical imaging [55,56,57,58].

2. HSR Design and Image Reconstruction

The main problem in designing a holographic subsurface radar is selection of the reference signal. Usually, the emitted signal is used, but the simplest way is to produce a coupling signal between the transmitter and receiver antennae. This requires an antenna appliance that can guarantee the independence of the phase and amplitude of this coupling signal from properties of the sounding surface and heterogeneities in the medium. To achieve this, for the RASCAN-type radar, the antennae are mounted in a round, open-ended waveguide, as in Figure 7 [8,59,60].
Initially, two receivers were used, for parallel polarization and cross-polarization, with both recorded simultaneously for several frequencies [39]. The recording of cross-polarization enhanced detection of elongate targets by reducing the influence of the angle between the long axis of the object and the plane of the receiving antenna feed.
This scheme is simple, but it allows recording of only amplitude radar holograms. This is sufficient when registering holograms in media with a high dielectric constant ε and a high level of attenuation of electromagnetic waves [19,20], which produces no outer Fresnel zones in the recorded image (see Figure 8) [47]. For such images, digital reconstruction of the radar hologram does not significantly improve the image. The interference pattern alone provides a good approximation of the target shape in plain view.
Another feature of images recorded at cross-polarization is the asymmetry of point targets, as in Figure 9a. In this case, the interference pattern depends on the orientation of the antenna. However, at parallel polarization (Figure 9b), the symmetrical concentric circles in the interference pattern are directly analogous to the optical image in Figure 2.
RASCAN-style HSR has been designed with programmable electronics capable of emitting a sequence of discrete frequencies (up to a maximum of 5). This multi-frequency operating mode is fundamental for a CW HSR since the phase difference between the sinusoidal reference and object waves for a target at a certain depth can result in zero amplitude in the hologram. In fact, for a given frequency and a medium with a constant propagation speed, there will be cyclically repeating distances (depths) that provide a phase that cancels the sinusoidal function and therefore the detection of the object [61]. The effect of changes in contrast with frequency is demonstrated in an animation in [62]. This animation recorded by RASCAN HSR presents a multi-frequency hologram of a rectangular Soviet PTM-3 antitank (AT) mine buried in sand. Each frame of the animation corresponds to a selected frequency of the radar. Note that there are frequencies at which the mine is clearly visible and others where it nearly disappears. Recording at discrete frequencies within the antenna band [63,64] ensures that any reflective target will appear in an image for at least at one frequency.
Mathematically, this phenomenon can be expressed by considering a reflector (target) plane perpendicular to the propagation direction of the incident electromagnetic wave generated by the holographic antenna. The waves emitted by the HSR have a constant frequency ω, but amplitude and phase that are not constant over time. Ar is defined as the amplitude of the reflected wave of constant value, and with phase φr depending on the depth of the plane reflector.
φ r = 2 ε l ω c + Δ φ
where Δφ is the phase shift that arises upon reflection of the electromagnetic wave from the object, ε is the dielectric permittivity of the medium, l is the distance to the object, ω is the angular frequency, and c is the speed of light. Thus, the reflected signal as a function of time t can be written as
Ar cos(ωt + φr)
The reflected wave (Equation (6)) mixes with a constant-phase radar reference signal of the form
Ao cos(ωt + φo),
where Ao and φo are the amplitude and phase of the reference signal, respectively. The reflected signal (Equation (6)) is mixed with the radar reference signal (Equation (7)) at the receiver. The amplitude of the signal in the mixer output at the difference frequency is given by
Ar Ao cos(φoφr).
From this relation, one can conclude that if the phase shift between the reference signal and the reflected one is close to
φo − φr = (k + 1/2) π, k = 0, 1, 2, …
the level of recorded signal from the object is low, and at
φo − φr = kπ, k = 0, 1, 2, …
the recorded signal level is maximal. To avoid “blind” depths, the original RASCAN-type HSR used multiple discrete frequencies across a bandwidth that ensured high target contrast for one or more images [63].
Typical surveyed media (soils, concrete, etc.), often have a relatively high dielectric constant due to moisture content. This also enhances electrical conductivity, and therefore attenuation, so that the outer Fresnel zones of the holographic interference pattern are suppressed—sometimes to the point where only reflections in nadir are recorded. In these cases, the interference pattern strongly resembles the footprint of the target, and no image processing is needed [19,20].
However, for media with a high degree of transparency for MWs and a low level of ε, reconstruction of the hologram from a relatively complete interference pattern significantly improves the quality and resolution of HSR images [21]. To achieve this, a modification of the HSR (RASCAN-5) with accompanying software was developed (Figure 10). The general layout of the radar antenna was retained, but the cross-polarized antenna channel was eliminated, and the generator signal was used as a reference signal. This allows recording of complex MW holograms of hidden objects. The radar antenna head containing both transmitter and receiver is connected via cable to a microcontroller unit with a USB link to an ordinary PC. The microcontroller unit drives the transmitter and receiver, digitizes data, and transmits them to the computer.
RASCAN-5 allows the acquisition of complex holograms. In low-loss media, where the outer fringes of the interference pattern are retained, the raw image is (somewhat paradoxically) poor. However, in these cases, hologram reconstruction algorithms can be adopted [21,50,65,66,67,68,69]. These make it possible to focus/improve the resolution of the HSR images at selected depths of investigation. For example, Figure 11 illustrates the data acquisition method for reconstructing the MW hologram of an object that has a 2D shape at a depth z0.
The target is assumed to be flat, parallel to the scanning plane, lying at a constant depth z0. The key relationships can be summarized as follows:
F ( k x , k y ) = 1 ( 2 π ) 2 E ( x , y ) e i ( k x x + k y y ) d x d y
S ( k x , k y , z 0 ) = F ( k x , k y ) e i 4 ( ω ε / c ) 2 k x 2 k e 2 z 0  
E R ( x , y , z 0 ) = S ( k x , k y , z 0 ) e i ( k x x + k y y ) d k x d k y  
where E (x, y) is the recorded hologram. E (x, y) represents a complex quantity whose values are sampled by the holographic antenna on the scanning surface at z = 0. Applying the Fourier transform to E (x, y) in the space domain (x, y), we obtain the distribution F (kx, ky), which is the spectrum of the plane waves of the hologram, and kx and ky represent the wave numbers corresponding to x and y, respectively. At a different coordinate z0 or a parallel plane, it is possible to calculate the spectrum of the plane waves of the hologram S (kx, ky, z0). From the latter, by means of the inverse Fourier transform, we can obtain ER (x, y, z0), which represents the holographic image for z = z0. The mathematical formulation of the calculation process is described by Equations (11)–(13).
Since HSR is CW, target depths cannot be calculated from known wave propagation speed and TOF. However, depth can be estimated empirically by reconstructing ER (x, y, z0) for a range of z0 values, with the best focus occurring at a good approximation for the target depth. In general, the determination of the depth of a buried object through measurements with either ISR or HSR is typically a difficult problem requiring the solution of an inverse and ill-posed problem [70]. Another reconstruction algorithm based on Green’s formula was proposed in [70]. Kirchhoff approximation [71] and less strict empirical algorithms used for the reconstruction of MW holograms of land mines are described in [44,72].
Often, scanning is performed on an uneven surface, which distorts HSR images. This is especially true when detecting plastic-cased land mines that may have low dielectric contrast with soils and are located close to the (potentially uneven) scanned surface. The problem of reconstructing MW holograms for media with an uneven surface is considered in [73,74,75].

3. Main Applications of Holographic Subsurface Radars

The greater effective sounding depth of ISR has led to its dominance in the GPR industry [76,77]. However, HSR is preferred in specialty or niche applications requiring high resolution at only shallow depths. Thus, the early development and testing of HSR focused on application to land mine detection [45,78], and mapping of plastic and metal pipes in concrete floors [7,31]. Twenty years of further research has expanded the applications for HSRs, many of which are described in [79] with diverse examples below.

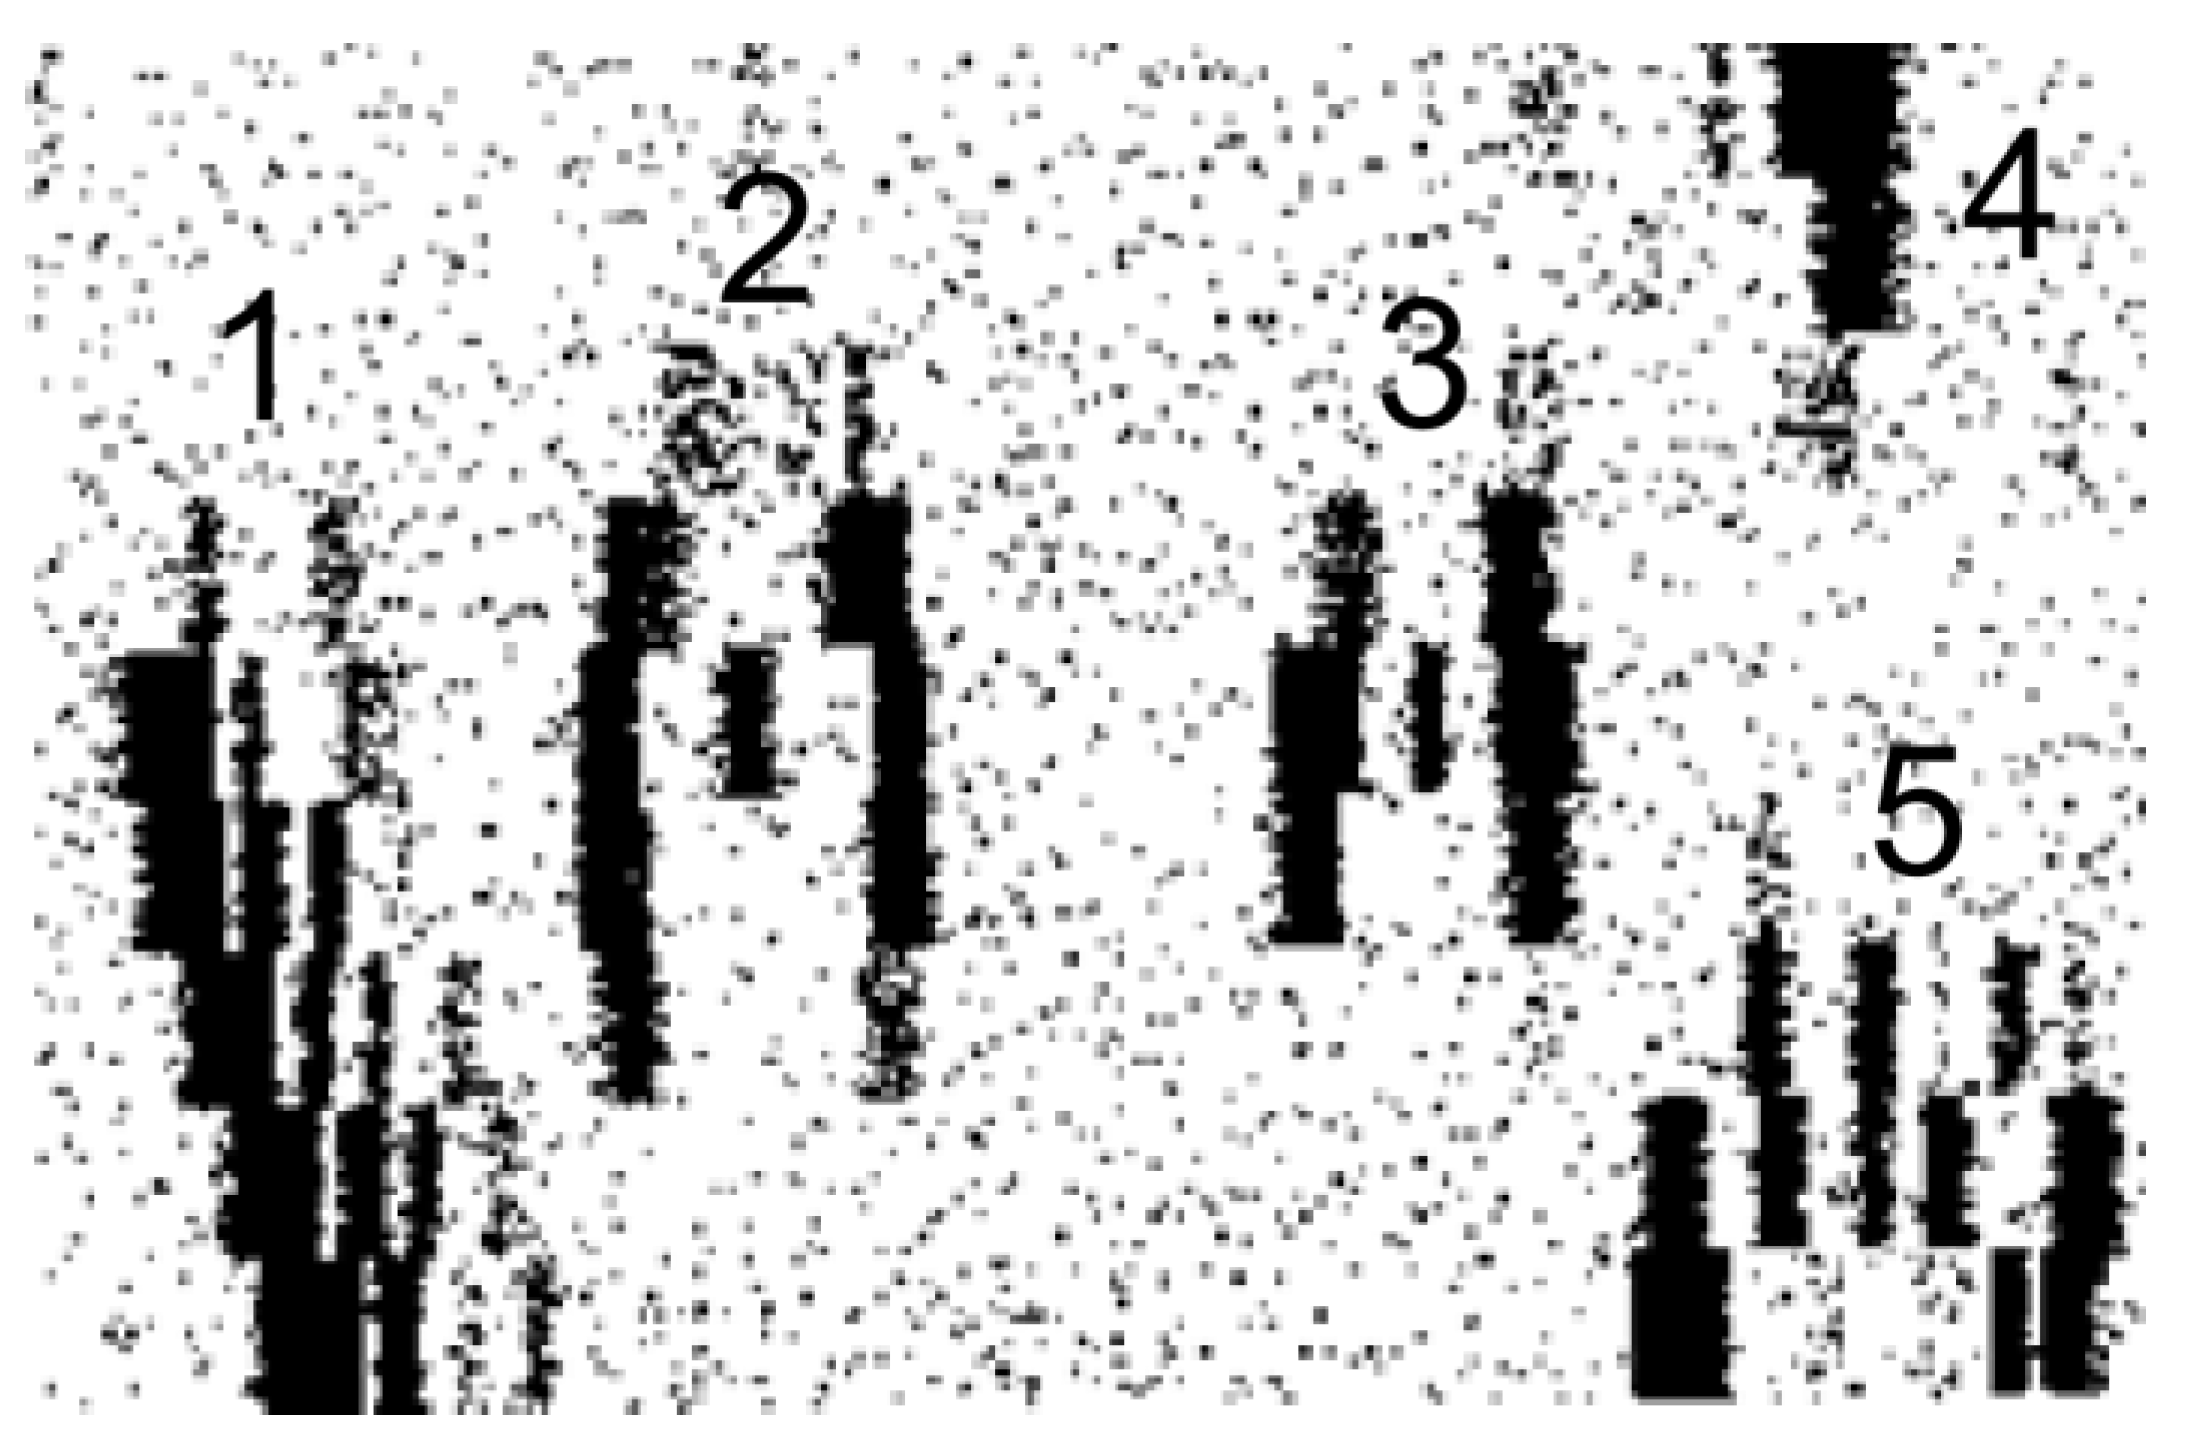
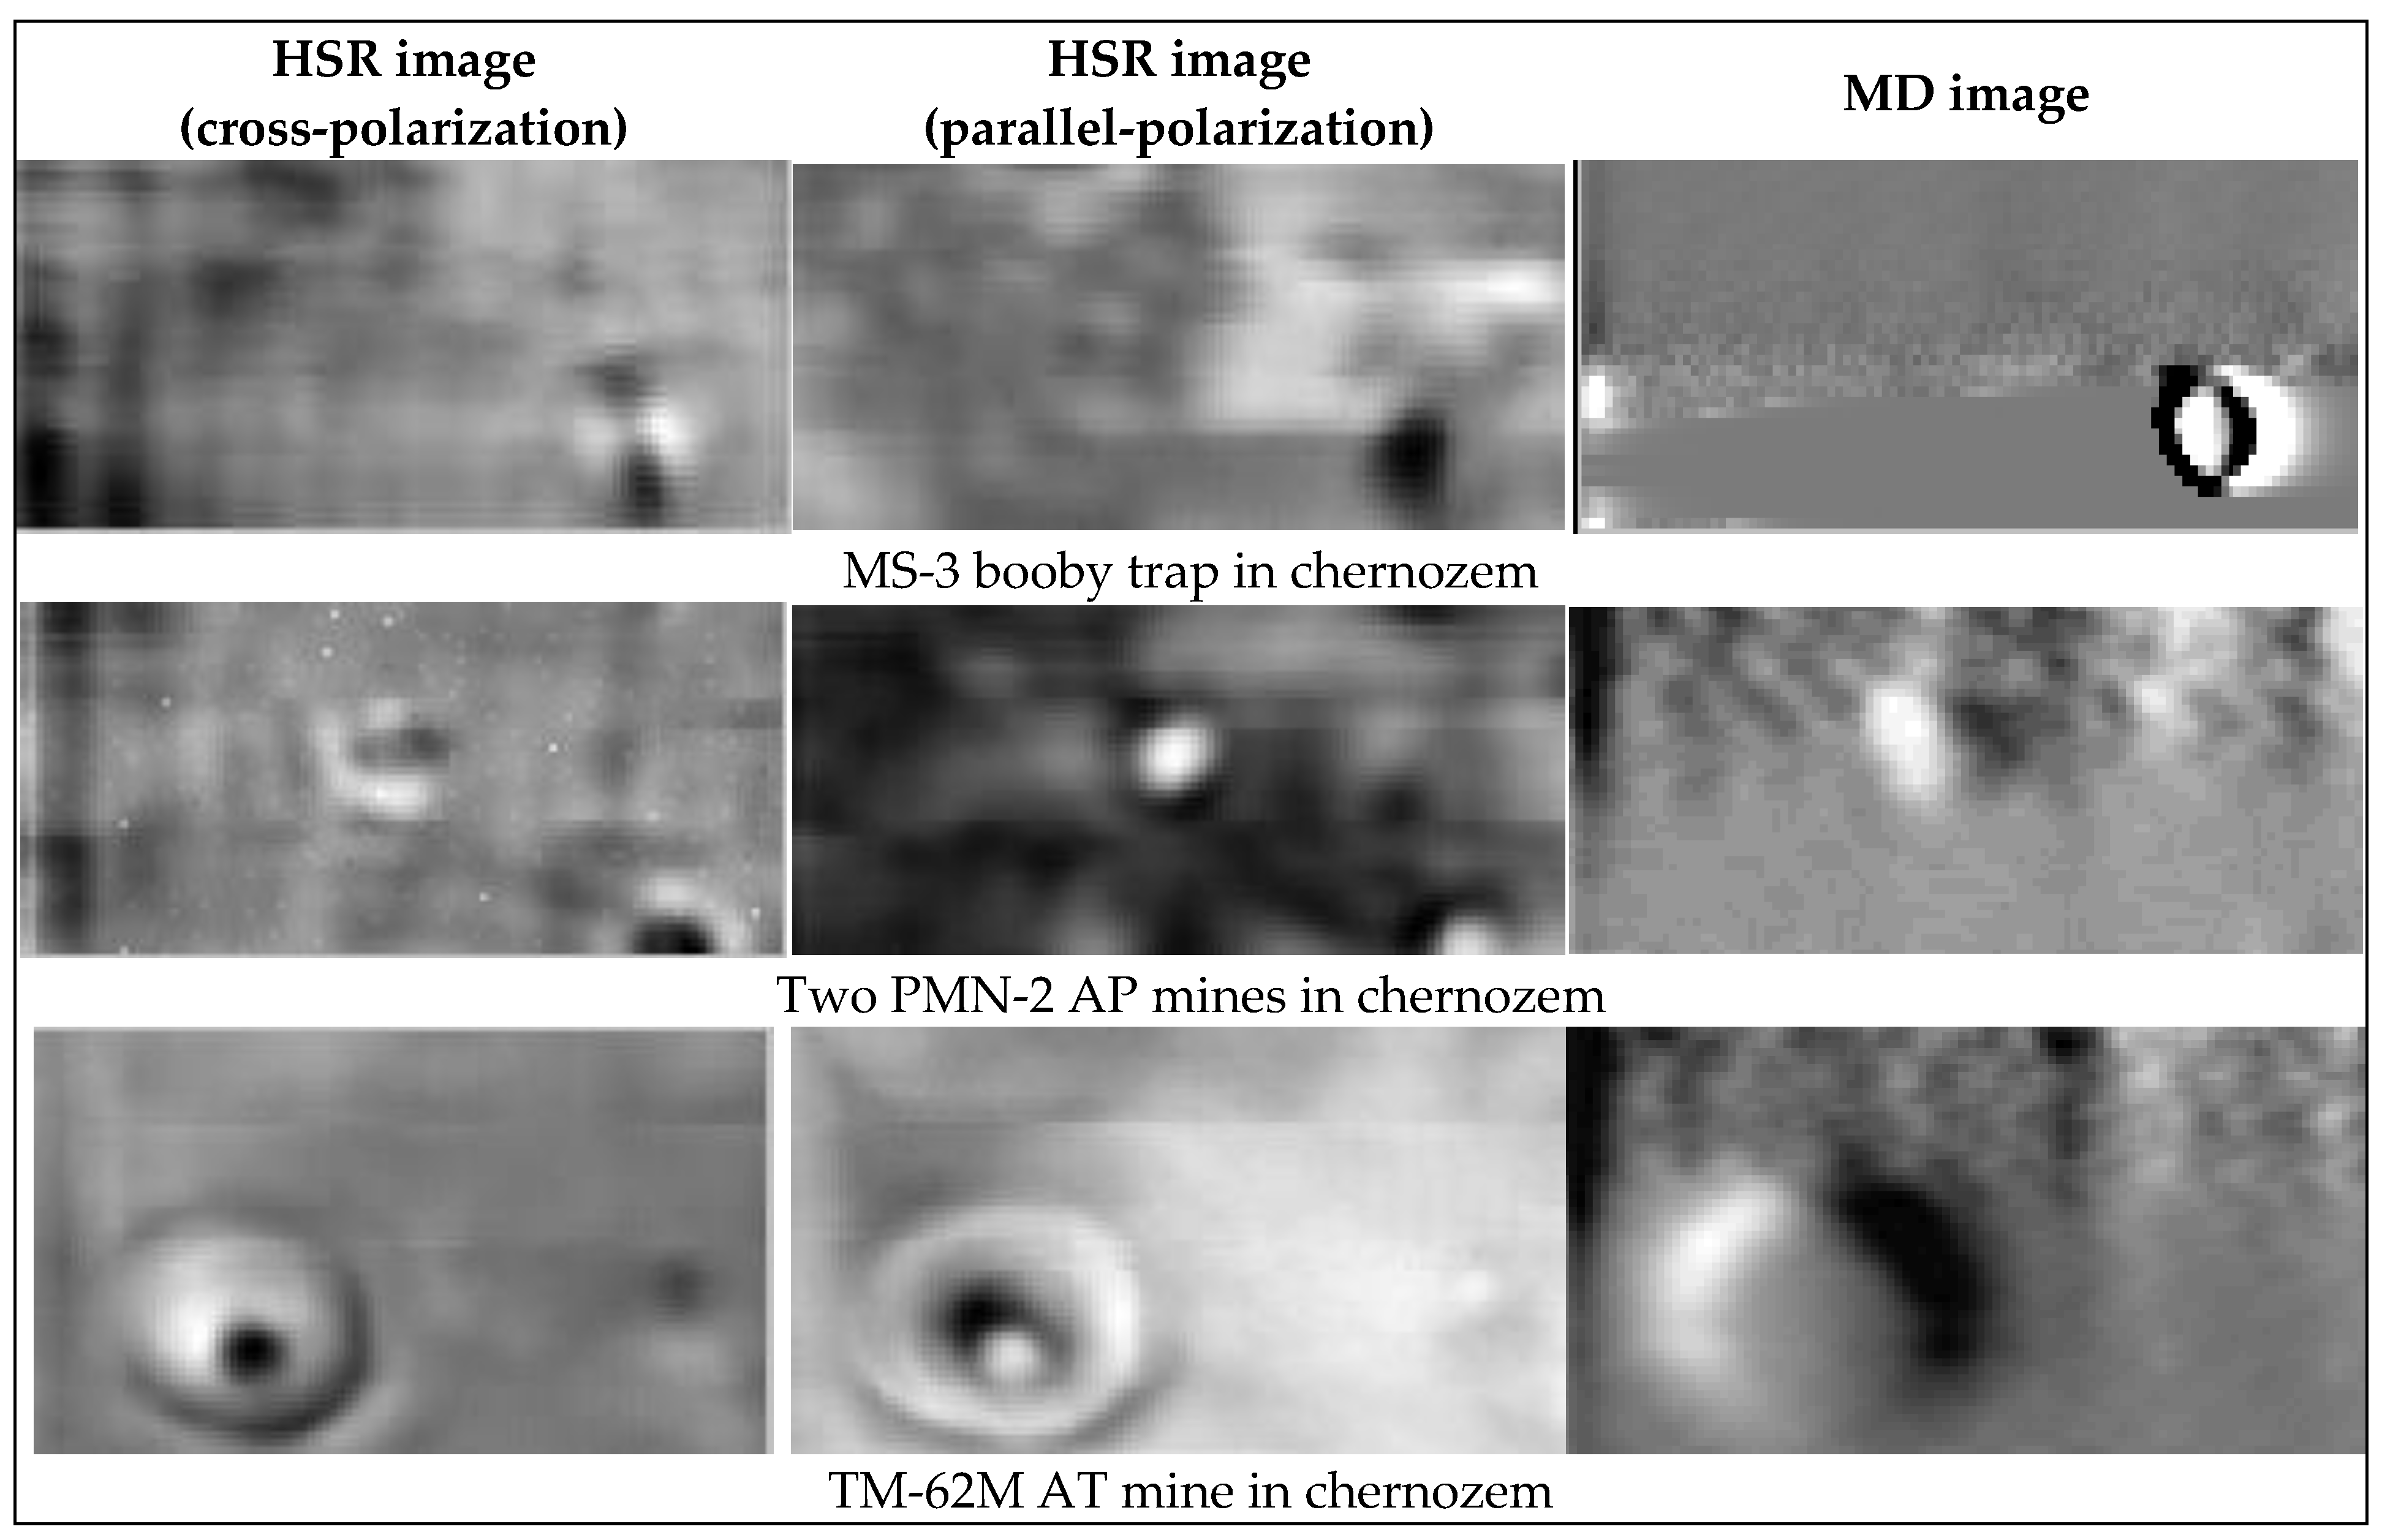
3.1. Land Mine Detection

In the latter two-thirds of the 20th century, conflicts all over the world were characterized by widespread use of both antipersonnel (AP) and antitank (AT) mines. From the 1960s onward, a significant proportion of deployed mines had plastic casings, and some had almost no metal, making them difficult to detect. Although use has declined since the 1998 Ottawa mine ban treaty, an estimated tens of millions remain in over 60 countries worldwide. According to the Landmine Monitor, global mine casualties reached a minimum in 2013, and have risen steadily since [80]. Armed conflicts involving mines continue in places such as Afghanistan, Iraq, Mali, Libya, Myanmar, Nigeria, Syria, Ukraine, and Nagorno-Karabakh. According to UN estimates, the average cost for demining is about $0.6/m2, with a daily coverage for a single operator of between 10 m2 and 20 m2 [81,82]. Casualties during demining are variable and unfortunately high, approaching one to two deaths for every 1000 min removed.
The widespread introduction of first wood- and then plastic-bodied and minimal-metal mines in the second half of the 20th century (starting with the infamous Schu-42 and PMD-6M in WWII) made metal detectors (MDs) ineffective. By the 1980s, significant research began on the use of radio waves to detect mines based on variations in the dielectric constant ε of the soil caused by the installation or presence of a mine [45].
The main problem with using radio-frequency devices for detecting plastic mines with low dielectric contrast with soil is a high level of false alarms caused by soil inhomogeneities and/or an uneven ground surface. Experience shows that with a false alarm rate of 1 to 2 per m2, a sapper will reject any high-tech device and work with a simple probing spike—which is dangerous because it puts the sapper close to potential explosive devices and may trigger sensitive ones. One of the ways to reduce the level of false alarms is to obtain an image of a target while it is still in the ground—allowing discrimination of actual mines from soil inhomogeneities [46,78,82].
Figure 12 depicts a laboratory setup of a wide-span mine detection system designed in the late 1980s [45,46] consisting of five standard 600 MHz CW mine detector sensors (not yet called HSRs but quite similar in principle). The advantages of wide-span systems include higher scanning efficiency and the reduction of false alarms through recording of accurate images due to the fixed geometry of the sensors. This system was able to distinguish soil heterogeneities from mines and could discriminate AT (20-cm- to 30-cm-diameter) from AP (7-cm- to 12-cm-diameter) mines [83].
The wide-span mine detector in Figure 12 has a scanning swath width of 2 m and is suspended over a 6 m test bed containing 1.5 m of soil. Figure 13 shows one of the first tests of the radar array: an image of a metal pipe (labeled 1), two AT mines (metal casing TM-62M labeled 2 and plastic casing TC-6 labeled 3), #4 is a brick, and #5, a 30 cm × 30 cm sheet metal plate. The depths of these objects vary from 5 cm to 10 cm.
The radar images in Figure 13 show in black-and-white the amplitude of the signals reflected and recorded with the MW antenna array. The image of a mine has two opposing arcs perpendicular to the direction of the array movement reflections from the cylindrical body), with an intense reflection in the center (the raised detonator). The characteristic response for 2 and 3 allows discrimination of the mines from clutter objects 1, 4, and 5, and the estimated diameter of 20 cm to 30 cm is consistent with AT mines. Further testing of such scanning systems has shown that they tolerate well the effects of soil inhomogeneities.
A spatial filtering algorithm has been developed and tested that identifies buried mines by the characteristic shape of their response on MW images. A simple correlation filter is used with a recognition matrix Fj,n, which depends on the shape and dimensions of the selected targets [45,46].
F j , n = f j , n = 011100001110 111001100111 011100001110 ;   n = 1 , 2 12 j = 1 , 2 , 3
The following algorithm then provides target recognition. This describes the relation between each element of the radar image brightness matrix m i , k and the element of the matrix f i , k , which is calculated as follows:
l i , k = Θ ( j = 1 3 n = 1 12 f j , n m i + j 2 , k + n 5 p )
where p is the value of the detection threshold.
The function Θ(x) in Equation (15) is determined as follows:
Θ ( x ) = 0 ;   a t   x 0 1 ;   a t   x > 0
In addition, it should be noted that the calculated values of the matrix M = m i , k may go beyond the region where it is defined. In this case, the corresponding values of the matrix are taken to be zero.
The proposed algorithm made it possible to recognize both AT and AP mines in this experimental setup. Considering the relative crudeness of computers and displays, and the general novelty of using computers to evaluate image data in the late 1980s, these results were encouraging.
Development of HSRs of the RASCAN progressed in the mid-1990s [78]. The design of these was quite simple and could be easily adapted to any desired frequency range. The prototype of a wide-span mine detector MiRascan included elements for detecting five frequencies of HSR in two orthogonal polarizations, and a metal detector (MD) [78]. The sensors were installed on a cart, which was driven by a stand-off operator using a control box connected by an umbilical cord (Figure 14a). A block diagram of the MiRascan radar with MD is presented in Figure 14b.
The radar operated at five CW frequencies (cycled in sequence) in the range of 1.6 through 2.0 GHz with parallel- and cross-polarized receivers and transmitted unmodulated signals at each frequency. Its signals were received in two polarizations. The emitted power was only 10 mW, providing complete safety for the operator. A 2 MHz induction loop MD was located on the 120 mm aperture of the radar, providing coincident HSR and MD images. The cyclical recording of signals at each frequency and both polarizations of HSR and from the MD was realized at a high rate, while the sensor head was electromechanically swept side-to-side as the entire system advanced at a rate of 0.17 m/min along a 112-cm-wide lane.
Inert Soviet TM-62M and PTM-3 and Italian TC-6.1 metal-cased AT mines were used in testing MiRascan. Testing on plastic-cased AT mines used the Italian TC-2.5 and Soviet TM-62PZ. As examples of AP mines, Soviet plastic-cased PMN-2 mines were used, as well as a plastic-body MS-3 booby trap. All these mines are shown in Figure 15.
The experiments to detect and identify inert plastic- and metal-cased mines were conducted under realistic conditions in a special military test ground near Moscow. The proving ground had sites with several characteristic soils: sand, chernozem, loam, etc. This ensured testing across wide variations in soil dielectric properties. To research the impact of moisture content on the quality of HSR images received by the different channels, tests were conducted under differing weather conditions: both during hot/dry periods and following rain events.
Since many mine fields are in populated areas and/or former conflict zones, human debris and shrapnel (clutter) produce false alarms that greatly outnumber actual explosive threats. To test discrimination between mines and clutter, glass and plastic bottles (empty and filled with water) were buried in the test bed. The AT mines and bottles were laid in the ground at a depth of 5 cm to 10 cm and the AP mines at a depth of 1 cm to 5 cm.
The experimental results are shown in Figure 16 for two polarizations of HSR and MD. Although HSR images were recorded at five discrete frequencies, only the most distinct image is shown for each polarization. The high MD contrast for the plastic-bodied MS-3 booby trap (top right image) is due to the presence of a metal retaining ring around the casing.
In the second row of Figure 16, two PMN-2 AP mines are shown. Both appear clearly in HSR, but only the upper one shows on MD because the metal arming pin has not been pulled as it has for the lower one. The metal-cased TM-62M AT mine in the third row of Figure 16 displays a clear round footprint in all channels, with the raised pressure plate clearly visible on HSR. The bottom row presents the images of glass (top of each image) and plastic (bottom of each image) bottles filled with water. Since the bottles have no metal, there is no MD image. It is worth noting that in the years after this test, approaches that merge or fuse two sensor outputs were adopted for other dual-sensor mine detectors such as Minehound [84] and ALIS [82].
Later experiments with higher-frequency RASCAN radar provided further MW holograms of explosive devices, as shown in Figure 17 [85]. The items were buried horizontally in a sand test bed and scanned with at a frequency of 3.8 GHz. In general, large explosive objects are buried at varying depths, as in the case, for example, the ends of the object ranged from 0 to about 8 cm. In particular, the rocket’s fins were almost exposed, while the cylindrical body was about 7 cm deep. The thickest part of the 8 cm shell body was on the surface, with the fins at about 4 cm and the thinnest part of the body at 7 cm or 8 cm. This information is used to understand how the various parts of the body reflect plane waves, and the figures shown show the wave nature of the HSR interference pattern. However, considering the response of the first lobe of the interference pattern, the 2D images faithfully reproduce the shape and size of the real target, even though the 3D reconstruction of the hologram from the recorded interference pattern has not been performed.
It has been shown that HSR images of mines are sufficiently distinct from common clutter items and that they can be discriminated using a machine learning neural network approach. In a study using a cylindrical mine simulant and four clutter objects (rock, crushed can, shell casing, and segment of barbed wired), a neural network was trained to identify in any HSR image the mine with a 100% detection rate and zero false alarms [86].
HSRs of other designs intended for mine detection have been described in [10,11,44]. The operational frequency for these radars is 2 GHz. In most conditions, this seems to be the optimal frequency for land mine detection [78,87]. The HSR for mine detection using a spiral scanning method [10] is shown in Figure 18. The device is attached to a rail rotating around the mounting axis, as shown in Figure 18b, and records the MW hologram in polar coordinates.
The advantage of this scanning method is its relative simplicity and higher productivity in comparison with a rectangular grid, while the disadvantage is the presence of a blind zone in the center of the scan, as well as the necessity to place the central pivot within a potentially mined area. So, it is difficult to imagine how to use this technology in actual field conditions.
The simple and compact design of the RASCAN HSR suggested another approach for alleviating the burden of manual scanning using a robotic scanner (Figure 19) with simple architecture for sweeping the radar antenna across the path of the robot as it advances incrementally [88].
Further advances came with integration of a one transmitter (Tx)—four receiver (Rx) ISR (2 GHz) for rapid detection of buried objects and calculation of their cartesian coordinates and an HSR (1.97 GHz, similar to that described proposed in [59], used in [78], and depicted in Figure 7) for object imaging and classification to reduce false alarms. The system (Figure 20) also has a 3D video camera that records a digital elevation model (DEM) of the area scanned by the HSR [87,89]. As shown in Figure 20, all sensors were mounted on a commercial robotic platform (Clearpath Jackal). Note that all of the radars described above used practically the same CW frequency or impulse center frequency of 2 GHz. This is based on field testing of the electromagnetic properties of soils near the conflict zone in eastern Ukraine [87], which was the initial focus for the development of this system. For the chernozem soils of this region, 2 GHz provides sufficient resolution to detect and discriminate land mines, while maintaining a sufficient sounding depth of 5 cm to 20 cm.
Demining is complicated by the widespread occurrence of small, plastic-cased AP mines, which, due to their sometimes insignificant signature on both radars and MDs, are easily indistinguishable from reflections from soil irregularities. Scientific experiments, as a rule, are carried out in controlled conditions with more or less homogeneous soil and a relatively flat ground surface. Figure 21 shows the conditions of real minefields. These circumstances need to be comprehended in further design of MW devices and algorithms for mine detection and discrimination.
There are several methods for filtering out false reflections from surface relief. For ultrawide-band (UWB) ISR, this can be done by gating the reflected signal by range or by other methods using the high spatial resolution of UWB radars [73,90,91]. For HSR, this cannot be used, since the signal is CW, either monochromatic [10,87] or multi-frequency [31], which is insufficient to obtain the required range resolution. One of the possible ways to solve this problem for HSR is using an additional video sensor [74,92].
In the first case [74], it was proposed to suppress the uneven surface influence using a reconstruction method (modified back-propagation) that incorporates a DEM collected by a video sensor. The utility of this approach was illustrated experimentally by comparing MW images reconstructed with the DEM against the same images realized using traditional back-propagation methods assuming a homogeneous ground with a planar surface. Accurate positioning of the HSR sensor was obtained using a webcam video and a graphic contrast augmented reality (AR) marker; this solution [93] allows the acquisition of interference pattern samples at a great number of arbitrary positions to investigate a volume. To calculate the radar position, the physical coordinates of the AR marker angles are corrected with their geometric projections on the webcam image. With the information on the 3D coordinates of each sample, it was possible to adopt a rear projection algorithm for the reconstruction of the MW image. By introducing the concept of AR, it is possible to superimpose the visual image of the scanned area onto the MW image, eliminating the need to georeference the radar image (although this is still possible and often desirable).
This method for incorporating surface relief is important for demining but also lends itself to other applications, such as detection of objects hidden under clothing or scanning of non-flat surfaces (arched ceilings, columns, statues, etc.). It should be noted that the high sensitivity of HSR to reflections from surface irregularities can also be useful in applications where surface defects themselves are to be detected. As, for example, when detecting surface defects on metals [93,94,95].

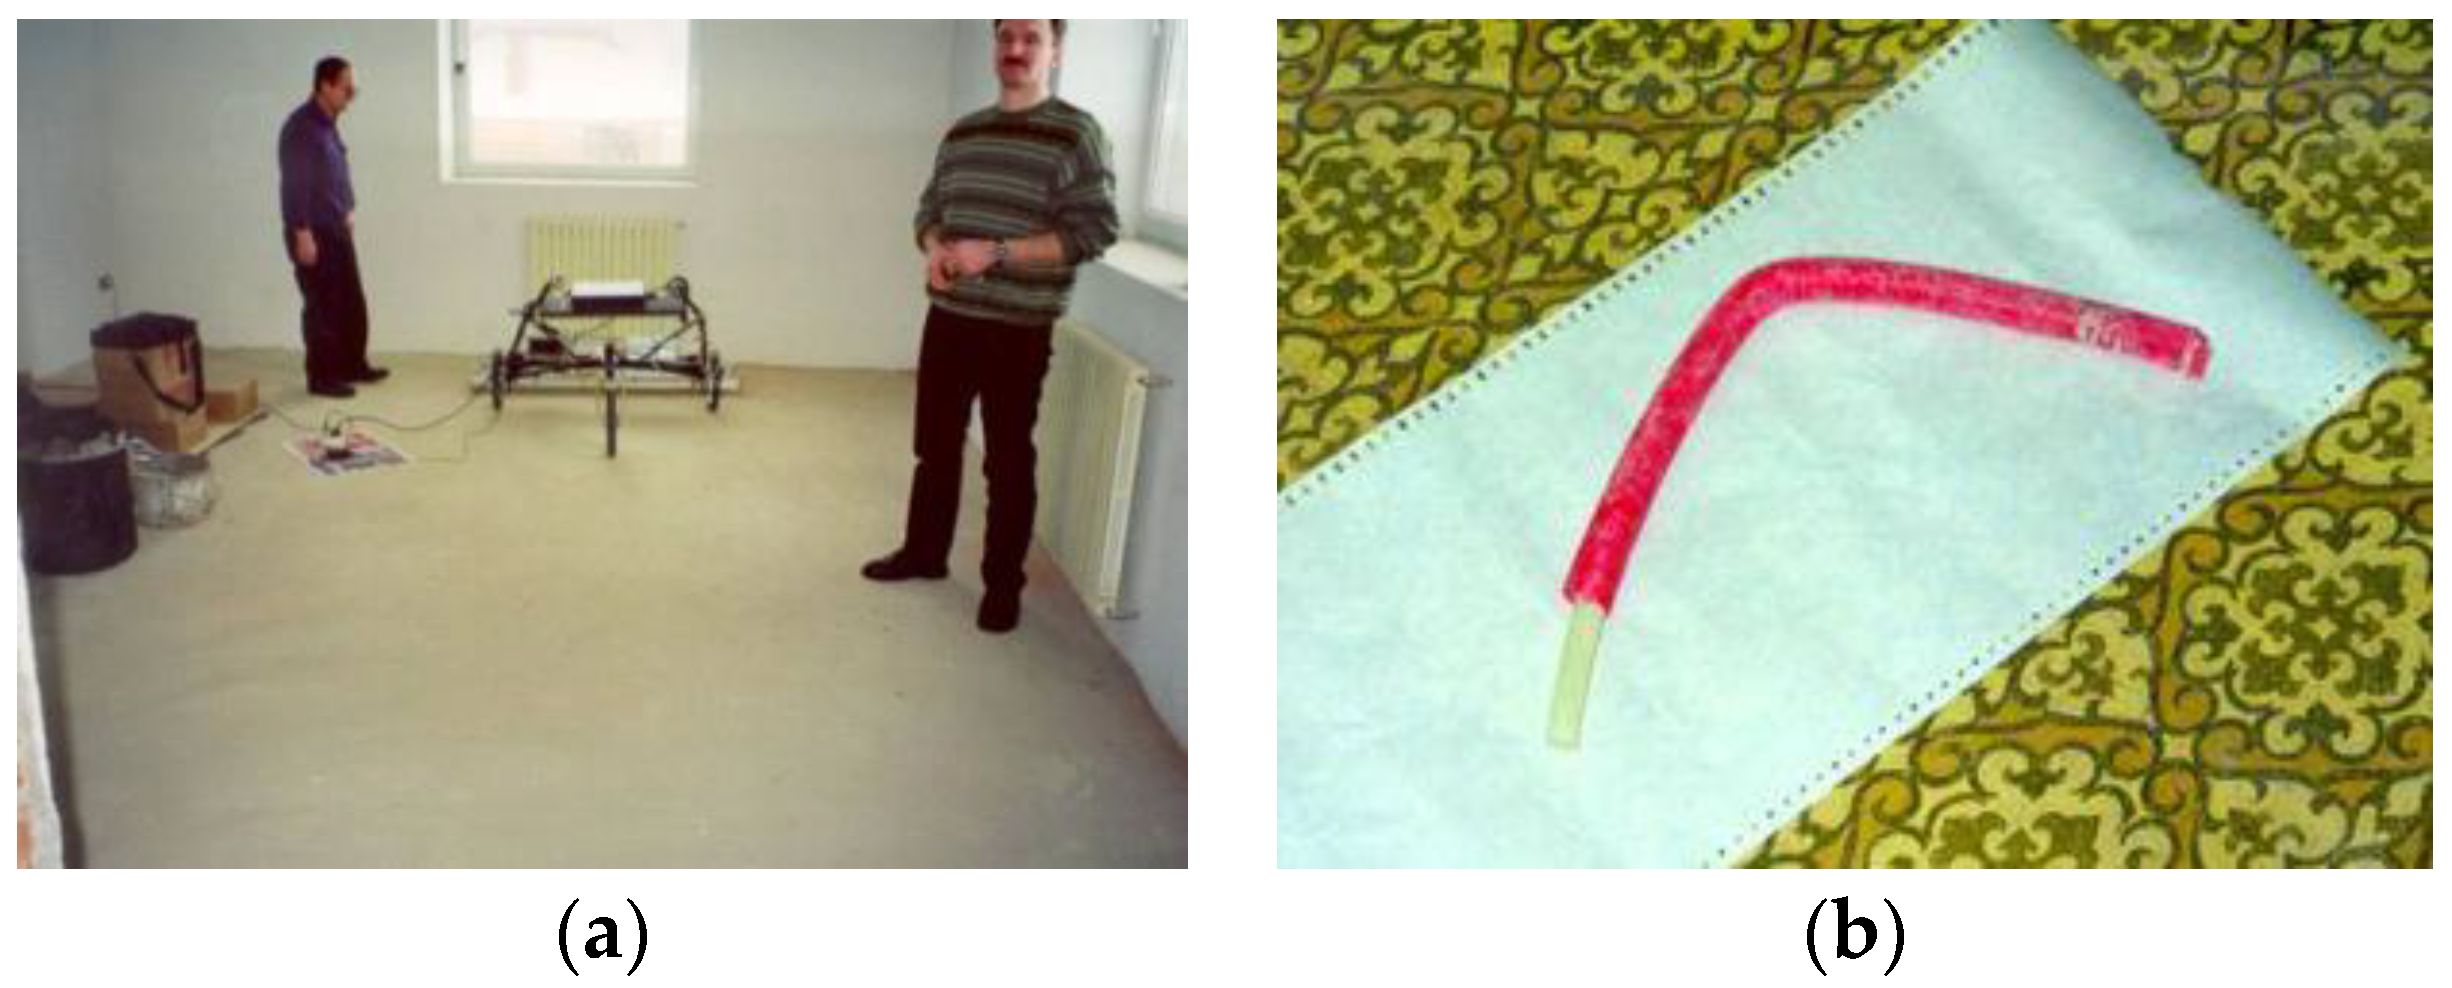
3.2. Non-Destructive Testing of Building Structures and Composite Materials

Despite the fact that the first HSRs of RASCAN type were designed with the rather narrow goal of detecting land mines, particularly those with plastic cases, later work shows that they have a much wider field of applications. One of these areas is the examination of building structures in order to detect defects, embedded elements, and other inhomogeneities [39,96]. Building elements are an easier subject for scanning and interpretation since, in general, they have a relatively flat surface and more or less homogeneous and predictable composition. A trained user easily learns to recognize the internal elements of a structure from a recorded MW image and to identify anomalous targets or conditions.
The need for detecting concealed details (such as, e.g., reinforcing or voids) in different structures frequently arises during repair and renovation of old buildings. MDs are traditionally used to detect metallic details such as rebar, mesh, conduits, or post-tensioning cables. However, the need to detect dielectric objects (e.g., plastic conduits or pipes, voids, etc.) is also of great interest and importance.
The most sensitive and still widely used method for inspecting structures uses X-rays. However, traditional X-rays do not use a backscattered signal and therefore require a two-sided approach, with the source and receiver placed on opposite sides of the structure. In some important cases, both sides of a structure under investigation cannot be accessed, for example, in the sounding of roadways and airstrips. In addition, there are significant health concerns when storing, transporting, and using X-ray sources.
The first experiments in the field of MW imaging of structures involved concrete floor inspection using the mine-detecting MiRascan system, as depicted in Figure 22 [35,97]. MW images were recorded to map plastic heating tubes in a floor to prevent driven nail damage during installation of a parquet floor. More details on this use of HSR are given in the later section on cultural heritage investigations [98].
Another application for HSR was after the catastrophic crash of the US space shuttle Columbia in 2003 [99]. There was a need for non-destructive testing (NDT) of the dielectric foam thermal insulation on the large propellant tanks and the adhesion of the thermal tiles to the aluminum body of the craft. These and other composite materials used in the aeronautical and aerospace sector are semi-transparent in the MW range [28,100]. For example, a shuttle’s external liquid hydrogen and oxygen tanks store these propellant components at −183 °C and −253 °C, respectively. To prevent fuel vaporization and exterior condensation and icing, the tank is covered with insulating polyurethane foam. This layer has a thickness ranging from 25 mm to 50 mm. NASA investigators determined that damage to the left wing of the spacecraft during the launch of the 28th mission was caused by the sudden boiling (at high altitude) of condensation in or under the thermal insulation. On re-entry, the damage to the thermal protection allowed plasma to penetrate and destroy the aluminum wing. After previous space shuttle launches, similar damage had been found, but of much smaller magnitude, and it was considered an acceptable level of risk [101,102,103]. Another type of damage was associated with the coating of thermal protection tiles. During re-entry, they are subjected to high thermal and mechanical stresses. A case reported in the literature concerns the first flight (12 April 1981) of the space shuttle Columbia, where 16 thermal protection tiles were lost and 148 were damaged [100]. After the first and only flight of the Soviet shuttle Buran (15 November 1988), similar defects with serious side effects were found [100].
Tests of MW and millimeter-wave technologies for NDT of the space shuttle thermal shielding have been undertaken following the Columbia disaster [27,28,104]. Although the shuttle program was soon cancelled, the success of these tests led to development of devices specifically designed for NDT of the composite materials that are used in aerospace engineering.
Initially, RASCAN-5 with its ability to record both amplitude and phase (therefore allowing reconstruction of complex MW holograms [19,20,21]) was tested for NDT of composite details [66,67,105]. However, these experiments showed insufficient sensitivity to small and low-contrast defects due to low operating frequency and imprecise positioning during manual scanning. This prompted the creation of an automated stand system (Figure 23) that would achieve the required sensitivity and precision [106,107].
The experimental setup mainly consists of a ZVA 24 vector network analyzer (VNA) with a 10 MHz to 24 GHz frequency band and a 2D electromechanical scanning bed. An antenna with Tx and Rx function is connected by two flexible stable phase feeders to the VNA. The distance between the antenna and the scanning plane of the investigated object is adjusted by means of a tripod with adjustable height on which the antenna is fixed. This setup also allowed us to experiment with different styles of antenna. The measurements were carried out by moving the sample with the 2D scanner bed, while the antenna remained fixed on the tripod. The movement system synchronized with the VNA allows acquisition on a programmable grid of points.
The capabilities of the MW NDT investigation system to detect defects of interest to the aerospace industry were evaluated using a thermal insulation sample with purposely created internal defects. This sample was produced by a Russian aerospace company, and its specifications (not shown to the researchers until experiments were complete) are shown in Figure 24 (dimensions indicated in mm). A foam disk with diameter 270 mm and thickness 40 mm was glued to a 5 mm aluminum plate. However, prior to gluing, three circles with a diameter of 50 mm and a height of 1 mm were cut from the lower surface of the foam disk. Therefore, in the sample, there was no adhesion to the aluminum plate on the surfaces of the three buried circular defects (blind defects), while the deposition of the glue on the circular surfaces of the cuts was preserved to simulate the effect of delamination at the interface between the foam and metal. The thickness of the glue was about 200 µm. Finally, the entire 400 mm × 500 mm frame was filled with insulating foam to conceal all interior details.
When this blind sample arrived at the laboratory, scans were carried out with the HSR at three frequencies: 7 GHz, 15 GHz, and 22.5 GHz. The HSR images are shown in Figure 25 [108,109]. As expected from theory, the spatial resolution improves with increasing frequency (while attenuation also increases). At 7 GHz, it is not possible to detect the three intentional defects. Instead, a geometric pattern of reflections from the edges of the sample dominates the image. However, the flaws are readily detectable in the 15 GHz and 22.5 GHz MW images. In addition, at higher frequencies, a weld bead in the aluminum substrate is visible. In the 22.5 GHz image, the reconstruction algorithm provides strong suppression of the edge effects, and while the intentional defects and internal structure of the sample are clear, there is also a surprise. Targets 1 and 2 on Figure 25 are imaged by the 22.5 GHz HSR but are not intentional anomalies. These are defects in the foam that were not intended by, nor known to, the fabricator. This experiment highlights that manufacturing procedures, even if carried out by qualified personnel and in specialized laboratories, are not free from unintentional defects that can be detected by HSR scans with sufficiently high frequency and precision.
This system was also successfully used in similar blind experiments on a sample submitted by the Vikram Sarabhai Space Center, India [109]. Other NDT applications have included detection of water intrusion in honeycomb composite products [32,110,111] and examination of tube coverings [32,112,113] among others.
MW technology is not yet in wide use for NDT of dielectric components, but there are now blind tests that show clear advantages of HSR for the aerospace industry. Comparing HSR with ISR, we can affirm that the former is less expensive and more easily adaptable to specific geometries and test conditions. HSR can also be compared with traditional ultrasonic NDT techniques applied to dielectric materials such as thermal insulating foams with high porosity, thermal tiles made with sintered quartz fibers, and composite materials based on fiber glass or carbon with a honeycomb structure: all of these materials or components exhibit high attenuation for acoustic waves [27] at frequencies that would provide spatial resolution comparable to MW HSR systems [114]. Furthermore, ultrasonic systems are efficient only when the transducers are placed in contact with the tested surface to ensure a good mechanical coupling (often requiring coupling gels). HSR NDT can be done in complete stand-off fashion.

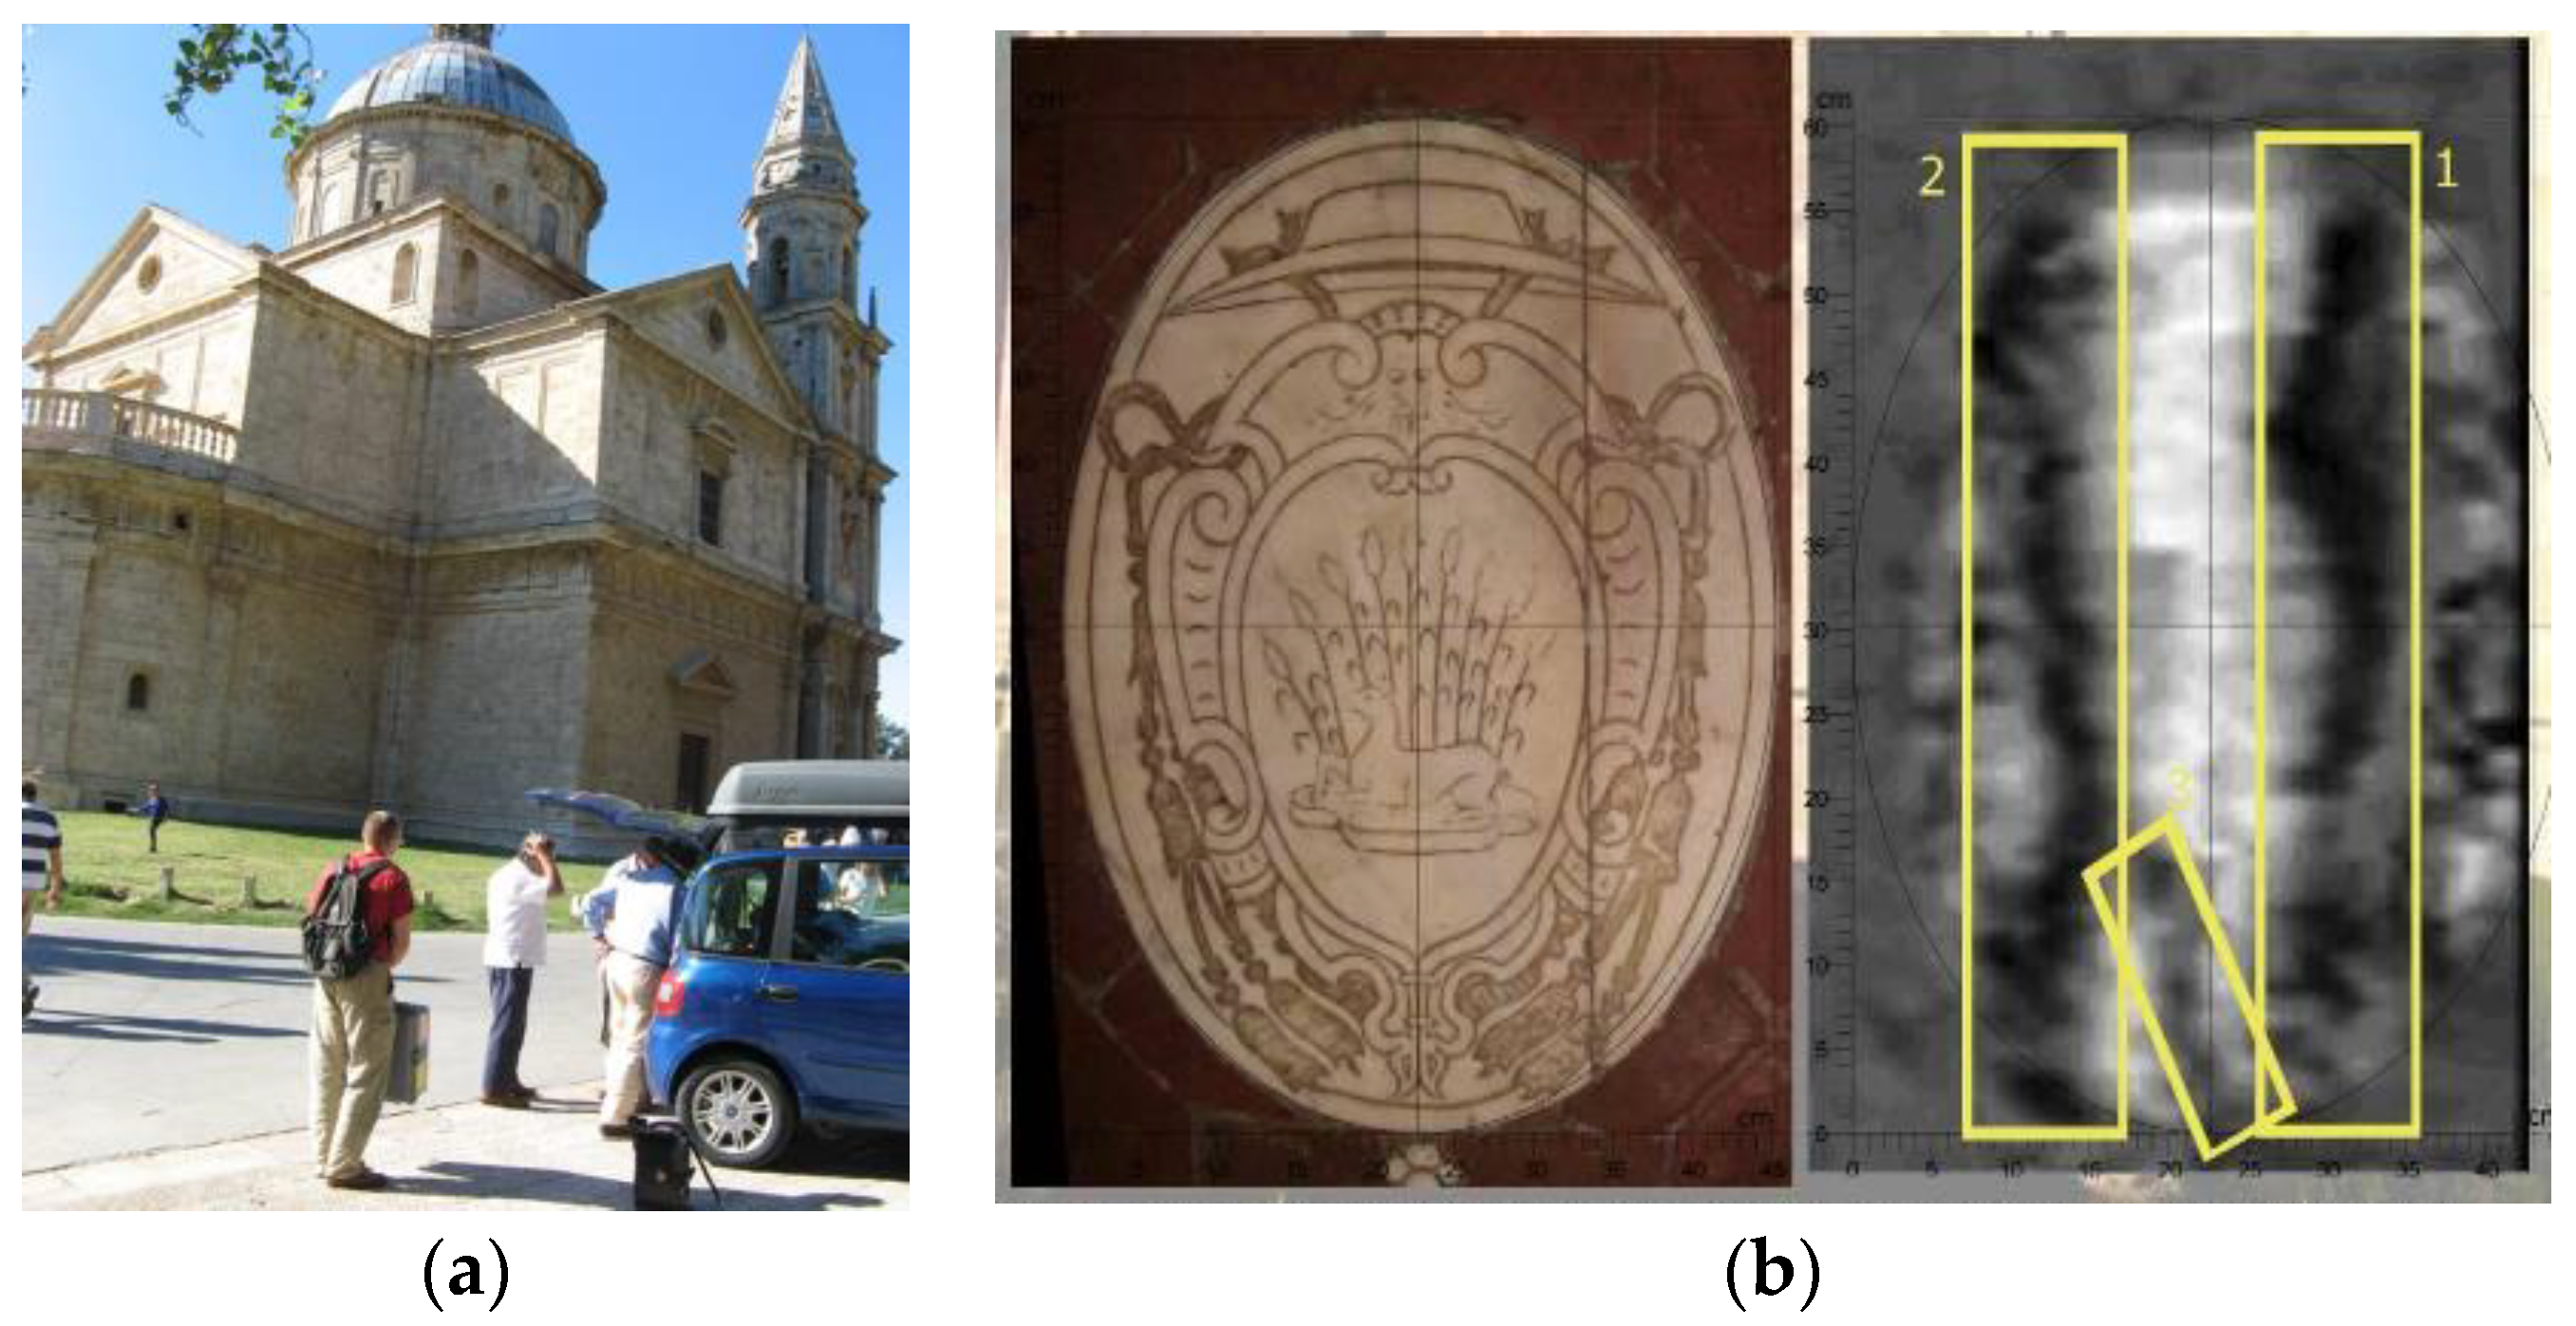
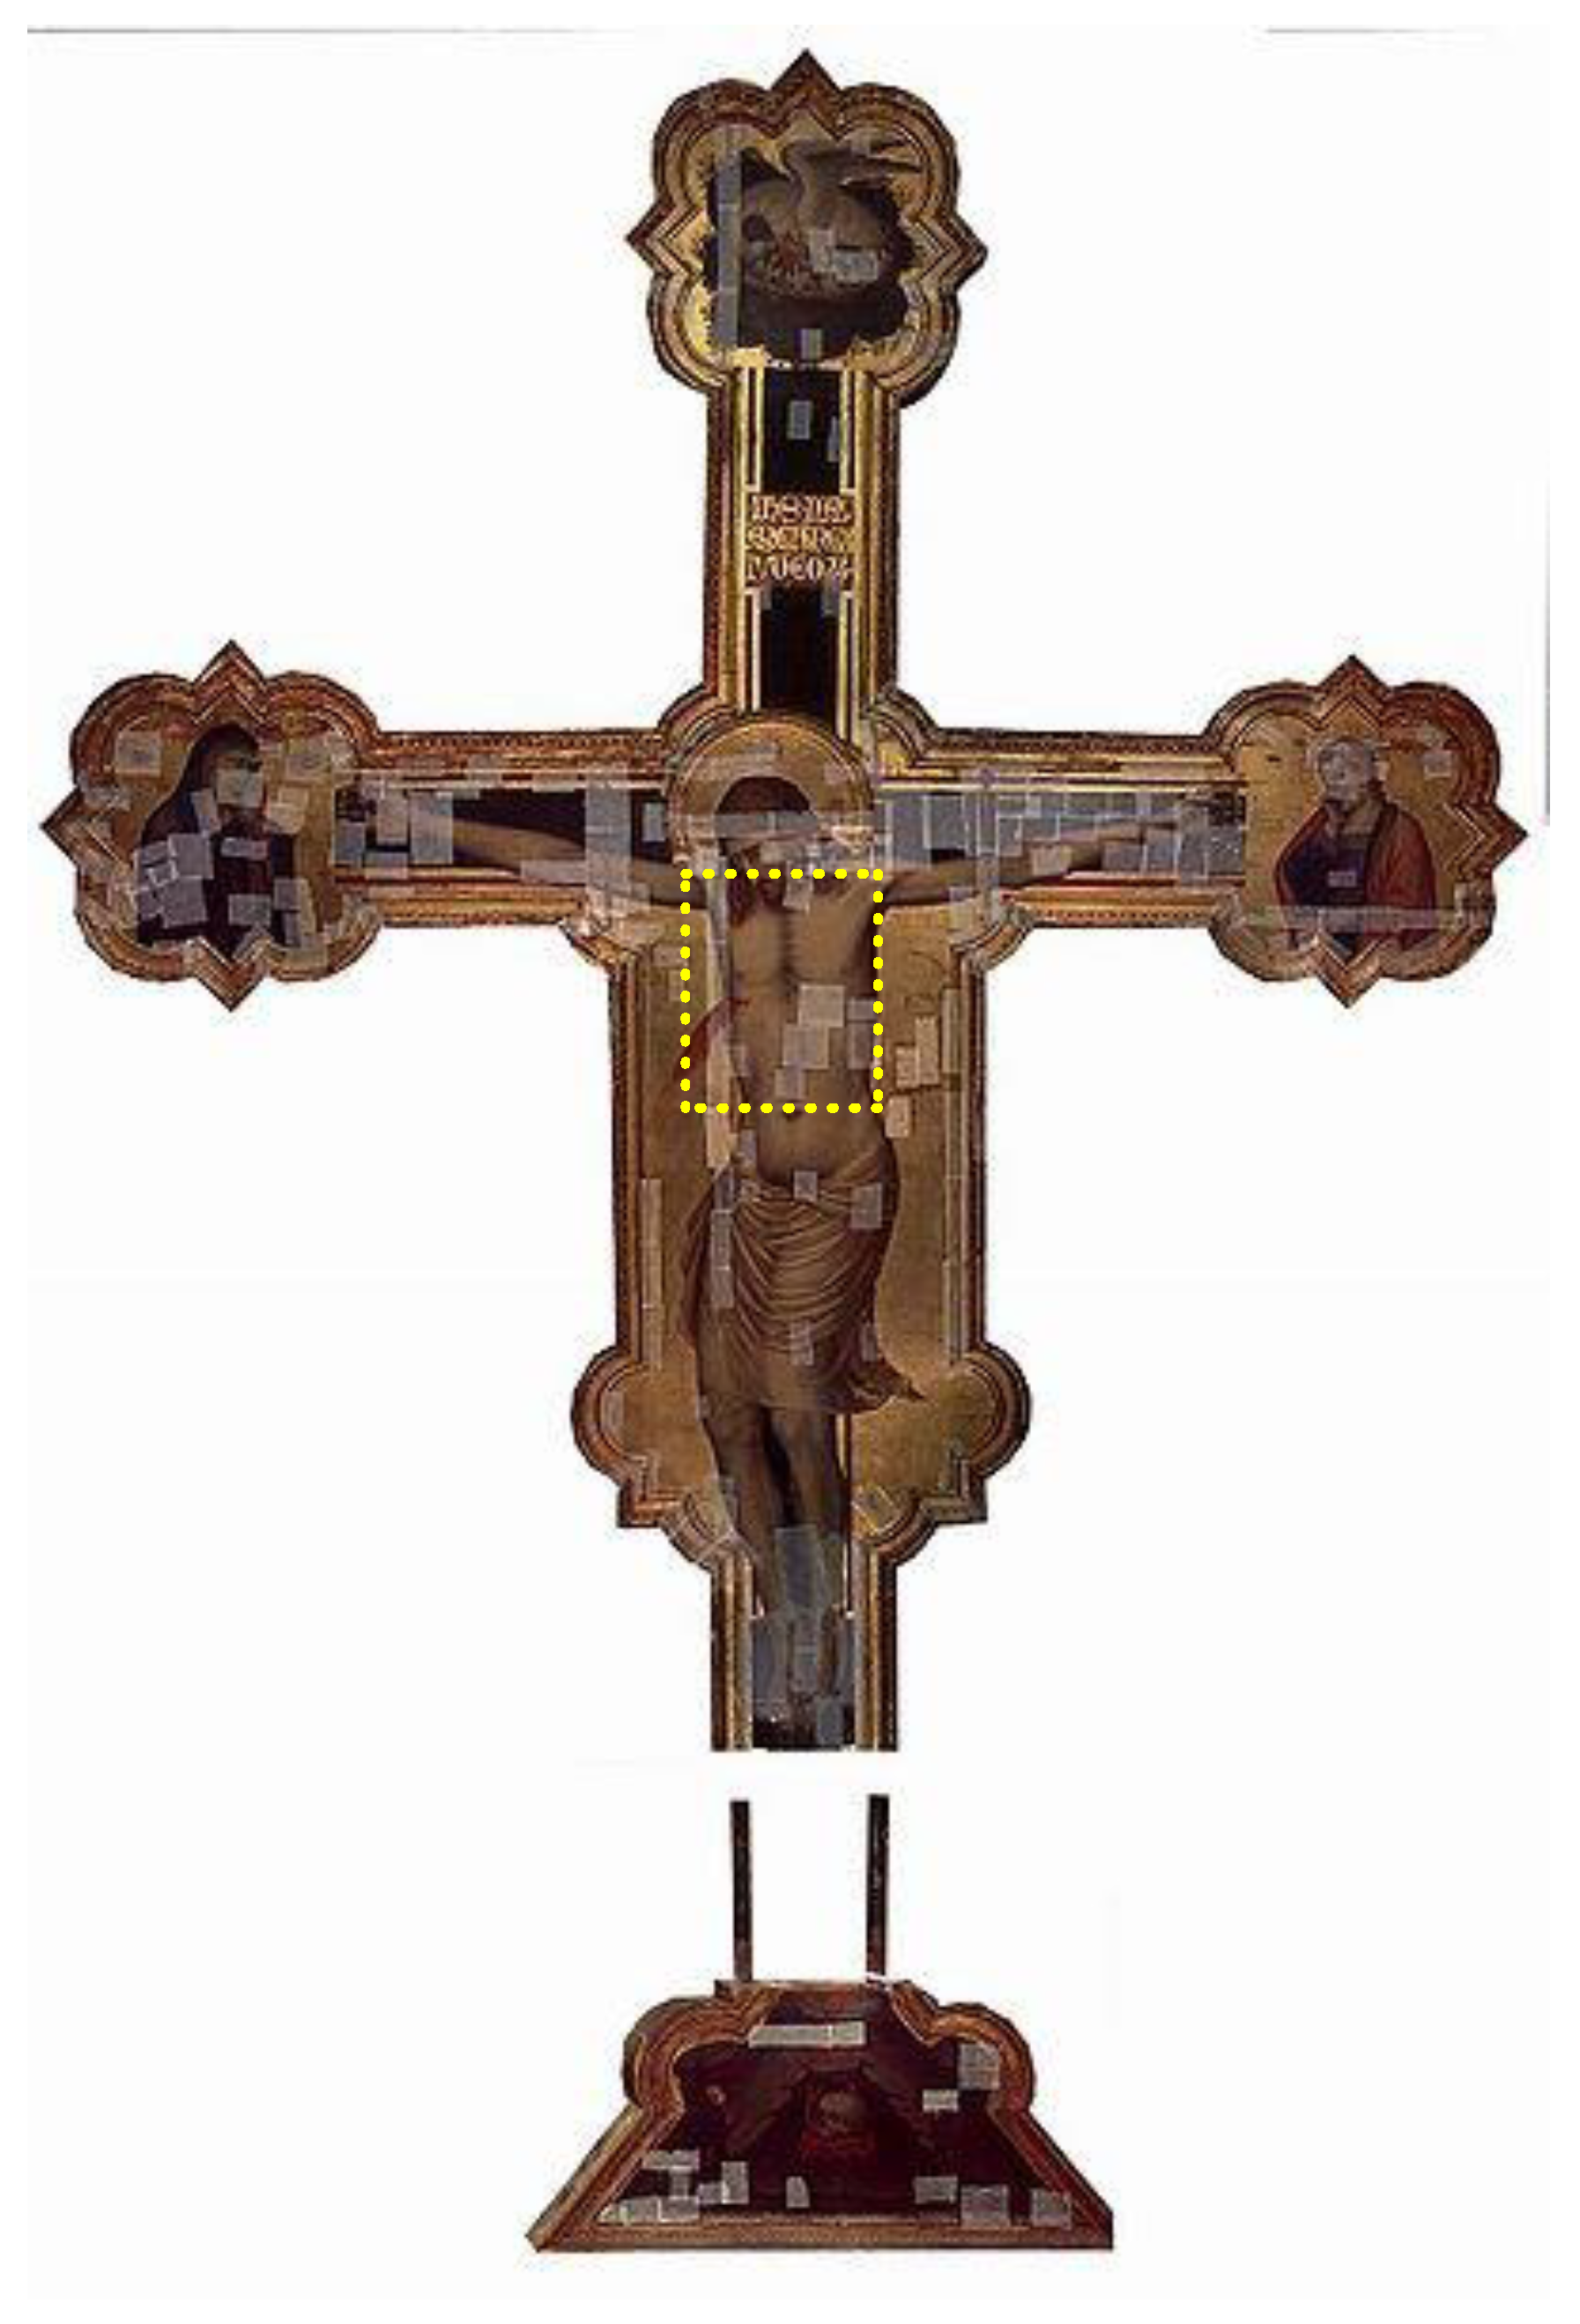
3.3. Cultural Heritage Inspection and Diagnostics

This section is a largely a continuation of the previous but considers the specific requirements and precautions required for examination of important artworks, architecture, and other cultural heritage objects. This is where the advantages of all NDT methods are most manifest. Traditionally, several NDT methods have been applied to these studies, with the selection and effectiveness of a particular technology dependent upon the properties of medium under investigation. A comparison of HSR with other NDT methods for cultural heritage studies is in [115].
One of the first examples of the use of HSR in a historical building was during the reconstruction of the early 19th-century senate building in Saint Petersburg, Russia [37,116]. The building was being refitted for using it by the Constitutional Court of the Russian Federation (Figure 26). The building was built by the Russian-Italian outstanding architect Carlo di Giovanni Rossi in 1829–1834 and has great value for Russian culture. An in-floor radiant heating system had been installed previously, but with no water piping plan. In addition, there were electrical and communications cables in the concrete floor. Workers wished to avoid damaging pipes and cables with driven nails during the installation of a parquet (as in the early use of MiRascan described above). In this construction, first, a metal mesh with 150 mm spacing was laid on the concrete subfloor. Then, pipes were fastened to the mesh using plastic clips. Various types of pipes were used, including cross-linked polyethylene (PEX), multi-layer (a composite of aluminum and PEX), and polybutylene (PB). The spacing between pipes was about 30 cm. The pipes were then covered by a cement screed with thickness above the pipes of about 3 cm.
There was concern that the plastic pipes would be invisible against the background of the highly MW reflective metal mesh. However, there are several effects that worked in favor. Recall that the contrast of an object on an HSR image depends on its reflectivity and the phase shift, which is a function of the distance from the antenna aperture to the target. For elongate objects, polarization also has a strong influence on the recorded contrast. In this case, the pipes were above the mesh and quite elongate.
The survey was carried out with the aid of a RASCAN-4/2000 holographic subsurface radar with discrete CW operating frequencies in the range of 1.6 GHz to 2.0 GHz (Figure 27a). Figure 27b depicts a portion of the scanned floor (16.7 m2 total area) with imaged pipes and cable marked in chalk. As expected, there was no contrast between pipes and metal mesh in the parallel polarization radar images. However, in cross-polarization images, the plastic pipes were clearly visible. A detailed radar image showing pipes draping across a cable is shown on Figure 27c.
As the survey progressed, the operator analyzed the image and drew the results in chalk on the floor, blue for heating tubes and red for electrical cables. The composite MW image of the total scanned area is presented in Figure 28a and the interpreted layout in Figure 28b.
Another application was the scanning of a marble medallion in the floor of the church of San Biagio in Montepulciano, Italy (see Figure 29) [36]. From information on the typical thicknesses of such marble medallions, a 4 GHz HSR was employed. In Figure 29b, there is good correlation between the optical image and the HSR image. With reasonable certainty, we could conclude that the objects highlighted by the contrast patterns are dielectric and non-metallic materials. Below are the interpretations for the three contrasting patterns shown in the yellow squares in Figure 29b. The yellow highlighting labeled 1 and 2 may at first represent either brick or wooden supports, or maybe a symmetrical change in contrast due to reflection depth from an arched opening beneath the medallion. In fact, it is possible to view the images at different frequencies, and the positions of these dark contrast bands shift systematically, confirming the arch hypothesis.
The dark feature labeled 3 matches a barely visible hairline crack in the marble. Since the dimensions of the crack are much smaller than the wavelength of the HSR signal, this response is interpreted as arising from moisture that has intruded the marble along this crack. Later laboratory experiments comparing MW images of perfectly mated cracks in marble with and without moisture confirm this effect [36].
Historical research in the church archive indicates that the medallion was placed around 1590 during the funeral ceremony of a Prelatio of the Casata Cervini family. The current burial place of the Prelatio is not registered. However, the hypothesized supports and the arched vault suggest the possibility that under the medallion there could be the remains or relics of the Prelatio.
An example of non-destructive investigation with HSR concerns the Croce di San Marco, which dates to the mid-fourteenth century and is attributed to Puccio di Simone [116]. It is considered one of the masterpieces and greatest examples of Florentine painting: the dimensions of the cross are imposing reaching a height of 6.3 m. The cross was assembled by the masters of the time by composing perpendicular axes with a retractable joint. The thickness of each poplar board is 7 cm, and the entire structure, including the crossbars, reaches a thickness of about 25 cm, with an estimated total weight of around 500 kg (see Figure 30). A test of RASCAN HSR was performed on the area highlighted by the yellow box in Figure 31. During scanning, the artwork was protected by a cloth supporting a plexiglass sheet marked with parallel and numbered scan lines.
In the images, metal nails securing the wooden planks are clearly visible as dark spots. The image at a frequency of 3.7 GHz clearly shows the contrast between areas laminated with gold leaf (white areas in Figure 31) versus those where the wood is painted (shades of gray in Figure 31).
In the painted area, streaks consistent with the wood grain are visible, as are dark spots that may represent knots in the wood. These features highlight the sensitivity of HSR. In addition, especially in cross-polarization, there is a dark curved shape associated with blood emanating from the wound on the side of the Christ figure (see Figure 30).
This contrast pattern was not expected, as it is painted on the gold leaf that surrounds the figure. It is not plausible that a dielectric layer less than a tenth of a millimeter thick could modify the amplitude or phase of the reflected wave, so an explanation was sought by designing a dedicated experiment in the laboratory of the Opificio delle Pietre Dure in Florence. To recreate this phenomenon, a specimen was made with gold foil partially covered with a layer of red paint.
As expected, the area covered by the layer of paint is indistinguishable from that on gold foil without paint. A plausible hypothesis is that the paint used for the blood contains a metal component and therefore can be modeled as a non-perfect conductor. In this case, the electric field would be cancelled only partially, thus determining a phase variation different from 180°, resulting in the image in Figure 31. This hypothesis was confirmed by a chemical analysis carried out previously by the Opificio delle Pietre Dure of Florence, which detected high levels of lead in the paint used to depict the blood. Somewhat surprisingly, lead was used at the time of creation of this piece to make the color white. Here it may have been used to create the appearance of the flow of blood by making striations of red and lighter red to white.
In the United States, termites and other wood-boring organisms inflict $4.5 billion worth of damage on homes and other buildings each year. While professional inspections, trained dogs, and CO2 detectors can spot active colonies, the old damage from previous infestations is often not visible at the surface of wooden structures and may be hidden behind plaster or other floor, wall, or ceiling coverings (which in historic structures cannot be removed). HSR of the RASCAN type has been shown to be effective in detecting hidden tunnels and other damage [54]. Figure 32 shows a wooden beam in a structure on the former estate of US President James Buchanan (1791–1868). On the left is a photo of the surface of the old beam. The center is an HSR image at parallel polarization and 3.7 GHz signal frequency. The dark contrast highlights its joint with an adjacent beam to the right, as well as an area with no obvious surface manifestation. The photo on the right of Figure 32 shows termite damage exposed by peeling away the surface of the wood.
Perhaps the most exotic application of holographic radar has been for the detection and imaging of hidden dinosaur tracks [117,118]. The study of dinosaur tracks provides important information about these prehistoric animals, in particular behavior, which is often not revealed by the fossil remains. If the sediment fills a series of footprints before they are eroded by the elements (wind, water, etc.), then the track could be fossilized and preserved for millions of years as a mold and cast that can be separated to reveal the print. Until now, dinosaur tracks have been studied when they are found during exposure by erosion or quarrying. Where they are exposed, it is reasonable to assume that other tracks may exist but remain covered and hidden from direct observation. Following partially successful laboratory and field experiments, it was proposed to use the high-precision experimental installation shown in Figure 23. These experiments were conducted in three frequency ranges: 6.4 GHz to 7.0 GHz, 12.8 GHz to 15.2 GHz, and 18.0 GHz to 21.5 GHz. A cast and modeled dinosaur trace model were created by making a plaster cast of a real dinosaur trace (var. Anamoepus [119] from the Dinosaur State Park in Connecticut, USA) and reproducing the well-fitting mold from this cast, as shown in Figure 33. The half of the specimen with the impression mold has an area of 255 mm × 225 mm and a height of 27 mm. The cast sample has the same area but is 22 mm high. The footprint is in the center of the samples and has dimensions of 11cm in length by 7.5 cm in width.
Experiments with only the cast or mold with clean plaster surfaces conducted in all frequency bands showed clear radar images that gave better results at higher frequencies. From this experimental investigation and from the support of the simulations of digital fingerprint models, we can believe that the MW holographic radar is suitable for performing non-contact scans of areas in which the traces are even partially exposed. The ability to scan without contact is an important advantage, considering the fragility of the thin layers that covers the sequences of the impressions and the difficulty of recording and reproducing them digitally when they have low relief. To highlight the ability to discover hidden footprints, the mold of the implant was coupled with the plaster cast to reproduce the situation in nature. This imaging (Figure 34) was most successful when the mold and cast were separated by a thin (less than 1 mm) slip of clay or sand (as is common for real tracks).
Other experiments that used HSR on paleontological samples include a partially exposed rostrum of an Upper Jurassic to Lower Cretaceous fossil crocodylomorph in a 21-mm-thick limestone slab from the Maiolica Formation. The specimen, recovered in the Altopiano di Asiago (Vicenza Province, Italy), is presently housed in the paleontological collections of the Rovereto Civic Museum (Trento Province, Italy). The holographic radar response recorded on the surface where the fossil cannot be observed correlates well with the actual fossil shape revealed on the reverse side of the slab. This study was done using a RASCAN-4/7000 HSR radar with discrete signals at frequencies between 6.4 GHz and 6.8 GHz.
The results of these paleontological experiments are not fully developed, but this is a new field of application for HSR. Therefore, further field trials are needed to understand the relevance of the MW holographic technique for the remote detection of characteristic shapes in areas of paleontological interest. For example, the high-dielectric-contrast sensitivity of the proposed method has been exploited for imaging hidden invertebrate fossils (see Figure 35) that have been pyritized or otherwise replaced by secondary minerals with different dielectric constants from the rock in which they were fossilized.

3.4. Security

Modern security systems that use active MW technology generally record the complex amplitude of reflected waves from an area under surveillance and process these signals to produce images that may reveal concealed objects. These security systems are classified into two categories. The first includes mechanical scanning systems, while the second includes electronic scanning systems [50]. For both categories, during scanning and data acquisition, the electromagnetic field is the same. For the second category, it can be estimated that electronic scanning can be completed in about one-tenth the time for systems with mechanical scanning [120]. The high acquisition rate in electronically scanned radar systems enables MW video streaming at frame rates of dozens per second. There are already several systems on the market and therefore much research; among these are the ProVision [121] system produced by L-3 Communications, which uses mechanical scanning by means of a series of vertically distributed elements, and the Eqo [122] radar system produced by Smiths Detection, which uses the electronic control of a 2D matrix of distributed elements. Through the electronic programming of the relative delays between the transmitting elements, it is possible to define the point of focus within the investigated volume to provide a high-resolution radar image [48]. The performance of the ProVision system, as stated in the data sheet [121], is between 200 and 300 people per hour at a data acquisition time of 1.5 s. The performance of Eqo should not exceed that of ProVision, because it is based on the cooperative self-rotation of the subject, which is difficult to obtain in less than 1.5 s. The performance of both systems is further limited by the fact that subjects must often remove outer clothing before scanning. System performance limitations and high cost (approximately $ 170,000) limit use outside of airports.
To increase the throughput of active radar systems while decreasing system cost, a system architecture based on the principle of inverse aperture synthesis has been proposed. This concept is different from the systems with mechanical scanning in that it uses the motion of subjects through an array of stationary transmitters to form a synthetic aperture. Systems that use such aperture synthesis are currently used in radar systems for tracking aerial or marine targets. In these systems, one of the difficulties arises from not knowing target parameters that would allow calculation of matched filter coefficients for signal processing. These difficulties can be overcome for a moving person by recording a synchronous video that captures the motion parameters of the subject, as in Figure 36 [52], [120]. These parameters will enable coherent radar processing and inverse aperture synthesis, leading to a synthesized radar image, which can be calculated for every instantaneous pose of the walking person.
The proposed principle has been tested in laboratory conditions and shown to be practical. Using an experimental setup with a mannequin subject (Figure 37a), it was shown that the proposed method can significantly reduce the dimensions of a prospective screening system and the number of channels in the antenna system and at the same time obtain detailed radar images of hidden objects.
The data obtained in an experiment with the mannequin are shown in Figure 37 [51]. The data acquisition was done with the following parameters:
  • The distance from the mannequin to the scan plane was about 45 cm.
  • The frequency of VNA sweeps was 18.0 GHz to 26.5 GHz.
  • The height and width of the scanned aperture were 100 cm and 90 cm, respectively.
In the reconstructed MW hologram (Figure 37), the silhouette of the plastic mannequin is visible, as well as the metal belt buckle, and especially the highly reflective metal weapons. Further development of the proposed method and evaluation of its performance are underway using an electronically switched antenna array. This allows more rapid and representative data collection.

4. Conclusions

This review provides a summary of the theory, technology, and applications of HSR, including humanitarian demining, NDT, cultural heritage investigations, and security. While HSR is not a universally applicable method for sounding of optically opaque media, there are many (and growing) practical and important cases. With selection of an appropriate probing signal frequency to balance the trade-off between scanning depth and plan-view resolution, it is possible to reconstruct MW holograms of shallow targets that allow accurate determination of the shape and dimensions and provide images suitable for human or machine classification. The case histories summarized here indicate promising prospects for even better subsurface imaging based on combining HSR with other sensors (e.g., optical, magnetic, acoustic) and with manual spatial sampling replaced by more precise robotic and/or electromechanical scanners.

Funding

This research received no external funding. All funding is counted in Acknowledgments.

Institutional Review Board Statement

This is a review paper. So, any humans or animals were not used in experiments.

Informed Consent Statement

This is a review paper. So, any humans or animals were not used in experiments.

Acknowledgments

This review was prepared by an international team of authors from Russia, the United States, Italy, Bulgaria, and Turkey and was supported by a few foundations, including the Russian Science Foundation under project # 21-19-00043, the Russian Foundation for Basic Research under projects #19-57-18001 and #20-57-46004, and Bulgarian National Science Fund under administrative contract #KP-06-RUSSIA/22-28.09.2019.

Conflicts of Interest

The authors declare no conflict of interest.

References

  1. Finkelstein, M.I. Subsurface radar. Telecomm. Radio Eng. 1997, 32, 18–26. [Google Scholar]
  2. Daniels, D.J. Surface-Penetrating Radar; IEEE: London, UK, 1996. [Google Scholar]
  3. Finkelstein, M.I.; Kutev, V.A.; Zolotarev, V.P. Applications of Subsurface Radar in Geology; Nedra: Moscow, Russia, 1986. (In Russian) [Google Scholar]
  4. Doolittle, J.A. Using ground penetrating radar to increase the quality and efficiency of soil surveys. Soil Surv. Tech. 1987, 20, 11–32. [Google Scholar]
  5. Iizuka, K. Microwave hologram by photoengraving. Proc. IEEE 1969, 57, 813–814. [Google Scholar] [CrossRef]
  6. Iizuka, K.; Gregoris, L.G. Application of microwave holography in the study of the field from a radiating source. Appl. Phys. Lett. 1970, 17, 509–512. [Google Scholar] [CrossRef]
  7. Junkin, G.; Anderson, A.P. Limitations in microwave holographic synthetic aperture imaging over a lossy half-space. Commun. Radar Signal Process. IEEE Proc. F 1988, 135, 321–329. [Google Scholar] [CrossRef]
  8. Ivashov, S.I.; Razevig, V.V.; Vasiliev, I.A.; Zhuravlev, A.V.; Bechtel, T.D.; Capineri, L. Holographic Subsurface Radar of RASCAN Type: Development and Applications. IEEE J. Sel. Top. Earth Obs. Remote Sens. 2011, 4, 763–778. [Google Scholar] [CrossRef]
  9. Ivashov, S.I.; Razevig, V.V.; Sheyko, A.P.; Vasilyev, I.A. A Review of the Remote Sensing Laboratory’s Techniques for Humanitarian Demining. In Proceedings of the International Conference on Requirements and Technologies for the Detection, Removal and Neutralization of Landmines and UXO, EUDEM2-SCOT-2003, Brussels, Belgium, 15–18 September 2003; Volume 1, pp. 3–8. [Google Scholar]
  10. Song, X.J.; Su, Y.; Huang, C.L.; Lu, M.; Zhu, S.P. Landmine Detection with Holographic Radar. In Proceedings of the 16th International Conference of Ground Penetrating Radar (GPR 2016), Hong Kong, 13–16 June 2016; pp. 1–4. [Google Scholar] [CrossRef]
  11. Pochanin, G.; Capineri, L.; Bechtel, T.; Ruban, V.; Falorni, P.; Crawford, F.; Ogurtsova, T.; Bossi, L. Radar Systems for Landmine Detection: Invited Paper. In Proceedings of the 2020 IEEE Ukrainian Microwave Week (UkrMW), Kharkiv, Ukraine, 21–25 September 2020; pp. 1118–1122. [Google Scholar] [CrossRef]
  12. Gabor, D. A new microscopic principle. Nature 1948, 161, 777–778. [Google Scholar] [CrossRef]
  13. Chubinsky, N.P. Possibilities of holographic methods at sounding of lossy media. In Proceedings of the 4th Russian conference Radio-Physics Methods in Remote Sensing, Murom, Russia, 30 June–3 July 2009; pp. 47–60. (In Russian). [Google Scholar]
  14. Collier, R.J.; Burckhardt, C.B.; Lin, L.H. Optical Holography; Academic Press: New York, NY, USA; London, UK, 1971. [Google Scholar]
  15. Williams, W.R. Physical Optics; The MacMillan Company: New York, NY, USA, 1911; pp. 37–39. [Google Scholar]
  16. Leith, E.N.; Upatnieks, J. Reconstructed wave fronts and communication theory. J. Opt. Soc. Am. 1962, 52, 1123–1130. [Google Scholar] [CrossRef]
  17. McMakin, D.L.; Sheen, D.M.; Griffin, J.W.; Lechelt, W.M. Extremely high-frequency holographic radar imaging of personnel and mail. In Sensors, and Command, Control, Communications, and Intelligence (C31) Technologies for Homeland Security and Homeland Defense V; Edward, M., Ed.; Carapezza, SPIE: Wayland, MA, USA, 2006; Volume 6201. [Google Scholar] [CrossRef]
  18. Zhuravlev, A.; Razevig, V.; Chizh, M.; Ivashov, S. Imaging of concealed objects on moving persons by creating synthetic aperture due to their natural motion. In Proceedings of the IEEE International Conference on Microwaves, Communications, Antennas and Electronic Systems (COMCAS 2017), Tel-Aviv, Israel, 13–15 November 2017; pp. 1–4. [Google Scholar] [CrossRef]
  19. Razevig, V.V.; Ivashov, S.I.; Vasiliev, I.A.; Zhuravlev, A.V.; Bechtel, T.; Capineri, L. Advantages and Restrictions of Holographic Subsurface Radars. Experimental evaluation. In Proceedings of the XIII International Conference on Ground Penetrating Radar, Lecce, Italy, 21–25 June 2010; pp. 657–662. [Google Scholar] [CrossRef]
  20. Razevig, V.; Ivashov, S.; Chizh, M.; Zhuravlev, A.; Capineri, L. Influence of Electrical Properties of Media on Reconstruction of Microwave Holograms Recorded by Subsurface Radar. In Proceedings of the 2019 IEEE International Conference on Microwaves, Antennas, Communications and Electronic Systems (COMCAS), Tel-Aviv, Israel, 4–6 November 2019; pp. 1–5. [Google Scholar] [CrossRef]
  21. Razevig, V.; Ivashov, S.; Vasiliev, I.; Zhuravlev, A. Comparison of Different Methods for Reconstruction of Microwave Holograms Recorded by the Subsurface Radar. In Proceedings of the 14th International Conference on Ground Penetrating Radar, Shanghai, China, 4–8 June 2012; pp. 335–339. [Google Scholar] [CrossRef]
  22. Kolandasami, A.P.; Makhmanazarov, R.M.; Kuz`menko, I.Y.; Muksunov, T.R.; Yakubov, V.P. Phase as the basis for wave vision. IOP Conf. Ser. Mater. Sci. Eng. 2019, 516, 012058. [Google Scholar] [CrossRef]
  23. Available online: http://www.rslab.ru/downloads/scan.avi (accessed on 29 August 2021).
  24. Bechtel, E.; Ivashov, S.; Bechtel, T.; Arsenyeva, E.; Zhuravlev, A.; Vasiliev, I.; Razevig, V.; Sheyko, A. Experimental determination of the resolution of the Rascan-4/4000 holographic radar system. In Proceedings of the 12th International Conference on Ground Penetrating Radar, Birmingham, UK, 16–19 June 2008; Available online: http://www.rslab.ru/downloads/bechtel_et_al.pdf (accessed on 29 August 2021).
  25. Liu, C.; Al Qaseer, M.T.; Zoughi, R. Influence of Antenna Pattern on Synthetic Aperture Radar Resolution for NDE Applications. In IEEE Transactions on Instrumentation and Measurement; Publisher Institute of Electrical and Electronics Engineers: New York, NY, USA, 2020. [Google Scholar] [CrossRef]
  26. Lu, T.; Snapp, C.; Chao, T.-H.; Thakoor, A.; Bechtel, T.; Ivashov, S.; Vasiliev, I. Evaluation of holographic subsurface radar for NDE of space shuttle thermal protection tiles. In Sensors and Systems for Space Applications; SPIE: Orlando, FL, USA; Publisher the Society of Photo-Optical Instrumentation Engineers: Bellingham, DC, USA, 2007; Volume 6555. [Google Scholar] [CrossRef]
  27. Ivashov, S.I.; Razevig, V.V.; Zhuravlev, A.V.; Bechtel, T.; Chizh, M.A. Comparison of Different NDT Methods in Diagnostics of Rocket Cryogenic Tanks Thermal Protection Coating. In Proceedings of the 2019 IEEE International Conference on Microwaves, Antennas, Communications and Electronic Systems (COMCAS), Tel-Aviv, Israel, 4–6 November 2019; pp. 1–5. [Google Scholar] [CrossRef]
  28. Kharkovsky, S.; Zoughi, R. Microwave and millimeter wave nondestructive testing and evaluation. IEEE Instrum. Meas. Mag. 2007, 10, 26–38. [Google Scholar] [CrossRef]
  29. Case, J.T.; Hepburn, F.L.; Zoughi, R. Inspection of Spray on Foam Insulation (SOFI) Using Microwave and Millimeter Wave Synthetic Aperture Focusing and Holography. In Proceedings of the 2006 IEEE Instrumentation and Measurement Technology Conference Proceedings, Sorrento, Italy, 24–27 April 2006. [Google Scholar] [CrossRef] [Green Version]
  30. Capineri, L.; Falorni, P.; Becthel, T.; Ivashov, S.; Razevig, V.; Zhuravlev, A. Water detection in thermal insulating materials by high resolution imaging with holographic radar. Meas. Sci. Technol. 2017, 28, 1–6. [Google Scholar] [CrossRef]
  31. Zhang, X.; Liang, J.; Wang, N.; Chang, T.; Guo, Q.; Cui, H. Broadband Millimeter-Wave Imaging Radar-Based 3-D Holographic Reconstruction for Nondestructive Testing. IEEE Trans. Microw. Theory Tech. 2020, 68, 1074–1085. [Google Scholar] [CrossRef]
  32. Amineh, R.K.; Ravan, M.; Sharma, R. Nondestructive Testing of Nonmetallic Pipes Using Wideband Microwave Measurements. IEEE Trans. Microw. Theory Tech. 2020, 68, 1763–1772. [Google Scholar] [CrossRef]
  33. Liu, C.; Tayeb, A.Q.M.; Bao, F.S.; Zoughi, R. Target Depth-Based Adaptive Scanning in Microwave Synthetic Aperture Radar Imaging for NDE Applications; Passive and Active Millimeter-Wave Imaging XXIV; SPIE: Orlando, FL, USA, 2021; Volume 11745. [Google Scholar] [CrossRef]
  34. Och, A.; Patrick, A.H.; Schuster, S.; Scheiblhofer, S.; Zankl, D.; Pathuri-Bhuvana, V.; Weigel, R. High-Resolution Millimeter-Wave Tomography System for Nondestructive Testing of Low-Permittivity Materials. IEEE Trans. Microw. Theory Tech. 2021, 69, 1105–1113. [Google Scholar] [CrossRef]
  35. Ivashov, S.I.; Makarenkov, V.I.; Razevig, V.V.; Sablin, V.N.; Sheyko, A.P.; Vasiliev, I.A. Concrete floor inspection with help of subsurface radar. In Proceedings of the Eight International Conference on Ground-Penetrating Radar, GPR’2000, Queensland, Australia, 23–26 May 2000; pp. 552–555. [Google Scholar] [CrossRef]
  36. Capineri, L.; Falorni, P.; Borgioli, G.; Bulletti, A.; Valentini, S.; Ivashov, S.; Zhuravlev, A.; Razevig, V.; Vasiliev, I.; Paradiso, M.; et al. Application of the RASCAN holographic radar to cultural heritage inspections. Archaeol. Prospect. 2009, 16, 218–230. [Google Scholar] [CrossRef]
  37. Razevig, V.V.; Ivashov, S.I.; Sheyko, A.P.; Vasilyev, I.A.; Zhuravlev, A.V. An example of holographic radar using at restoration works of historical building. Prog. Electromagn. Res. Lett. 2008, 1, 173–179. [Google Scholar] [CrossRef] [Green Version]
  38. Ivashov, S.; Bechtel, T.; Razevig, V.; Capineri, L.; Inagaki, M. A proposed radar method for non-destructive investigation of Egyptian pyramids. Insight 2021, 63, 12–19. [Google Scholar] [CrossRef]
  39. Vasiliev, I.A.; Ivashov, S.I.; Makarenkov, V.I.; Sablin, V.N.; Sheyko, A.P. RF Band High Resolution Sounding of Building Structures and Works. IEEE Aerosp. Electron. Syst. Mag. 1999, 14, 25–28. [Google Scholar] [CrossRef] [Green Version]
  40. Bossi, L.; Falorni, P.; Windsor, C.; Zandonai, F.; Bizzarini, F.; Delfino, M.; Giusberti, L.; Bechtel, T.; Chizh, M.; Ivashov, S.; et al. The imaging of subsurface crocodile remains in a limestone slab using holographic radar. In Proceedings of the GPR 2020—18th International Conference on Ground Penetrating Radar, Golden, CO, USA, 14–19 June 2020; pp. 6–9. [Google Scholar] [CrossRef]
  41. Ivashov, S.; Razevig, V.; Zhuravlev, A.; Chizh, M.; Bechtel, T.; Capineri, L.; Inagaki, M. MW Holographic Imaging System for Detection of Hidden Dinosaur Tracks. In Proceedings of the 2017 Progress In Electromagnetics Research Symposium—Spring (PIERS), St. Petersburg, Russia, 22–25 May 2017; pp. 3241–3246. [Google Scholar] [CrossRef]
  42. Vohra, D.; Bechtel, T.; Thomas, R.D.K.; Windsor, C.; Ivashov, S.; Capineri, L.; Inagaki, M.; Van Scyoc, R. A test of holographic radar for detection of hidden vertebrate tracks and trackways. In Proceedings of the 2015 8th International Workshop on Advanced Ground Penetrating Radar (IWAGPR), Florence, Italy, 7–10 July 2015; pp. 1–4. [Google Scholar]
  43. Bechtel, T.; Capineri, L.; Windsor, C.; Inagaki, M.; Ivashov, S. Comparison of ROC curves for landmine detection by holographic radar with ROC data from other methods. In Proceedings of the 2015 8th International Workshop on Advanced Ground Penetrating Radar (IWAGPR), Florence, Italy, 7–10 July 2015; pp. 1–4. [Google Scholar] [CrossRef]
  44. Borgioli, G.; Bossi, L.; Capineri, L.; Falorni, P.; Bechtel, T.; Crawford, F.; Inagaki, M.; Pochanin, G.; Ruban, V.; Varyanitza-Roschupkina, L.; et al. A Hologram Reconstruction Algorithm for Landmine Recognition and Classification Based on Microwave Holographic Radar Data. In Proceedings of the 2018 Progress in Electromagnetics Research Symposium (PIERS-Toyama), Toyama, Japan, 1–4 August 2018; pp. 1938–1944. [Google Scholar] [CrossRef]
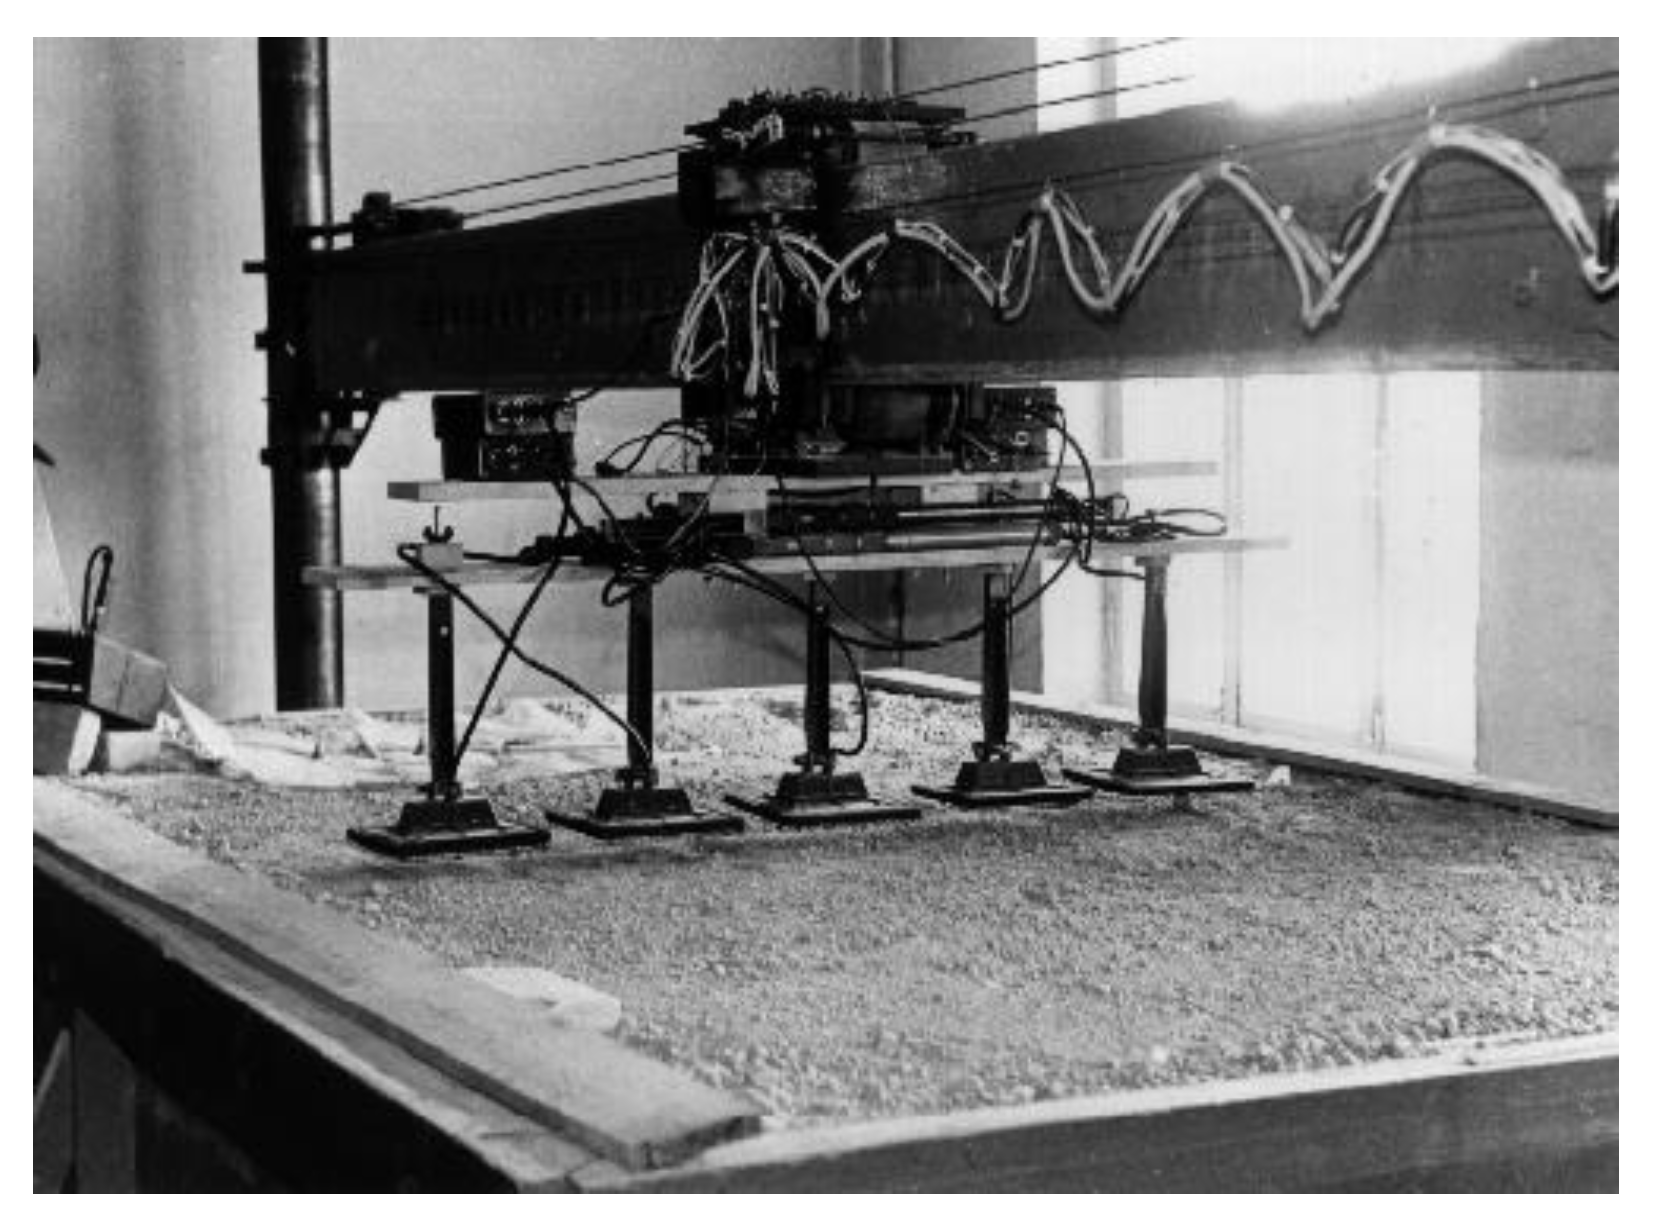
  45. Ivashov, S.I.; Sablin, V.N.; Vasilyev, I.A. Wide-span systems of mine detection. IEEE Aerosp. Electron. Syst. Mag. 1999, 14, 6–8. [Google Scholar] [CrossRef]
  46. Ivashov, S.I.; Sablin, V.N.; Vasilyev, I.A.; Nikiforov, N.V.; Minkov, V.E. Wide-span systems of mine detection. In Proceedings of the 1998 Second International Conference on the Detection of Abandoned Land Mines (IEE Conf. Publ. No. 458), Edinburgh, UK, 12–14 October 1998; pp. 78–80. [Google Scholar] [CrossRef] [Green Version]
  47. Zhuravlev, A.; Bugaev, A.; Ivashov, S.; Razevig, V.; Vasiliev, I. Microwave holography in detection of hidden objects under the surface and beneath clothes. In Proceedings of the 2011 XXXth URSI General Assembly and Scientific Symposium, Istanbul, Turkey, 13–20 August 2011; pp. 1–4. [Google Scholar] [CrossRef]
  48. Ahmed, S.S. Personnel screening with advanced multistatic imaging technology. In Passive and Active Millimeter-Wave Imaging XVI; SPIE: Orlando, FL, USA, 2013. [Google Scholar] [CrossRef]
  49. Meng, Y.; Lin, C.; Zang, J.; Qing, A.; Nikolova, N.K. Ka Band Holographic Imaging System Based on Linear Frequency Modulation Radar. Sensors 2020, 20, 6527. [Google Scholar] [CrossRef]
  50. Sheen, D.M.; McMakin, D.L.; Hall, T.E. Three-dimensional millimeter-wave imaging for concealed weapon detection. IEEE Trans. Microw. Theory Tech. 2001, 49, 1581–1592. [Google Scholar] [CrossRef]
  51. Zhuravlev, A.; Razevig, V.; Chizh, M.; Dong, G.; Hu, B. A New Method for Obtaining Radar Images of Concealed Objects in Microwave Personnel Screening Systems. IEEE Trans. Microw. Theory Tech. 2020, 69, 357–364. [Google Scholar] [CrossRef]
  52. David, M.; Sheen, R.; Trevor Clark, J.; Tedeschi, A.; Jones, M.; Hall, T.E. High-Resolution 3D Microwave Imaging of a Moving Target Using Optical Motion Capture; Passive and Active Millimeter-Wave Imaging XXII; SPIE: Orlando, FL, USA, 2019. [Google Scholar] [CrossRef]
  53. Gao, J.; Qin, Y.; Deng, B.; Wang, H.; Li, X. A Novel Method for 3-D Millimeter-Wave Holographic Reconstruction Based on Frequency Interferometry Techniques. IEEE Trans. Microw. Theory Tech. 2018, 66, 1579–1596. [Google Scholar] [CrossRef]
  54. Bechtel, T.; Capineri, L.; Falorni, P.; Inagaki, M.; Zhuravlev, A.; Razevig, V.; Ivashov, S.; Windsor, C. Detection of Latent Damage from Insect Activity in Wooden Structures through the Use of Holographic Subsurface Radar. In Proceedings of the PIERS, Marrakesh, Morocco, 20–23 March 2011; p. 95. [Google Scholar]
  55. Anishchenko, L.N.; Alborova, I.L.; Chizh, M.A.; Zhuravlev, A.V. Microwave imaging of biological tissue phantom in different frequency ranges. In Proceedings of the 2016 Progress in Electromagnetic Research Symposium (PIERS), Shanghai, China, 8–11 August 2016; pp. 4639–4643. [Google Scholar] [CrossRef]
  56. Huang, C.; Liu, T.; Lu, M.; Su, Y. Holographic subsurface imaging for medical detection. In Proceedings of the 15th International Conference on Ground Penetrating Radar, Brussels, Belgium, 30 June–4 July 2014; pp. 651–654. [Google Scholar] [CrossRef]
  57. Flores-Tapia, D.; Maizlish, O.; Alabaster, C.M.; Pistorius, S. A holographic reconstruction method for circular multistatic subsurface radar. In Proceedings of the 2012 International Waveform Diversity & Design Conference (WDD), Kauai, HI, USA, 22–27 January 2012; pp. 142–145. [Google Scholar] [CrossRef]
  58. Wu, H.; Ravan, M.; Amineh, R.K. Holographic Near-Field Microwave Imaging With Antenna Arrays in a Cylindrical Setup. IEEE Trans. Microw. Theory Tech. 2021, 69, 418–430. [Google Scholar] [CrossRef]
  59. Vasiliev, I.A.; Ivashov, A.I.; Ivashov, S.I.; Makarenkov, V.I.; Sablin, V.N.; Sheiko, A.P. Subsurface radar, Russian Patent # 2158015, 20.10.2000, RU 2 158 015 C2. Reference in WoS. Available online: http://0-apps-webofknowledge-com.brum.beds.ac.uk/full_record.do?colName=DIIDW&recordID=2001101210&log_event=no&search_mode=GeneralSearch&qid=2&log_event=yes&product=UA&SID=C6FUAJCOAHXc12dYwqC&viewType=fullRecord&doc=3&page=1 (accessed on 27 August 2021).
  60. Bossi, L.; Falorni, P.; Bartolini, A.; Capineri, L. Characterization of a 2 GHz holographic radar antenna for detection of subsurface targets. In Proceedings of the 18th International Conference on Ground Penetrating Radar, Golden, CO, USA, 14–19 June 2020; pp. 324–327. [Google Scholar] [CrossRef]
  61. Ivashov, S.I.; Capineri, L.; Bechtel, T.D. Holographic Subsurface Radar Technology and Applications, in Book UWB Radar. Applications and Design; James, J.T., Ed.; CRC Press: Boca Raton, FL, USA, 2012; pp. 421–444. ISBN 978-1-4200-8986-8. [Google Scholar]
  62. Available online: http://www.rslab.ru/downloads/ptm3.avi (accessed on 28 August 2021).
  63. Razevig, V.V.; Vasil’ev, I.A.; Ivashov, A.I.; Ivashov, S.I.; Makarenkov, V.I. Method of Obtaining Radio Holograms of Subsurface Objects. Russian Patent #2482518, 1 November 2011. Available online: http://0-apps-webofknowledge-com.brum.beds.ac.uk/full_record.do?colName=DIIDW&recordID=2013H61403&log_event=no&search_mode=GeneralSearch&qid=9&log_event=yes&product=UA&SID=F1YM3JgCMcXP2VTvp7o&viewType=fullRecord&doc=2&page=1 (accessed on 27 August 2021).
  64. Available online: http://www.rslab.ru/english/product (accessed on 27 August 2021).
  65. Zhuravlev, A.; Ivashov, S.; Vasiliev, I.; Razevig, V. Processing of Holographic Subsurface Radar Data. In Proceedings of the 14th International Conference on Ground Penetrating Radar, Shanghai, China, 4–8 June 2012; pp. 68–71. [Google Scholar] [CrossRef]
  66. Ivashov, S.; Razevig, V.; Vasiliev, I.; Bechtel, T.; Capineri, L. Holographic subsurface radar for diagnostics of cryogenic fuel tank thermal insulation of space vehicles. NDT Int. 2015, 69, 48–54. [Google Scholar] [CrossRef]
  67. Zhuravlev, V.; Ivashov, S.I.; Razevig, V.V.; Vasiliev, I.A.; Bugaev, A.S. Holographic subsurface radar RASCAN-5. In Proceedings of the 2013 7th International Workshop on Advanced Ground Penetrating Radar, Nantes, France, 2–5 July 2013; pp. 1–6. [Google Scholar] [CrossRef]
  68. Goodman, J.V. Introduction to Fourier Optics; McGraw-Hill: New York, NY, USA, 2005. [Google Scholar]
  69. Tikhonov, A.N. Solutions of Ill-Posed Problems; Winston: New York, NY, USA, 1977. [Google Scholar]
  70. Popov, A.V.; Kopeikyn, V.V.; Vinogradov, V.A.; Zapunidi, S.A. Reconstruction algorithms and experiments with a prototype of holographic subsurface radar. In Proceedings of the 4th International Conference on Antenna Theory and Techniques (Cat. No.03EX699), Sevastopol, Ukraine, 9–12 September 2003; Volume 2, pp. 561–563. [Google Scholar] [CrossRef]
  71. Popov, A.; Prokopovich, I.; Edemskii, D. Experimental implementation of microwave subsurface holography. In Proceedings of the 2016 Days on Diffraction (DD), St. Petersburg, Russia, 27 June–1 July 2016; pp. 340–345. [Google Scholar] [CrossRef]
  72. Zhang, Y.; Xiao, Z.; Wu, L.; Lu, X.; Wang, Y. Deep learning for subsurface penetrating super-resolution imaging. In Proceedings of the 2017 10th UK-Europe-China Workshop on Millimetre Waves and Terahertz Technologies (UCMMT), Liverpool, UK, 11–13 September 2017; pp. 1–4. [Google Scholar] [CrossRef]
  73. Sukhanov, D.; Zavyalova, K. Three-dimensional non-contact subsurface radiotomography through a non-planar interface between media. In Proceedings of the 15th International Conference on Ground Penetrating Radar, Brussels, Belgium, 30 June–4 July 2014; pp. 663–667. [Google Scholar] [CrossRef]
  74. Razevig, V.V.; Zhuravlev, A.V.; Bugaev, A.S.; Chizh, M.A.; Ivashov, S.I. Imaging under irregular surface using microwave holography. In Proceedings of the 2017 Progress in Electromagnetics Research Symposium—Fall (PIERS—FALL), Singapore, 19–22 November 2017; pp. 172–177. [Google Scholar] [CrossRef]
  75. Qin, T.; Bossi, L.; Bartolini, A.; Falorni, P.; Giannelli, P.; Zhao, Y.; Capineri, L. Influence Analysis of Uneven Surface on Landmine Detection Using Holographic Radar. In Proceedings of the 2018 Progress in Electromagnetics Research Symposium (PIERS-Toyama), Toyama, Japan, 1–4 August 2018. [Google Scholar] [CrossRef]
  76. Available online: https://www.geophysical.com/about-gssi (accessed on 27 August 2021).
  77. Available online: https://www.guidelinegeo.com/ (accessed on 27 August 2021).
  78. Ivashov, S.I.; Makarenkov, V.I.; Razevig, V.V.; Sablin, V.N.; Sheyko, A.P.; Vasiliev, I.A. Remote Control Mine Detection System with GPR and Metal Detector. In Proceedings of the Eight International Conference on Ground-Penetrating Radar, GPR’2000, Queensland, Australia, 23–26 May 2000; pp. 36–39. [Google Scholar] [CrossRef]
  79. Amineh, R.K.; Nikolova, N.K.; Ravan, M. Real Time Three Dimensional Imaging of Dielectric Bodies Using Microwave/Millimeter Wave Holography. In IEEE Press Series on RF and Microwave Technology; IEEE Press: Hoboken, NJ, USA, 2019; ISBN 978-1-119-53886-8. [Google Scholar] [CrossRef]
  80. Landmine Monitor. 2020. Available online: https://www.the-monitor.org/en-gb/reports/2020/landmine-monitor-2020.aspx (accessed on 27 August 2021).
  81. Joynt, V.P. Mobile metal detection: A field perspective. In Proceedings of the Second International Conference on the Detection of Abandoned Land Mines, MD’98, Edinburgh, UK, 12–16 October 1998; pp. 14–15. [Google Scholar]
  82. Sato, M. Dual Sensor ALIS for Humanitarian Demining and its Evaluation Test in Mine Fields in Croatia. In Proceedings of the IGARSS 2008—2008 IEEE International Geoscience and Remote Sensing Symposium, Boston, MA, USA, 7–11 July 2008. [Google Scholar] [CrossRef]
  83. Jane’s Mines and Mine Clearance Edition by Colin King; Janes Information Group: Coulston, UK, 1996; ISBN 978-0710618030.
  84. Daniels, D.; Braunstein, J.; Nevard, M. Using MINEHOUND in Cambodia and Afghanistan. J. ERW Mine Action 2014, 18, 14. [Google Scholar]
  85. Ivashov, S.; Razevig, V.; Vasilyev, I.; Zhuravlev, A.; Bechtel, T.; Capineri, L. The Holographic Principle in Subsurface Radar Technology. In Proceedings of the International Symposium to Commemorate the 60th Anniversary of the Invention of Holography, Springfield, MA, USA, 27–29 October 2008; pp. 183–197. [Google Scholar]
  86. Windsor, C.; Capineri, L.; Bechtel, T.D. Buried object classification using holographic radar. Insight-Non-Destr. Test. Cond. Monit. 2012, 54, 331–339. [Google Scholar] [CrossRef]
  87. Bechtel, T.; Pochanin, G.; Truskavetsky, S.; Dimitri, M.; Ruban, V.; Orlenko, O.; Byndych, T.; Sherstyuk, A.; Viatkin, K.; Crawford, F.; et al. Terrain Analysis in Eastern Ukraine and the Design of a Robotic Platform Carrying GPR Sensors for Landmine Detection. In Proceedings of the 2018 17th International Conference on Ground Penetrating Radar (GPR), Rapperswil, Switzerland, 18–21 June 2018; pp. 1–4. [Google Scholar] [CrossRef]
  88. Capineri, L.; Arezzini, I.; Calzolai, M.; Windsor, C.; Inagaki, M.; Bechtel, T.; Ivashov, S. High resolution imaging with a holographic radar mounted on a robotic scanner. In Proceedings of the Electromagnetics Research Symposium Proceedings, Stockholm, Sweden, 12–15 August 2013. [Google Scholar]
  89. Bossi, L.; Falorni, P.; Pochanin, G.; Ruban, V.; Ogurtsova, T.; Crawford, F.; Bechtel, T.; Capineri, L. Detection of targets from radar tracks of the UWB-GPR 1Tx+ 4Rx on the mobile platform. In Proceedings of the 18th International Conference on Ground Penetrating Radar, Golden, CO, USA, 14–19 June 2020; pp. 448–451. [Google Scholar] [CrossRef]
  90. Jonard, F.; Weihermüller, L.; Vereecken, H.; Lambot, S. Accounting for soil surface roughness in the inversion of ultrawideband off-ground GPR signal for soil moisture retrieval. Geophysics 2012, 77, H1–H7. [Google Scholar] [CrossRef]
  91. Altuncu, Y.; Akduman, I.; Yapar, A. Detecting and locating dielectric objects buried under a rough interface. IEEE Geosci. Remote Sens. Lett. 2007, 4, 251–255. [Google Scholar] [CrossRef]
  92. Razevig, V.; Zhuravlev, A.; Chizh, M.; Ivashov, S.; Bugaev, A. Hand-held Radar with Video Positioning System for Microwave Imaging. In Proceedings of the The 38th PIERS, St Petersburg, Russia, 22–25 May 2017; pp. 3052–3055. [Google Scholar] [CrossRef]
  93. Zhuravlev, A.; Razevig, V.; Ivashov, S.; Skrebkov, A.; Alekseev, V. On the Use of Microwave Holography to Detect Surface Defects of Rails and Measure the Rail Profile. Sensors 2019, 19, 1376. [Google Scholar] [CrossRef] [Green Version]
  94. Zoughi, R.; Huber, C.; Qaddoumi, N.; Ranu, E.; Otashevich, V.; Mirshahi, R.; Ganchev, S.; Johnson, T. Real-time and on-line near-field microwave inspection of surface defects in rolled steel. In Proceedings of the 1997 Asia-Pacific Microwave Conference, Hong Kong, China, 2–5 December 1997; pp. 1081–1084. [Google Scholar] [CrossRef]
  95. Gao, Y.; Ghasr, M.T.; Ying, K.; Dvorsky, M.; Boots, A.; Zoughi, R.; Palmer, D. Millimeter Wave Differential Probe System for Surface Crack Detection in Painted Aircraft Fuselage. In Proceedings of the 2019 IEEE International Instrumentation and Measurement Technology Conference (I2MTC), Auckland, New Zealand, 20–23 May 2019; pp. 1–6. [Google Scholar] [CrossRef]
  96. Ghasr, M.T.; LePape, Y.; Scott, D.B.; Zoughi, R. Holographical Microwave Imaging of Corroded Steel Bars in Concrete. Am. Concr. Inst. (ACI) Mater. J. 2015, 112, 115–124. [Google Scholar] [CrossRef]
  97. Available online: http://www.rslab.ru/english/project/mirascan/ (accessed on 28 August 2021).
  98. Ivashov, S.; Razevig, V.; Sheyko, A.; Vasilyev, I.; Bechtel, T. Holographic Radar as a Tool for Non-Destructive Evaluation of Structural Materials. In Proceedings of the 2005 SEM Annual Conference & Exposition on Experimental and Applied Mechanics, Portland, ON, USA, 7–9 June 2005. [Google Scholar]
  99. NASA. Columbia Accident Investigation Board Report; Government Printing Office: Washington, DC, USA, 2003; Available online: http://s3.amazonaws.com/akamai.netstorage/anon.nasa-global/CAIB/CAIB_lowres_full.pdf (accessed on 28 August 2021).
  100. Gofin, M.Y. Heat Resisting and Thermal Protecting Systems of Reusable Space Ships; Mir: Moscow, Russian, 2003; p. 672. [Google Scholar]
  101. Aviation Week & Space Technology; Informa Plc.: New York, NY, USA, 2003; p. 31. Available online: https://aviationweek.com/AWST (accessed on 28 August 2021).
  102. Aviation Week & Space Technology; Informa Plc.: New York, NY, USA, 2003; pp. 27–28. Available online: https://aviationweek.com/AWST (accessed on 28 August 2021).
  103. Aviation Week & Space Technology; Informa Plc.: New York, NY, USA, 2004; p. 58. Available online: https://aviationweek.com/AWST (accessed on 28 August 2021).
  104. Ivashov, S.I.; Vasiliev, I.A.; Bechtel, T.D.; Snapp, C. Comparison between impulse and holographic subsurface radar for NDT of space vehicle structural materials. In Proceedings of the Progress in Electromagnetics Research Symposium, Beijing, China, 26–30 March 2007; pp. 1816–1819. [Google Scholar]
  105. Ivashov, S.I.; Razevig, V.V.; Bechtel, T.D.; Vasiliev, I.A.; Capineri, L.; Zhuravlev, A.V. Microwave Holography for NDT of Dielectric Structures. In Proceedings of the IEEE International Conference on Microwaves, Communications, Antennas and Electronic Systems (COMCAS 2015), Tel-Aviv, Israel, 2–4 November 2015. [Google Scholar] [CrossRef]
  106. Ivashov, S.; Zhuravlev, A.; Chizh, M.; Razevig, V. High resolution MW holographic system for NDT of dielectric materials and details. In Proceedings of the 2016 16th International Conference on Ground Penetrating Radar (GPR), Hong Kong, China, 13–16 June 2016. [Google Scholar] [CrossRef]
  107. Chizh, M.A.; Zhuravlev, A.V.; Razevig, V.V.; Ivashov, S.I. Experimental Validation of Sparse Sensing Technique in Subsurface Microwave Holography. In Proceedings of the PIERS, Shanghai, China, 8–11 August 2016; pp. 1734–1738. [Google Scholar] [CrossRef]
  108. Ivashov, S.; Zhuravlev, A.; Razevig, V.; Chizh, M.; Bechtel, T.; Capineri, L.; Thomas, B. Frequency Influence in Microwave Subsurface Holography for Composite Materials Testing. In Proceedings of the 17th International Conference on Ground Penetrating Radar, GPR 2018, Rapperswil, Switzerland, 18–21 June 2018; pp. 98–103. [Google Scholar] [CrossRef]
  109. Ivashov, S.I.; Bugaev, A.S.; Zhuravlev, A.V.; Razevig, V.V.; Chizh, M.A.; Ivashov, A.I. Holographic Subsurface Radar Technique for Nondestructive Testing of Dielectric Structures. Tech. Phys. 2018, 63, 260–267. [Google Scholar] [CrossRef]
  110. Chizh, M.; Zhuravlev, A.; Razevig, V.; Ivashov, S. Detection of Water Inclusions in Honeycomb Composite Products by a Holographic Radar. In Proceedings of the 2019 IEEE International Conference on Microwaves, Antennas, Communications and Electronic Systems (COMCAS), Tel-Aviv, Israel, 4–6 November 2019; pp. 1–5. [Google Scholar] [CrossRef]
  111. Case, J.T.; Kharkovsky, S.; Zoughi, R.; Steffes, G.; Hepburn, F.L. Millimeter Wave Holographical Inspection of Honeycomb Composites. In Proceedings of the AIP Conference, Incheon, Korea, 18–20 May 2018; pp. 970–975. [Google Scholar] [CrossRef] [Green Version]
  112. Mazzinghi, A.; Freni, A.; Capineri, L. A microwave non-destructive testing method for controlling polymeric coating of metal layers in industrial products. NDT Int. 2019, 102, 207–217. [Google Scholar] [CrossRef]
  113. Ur Rahman, M.S.; Haryono, A.; Abou-Khousa, M.A. Microwave Non-destructive Evaluation of Glass Reinforced Epoxy and High Density Polyethylene Pipes. J. Nondestruct. Eval. 2020, 39, 26. [Google Scholar] [CrossRef]
  114. Abou-Khousa, M.A.; Ryley, A.; Kharkovsky, S.; Zoughi, R.; Daniels, D.; Kreitinger, N.; Steffes, G. Comparison of X-Ray, Millimeter Wave, Shearography and Through-Transmission Ultrasonic Methods for Inspection of Honeycomb Composites. AIP Conf. Proc. 2007, 894, 999. [Google Scholar] [CrossRef]
  115. Capineri, L.; Falorni, P.; Ivashov, S.; Zhuravlev, A.; Vasiliev, I.; Razevig, V.; Bechtel, T.; Stankiewicz, G. Combined holographic subsurface radar and infrared thermography for diagnosis of the conditions of historical structures and artworks. Near Surf. Geophys. 2010, 8, 355–364. [Google Scholar] [CrossRef] [Green Version]
  116. Ivashov, S.; Capineri, L.; Bechtel, T.; Razevig, V.; Zhuravlev, A.; Falorni, P. Use of holographic subsurface radar analysis in the preservation and restoration of cultural heritage objects. Surf. Topogr. Metrol. Prop. 2019, 7, 045017. [Google Scholar] [CrossRef]
  117. Capineri, L.; Zandonai, F.; Inagaki, M.; Razevig, V.; Ivashov, S.; Windsor, C.; Bechtel, T. RASCAN holographic radar for detecting and characterizing dinosaur tracks. In Proceedings of the 2013 7th International Workshop on Advanced Ground-Penetrating Radar, Nantes, France, 2–5 July 2013; pp. 71–76. [Google Scholar] [CrossRef]
  118. Inagaki, M.; Bechtel, T.; Capineri, L.; Ivashov, S.; Windsor, C. A small difference of permittivity observed in a holographic radar image of dinosaur footprints. In Conference: Society of Exploration Geophysics Japan; Lapan: Tokyo, Japen, 2013; pp. 117–120. (In Japanes) [Google Scholar]
  119. Galton, P.M.; Farlow, J.O. Dinosaur State Park, Connecticut, USA: History, footprints, trackways exhibits. Zubia 2003, 21, 129–174. [Google Scholar]
  120. Zhuravlev, A.; Ivashov, S.; Razevig, V.; Vasiliev, I. Inverse synthetic aperture radar imaging for concealed object detection on a naturally walking person. In Proceedings of the SPIE Symposium on Defense and Security, Radar Sensor Technology XVIII Conference, Baltimore, MD, USA, 5–7 May 2014; Volume 9074. [Google Scholar] [CrossRef]
  121. ProVision® Imaging. 2014. Available online: https://www.leidos.com/sites/g/files/zoouby166/files/2020-07/FS-Leidos-Provision2.pdf (accessed on 27 August 2021).
  122. People Screening with Automatic Detection Eqo, Producer Smiths Detection. Available online: https://www.smithsdetection.com/products/eqo/ (accessed on 27 August 2021).
Figure 1. Classification of main types of subsurface radar [2].
Remotesensing 13 03487 g001
Figure 2. Simple optical hologram of a point target.
Remotesensing 13 03487 g002
Figure 3. Schematic optical holography using an inclined beam (e.g., laser).
Remotesensing 13 03487 g003
Figure 4. Gabor’s optical hologram [12].
Remotesensing 13 03487 g004
Figure 5. Paper sheet with aluminum foil letters (ruler is 12 inches, or 30.48 cm).
Remotesensing 13 03487 g005
Figure 6. RASCAN holograms recorded through varying stacks of plaster sheets.
Remotesensing 13 03487 g006
Figure 7. Design of a holographic subsurface radar antenna [59]. The drawing shows the main elements of the design, as described in the following: (1) emitting feed antenna, (2) receiver feed antenna for parallel polarization, (3) receiver feed antenna for cross-polarization, (4) round waveguide, and (5) open end of waveguide. The dimensional parameters are D—waveguide diameter, L—waveguide length, and l—distance between the closed end of the waveguide and the plane of pin antennas 1 and 2.
Remotesensing 13 03487 g007
Figure 8. Radar image of reinforcing in concrete at 3.9 GHz. Mesh spacing is 20 cm × 20 cm at a depth of 3 cm to 4 cm [39].
Remotesensing 13 03487 g008
Figure 9. Cross- (a) and parallel (b) polarization-received signals recorded at a frequency of 4.0 GHz [39]. These images were recorded for a test wall inside of which small coins and metal wires were placed at different depths.
Remotesensing 13 03487 g009
Figure 10. Holographic subsurface radar RASCAN-5 [64].
Remotesensing 13 03487 g010
Figure 11. Geometry of a holographic imaging system.
Remotesensing 13 03487 g011
Figure 12. Mock-up of a wide-span system for mine detection.
Remotesensing 13 03487 g012
Figure 13. Radar images recorded by a wide-span mine detector.
Remotesensing 13 03487 g013
Figure 14. (a) Two-sensor MiRascan mine detection system and (b) block diagram of MiRascan HSR with MD.
Remotesensing 13 03487 g014
Figure 15. Mines used in experiments: (1) TC-6.1, (2) TC-2.5, (3) TM-62M, (4) TM-62PZ, (5) PTM-3, (6) MS-3, and (7) PMN-2.
Remotesensing 13 03487 g015
Figure 16. HSR and MD images of mines and clutter.
Remotesensing 13 03487 g016aRemotesensing 13 03487 g016b
Figure 17. HSR images recorded by RASCAN-4/4000.
Remotesensing 13 03487 g017
Figure 18. (a) HSR for mine detection [10]; (b) Experimental setup with spatial encoder.
Remotesensing 13 03487 g018
Figure 19. HSR on a robotic scanning platform [88].
Remotesensing 13 03487 g019
Figure 20. Robotic platform “Ugo 1st” [89]: (1) ISR antenna array, (2) ISR controller, (3) HSR, (4) 3D camera, and (4) antenna array.
Remotesensing 13 03487 g020
Figure 21. (a) Riverbank minefield in the Republic of Serbska and (b) minefield with a clearance lane in southern Lebanon.
Remotesensing 13 03487 g021
Figure 22. (a) MiRascan radar at work and (b) sample of plastic tubing.
Remotesensing 13 03487 g022
Figure 23. Experimental high-precision HSR system: (1) test sample, (2) antenna, (3) cables, (4) electromechanical scanning bed, and (5) VNA (ZVA 24).
Remotesensing 13 03487 g023
Figure 24. Mechanical drawing of composite mock insulation with three artificial defects.
Remotesensing 13 03487 g024
Figure 25. HSR images of the aerospace materials test sample with intentional (and unintentional) defects.
Remotesensing 13 03487 g025
Figure 26. Historical Russian Senate building during the time of restoration.
Remotesensing 13 03487 g026
Figure 27. (a) HSR antenna, (b) pipes and cables marked on the floor, and (c) pipes (light) draping over cable (dark).
Remotesensing 13 03487 g027
Figure 28. (a) Composite HSR image and (b) layout of pipes and cables.
Remotesensing 13 03487 g028
Figure 29. (a) The church of San Biaggio and (b) side-by-side optical and MW images of the medallion.
Remotesensing 13 03487 g029
Figure 30. Croce di San Marco.
Remotesensing 13 03487 g030
Figure 31. HSR images of the Croce di San Marco recorded at 3.7 GHz: (a) parallel polarization and (b) cross-polarization.
Remotesensing 13 03487 g031
Figure 32. Wooden beam in a historic structure with insect damage detected and revealed.
Remotesensing 13 03487 g032
Figure 33. Cast (a) and mold (b) of the Anamoepus dinosaur footprint.
Remotesensing 13 03487 g033
Figure 34. (a) Cast and mold cleanly mated and (b) separated by a < 1 mm slip of sand.
Remotesensing 13 03487 g034
Figure 35. Summed modulus of parallel and cross-polarization scans at 6.7 GHz (top); summed modulus of scans 6.4 GHz, 6.5 GHz, 6.6 GHz, and 6.7 GHz parallel and cross-polarization (middle); and photograph of the lower side of the limestone slab aligned to correspond with the scanned area (bottom).
Remotesensing 13 03487 g035
Figure 36. Schematic system for inverse aperture synthesis using radar and a video camera.
Remotesensing 13 03487 g036
Figure 37. (a) Mannequin with concealed weapons, (b) real part of a portion of the holographic interference pattern, and (c) reconstructed image at a distance of 45 cm.
Remotesensing 13 03487 g037
Publisher’s Note: MDPI stays neutral with regard to jurisdictional claims in published maps and institutional affiliations.

