Article

The Impacts of Farmland Loss on Regional Food Self-Sufficiency in Yangtze River Delta Urban Agglomeration over Last Two Decades

1
School of Remote Sensing and Information Engineering, Wuhan University, Wuhan 430079, China
2
Zhejiang Academy of Agricultural Sciences, Hangzhou 310000, China
3
Qingdao Urban Planning and Design Research Institute, Qingdao 266000, China
*
Author to whom correspondence should be addressed.
Remote Sens. 2021, 13(17), 3514; https://0-doi-org.brum.beds.ac.uk/10.3390/rs13173514
Submission received: 4 August 2021 / Revised: 28 August 2021 / Accepted: 30 August 2021 / Published: 4 September 2021

Abstract

:
Food security is essential for human survival and sustainable development. Due to rapid urbanization and industrialization, the farmland loss in Yangtze River Delta Urban Agglomeration (YRDUA) has threatened food security. Thus, this study intended to quantify the farmland loss and assess its impacts on food security in the YRDUA from 2000 to 2020 at three scales based on the Google Earth Engine platform. Our results show that the area of farmland in YRDUA is decreasing at a rather high speed in the past 20 years and the trend is getting worse. At the urban agglomeration scale, there was a farmland deficit of 0.44 million ha in 2000, followed by larger farmland deficits in 2010 and 2020. At the city scale, Shanghai had the largest scarcity of farmland. At the urban subgroup scale, Subgroup I in the west and Subgroup II in the north always maintained an oversupply of farmland, while Subgroup III in the east and Subgroup IV in the south faced serious food security problems. Our study suggests that farmland must be protected in YRDUA in order to ensure food self-sufficiency and promote regional sustainability.

1. Introduction

Food security has become a worldwide concern due to its important role in sustaining human survival and development [1,2]. In 2000, the United Nations proposed the Millennium Development Goals (MDGs), with the first and the most prominent goal to halve the proportion of people who suffer from hunger by the year 2015 [3]. By 2030, nations should be able to end hunger and ensure access by all people, in particular the poor and people in vulnerable situations, including infants, to safe, nutritious and sufficient food all year round [4,5]. According to the State of Food Security and Nutrition in the World (2019), more than 820 million people were still hungry and about 2 billion people in the world experienced moderate or severe food insecurity [6]. Food insecurity negatively affects human physical, social, emotional, and cognitive development and is a major social and environmental disruptor with serious repercussions [7,8]. Thus, attention to food security is essential for maintaining sustainable development of the world. Although the research directions and contents vary greatly, their ultimate goal is to provide reasonable advice and help to ensure food security, which is related to economic development and national security, and plays a crucial role in the sustainable development of world and human well-being [9,10].
Food security issues are not only related to population growth, but also influenced by farmland loss. In the process of urbanization, a large flow of ruralurban migration has resulted in a quick increase of urban area [11,12], which has resulted in farmland loss [13,14,15]. As a developing country with the largest population in the world, China’s food security has received close attention worldwide. It’s agroecosystem has experienced dramatic alterations because of climate change and policy impact during the last three decades, threatening its agricultural sustainability [16]. In 2019, the population in China reached 1.47 billion [17], accounting for 19% of the global population, while the per capita farmland area of China is about 0.1 ha, which is far below the world average [18]. However, in order to maximize economic benefit and increase GDP, Chinese governments at all levels still give priority to urban constructions, which brought stress to food security [19]. Since China’s reform and opening-up policy, a large amount of foreign investment has been introduced and real estate has boomed [20], resulting in extensive expansion of built-up land and continuous loss of farmland.
The Yangtze River Delta Urban Agglomeration (YRDUA) has been well-known as one of the main grain-producing areas of China since the Nan-Song Dynasty. The grain yield per hectare in this area is more than twice the national average. However, with the rapid urbanization [21], the industry and services account for an increasing proportion of its GDP, and grain is no longer the protagonist of the “hometown of fish and rice”. Its status as a “granary” has gradually declined, giving way to the Northeast Plain of China. But, is the YRDUA faced with food insecurity now? To answer this question, we quantified the farmland loss and its impacts on regional food self-sufficiency at multiple scales from a hierarchical perspective. Specifically, the objectives of this study were to: (1) quantify the farmland change in YRDUA from 2000 to 2020; (2) identify the urban subgroups with socio-economic ties; (3) estimate the surplus and deficit of farmland at different scales.

2. Study Area and Hierarchical Structure of Urban Systems
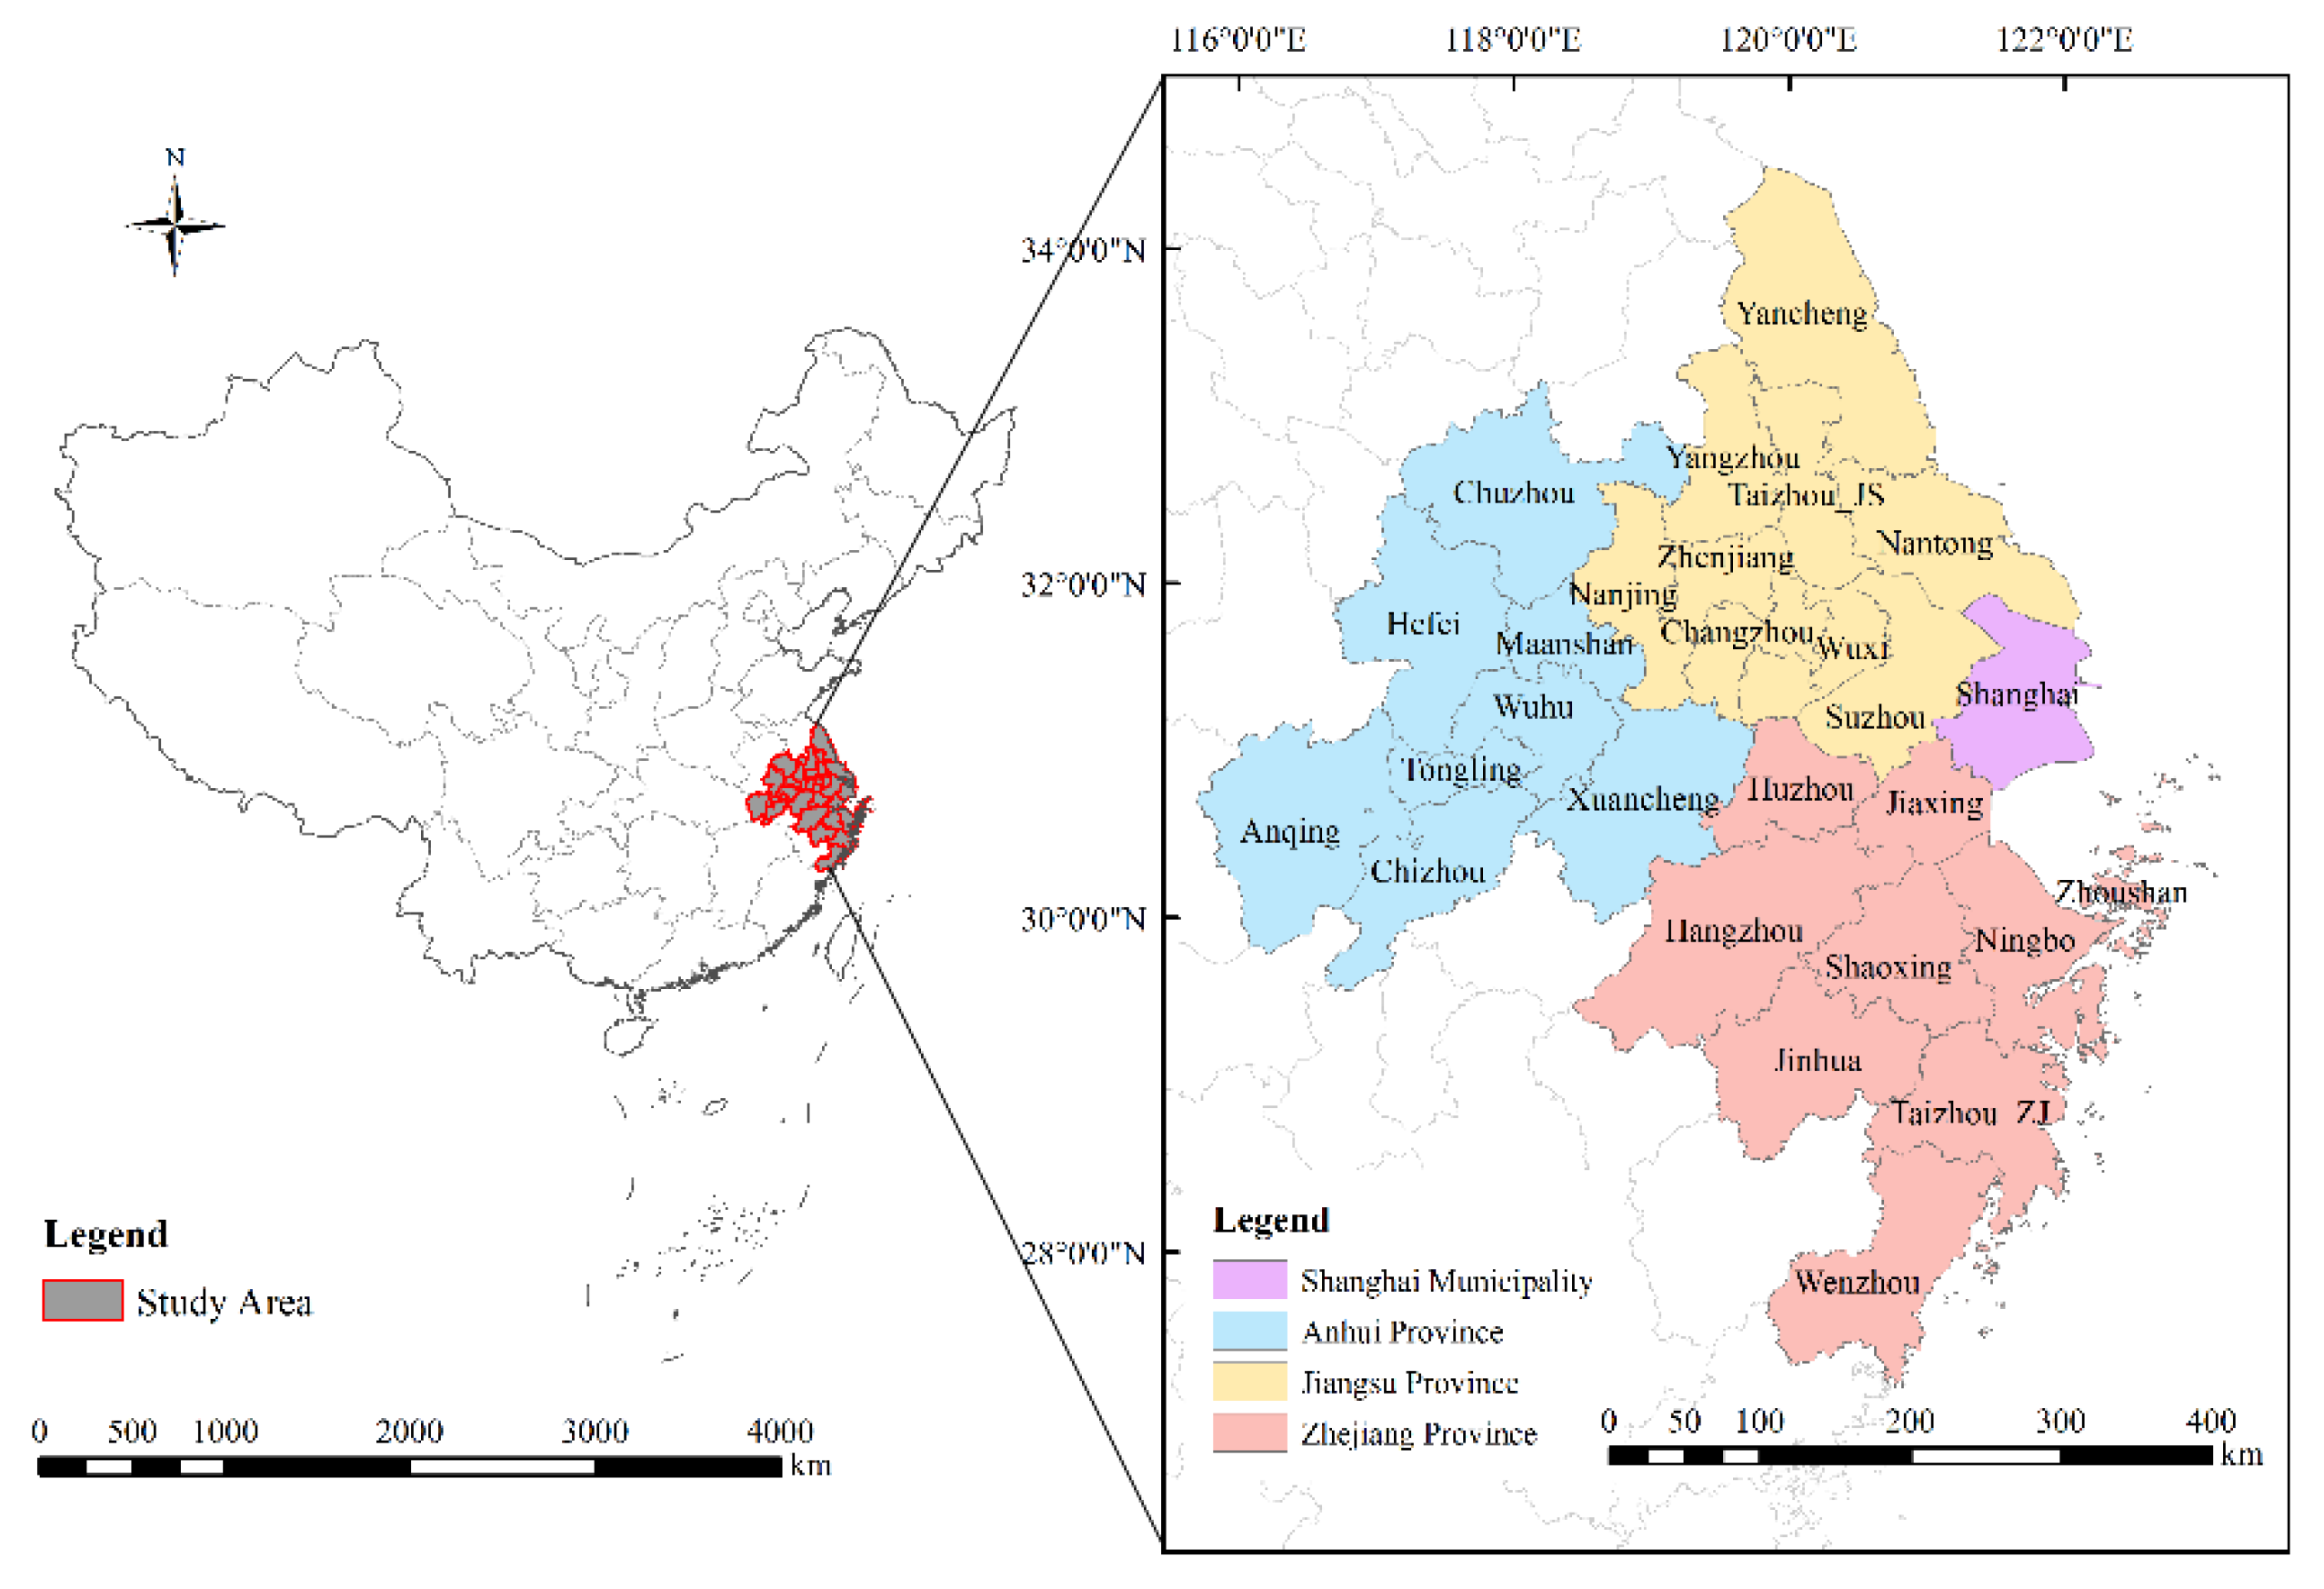
2.1. Study Area

The YRDUA is located at eastern coastal China, 115°46′ E–123°25′ E, 27°03′ N–34°28′ N, with a total land area of more than 210,000 km2, and a total population of more than 150 million (Figure 1). It belongs to the humid subtropical zone, which is characterized by short cold dry winters and long hot rainy summers. The average annual temperature is approximately 13 °C–20 °C and the annual rainfall is about 1000–1400 mm. It is one of the regions with the most active economic development, the highest degree of openness, and the strongest innovation capability in China. As an important intersection of the two national strategies of the “Belt and Road” and the Yangtze River Economic Belt, it has a decisive strategic position in the overall situation of China’s modernization and the all-round opening pattern.

2.2. Hierarchical Structure of YRDUA

In both the natural and the artificial worlds, complex systems are often hierarchically organized [22]. Especially the urban system, often presents a hierarchical structure with nonlinear pattern process interactions within and across different scales in space and time [23]. In fact, many geographic phenomena are scale-dependent [24,25]. Research conducted at different scales may lead to different conclusions. Therefore, some of urban theories and hypotheses can be reexamined in a hierarchical perspective. A hierarchy system has both vertical structure and horizontal structure [26]. In this study, vertical structure is deemed as scale, which indicates urban agglomeration scale, urban subgroup scale and city scale. Horizontal structure is deemed as different cities, which can be compared in the same urban subgroup or different urban subgroups. Then the research on farmland loss and its impact on food self-sufficiency in the YRDUA between 2000 and 2020 was carried out at multiple scales from a hierarchical perspective.

3. Materials and Methods

3.1. Data Sources

Based on the Google Earth Engine (GEE) platform, Landsat images are used for land use classification. Due to the abundant sunshine and rain in summer, it is the most vigorous season for crops to grow, which is conducive to the extraction of farmland. Therefore, Landsat surface reflectance data in summer was used for interpretation in this study. Unlike the original Landsat data set and the TOA reflectance data set, the images in the Landsat surface reflectance data set are data after radiation correction and atmospheric correction, which can better reflect the real situation on the ground.
Socio-economic data in YRDUA, including the total population, grain yield, total agricultural output value and sown area of crops, are obtained from the Statistics Bureau of each city. Since the statistical data of cities in 2020 have not been published, the data in 2019 are used for calculation. The food self-sufficiency rate and the annual grain demand per capita refer to the “Outline of Medium- and Long-term Planning for National Food Security (2008–2020)”: the food self-sufficiency rate is 95%; the annual grain demand per capita is calculated by 389 kg/person in 2010 and 395 kg/person in 2020 (assuming that the grain demand per capita each year increases at a certain rate).

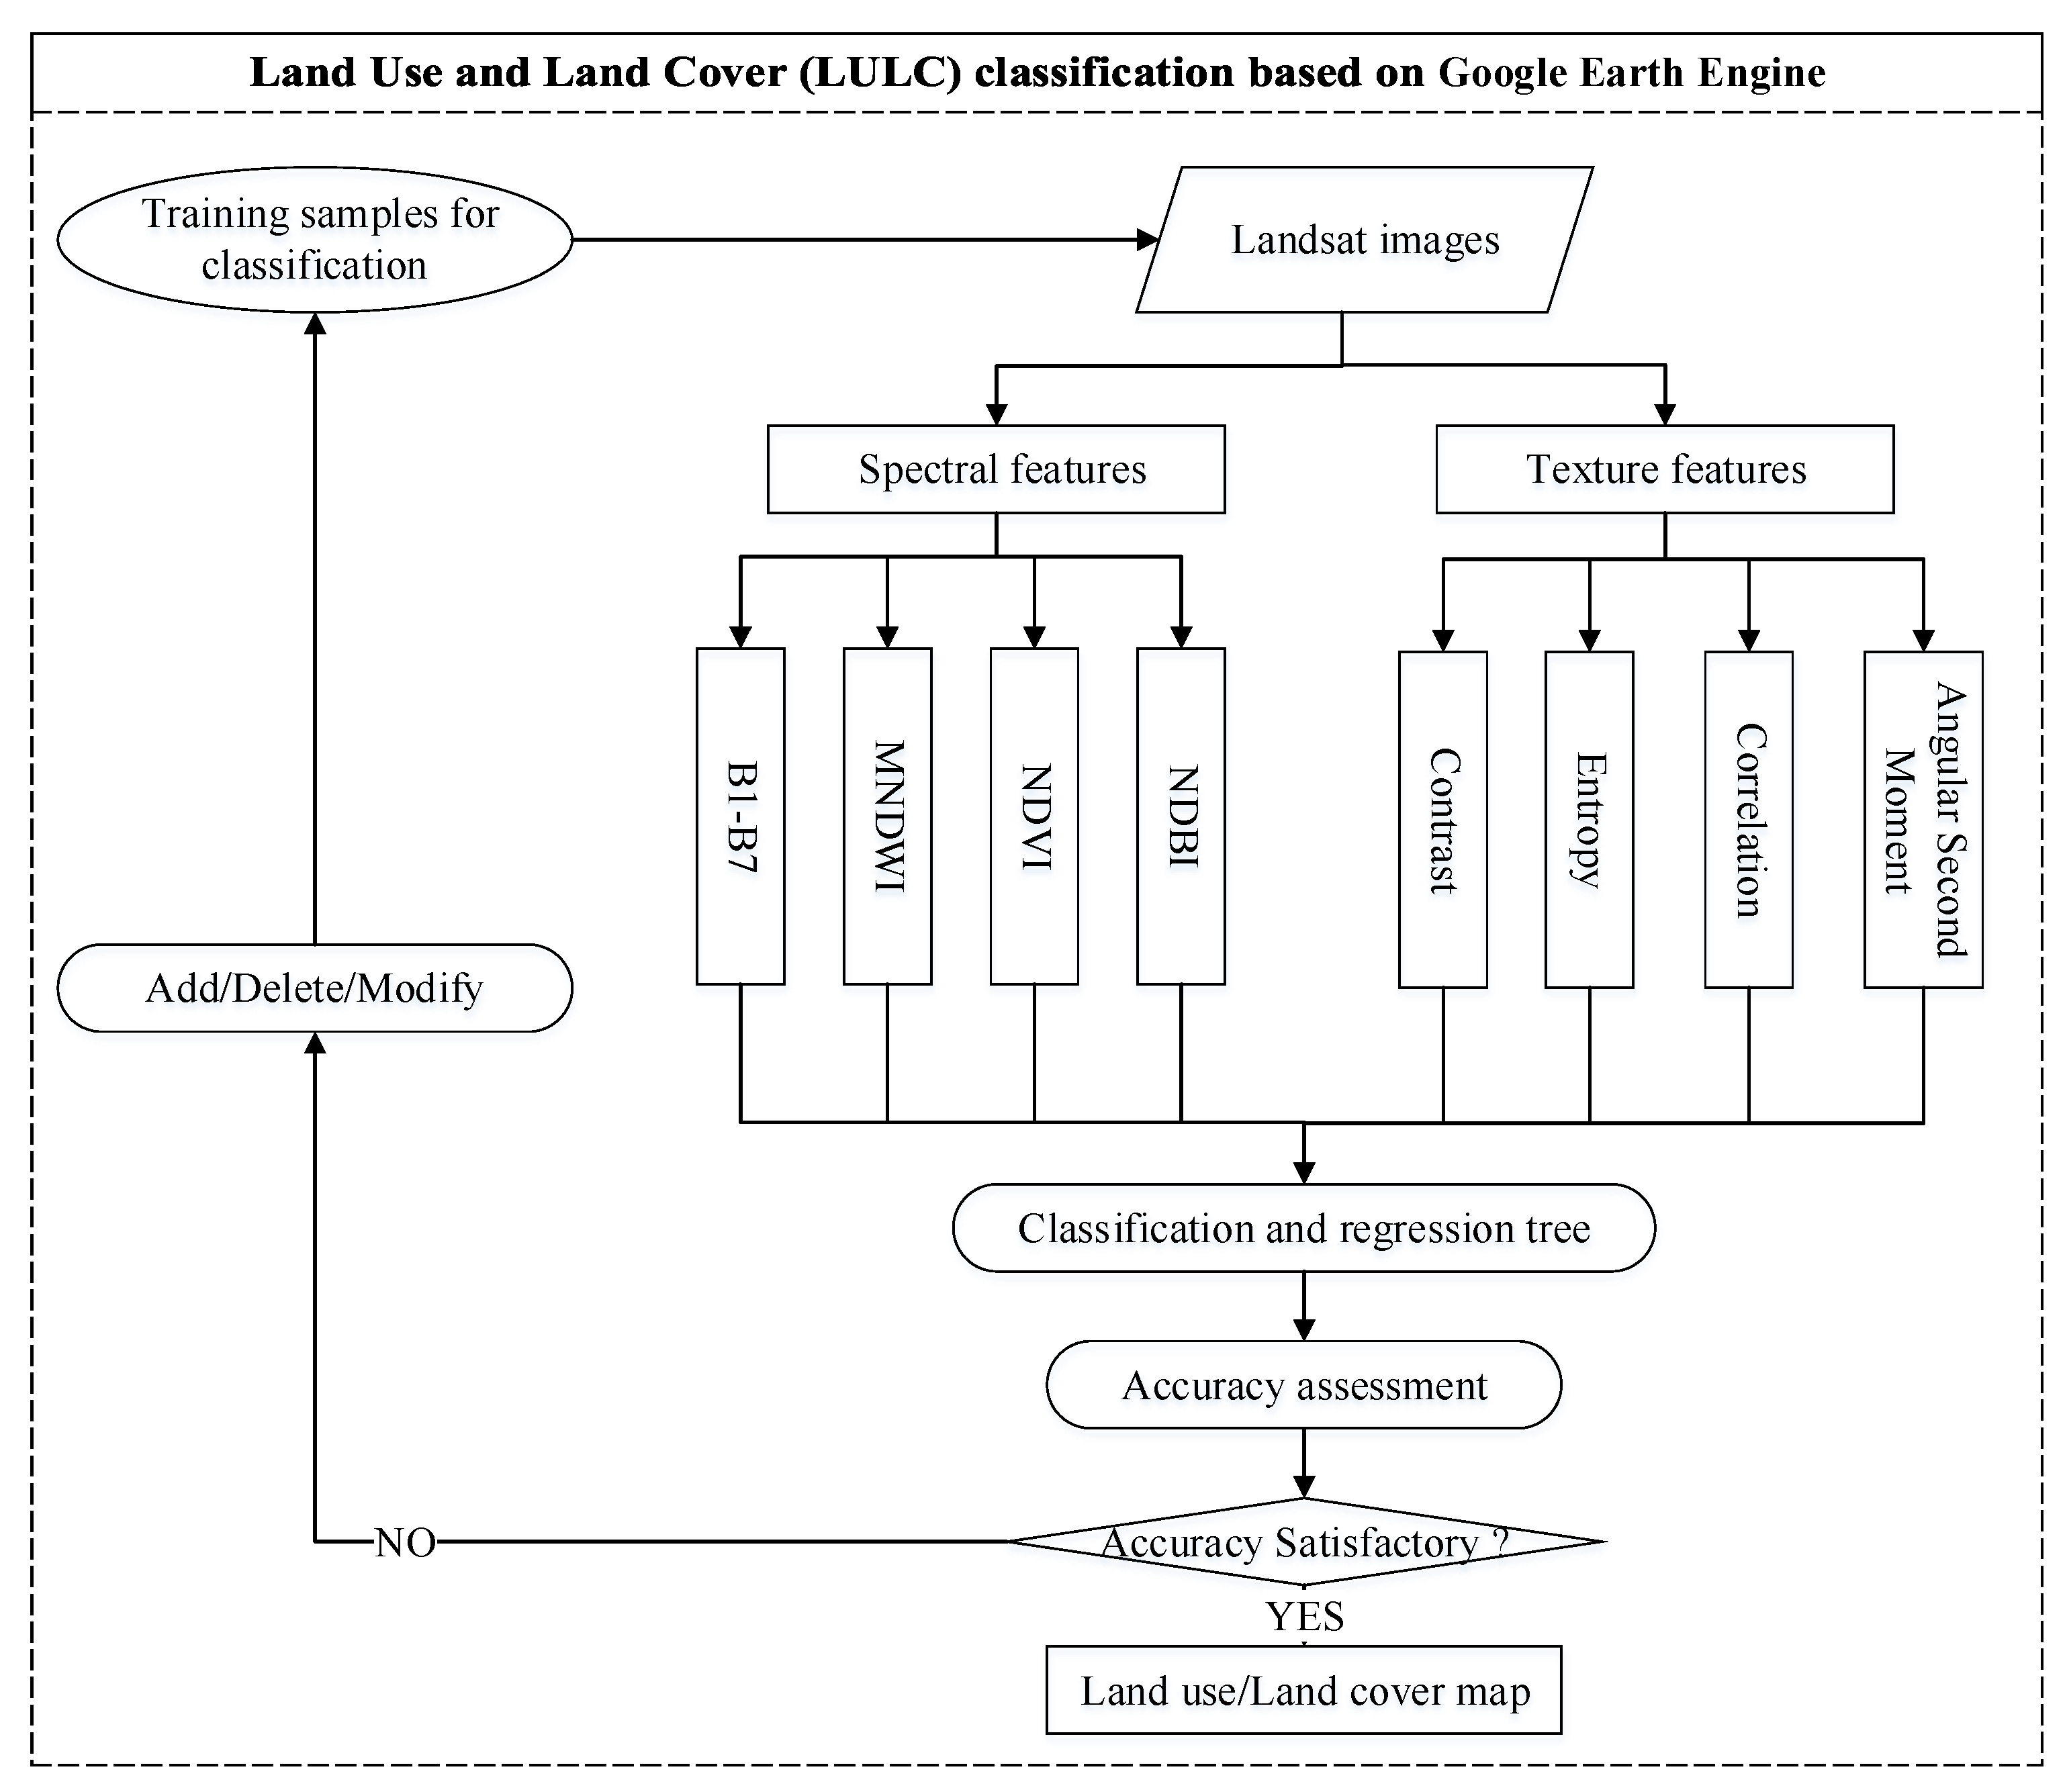
3.2. Land Use and Land Cover Classification and Accuracy Assessment

3.2.1. Classification and Regression Tree (CART)

This paper carries out land use classification based on GEE platform. GEE is a free geographic computing cloud platform provided by Google, which can quickly access remote sensing images and other earth observation data in batches, and provide sufficient computing power to visually calculate and analyze the data. Many LULC mapping projects have been conducted successfully all over the world based on this platform, indicating the usefulness of GEE for extensive Earth observation [27]. The specific process is as shown in Figure 2.
The classification and regression tree (CART) algorithm [28] was used for land use classification, which is simple and has high classification accuracy. It forms a binary decision tree through cyclic analysis of the training data set composed of test variables and target variables. In the process of decision tree construction, Gini Index in economics is used as the criterion to select the best test variable and segmentation threshold. The Gini Index is defined as follows:
Gini   Index = 1 j = 1 J p 2 ( j / h )
p ( j / h ) = n j ( h ) n ( h )
j = 1 J p ( j / h ) = 1
where p ( j / h ) is the probability that the test variable h belongs to class j when a sample is randomly selected from the sample set, n j ( h ) is the number of samples belonging to class j when the test variable value is h , n ( h ) is the number of samples whose test variable value is h in the training sample set and j is the number of categories.
Moreover, in order to avoid the phenomenon of overfitting, the CART algorithm prunes the generated tree, which is mainly divided into two steps: the first step is to generate various pruned decision trees from the original decision tree; the second step is to use cross-validation to test the predictive ability of the decision tree after pruning, and the post-pruning decision tree with the best generalization prediction ability is selected as the final CART tree. The decision tree model is simplified by pruning to ensure that the accuracy rate is as high as possible with the lowest tree height. Finally, this tree is used to classify the unknown data. In the future, we may leverage the recent error-tolerant deep learning methods [29,30,31] to further improve the modification performance.

3.2.2. Accuracy Assessment

The accuracy assessment method based on location information is adopted in this study. Before selecting verification points, the minimum number of verification points should be determined, which is related to whether the accuracy assessment results are reliable or not. The number of verification points used for confusion matrix accuracy assessment [32] can be calculated as follows:
n = B / 4 b 2
where n is the number of verification points, B is the critical value of the chi-square test ( 1 b / m ) with 1 degree of freedom, b is the confidence error and m is the number of categories. There are five land use types in this study. Assuming that the confidence level requirement is above 95%, the error tolerance range is 5%. Under the assumption, the critical value of the degree of freedom 1 under the chi-square test is 6.64, so at least 664 verification points are required for accuracy assessment.
In total, 1750 verification points are selected online based on the Google Earth Engine platform for accuracy assessment. Among them: 400 verification points for water bodies, 400 verification points for forest, 450 verification points for farmland, 400 verification points for built-up land and 100 verification points for unutilized land. In addition, farmland is the focus category of this study, so the samples selected for classification and the number of verification points for accuracy assessment are more than other categories.

3.3. Measurement of Farmland Surplus and Deficit

The measurement of farmland surplus and deficit mainly considers the supply and demand of farmland. The minimum amount of farmland required to meet people’s food needs (demand of farmland) is defined as [33]:
D = n α c S Y
where D is the demand of farmland, n is the number of population, α is self-sufficiency rate of food, c is the annual grain demand per capita, S is the farmland area, Y is the grain yield per year.
Then the number and the coefficient of surplus and deficit can be calculated as follows:
U = S D
λ = U S 100 %
where U is the number of surplus and deficit, U > 0 means the supply of farmland is greater than the demand, that is, the farmland is in surplus; U < 0 means that the supply of farmland is less than the demand, that is, the farmland is in deficit; λ is the coefficient of surplus and deficit, when λ > 0 , the greater the surplus; when λ < 0 , the smaller the deficit.

3.4. Urban Subgroup Extraction

The extraction of urban subgroups mainly relies on the analysis of the multi-value relationship matrix derived from the gravity model. The original gravity model comes from Newton’s law of gravitation, which expresses the gravity between two objects as the relationship between distance and mass. In 1942, Zipf first applied gravity model in spatial analysis of urban agglomerations [34]. Later, more and more scholars improved the gravity model according to the specific needs of the study and applied it to analyze the connection between regions. Based on the existing research [35,36] and the actual needs, the original gravity model is modified as follows:
F i j = k i j V i P i A i 3 V j P j A j 3 D i j 2
k i j = V i V i + V j
where F i j is the agricultural economic connection degree between city i and city j , V i and V j are the total agricultural output value of cities i and j , P i and P j are the resident population of cities i and j , A i and A j are the crop sown area of cities i and j , D i j is the traffic mileage between cities i and, j, kij is the empirical constant, which is used to indicate the unequal economic development level and economic connection between different cities.
With the help of the Ucinet6.237 software, CONCOR (convergent correlation) algorithm is used to cluster 27 cities in the YRDUA. CONCOR is an iterative correlation convergence method, which is mainly based on Pearson correlation coefficient. It calculates the correlation coefficient of each row or column of the initial matrix to obtain a correlation coefficient matrix C 1 with the value between −1 and 1. The value in the matrix is related to its correlation, where −1 means completely irrelevant and 1 means completely correlated. Then the C 1 matrix is taken as the input and the correlation coefficients between the rows or columns of the matrix are calculated to get the new matrix. According to this rule, iteration continues until a correlation coefficient matrix consisting of only 1 and −1 is finally generated [37,38]. According to this matrix, cities in the YRDUA can be divided into several subgroups.
In the CONCOR module of Ucinet6.237 software, the max depth of splits is set to 3 and the convergence criteria is set to 0.2. Taking the multi-valued relationship matrix calculated by the gravity model as input, the multivariate relationship data analysis is carried out. After several iterations, the tree diagram reflecting the internal hierarchical structure of YRDUA is obtained. Cities with strong, direct, and close connections are grouped together, which is the basis for dividing urban subgroups.

4. Results

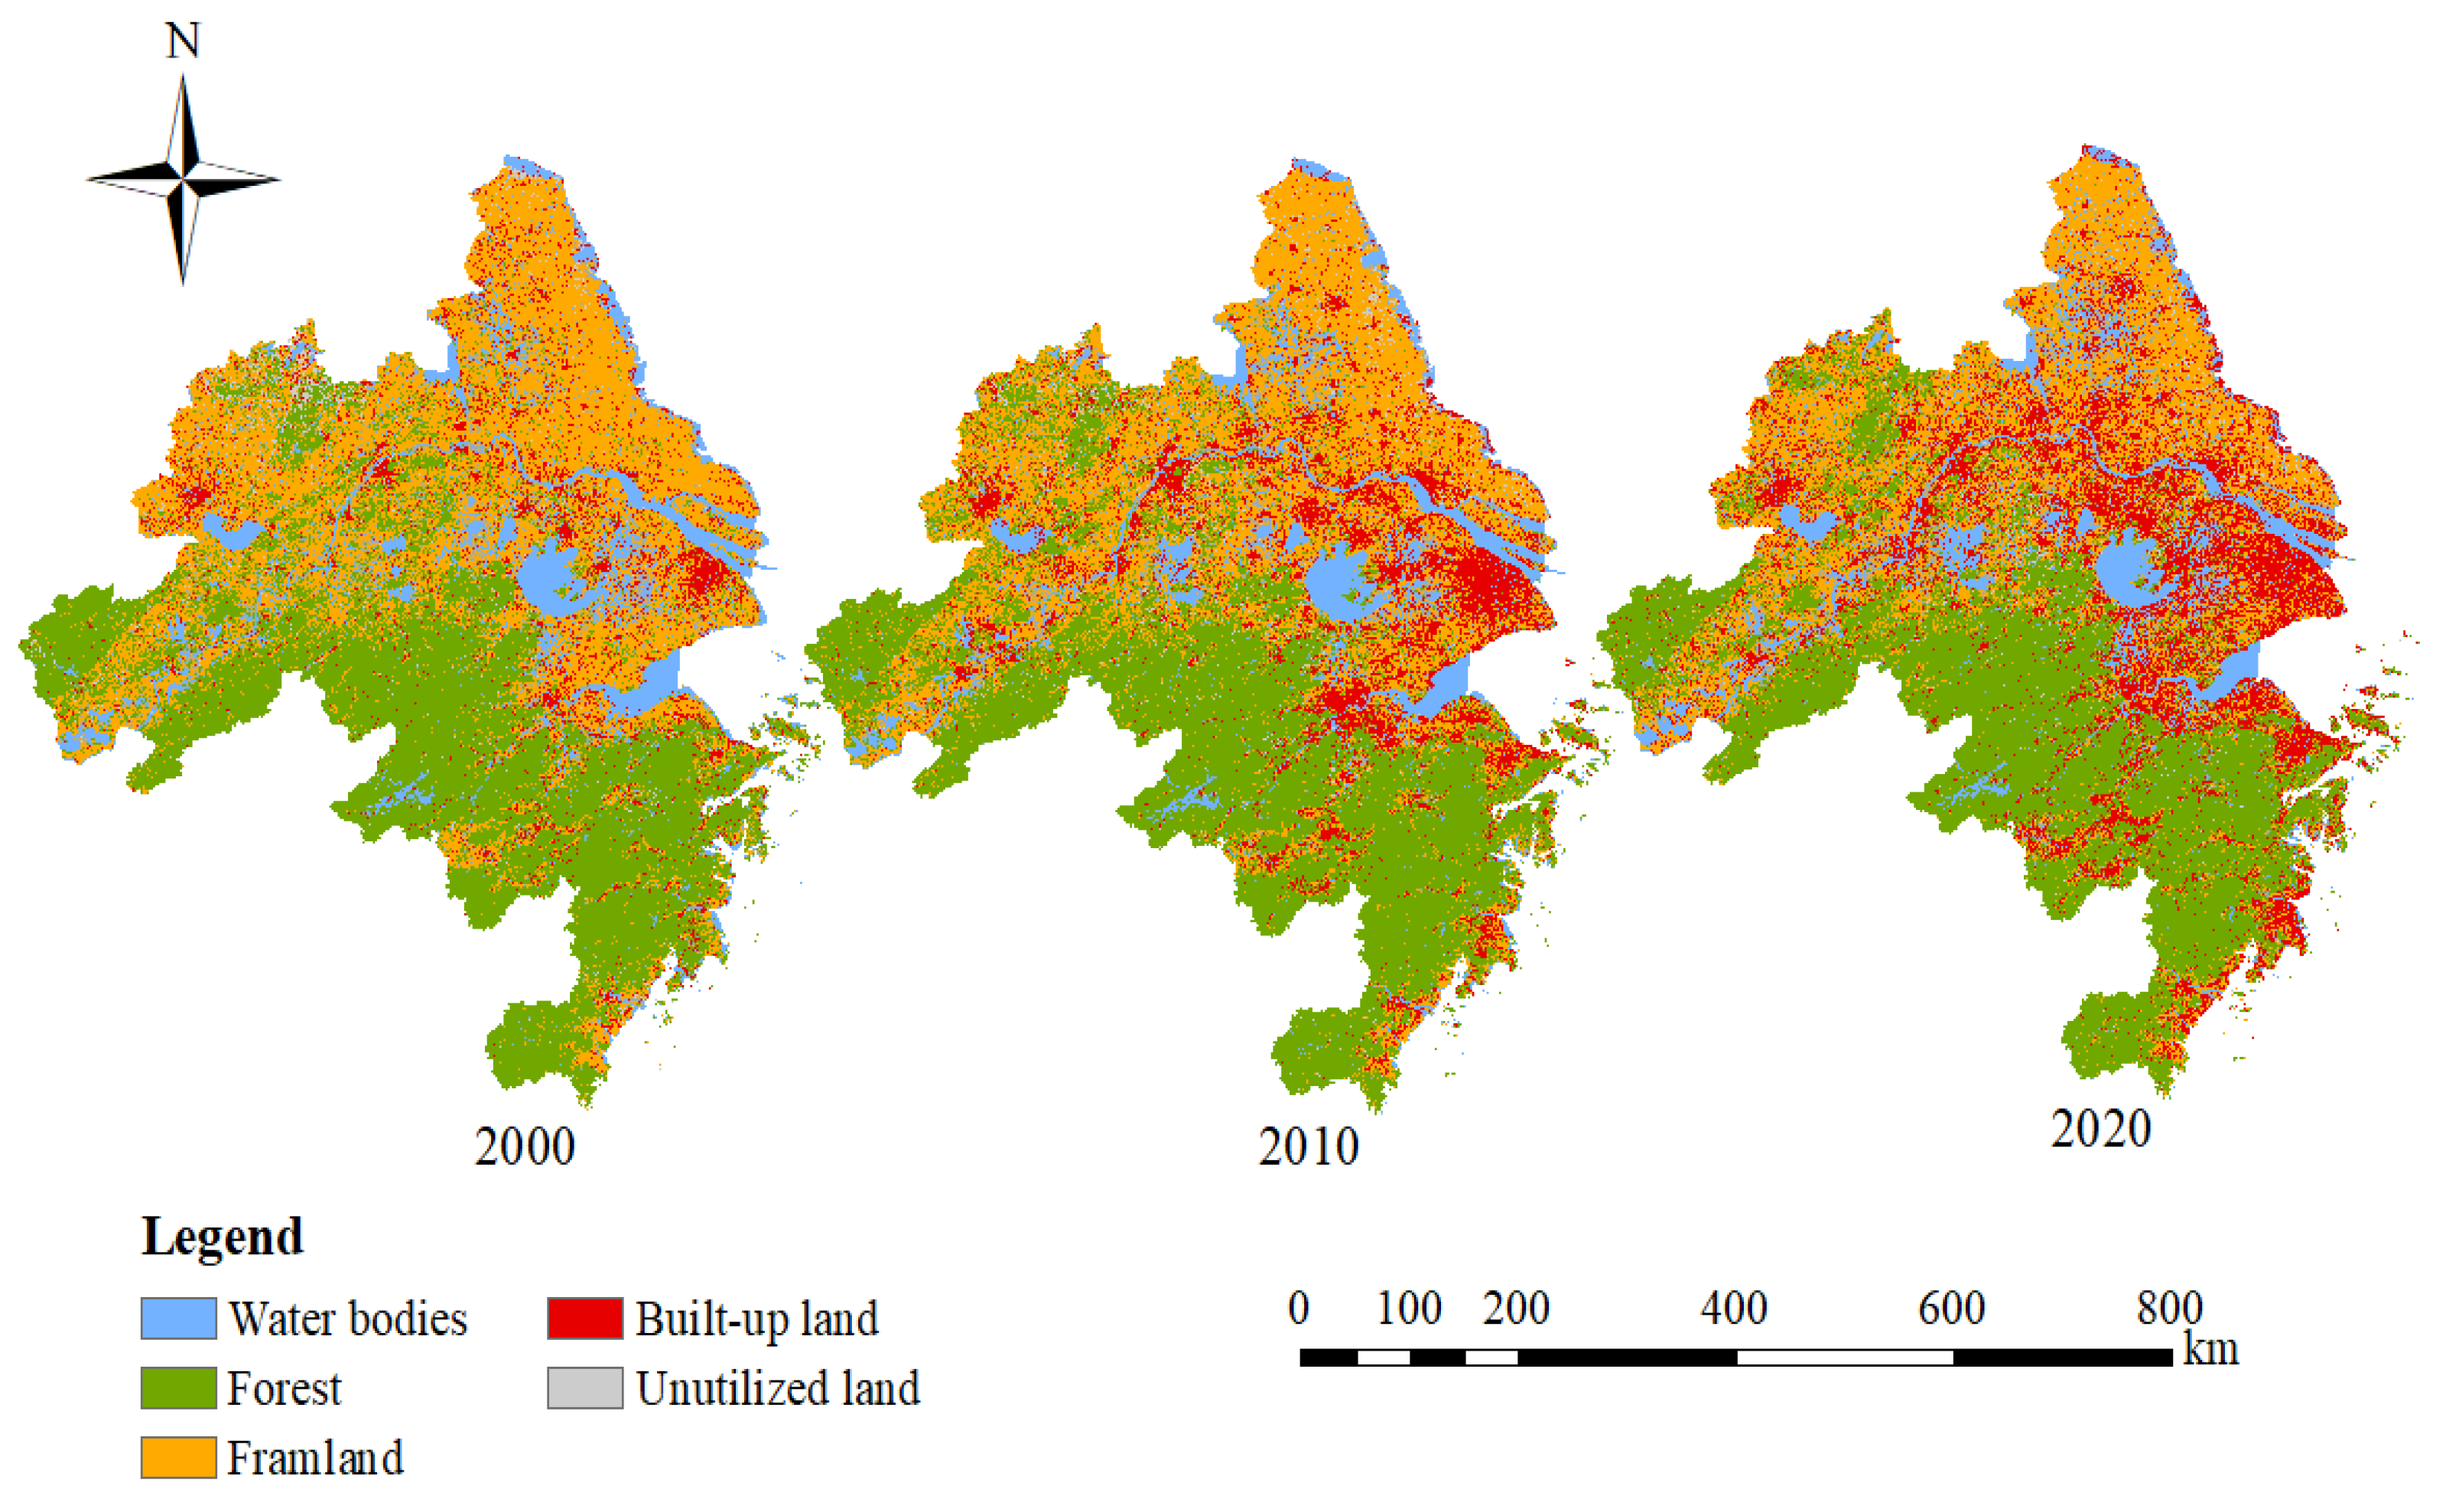
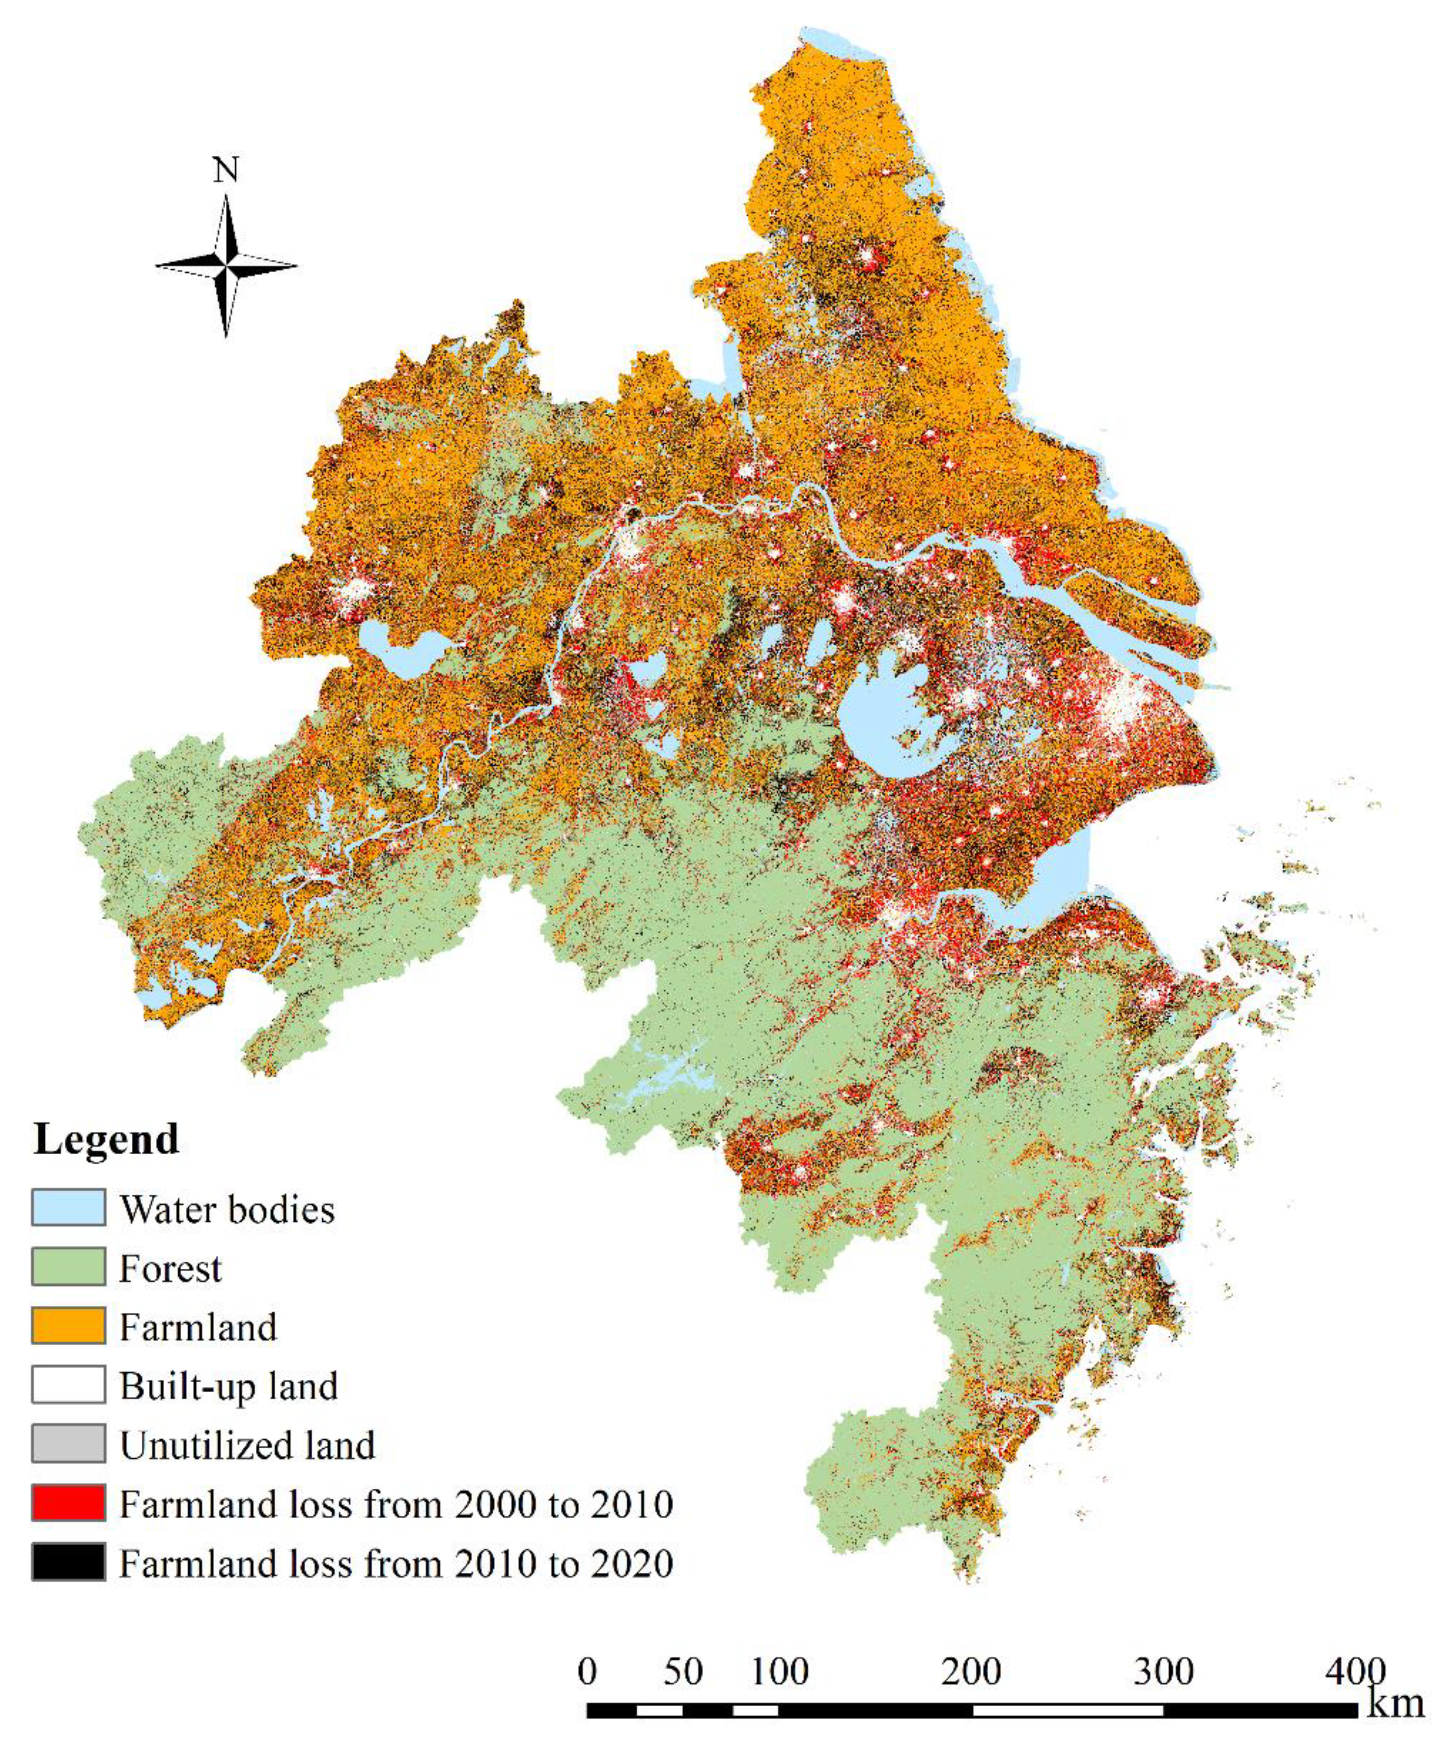
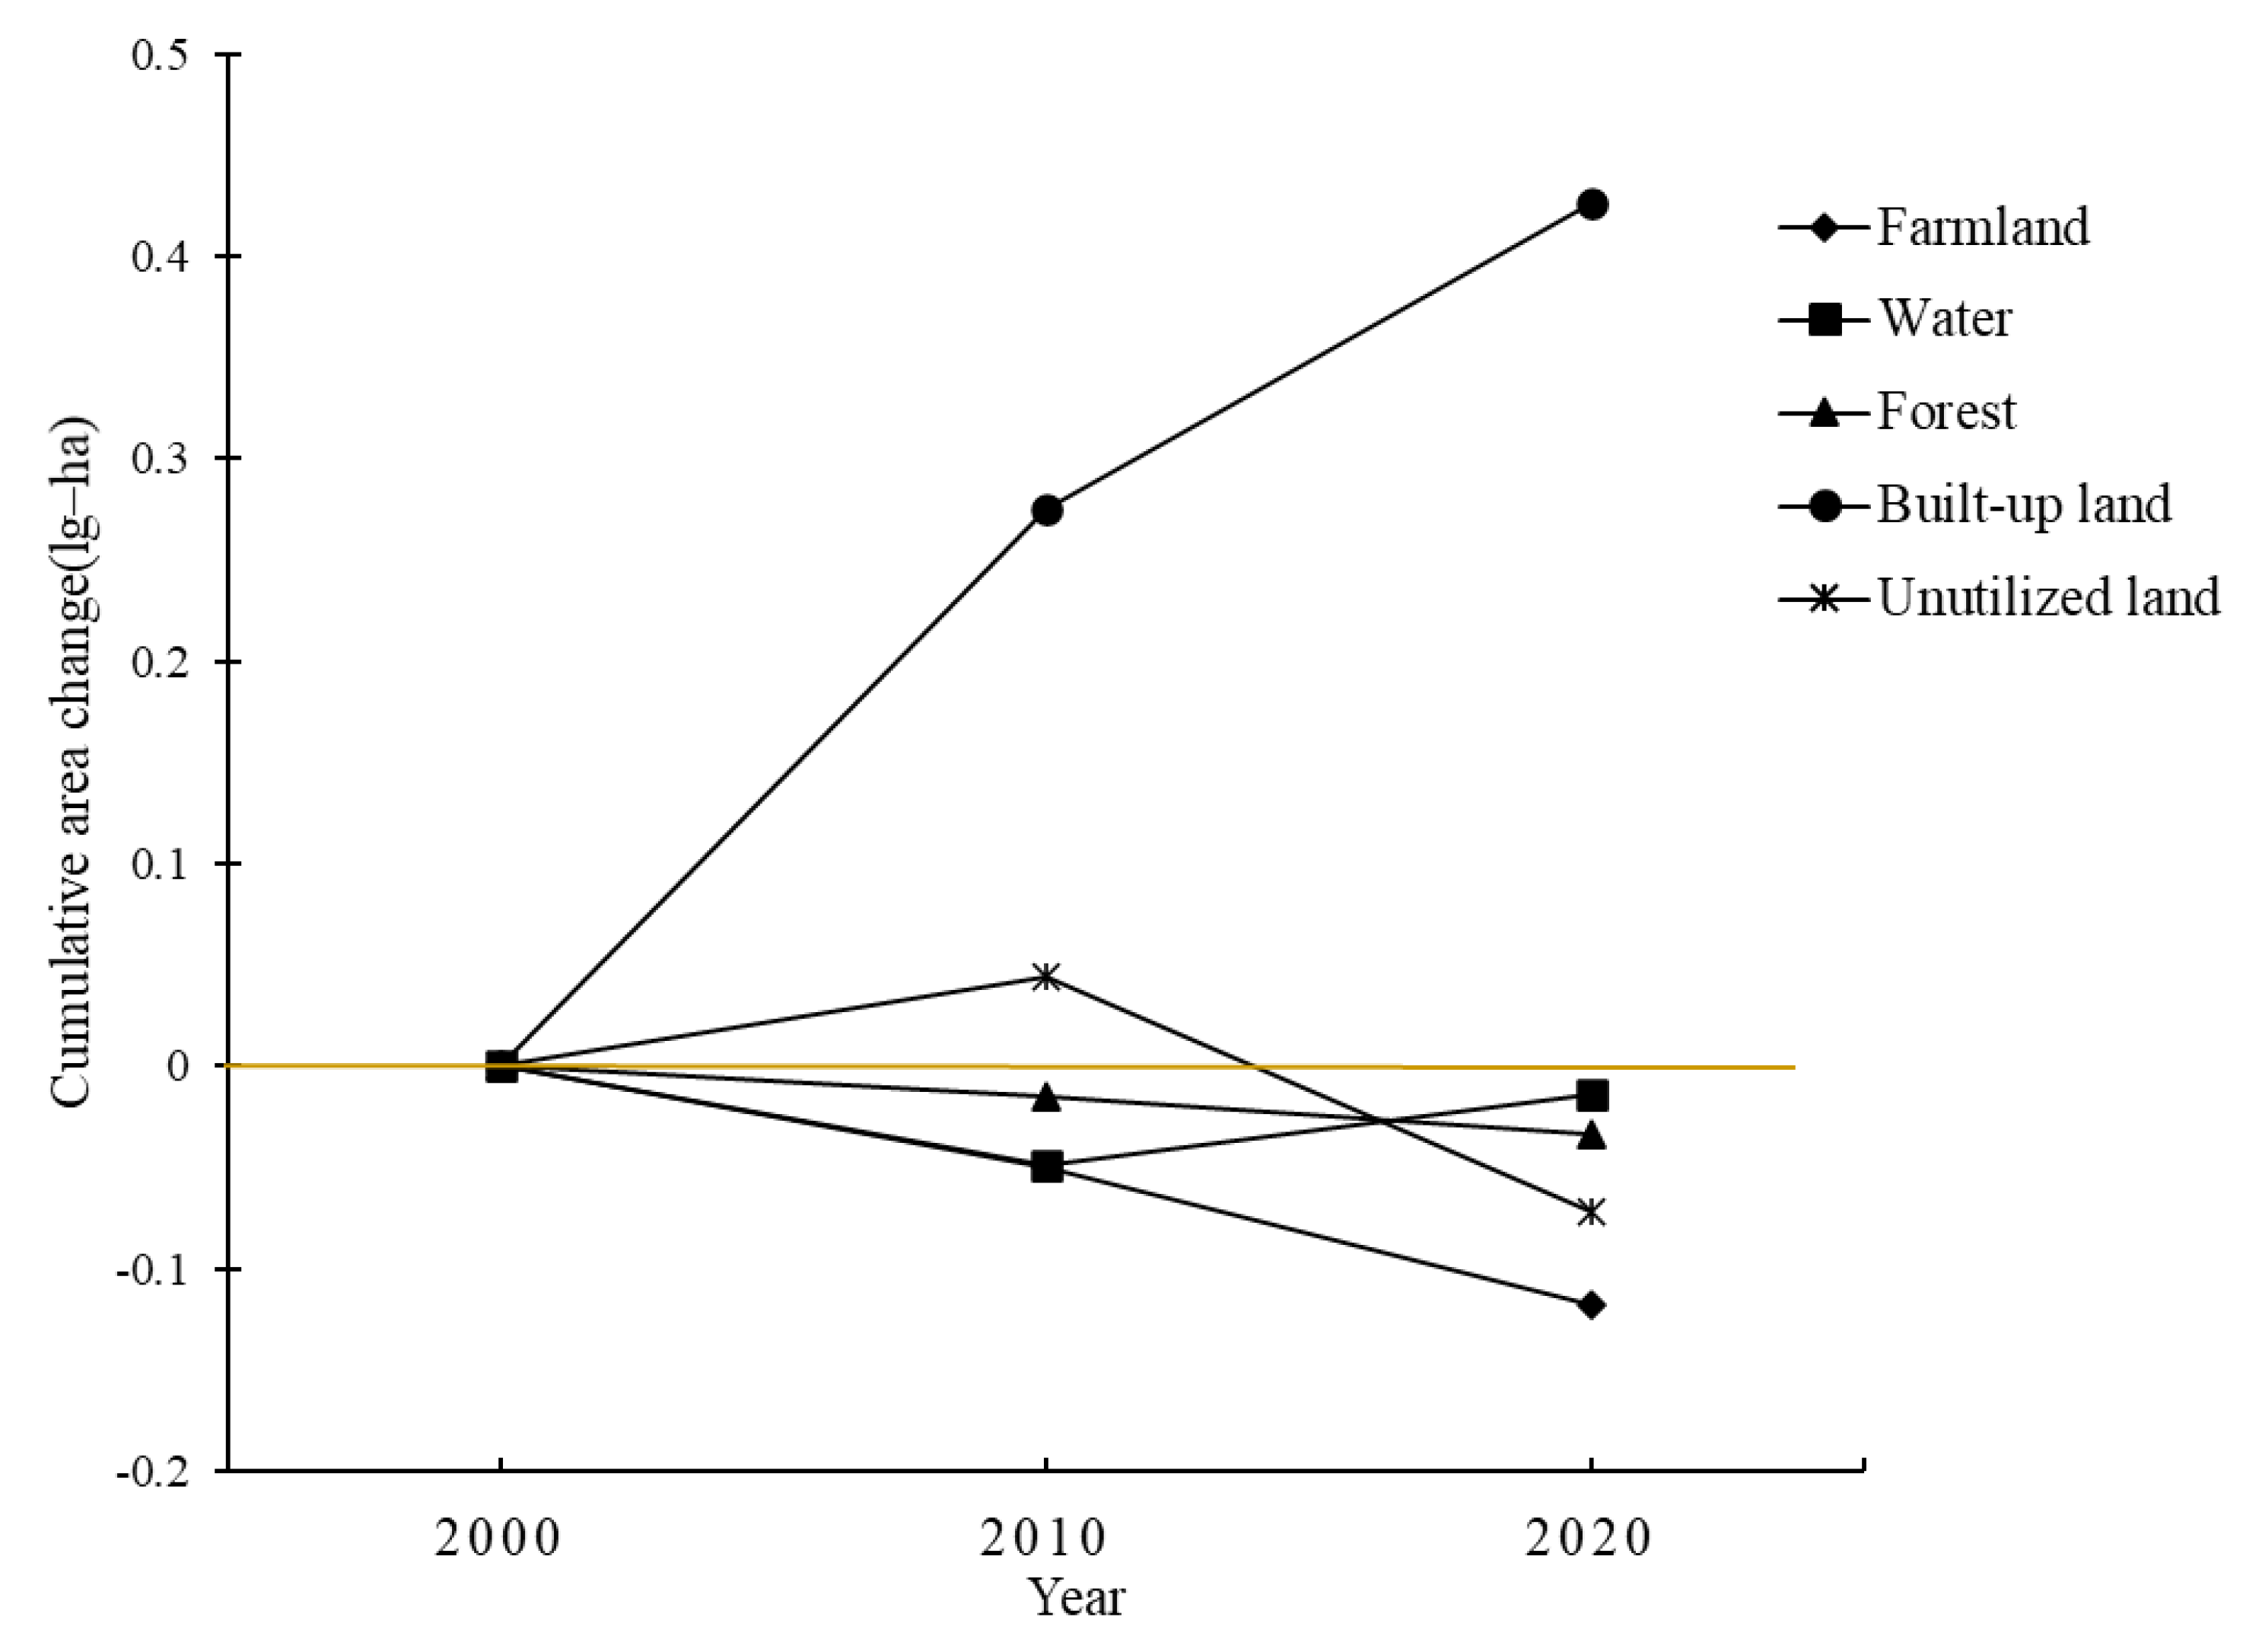
4.1. Land Cover Dynamics

Figure 3 is the LULC map of YRDUA from 2000 to 2020. It shows that over the past 20 years, land use in YRDAU has undergone tremendous changes, mainly manifested in the reduction of farmland area and the expansion of built-up land. In 2000, the area of farmland is large and the distribution of farmland is concentrated. Later, built-up land increased significantly at the expense of farmland, especially in large cities.
The overall accuracy and kappa coefficient of classification results in 2000, 2010 and 2020 are as follows (Table 1):
The farmland loss from 2000 to 2010 took place mainly in and around major urban areas, especially big cities like Shanghai, Suzhou, Hefei, and Hangzhou. The farmland loss that occurred from 2010 to 2020 were more scattered. By 2020, the distribution of farmland in northern cities was relatively clustered, while the farmland in other regions was fragmented (Figure 4).
In order to better study the area, change trends of different land use types and the cumulative area changes are calculated after log-transforming the area (ha). When performing log-transformation, we select 10 as the base. Cumulative area changes were calculated by subtracting log-transformed area in the initial year from that of the target year. Compared to the land use in 2000 by 2020 the area of built-up land has increased by about 166.8% and the area of farmland has reduced by about 23.7% (Figure 5).

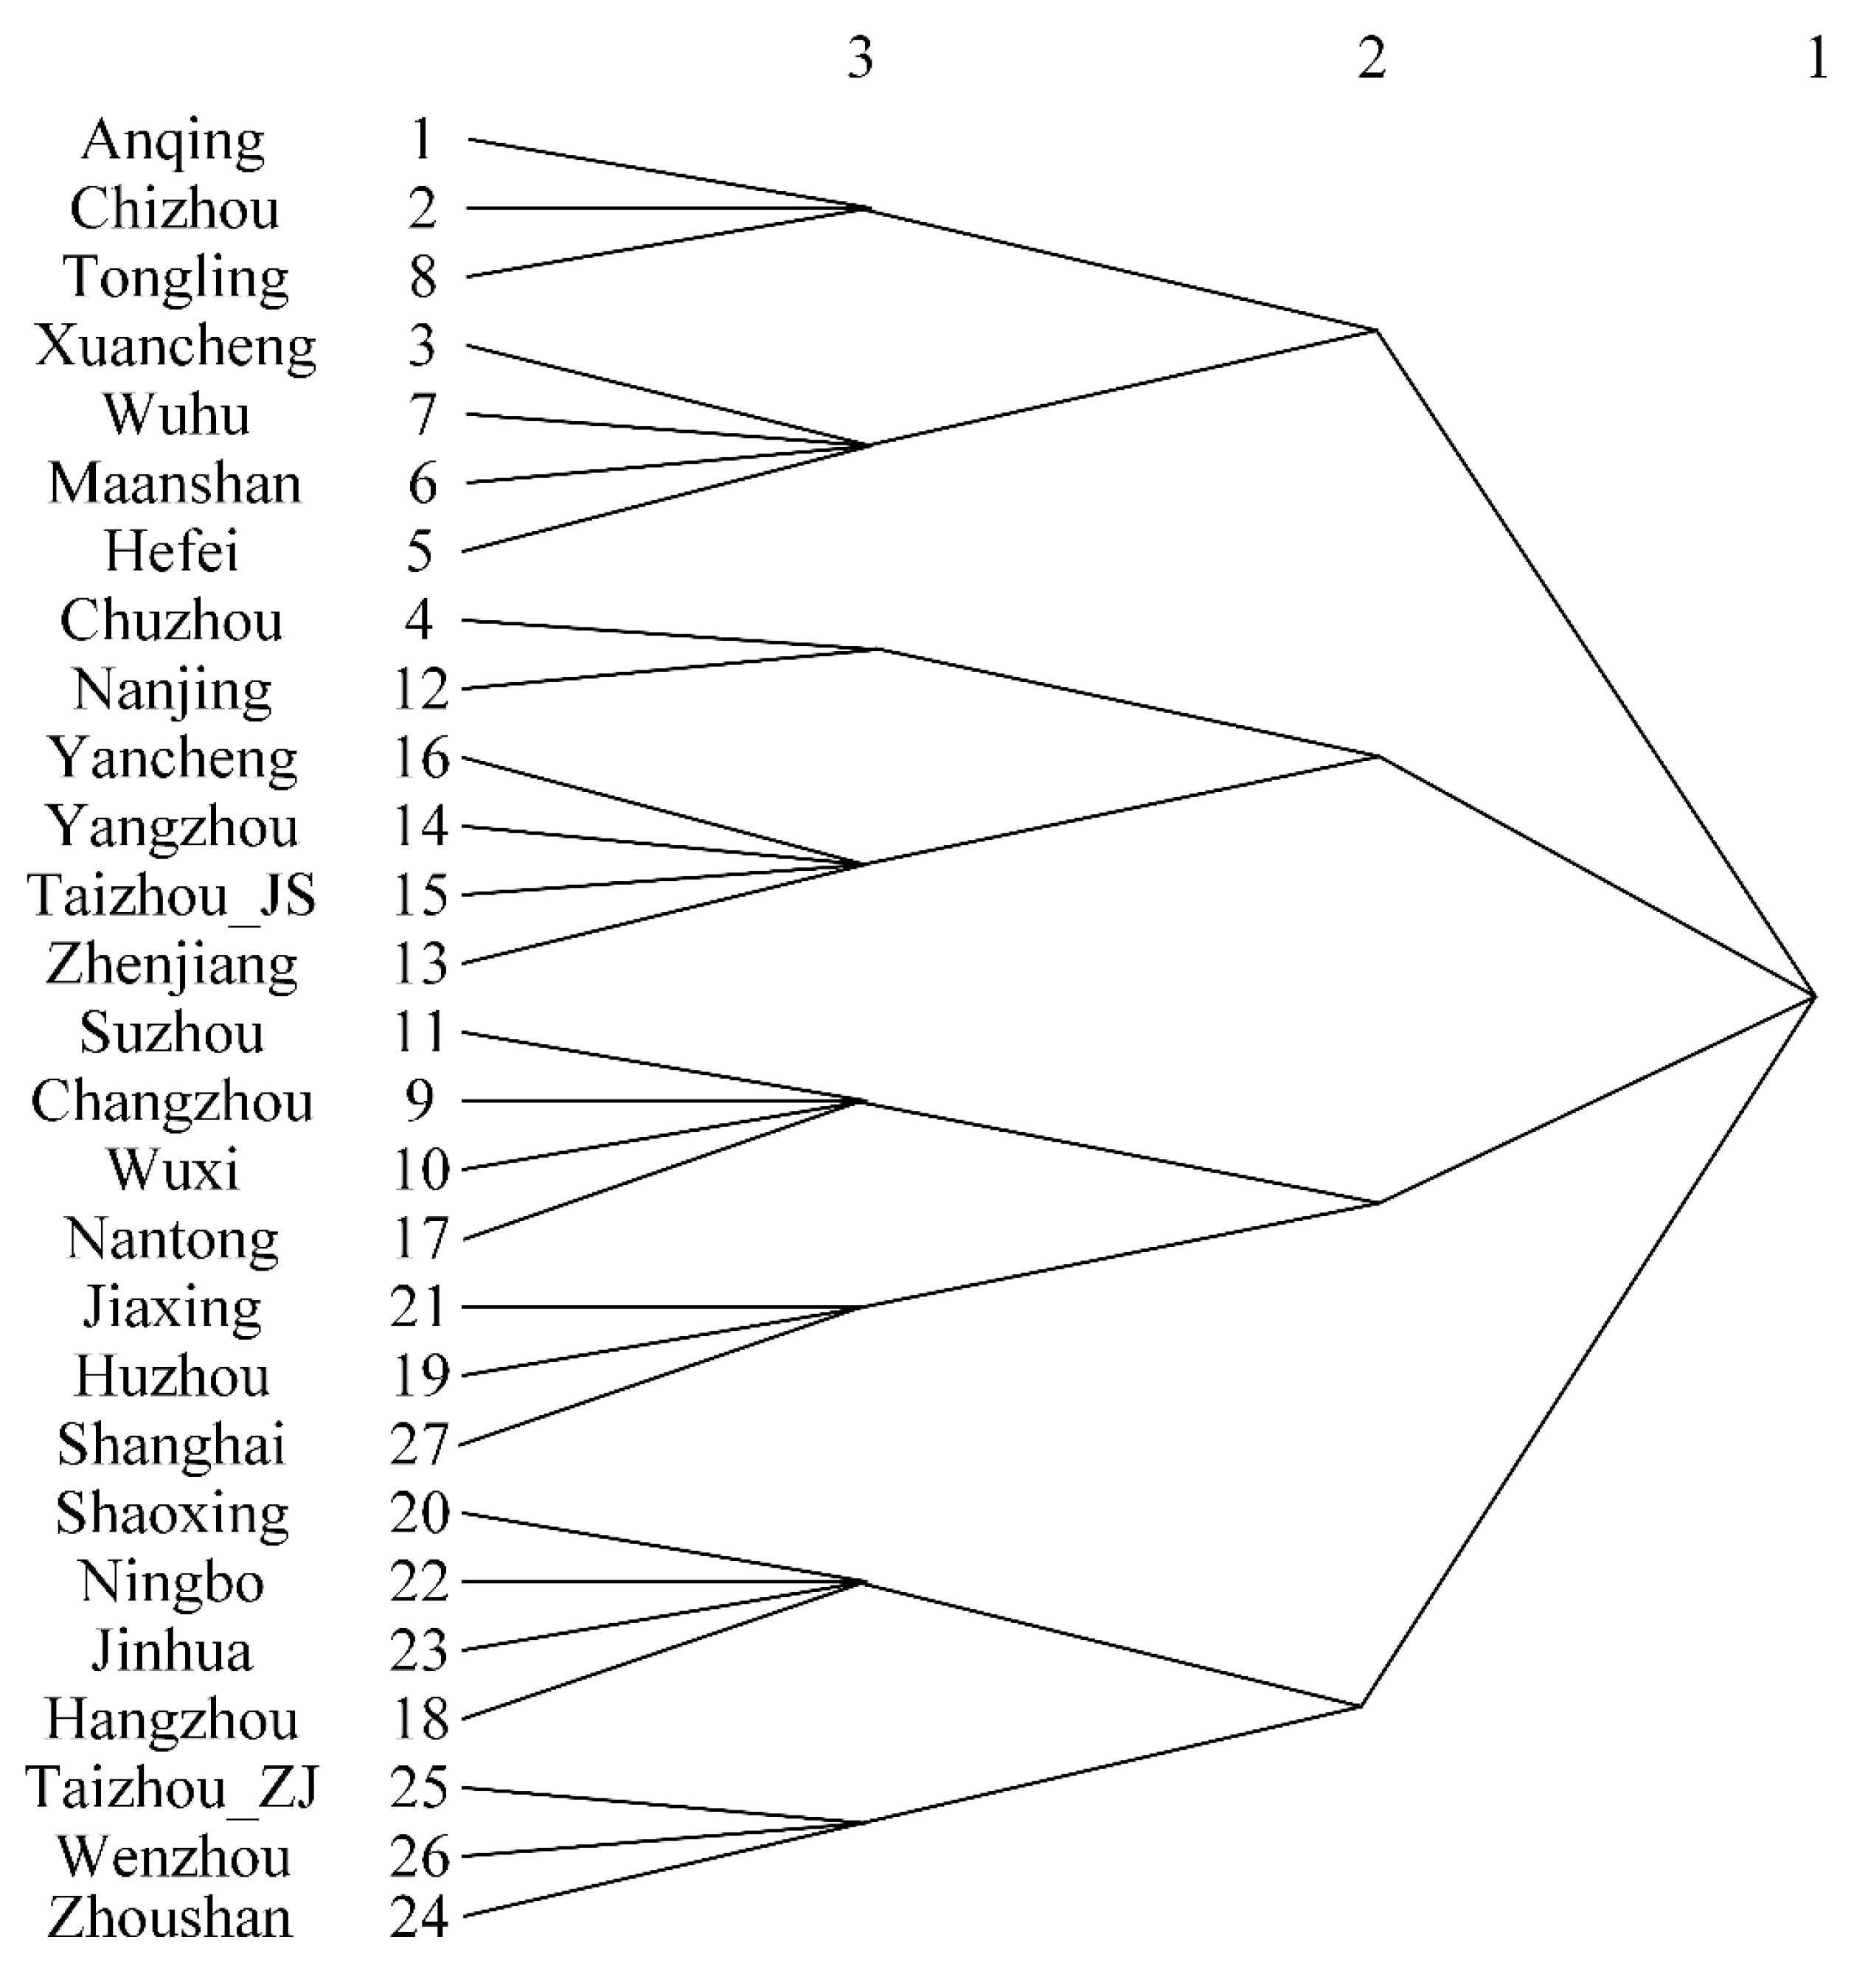
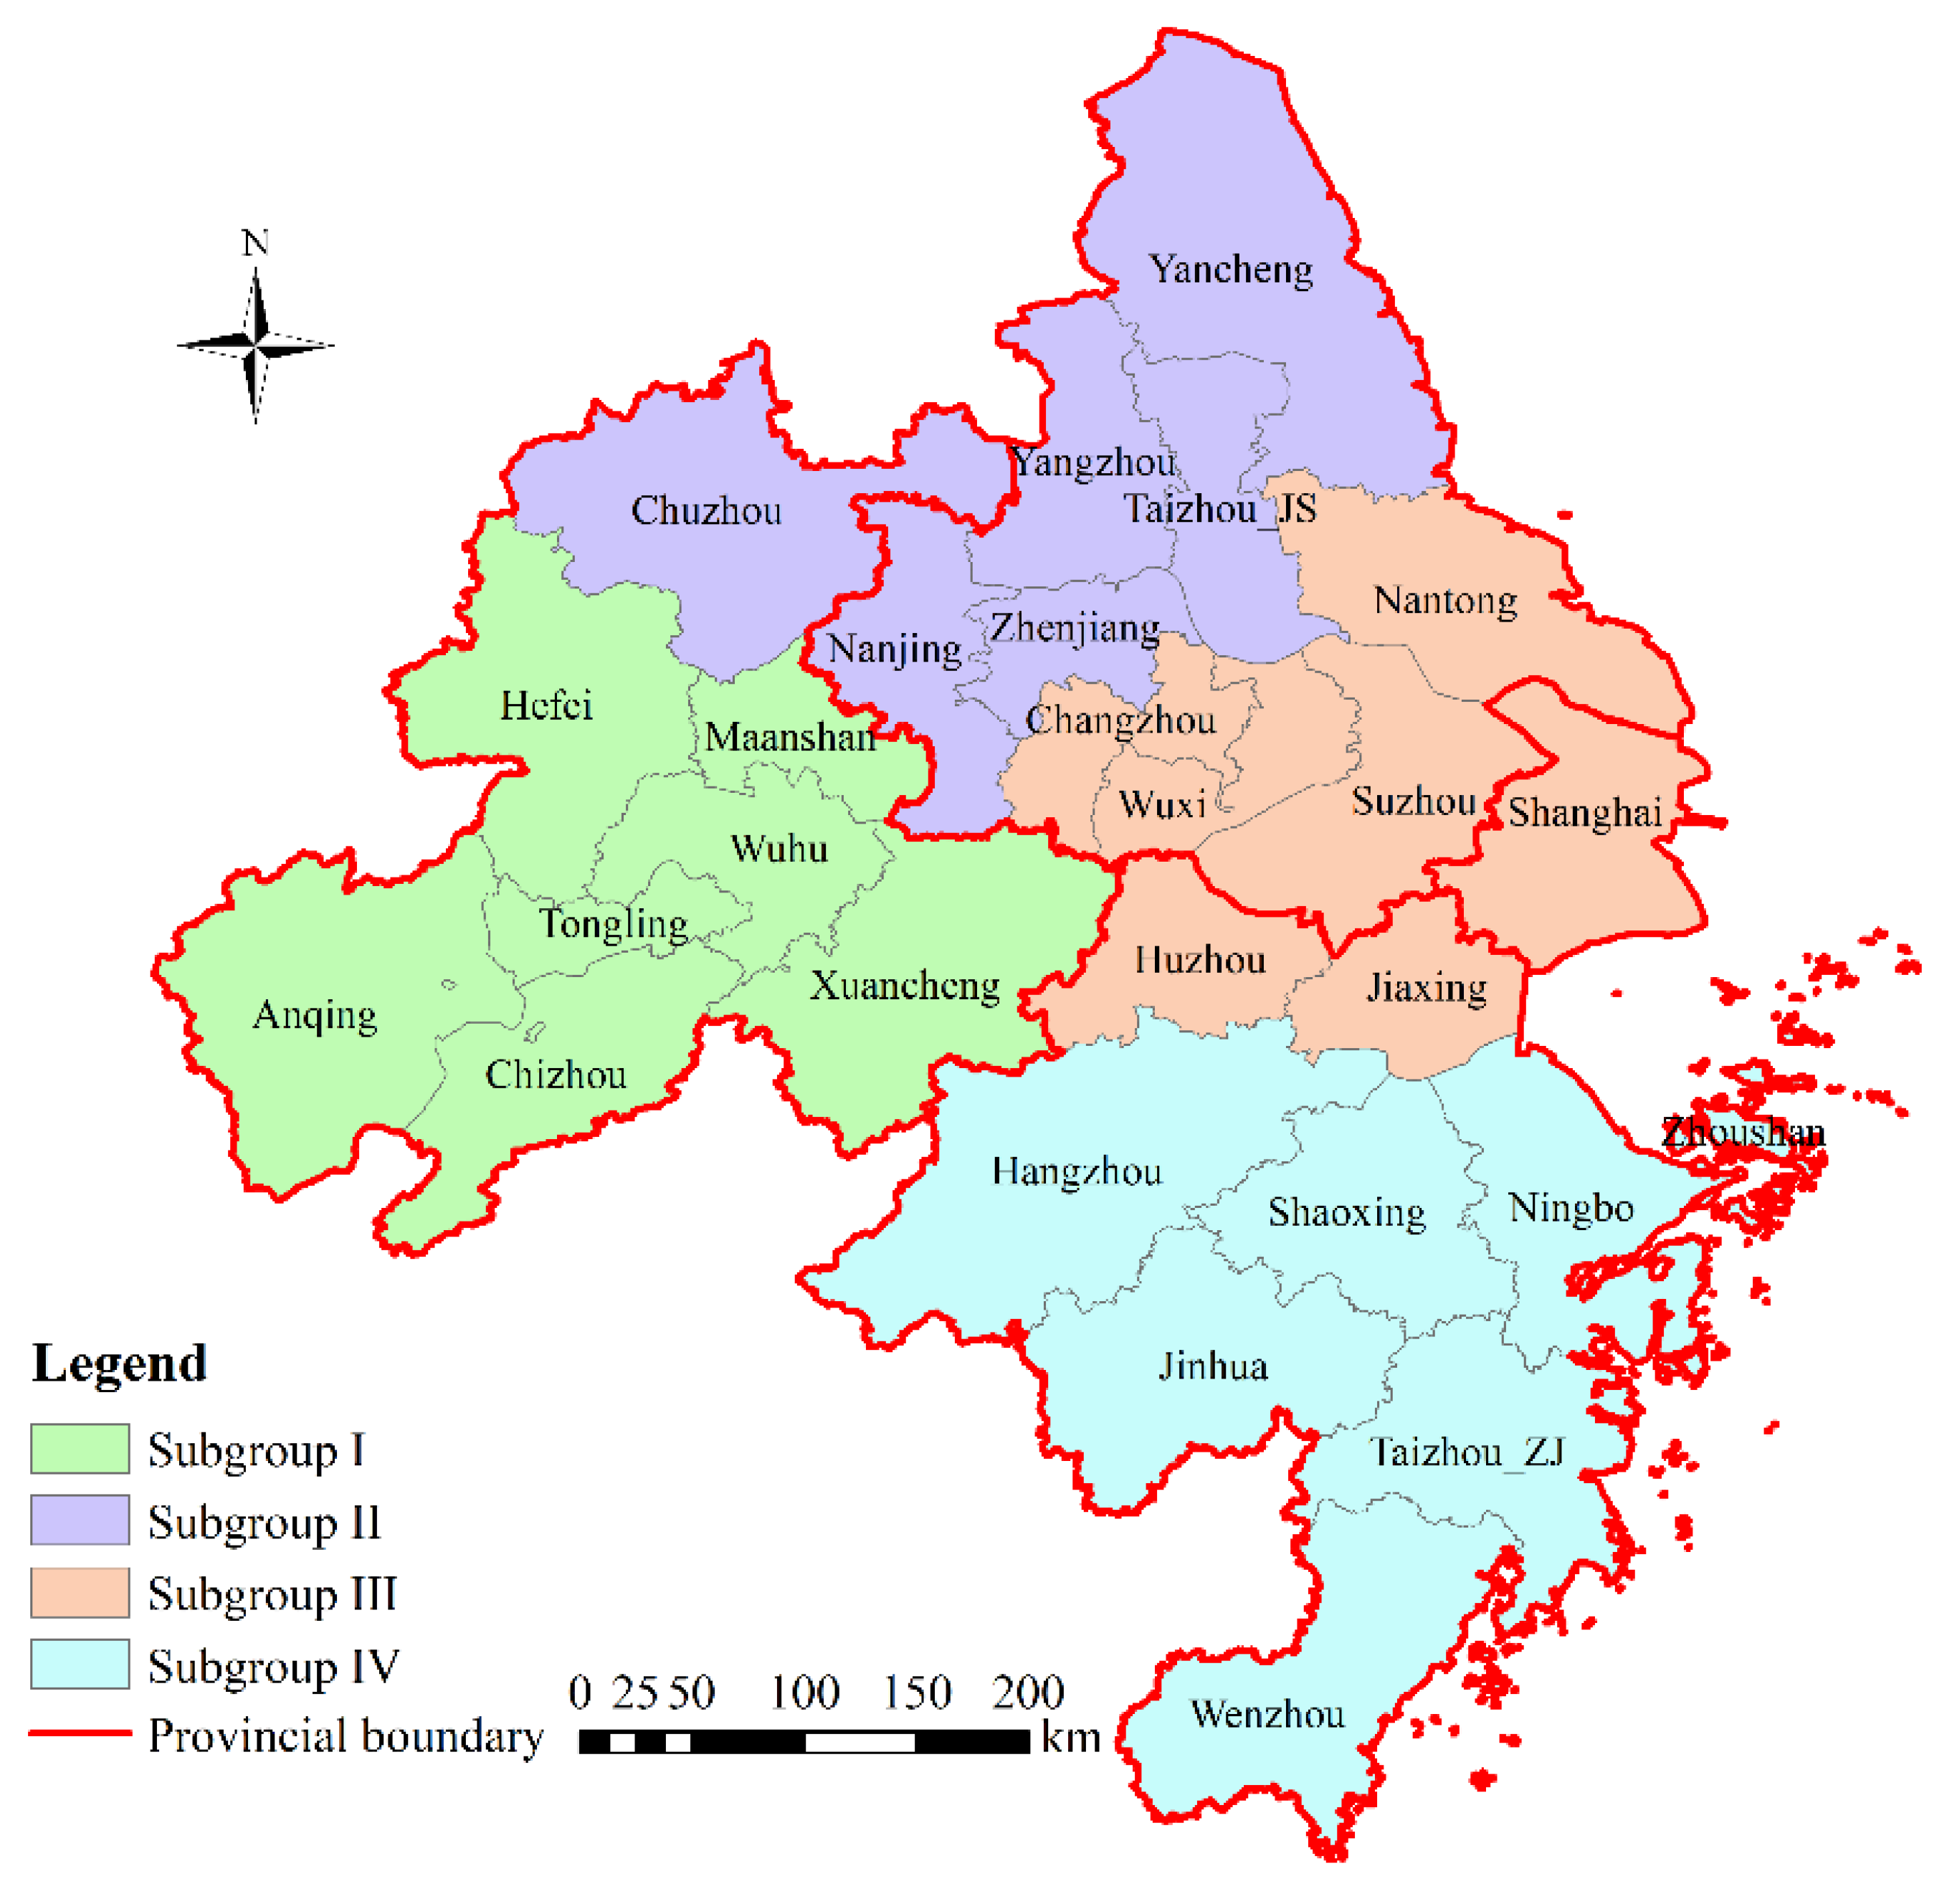
4.2. Division of Urban Subgroups

The tree diagram shows the division result of cohesive subgroups (Figure 6). According to the second level, YRDUA can be divided into four urban subgroups. There are close agricultural economic links among the cities within the subgroup, and their food security also affects each other.
Figure 7 shows the location/division of the four subgroups. Subgroup I is in Anhui Province; subgroup II includes most cities in Jiangsu Province and Chuzhou in Anhui Province; subgroup III is composed of Shanghai, two cities in Zhejiang Province and four cities in Jiangsu Province; all the cities in Subgroup IV locate in Zhejiang Province. It shows that the division of each subgroup closely matches the geographical proximity. The formation of urban subgroups by neighboring cities is conductive to the material and economic exchange between cities.

4.3. Farmland Surplus and Deficit at Multiple Scales

4.3.1. Farmland Surplus and Deficit at Urban Agglomeration Scale

Table 2 shows the decline of farmland in YRDUA. Over the last two decades, the farmland area has reduced by as much as 1.99 million ha. The reduction was the slowest in 2000–2010, and became faster in 2010–2020.
There were different degrees of farmland deficit in 2000, 2010 and 2020, which indicated that the YRDUA could not achieve food self-sufficiency since 2000. The demand for farmland resources in 2020 was far beyond the supply, resulting in a scarcity of 5.14 million ha. In terms of the surplus and deficit coefficient, the coefficient from 2000 to 2020 was negative, and the absolute value was continuously increasing, reaching a maximum of 80.36%.

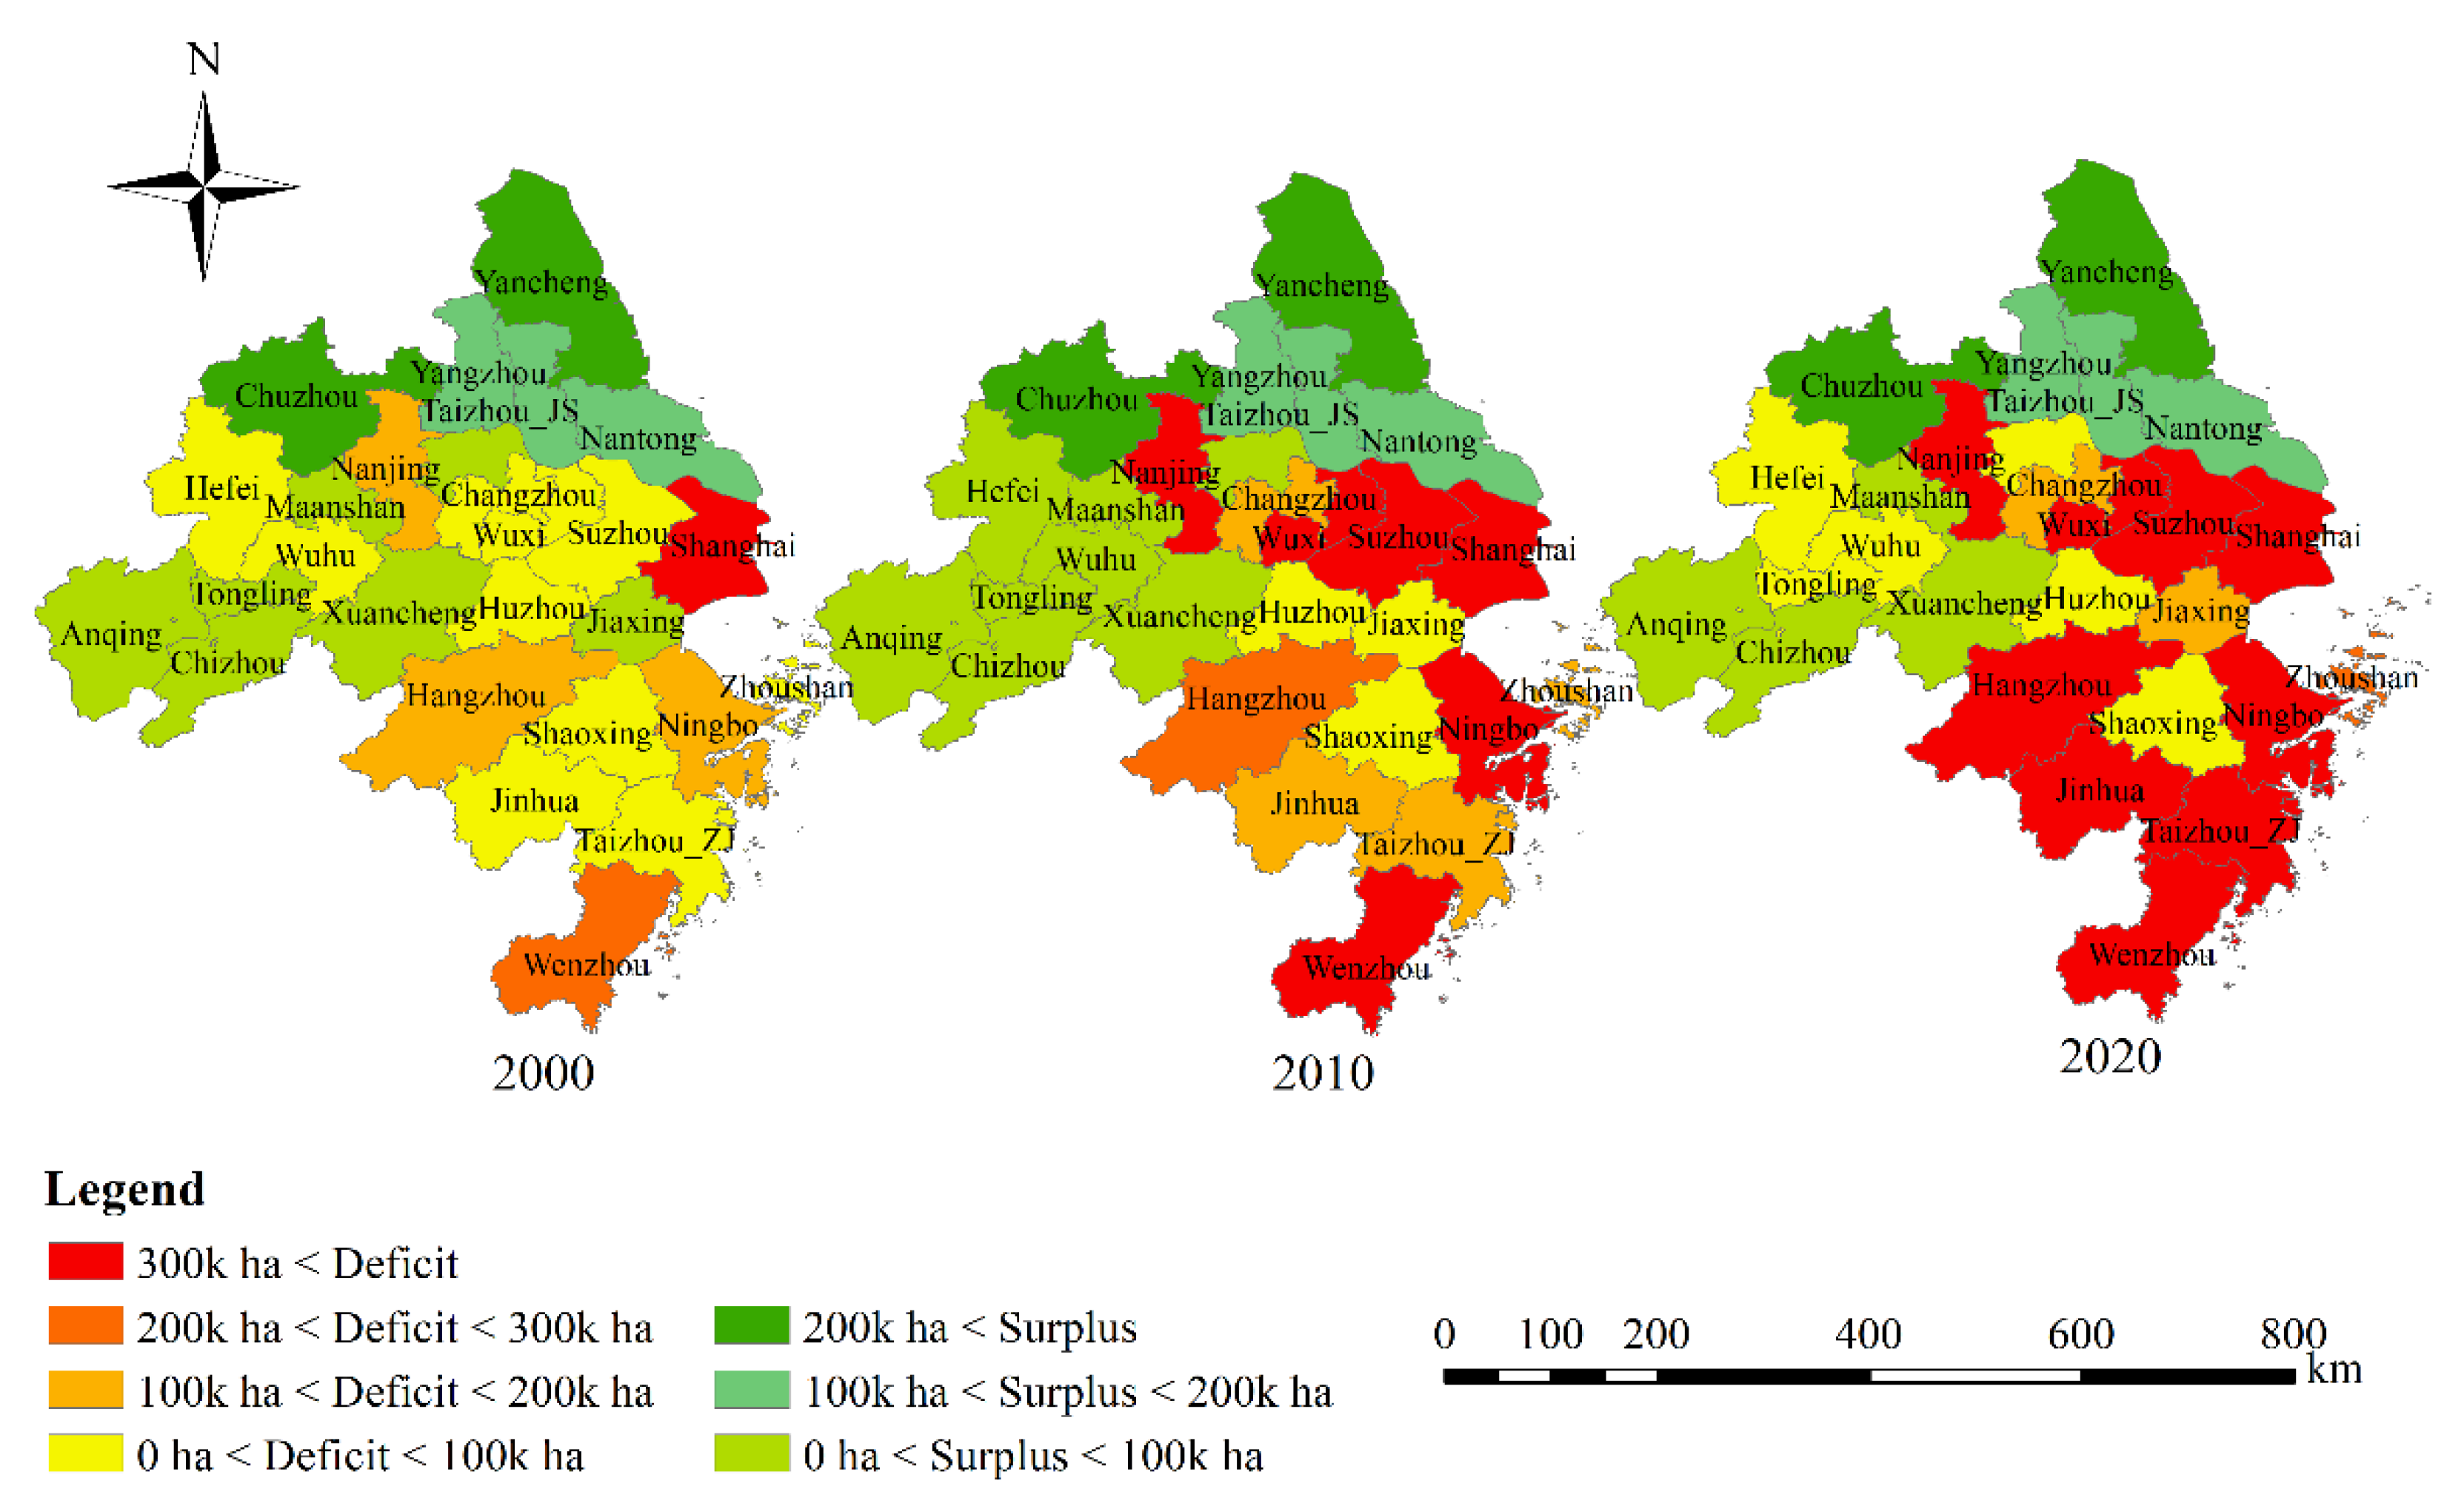
4.3.2. Farmland Surplus and Deficit at City Scale

Table 3 shows the farmland surplus and deficit at city scale. Shanghai, followed by Wenzhou, Nanjing, Suzhou and Hangzhou, had the severest scarcity of farmland. The largest surplus was found in Yancheng, Jiangsu Province, with an area of 0.65 million ha in 2020. Following that was Chuzhou in Anhui Province, and it had the largest coefficient of surplus and deficit in 2020, which was 66.50%. Zhoushan had the least coefficient of surplus and deficit in 2020, which was −1565.26%. In 2020, Yancheng was the city with the most farmland area, which was 1.05 million ha. It was followed by Chuzhou in Anhui Province, with 0.67 million ha.
Figure 8 shows the spatial distribution of farmland-surplus cities and farmland-scarce cities. Farmland-surplus cities are mostly distributed in the northern region, such as Yancheng and Chuzhou. Farmland-scarce cities are mainly distributed in the southern region, such as Hangzhou, Jinhua, Wenzhou, Taizhou (Zhejiang Province) and Ningbo. The scarcity of farmland resources in cities along Shanghai-Nanjing axis and Shanghai-Hangzhou axis is obvious. In 2000, Shanghai was the only city with a deficit of more than 0.3 million ha. In 2010, six cities Nanjing, Wuxi, Suzhou, Shanghai, Ningbo and Wenzhou had a deficit of more than 0.3 million ha. In 2020, three more cities were added to the list, namely, Hangzhou, Jinhua and Taizhou (Zhejiang Province).

4.3.3. Farmland Surplus and Deficit at the Urban Subgroup Scale

Table 4 shows that the farmland area of Subgroup II has always ranked first among the four urban subgroups, and farmland area of Subgroup IV has always been at the bottom of the four urban subgroups. The farmland resources of Subgroup I and Subgroup II are always in a state of oversupply. However, the numbers of surplus and deficit of farmland in Subgroup III and Subgroup IV are always negative, which indicates that the two subgroups are always in a state of farmland scarcity. Moreover, the absolute value of deficit coefficient in Subgroup IV is greater than that of Subgroup III, indicating that the food security problems faced by Subgroup IV is more serious than that of Subgroup III.
Figure 9 shows that the urban subgroup in the north had a farmland surplus of more than 0.4 million ha in 2000, 2010 and 2020. Farmland in the western subgroup has been in a state of oversupply from 2000 to 2020, with the largest surplus in 2010. The urban subgroup in the east and south have been in a state of supply less than demand since 2000 and this situation has become more and more serious as time goes by. In 2020, the deficit of farmland in the eastern and southern urban subgroup had exceeded 2 million ha. The gaps in the surplus and deficit of farmland resources among the urban subgroups reflect the different food security levels and the uneven development of the YRDUA.

5. Discussion

5.1. Farmland Loss

Urban expansion has resulted in the loss of farmland. [39]. In the past few decades, urbanization has been positioned as China’s main national development strategy. As China’s largest urban agglomeration region, YRDUA enjoyed many favorable development policies and formed an exogenous and export-oriented economic development pattern [40]. Under the dual effects of rapid urbanization and capital-oriented land management policies, local governments expropriated rural land for urban development, deducted and exploited farmers’ land income, and benefited industrial investors and real estate developers [41], which forced rural residences to live in peri-urban or urban areas. Due to the imperfect social welfare system, rural migrants cannot integrate well into urban life. Most of them choose to build new houses back in their home villages and usually on arable land [42]. In addition, land management laws and regulations in the region are inadequate. The difficulties of supervision and measurement will make the actual occupation of cultivated land exceed the control standard. Thus a large amount of farmland has been converted into urban construction land for residential, industrial, commercial and infrastructure uses [43].
This study has found that farmland loss is a common phenomenon in most cities in YRDUA. During the period from 2000 to 2020, the farmland area in the whole urban agglomeration decreased by as much as 1.99 million ha. The results have reflected not only the most common tendencies in China, but also a global process. In southern Jiangsu Province, China, 182.485 million ha of arable land was lost to urban settlements during 1990–2006 [44]. The farmland in Changzhou, Jiangsu Province, shrank significantly and 23.79% of it was converted to non-agricultural built-up environments during the period of 2004–2011 [45]. Similar conclusions were reached in the Nile Delta, where 7.46 million ha of fertile agricultural land was lost to urban expansion from 1992 to 2015 at an average rate of 3108 ha year−1 [46], and in America, where 31 million acres of agricultural land was irreversibly lost to development [47].
Confront with massive loss of farmland resources, strict policies such as the “1.8 billion mu (a unit of area (=0.0667 hectares)) red line of cultivated land” were initiated in 2006 [48]. However, it is inevitable that a lot of farmland is occupied for urbanization in areas with rapid socio-economic development such as the YRDUA. In view of this situation, China has also formulated the national overall planning policy for cross-provincial compensation for farmland. Policies “the replacement of basic farmland in different places”, “the compensated supplement of farmland in different places” and “the land conversion quotas transregional transaction” in Zhejiang province have achieved positive effects [49].

5.2. Food Security

Food security is an essential guarantee for world peace and development. The Yangtze River Delta region, as one of the regions with the most prominent food supply–demand relationship and the most concentrated demand, has an important influence on the food circulation and market structure in China and even the world. Like the financial system, food is also a credit commodity. If a region cannot be self-sufficient in food, it needs other regions to deliver food to the region in order to ensure the rapid socio-economic development and population growth of the region. However, domestic transportation capacity is limited, and there is often a certain transportation burden on interregional food supply, which may have a short-term impact on people’s lives. Secondly, interregional administrative segmentation also brings hidden costs to grain domestic circulation [50]. Therefore, increasing regional food production is essential to ensure regional food security.
With the acceleration of urbanization, the proportion of secondary and tertiary industries in the YRDUA has increased, while the primary industry has declined significantly, especially the grain output has decreased. Its existing farmland cannot guarantee food self-sufficiency, indicating that it has food security risks. In order to increase food production, various measures have been taken by most countries and regions, including improving farming conditions, such as enhancing fertilizer use efficiency [51], identifying an optimal plant density [52], enlarging the irrigation area [53] and adopting new technologies for herbicide and weed control [54]. Restricting food exports and increasing food imports to ensure food supply [55] are also effective. In addition, for regions with rapid economic development, increasing the diversity of food, not limited to the food produced by farmland, such as the production of meat, poultry, eggs, milk and aquatic products is necessary. But, measures should be taken to ensure the quantity and the quality of farmland since it is the core resource ensuring food security [56]. These measures may include implementing strict policy for the requisition–compensation balance of arable land [57,58], reasonably developing saline land, tidal flat and some unutilized land to supplement the farmland [59,60] and applying the fallowing and crop rotation system [61,62] to improve the quality of farmland.

5.3. Scale Effects

Our study has demonstrated that the food security situation varied at different hierarchical levels (scales), which has significance on understanding the internal interaction and promoting the sustainable development of YRDUA. The high level of farmland scarcity in the whole urban agglomeration indicates that the YRDUA needs to import grain from other regions to ensure its food security. However, there are many towns and cities, not all of which are short of food. From the city scale, there is a high level of scarcity in Shanghai, Suzhou, Nanjing and the southern region of Zhejiang, which are also economically developed regions with large population. But, the study at the urban subgroup scale shows that Subgroup II, in which Nanjing is located, has a surplus of farmland from 2000 to 2020. It indicates that Subgroup II can be self-sufficient and Nanjing’s food shortage can be supplied from other cities in Subgroup II. In addition, the grain import of the YRDUA is mainly due to the demand of Subgroup III and Subgroup IV, both of which have a high level of farmland scarcity. Study results at the urban agglomeration scale indicate a great demand of food, but whether a city is in surplus and deficit cannot be known. Results at the city scale show food demand of each city but it is unknown the food in which city can be provided from YRDUA and food in which city should be provided from other areas. Results at the urban subgroup scale show which subgroup is self-sufficient in food and which will have to obtain it from other areas. In this study, for example, Nanjing can be supplemented from neighboring cities, while Shanghai, Hangzhou and other cities may need to be supplemented from outside their subgroups.

5.4. Implications and Limitations

Our study has useful implications for improving farmland preservation and food security policies. First, farmland loss occurs in all stages of urban agglomeration development and it will continue to occur, even after reaching the final stage of urbanization [63]. Second, there are differences in the supply and demand of food between hierarchical levels and it can be adjusted and improved through policy interventions. There is an urgent need for strengthening the protection of farmland, especially the high-quality farmland. At present, China has carried out a series of policies, such as farmland protection, farmland compensation, land reclamation, etc., all of which have a positive impact on the sustainability of food. City, like Yancheng, has replenished its area of farmland as well as food production by using tidal flat resources and turning saline land into cultivated land. However, these policies still have some loopholes that need to be improved. The high profits obtained by converting farmland with low compensation to high value commercial use land drives the government to supply more land for urban use and offset this loss through the conversion of other land to low-quality farmland. Therefore, the policy makers should improve the current farmland protection policy from two aspects of local governments’ land financing policy and the quality standard of supplementary cultivated land.
This study explored the change of farmland area and its impact on regional food self-sufficiency in YRDUA at different scales: the city scale, the urban subgroup scale, and the urban agglomeration scale. Three limitations in this study deserve mentioning. Firstly, it’s difficult to define the food security based only on statistical data. Further researches are needed to tackle this problem from different points of view: change of farmland quality and spatial distribution patterns, environmental threats related to land use change and socio-economic aspects for people living in the area. Secondly, the reasons for farmland loss were not analyzed. Factors such as economy, society, population and national policies could be added to explore the driving forces of farmland loss when data become available. Last but not least, the area covered by this study is small and limited to the Yangtze River Delta urban agglomeration. It is important to further investigate the budget of supply and demand of farmland and the food security at the national scale, when more data become available in the future.

6. Conclusions

This study quantified the area change of farmland and its impacts on food self-sufficiency in the YRDUA from 2000 to 2020 at three scales. The area of farmland in YRDUA is decreasing at a rather high speed in the past 20 years and the trend is getting worse. At the urban agglomeration scale, there was a farmland deficit of 0.44 million ha in 2000, followed by larger farmland deficits in 2010 and 2020. At the city scale, Shanghai had the most serious farmland scarcity, while Yancheng had a farmland surplus of 0.65 million ha in 2020. At the urban subgroup scale, Subgroup I in the west and Subgroup II in the north always maintained an oversupply of farmland, while Subgroup III in the east and Subgroup IV in the south faced serious food security problems. Policies for improving farmland quality, land financing, farmland protection and food supply system should be implemented in YRDUA in order to ensure its regional food self-sufficiency and promote regional sustainability.

Author Contributions

Conceptualization, X.F. and Q.M.; methodology, X.D. and R.X.; software, X.D. and M.L.; validation, Q.M. and M.L.; formal analysis, X.F.; investigation, M.L.; resources, Q.M.; data curation, X.F.; writing—original draft preparation, X.D.; writing—review and editing, R.X.; visualization, Q.M. and X.D.; supervision, X.F.; funding acquisition, R.X. All authors have read and agreed to the published version of the manuscript.

Funding

This work was supported by National Natural Science Foundation of China (41701484).

Institutional Review Board Statement

Not applicable.

Informed Consent Statement

Not applicable.

Data Availability Statement

The Landsat images are available from Google Earth engine platform (https://code.earthengine.google.com/), and the statistical data of cities in the Yangtze River Delta urban agglomeration are available from China’s economic and social big data research platform (https://data.cnki.net/).

Conflicts of Interest

The authors declare no conflict of interest.

References

  1. Xu, X.; Hu, H.; Tan, Y.; Yang, G.; Zhu, P.; Jiang, B. Quantifying the impacts of climate variability and human interventions on crop production and food security in the Yangtze River Basin, China, 1990–2015. Sci. Total Environ. 2019, 665, 379–389. [Google Scholar] [CrossRef] [PubMed]
  2. Rosegrant, M.W.; Cline, S.A. Global food security: Challenges and policies. Science 2003, 302, 1917–1919. [Google Scholar] [CrossRef] [PubMed] [Green Version]
  3. Ki-Moon, B. The millennium development goals report 2013. United Nations Pubns 2013, 365, 366. [Google Scholar]
  4. Graziano da Silva, J. From Fome Zero to Zero Hunger: A Global Perspective; Food and Agriculture Organization of the United Nations: Rome, Italy, 2019. [Google Scholar]
  5. Ferranti, P. The United Nations Sustainable Development Goals. Encycl. Food Secur. Sustain. 2019, 1, 6–8. [Google Scholar]
  6. FAO; IFAD; WFP; WHO; UNICEF. The State of Food Security and Nutrition in the World 2019: Safeguarding against Economic Slowdowns and Downturns; FAO: Rome, Italy, 2019. [Google Scholar]
  7. Hines, C.T.; Markowitz, A.J.; Johnson, A.D. Food Insecurity: What Are Its Effects, Why, and What Can Policy Do About It? Policy Insights Behav. Brain Sci. 2021, 1, 23727322211032250. [Google Scholar]
  8. Pérez-Escamilla, R. Food Security and the 2015-2030 Sustainable Development Goals: From Human to Planetary Health: Perspectives and Opinions. Curr. Dev. Nutr. 2017, 1, e000513. [Google Scholar] [CrossRef]
  9. Torero, M. Food Security Brings Economic Growth—Not the Other Way Around. Available online: https://www.devex.com/news/food-security-brings-economic-growth-not-the-other-way-around-84561 (accessed on 31 August 2020).
  10. Berry, E.M.; Dernini, S.; Burlingame, B.; Meybeck, A.; Conforti, P. Food security and sustainability: Can one exist without the other? Public Health Nutr. 2015, 18, 2293–2302. [Google Scholar] [CrossRef] [PubMed]
  11. Zhang, K.H.; Shunfeng, S. Rural–urban migration and urbanization in China: Evidence from time-series and cross-section analyses. China Econ. Rev. 2003, 14, 386–400. [Google Scholar] [CrossRef]
  12. Seeborg, M.C.; Jin, Z.; Zhu, Y. The new rural-urban labor mobility in China: Causes and implications. J. Behav. Exp. Econ. 2000, 29, 39–56. [Google Scholar] [CrossRef] [Green Version]
  13. Mears, R. Rural-urban migration or urbanization in South Africa. S. Afr. J. Econ. 1997, 65, 595–614. [Google Scholar] [CrossRef]
  14. Singh, H. Increasing rural to urban migration in India: A challenge or an opportunity. Int. J. Appl. Res. 2016, 2, 447–450. [Google Scholar]
  15. Zhu, C.; Zhang, X.; Wang, K.; Yuan, S.; Yang, L.; Skitmore, M. Urban–rural construction land transition and its coupling relationship with population flow in China’s urban agglomeration region. Cities 2020, 101, 102701. [Google Scholar] [CrossRef]
  16. Yu, D.; Qiao, J.; Shi, P. Spatiotemporal patterns, relationships, and drivers of China’s agricultural ecosystem services from 1980 to 2010: A multiscale analysis. Landsc. Ecol. 2018, 33, 575–595. [Google Scholar] [CrossRef]
  17. UN. World Population Prospects 2019. Available online: https://population.un.org/wpp/ (accessed on 20 August 2020).
  18. Chai, J.; Wang, Z.; Yang, J.; Zhang, L. Analysis for spatial-temporal changes of grain production and farmland resource: Evidence from Hubei Province, central China. J. Clean. Prod. 2019, 207, 474–482. [Google Scholar] [CrossRef]
  19. He, C.; Liu, Z.; Xu, M.; Ma, Q.; Dou, Y. Urban expansion brought stress to food security in China: Evidence from decreased cropland net primary productivity. Sci. Total Environ. 2017, 576, 660–670. [Google Scholar] [CrossRef]
  20. Liu, J.; Kuang, W.; Zhang, Z.; Xu, X.; Qin, Y.; Ning, J.; Zhou, W.; Zhang, S.; Li, R.; Yan, C.; et al. Spatiotemporal characteristics, patterns, and causes of land-use changes in China since the late 1980s. J. Geogr. Sci. 2014, 24, 195–210. [Google Scholar] [CrossRef]
  21. Yu, M.; Guo, S.; Guan, Y.; Cai, D.; Zhang, C.; Fraedrich, K.; Liao, Z.; Zhang, X.; Tian, Z. Spatiotemporal Heterogeneity Analysis of Yangtze River Delta Urban Agglomeration: Evidence from Nighttime Light Data (2001–2019). Remote Sens. 2021, 13, 1235. [Google Scholar] [CrossRef]
  22. Wu, J. Hierarchy Theory: An Overview. In Linking Ecology and Ethics for a Changing World. Ecology and Ethics; Rozzi, R., Palmer, C., Armesto, J., Callicott, J., Eds.; Springer: Berlin/Heidelberg, Germany, 2013; pp. 281–301. [Google Scholar] [CrossRef]
  23. Li, C.; Li, J.; Wu, J. What drives urban growth in China? A multi-scale comparative analysis. Appl. Geogr. 2018, 98, 43–51. [Google Scholar] [CrossRef]
  24. Liu, Y.; Yuan, Y.; Gao, S. Modeling the Vagueness of Areal Geographic Objects: A Categorization System. ISPRS Int. J. Geo-Inf. 2019, 8, 306. [Google Scholar] [CrossRef] [Green Version]
  25. Goodchild, M.F. A Geographer Looks at Spatial Information Theory. In Proceedings of the Spatial Information Theory: Foundations of Geographic Information Science, International Conference, Cosit, Morro Bay, CA, USA, 19–23 September 2001; pp. 1–13. [Google Scholar]
  26. Wu, J. Hierarchy and scaling: Extrapolating information along a scaling ladder. Can. J. Remote Sens. 1999, 25, 367–380. [Google Scholar] [CrossRef] [Green Version]
  27. Liu, D.; Chen, N.; Zhang, X.; Wang, C.; Du, W. Annual large-scale urban land mapping based on Landsat time series in Google Earth Engine and OpenStreetMap data: A case study in the middle Yangtze River basin. ISPRS J. Photogramm. Remote Sens. 2020, 159, 337–351. [Google Scholar] [CrossRef]
  28. Loh, W.Y. Classification and regression trees. Wiley Interdiscip. Rev. Data Min. Knowl. Discov. 2011, 1, 14–23. [Google Scholar] [CrossRef]
  29. Li, Y.; Chen, W.; Zhang, Y.; Tao, C.; Xiao, R.; Tan, Y. Accurate cloud detection in high-resolution remote sensing imagery by weakly supervised deep learning. Remote Sens. Environ. 2020, 250, 112045. [Google Scholar] [CrossRef]
  30. Li, Y.; Shi, T.; Zhang, Y.; Chen, W.; Wang, Z.; Li, H. Learning deep semantic segmentation network under multiple weakly-supervised constraints for cross-domain remote sensing image semantic segmentation. ISPRS J. Photogramm. Remote Sens. 2021, 175, 20–33. [Google Scholar] [CrossRef]
  31. Li, Y.; Zhang, Y.; Zhu, Z. Error-Tolerant Deep Learning for Remote Sensing Image Scene Classification. IEEE Trans. Cybern. 2021, 51, 1756–1768. [Google Scholar] [CrossRef]
  32. Tortora, R.D. A Note on Sample Size Estimation for Multinomial Populations. Am. Stat. 1978, 32, 100–102. [Google Scholar] [CrossRef]
  33. Chen, X.; Fang, K.; Wu, C. A study on spatio-temporal changes in patterns of China’s cultivated land use from 2009 to 2015. Bull. Soil Water Conserv. 2019, 39, 291–296. [Google Scholar]
  34. Fang, C.; Yu, D. Urban agglomeration: An evolving concept of an emerging phenomenon. Landsc. Urban. Plann. 2017, 162, 126–136. [Google Scholar] [CrossRef]
  35. Kong, X.; Zhang, C. Social Network Analysis of Urban Agricultural Economic Links in Beijing-Tianjin-Hebei Region. J. Beijing Vocat. Coll. Agric. 2018, 32, 5–15. [Google Scholar] [CrossRef]
  36. Ye, L.; Duan, X.; Ou, X. Functional polycentricity in Yangtze River delta based on social network analysis. J. Univ. Chin. Acad. Sci. 2016, 33, 75–81. [Google Scholar] [CrossRef]
  37. Jiang, G.; Jiao, J.; Li, J.; Sun, C. Network analysis of R&D technology spillovers effect in the Yangtze River Delta Region. IOP Conf. Ser. Earth Environ. Sci 2020, 615, 012026. [Google Scholar] [CrossRef]
  38. Wasserman, S.; Faust, K. Social network analysis: Methods and applications; Cambridge University: Cambridge, UK, 1994. [Google Scholar]
  39. Huang, Z.; Du, X.; Castillo, C.S.Z. How does urbanization affect farmland protection? Evidence from China. Resour. Conserv. Recycl. 2019, 145, 139–147. [Google Scholar] [CrossRef] [Green Version]
  40. Wang, L.; Shen, J. Comparative Analysis of Urban Competitiveness in the Yangtze River Delta and Pearl River Delta Regions of China, 2000–2010. Appl. Spat. Anal. Policy 2017, 10, 401–419. [Google Scholar] [CrossRef]
  41. Huang, J.; Li, K. Has Administrative Zoning Adjustment Strengthened Land Property Operation? Policy Effects from Yangtze River Delta. Trop. Geogr. 2020, 41, 1–8. [Google Scholar]
  42. Han, J.; Meng, X.; Zhou, X.; Yi, B.; Liu, M.; Xiang, W.-N. A long-term analysis of urbanization process, landscape change, and carbon sources and sinks: A case study in China’s Yangtze River Delta region. J. Clean. Prod. 2017, 141, 1040–1050. [Google Scholar] [CrossRef]
  43. Cheng, C.; Yang, X.; Cai, H. Analysis of Spatial and Temporal Changes and Expansion Patterns in Mainland Chinese Urban Land between 1995 and 2015. Remote Sens. 2021, 13, 2090. [Google Scholar] [CrossRef]
  44. Liu, Y.; Wang, J.; Long, H. Analysis of arable land loss and its impact on rural sustainability in Southern Jiangsu Province of China. J. Environ. Manag. 2010, 91, 646–653. [Google Scholar] [CrossRef]
  45. Liang, C.; Penghui, J.; Wei, C.; Manchun, L.; Liyan, W.; Yuan, G.; Yuzhe, P.; Nan, X.; Yuewei, D.; Qiuhao, H. Farmland protection policies and rapid urbanization in China: A case study for Changzhou City. Land Use Policy 2015, 48, 552–566. [Google Scholar] [CrossRef]
  46. Radwan, T.M.; Blackburn, G.A.; Whyatt, J.D.; Atkinson, P.M. Dramatic loss of agricultural land due to urban expansion threatens food security in the Nile Delta, Egypt. Remote Sens. 2019, 11, 332. [Google Scholar] [CrossRef] [Green Version]
  47. Sorensen, A.; Freedgood, J.; Dempsey, J.; Theobald, D. Farms Under Threat: The State of America’s Farmland; American Farmland Trust: Washington, DC, USA, 2018. [Google Scholar]
  48. Wang, Y.-S. The challenges and strategies of food security under rapid urbanization in China. Sustainability 2019, 11, 542. [Google Scholar] [CrossRef] [Green Version]
  49. Cao, Y.; Zhang, X.; Zhang, X.; Li, H. The incremental construction land differentiated management framework: The perspective of land quota trading in China. Land Use Policy 2020, 96, 104675. [Google Scholar] [CrossRef]
  50. Cao, B.; Xia, B. Report on Food Development in the Yangtze River Delta—Food Security in the Yangtze River Delta; Economic Management Press: Beijing, China, 2015; Volume 978. [Google Scholar]
  51. Wang, M.; Ma, L.; Strokal, M.; Chu, Y.; Kroeze, C. Exploring nutrient management options to increase nitrogen and phosphorus use efficiencies in food production of China. Agric. Syst. 2018, 163, 58–72. [Google Scholar] [CrossRef]
  52. Assefa, Y.; Vara Prasad, P.V.; Carter, P.; Hinds, M.; Bhalla, G.; Schon, R.; Jeschke, M.; Paszkiewicz, S.; Ciampitti, I.A. Yield Responses to Planting Density for US Modern Corn Hybrids: A Synthesis-Analysis. Crop. Sci. 2016, 56, 2802–2817. [Google Scholar] [CrossRef]
  53. Cao, X.; Wang, Y.; Wu, P.; Zhao, X.; Wang, J. An evaluation of the water utilization and grain production of irrigated and rain-fed croplands in China. Sci. Total Environ. 2015, 529, 10–20. [Google Scholar] [CrossRef] [PubMed]
  54. Gianessi, L.P. The increasing importance of herbicides in worldwide crop production. Pest Manag. Sci. 2013, 69, 1099–1105. [Google Scholar] [CrossRef]
  55. Headey, D. Rethinking the global food crisis: The role of trade shocks. Food Policy 2011, 36, 136–146. [Google Scholar] [CrossRef]
  56. Long, H.; Ge, D.; Zhang, Y.; Tu, S.; Qu, Y.; Ma, L. Changing man-land interrelations in China’s farming area under urbanization and its implications for food security. J. Environ. Manag. 2018, 209, 440–451. [Google Scholar] [CrossRef]
  57. Chien, S.-S. Local farmland loss and preservation in China—A perspective of quota territorialization. Land Use Policy 2015, 49, 65–74. [Google Scholar] [CrossRef]
  58. Song, W.; Pijanowski, B.C. The effects of China’s cultivated land balance program on potential land productivity at a national scale. Appl. Geogr. 2014, 46, 158–170. [Google Scholar] [CrossRef]
  59. Mao, Y.; Zhao, N.; Yang, X. Food Security and Farm Land Protection in China, 1st ed.; World Scientific: Singapore, 2013. [Google Scholar]
  60. Jin, X.; Zhang, Z.; Wu, X.; Xiang, X.; Sun, W.; Bai, Q.; Zhou, Y. Co-ordination of land exploitation, exploitable farmland reserves and national planning in China. Land Use Policy 2016, 57, 682–693. [Google Scholar] [CrossRef]
  61. Yang, Q.; Yang, R.; Wang, Y.; Shi, K. Does Fallowing Cultivated Land Threaten Food Security? Empirical Evidence from Chinese Pilot Provinces. Sustainability 2019, 11, 2836. [Google Scholar] [CrossRef] [Green Version]
  62. Farooq, M.; Nawaz, A.; Nadeem, F. Crop Rotations, Fallowing, and Associated Environmental Benefits. In Oxford Research Encyclopedia of Environmental Science; Oxford University Press: Oxford, UK, 2019. [Google Scholar] [CrossRef]
  63. Zhou, B.-B.; Lv, L. Understanding the dynamics of farmland loss in a rapidly urbanizing region: A problem-driven, diagnostic approach to landscape sustainability. Landsc. Ecol. 2020. [Google Scholar] [CrossRef]
Figure 1. Locational map of the study area Yangtze River Delta Urban Agglomeration, China.
Remotesensing 13 03514 g001
Figure 2. Technical flow chart of LULC data modification.
Remotesensing 13 03514 g002
Figure 3. LULC map of YRDAU from 2000 to 2020.
Remotesensing 13 03514 g003
Figure 4. Farmland loss during different time periods from 2000 to 2020.
Remotesensing 13 03514 g004
Figure 5. Cumulative area change.
Remotesensing 13 03514 g005
Figure 6. Division of cohesive subgroups.
Remotesensing 13 03514 g006
Figure 7. Composition and distribution of urban subgroups.
Remotesensing 13 03514 g007
Figure 8. Spatial distribution of farmland-surplus cities and farmland-scarce cities.
Remotesensing 13 03514 g008
Figure 9. Spatial distribution of farmland-surplus subgroups and farmland-deficit subgroups.
Remotesensing 13 03514 g009
Table 1. The overall accuracy and kappa coefficient of classification results.
200020102020
Overall accuracy0.930.940.94
Kappa coefficient0.910.920.92
Table 2. Farmland surplus and deficit at urban agglomeration scale.
YearSurplus and Deficit of FarmlandArea (10 k ha)
Amount (10 k ha)Coefficient (%)
2000−43.61−5.20838.17
2010−279.96−37.52746.08
2020−513.66−80.36639.17
Table 3. Farmland surplus and deficit at city scale.
CitySurplus and Deficit (10 k ha)Coefficient (%)Area (10 k ha)
200020102020200020102020200020102020
Anqing9.574.723.0723.7512.908.9240.3136.5734.39
Chizhou1.522.671.4612.0223.8114.0212.6211.2110.44
Xuancheng2.086.203.5110.2230.3722.6620.3320.4015.49
Chuzhou37.6346.2044.5154.6166.1966.5068.9169.8066.93
Hefei−2.607.18−1.09−3.8912.25−2.0266.9158.5854.04
Maanshan1.935.002.698.7926.4018.5021.9518.9314.55
Wuhu−3.740.87−0.44−12.703.18−1.8529.4727.2523.77
Tongling2.160.45−0.6621.243.71−6.1810.1512.1510.68
Changzhou−0.20−10.46−17.40−0.87−47.40−155.4222.5922.0611.19
Wuxi−8.56−35.36−34.79−45.69−192.90−351.7718.7318.339.89
Suzhou−8.46−60.92−57.10−27.42−238.08−362.7130.8725.5915.74
Nanjing−16.50−44.16−60.61−55.47−167.37−230.3329.7526.3926.31
Zhenjiang2.500.68−4.3812.293.73−25.9720.3618.2716.87
Yangzhou10.4115.6913.8725.8542.5940.2340.2736.8434.47
Taizhou_JS13.5614.3710.1135.6345.6837.9838.0731.4726.62
Yancheng44.6567.9065.2739.6458.8162.02112.64115.45105.24
Nantong14.1610.0010.0519.7417.1918.9471.7058.2253.05
Hangzhou−11.96−25.48−57.01−63.50−220.89−683.1618.8411.538.35
Huzhou−0.04−2.63−8.90−0.24−18.57−121.2517.2914.197.34
Shaoxing−1.10−6.71−9.92−8.44−56.09−142.4213.0111.976.97
Jiaxing4.22−4.72−11.9514.83−23.83−88.2528.4919.8013.54
Ningbo−11.86−38.20−48.05−63.73−222.81−383.2518.6117.1512.54
Jinhua−4.36−15.98−50.74−23.31−121.76−385.1518.7113.1213.17
Zhoushan−7.00−15.39−25.79−312.42−690.58−1565.262.242.231.65
Taizhou_ZJ−3.65−18.46−40.19−32.62−166.56−359.2611.1911.0811.19
Wenzhou−20.46−41.67−62.74−119.18−285.55−448.0317.1714.5914.00
Shanghai−87.50−141.74−176.43−236.37−618.71−850.1137.0222.9120.75
Table 4. Farmland surplus and deficit at urban subgroup scale.
SubgroupSurplus and Deficit
(10 k ha)
Coefficient (%)Area (10 k ha)
200020102020200020102020200020102020
I10.9127.078.545.4114.635.23201.74185.08163.35
II92.25100.6968.7729.7633.7624.88309.99298.23276.45
III−86.38−245.83−296.52−38.11−135.75−225.47226.68181.09131.51
IV−60.40−161.89−294.45−60.54−198.21−433.8999.7781.6767.86
Publisher’s Note: MDPI stays neutral with regard to jurisdictional claims in published maps and institutional affiliations.

