
Mapping Crop Types and Cropping Systems in Nigeria with Sentinel-2 Imagery
by
 , and
, and
Esther Shupel Ibrahim
1,2,3,*, 
Philippe Rufin
1,4,5 ,
,
Leon Nill
1,
Bahareh Kamali
2,6,
Claas Nendel
2,5,7 and
Patrick Hostert
1,5 1
Geography Department, Humboldt-Universität zu Berlin, Unter den Linden 6, 10099 Berlin, Germany
2
Leibniz Centre for Agricultural Landscape Research, Eberswalder Straße 84, 15374 Müncheberg, Germany
3
National Centre for Remote Sensing, Jos, Rizek Village Jos Eat LGA, P.M.B. 2136 Jos, Plateau State, Nigeria
4
Earth and Life Institute, Université Catholique de Louvain, Place Pasteur 3, 1348 Louvain-la-Neuve, Belgium
5
Integrative Research Institute on Transformations of Human-Environment Systems (IRI THESys), Humboldt-Universität zu Berlin, Unter den Linden 6, 10099 Berlin, Germany
6
Institute of Crop Science and Resource Conservation, University of Bonn, Katzenburgweg 5, 53115 Bonn, Germany
7
Institute of Biochemistry and Biology, University of Potsdam, Am Mühlenberg 3, 14476 Potsdam, Germany
*
Author to whom correspondence should be addressed.
Remote Sens. 2021, 13(17), 3523; https://0-doi-org.brum.beds.ac.uk/10.3390/rs13173523
Submission received: 26 July 2021
/
Revised: 25 August 2021
/
Accepted: 27 August 2021
/
Published: 5 September 2021
(This article belongs to the Collection Sentinel-2: Science and Applications)
Abstract
:Reliable crop type maps from satellite data are an essential prerequisite for quantifying crop growth, health, and yields. However, such maps do not exist for most parts of Africa, where smallholder farming is the dominant system. Prevalent cloud cover, small farm sizes, and mixed cropping systems pose substantial challenges when creating crop type maps for sub-Saharan Africa. In this study, we provide a mapping scheme based on freely available Sentinel-2A/B (S2) time series and very high-resolution SkySat data to map the main crops—maize and potato—and intercropping systems including these two crops on the Jos Plateau, Nigeria. We analyzed the spectral-temporal behavior of mixed crop classes to improve our understanding of inter-class spectral mixing. Building on the Framework for Operational Radiometric Correction for Environmental monitoring (FORCE), we preprocessed S2 time series and derived spectral-temporal metrics from S2 spectral bands for the main temporal cropping windows. These STMs were used as input features in a hierarchical random forest classification. Our results provide the first wall-to-wall crop type map for this key agricultural region of Nigeria. Our cropland identification had an overall accuracy of 84%, while the crop type map achieved an average accuracy of 72% for the five relevant crop classes. Our crop type map shows distinctive regional variations in the distribution of crop types. Maize is the dominant crop, followed by mixed cropping systems, including maize–cereals and potato–maize cropping; potato was found to be the least prevalent class. Plot analyses based on a sample of 1166 fields revealed largely homogeneous mapping patterns, demonstrating the effectiveness of our classification system also for intercropped classes, which are temporally and spatially highly heterogeneous. Moreover, we found that small field sizes were dominant in all crop types, regardless of whether or not intercropping was used. Maize–legume and maize exhibited the largest plots, with an area of up to 3 ha and slightly more than 10 ha, respectively; potato was mainly cultivated on fields smaller than 0.5 ha and only a few plots were larger than 1 ha. Besides providing the first spatially explicit map of cropping practices in the core production area of the Jos Plateau, Nigeria, the study also offers guidance for the creation of crop type maps for smallholder-dominated systems with intercropping. Critical temporal windows for crop type differentiation will enable the creation of mapping approaches in support of future smart agricultural practices for aspects such as food security, early warning systems, policies, and extension services.
1. Introduction
Smallholder agriculture is largely located in low to middle-income countries in Africa, Asia, and Latin America [1,2]. About 60% of farmers in these regions are poor, with families traditionally growing multiple crops on a single field due to the scarcity of fertile land per family, as well as the need to manage the land as effectively as possible and to optimize labor [3]. Nonetheless, intercropping offers a wide range of agronomic benefits, such as the diversification of nutrition options, the efficient use of nitrogen, and physical barriers for pests and diseases [3,4,5]. Consequently, agricultural production in smallholder regions is highly diverse, making it challenging to map. There is, however, a political and administrative demand for accurate estimates of agricultural production that go beyond the quality and frequency of traditional survey methods, improving the representation of smallholder agriculture in national to global food production [6]. There is a need for robust methodologies that provide accurate, reproducible, and cost-efficient estimates of agricultural production in these regions [7]. Enhanced knowledge of the contribution made to food production by smallholders will add to our understanding of smallholder farming systems and improve the role played by global food programs in attaining the Sustainable Development Goals (SDGs) [8,9]. In this context, it is crucial to know which crops are grown and where.
Agricultural plots in farming systems of sub-Saharan Africa (SSA) are smaller and follow less regular patterns than their counterparts in more intensively managed systems [10]. Smallholdings typically contain between 0.1 ha and 2 ha of agricultural land [1]. We know from household surveys in a number of African countries that around 50% and 25% of fields are smaller than 0.4 ha and 0.2 ha in size, respectively [11]. As a result, plot size may be a good proxy for characterizing smallholder systems or even land-use intensity in the absence of geodata on land ownership [2,12,13]. In addition, trees are often scattered across agricultural land [12], creating additional challenges when defining cropland masks or performing crop type mapping [14,15,16]. Consequently, it is challenging to create high-quality training and validation datasets [7], and field data collection in smallholder regions is both tedious and expensive [17,18]. Moreover, several crops are often grown simultaneously on one plot [1,17]. Such intercropping in smallholder systems creates spectral mixing due to the spatial and temporal similarity of crop type classes [18,19].
Remote sensing is a robust and cost-effective method for generating up-to-date crop type maps for large areas at various scales [20,21]. The advent of Sentinel-2A and Sentinel-2B (S2) imagery has significantly improved mapping of complex smallholder cropping systems in SSA, given the spatial resolution of 10 m (in the VIS/NIR domain), a temporal revisit window of approximately 5 days, an improved spectral resolution, and the inclusion of three vegetative red-edge bands [7]. Advances are further stimulated by the free data policies of the United States Geological Survey (USGS) Landsat program and the European Copernicus program, providing well-calibrated datasets for building time-series information. These developments and current computational capabilities offer opportunities for crop type mapping in complex smallholder systems over large areas.
Recently, remotely sensed time-series have been successfully employed for mapping crop types across different world regions [22], in Germany [23,24], in Ukraine, Mali, South Africa [25], in China [26], in India [27], and the United States of America [28], among others. Despite these great advancements regarding crop type mapping in general, studies focusing on crop type. Most previous studies on crop type mapping in smallholder systems of SSA have focused on the integration of multiple remote sensing datasets [29,30,31,32,33]. The authors of [30], for example, tested several combinations of Landsat-8 and S2 bands for mapping land cover, cereals, and legumes in Burkina Faso. They reported that a combination of Landsat and S2 red-edge bands produces the best output, particularly for separating legumes and cereals from other land cover types. Delrue et al. [34] tested the capability of Landsat and KOMPSAT-2 high-resolution data for crop type mapping in Ethiopia, and found that 4 m KOMPSAT-2 data were more appropriate than Landsat data for mapping smallholder fields. Prins and van Niekerk [35] explored the integration of LiDAR, S2, and aerial imagery using machine learning (ML) classifiers to map crop types in South Africa. They reported that LiDAR is robust for isolating crop types once crop heights reach a certain minimum threshold. Rustowiczet al. [31] mapped multiple crop types for Ghana and Sudan using semantic segmentation, integrating Sentinel-1 (S1), S2, and Planet data. Kpienbaareh et al. [33] integrated the same datasets to produce crop types in Malawi. These two latter studies reported that higher temporal and spatial resolutions, achieved by integrating data from three platforms, improved mapping accuracy. Mazarire et al. [36] tested crop type predictions in heterogeneous smallholder settings in SSA using only S2 to map a variety of crops. They reported an overall good accuracy based on a methods comparison, while encouraging the practice of mapping mixed classes with S2 data in the future.
Crop type mapping procedures in smallholder-dominated regions must be capable of handling temporally, spatially, and spectrally complex data, since heterogeneous smallholder cropping systems are highly diverse [14,37]. For this reason, commercial very high-resolution (VHR) satellite data are often used in studies that focus on smallholder systems. However, studies usually cover only small areas of interest (due to the high cost of commercial VHR data or the particular methods focus), neglecting intercropped classes [29,30,31,32,33]. Thus, there is a need to develop methods that are capable of mapping mixed classes, since mixed cropping is the most common form of farming in smallholder-dominated regions, impeding the production of useful annual crop type maps on the African continent. A review study on smallholder cropping regions by Chivasa et al. [37] identified major research gaps in the differentiation of crop varieties within a field, and highlighted the potential opportunities offered by sensors such as S1, S2, Landsat, and commercial high-resolution sensors for crop type mapping. Most importantly, the use of S2 data, offering advantages on account of the unique combination of spectral and spatial resolution with a dense revisiting schedule, opens up new opportunities for data-scarce regions characterized largely by smallholder agriculture. Open data policies and processing capabilities now make it possible to produce crop type maps for heterogeneous agricultural landscapes. However, challenges for creating analysis workflows adapted to seasonal data scarcity remain [31,37]. This problem is aggravated by heavy cloudiness during the main cropping season [38] and a lack of sufficient reference data [19]. Therefore, we focus explicitly on crop type mapping, including both sole cropping and mixed cropping systems in smallholder agriculture in SSA, using open source S2 data.
Few studies have been carried out to explore crop type mapping in Nigeria. To the best of our knowledge, previous studies focused largely on comparing different sensor constellations and classification setups [29,32], without specifically relating such strategies to the complexities of smallholder farming systems in Nigeria. Crop type maps are crucial for mitigating and adapting to future impacts of climate change and of increasing threats from pests and crop diseases in Nigeria; they are also crucial in supporting recent sustainability policies to transform the country’s agricultural sector [39]. Novel approaches are therefore needed to better map such spatially and temporally heterogeneous systems, specifically reflecting the complexity of smallholder cropping systems. In this study, we focus on the cropland of Nigeria, the main producer of grain in SSA [40]. We focus in particular on one of Nigeria’s core production region, the Jos Plateau [41]. Our overarching aim is to create a workflow for isolating phenological features and for mapping the key crops—maize and potato—in the complex environmental and agricultural setting of the Jos Plateau, Nigeria. We use spectral-temporal features from S2 spectral bands to tackle the challenges related to intercropping systems and fine-scale field structures relevant to smallholder agriculture. We further elaborate on the challenges and opportunities offered by the S2 sensor constellation in such data-scarce regions. We support our mapping approach with multi-temporal SkySat data for validation purposes. More specifically, we address the following questions:
- How accurately can we map maize, potato, and mixed cropping systems using all available S2 data in Nigeria?
- How are crop types distributed within the study region and across field size gradients?
2. Materials and Methods
2.1. Study Area
Nigeria’s Plateau State occupies an area of 30,913 km2, spanning from 7°24′ N to 10°25′ N and 8°45′ E to 10°38′ E. An elevational gradient divides Plateau State into two major distinctive ecological units (Figure 1). The upper plateau (Jos Plateau) and the lower plateau differ in terms of climatic conditions, soil types, and prevalent vegetation and morphology, due largely to differences in topography and geology (Figure 1). The Jos Plateau features a temperate climate compared to the other parts of Plateau State/Nigeria, with average monthly temperatures between 21 °C and 25 °C (https://de.climate-data.org accessed on 6 September 2020). Although the lower Plateau contains a larger area of agricultural land, the Jos Plateau is essential for food production in Nigeria, given its lower temperatures, increased precipitation, and favorable soil conditions. These conditions enable farmers to grow a wide variety of both tropical and temperate fruit, vegetables, and crops. Potato and other temperate foods are grown exclusively on the Jos Plateau. Nigeria is the fourth-largest producer of potatoes in SSA, with an estimated production of up to 843,000 tons per year, 82% of which is produced on the Jos Plateau [41,42].
Nigeria produces around 8 million tons of maize per year [40]. Plateau State is the fourth-largest producer of this important staple crop, which is grown in all states of Nigeria [43]. Maize is also predominantly grown on the Jos Plateau, intermixed mainly with potato, cowpea, or soybean. Staple crops such as cocoa, yam, cassava, beans, rice, fonio, and millet are produced on the Jos Plateau alongside the dominant crops, maize and potato [44].
The natural heterogeneity of savanna landscapes, where much of this cropland is situated, and the geological formations that occur in between them affect vegetation types and farming practices. Man-made patterns emerge due to intensive irrigation farming, which is prominent in close proximity to rivers, streams, and mine ponds; in addition, identifiable clusters are introduced due to other typical management practices that are inherent in the cultural origin of different tribes (special crop mixtures, terracing, etc.). These factors make the land cover and farming systems on the Jos Plateau unique, and by far one of the most difficult terrains to map in Nigeria from a remote sensing perspective.
2.2. Data
2.2.1. Image Data and Preprocessing
In this study, we integrated S2 (A and B) images with VHR SkySat imagery, the latter specifically for validation. To this end, we downloaded all available S2 Level 1C data for 2019 with a cloud cover of less than 70%, resulting in a total of 604 scenes across four footprints. We tasked SkySat acquisitions for four 25 km2 areas of interest and in five critical time periods of the 2020 cropping season (Figure 1). In addition, we obtained all available Landsat Collection 1 Level 1 observations for the period 2015 through 2020 for the purpose of improving the multi-temporal co-registration of the S2 time series [45]. Image downloads, preprocessing, and classification were carried out in the open source Framework for Operational Radiometric Correction for Environmental monitoring (FORCE) [46]. This preprocessing includes atmospheric correction [47], cloud masking [48], topographic correction, tiling, as well as image co-registration based on Landsat imagery. Here, we used the LSReg 2.0 algorithm [45], which is also fully integrated in the FORCE processing toolbox. In principle, the Landsat NIR band is used as a base layer over a 5-year period of acquisitions (in our case, 2015–2020) and co-registered via a hierarchical pyramid layer approach.
The result was a bottom-of-atmosphere reflectance for nine spectral bands in the visible through shortwave infrared wavelengths natively provided at 10 m and 20 m spatial resolution. FORCE enables the spatial resolution to be homogenized and improved spatial resolution by downscaling 20 m bands to 10 m pixel resolution [47]. This downscaling makes it easier to detect the variability of land cover or landscape features [49] and small fields, which are dominant in the smallholder setting [7,18]. Bands one, nine, and ten are for the purpose of atmospheric correction and cloud screening at 60 m spatial resolution; thus, they are not useful for our land cover or crop type mapping [50], and were removed from our main analysis.
2.2.2. Reference Data
Field data were collected during the 2019 and 2020 cropping seasons, along with 119 semi-structured interviews that focused on the farmers’ cropping practices. We collected 530 samples of potato and maize fields in 2019, covering ecological gradients and different management practices. A stratified random sampling across the study area was used and guided by the accessibility of farm settlements. Of this total, 180 of the samples covered potato fields, mostly intercropped with maize, and 352 samples corresponded to maize fields, which were intercropped in part with legumes (soybean, groundnuts, or cowpea). The 2020 field campaign added another 690 samples, 181 of which were from potato farms, mainly mixed with maize, and 509 from maize fields, most of which were also mixed with legumes (Figure 2 and Table 1).
Our initial classification models based solely on the 2019 field data suggested that the models suffered from a variance problem, where a decrease in prediction error may be caused by adding more training data. Furthermore, a variety of ML algorithms, including random forests (RF), are sensitive to class imbalance. We produced multiple crop types by testing the influence of training data and outlier effects; with higher training data, map accuracy increased from 50% to 72% in our final crop type map. We amended our training database accordingly by digitizing additional points in fields that had been visited, using in-season SkySat data to consider the exact and up-to-date parcel boundaries, following the approach by [7]. We increased the overall sample size to 2260, ignoring the maize class, which was well covered by samples from field campaigns. This procedure created a balanced distribution of training data in a bid to reduce errors related to infrequent classes in the sampling scheme [51]. The next step involved generating training samples of non-maize and non-potato fields based on VHR in-season SkySat imagery. Five other crops are produced in substantial quantities in the study area: yam, rice, grass, fonio, and vegetables. These crops were well identified from high-resolution satellite data due to ridging and plowing patterns, field textures, and field sizes. A total of 519 points were collected for the other crop types. Overall, we created a reference point database of 2779 samples for the crop type mapping (Table 1). We disregarded crops such as cassava and cocoyam because their cropping calendars do not overlap with our dominant crop types and therefore our temporal mapping window.
2.3. Phenology and Spectral-Temporal Metrics
Robust information on crop phenology is required to be able to map smallholder cropping systems. After generating a crop calendar from field observations and multi-temporal satellite data (SkySat, Google Earth, and S2), we estimated the biomass peaking months of maize and potato from the 2019 field data and leaf area index based on harvested leaf measurements. This information was used as guidance for designing the cropping calendar, which includes typical dates of crop phenology and management (Figure 3). The chart indicates the average occurrence and development stages of significant crop types, and compares them with their appearance on remote sensing images [51].
We conceptualized four critical windows (CW-1 to CW-4) for mapping crop types in the mixed smallholder farming systems of the Jos Plateau region (Figure 3). CW-1 is the dominant window for the sowing and emergence of potatoes, which is usually between the last week of March and early May. Planting dates depend on the local temperature, rainfall, soil type, and management practices. CW-2 is the dominant window when maize is sown and emerges. Maize is usually introduced 3 to 5 weeks after the emergence of potatoes in mixed fields. This window also corresponds to the period when potatoes mature; it is usually a very narrow window due to the influx of potato diseases (mainly potato blight and bacterial wilt). CW-3, the window in which potatoes are harvested, is largely dependent on the time when the potatoes were laid, the rate of disease infection, and the local climate. CW-3 is also the most critical window for mapping potato and potato–maize classes. CW-4, the window for maize anthesis and maturity, occurs before maize senescence. CW-4 also corresponds with the presence of maize–legumes, and is the period when potatoes are completely harvested from mixed fields. Essentially, the windows can be described as follows: (i) CW-1 is when potatoes are cultivated; (ii) CW-2 and CW-3 are when maize is sown and the potato canopy has reached full cover; and (iii) CW-4 is when potatoes are harvested, maize is at maximum biomass, and legumes are introduced.
The cropping calendar served as a proxy for generating spectral-temporal metrics (STMs) used to map land cover and crop types on the Jos Plateau. STMs are frequently used in remote sensing for large area mapping and have proven useful in the context of agricultural analyses, given that they facilitate the statistical description of key phenological stages in time series data [51,52,53]. The creation of STMs is an aggregation of all available observations from a predefined temporal window into descriptive statistics—in our case, critical windows. STMs maintain extensive information on the temporal variability of land surface reflectance and serve as powerful predictors for ML classifiers [52].
We calculated a total of 11 pixel-based statistics: Minimum (Min), 25% Quantile (Q25), 50% Quantile (Q50), 75% Quantile (Q75), Maximum (Max), Average (AVG), Standard Deviation (STD), Range (RNG), Inter-Quartile Range (IQR), Skewness (SQW), and Kurtosis (KRT). STMs were produced for each of the nine S2 spectral bands as well as the following indices: (i) Normalized Difference Vegetation Index (NDVI); (ii) Enhanced Vegetation Index (EVI); (iii) Normalized Difference Water Index (NDWI) and the Tasseled Cap transformations; (iv) Wetness (TCW); (v) Greenness (TCG); and (vi) Brightness (TCB). Furthermore, we created separate STMs for five temporal windows based on: (i) the entire calendar year (Day-of-Year (DOY) 001–365); (ii) the entire cropping period (DOY 091–304); (iii) the start of season (DOY 121–181); (iv) the peak of season (DOY 213–273); and (v) the off-season (DOY 304–090). We produced 770 image features in total. Due to the high prevalence of clouds during the growing season and our aggressive cloud masking, a total of 20.7% (with 134 image observations across four tiles) and 7.5% (with 81 image observations across four tiles) of the study area had no single clear-sky observation in the DOY 121–181 and the DOY 213–273 temporal windows, respectively. In contrast, the DOY 094–304 temporal window had no data gaps. Data gaps particularly occurred in the south-west of the study region.
The 770-dimensional feature space is large, consisting of redundant and correlated features, which do not add important information to the RF classifier but increase computational complexity, storage space, and classification run time [54,55,56]. Therefore, we applied recursive feature elimination within a cross-validated setup using the scikit-learn RFECV-class in Python. The procedure is a user-defined parametrization to select features of importance and reduce redundancy among features, ultimately improving computational performance [57,58].
Accordingly, we reduced the input feature space to 155 dimensions for the land cover modeling, and 208 features for the crop type mapping. We used the entire set of spectral bands, Tasseled Cap Brightness, Greenness and Wetness, as well as indices across the different temporal windows for the land cover mapping, resulting in 155 features. For the crop type mapping, we reduced metrics to the major six (Min, Max, Avg, Q25, Q50, Q75) for the nine spectral bands and only for three critical cropping windows (start-of-season, mid-season, and entire cropping season), totaling 208 features including elevation from SRTM. Since our main objective was prediction accuracy and RFs can handle collinearity among features and a high-dimensional feature space, we did not further decrease the input dimensions.
A few of the STMs generated were also selected for the phenological analysis to reduce potential outlier effects [59]. Only the following STMs were used to assess the spectral-temporal variability and phenology of maize and potato: Q25, Q50, Q75, and STD for the entire cropping calendar (DOY 091–304). The phenological profiles were individually generated for all nine S2 spectral bands and also NDVI. The profiles showed that the differences in potato and maize fields were largely captured spectrally between May and July (CW-2 and CW-3) for all bands, while the near infrared red (NIR), short wave infrared red 2 (SWIR2), and the three red-edge bands showed a slight distinction between crop types in the other critical windows as well. The Q25 and STD metrics showed a better separability in maize and pure potato fields, especially in the last quarter of May, while Q75 and Q50 exhibited greater distinction in the first quarter of June.
Even though the peak levels for mixed and sole-cropped fields are comparable (especially the three classes with maize), the peaks appear at different temporal windows (Figure 4). This is in relation to the presence and absence of companion crops and when they appear on or disappear from the fields as indicated in the crop calendar. In general, our four classes of interest show a very similar NDVI profile, but peaks and shapes vary (Figure 4). However, we note that the NDVI peaks in the potato–maize system are lower than in the sole maize and maize–legume fields, which can be attributed to planting densities.
The patterns of the sole maize spectral bands and NDVI profiles appear to be more stable; they also reveal flexibility within the season window, and diverse field-level and regional management. The varying standard deviations across the different temporal windows underlines this. The phenological profiles show no clear cuts in harvest; fields are just left fallow and it is difficult to define when crops are still on the field and when they have been harvested. In general, maize profiles exhibit a smoother curve with stable standard deviations, except for the start of season. In contrast, potato profiles are quite erratic, as captured in the standard deviations, especially during June and July, when all profiles show a temporary decline. Largely, the phenological profiles compare with the growing patterns shown in our crop calendar, representing quite well the true nature of crop production cycles in Plateau State (onset of rainfall, emergence, harvesting regimes, etc.).
2.4. Crop Type Mapping and Field Sizes
We used an RF classifier because RFs are widely used in the classification of crop types, parametrization is straightforward and well understood, and performance is generally good [60]. We first produced a land cover map with the goal of eliminating other land cover types and creating a cropland mask for our crop type mapping. Model building and prediction were carried out in FORCE using the 2779 training points as input for training an RF model, using a selected set of 155 features obtained from recursive feature elimination (from the 770 STMs) and 500 trees in the RF. We first generated five land cover classes (bare ground, cropland, water, vegetation, and built-up), then collided all five land cover classes into binary classes of cropland and non-cropland. We estimated the accuracy of the land cover map by area-adjusted accuracy assessment [61].
For the crop type mapping, we restricted the input features to spectral bands only, in order to test the capability of S2 bands in predicting crop types in the heterogeneous and smallholder-dominated region. Guided by the crop calendar and phenological analysis, the following temporal windows were identified as being specifically useful for separating maize, potato, and mixed fields on the Jos Plateau: (i) DOY 091–304, (ii) DOY 121–181, and (iii) DOY 213–273. For the DOY 091–304 window, we used all 11 generated STMs. For the narrower windows, we restricted the STMs to six metrics (MIN, MAX, Q25, Q50, Q75, AVG) in order to increase feature quality and reduce the impact of image artifacts (e.g., caused by cloud remnants).
A total of 207 S2 band STMs and surface elevation data (SRTM), together with the 2779 training samples, served as input to an RF classifier to predict the crop types inside the masked cropland area. The SRTM-based digital elevation model (DEM) was integrated into the crop type classification [62] due to the importance of elevation in the distribution of crop types, especially potato. The crop type map was outed with an auxiliary marginal probability map. Normally, a probability map is produced as a supplementary product when producing an RF classification in FORCE. The marginal probability map is outputted only when multiple models are assigned for each model set and the margin is produced based on the mean class probability (see FORCE documentation: https://force-eo.readthedocs.io/en/latest/, accessed on 1 May 2021). We estimated accuracies using 20-fold cross-validation on the training data, because even SkySat imagery did not allow us to create a validation sample for the complex target classes that would have facilitated an area-adjusted accuracy assessment. Finally, we applied a spatial filter to reduce isolated misclassified pixels in the crop type classification. This step is specifically very useful for improving crop type classifications in heterogeneous smallholder settings [14]. All maps were produced at the 10 m resolution provided by the input data.
We then assessed crop types in relation to field sizes in Nigeria’s Jos Plateau. To this end, we interactively delineated plot boundaries in the SkySat imagery in systematic, purposive selected clusters from the four tasked SkySat acquisitions (see AOIs in Figure 1). The AOIs were selected based on field knowledge with the goal to represent crop diversity and management types. Six clusters were selected for each of the four AOIs (24 clusters in total); cluster selection was guided by the availability of field information (131 farms) to further validate crop type mapping at plot level. In spite of having selected similar sized clusters, the number of fields within a cluster varied across the four AOIs. We digitized a total of 1066 fields; field data and crop type information were known for 131 of the extracted fields. We then calculated field sizes in hectares to shed light on the size of fields in the Jos Plateau smallholder region. In the next step, we masked crop type at the respective fields to capture field-level crop type prediction accuracy. This was achieved using rule sets, which involved assigning the majority vote of the pixel counts in each field and estimating misclassified pixels in fields where multiple classes occurred to calculate accuracies. The entire approach and data used for the crop type mapping are illustrated in the flowchart below (Figure 5).
3. Results
3.1. Mapping Complex Cropping Systems with S2 Time Series
The Jos Plateau covers about 10,086 km2 of the landmass in Plateau State, Nigeria. Our land cover map shows that cultivated fields are the most dominant land cover type on the Jos Plateau, accounting for 4149.8 km2, or 41%, of the total land area in 2019; non-cropland classes make up the remaining area. The cropland/non-cropland classification achieved an overall accuracy of 84.2%, with a producer’s accuracy and a user’s accuracy of 74.7% and 86.6%, respectively, for the cropland class. Non-cropland achieved a producer’s/user’s accuracy of 91.2% and 72.5%, respectively.
The cross-validation of our crop type predictions shows an overall mean accuracy of 72%. Class-wise accuracies show that “potato–maize” has the highest producer’s accuracy (83%), while “potato” achieved the highest user’s accuracy of 99% and the lowest producer’s accuracy of 65% (Figure 6). Surprisingly, the accuracies of our mixed classes are comparably high (especially potato–maize). The variances of user’s and producer’s accuracies are comparable in all classes, except for potato, which shows a higher variance in producer’s accuracy.
The results of the RF variable importance analysis revealed that elevation (DEM) was more important than any single spectral metric derived from S2 in the crop type predictions. Generally, significance values show little variation across the 207 spectral input features, with 0.00576 for the SRTM and all spectral input features ranging from 0.00511 to 0.00474. In terms of temporal windows, the DOY 091–304 window is the most important one, followed closely by the end-of-season narrow window (DOY 213–273), which appears to be very important in spite of the limited data frequency within this window.
The maximum RF marginal probability was comparable across all classes, except for potato (Figure 7). The potato class has a very high probability density between 0.2 and 0.4, corresponding to the lowest overall and maximum probabilities. This is likely related to it being the smallest class with the fewest training samples. Class probabilities are generally relatively low. This is not surprising, given the spectral similarities of the mapped classes as shown in the phenological profiles (Figure 4).
3.2. Assessing the Spatial Patterns of Crop Types and Field Sizes
Obvious regional patterns emerge from the crop type map, with farmers in different sub regions focusing on growing different crop types, and mixtures thereof (Figure 8). Overall, the crop type map indicates that sole maize is the dominant class, covering 1624 km2 or 39% of the cropland on the Jos Plateau. The second-largest crop class is the mixed class of “Other” crops, i.e., all crop types not including maize or potatoes, occupying 1045 km2 (25.1%). Next is maize–legumes with 971 km2 (22.6%), followed by potato–maize accounting for an area of about 545 km2 (13.1%). Potato–maize is primarily produced in clusters, especially in the western, central, and southern parts of the area. Potato is the smallest class, with only 35 km2, i.e., covering less than 1% of the cropland on the Jos Plateau. The sole potato class is more dominant in the Jos-Maingo and Heigpang areas (Figure 8), while only a few scattered fields were mapped in other regions.
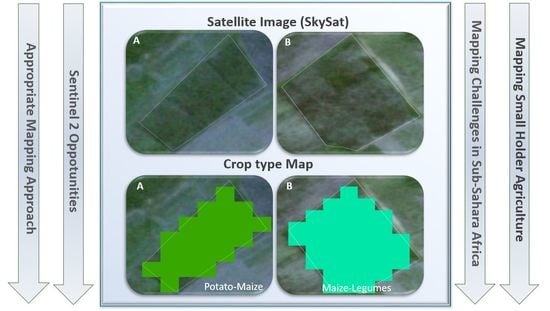
Our results revealed that the majority of plots were well captured, showing largely homogeneous patterns within each plot. Mixing mainly occurred along field boundaries within a cluster (Figure 9). The plot boundaries are usually left fallow for demarcation, resulting in transitional pixels being hard to assign to one class or another, even at 10 m spatial resolution. Inhomogeneity within single plots is often associated with erratic growth patterns, which are also visible in the SkySat images (Figure 9). There are distinctive clusters of similar crops on the crop type map and crop type mixtures (e.g., Cluster 1), while other clusters are quite diverse, exhibiting various mixtures in different fields within the cluster (e.g., Cluster 4). Applying spatial filters, the map reduced isolated misclassified pixels, because most clusters on the Jos Plateau are homogeneous and present minor snags on very small neighboring pixels. Most of the smallest fields were clustered in Bokkos (0.4 to 0.8 ha), while the majority of the large fields (between 3 ha and 5 ha) were located in Jengre/Bassa and Pankshin (Figure 9).
Field sizes varied from 0.02 ha to 5.7 ha in our sample of 1166 fields, with a mean of 0.3 ha to 0.5 ha. Around 75% of the fields were smaller than 1 ha, and 99% were less than 2 ha in size (Figure 10 and Figure 11). In general, similar field size distributions occurred across all the mapped crop types (Figure 10). Potato fields differed slightly from other crop types, yielding the smallest average size and a size distribution towards the lower end of field sizes on the Jos Plateau. The majority of potato fields were smaller than 0.5 ha; a very small number of fields had an area of up to 1.2 ha. On average, the largest fields occurred in the maize–legume class, where the majority of fields were larger than 0.5 ha, and even up to 3 ha in a few instances. A small number of maize fields had an area of a few hectares; the maximum size was just over 10 ha.
The mean field-level homogeneity is approximately 79% for all 1166 fields, with most homogeneities ranging from 90% to 100% (Figure 11B). The distribution of class-wise field-level homogeneities was as follows: 67% of maize–legumes fields were above 80%, similar to the results of 63% and 59% in the case of maize and potato–maize fields, respectively. The potato class exhibited the lowest field-level homogeneity, with only 54% of the fields being at least 80% homogeneous. The field-level homogeneity is in line with the overall class-wise accuracies, except for the potato class. Likewise, crop predictions of large fields and small fields are comparable (Figure 9).
4. Discussion
Previous studies have highlighted the significance of S2 for mapping crop types in the heterogeneous smallholder farming systems of SSA [14,31,32,35,36]. However, studies often focus on yield estimates based on indices and regression models [7,18], mainly for sole crops [7,32,36], mostly using a combination of several satellite datasets [33,34,35], tested for very small districts only [14,34,36]. For this reason, we expanded the mapping methodology with a specific focus on crop type mapping, integrating sole and intercropped fields using only S2 spectral bands only in a key agricultural region of Nigeria.
4.1. Accuracy of Cropping System Identification
Maize and potato (inter)cropping systems were mapped with an overall accuracy of 72%. The resulting map showed distinctive variations in regional crop types, clearly demarcating the diverse sub regions with different cropping systems and corresponding well with regional farming practices (Figure 8). The maize class surprisingly achieved the lowest user’s accuracy (65%), yielding also low probabilities in maximum and density thresholds. Even though maize phenological profiles are more consistent (Figure 4), the range of field-level practices diverges substantially in the region (as shown by the standard deviations). Field observations and individual phenological profiles exhibit different growth, biomass, and plant vigor across and within sole-cropped maize fields, representing site-specific expressions of weather, soil, pests, diseases, and management practices. Within-field intra-class variability is mainly associated with nutrient deficiencies and damage by pests and diseases. Our results showed a wide NDVI peak value range for maize (0.5 to 0.79), which is in line with findings by Wang et al. [63]. Consequently, we drew training samples across all management segments (healthy, malnourished, and underdeveloped fields). This may have further reduced mapping accuracies of the maize class by inter-class spectral mixing, thereby explaining the wide range of phenological profiles and related standard deviations. However, the wide range of intra-class spectral values improved the identification of intra-class spectral variability as exemplified in Huong et al. [64]. Moreover, maize is the class with the largest planting variation, responding to a regional climatic gradient. Plants grow faster on the eastern and southern Jos Plateau—irrespective of when they are planted—due to more favorable rainfall and temperature conditions. Foerster et al. [65] reported significant improvements in crop type classification when weather data are integrated. However, we also related lower mapping accuracies in the maize class to limited satellite data frequency within the critical maize peaking window. Within the August–September (DOY 213–273) window, only 81 S2 images across four footprints were available, with 7.5% of the cropland pixels not being observed at all. The isochronism of critical windows and cloud cover peaks has also been addressed by other studies [14,18,30], since the availability of cloud-free optical observations is important in differentiating crop phenology and ultimately crop types [46]. Moreover, the overlapping phenological stages of crops and specifically mixed-cropping systems adds to the challenges (see Figure 3). Lastly, we relate the low accuracy in the maize class to the presence of maize in all mapped cropping systems, except for sole potato. This may be difficult for the classifier to separate, especially in the latter part of the cropping calendar when the dominant reflectance is from maize, overshadowing all under sown crops (Figure 4).
There is a wide gap between producer’s and user’s accuracies of the potato class; we have a few commission errors and large omission errors as a result of the insufficient number and spatial distribution of reference data in that class [51]. We increased the reference data in this class from 57 to 338 points, making it the class with the largest reference data addition (Table 1). However, these points are clustered around the few original points because sole potato fields are rare in that area. As a result, the component of spatial distribution is lacking in both training and validation. This is reflected in the probability statistics, where a strong probability density as a result of the increased clustered training points comes with a low maximum probability. The phenological profile of potato surprisingly reveals high values at the end of the season, when potatoes are supposed to be harvested. However, this likely results from natural regrowth of weeds on fallow fields, or from other crops being planted immediately after the potato harvest. Given that potato is harvested in the early quarter of the cropping calendar and is a fast-producing crop, field conditions from July–September are suitable for vegetation regrowth or for producing legumes (cowpea, soybean, etc.), cassava, vegetables, cocoyam, and so on. This range of options for farmers also explains the large standard deviation found for this temporal window (Figure 4).
The maize–potato class achieved a mean producer’s accuracy of about 84%, and a mean user’s accuracy of around 77% (Figure 6). Despite the similarity in the class profiles, we observed slight alterations in the potato–maize profile, especially in the window when potatoes are harvested, which is mainly characterized by a reduction in biomass on the field (Figure 4). There is a wide standard deviation within this temporal window in this class because its signature is largely dependent on the growth stage of maize. If potatoes are harvested in June–July, the reduction in biomass is captured. However, if potatoes are harvested when maize is at a developed stage, no obvious changes will be reflected in the spectral-temporal profile, which is typically the case in August (compare Figure 3). Potato is traditionally the prime crop in this case, and maize is planted later in the season to take advantage of or to support nutrient carry-over effects. Potato tubers are usually completely evacuated from the fields, with all leaves being removed during harvest. Potato harvest commences as soon as plants have reached maturity (July–August), but often earlier in Plateau State if infected by diseases such as blight or bacterial wilt (end of June–July).
The maize–legumes class is the only class where user’s and producer’s accuracies are comparable. The maize–legume class is a combination of maize with soybean, cowpea, or groundnuts. Its phenological profile is comparable to the pure maize class, mainly because weeds on maize fields exhibit similar characteristics as legumes [14,18]. In the intercropping systems of Nigeria, legumes are often introduced later on the field, at sparse intervals; in such instances, maize is the principal crop, dominating the temporal profile. Surprisingly, the user’s and producer’s accuracies of mixed classes are high and more stable, yielding between 70% and 99% (Figure 6). The S2 spectral bands under the systematic temporal critical windows performed well in predicting mixed classes, especially potato–maize.
Summarizing, we observed several factors that affect the accuracy of our crop type map, including the quantity and spatial distribution of training samples [39,51], the frequency and quality of available satellite data [46], spectral-temporal variation in classes due to nutrient deficiencies and poor management practices, which are common in the African smallholder system [17], and the spectral similarity of the mapped classes (Figure 4, see also [18]). We already highlighted satellite data availability as one of the key factors affecting crop type mapping, especially limited S2 data within the critical narrow temporal windows of DOY 121–181 and DOY 213–273. Such region-inherent data scarcity can only be overcome by developing integrated approaches using both optical and synthetic aperture radar data, such as S1 data to compliment S2, as shown by [7,26,33,65]; such studies are reported to have higher accuracies [66]. Multi-sensor compositing, integrating Landsat observations, has also been used to improve data availability [30,67,68]. However, Forkuor et al. [30] reported a contrary finding for SSA, and Griffiths et al. [23] pointed out that the 30 m resolution compositing Landsat and S2A/B for smallholder farming systems of developing countries is inadequate, where a 30 m pixel may cover multiple fields. Studies have also recommended using VHR data to improve crop type predictions in smallholder regions of SSA [22,31,33,34], or LiDAR data [35]. However, our approach performed well compared to studies where multiple sensors are integrated, as also reported by [36]. Combining reference data from field visits with additional information from multi-temporal SkySat acquisitions was useful for increasing inter-class separability—a strategy that may well be adaptable in many contexts of SSA, where fieldwork is limited.
The phenological analysis revealed that the most important S2 features for separating crop types on the Jos Plateau were STMs based on red-edge bands, the NIR, and SWIR bands. The importance of S2 red-edge bands was consistent with previous studies, which reported the significance of S2 red-edge and SWIR bands for estimating crop yields in complex smallholder regions of Africa [7,14,18,69]. Red-edge 3 (Band 6), in particular, has been shown to be essential to investigate photosynthesis, and canopy measurement of chlorophyll and nitrogen [18,49,69,70]. Specifically, Griffiths et al. [23] highlighted the importance of S2 red-edge bands in discriminating potato from other crop types; in addition, mapping accuracies of maize increased when red-edge bands were integrated. Forkuor et al. [30] found that they helped to separate cereals and legumes from other vegetation types in West Africa. Our RF variable of importance negates this finding. Although the red-edge 3 band appeared in the 20 most important features, the STRM is ranked the most important feature, followed by red and then seven SWIR feature metrics within different temporal windows (see also [36,49,70,71]). We found that no single feature is dominant in complex phenological settings, data-scarce regions, and smallholder-dominated agriculture. This is likely due to the multicollinearity in this high-dimensional feature space. It also highlights the importance of providing the machine learner with as much input information as possible when crop type variability and in-field crop type mixtures are high, and average field size small, as in the case of the Jos Plateau.
4.2. Spatial Patterns and Field Sizes in Jos Plateau Cropping Systems
Our map shows distinct variations in regional cropping systems, clearly demarcating the different sub regions with diverse crop types and mixtures. The mapped patterns correspond well with the regional cropping practices, as known from field experience and the interviews conducted (Figure 8 and Figure 9). Potato–maize is dominantly produced in clusters (see also [30]), grown in valleys to take advantage of the early rains, especially in the western, central, and southern parts of our area-of-interest, where climate and soils are suitable for this cropping regime. These locations are well delineated in the crop type map. Likewise, the regions where maize is mixed with legumes are well predicted, especially in the western, central, and southern parts of the Jos Plateau. Correspondingly, potato and potato–maize classes are not mapped in northern and eastern regions, where higher temperatures and unsuitable soil types are not conducive for potato cropping (Figure 8 and Figure 9).
Despite having successfully digitized field boundaries using SkySat imagery, we were unable validate the accuracies of the delineated field boundaries using cadaster information, which is lacking for the region. Our field-level results show that the Jos Plateau is dominated by extremely fine-structured smallholder agriculture [1]. Mean field sizes range predominantly from 0.3 ha to 0.5 ha, and more than 80% of the plots are smaller than 0.8 ha (Figure 11; see also [10]). Other studies also found that field sizes in such settings are typically extremely small and often irregularly shaped [17] rendering the extraction of cultivated land a complex task (see also [1,11]). Fields on the Jos Plateau are further characterized by fragmentation, mainly induced by rock formations and degraded land (mine dumps, ponds, and wasteland), especially in the western and southern parts of the region (Figure 8 and Figure 9). Our results revealed that fields where maize is grown are larger in size (on average 0.4–8 ha), while potato fields are smaller (on average 0.2–0.5 ha; Figure 10). This difference is related to the economic aspect of growing potatoes, and especially the cost of seed potatoes [72].
The field-level accuracies revealed that the majority (approx. 70%) of the extracted fields achieved homogeneity levels between 80% and 100% (Figure 11). Errors were due to mixed pixels, plant diseases that introduced spectral heterogeneity, or the cultivation of multiple crops in a single field. Field-level misclassifications also stemmed from the similarity of the majority of mapped classes or related to crop mixtures (Figure 9). However, the potato class exhibited lower homogeneities, in contrast to the overall accuracies of that class. Mixed pixels mainly occurred along field boundaries (fallow demarcations), where smaller fields had a stronger relative influence on field homogeneity or heterogeneity. Field demarcation originating from small ridges, usually at a sub-pixel level, were difficult to extract, especially if similar crops were growing on adjacent fields.
5. Conclusions
Crop type mapping in smallholder settings in SSA is complex, given the irregular field patterns and small field sizes, diverse management practices, highly heterogeneous growing environments, and other mapping difficulties associated especially with smallholder farming systems. Adding to that, frequent cloud cover during the growing season renders crop type mapping, including intercropping, a challenging exercise. Therefore, freely available satellite data of the European Copernicus Program, specifically S2A/B, allow for major advances in mapping and monitoring crop types in smallholder farming systems of SSA.
In this study, we expanded existing crop type mapping methodologies to map maize and potato, as well as intercropping mixtures with both crops, using S2 data only. To our knowledge, this is missing for crop type mapping in the smallholder region of SSA. For the complex smallholder cropping systems of the Jos Plateau, Nigeria, our crop mapping approach achieved 72% mean accuracy using S2A/B STMs of spectral bands across critical growth periods and SRTM-sourced elevation data. Achievable accuracy was comparable with studies that had a narrower focus (single crops, multiple sole-crop classes, VHR data, and small sites at district or village level) or where multiple remote sensing data were integrated, highlighting the importance of S2A/B for complex smallholder regions. We are convinced that this as a crucial first step to better comprehend the opportunities and limitations regarding the use of Sentinel-2 data for monitoring smallholder cropping systems. Our study helps in understanding the most pressing issues that need to be solved, if operational agricultural monitoring in regions of SSA, such as the Jos Plateau in central Nigeria, is the goal. Our crop maps have achieved a level of quality, though, that enables them to be used for guiding informed policies, broad-scale early warning systems (regarding nutrient deficiencies, pests, and diseases), the regional monitoring of crop production leading to comprehensive crop archives, and relatively accurate yield estimations for food planning, bio-waste, and bioenergy potentials, at a regional level.
Our study highlights the possibility of mapping sole and mixed crop types with S2A/B, even though spectral profiles of mixed classes can be quite similar to sole-cropped fields. As such, there is a need to further expand methods so that they are able to map intercropped classes especially to improve field-level accuracies. After all, such classes represent the dominant management practices in smallholder regions, and remain one of the most challenging factors that impede the production of annual crop type maps across the African continent. Since the climatic conditions, satellite data frequencies, cloud cover, and management and farming practices compare to those in many other African tropical highlands, it would be possible to use similar methods in areas with high levels of intercropping in smallholder systems, e.g., Ethiopia, Kenya, Uganda, Rwanda, and Angola.
Author Contributions
E.S.I., P.H. and C.N. motivated the study. E.S.I., P.R., L.N. and P.H. conceptualized the methodology; 2019 field work, data pre-preprocessing and analysis were performed by E.S.I. and P.R. contributed to data pre-processing, land cover/crop type mapping, and visual assessments of the maps and figures. L.N. performed data download and Python-cripting for the feature selection and crop map validation, and contributed to land cover/crop type mapping. E.S.I. and P.H. wrote most parts of the manuscript and all authors contributed to the review and editing of the manuscript, especially C.N. and B.K. All authors have read and agreed to the published version of the manuscript.
Funding
This research is funded by the Nigerian-German Postgraduate Training Programme PhD, 2019 (57473408). The National Centre for Remote Sensing, Jos Plateau State, Nigeria, Humboldt university of Berlin, Germany, and Leibniz Centre for Agricultural Landscape Research (ZALF), Brandenburg, Germany offered the necessary support.
Institutional Review Board Statement
Not applicable.
Informed Consent Statement
Not applicable.
Data Availability Statement
The data presented in this study is openly available in Zenodo referring to this paper. Available online: https://0-doi-org.brum.beds.ac.uk/10.5281/zenodo.5426026 (accessed on 26 July 2021).
Acknowledgments
We acknowledge support by the German Research Foundation (DFG) and the Open Access Publication Fund of Humboldt-Universität zu Berlin. The Deutsche Gesellschaft für Internationale Zusammenarbeit (GIZ), Jos Plateau State, Nigeria, provided relevant reports and contacts of farmer associations. Likewise, we thank the Plateau Agriculture Development Program, National Root Crops Research Institute-Potato (Kuru-Jos) and Daniel Lenka of the Department of Agriculture, University of Jos, for providing additional supporting documents. The authors appreciate Rifkatu Ibrahim, Joshua Azi Aware, Serah Habu, Alloycious Dere, Shomboro Karau, Samuel Odi, and Atang Itse for their field support in 2019 and independently collecting field data for the 2020 cropping season. We also acknowledge the cooperation of 119 farmers (questionnaire respondents) on the Jos Plateau, they provided relevant information regarding farming practices and farm managements.
Conflicts of Interest
The authors declare no conflict of interest.
References
- Lowder, S.K.; Skoet, J.; Raney, T. The Number, Size, and Distribution of Farms, Smallholder Farms, and Family Farms Worldwide. World Dev. 2016, 87, 16–29. [Google Scholar] [CrossRef] [Green Version]
- Samberg, L.H.; Gerber, J.S.; Ramankutty, N.; Herrero, M.; West, P.C. Subnational distribution of average farm size and smallholder contributions to global food production. Environ. Res. Lett. 2016, 11, 124010. [Google Scholar] [CrossRef]
- Bouws, H.; Finckh, M.R. Effects of strip intercropping of potatoes with non-hosts on late blight severity and tuber yield in organic production. Plant Path. 2008, 57, 916–927. [Google Scholar] [CrossRef]
- Kumar, R. Physical control of pests. In Insect Pest Control—with Reference to African Agriculture; The Camelot Press Ltd.: Southampton, UK, 1988; pp. 63–71. [Google Scholar]
- Zang, C.P. Recent Increased Incidences of Potato Late Blight on the Jos Plateau: A Case for Intercropping. Agric. For. Fish. 2014, 3, 363. [Google Scholar] [CrossRef] [Green Version]
- UN DESA Report, “World Population Prospects”. United Nations Department of Economic and Social Affairs/Population Division 1. Key Findings and Advance Tables. 2015. Available online: https://esa.un.org›files›key_findings_wpp_2015 (accessed on 25 June 2020).
- Jin, Z.; Azzari, G.; You, C.; Di Tommaso, S.; Aston, S.; Burke, M.; Lobell, D.B. Smallholder maize area and yield mapping at national scales with Google Earth Engine. Remote Sens. Environ. 2019, 228, 115–128. [Google Scholar] [CrossRef]
- Earth Observation for Sustainable Development Goal—Compendium of Earth Observation Contributions to the SDG Targets and Indicators. Available online: https://eo4society.esa.int/wp-content/uploads/2021/01/EO_Compendium-for-SDGs.pdf (accessed on 25 May 2021).
- Estoque, R.C. A Review of the Sustainability Concept and the State of SDG Monitoring Using Remote Sensing. Remote Sens. 2020, 12, 1770. [Google Scholar] [CrossRef]
- Fritz, S.; See, L.; McCallum, I.; You, L.; Bun, A.; Moltchanova, E.; Duerauer, M.; Albrecht, F.; Schill, C.; Perger, C.; et al. Mapping global cropland and field size. Glob. Chang. Biol. 2016, 21, 1980–1992. [Google Scholar] [CrossRef]
- Carletto, C.; Jolliffe, D.; Banerjee, R. From Tragedy to Renaissance: Improving Agricultural Data for Better Policies. J. Dev. Stud. 2015, 51, 133–148. [Google Scholar] [CrossRef]
- Bey, A.; Jetimane, J.; Lisboa, S.N.; Ribeiro, N.; Sitoe, A.; Meyfroidt, P. Mapping smallholder and large-scale cropland dynamics with a flexible classification system and pixel-based composites in an emerging frontier of Mozambique. Remote Sens. Environ. 2020, 239, 111611. [Google Scholar] [CrossRef]
- Waldner, F.; Diakogiannis, F.I. Deep learning on edge: Extracting field boundaries from satellite images with a convolutional neural network. Remote Sens. Environ. 2020, 245, 111741. [Google Scholar] [CrossRef]
- Lambert, M.-J.; Traoré, P.C.S.; Blaes, X.; Baret, P.; Defourny, P. Estimating smallholder crops production at village level from Sentinel-2 time series in Mali’s cotton belt. Remote Sens. Environ. 2018, 216, 647–657. [Google Scholar] [CrossRef]
- Traoré, K. Le Parc À Karité: Sa Contribution À La Durabilité De La-Grosystème. Cas Dune Toposéquence à Konobougou (Mali-Sud). Ph.D. Thesis, École Nationale Supérieure Agronomique De Montpellier (Ensam), Montpellier, France, 2003. [Google Scholar]
- Traoré, K.; McCarthy, G.; Gigou, J.; Doumbia, M.; Bagayoko, A.; Yost, R.; Konaré, H.; Dioni, L.; Coulibaly, H.; Sidibé, A.; et al. Aménagement en courbes de niveau et conservation carbone. In Proceedings of the Colloque International, Gestion De La Biomasse, Ruissellement, Érosion Et Séquestration Du Carbone, Montpellier, France, 23–28 September 2002; pp. 24–28. [Google Scholar]
- Burke, M.; Lobell, D.B. Satellite-based assessment of yield variation and its determinants in smallholder African systems. Proc. Natl. Acad. Sci. USA 2017, 114, 2189–2194. [Google Scholar] [CrossRef] [Green Version]
- Karlson, M.; Ostwald, M.; Bayala, J.; Bazié, H.R.; Ouedraogo, A.S.; Soro, B.; Sanou, J.; Reese, H. The Potential of Sentinel-2 for Crop Production Estimation in a Smallholder Agroforestry Landscape, Burkina Faso. Front. Environ. Sci. 2020, 8. [Google Scholar] [CrossRef]
- Bégué, A.; Arvor, D.; Bellon, B.; Betbeder, J.; de Abelleyra, D.; PD Ferraz, R.; Lebourgeois, V.; Lelong, C.; Simões, M.; RVerón, S. Remote Sensing and Cropping Practices: A Review. Remote Sens. 2018, 10, 99. [Google Scholar] [CrossRef] [Green Version]
- Conrad, C.; Fritsch, S.; Zeidler, J.; Rücker, G.; Dech, S. Per-Field Irrigated Crop Classification in Arid Central Asia Using SPOT and ASTER Data. Remote Sens. 2010, 2, 1035–1056. [Google Scholar] [CrossRef] [Green Version]
- Wu, B.; Gommes, R.; Zhang, M.; Zeng, H.; Yan, N.; Zou, W.; Zheng, Y.; Zhang, N.; Chang, S.; Xing, Q.; et al. Global Crop Monitoring: A Satellite-Based Hierarchical Approach. Remote Sens. 2015, 7, 3907–3933. [Google Scholar] [CrossRef] [Green Version]
- Inglada, J.; Arias, M.; Tardy, B.; Hagolle, O.; Valero, S.; Morin, D.; Dedieu, G.; Sepulcre, G.; Bontemps, S.; Defourny, P.; et al. Assessment of an Operational System for Crop Type Map Production Using High Temporal and Spatial Resolution Satellite Optical Imagery. Remote Sens. 2015, 7, 12356–12379. [Google Scholar] [CrossRef] [Green Version]
- Griffiths, P.; Nendel, C.; Hostert, P. Intra-annual reflectance composites from Sentinel-2 and Landsat for national-scale crop and land cover mapping. Remote Sens. Environ. 2019, 220, 135–151. [Google Scholar] [CrossRef]
- Blickensdörfer, L.; Schwieder, M.; Pflugmacher, D.; Nendel, C.; Erasmi, S.; Hostert, P. Multi-year national-scale crop type mapping with combined time series of Sentinel-1, Sentinel-2 and Landsat 8 data. Rev. Remote Sens. Environ. 2021. in review. [Google Scholar]
- Defourny, P.; Bontemps, S.; Bellemans, N.; Cara, C.; Dedieu, G.; Guzzonato, E.; Hagolle, O.; Inglada, J.; Nicola, L.; Rabaute, T.; et al. Near real-time agriculture monitoring at national scale at parcel resolution: Performance assessment of the Sen2-Agri automated system in various cropping systems around the world. Remote Sens. Environ. 2019, 221, 551–568. [Google Scholar] [CrossRef]
- Tian, H.; Pei, J.; Huang, J.; Li, X.; Wang, J.; Zhou, B.; Qin, Y.; Wang, L. Garlic and Winter Wheat Identification Based on Active and Passive Satellite Imagery and the Google Earth Engine in Northern China. Remote Sens. 2020, 12, 3539. [Google Scholar] [CrossRef]
- Wang, S.; Di Tommaso, S.; Faulkner, J.; Friedel, T.; Kennepohl, A.; Strey, R.; Lobell, D.B. Mapping Crop Types in Southeast India with Smartphone Crowdsourcing and Deep Learning. Remote Sens. 2020, 12, 2957. [Google Scholar] [CrossRef]
- Song, X.-P.; Huang, W.; Hansen, M.C.; Potapov, P. An evaluation of Landsat, Sentinel-2, Sentinel-1 and MODIS data for crop type mapping. Sci. Remote Sens. 2021, 3, 100018. [Google Scholar] [CrossRef]
- Alabi, T.; Xiangming, X.; Kai, S.; Chandresahekar, B.; Junge, B.; Yade, M. Mapping and Monitoring Agricultural Land Use in West Africa. 2016. Available online: https://www.researchgate.net/publication/311310238_MAPPING_AND_MONITORING_AGRICULTURAL_LAND_USE_IN_WEST_AFRICA (accessed on 1 May 2021).
- Forkuor, G.; Dimobe, K.; Serme, I.; Tondoh, J.E. Landsat-8 vs. Sentinel-2: Examining the added value of sentinel-2′s red-edge bands to land-use and land-cover mapping in Burkina Faso. GIScience Remote Sens. 2018, 55, 331–354. [Google Scholar] [CrossRef]
- Rustowicz, R.; Cheong, R.; Wang, L.; Ermon, S.; Burke, M.; Lobell, D. Semantic Segmentation of Crop Type in Africa: A Novel Dataset and Analysis of Deep Learning Methods. In Proceedings of the CVPR Workshops, Sustainability and Artificial Intelligence Lab, Stanford University, Stanford, CA, USA, 16–20 June 2019. [Google Scholar]
- Abubakar, G.A.; Wang, K.; Shahtahamssebi, A.; Xue, X.; Belete, M.; Gudo, A.J.A.; Mohamed Shuka, K.A.; Gan, M. Mapping Maize Fields by Using Multi-Temporal Sentinel-1A and Sentinel-2A Images in Makarfi, Northern Nigeria, Africa. Sustainability 2020, 12, 2539. [Google Scholar] [CrossRef] [Green Version]
- Kpienbaareh, D.; Sun, X.; Wang, J.; Luginaah, I.; Bezner Kerr, R.; Lupafya, E.; Dakishoni, L. Crop Type and Land Cover Mapping in Northern Malawi Using the Integration of Sentinel-1, Sentinel-2, and PlanetScope Satellite Data. Remote Sens. 2021, 13, 700. [Google Scholar] [CrossRef]
- Delrue, J.; Bydekerke, L.; Eerens, H.; Gilliams, S.; Piccard, I.; Swinnen, E. Crop mapping in countries with small-scale farming: A case study for West Shewa, Ethiopia. Int. J. Remote Sens. 2020, 34, 2566–2582. [Google Scholar] [CrossRef]
- Prins, A.J.; van Niekerk, A. Crop type mapping using LiDAR, Sentinel-2 and aerial imagery with machine learning algorithms. Geo-Spat. Inf. Sci. 2021, 24, 215–227. [Google Scholar] [CrossRef]
- Mazarire, T.T.; Ratshiedana, P.E.; Nyamugama, A.; Adam, E.; Chirima, G. Exploring machine learning algorithms for mapping crop types in a heterogeneous agriculture landscape using Sentinel-2 data. A case study of Free State Province, South Africa. South Afric. J. Geomat. 2020, 9. [Google Scholar] [CrossRef]
- Chivasa, W.; Mutanga, O.; Biradar, C. Application of remote sensing in estimating maize grain yield in heterogeneous African agricultural landscapes: A review. Int. J. Remote Sens. 2017, 38, 6816–6845. [Google Scholar] [CrossRef]
- Whitcraft, A.K.; Vermote, E.F.; Becker-Reshef, I.; Justice, C.O. Cloud cover throughout the agricultural growing season: Impacts on passive optical earth observations. Remote Sens. Environ. 2015, 156, 438–447. [Google Scholar] [CrossRef]
- The Agriculture Promotion Policy Nigeria Agricultural Sector Policy Roadmap. Policy and Strategy Document 2016. Available online: https://nssp.ifpri.info/files/2017/12/2016-Nigeria-Agric-Sector-Policy-Roadmap_June-15-2016_Final.pdf (accessed on 23 August 2018).
- Food and Agriculture Organization of the United Nations, 2018. FAOSTAT Database. Available online: http://www.fao.org/faostat/en/#data/QC (accessed on 23 July 2020).
- Ndor, D.C. Survey of Potato (Solanum Tuberosum L.) Bacterial, Fungal, and Viral Diseases in Irragated Fadama Areas of Kuru (Jos South) And Kerang (Mangu) Local Government Areas of Plateau State, Nigeria. Niger. J. Crop Sci. 2016. Available online: https://africaneditors.org/journal/NJCS/abstract/FB4403D132 (accessed on 26 August 2018).
- The National Root Crops Research Institute NRCRI. Annual Potato Programme Report 2012, Umidike; NRCRI: Kuru Jos South, Plateau State, Nigeria.
- World Atlas, Nigerian Maps. Available online: https://knoema.com/atlas/Nigeria/maps/Production-of-Maize (accessed on 3 September 2021).
- Apata, T.G.; Samuel, K.D.; Adeola, A.O. Analysis of Climate Change Perception and Adaptation among Arable Food Crop Farmers in South Western Nigeria. In Proceedings of the International Association of Agricultural Economists’ 2009 Conference, Beijing, China, 16–22 August 2009; Available online: https://www.researchgate.net/publication/254463276_Analysis_of_Climate_Change_Perception_and_Adaptation_among_Arable_Food_Crop_Farmers_in_South_Western_Nigeria (accessed on 28 August 2019).
- Rufin, P.; Frantz, D.; Yan, L.; Hostert, P. Operational Coregistration of the Sentinel-2A/B Image Archive Using Multitemporal Landsat Spectral Averages. IEEE Geosci. Remote Sens. Lett. 2020, 1–5. [Google Scholar] [CrossRef]
- Frantz, D. FORCE—Landsat + Sentinel-2 Analysis Ready Data and Beyond. Remote Sens. 2019, 11, 1124. [Google Scholar] [CrossRef] [Green Version]
- Frantz, D.; Roder, A.; Stellmes, M.; Hill, J. An Operational Radiometric Landsat Preprocessing Framework for Large-Area Time Series Applications. IEEE Trans. Geosci. Remote Sens. 2016, 54, 3928–3943. [Google Scholar] [CrossRef]
- Frantz, D.; Haß, E.; Uhl, A.; Stoffels, J.; Hill, J. Improvement of the Fmask algorithm for Sentinel-2 images: Separating clouds from bright surfaces based on parallax effects. Remote Sens. Environ. 2018, 215, 471–481. [Google Scholar] [CrossRef]
- Radoux, J.; Chomé, G.; Jacques, D.C.; Waldner, F.; Bellemans, N.; Matton, N.; Lamarche, C.; D’Andrimont, R.; Defourny, P. Sentinel-2′s Potential for Sub-Pixel Landscape Feature Detection. Remote Sens. 2016, 8, 488. [Google Scholar] [CrossRef] [Green Version]
- Drusch, M.; Del Bello, U.; Carlier, S.; Colin, O.; Fernandez, V.; Gascon, F.; Hoersch, B.; Isola, C.; Laberinti, P.; Martimort, P.; et al. Sentinel-2: ESA’s Optical High-Resolution Mission for GMES Operational Services. Remote Sens. Environ. 2012, 120, 25–36. [Google Scholar] [CrossRef]
- Waldner, F.; Chen, Y.; Lawes, R.; Hochman, Z. Needle in a haystack: Mapping rare and infrequent crops using satellite imagery and data balancing methods. Remote Sens. Environ. 2019, 233. [Google Scholar] [CrossRef]
- Pflugmacher, D.; Rabe, A.; Peters, M.; Hostert, P. Mapping pan-European land cover using Landsat spectral-temporal metrics and the European LUCAS survey. Remote Sens. Environ. 2019, 221, 583–595. [Google Scholar] [CrossRef]
- Rufin, P.; Frantz, D.; Ernst, S.; Rabe, A.; Griffiths, P.; Özdoğan, M.; Hostert, P. Mapping Cropping Practices on a National Scale Using Intra-Annual Landsat Time Series Binning. Remote Sens. 2019, 11, 232. [Google Scholar] [CrossRef] [Green Version]
- Bhardwaj, K.; Patra, S. An unsupervised technique for optimal feature selection in attribute profiles for spectral-spatial classification of hyperspectral images. J. Photogramm. Remote Sens. 2018, 138, 139–150. [Google Scholar] [CrossRef]
- Hu, Q.; Sulla-Menashe, D.; Xu, B.; Yin, H.; Tang, H.; Yang, P.; Wu, W. A phenology-based spectral and temporal feature selection method for crop mapping from satellite time series. Int. J. Appl. Earth Obs. Geoinf. 2019, 80, 218–229. [Google Scholar] [CrossRef]
- Schulz, D.; Yin, H.; Tischbein, B.; Verleysdonk, S.; Adamou, R.; Kumar, N. Land use mapping using Sentinel-1 and Sentinel-2 time series in a heterogeneous landscape in Niger, Sahel. J. Photogramm. Remote Sens. 2021, 178, 71–111. [Google Scholar] [CrossRef]
- Rodriguez-Galiano, V.F.; Ghimire, B.; Rogan, J.; Chica-Olmo, M.; Rigol-Sanchez, J.P. An assessment of the effectiveness of a random forest classifier for land-cover classification. J. Photogramm. Remote Sens. 2012, 67, 93–104. [Google Scholar] [CrossRef]
- Gislason, P.; Benediktsson, J.; Sveinsson, J.R. Random Forests for land cover classification. Pattern Recognit. Lett. 2006, 27, 294–300. [Google Scholar] [CrossRef]
- do Nascimento Bendini, H.; Garcia Fonseca, L.M.; Schwieder, M.; Sehn Körting, T.; Rufin, P.; Del Arco Sanches, I.; Leitão, P.J.; Hostert, P. Detailed agricultural land classification in the Brazilian cerrado based on phenological information from dense satellite image time series. Int. J. Appl. Earth Obs. Geoinf. 2019, 82, 101872. [Google Scholar] [CrossRef]
- Maxwell, A.E.; Warner, T.A.; Fang, F. Implementation of machine-learning classification in remote sensing: An applied review. Int. J. Remote Sens. 2018, 39, 2784–2817. [Google Scholar] [CrossRef] [Green Version]
- Olofsson, P.; Foody, G.M.; Herold, M.; Stehman, S.V.; Woodcock, C.E.; Wulder, M.A. Good practices for estimating area and assessing accuracy of land change. Remote Sens. Environ. 2014, 148, 42–57. [Google Scholar] [CrossRef]
- Cingolani, A.; Renison, D.; Zak, M.; Cabido, M. Mapping vegetation in a heterogeneous mountain rangeland using landsat data: An alternative method to define and classify land-cover units. Remote Sens. Environ. 2004, 92, 84–97. [Google Scholar] [CrossRef]
- Wang, R.; Cherkauer, K.; Bowling, L. Corn Response to Climate Stress Detected with Satellite-Based NDVI Time Series. Remote Sens. 2016, 8, 269. [Google Scholar] [CrossRef] [Green Version]
- Huong, T.X.D.; Giles, M.F.; Dieu, T.B. Reducing the impacts of intra-class spectral variability on the accuracy of soft classification and super-resolution mapping of shoreline. Int. J. Remote Sens. 2019, 40, 3384–3400. [Google Scholar] [CrossRef]
- Foerster, S.; Kaden, K.; Foerster, M.; Itzerott, S. Crop type mapping using spectral–temporal profiles and phenological information. Comput. Electron. Agric. 2012, 89, 30–40. [Google Scholar] [CrossRef] [Green Version]
- Dakir, A.; Bachir Alami, O.; Barramou, F. Crop type mapping using optical and radar images: A review. In Proceedings of the 2020 IEEE International Conference of Moroccan Geomatics (Morgeo), Casablanca, Morocco, 11–13 May 2020; pp. 1–8. [Google Scholar] [CrossRef]
- Griffiths, P.; van der Linden, S.; Kuemmerle, T.; Hostert, P. A Pixel-Based Landsat Compositing Algorithm for Large Area Land Cover Mapping. IEEE J. Sel.Top. Appl. Earth Obs. Remote Sens. 2013, 6, 2088–2101. [Google Scholar] [CrossRef]
- Pan, L.; Xia, H.; Yang, J.; Niu, W.; Wang, R.; Song, H.; Guo, Y.; Qin, Y. Mapping cropping intensity in Huaihe basin using phenology algorithm, all Sentinel-2 and Landsat images in Google Earth Engine. Int. J. Appl. Earth Obs. Geoinf. 2021, 102, 102376. [Google Scholar] [CrossRef]
- Jin, Z.; Azzari, G.; Burke, M.; Aston, S.; Lobell, D.B. Mapping Smallholder Yield Heterogeneity at Multiple Scales in Eastern Africa. Remote Sens. 2017, 9, 931. [Google Scholar] [CrossRef] [Green Version]
- Inglada, J.; Dejoux, J.; Hagolle, O.; Dedieu, G. Multi-temporal remote sensing image segmentation of croplands constrained by a topographical database. In Proceedings of the 2012 IEEE International Geoscience and Remote Sensing Symposium, Munich, Germany, 22–27 July 2012; pp. 6781–6784. [Google Scholar] [CrossRef]
- Clevers, J.; Gitelson, A.A. Remote estimation of crop and grass chlorophyll and nitrogen content using red-edge bands on Sentinel-2 and -3. Int. J. Appl. Earth Obs. Geoinf. 2013, 23, 344–351. [Google Scholar] [CrossRef]
- Ugonna, C.; Jolaoso, M.O.; Onwualu, A. A technical appraisal of potato value chain in Nigeria. Int. Res. J. Agric. Sci. Soil Sci. 2013, 3, 291–301. [Google Scholar] [CrossRef]
Figure 1.
Overview map of Nigeria and a close-up of the Jos Plateau study area. The close-up includes the S2 tiling system as used in this study and SkySat areas of interest (AOIs). See Section 2.2 for details on the satellite data.
Figure 1.
Overview map of Nigeria and a close-up of the Jos Plateau study area. The close-up includes the S2 tiling system as used in this study and SkySat areas of interest (AOIs). See Section 2.2 for details on the satellite data.

Figure 2.
Crop type classes: (A) maize; (B) potato; (C) potato–maize; (D) maize–legumes (in this case, soybean).
Figure 2.
Crop type classes: (A) maize; (B) potato; (C) potato–maize; (D) maize–legumes (in this case, soybean).

Figure 3.
Cropping calendar showing critical windows (CW) and the 2019 mean monthly precipitation on the Jos Plateau (precipitation data accessed from http://www.worldweatheronline.com/ (accessed on 10 November 2020)).
Figure 3.
Cropping calendar showing critical windows (CW) and the 2019 mean monthly precipitation on the Jos Plateau (precipitation data accessed from http://www.worldweatheronline.com/ (accessed on 10 November 2020)).

Figure 4.
NDVI-based phenology of maize, potato, and mixed crops for 2019 (±1 standard deviation).

Figure 5.
Methodological flow chart: (A) Preprocessing, STMs, and phenological analysis; (B) land cover mapping and cropland mask generation; and (C) crop type mapping and field-level analysis.
Figure 5.
Methodological flow chart: (A) Preprocessing, STMs, and phenological analysis; (B) land cover mapping and cropland mask generation; and (C) crop type mapping and field-level analysis.

Figure 6.
Overall and per-class accuracies of crop type predictions. The boxplot shows the median (red line), and the lower and upper quartiles (black whiskers). Accuracies are derived from a 20-fold cross-validation using RF model parameterization.
Figure 6.
Overall and per-class accuracies of crop type predictions. The boxplot shows the median (red line), and the lower and upper quartiles (black whiskers). Accuracies are derived from a 20-fold cross-validation using RF model parameterization.

Figure 7.
Random forest prediction probabilities.

Figure 8.
Cropping systems of the Jos Plateau. The “others” class includes grasses, fonio, yam, rice, and vegetables.
Figure 8.
Cropping systems of the Jos Plateau. The “others” class includes grasses, fonio, yam, rice, and vegetables.

Figure 9.
Samples of crop type predictions at the plot cluster level (see AOIs in Figure 1).
Figure 9.
Samples of crop type predictions at the plot cluster level (see AOIs in Figure 1).

Figure 10.
Density distribution of field size by crop type. The 25th, 50th, and 75th percentile (boxplot in black) and median (white line) on top of the violin plots.
Figure 10.
Density distribution of field size by crop type. The 25th, 50th, and 75th percentile (boxplot in black) and median (white line) on top of the violin plots.

Figure 11.
Field-level analysis of the fields sampled on the Jos Plateau: (A) distribution of field size; (B) distribution of field-level homogeneity.
Figure 11.
Field-level analysis of the fields sampled on the Jos Plateau: (A) distribution of field size; (B) distribution of field-level homogeneity.


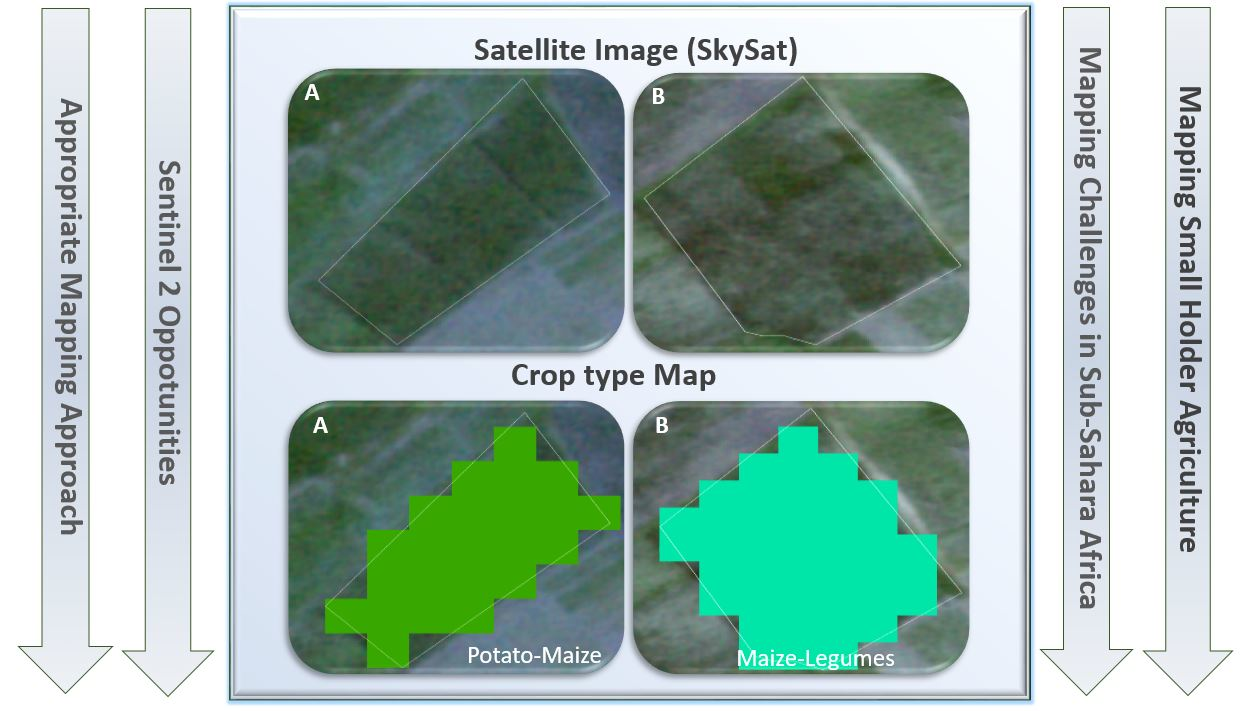
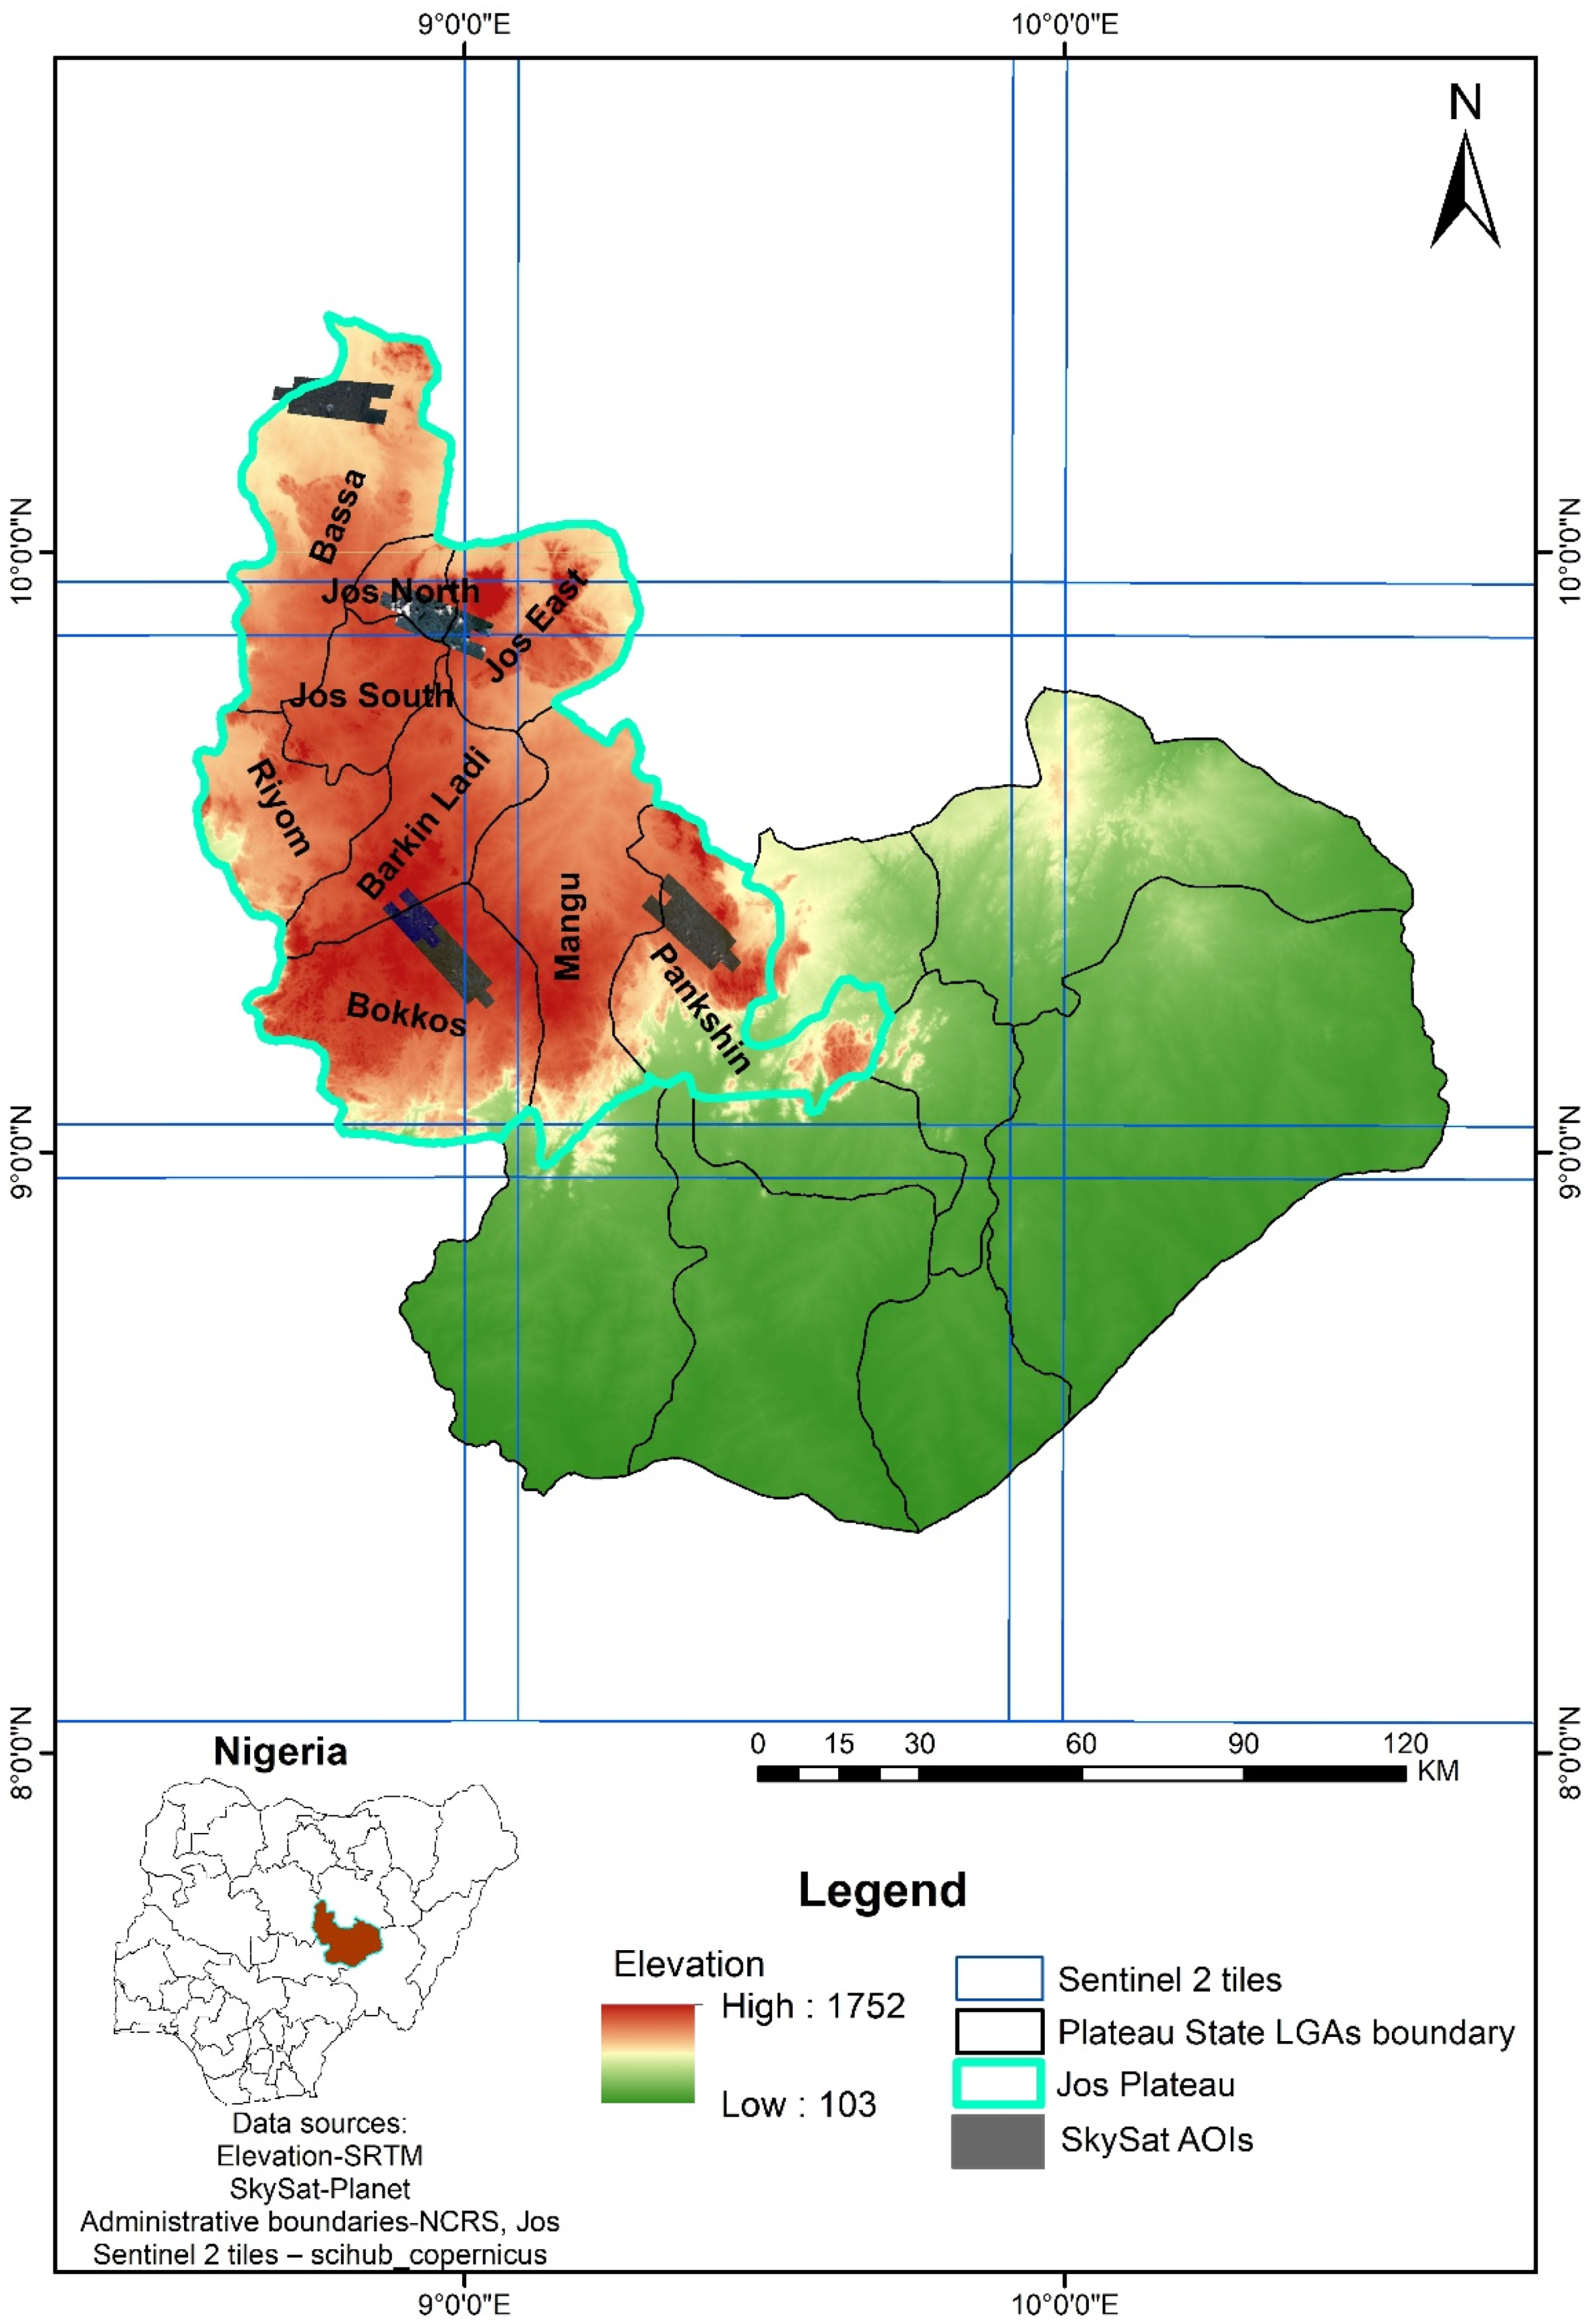
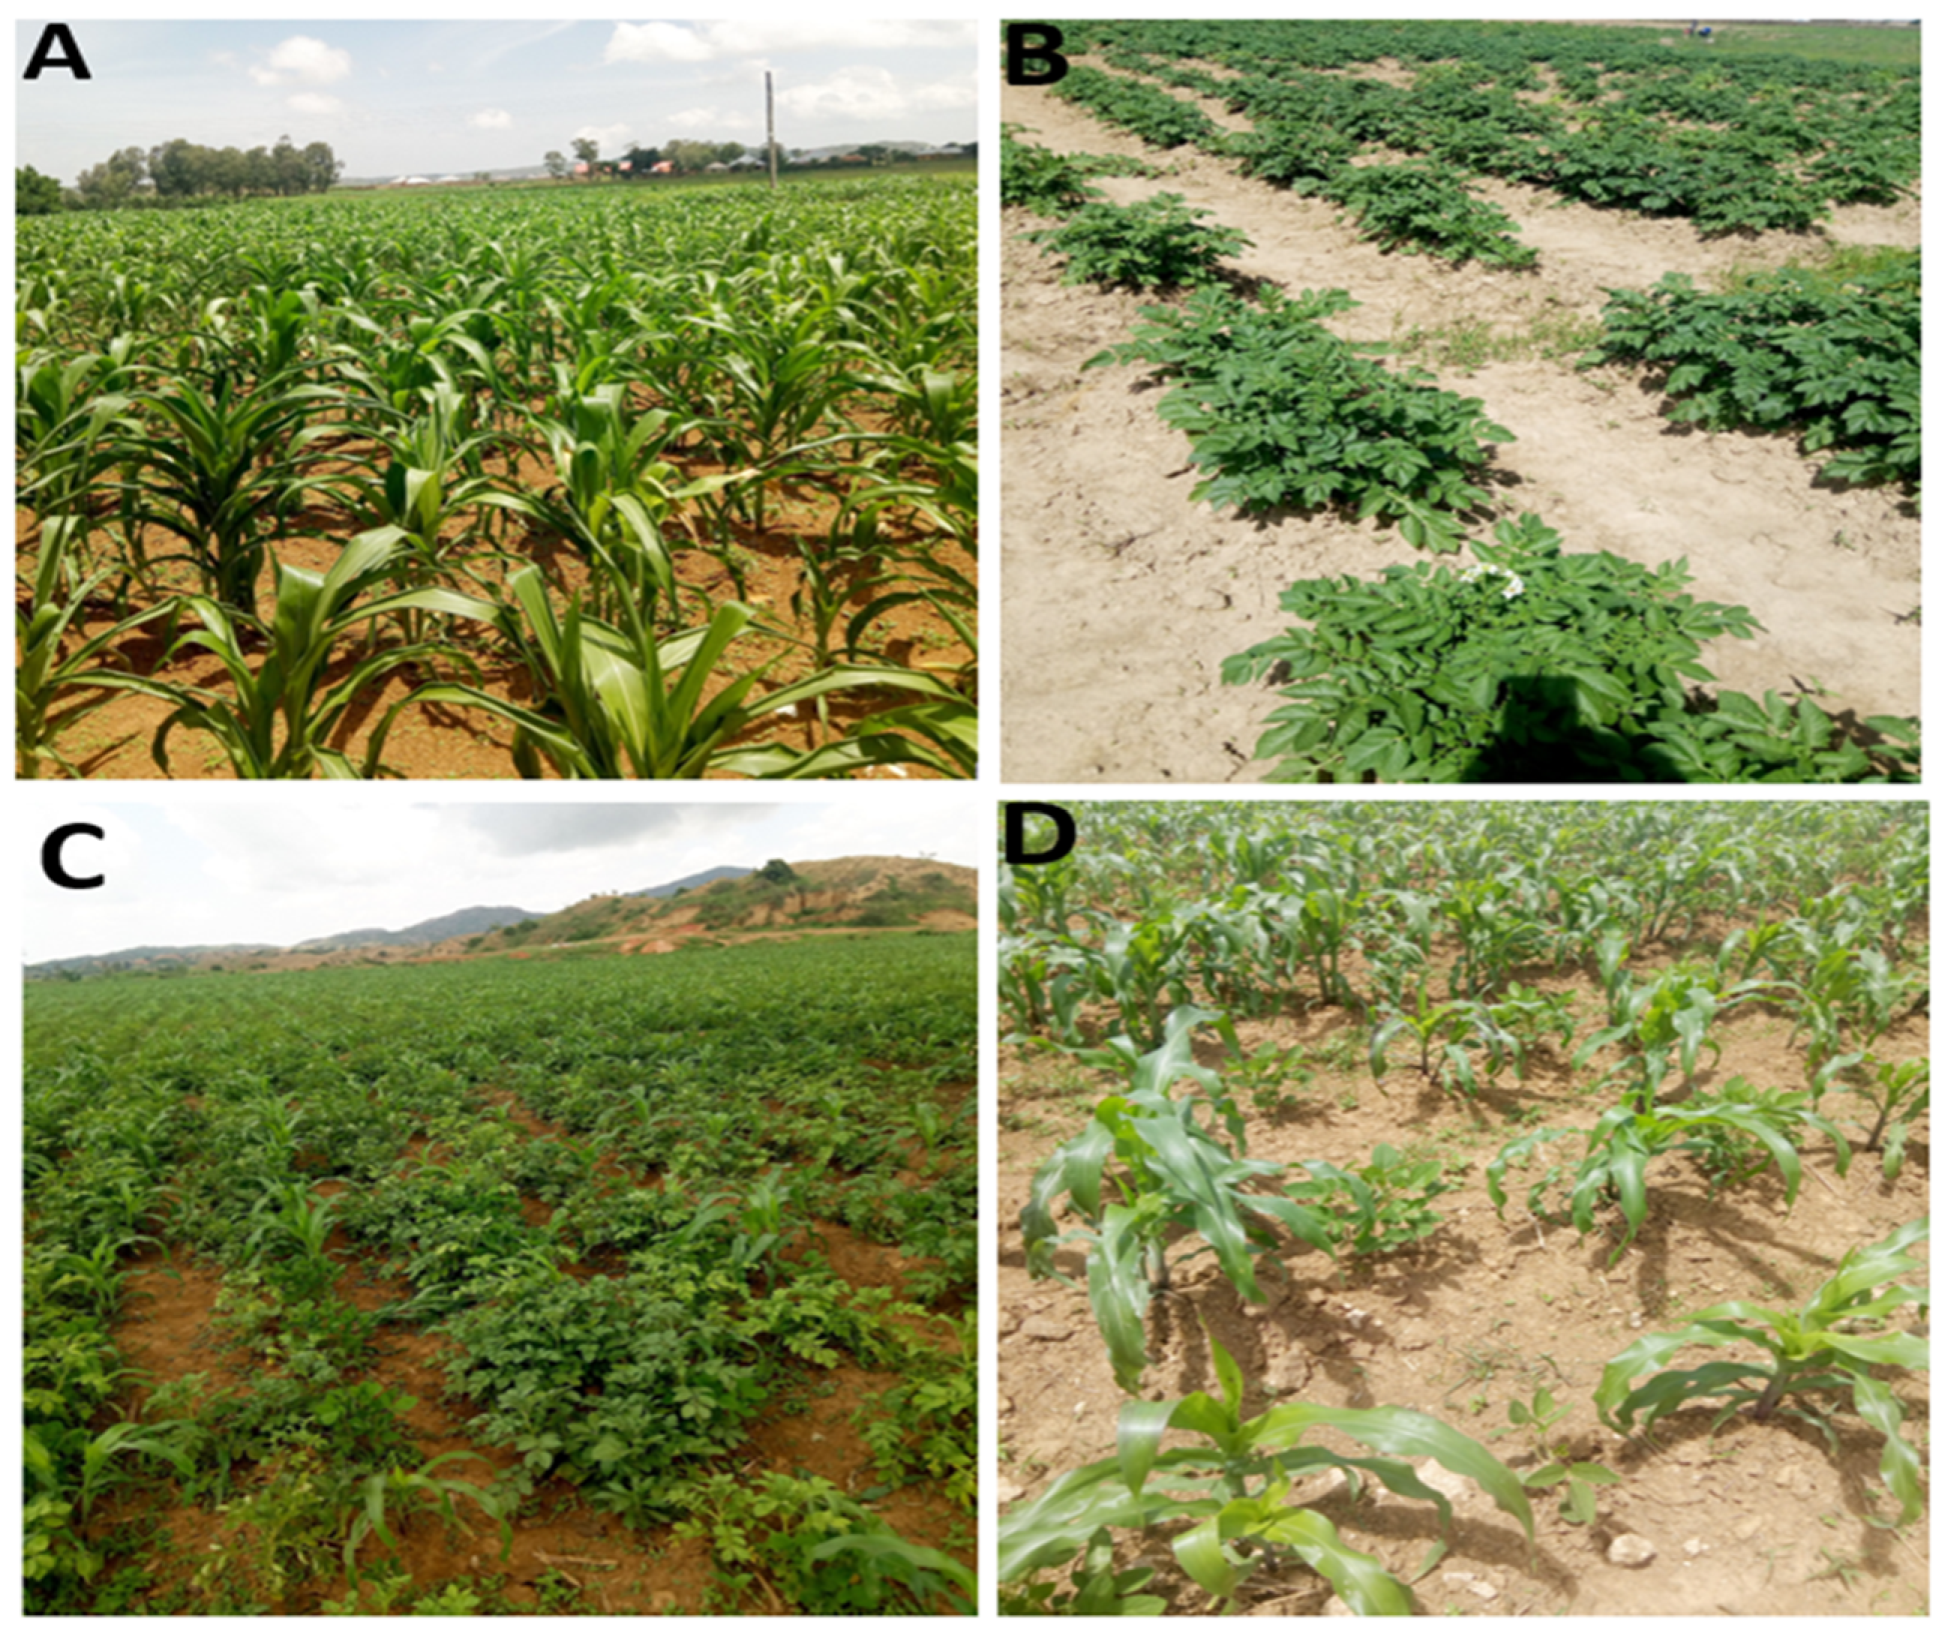
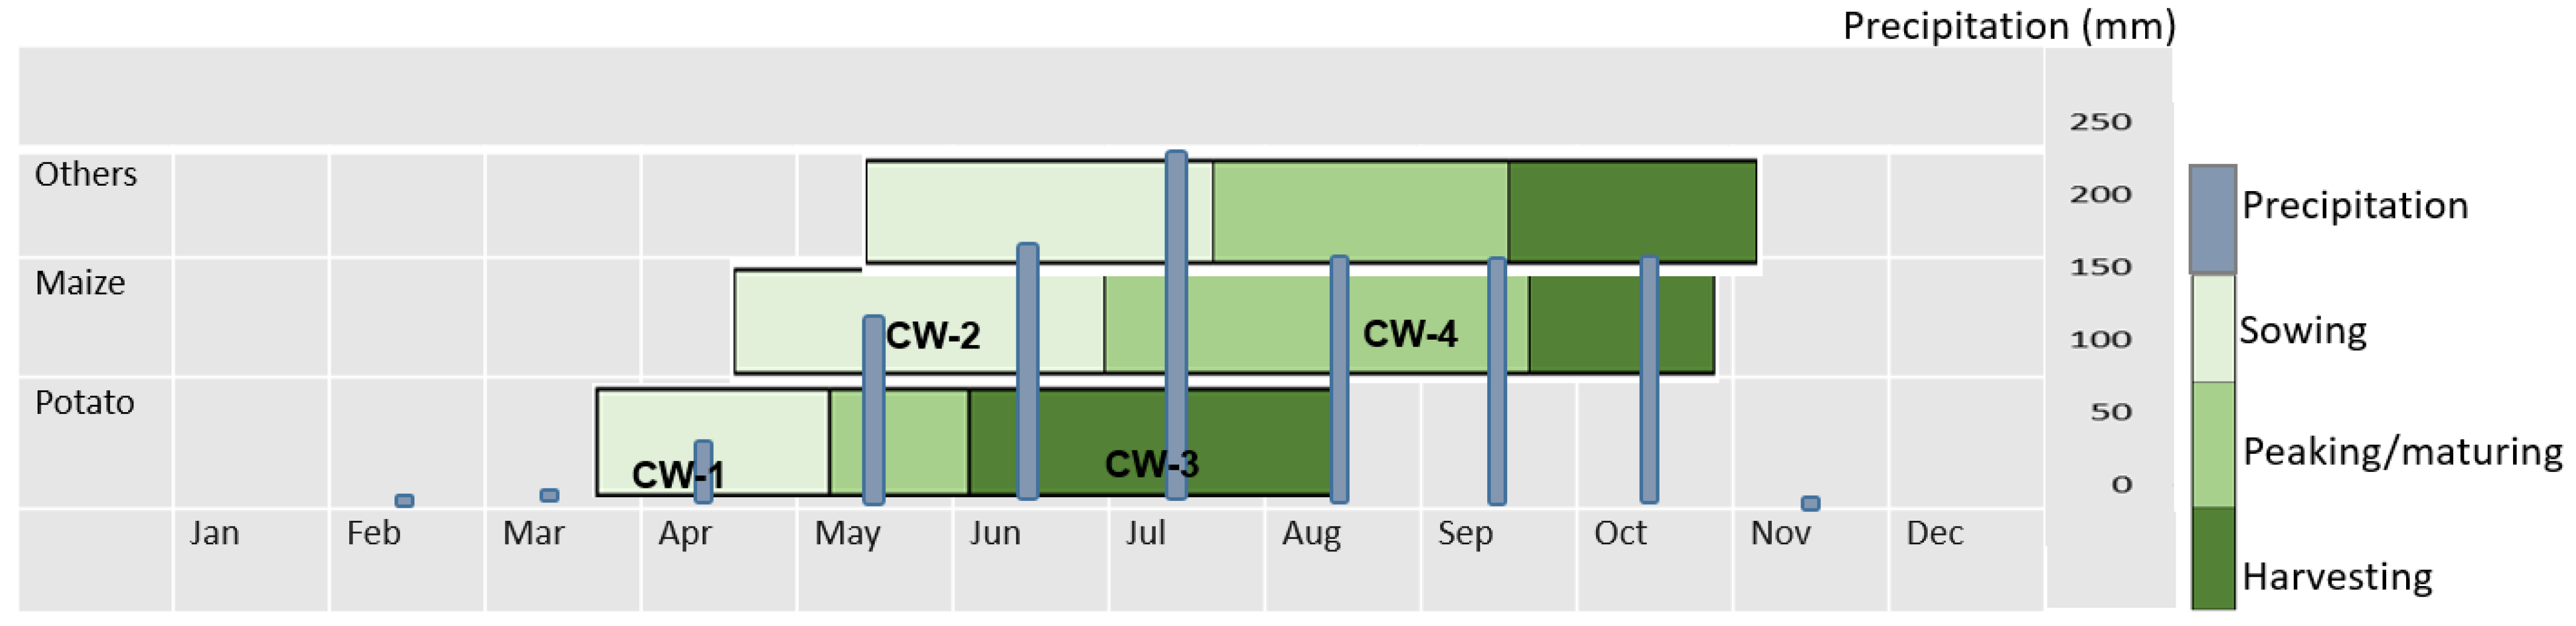
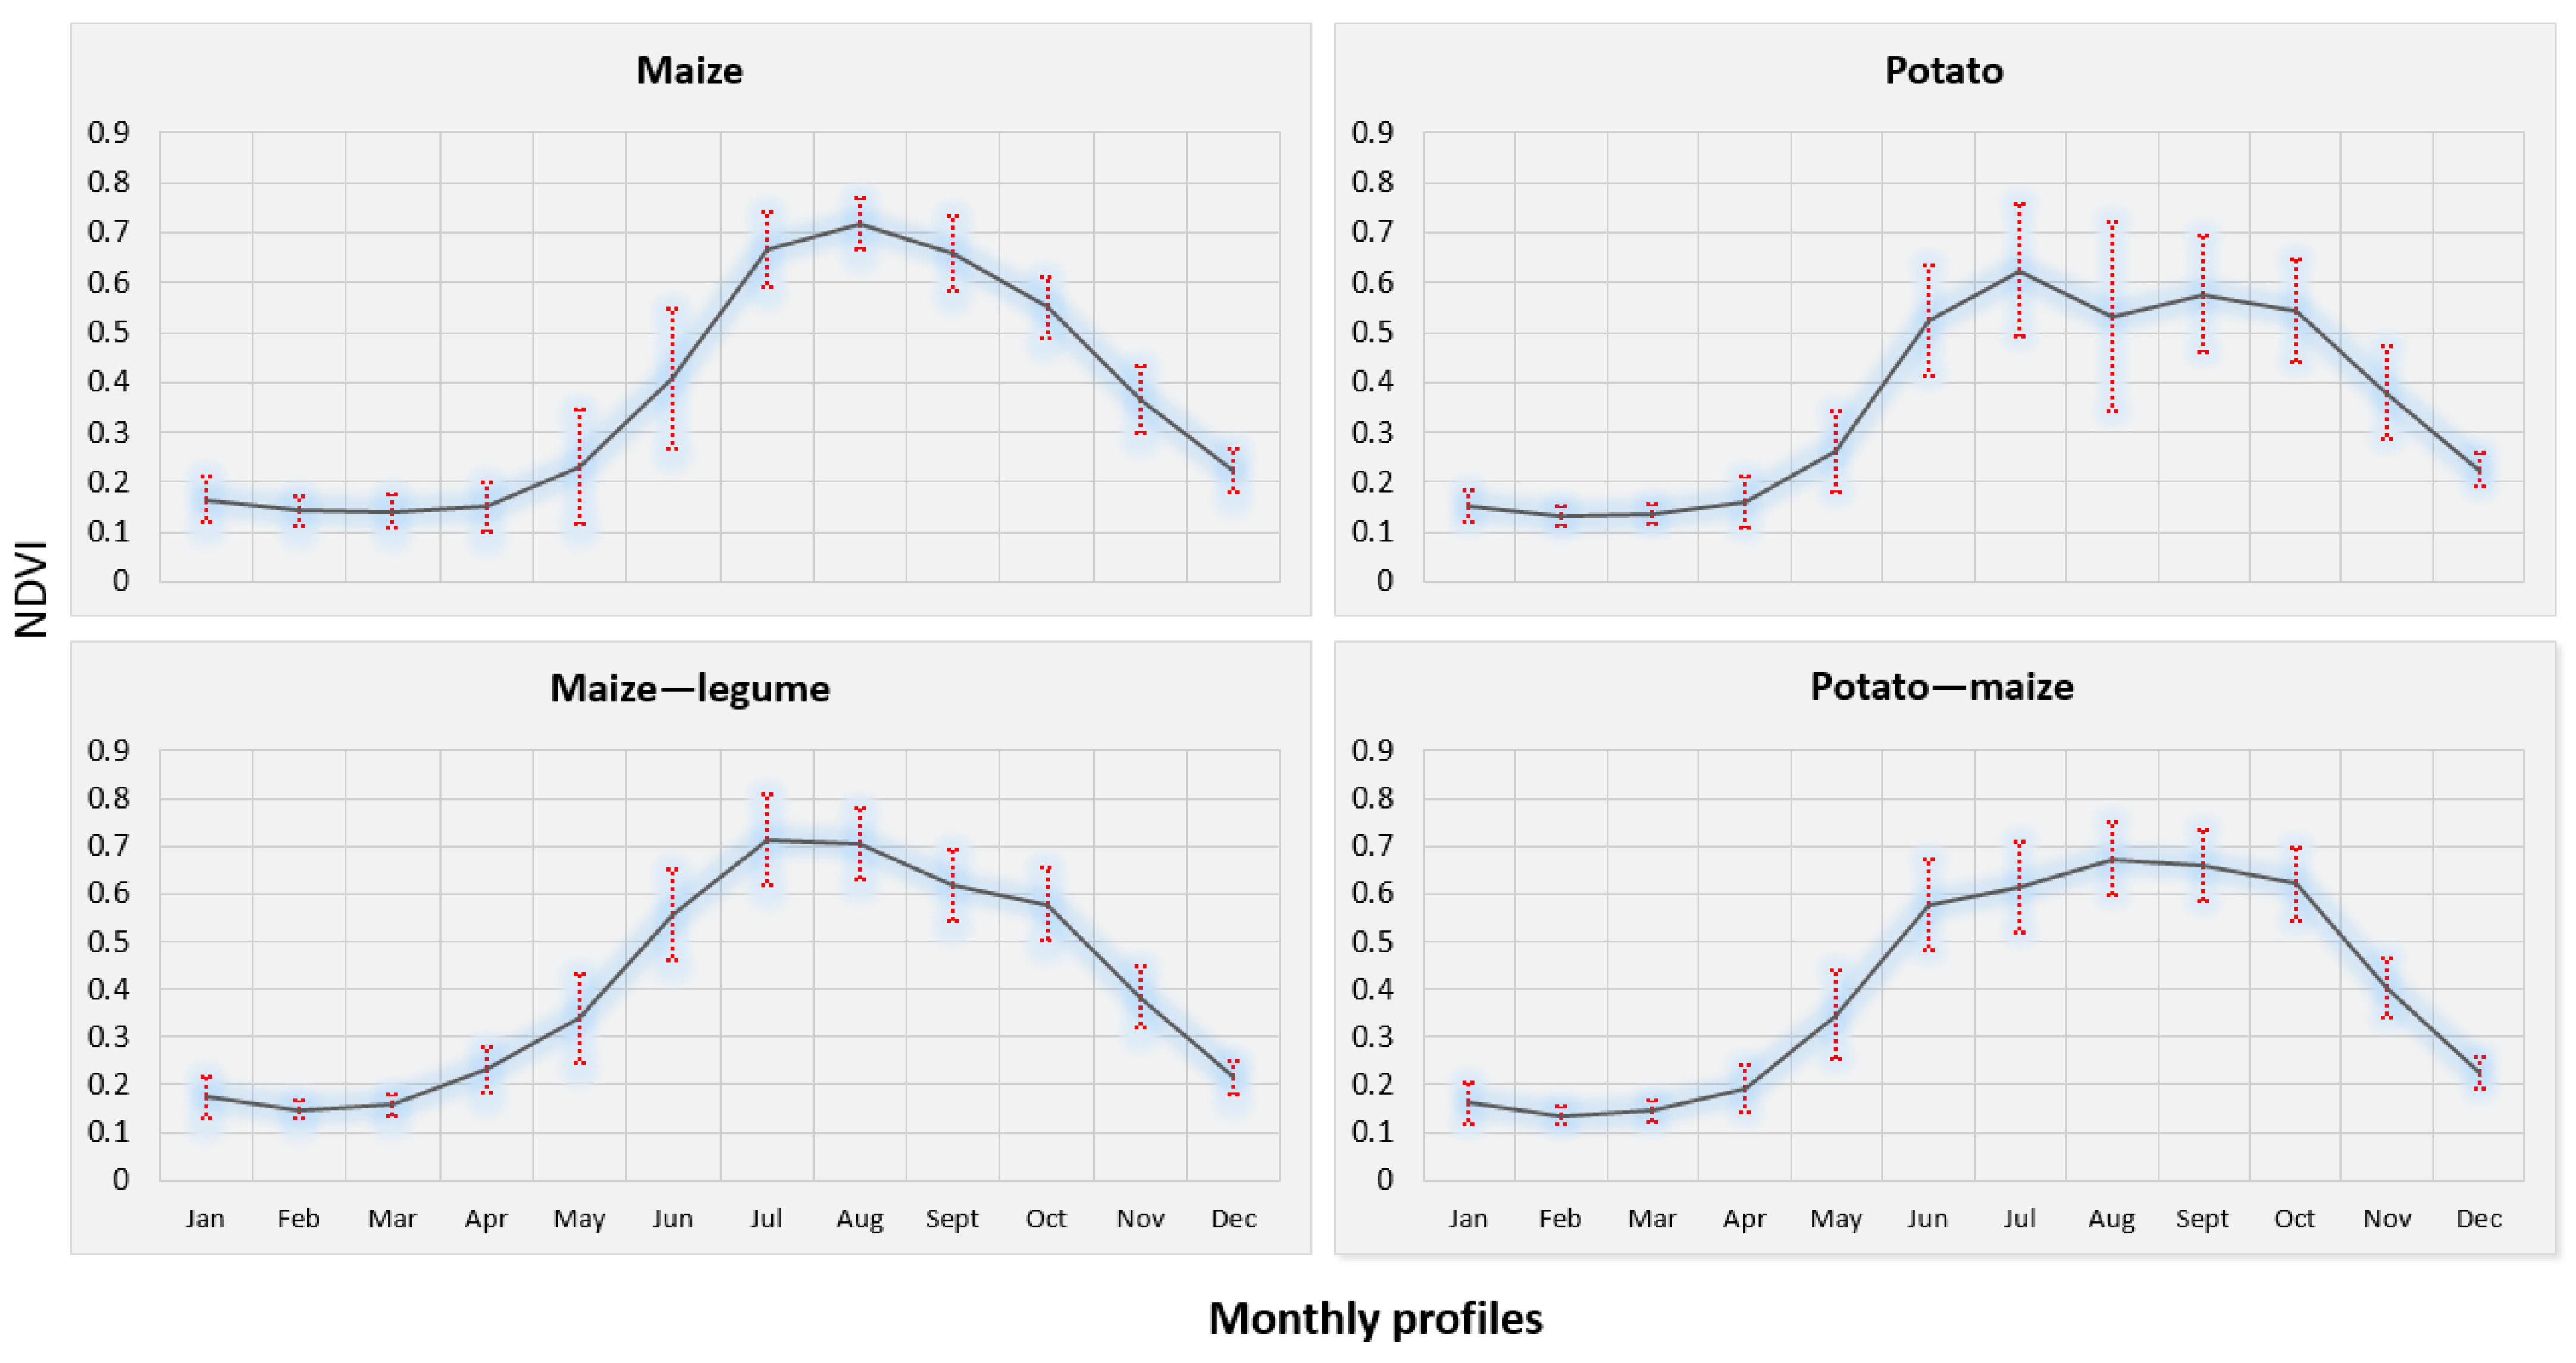
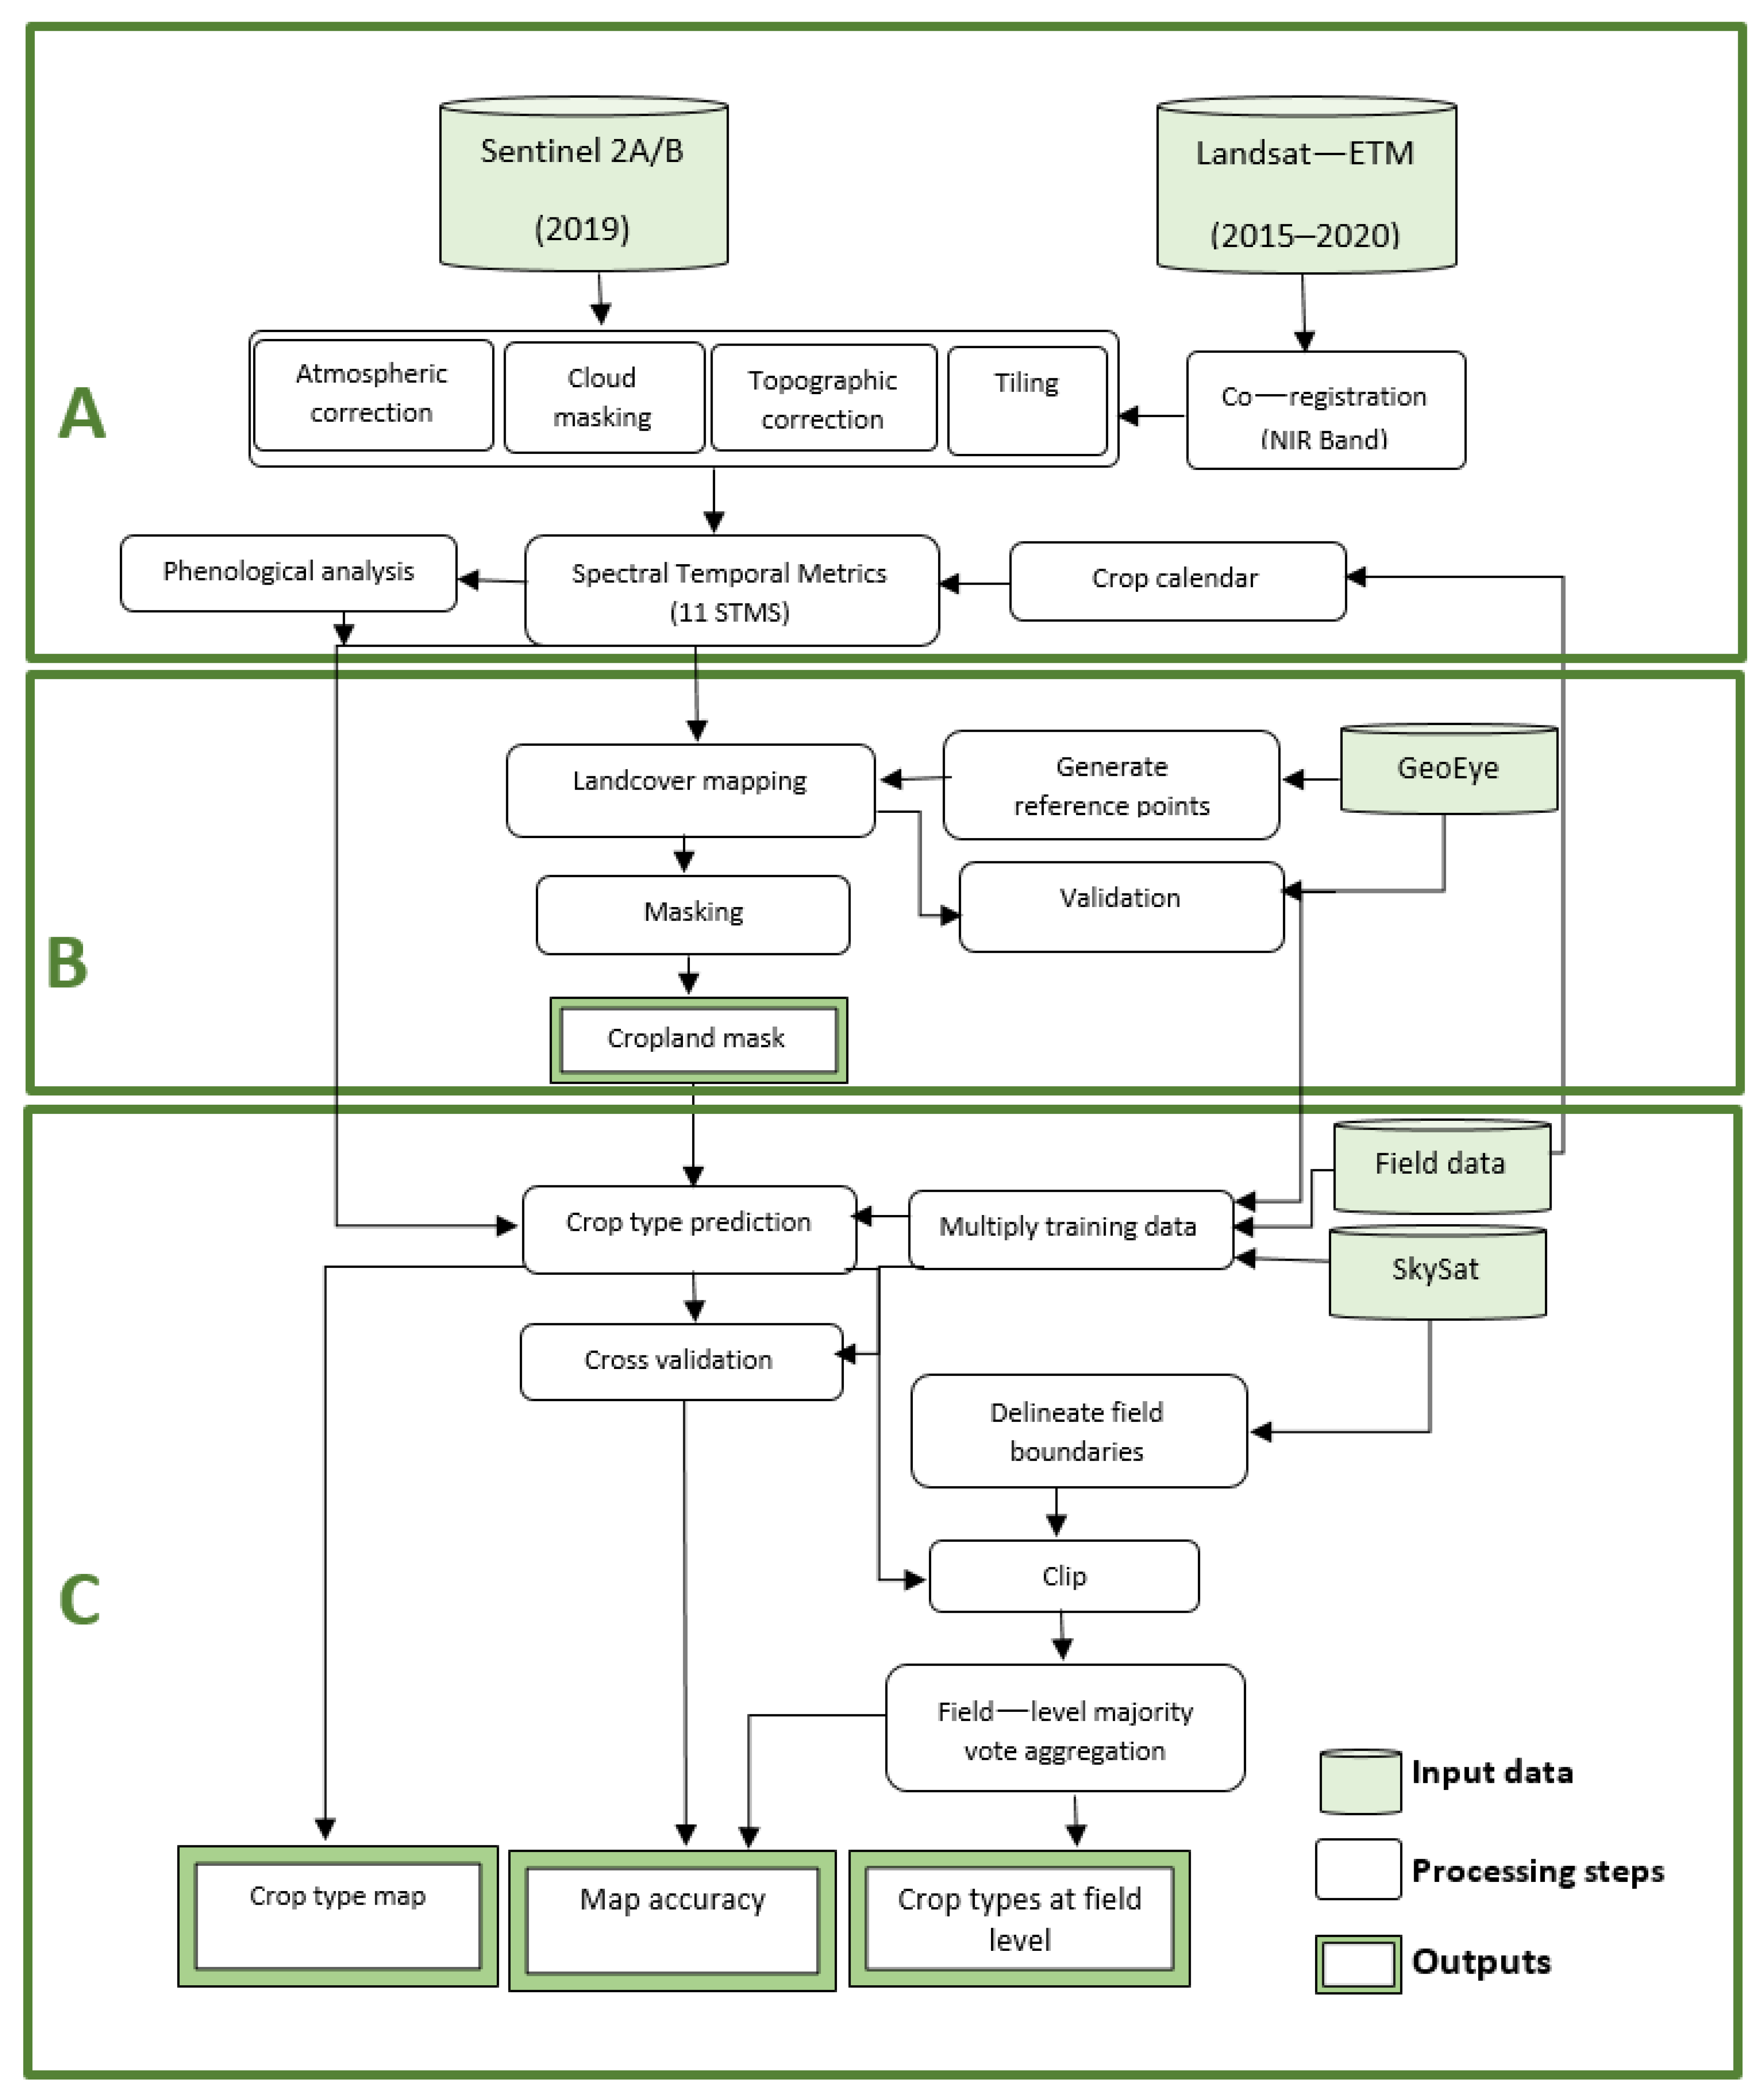
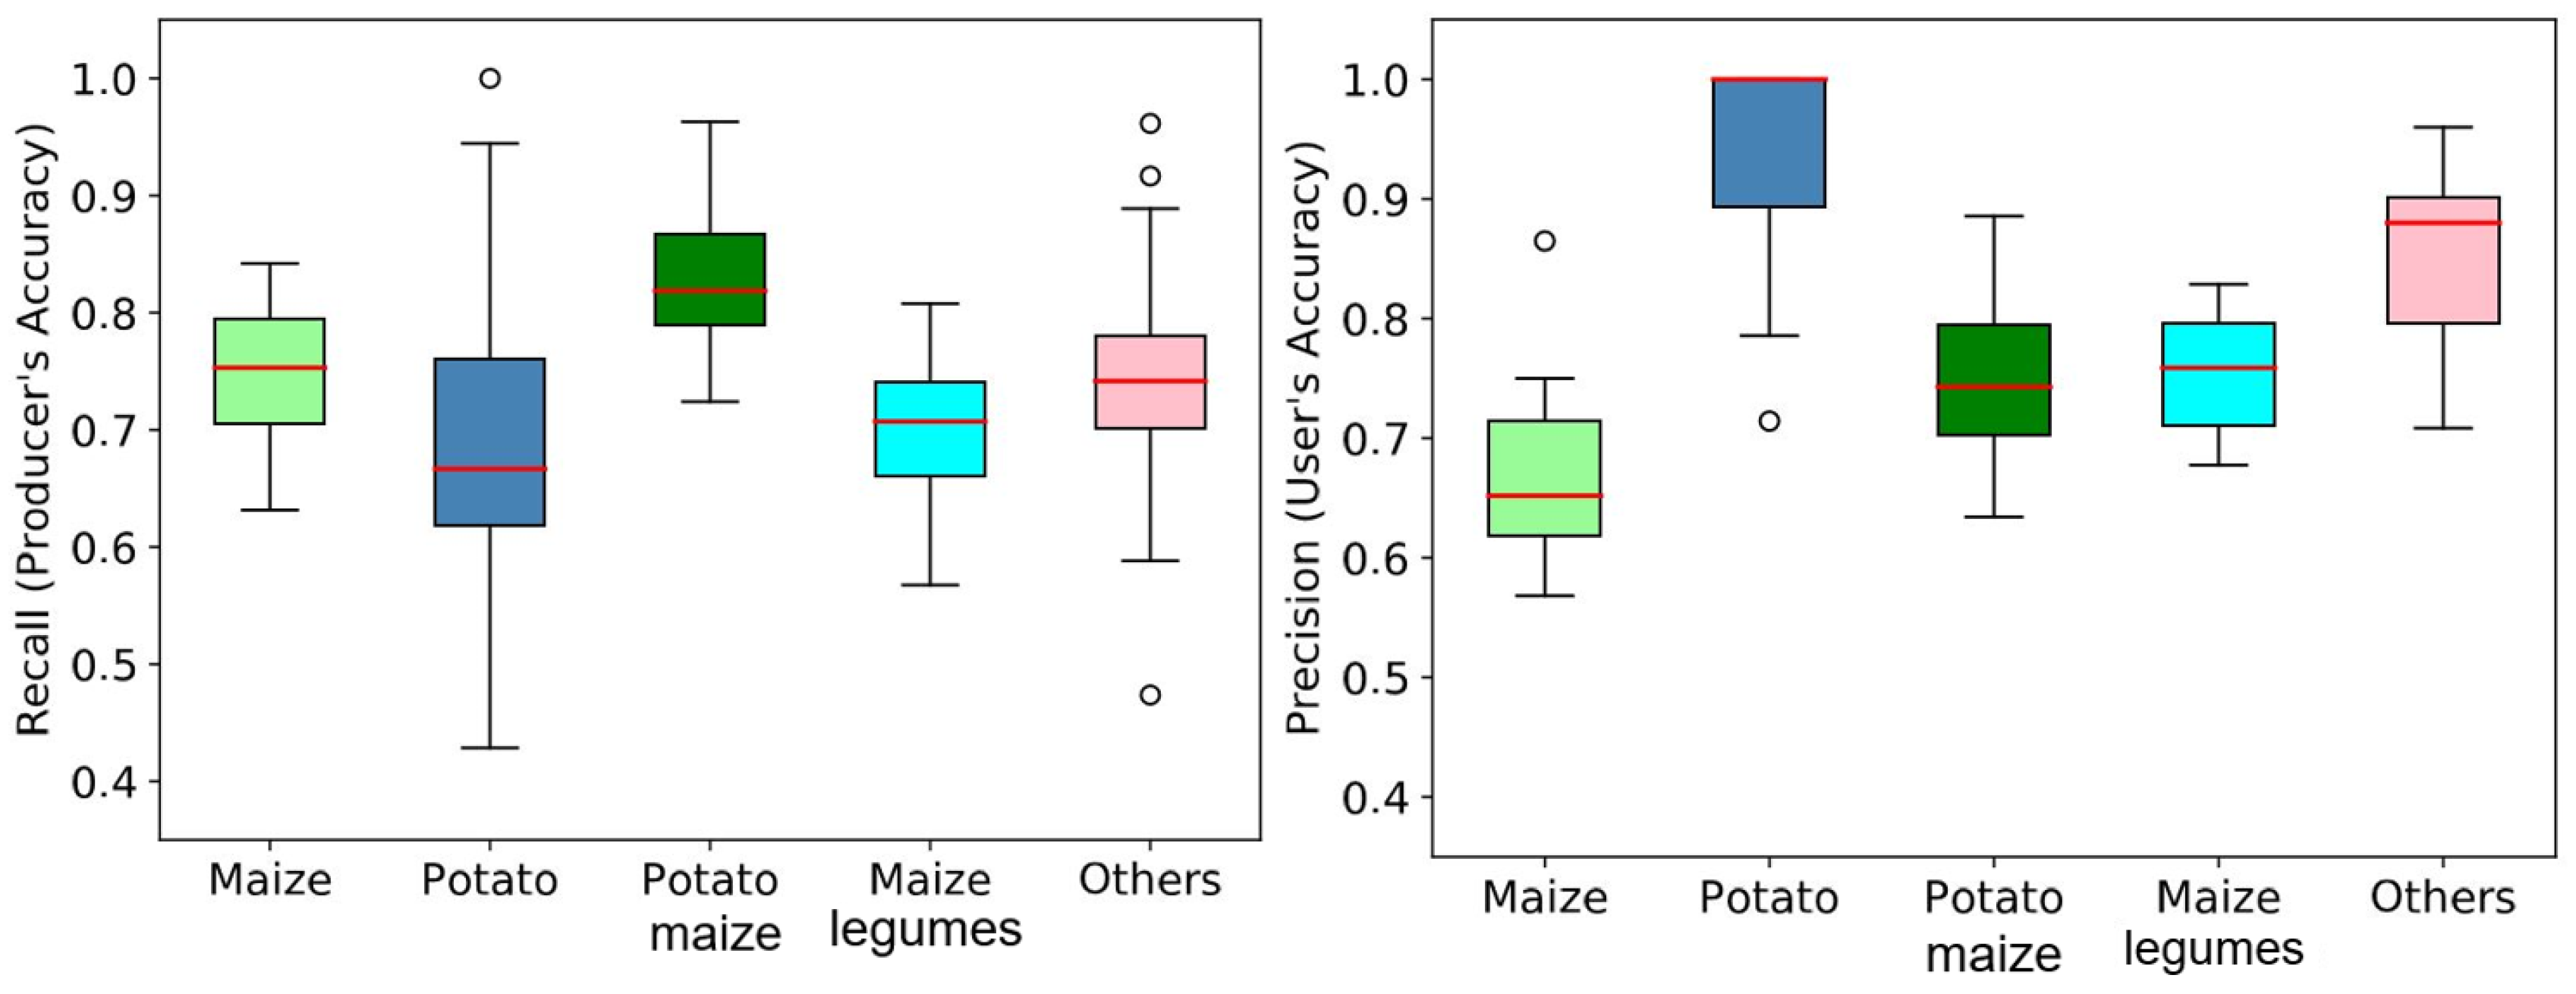
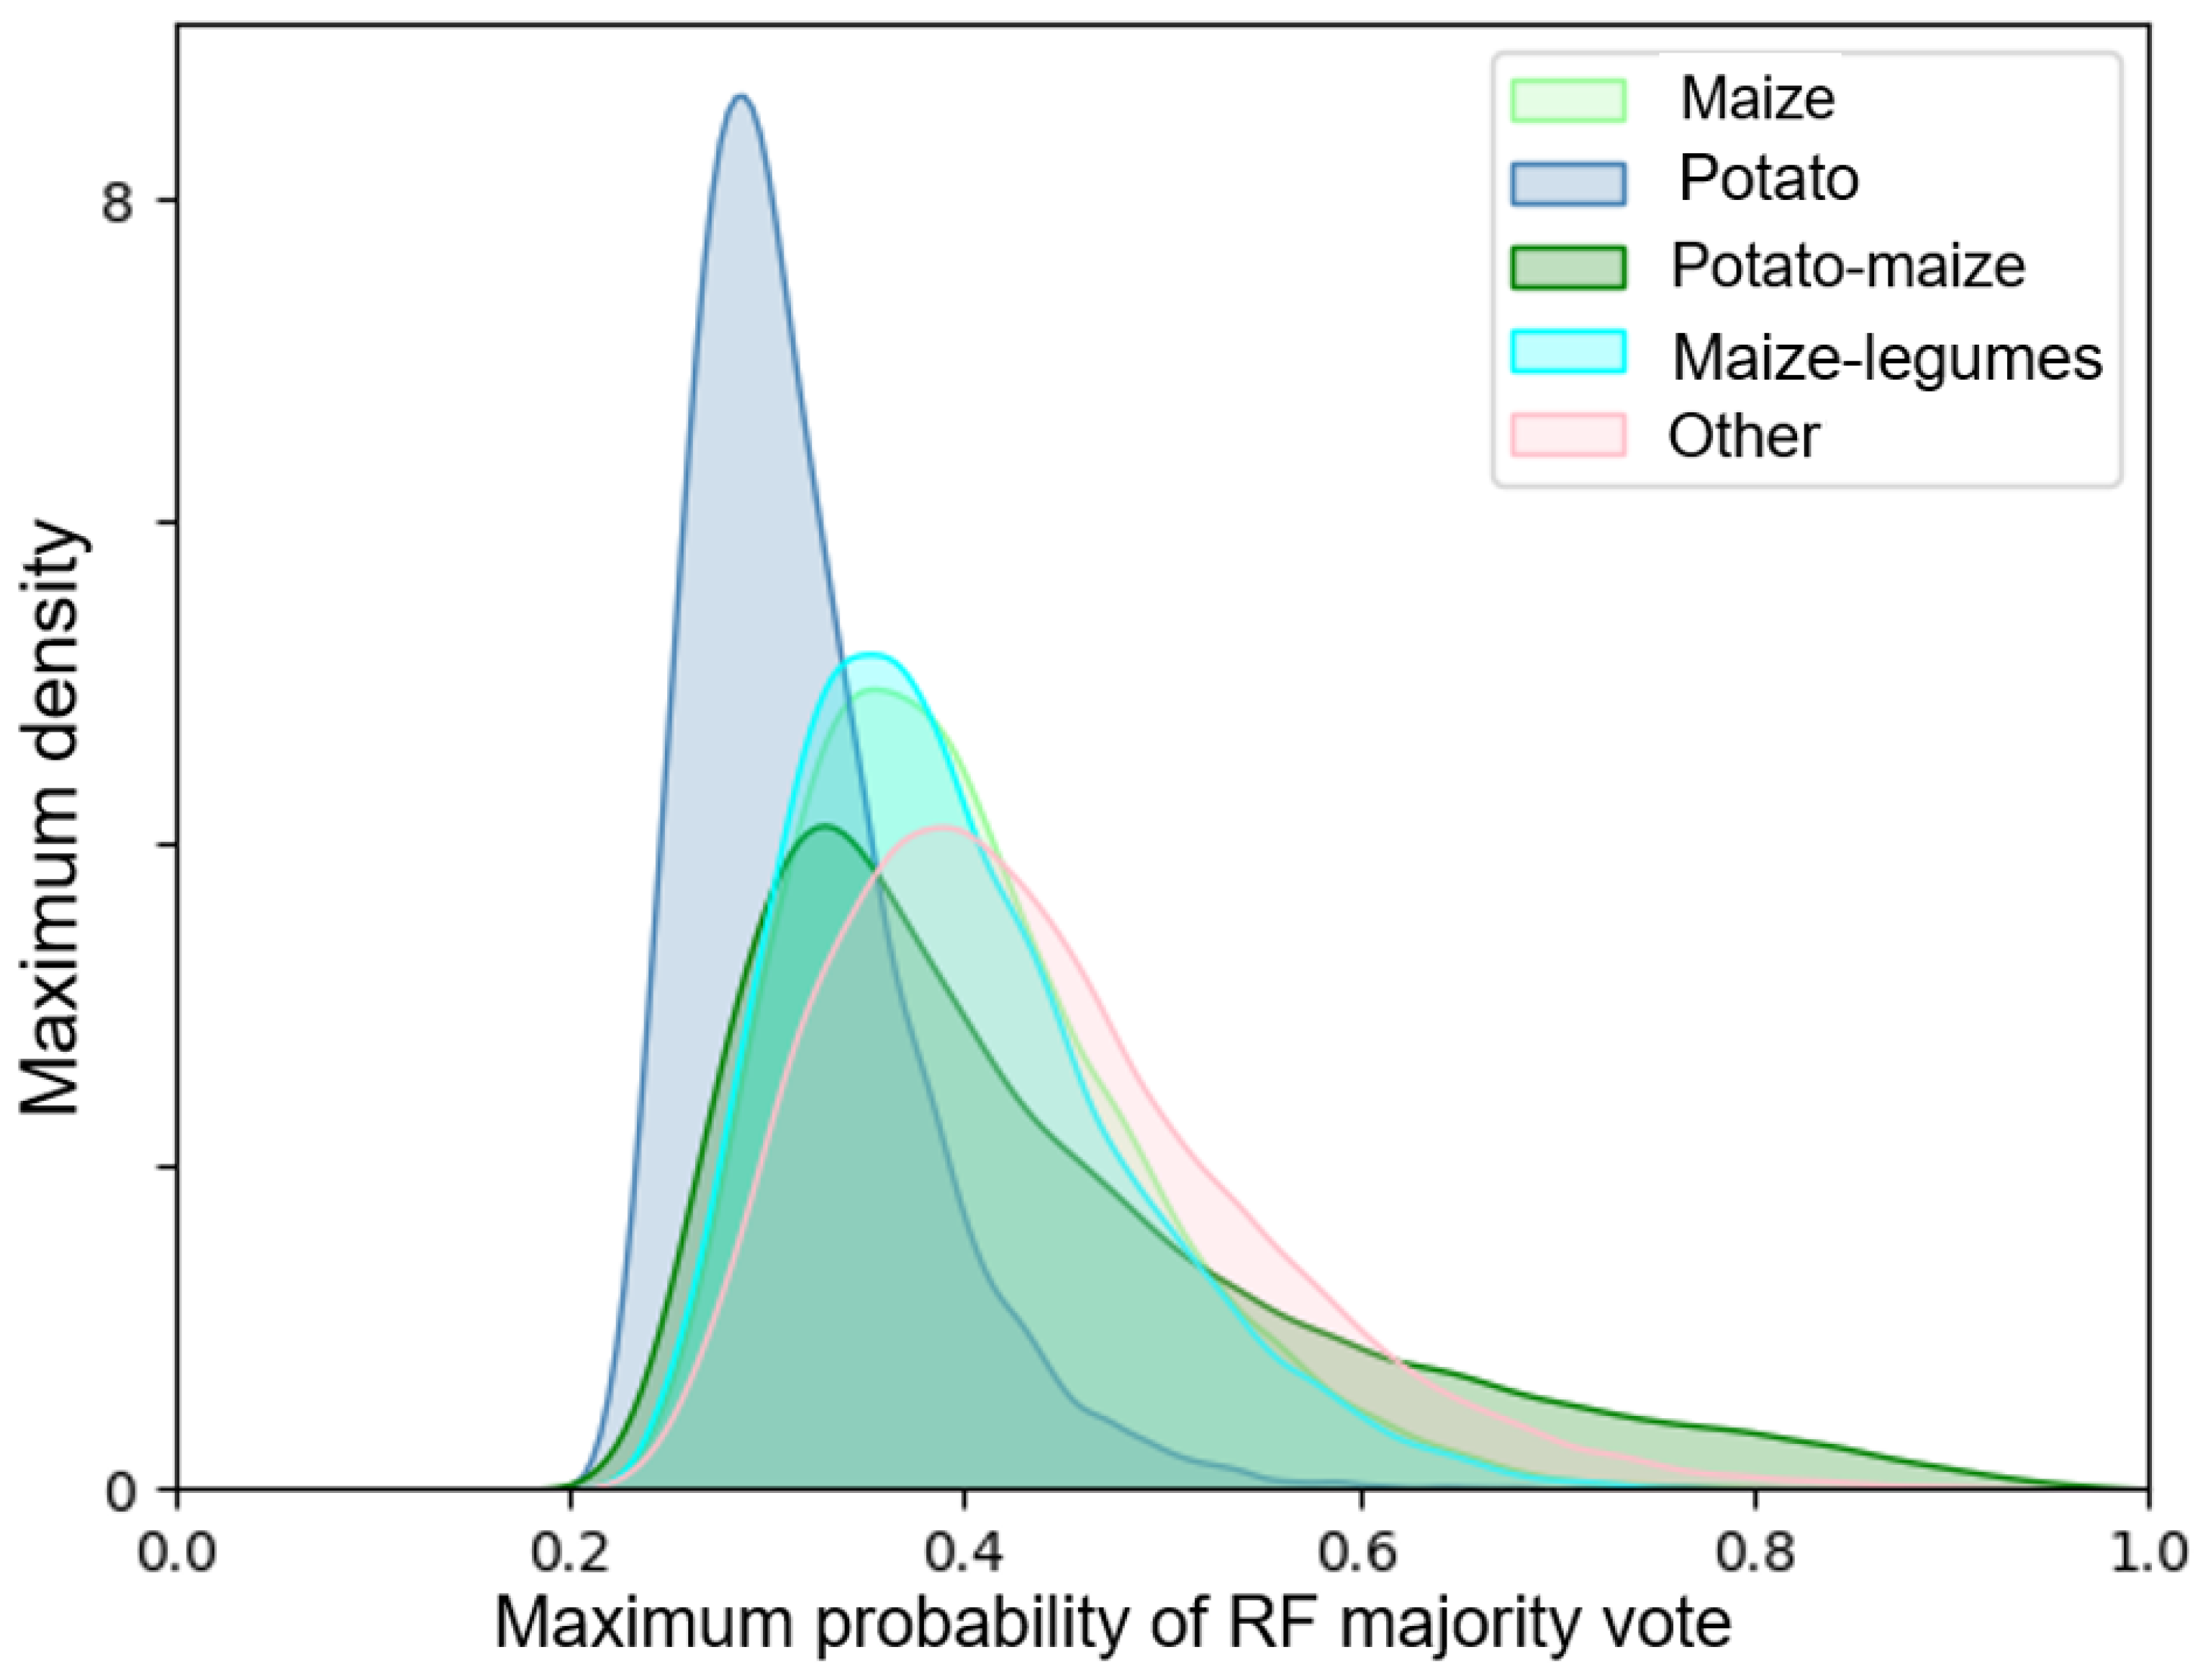
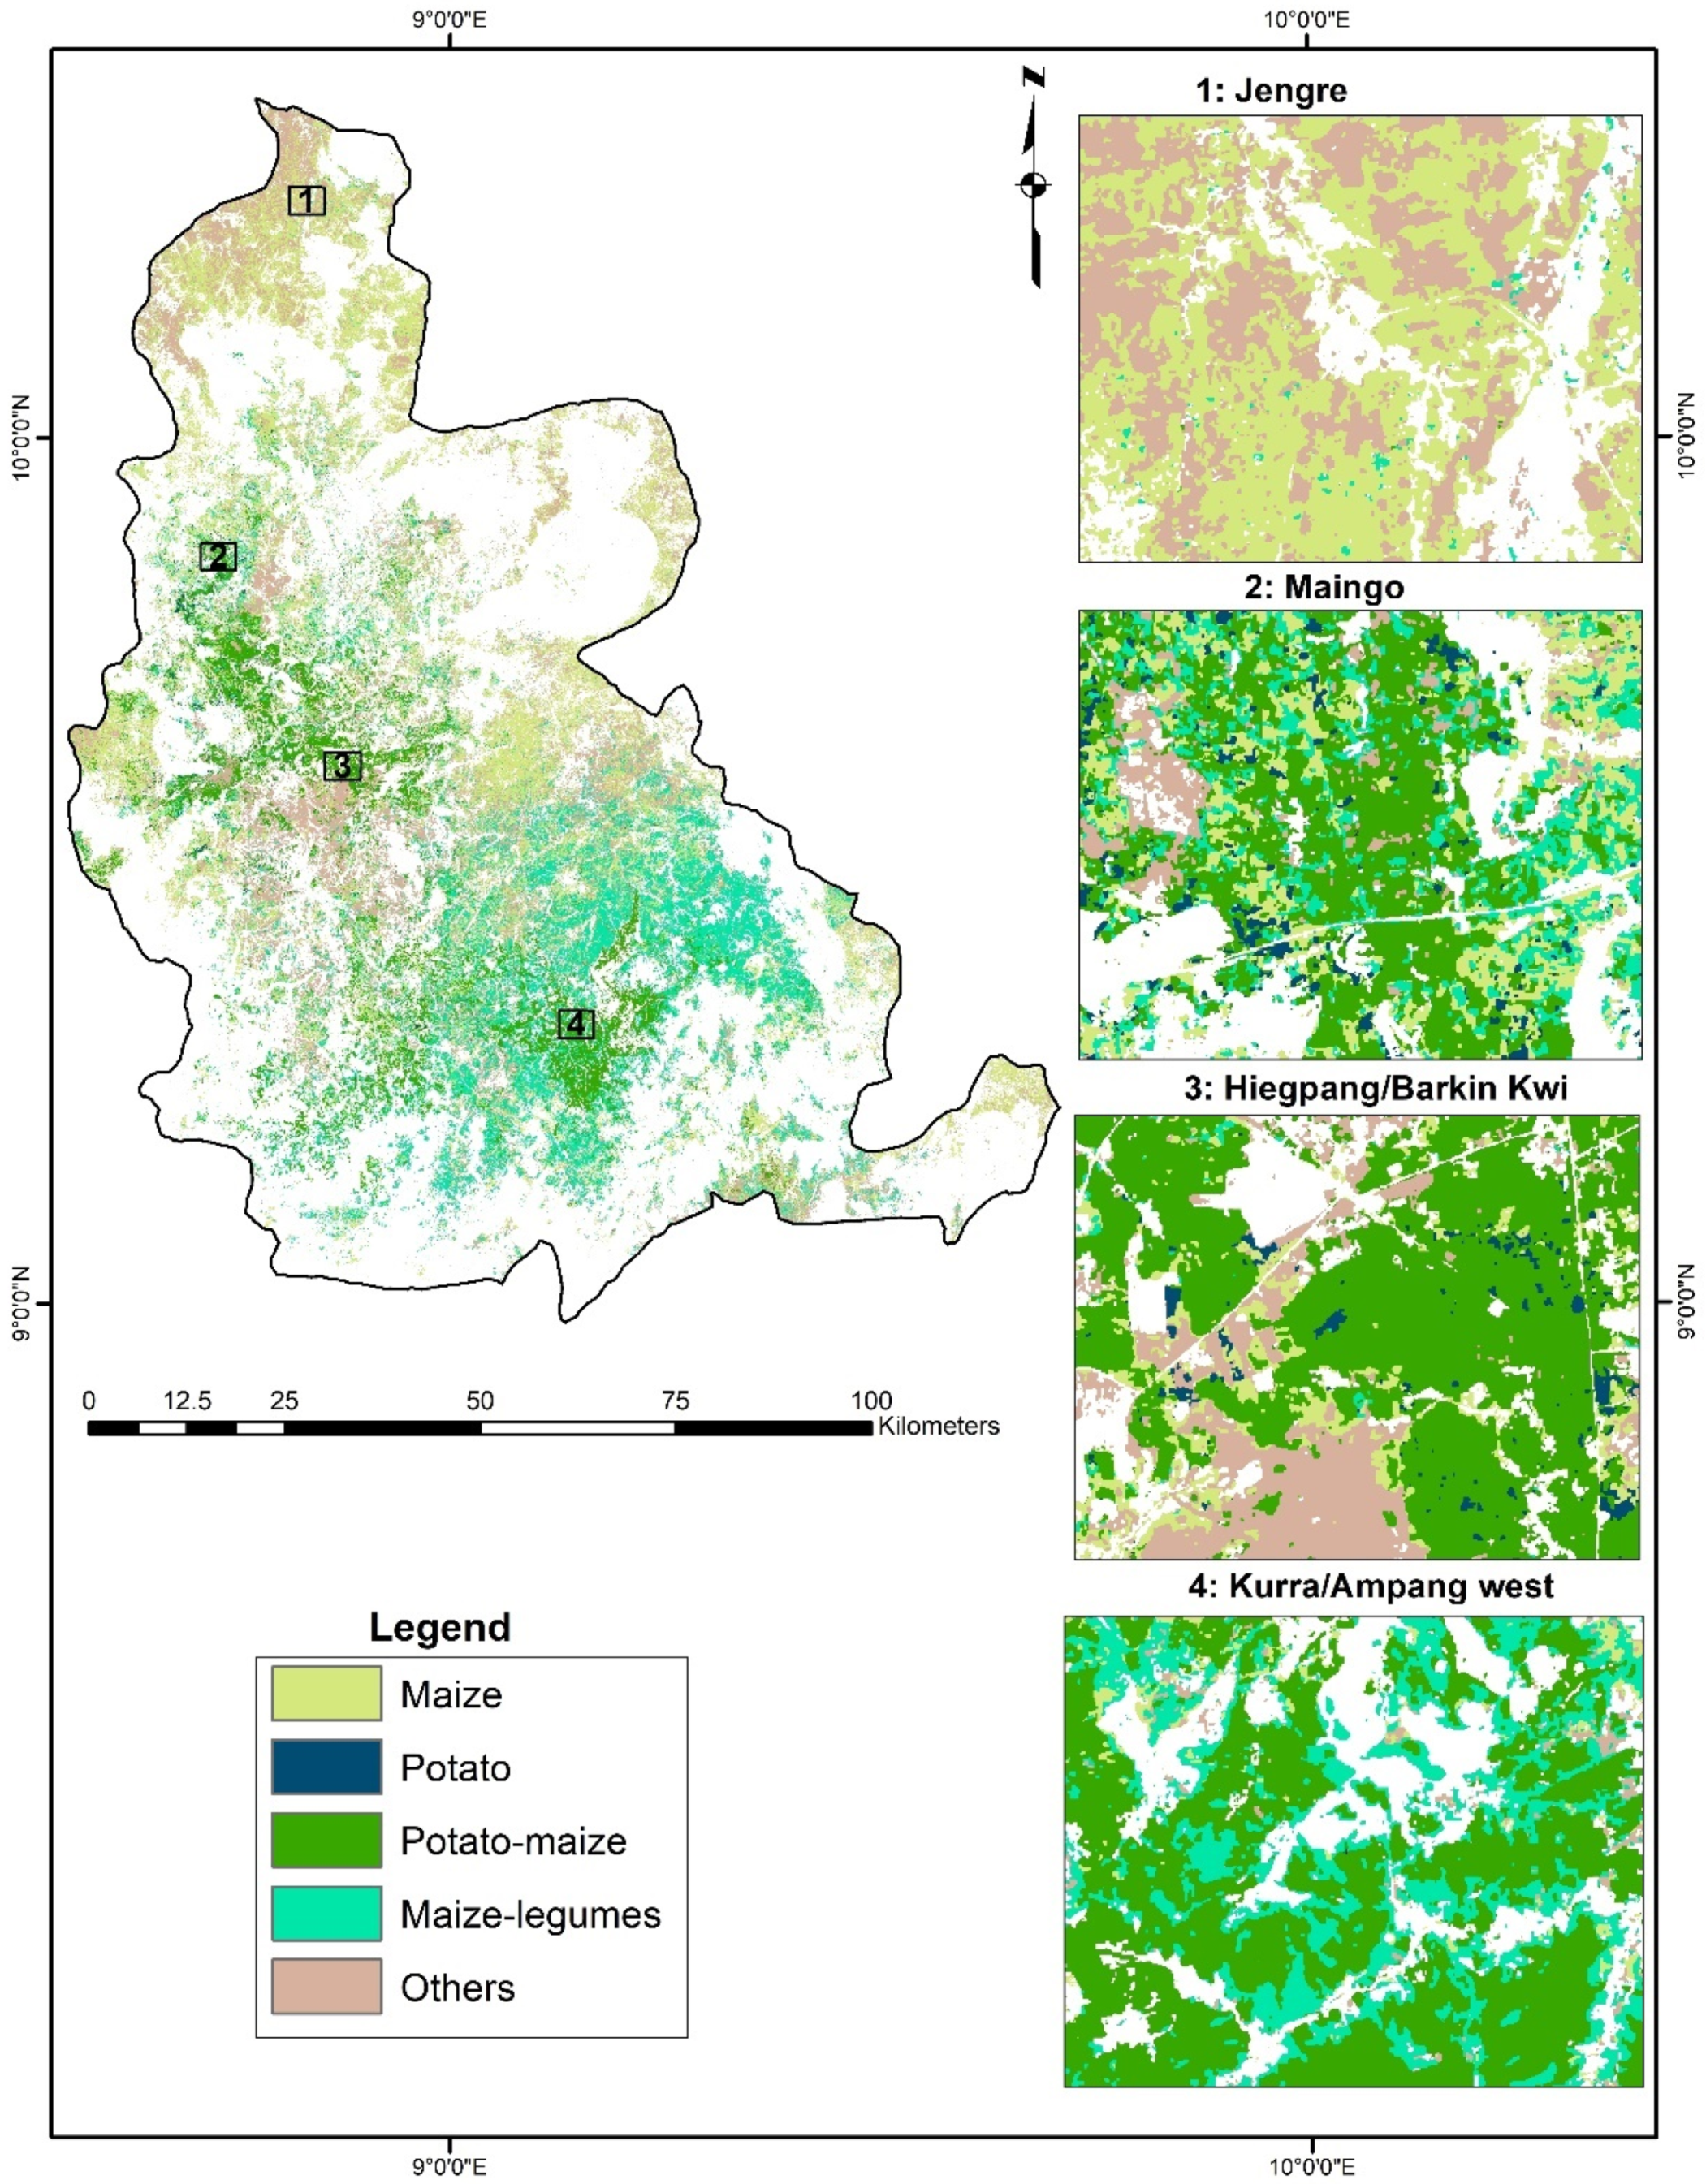
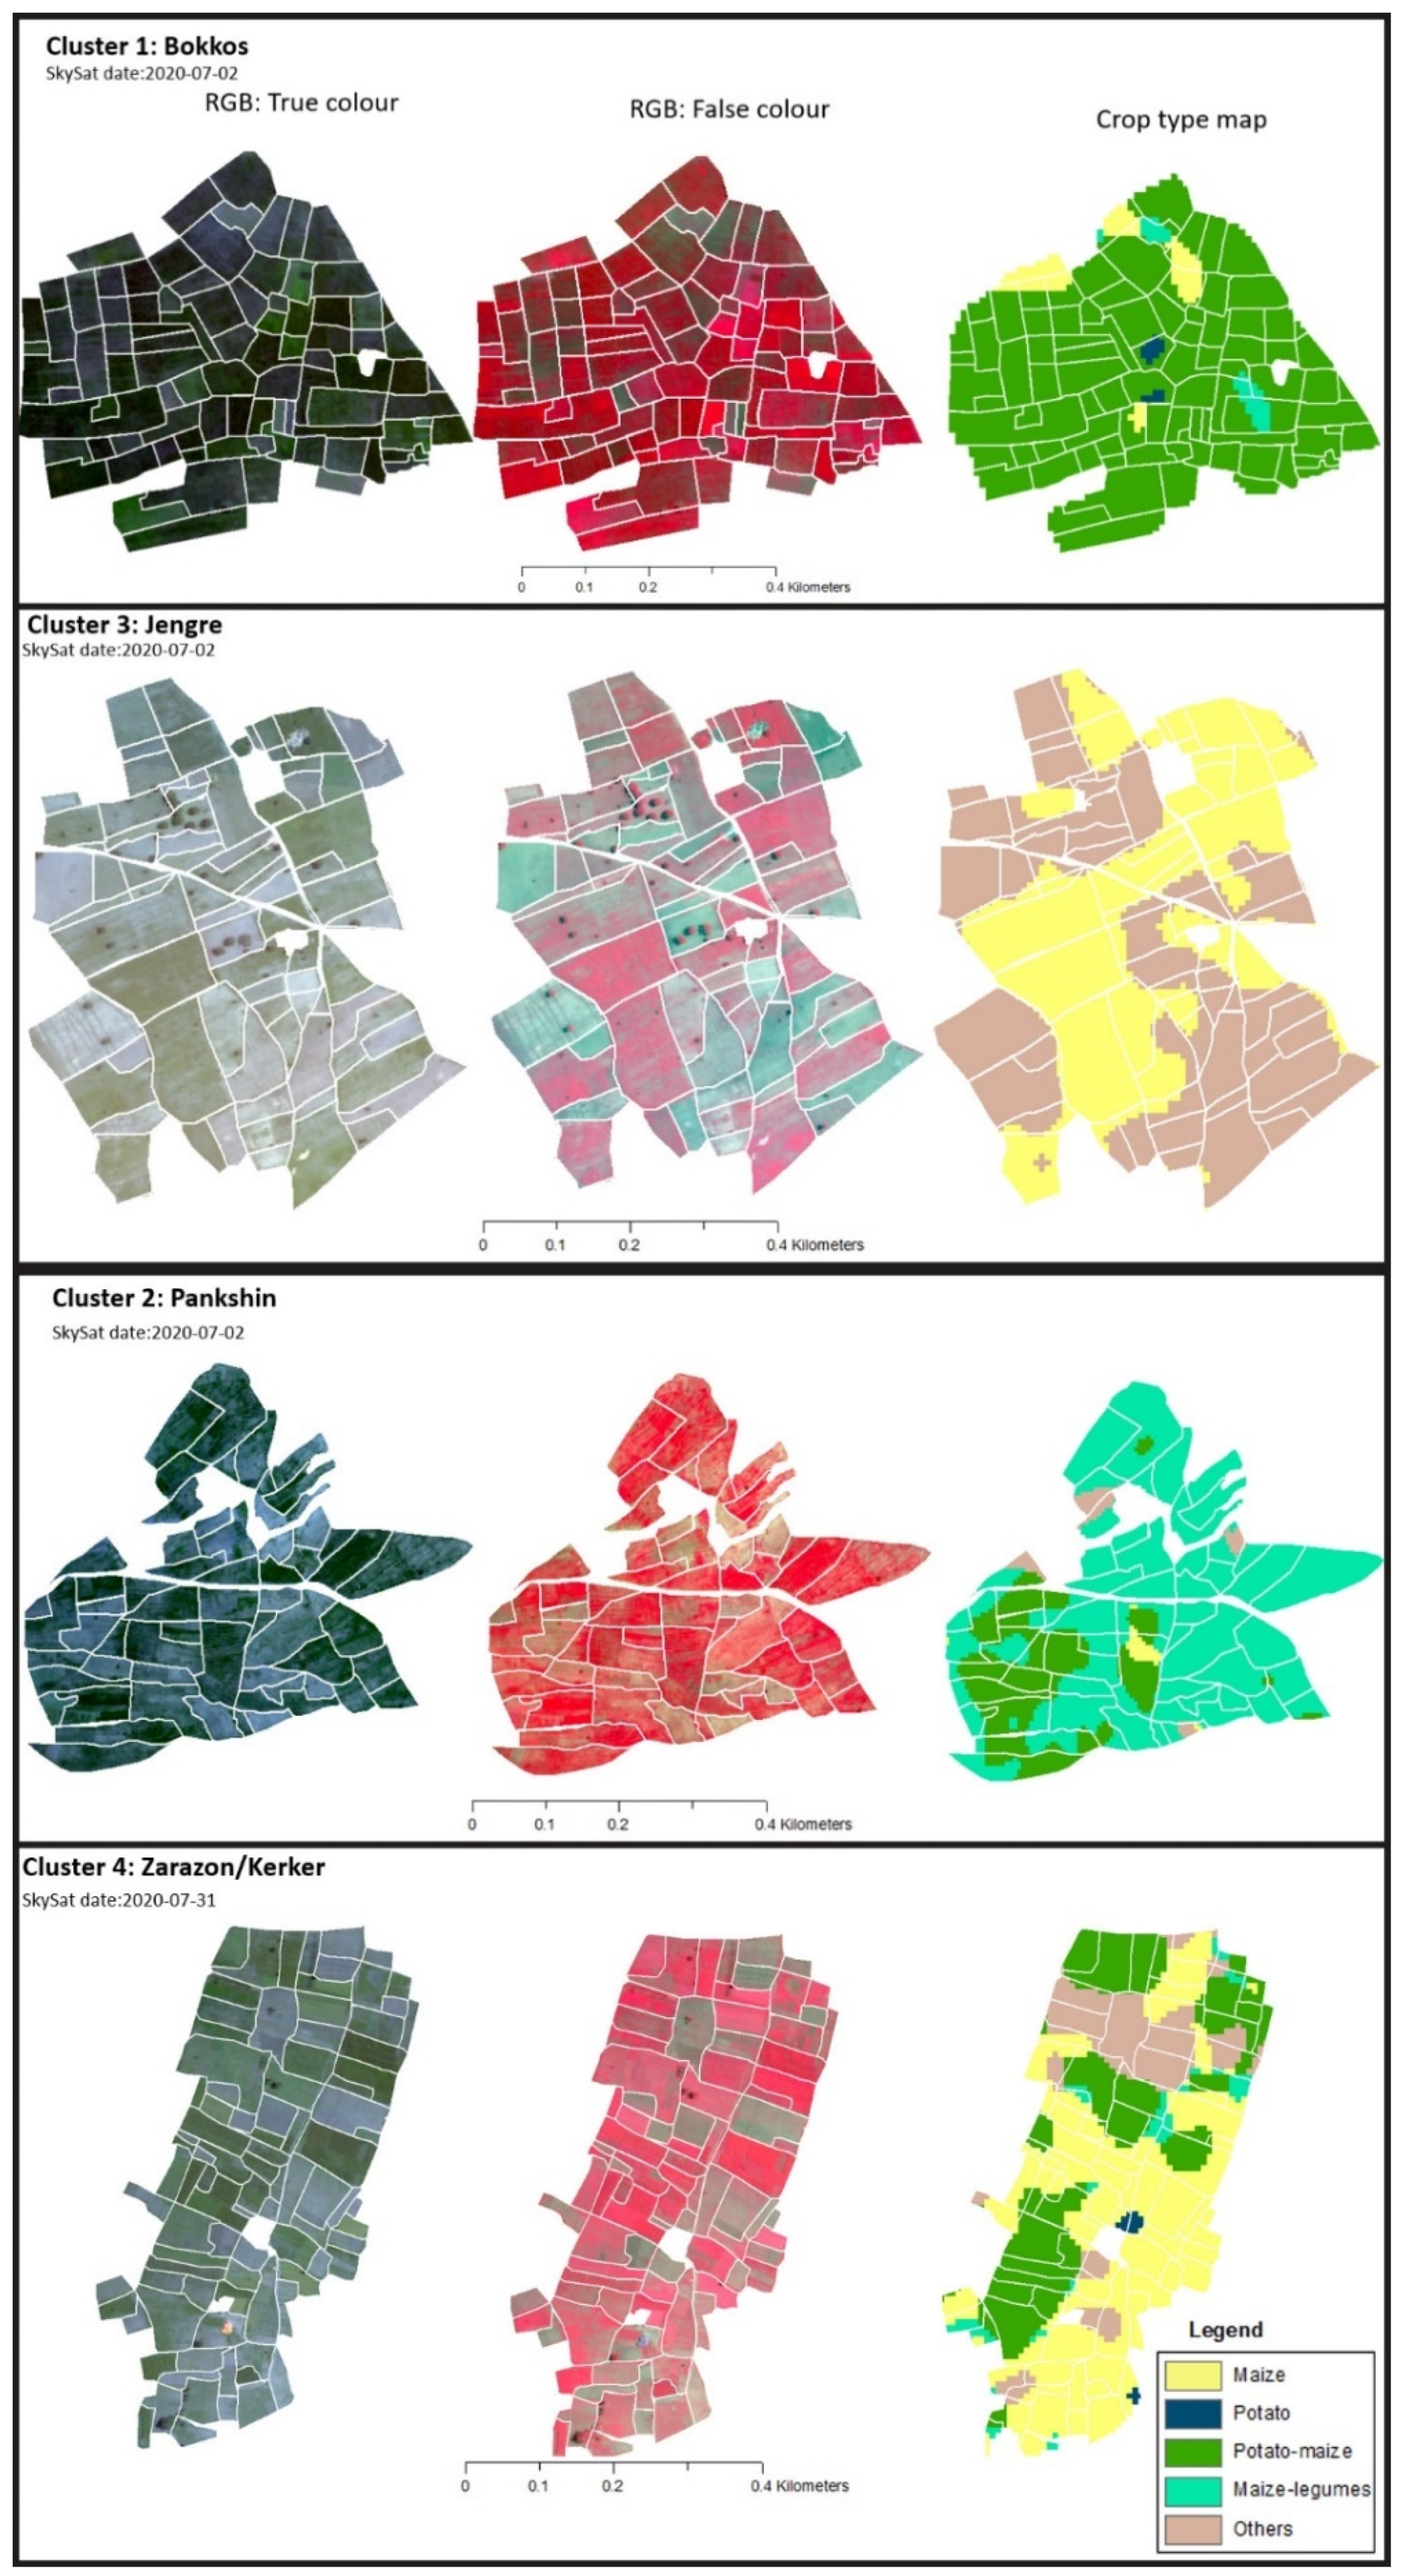
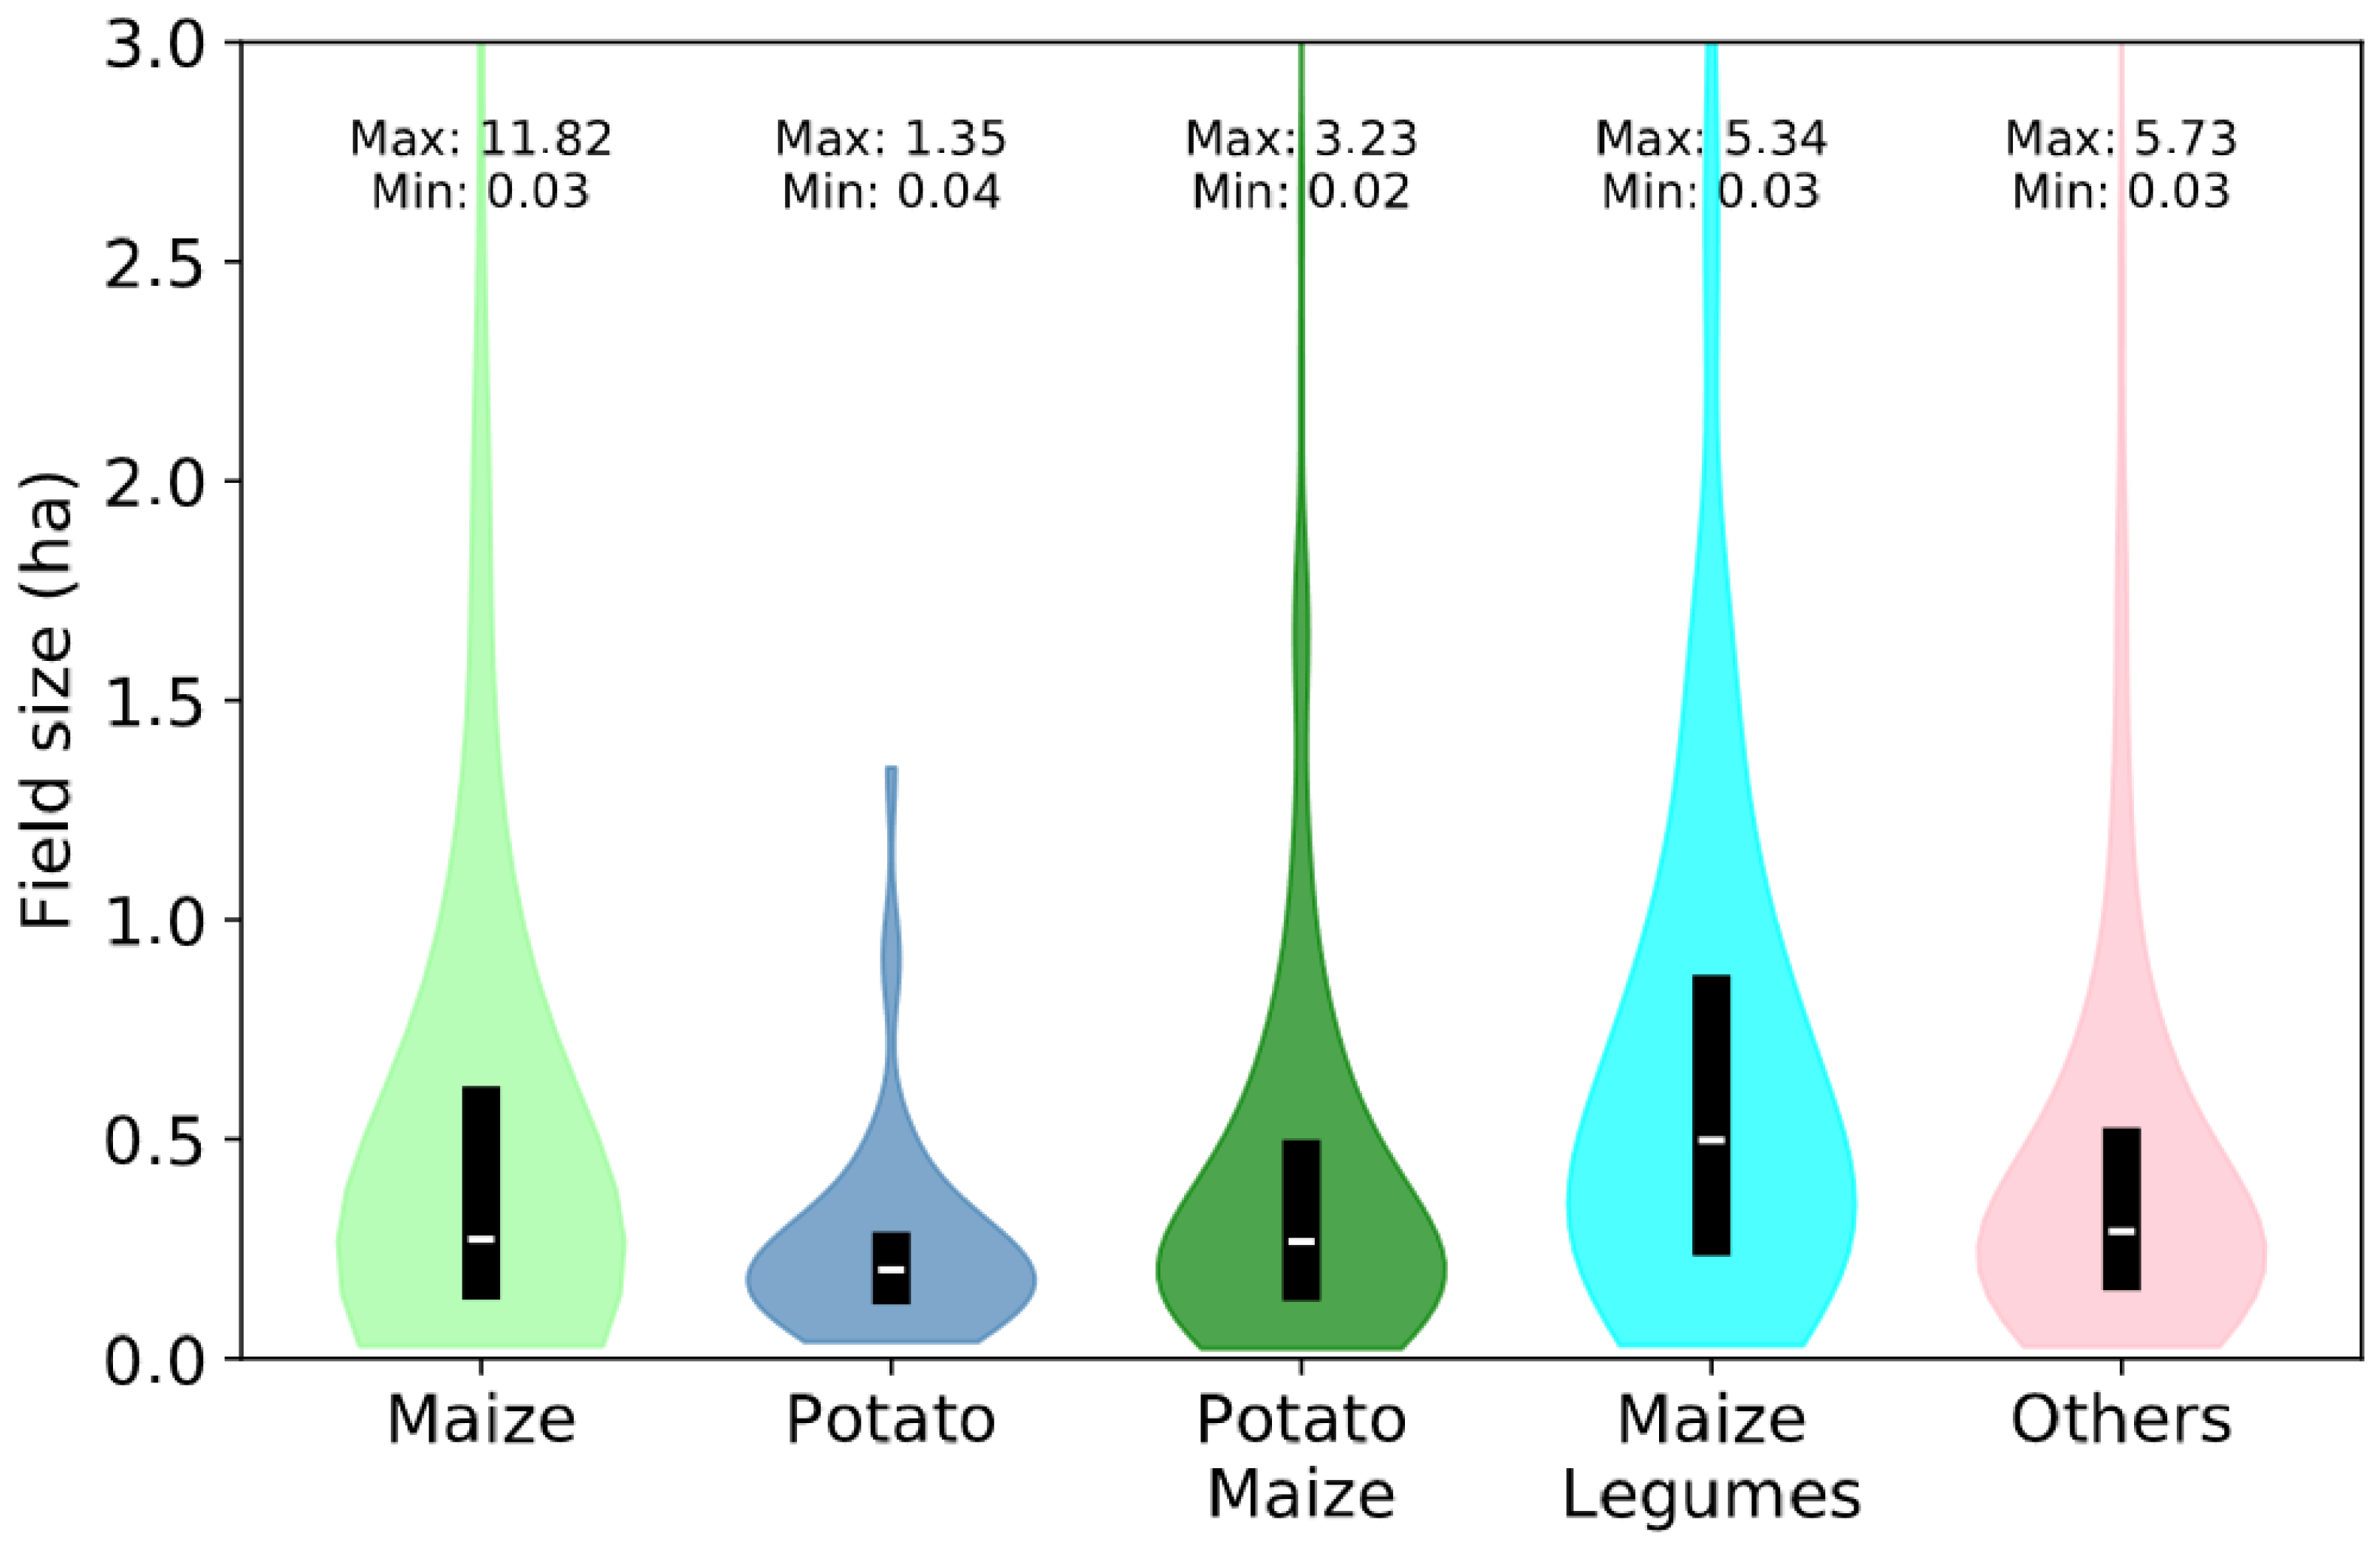
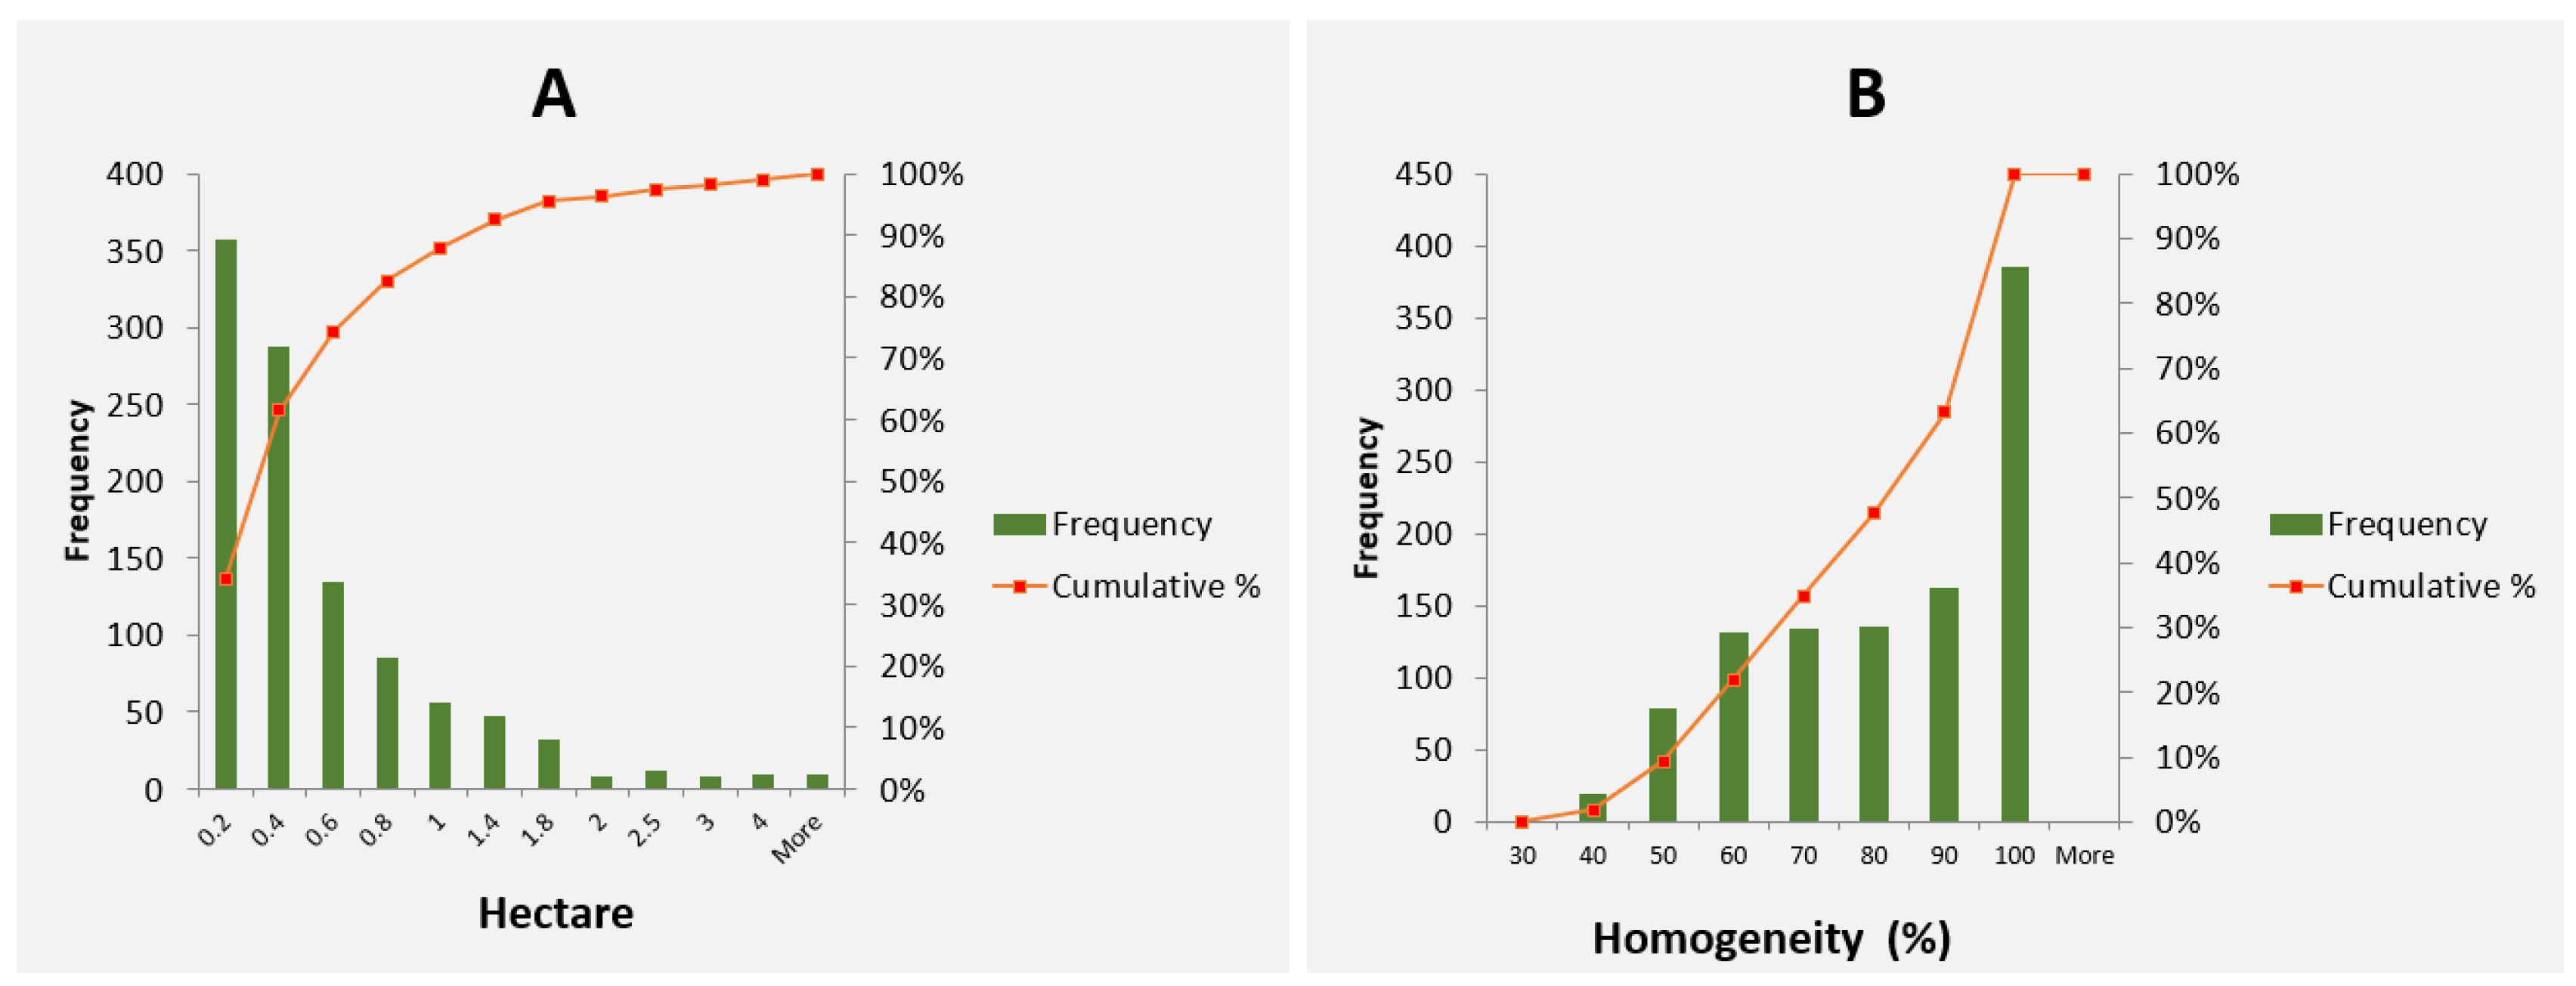
Table 1.
Reference crop type samples.
| Crop Type | Field Data 2019 | Field Data 2020 | Digitized (SkySat) | Total |
|---|---|---|---|---|
| Maize | 213 | 400 | - | 613 |
| Potato | 33 | 24 | 281 | 338 |
| Potato–maize | 115 | 152 | 406 | 673 |
| Maize–legumes | 115 | 114 | 407 | 636 |
| Others | - | - | 517 | 519 |
| Total | 447 | 690 | 1685 | 2779 |
Publisher’s Note: MDPI stays neutral with regard to jurisdictional claims in published maps and institutional affiliations. |
© 2021 by the authors. Licensee MDPI, Basel, Switzerland. This article is an open access article distributed under the terms and conditions of the Creative Commons Attribution (CC BY) license (https://creativecommons.org/licenses/by/4.0/).
Share and Cite
MDPI and ACS Style
Ibrahim, E.S.; Rufin, P.; Nill, L.; Kamali, B.; Nendel, C.; Hostert, P. Mapping Crop Types and Cropping Systems in Nigeria with Sentinel-2 Imagery. Remote Sens. 2021, 13, 3523. https://0-doi-org.brum.beds.ac.uk/10.3390/rs13173523
AMA Style
Ibrahim ES, Rufin P, Nill L, Kamali B, Nendel C, Hostert P. Mapping Crop Types and Cropping Systems in Nigeria with Sentinel-2 Imagery. Remote Sensing. 2021; 13(17):3523. https://0-doi-org.brum.beds.ac.uk/10.3390/rs13173523
Chicago/Turabian StyleIbrahim, Esther Shupel, Philippe Rufin, Leon Nill, Bahareh Kamali, Claas Nendel, and Patrick Hostert. 2021. "Mapping Crop Types and Cropping Systems in Nigeria with Sentinel-2 Imagery" Remote Sensing 13, no. 17: 3523. https://0-doi-org.brum.beds.ac.uk/10.3390/rs13173523
Note that from the first issue of 2016, this journal uses article numbers instead of page numbers. See further details here.