Technical Note

Application of Copernicus Data for Climate-Relevant Urban Planning Using the Example of Water, Heat, and Vegetation

1
Faculty of Civil Engineering, Konstanz University of Applied Sciences, 78462 Konstanz, Germany
2
Institute of Engineering Geodesy (IIGS), University of Stuttgart, 70174 Stuttgart, Germany
3
Climate Service Center Germany (GERICS), Helmholtz-Zentrum Hereon GmbH, 21502 Geesthacht, Germany
4
Mayor’s Department, City of Konstanz, 78462 Konstanz, Germany
5
Department of Civil, Geo and Environmental Engineering, Technical University Munich, 80333 Munich, Germany
6
Benefit Unternehmensentwicklung GmbH, 77933 Lahr, Germany
7
Tejeda Ing. Büro für Planung und Projektmanagement, 39365 Eilsleben, Germany
8
str.ucture GmbH, 70176 Stuttgart, Germany
9
Esri Deutschland GmbH, 85402 Kranzberg, Germany
*
Author to whom correspondence should be addressed.
Remote Sens. 2021, 13(18), 3634; https://0-doi-org.brum.beds.ac.uk/10.3390/rs13183634
Submission received: 15 July 2021 / Revised: 2 September 2021 / Accepted: 8 September 2021 / Published: 11 September 2021

Abstract

:
Specific climate adaptation and resilience measures can be efficiently designed and implemented at regional and local levels. Climate and environmental databases are critical for achieving the sustainable development goals (SDGs) and for efficiently planning and implementing appropriate adaptation measures. Available federated and distributed databases can serve as necessary starting points for municipalities to identify needs, prioritize resources, and allocate investments, taking into account often tight budget constraints. High-quality geospatial, climate, and environmental data are now broadly available and remote sensing data, e.g., Copernicus services, will be critical. There are forward-looking approaches to use these datasets to derive forecasts for optimizing urban planning processes for local governments. On the municipal level, however, the existing data have only been used to a limited extent. There are no adequate tools for urban planning with which remote sensing data can be merged and meaningfully combined with local data and further processed and applied in municipal planning and decision-making. Therefore, our project CoKLIMAx aims at the development of new digital products, advanced urban services, and procedures, such as the development of practical technical tools that capture different remote sensing and in-situ data sets for validation and further processing. CoKLIMAx will be used to develop a scalable toolbox for urban planning to increase climate resilience. Focus areas of the project will be water (e.g., soil sealing, stormwater drainage, retention, and flood protection), urban (micro)climate (e.g., heat islands and air flows), and vegetation (e.g., greening strategy, vegetation monitoring/vitality). To this end, new digital process structures will be embedded in local government to enable better policy decisions for the future.

Graphical Abstract

1. Introduction

Currently, 55% of the global population lives in cities—with a projected percentage of 68% in 2050 [1]. At the same time, the effects and consequences of the climate crisis are particularly striking in urban areas. They are associated with a high potential for damage due to the high spatial concentration of people, buildings, technical infrastructure, economic output, and social and cultural activities. For example, rising summer temperatures increase heat stress, especially in cities, leading to increased health problems and higher heat-related deaths [2,3,4,5,6]. More frequent and extreme storm and tempest events cause damage to infrastructure and commercial and residential buildings [7,8,9]. Cities are particularly affected by the effects of climate change and are exacerbating this effect. Due to increased urbanization, the rising volume of traffic is placing an increasing burden on the environment. Thus, cities are increasingly struggling with the heat, air pollution, CO2 emissions, and traffic noise. To counteract this trend, the preservation of existing and the development of new green spaces have become an essential part of modern urban planning to ensure sustainable urban development (cf. [10,11]).
According to current scenarios and model calculations, Germany’s costs of climate damage are in the range of 0.1–0.6% of GDP by 2050. Recent studies expect even higher numbers on a global level [12]. With investments in climate adaptation amounting to 0.1–0.2% of GDP, governments could avoid much of the damage and instead generate attractive additional benefits at the same time [13,14]. Governments could design and implement concrete measures for climate adaptation and climate resilience, particularly efficiently at the municipal level. Municipal actors, in particular, have various options for action. Regional planning, urban land use planning, environmental planning, municipal landscaping, etc., play a crucial role in mitigating or minimizing the risks and negative consequences of the climate crisis [15].
For viable economic planning and implementation of appropriate measures to minimize climate crisis-related impairments and hazards, sophisticated knowledge of environmental and climatic parameters and their anticipated changes are of utmost importance. It is possible to simulate relevant scenarios and derive measures to succeed in a targeted adaptation of urban areas based on pertinent databases. Thus, the timeliness, quality, suitability, and availability/usability of the available climate and environmental data are determining factors for the ability of cities and municipalities to act, and are of central importance for the planning and justification of climate resilience measures, which usually have to be designed and implemented under tight budgetary constraints and complex boundary conditions [16,17].
Meanwhile, powerful geospatial, climate, and environmental information is increasingly becoming available in Copernicus data and services as past, present, and projection data for different emissions scenarios. There are forward-looking approaches to its use in the context of climate and weather-related influences at the local level [18]. However, the implementation of remote sensing and imagery techniques and their secondary applications for monitoring and detecting the effects of extreme weather events and their impact on the built environment is still underdeveloped [19].

2. Resilient and Climate-Relevant Urban Planning

As the research community expects climate change to worsen significantly in the future, timely climate adaptation in cities is essential. In particular, thermal protection measures are needed to counteract local overheating and maintain the quality and safety of life in the city. A virtual representation that acts as a real-time digital counterpart of the physical town called the digital (city/urban) twin can run simulations of a city’s cooling energy demand and evaluate “what if” mitigation scenarios. The digital twin uses climate models, in-situ and remote sensor networks, and building and transportation systems to show areas most affected by heat stress (cf. [20]). City planners can use different scenarios to determine how newly planned buildings and facilities or even entire city neighborhoods will be affected by urban heat [11]. With the help of these scenarios, architects and engineers can also project the effects of other essential climate factors on structures (i.e., precipitation, wind, and humidity). Based on the results of their simulations, they can then determine the optimal building configuration. In addition, their models can show which existing areas are particularly affected by heat and what counteracting measures they can propose. Their models can guide designers in optimizing the locations where a roof/façade greening or tree planting initiative will most effectively reduce the ambient temperature [11].
The city of Zurich, for instance, is already using the digital twin for selected urban areas to analyze the potential positive impact of existing and planned buildings on cold airflow corridors in the city. For this purpose, the city has developed 13 mitigation measures and applied them to achieve an optimized climate situation. The model compares the current state with the climate-optimized state using the different mitigation measures. The model indicates how the physiological equivalent temperature (PET) changes within different simulated scenarios and where mitigation through specific landscaping and urban planning measures is most effective. City planners can give more significant consideration to climate aspects in future planning processes thanks to the simulated scenarios. Climate factors (i.e., solar radiation, air temperature, precipitation, humidity, and wind) will increasingly play an important decision-making role in urban planning processes. The example of Zurich clearly shows how the digital city twin can be used to improve the urban climate (cf. [21] p. 108, [11]). The digital urban twin can be used to simulate future development scenarios transparently and understandably. Considering different planning specifications and parameters linked to geospatial data, scenarios of possible building uses, and their effects can be calculated and compared with each other. The calculation and visualization of different planning scenarios serve as a basis for discussion and decision-making involving planners, architects, and city administrators as well as citizens (cf. [21] p. 107, [11]).
With the help of the digital twin, hydrologists can carry out GIS-based heavy rain event analyses and simulate flood scenarios using hydrologic, hydraulic, and mathematical models. The consequences of severe rain events are usually devastating, particularly when flash flooding in combination with sealed or dried out soil with a lower water absorbency rate leads to an overload of the sewer system. Therefore, flooding and heavy rainfall risks must be considered in municipal urban land use planning to minimize future damage to buildings, human life loss, number of injuries, and direct economic loss. With the inclusion of real-time data, scientists can realistically describe predictions of heavy rain events and their expected impact. Examples include the visualization of flood scenarios in the city of Cologne, which identified where buildings were particularly affected by the flooding and successfully used this information to develop effective mitigation measures [22]. Complex simulations are feasible using a digital twin, e.g., coupled modeling of the sewer network and surface runoff.
Furthermore, by simulating heavy rainfall, investigators can identify sewers with increased surface runoff since exceeding the capacity of the sewer network may also release harmful pollutants. For critical sewers, appropriate mitigation action, e.g., redesign or retention areas, can be taken. The digital twin is a valuable tool to produce realistic temporal and spatial forecasts of heavy rainfall events. The frequency and intensity of extreme weather events have increased, especially in recent years. In Germany, extreme weather situations such as heavy rain and floods occur more and more frequently ([23] p. 483, [24] p. 668, and [11]). With the help of the simulation of heavy rainfall events, municipal governments can realistically map flood forecasts using the digital twin and thus can identify flood-prone areas. By modeling water levels and runoff volumes, they can determine the damage to buildings and infrastructure and derive suitable measures and protection plans. Finally, city managers can evaluate object-specific protective measures based on structural and technical data and individual objects’ information (cf. [11,25]). The city of Lisbon already used its digital city twin for urban flood simulations. Based on the results of the simulations, it developed a master plan for drainage for several return periods. Lisbon has already implemented suitable flood protection measures. As a result, Lisbon is now better prepared for flood events in the next century since the city can proactively avert significant damage from flooding (cf. [11,26]). The analyses enable precise and targeted planning and early initiation of necessary flood protection measures. Thus, with the help of the digital twin, the city can make the lives of its citizens safer [11].

3. Relevant Data and State-of-the-Art Technology

3.1. CODE-DE Platform

For access to climate and environmental data by German authorities, the platform CODE-DE (Copernicus Data and Exploitation Platform—DE; https://code-de.org/en/, accessed on 30 August 2021) is available, representing the current state of the art, which municipalities can also use in the context of the applications and tasks focused on here. CODE-DE is part of Germany’s geospatial data and information strategy. It offers access to remote sensing data, a virtual working environment for processing these data, and extensive information material and training to support users.
In particular, CODE-DE provides access to the Sentinel and Contributing Mission data and information products of the Copernicus services, offers processing capabilities, and access to a portfolio of products and tools specifically designed for government applications and applications in the science and private sectors. It is a platform that allows downloading processed Level 1 and Level 2 raster (satellite) data. An API is also available from CODE-DE. Many of the data products available via CODE-DE originate from the CDS and are adapted for Germany. CODE-DE cloud contingents are available for free access to the data [27] and the efficient data processing environment, particularly for public authorities and their contractors. The quotas are allocated on request and, if necessary, prioritized according to the following user categories:
  • Category 1: German federal authorities and their contractors
  • Category 2: German state authorities, municipalities, and their contractors
  • Category 3: German research institutions and other non-commercial organizations
  • Category 4: Anyone who does not fall into one of the other categories. Examples include non-German users, students, and private sector users.

3.2. Climate Data Store (CDS)

The climate data store (Copernicus Climate Data Store, CDS; https://cds.climate.copernicus.eu/#!/home, accessed on 30 August 2021) provides access to a multitude of climate datasets through a searchable catalog (e.g., [28]). CDS datasets include observed historical climate data records and estimates of essential climate variables (ECVs) derived from Earth observations, global and regional climate reanalysis of past observations, seasonal forecasts, simulated past climate, and future climate change projections. The access to data is open, free, and unrestricted. An online toolbox is available to allow users to create workflows and applications tailored to their needs. An application programming interface (API) enables users to automate their interactions with the CDS and allows direct integration of CDS offerings and functions into software tools. CDS data and tools form the backbone of the C3S sectoral information system (SIS), which provides tools and applications for dealing with climate impact in different industrial sectors, including energy, water management, and agriculture (e.g., [29]).

3.3. Commercial Software Products

In addition to using open source software, the consortium uses a sophisticated and specialized GIS software suite from ESRI, an international supplier of geographic information system software, web GIS, and geodatabase management applications. Their ArcGIS product family offers a wide range of tools and applications, most of which the CoKLIMAx consortium already used in the past. For instance, we successfully used ArcGIS Enterprise (Platform), ArcGIS Online, ArcGIS Developer, ArcGIS Pro, ArcGIS Desktop, ArcGIS Online, running on servers, in the cloud, on web and mobile devices, and desktops [30]. Possible application contexts, including research activities as well as administrative and especially, operational use, can be categorized as follows:
Spatial Analysis and Data Science allow the CoKLIMAx consortium to “connect the seemingly disconnected with the most comprehensive set of analytical methods and spatial algorithms available” [31,32]. This way, we can uncover former, new, or hidden patterns to forge or improve predictive modeling and thus create a competitive advantage using the AMCDS toolbox. Consequently, spatial data analysis and science help to extract deeper insight from the available data of the CDS and the city of Constance. The comprehensive set of analytical methods and spatial algorithms, including machine learning and deep learning techniques using Python and R, are part of the software suite to deal with the growing amount of diverse geographic data from different sources.
Location intelligence can be improved and blended with newly collected information, using Field Operations, together with and for citizen participation, to support (municipal) administrations, various collaborative institutions, companies, etc. It will improve coordination and operational efficiency for activities in the urban environment field to monitor a city’s interwoven entanglement of countless processes and activities. It can also help reduce or even replace reliance on paper, pushing digital applications. Thus, both staff working in the field and those in administrative offices will use the same authoritative data to reduce errors by standardization, increase productivity, and save money.
The dynamic mapping software will help create interactive maps for dashboards of mobile applications to visualize and explore the data. Powerful analysis tools and map styles will help discover and refine a stakeholder’s understanding of their data in place. We will create maps with custom styles, symbols, and base maps to personalize the products for the respective users and share the data insights to influence change positively.
3D GIS and BIM, e.g., digital twin and local real-time sensortechnology, gain relevance in daily operations. The city of Constance is early to implement and use a 3D model for city planning. The project shall help create and add additional dimensions to the cities data. The visualized, as-built environment improves further conceptualization of the planners’ vision. This way, planners can further analyze and extract value from available data to solve current or future problems and understand the bigger picture. Therefore, visualizing the urban build environment using a 3D model and data visualizations shall support to see patterns, trends, and non-obvious relationships. Last but not least, the 3D visualization will help to communicate information to stakeholders by the ease of sharing ideas and concepts.
Image data and remote sensing from drones, aerial and satellite imagery, and other types of remotely sensed data are opening new possibilities in just about every field of work and research. This data can help enhance analysts’ or users’ ability to understand their environment and handle increasing volumes of data using robust mapping, geospatial analytics, artificial geospatial intelligence (GeoAI), and modeling tools. The software suite will help CoKLIMAx run the AMCDS toolbox development. In detail, it derives improved insights with flexible deployment options for managing, mapping, analyzing, visualizing, and sharing preprocessed or streamlined CDS climate data or local imagery and raster data, blended with other relevant, local information.
Data acquisition and management (Big Data) are a crucial part of the project and the city and its daily business, primarily due to the greater amount of diverse data than ever before. Whether it is 3D imagery, real-time, or big data, the volume, and data types are constantly increasing. Data (i.e., climate data, urban data, environmental data, or even sensor data) comes from all kinds of sources and sensors. It is essential to organize and manage that data properly. The applied and used software suite shall help the consortium make better and informed decisions to enhance the productivity for all stakeholders, particularly for and across the entities of the city of Constance with all its administrative departments, together with external business. Therefore, the CoKLIMAx software architecture is built with and around the ArcGIS platform, which is in the center of spatial data storage and better organized GIS data management and workflows to collect, store, maintain, prepare, and share relevant data.
The advantage of using a federated and distributed GIS system or platform is the seamless interoperability and integration with and for all users who can and will use the wide range of interconnected tools available [33]. It will help improve municipal or other local government operations and enhance services provided to the administration, stakeholders, and public. The local municipality and other stakeholders already use the mentioned software suite or system (ArcGIS). They currently all work with and use location-based data and technology to improve daily processes and operations, and thus enhance services provided within the administrative bodies, and to share information or applications with external partners and the public. The city of Constance and the project partners have recognized the positive impact on their work with and for the administration when they use spatial data to prioritize strategies, innovate, and collaborate with internal and external stakeholders.
Daily tasks of the local administration and their entities deal with dynamic organizational structures and processes. However, understanding how ArcGIS aligns with business needs can be challenging. The lack of human capital and the increasing complexity of today’s technology landscape makes it challenging to develop and deploy solutions that meet all administrative needs. Hence, ArcGIS solutions often reduce costly development and time to deploy location-based solutions and services across a wide range and variety of organizational and business needs.
The CoKLIMAx federated and distributed GIS system strengthens and improves situational awareness, tasks, operational observation, and spatial and non-spatial data [33]. Therefore, an ESRI GIS Enterprise System shall offer the possibility of various services: data collection, processing, storage, map or app creation and analysis, for both the local infrastructure and in the cloud with a dedicated web GIS infrastructure, so that work can be organized and shared anytime, anywhere and on any device. The ArcGIS Enterprise Platform puts collaboration and flexibility at the center of the project.
The purpose of the CoKLIMAx federated and distributed GIS System is to use and build on a centralized, server and cloud-based GIS capacity for the management, provision, and collection of data to support daily operations and processes by providing more comprehensive operational data and observations. As pointed out and displayed in the architectural graphic (3.5), CoKLIMAx will focus on combining several data streams from different sources. The merging, maintenance, and analysis of data will help to master the challenging volume of data. It will ensure a better overview of what is happening in a rapidly developing area of activity concerning digital transformation processes. It will also include managing risks and the necessary security measures and improving already existing or related functions.
The centralized system shall help provide decision-makers with relevant information regarding the nature of all possible situations or even risks related to their urban or rural environment. At the same time, the status quo of planning and response activities is always critical to any short-term or long-term or possible crisis management in an unforeseen event.

3.4. Copernicus Climate Change Service (C3S)

The European Centre for Medium-Range Weather Forecasts (ECMWF) provides the Copernicus Climate Change Service (C3S; https://climate.copernicus.eu/, accessed on 30 August 2021). The C3S aims to support policy development in Europe for climate change, to improve the planning of climate mitigation and adaptation measures, and to promote the development of new services with economic value for society, i.e., by protecting people and assets, increasing knowledge on the state of our environment, improving environmental policy effectiveness, facilitating the adaption to climate change, helping to manage emergency and security related situations, and fostering downstream applications in various fields such as health, agriculture/forestry, energy, transportation, etc. In addition to global and regional climate change projections for Europe until the end of the 21st century, ECMWF provides a range of observational and reanalysis data. Furthermore, it produces reanalysis data with models of global circulation incorporating daily observations and is thus close to the observed climate. ECMWF provides these data continuously in a very timely manner at hourly resolution. In addition to numerous atmospheric parameters such as temperature, evaporation, precipitation, radiation, etc., they also contain many data on land surfaces and land hydrology and a large number of parameters for lakes.

3.5. International CORDEX Initiative

Within the framework of the international COoRdinated Downscaling EXperiments (CORDEX; Coordinated Regional Climate Downscaling Experiment; https://cordex.org/, accessed on 30 August 2021) initiative of the World Climate Research Program (WCRP), coordinated regional climate simulations for the 21st century are carried out for different regions worldwide. For Europe, CORDEX generates climate change simulations at a comparatively high spatial resolution of 12.5 km × 12.5 km within the European branch of CORDEX, the EURO-CORDEX initiative ([34,35]). Within the Copernicus Climate Change Service (C3S) project “Producing Regional Climate Projections Leading to European Services” (PRINCIPLES, C3S_34b Lot2), additional regional climate change simulations based on the global Coupled Model Intercomparison Project Phase 5 and 6 (CMIP5 and 6, [36]) simulations for different emission scenarios have been generated. These simulations will further advance the ensemble of regional climate projections for Europe. The generated multi-model ensembles of climate projections allow the assessment of the quality of climate information by making statements about bandwidths and robustness of projected climate changes. The Earth System Grid Federation and, to a large extent, also the C3S Climate Data Store provide the data for regional climate projections.

3.6. Critical Discussion of Addressing Current Challenges of Using Climate and Environmental Data

In principle, therefore, there already exists a wide range of forward-looking approaches to using climate and environmental data. This data is as provided in particular by Copernicus, for the derivation of climate projections (e.g., [29,37,38,39]) and for the use of past, present, and projected data for the identification of expected climate- and weather-related challenges at the local level (e.g., [40,41,42,43]).
Although a relatively wide range of climate information and services and the articulated need for climate information and services from adaptation practitioners exist, studies [44] reveal that municipal users have adopted them only to a limited extent [45,46,47]. This lack of actual application is attributable to identifiable barriers of use. Besides, clear-cut obstacles like technical computational capacities, financial and personal resources, and expertise on climate information and its interpretation [36,48], also the institutional and organizational setup as well as personal beliefs on the value of scientific data can obstruct data application [49]. For example, regulatory barriers exist concerning climate projection data in land use planning due to the inherent uncertainties associated with these projection data. Similarly, the coordination of climate change adaptation is organizationally dispersed across several task areas. In addition, it is often institutionally fragmented and usually rather weakly anchored [34]. Other barriers and obstacles include both technical challenges to integrate the data into municipal tools and workflows, as well as the necessary knowledge on the quality of climate data and its interpretation, especially for the assessment of uncertainties (e.g., [29]), and its connection to locally available data. Suppose pertinent data do not exist, e.g., due to the complexity of the orography, dispersion of the stations, or short time series. In that case, downscaling will be impossible, and remote sensing tools have to be used to derive reliable precipitation and temperature information. An excellent example of successfully applying remote sensing tools in combination with in situ rain gauges has been provided by Valeriano [50], who used the Tropical Rainfall Measuring Mission method (TRMM) at the Huong River basin in Vietnam to carry out a flooding study.
The study combined a distributed hydrological model with remote sensing precipitation data to transform rainfall–runoff into streamflow and subsequently compared it with the observed in situ data. In this case study, the streamflow obtained by the satellite rainfall showed a better match for typical flow peaks than for extreme events [50]. Another application of remote sensing tools was provided by Wang et al. [51]. They used four different satellite remote sensing products (GSMaP, TRMM, CHIRPS, and SM2RAIN) in the Qaraqash River basin in China. His findings showed that CHIRPS and TRMM performed relatively poorly in the study area, with errors between ±8 to ±12%, respectively.
Furthermore, TRMM underestimated maximum values in summer and overestimated in winter, whereas CHIRPS only performed poorly in summer. GSMaP and SM2RAIN generally performed better; nevertheless, SM2RAIN had a poor ability to reproduce the winter precipitation but showed a better match with in situ data in summer [51]. The investigations mentioned above clearly show that in our CoKLIMAx project, a careful application of different remote sensing tools will be necessary to ultimately select the optimal solution for the regional conditions at Lake Constance.
From the broad range of products and services offered by the C3S climate data store, it is usually equally difficult for average communal users to identify the climate parameters and data sets relevant to them. Also, it is difficult to recognize their potential benefits and added values for specific municipal applications. Therefore, it is helpful to illustrate the usefulness of existing climate parameters by their explanatory potential for past extreme events and other affectedness [46,52].
CoKLIMAx should also seek coordination concerning data format as well as temporal and geographic scales. Therefore, we have to develop solutions and integrate them into information systems to link the different spatial scales from the macro- to the micro-scale [45].
We will follow a transdisciplinary approach (co-design) and include municipal users. This approach will ensure that we design and develop solutions appropriately adaptable to local conditions and requirements and overcome or circumvent the existing usability barriers. In addition, this approach will ensure the alignment with characteristics and needs of institutional decision-making processes, the use of terminology understandable by the end-user, and inform appropriate municipal processes and tasks at suitable points in time [47,53]. This co-design process would need to identify the current roles and responsibilities to implement climate adaptation measures through social network analyses. Subsequently, to propose improved operation procedures, we map out the current data flow, work processes, and understandings of climate data (fuzzy cognitive maps could be an appropriate tool) [54]. Likewise, CoKLIMAx needs to identify climate parameters and spatial and temporal resolutions based on available datasets [55]. Ambitious open-data principles (FAIR) and the implementation capacities represent a crucial aspect of the co-design process. Analyzing current databases and practices between different departments and showing how Copernicus data can improve municipal tasks, a pathway for data connections and centralization, regarded as an essential characteristic of good open data policy [27], is fostered.
Thus, CoKLIMAx considers institutional structures, decision-making processes, data use norms, networks, and actor constellations responsible for relevant municipal tasks to ensure the persistence of climate knowledge and services. In addition, we align the input of climate projection data closely with these municipal structures and processes during the co-design process [48,49,56]. An extended needs assessment focused on these aspects can ensure that climate services are transferred and anchored in municipal practice practically and sustainably and thus continue to be used independently after the end of the project. A positive side effect of such a transdisciplinary work process is the capacity building for the municipal users. Similarly, outreach and education efforts should be directed towards the general public so that capacities for the interpretation and use of provided data can be enhanced [27].

4. Proposed Approach and Methods

The actual application by municipal actors has so far fallen far short of the possible and necessary scope. The following hurdles and challenges are known to be the reasons for the insufficient use of the system by municipalities:
  • It is difficult to identify the relevant datasets in each case.
  • Benefits and added value for municipal applications are not directly recognizable.
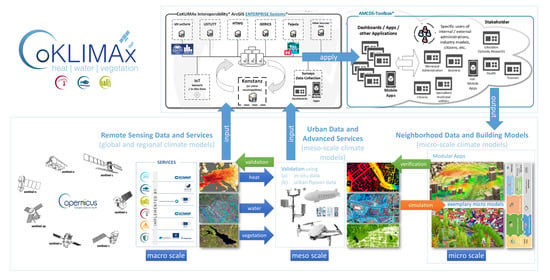
  • So far, there are no easy-to-use tools for identifying and merging different Copernicus data and processing and evaluating them (together with local data) for use in municipal planning activities. Notably, this challenge concerns linking different spatial scales (macro-, meso-, micro-scale) and integrating data on differently resolved past or forecast periods [57,58].
In this context, CoKLIMAx aims to develop the following new products and processes:
  • Practice-oriented technical tools for the determination and use of Copernicus data and services, merging with heterogeneous, locally available data sets and appropriate evaluation and preparation/presentation/visualization of output.
  • Associated technical and urban planning utilization methods, exemplified here to be implemented to increase urban climate resilience. The focus areas include water (sealing and desiccation of the soil, urban stormwater drainage design, flood control), heat (development planning, air flows, etc.), and vegetation (greening strategy and its spatial differentiation, vegetation monitoring/vitality).
  • Establish best-practice local government process structures for efficiently integrating climate and environmental data. Use technical tools and urban planning methods to carry out concrete climate resilience work of the municipality (spatial planning, environmental planning, risk management, etc.). More incentives to work collaboratively and mainstream adaptation processes are generated as the additional data and information increase efficiency for some municipal tasks.

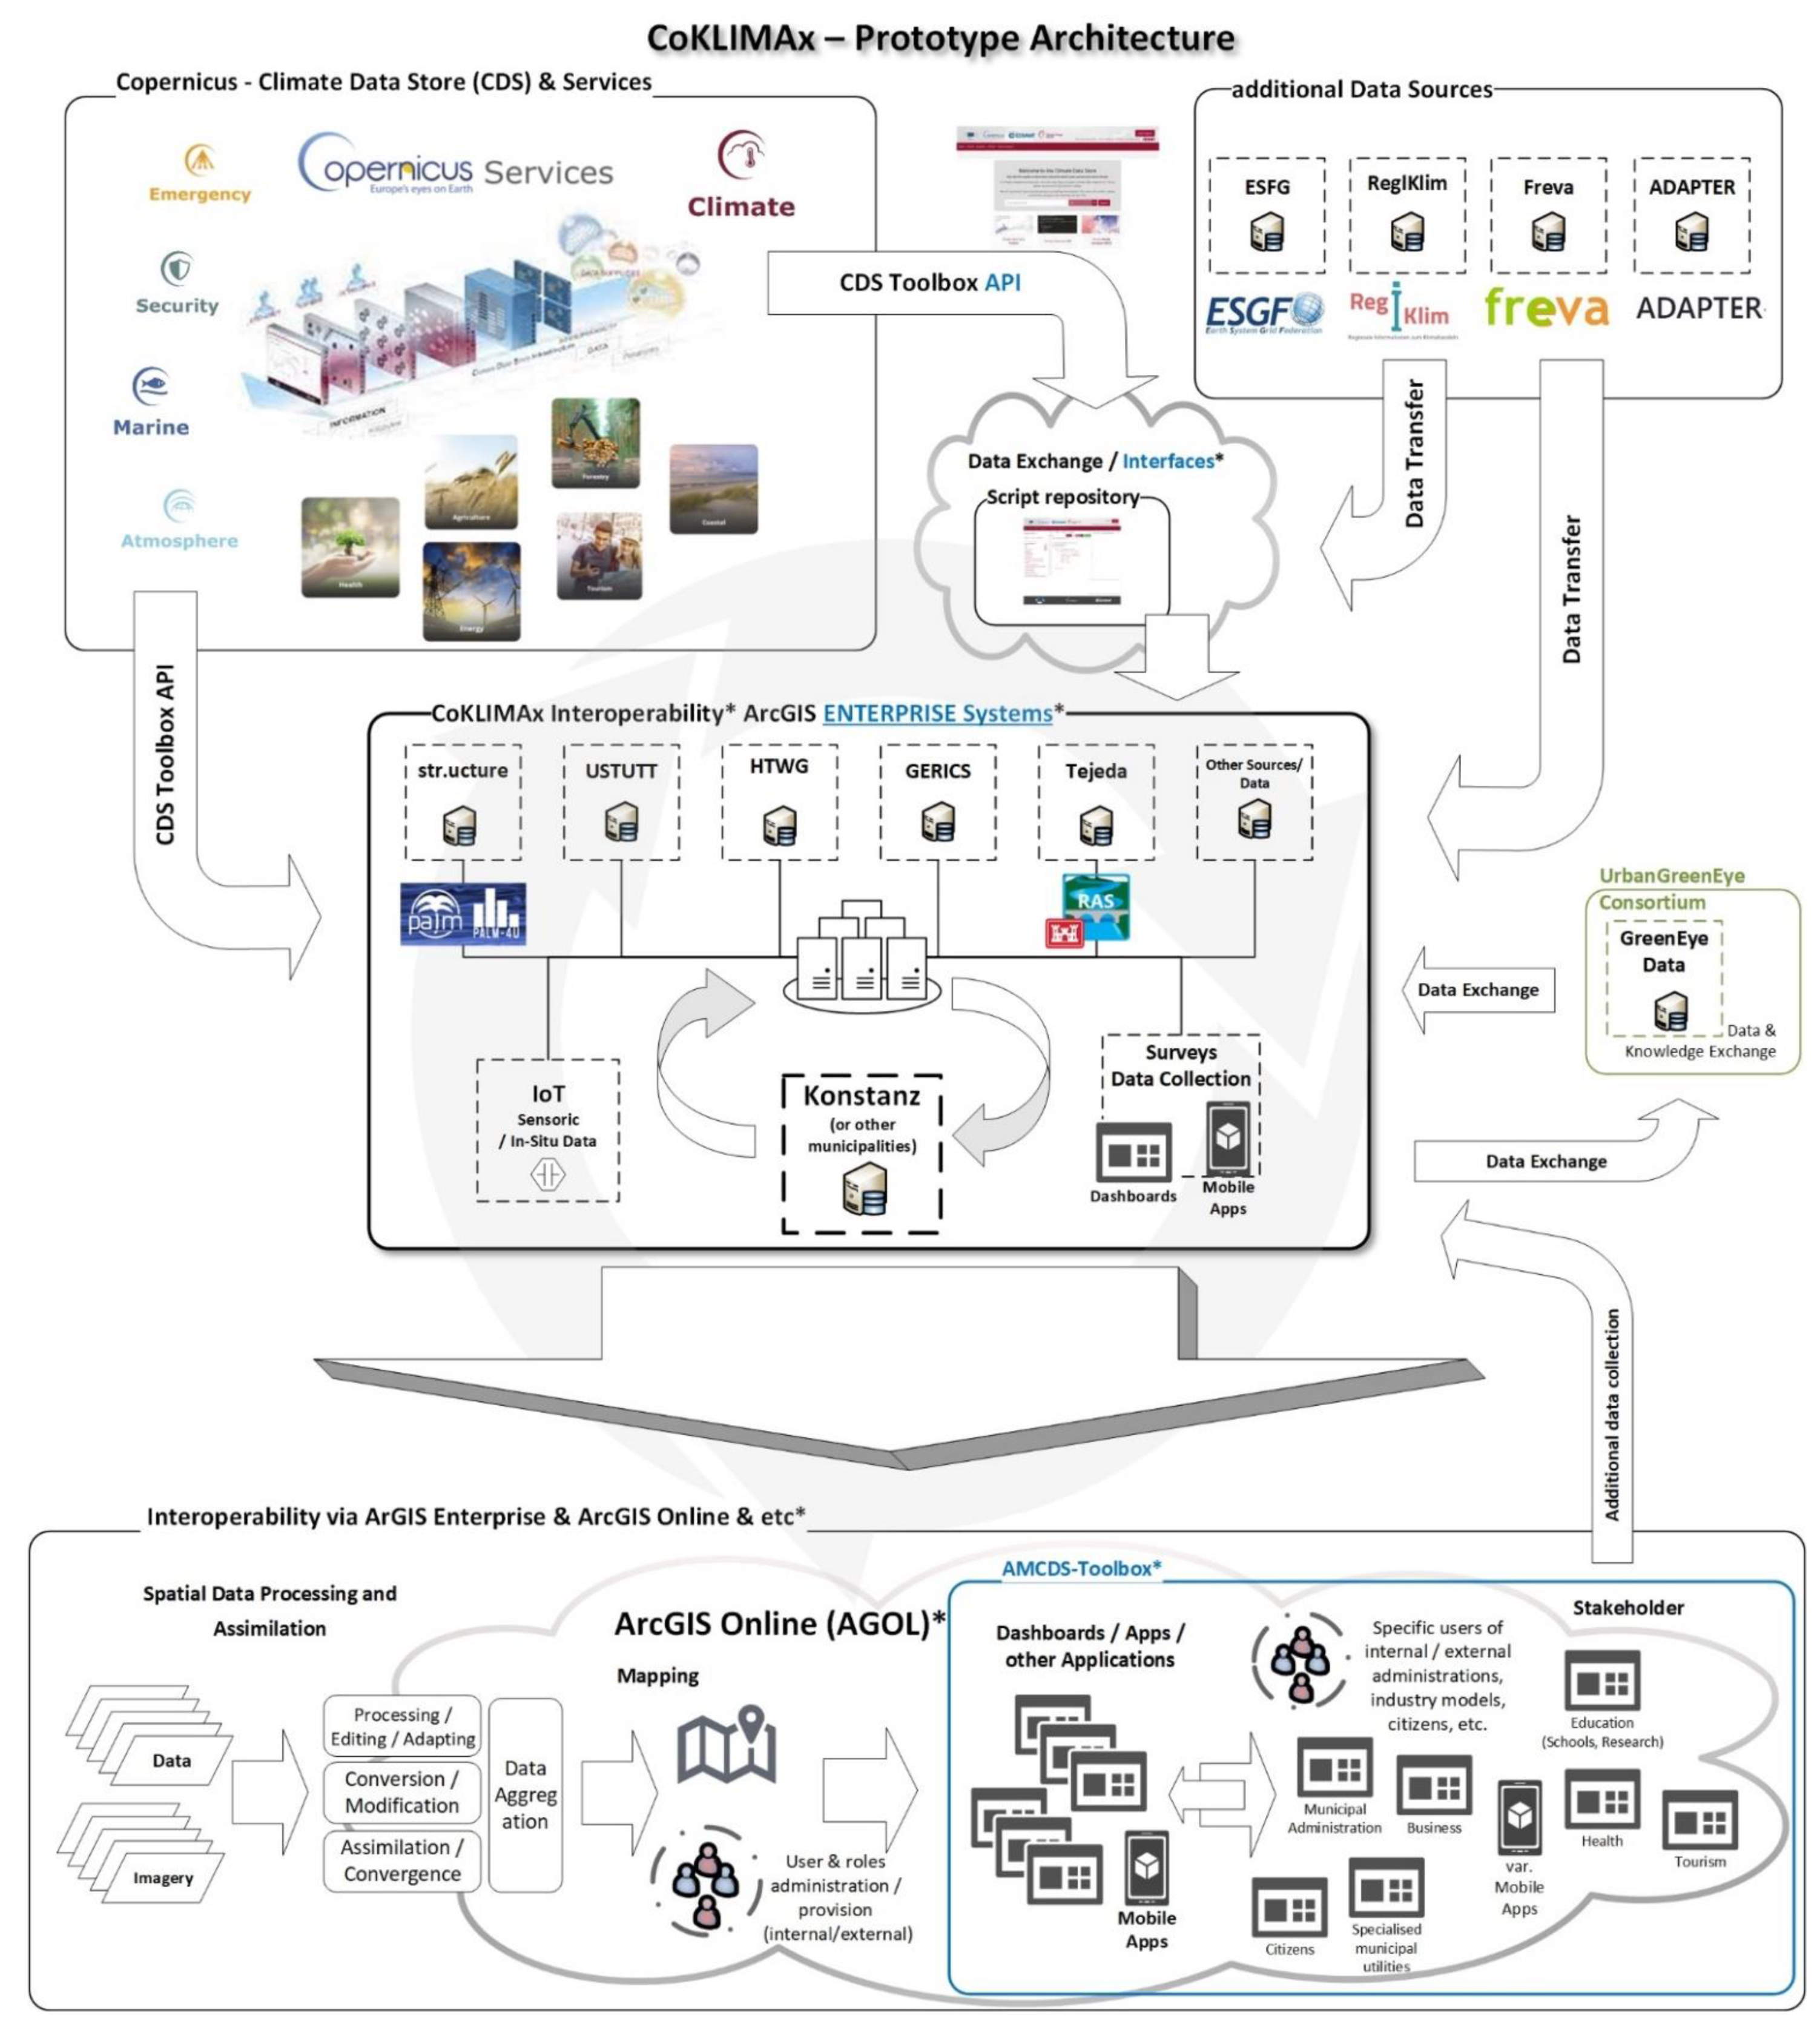
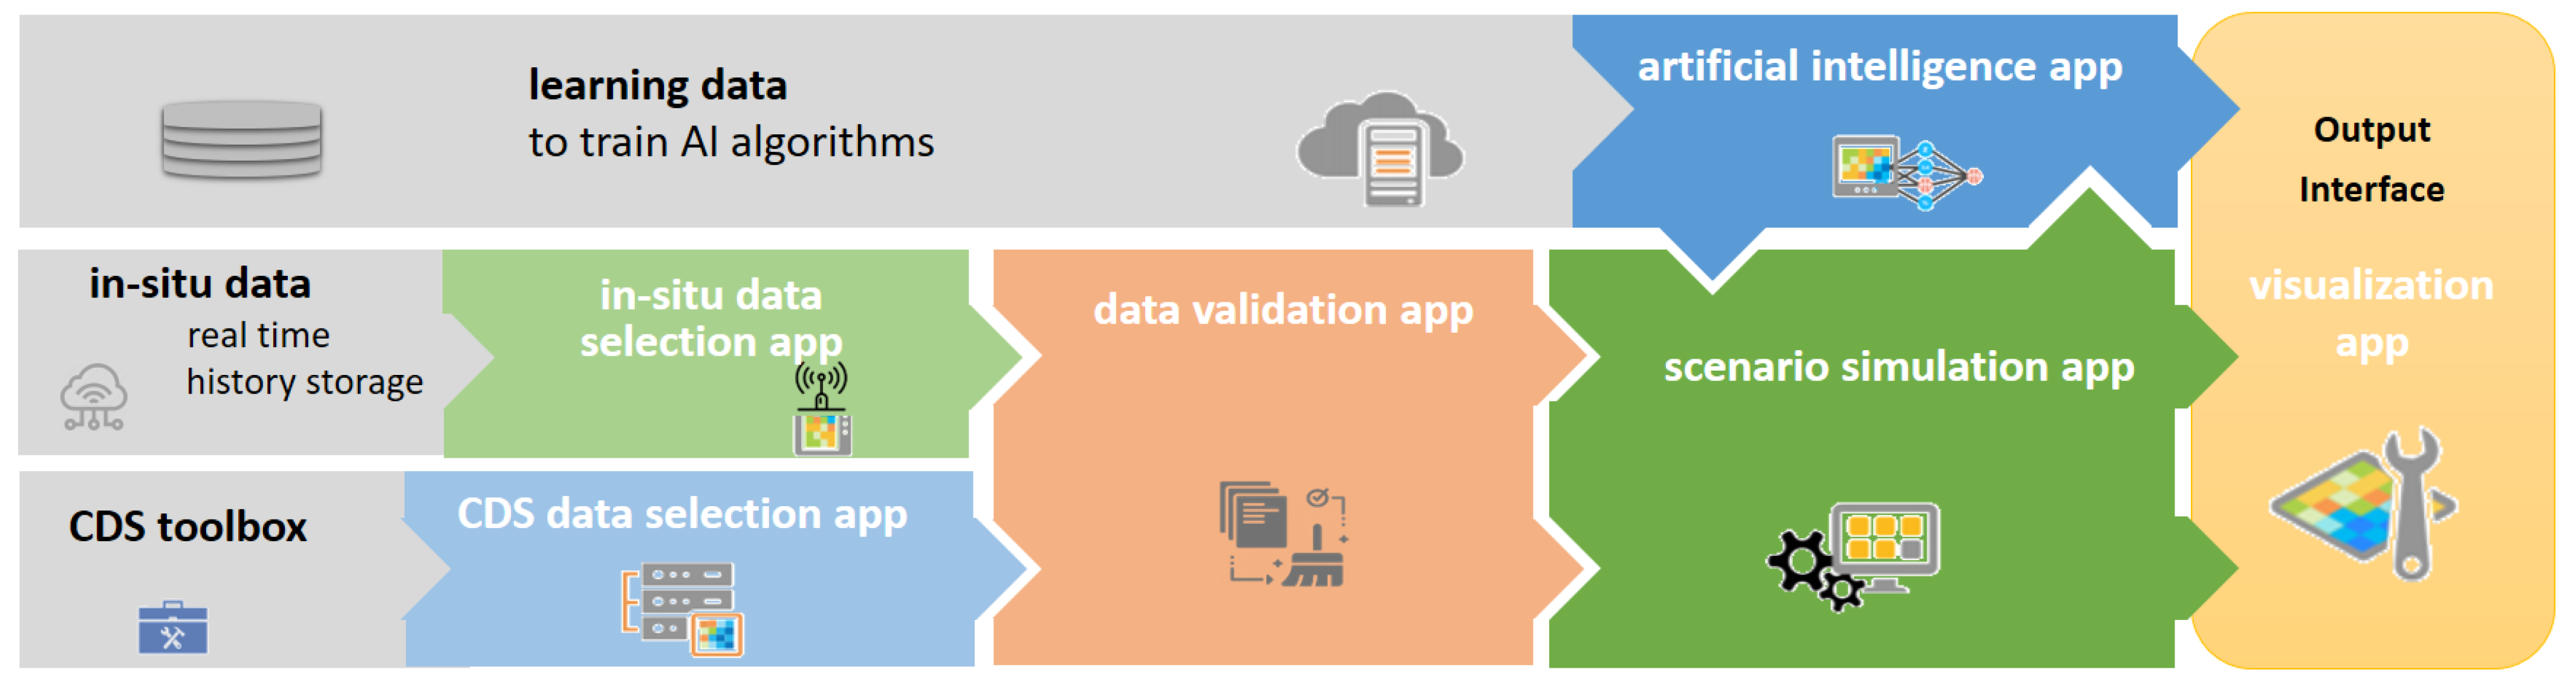
5. Advanced Municipal Climate Data Store (AMCDS Toolbox)

Within the scope of the objective, the conception, implementation, exemplary use, and practical validation of a toolbox for the combination and use of climate and environmental data of the Copernicus services with local data will be pursued (Advanced Municipal Climate Data Store: AMCDS toolbox). Regarding the data to be merged and made usable practically, the toolbox design will cover Copernicus data and services, Contributing Missions data, and local data/additional attribute data of the municipality (Figure 1).
Against the background of state of the art presented in Section 3, CoKLIMAx takes up the existing data offers as reasonable (besides access to the CDS, e.g., use of CODE-DE in categories 2 and 3). However, by researching practice-oriented solutions with a particular focus on municipal requirements and possibilities, data, services, and processing and presentation tools are not only made available specifically for the municipal context but through the interlinked research and development (R&D) work on workflows. The data, services, and processing and presentation tools are not only made available specifically for the municipal context, they are also placed in a holistic context for the first time through the interlinked R&D work on workflows, work processes, and organizational/interaction characteristics of relevant municipal administrative units and task areas, directly applied in exemplary use cases, and disseminated as a completely application-suitable overall bundle of IT tools, process concepts, and application aids through application-related best-practice documentation.
Local data will presently include in situ measurements (temperature, wind, precipitation, evapotranspiration, air pressure, humidity of local municipal and private/”crowd-sourced” weather stations) and data from the Smart Citizen Kits already widely deployed in Constance. CoKLIMAx will also use existing 3D models of the city of Constance, e.g., LoD2 GIS data, 3D mesh data from georeferenced digital orthophotos of recent overflights. In addition, we will use data from LiDAR drones for point cloud modeling that will allow the development of LoD3+ data, where required [59,60,61].
An easy-to-use AMCDS data hub complements the AMCDS toolbox. The data hub allows web browser-based searches for archived data and analyses of retrieved Copernicus data, local data, and performed merging, processing, etc. It dynamically displays them such as maps, scenes, or simulations. We will achieve the overall goals of the AMCDS toolkit by adhering to the principles of low-barrier access, including
(1)
Practical, ease-of-use, and value-adding application of Copernicus data by local communities without the need for specific professional qualifications, e.g., data scientist’s expertise;
(2)
Informed, evidence-based and real-time decision making for climate change risk and crisis management as well as data-driven improvement of the viability, sustainability, and cost-effectiveness of medium- and long-term urban infrastructure planning;
(3)
Independence of cities from external expertise procured on a case-by-case basis (i.e., autonomy of action, cost-effectiveness, and flexibility); and
(4)
Improved and expanded opportunities for citizen participation and justification/communication of planning measures and urban regulations to citizens.
We implement the application functions of the AMCDS toolbox in the form of apps, which are modularly combined through standardized interfaces. The apps cover one or a few functional steps of data localization, combination, processing, and presentation of results. We will integrate this modular function structure into the apps for self-description and ensure that only combinations that make sense can be applied, following the poka-yoke (Japanese for “mistake proving”) principle. Furthermore, the user can only put together such modular content (in each case, local checks at the corresponding combination point of function modules), resulting in technically low-threshold applicability. The above approach will ensure simple handling, assuring the data and workflows are consistent with the organizational requirements (Figure 2). As such, the module/app design is also inherently aligned with the public sector’s relevant work and administrative processes.

6. Discussion

The Lake Constance region is already struggling with the effects of climate change. In particular, extreme weather events such as heatwaves, more frequent heavy rainfall, and drought summers have intensified due to climate change and will continue to do so in the future. Heavy rain floods roads and affects traffic in the streets. The high temperatures strain humans, animals, and the environment and can cause considerable damage to the road surface [62]. The prolonged periods of heat and increasing weather extremes have resulted in people changing their leisure behavior. They prefer places with a pleasant climate. Thus, urban green spaces, trees that provide shade, sealed gravel areas, green roofs and facades, and sufficient ventilation are becoming increasingly crucial for Constance [11].
Anthropogenic climate factors increasingly shape the climate in the city of Constance. In the future, the city will use the AMCDS toolbox to plan urban development projects to compare different planning scenarios. By running the various design alternatives, city planners can swiftly determine the optimal size and location of the development. One key design objective will be to ensure sufficient ventilation in Constance and thus foster bioclimatic and air-hygienic advantages [11].
In addition to climatically favorable development, trees can significantly improve the urban climate by providing shade and reducing CO2 emissions. The city of Constance has already digitally recorded the city’s tree population, visualized it in a 3D model, and made it available on the open data platform as a 3D tree cadaster. The city can apply the proposed solution to map the respective CO2 values of trees or entire city districts. The AMCDS toolbox can support the simulation of the impact of air quality caused by different tree species. In detail, the city can use the toolbox to determine which tree species are best suited for additional planting in the city. The consequences of climate change also include flooding and inundation as a result of heavy rainfall. By simulating and visualizing heavy rain and flood events with the help of the CoKLIMAx initiative, the city can identify flood-prone areas and make detailed damage forecasts. Thus, it can change or cancel existing land use and development plans. In addition, city management can take preventive, protective measures when the plans are drawn up, thus preventing new risks from flooding. In addition, the simulations provide information on whether the city’s drainage system is designed adequately. The flood visualizations can be made available to the citizens of Constance in the form of a digital hazard map. Thus, citizens can inform themselves about the flood risk of their building and, if necessary, take appropriate protective measures. Minimizing risks and damages caused by floods, dealing with them, and ensuring the safety of citizens are the responsibility of many urban stakeholders. These include, for example, urban and structural planners, architects, climatologists and geoscientists, security forces, and insurers. All actors are equally interested in preventing flood damage and the management and aftercare of flood events. With the simulation of heavy rainfall events and floods, we can create a typical level of knowledge and transparent understanding for all stakeholders. Thus, the AMCDS toolbox serves as a collaborative tool for crisis management [11,25].
We will need comprehensive datasets to build realistic simulations of climate scenarios. In the context of sustainable and climate-friendly urban planning, satellite data have gained importance, especially in recent years. With its European Earth observation program Copernicus, ESA9 makes climate data freely and openly available on a cloud-based platform (cf. [63]). By linking this satellite data to its digital twin, the city of Constance can use the analyses to obtain detailed and meaningful results. However, the enormous amount of data provided makes it difficult to filter out relevant data. Therefore, suitable methods are needed to identify the appropriate climate data.
For this reason, the city of Constance submitted a project outline to the German Space Agency (Deutsches Zentrum für Luft- und Raumfahrt e.V., DLR) in March 2021 to present a project idea. With the project CoKLIMAx, the city envisions developing practical tools that will aid other municipalities. These tools should enable easy handling for data collection from the Copernicus program and the meaningful use and processing of these data. In addition, the tools are to be made freely and openly available to other municipalities in a digital toolbox on municipal GIS platforms. We will orient the implementation of the methods of use to the climate needs of the city of Constance. With the project CoKLIMAx, the city of Constance would create a new opportunity to share its know-how nationwide. In this way, cities do not have to find their solution but can successfully implement their climate-resilient urban planning through best practices. Constance can act as an impulse generator for other towns to facilitate their path to a sustainable and future-proof city [11].
The implementation will be exemplary based on the concrete local needs of the city of Constance in the focus areas as mentioned earlier. Relevant data and products will be developed for concrete applications in these areas and implemented, applied, and validated in a practice-oriented manner.
Regarding the intended urban planning utilization methods and process structures, CoKLIMAx aims to specify practical work and administrative processes and their exemplary implementation to illustrate the added value and potential benefits for municipal applications.
There are far-reaching synergy potentials between the data processing and technical software objectives on the one hand and the work, planning, and administration process-related research work on the other hand. The CoKLIMAx team will leverage these synergies by closely interlocking the associated solution approaches, work planning, and consortia cooperation. In this way, we will develop technically efficient products and services whose practical applicability and actual use are directly guaranteed and demonstrated in an exemplary manner.
The three use cases and focus areas of water, heat, and vegetation will serve as action-guiding, cross-questioning, and result-integrating “application dimensions” based on which both the data requirements and data processing, evaluation, and presentation functions as well as the municipal tasks, the resulting work processes, information chains, and administrative working methods will be examined and illustrated.
Beyond the project’s scope, these practical application axes established in the use cases also serve as leitmotifs and content-related technical basis for implementing and expanding the lighthouse effect of the project and nationwide dissemination of the results approaching further user partners and users [11].

7. Limitations, Project Risks, Schedule, and Project Funding

Challenges regarding data compatibility (formats, meta-information, data structure, spatial and temporal resolution, allocation, etc.) are difficult to assess in advance—especially given the diversity of relevant geospatial and environmental data, particularly the use of local data and data from different sources. Some data sources are not standardized, such as smart citizen kits or online portals like luftdaten.info, which should be made available performant and automated.
To achieve the intended, fully comprehensive overall objective and utilization perspective of CoKLIMAx, many different data portals, and sources will be relevant in addition to Copernicus data and services. Likewise, municipalities and possibly relevant governmental institutions usually have their own data structures and processes. Suppose this risk occurs in the form of technical challenges that we cannot overcome with reasonable effort; we will limit the scope of functionality concerning data from third-party systems. The central core of the technology envisaged here should be implementable independently of this.
Interface requirements are challenging to assess in advance. Any restrictions on software implementation options due to the relatively long useful life of IT hardware, operating systems, and any relevant third-party/legacy systems in the municipal context, e.g., backward compatibility. If this risk arises in technical challenges that we cannot overcome or at least with reasonable effort, the functional requirements can be restricted. The central core of the technology envisaged here should be implementable independently.
Risks exist regarding implementing the IT tools as app-based function modules (AMCDS toolbox): The envisaged function modules might not map the overall required functionality. Thus, there is a risk of not being able to achieve a modular functional breakdown. This risk primarily occurs due to the operational complexity required for high-performance Copernicus data utilization. The degree of complexity depends on proper interaction mechanisms of the software modules, e.g., synchronous/asynchronous communication and hierarchical management requirements of the modules’ access to shared resources and functions. Therefore, if necessary, we might restrict the modular approach at the expense of the flexibility and scope of the modular function breakdown to mitigate implementation risks. In this case, we will not change the basic functional scope, and only limited, more precisely defined variations would be made variably configurable by way of app-based combination.
Organizational risks arise, for example, due to possible obstacles in the integration of municipal shells due to rigid administrative–bureaucratic structures, possibly obstructive organizational inertia, and, under certain circumstances, limited availability of motivated/interested and temporally available specialists and users in the city administration apart from the directly scheduled project team. To minimize organizational risks, the city of Constance plans to communicate and present the benefits clearly and prudently, both within the administration and to the relevant partners and project partners. At the same time, coordination with and scheduling of third parties with as much lead time as possible is expressly planned, as well as comparatively long but more overlapping scheduling of the individual focal points/work packages in the project, which will provide additional flexibility.
CoKLIMAx will be funded with about one million euros and run for 32 months, starting in November 2021. We are already planning follow-up projects enabling industry participation. CoKLIMAx will perfectly complement the smart green city strategy of Constance. The city recently won the Federal Ministry of the Interior’s “Smart City Model Project” funding competition in this context. The initiative with the slogan “Constance in transition—networked & climate-neutral” will be funded with a total of 17.5 million euros [64].

8. Conclusions and Summary

The Lake Constance region is already struggling with the effects of climate change. In particular, climate change will exacerbate extreme weather events such as heatwaves, more frequent heavy rainfall events, and drought summers which will become even more severe in the future. The city of Constance is also affected, so that the topic of flood and inundation protection is becoming increasingly important. Therefore, suitable methods are needed to determine the relevant climate data. A differentiated knowledge of the environmental–climatic parameters and their expected changes is of utmost importance for sensible economic and urban planning and the implementation of suitable measures to minimize climate-related impairments and hazards.
Specific climate adaptation and resilience measures can be efficiently designed and implemented at regional and local levels. Climate and environmental databases are critical for achieving sustainable development goals and for efficient planning and implementation of appropriate climate actions: Available federated databases can serve as necessary starting points for municipalities to identify needs, set priorities, and allocate investments, considering often scarce budgetary resources. Copernicus services will be critical to these efforts. There are forward-looking approaches to using these datasets and deriving forecasts to optimize urban processes for city governments. Therefore, our project CoKLIMAx aims to develop new digital products, advanced urban services, and processes, such as developing practical technical tools that capture various remote sensing and in situ datasets for validation and further processing. CoKLIMAx aims to establish a scalable toolbox for urban planning to increase climate resilience in the areas of water, urban climate, and vegetation. As the scientific community expects that climate change will significantly intensify in the future, timely climate adaptation in cities is essential. In particular, thermal protection measures are needed to counteract local overheating and maintain the quality of life in the city. A virtual representation that acts as a real-time digital counterpart of the physical city, called the digital twin, can simulate a city’s cooling energy demand and evaluate “what-if” scenarios. The digital urban twin can be used to simulate future development scenarios transparently and understandably. Considering various planning specifications and parameters linked to geospatial data, scenarios of possible building uses and their effects can be calculated and compared.

Author Contributions

Conceptualization, writing, proposal concept, original draft preparation, review, editing, visualization, funding acquisition: M.M.B.; Software, conceptualization, remote sensing, tool development, geodetic validation, writing, proposal concept, original draft preparation, writing, visualization, funding acquisition: C.S.; Investigation, climate analysis, data provision, CDS curation: D.R.; Project administration, consortium coordination, methodology and municipal perspective: E.B.; Formal analysis, engineering, urban resilience analysis: A.M.; Methodology, engineering, urban resilience analysis; Ph.D. supervision and resources: B.R.; Resources, Ph.D. supervision and resources: K.N.; Investigation, remote sensing, tool development, geodetic validation: M.M.; Supervision, review and editing, remote sensing, tool development, geodetic validation: V.S.; Writing—original draft, literature review, climate analysis, data provision, CDS curation: J.-A.H.; Supervision, review and editing, Ph.D. supervision and resources: D.J.; Writing—review and editing, conceptualization, proposal concept, original draft preparation/writing: L.K.; Formal analysis; GIS software and technology, investigation: G.i.h.P.; Engineering, urban resilience analysis: R.C.R.T.; Methodology, engineering, urban resilience analysis: M.H.; Writing—review and editing, GIS software and technology: G.B. All authors have read and agreed to the published version of the manuscript.

Funding

This research received no external funding to date. A scientific grant application on “Development and implementation preparation of Copernicus services for public needs on climate adaptation strategies for municipal applications in Germany” was submitted to the Federal Ministry of Economics and Technology (Bundesministerium für Wirtschaft und Technologie, BMWi) on 30 June 2021. The open-access publication was funded by the Ministry of Science, Research and the Arts Baden-Württemberg (Ministerium für Wissenschaft, Forschung und Kunst Baden-Württemberg).

Institutional Review Board Statement

Not applicable.

Informed Consent Statement

Not applicable.

Data Availability Statement

Not applicable.

Conflicts of Interest

The authors declare no conflict of interest.

References

  1. Ritchie, H.; Roser, M. Urbanization. Published online at OurWorldInData.org. 2018. Available online: https://ourworldindata.org/urbanization (accessed on 9 July 2021).
  2. Di Napoli, C.; Pappenberger, F.; Cloke, H.L. Assessing heat-related health risk in Europe via the Universal Thermal Climate Index (UTCI). Int. J. Biometeorol. 2018, 62, 1155–1165. [Google Scholar] [CrossRef] [PubMed] [Green Version]
  3. Pyrgou, A.; Santamouris, M. Increasing probability of heat-related mortality in a Mediterranean city due to urban warming. Int. J. Environ. Res. Public Health 2018, 15, 1571. [Google Scholar] [CrossRef] [Green Version]
  4. Jandaghian, Z.; Akbari, H. The effects of increasing surface reflectivity on heat-related mortality in Greater Montreal Area, Canada. Urban Clim. 2018, 25, 135–151. [Google Scholar] [CrossRef]
  5. Hatvani-Kovacs, G.; Bush, J.; Sharifi, E.; Boland, J. Policy recommendations to increase urban heat stress resilience. Urban Clim. 2018, 25, 51–63. [Google Scholar] [CrossRef]
  6. Coumou, D.; Rahmstorf, S. A decade of weather extremes. Nat. Clim. Chang. 2012, 2, 491–496. [Google Scholar] [CrossRef]
  7. Baker, J.L. Climate Change, Disaster Risk, and the Urban Poor: Cities Building Resilience for a Changing World; World Bank Publications: Washington, DC, USA, 2012. [Google Scholar]
  8. Shakou, L.M.; Wybo, J.L.; Reniers, G.; Boustras, G. Developing an innovative framework for enhancing the resilience of critical infrastructure to climate change. Saf. Sci. 2019, 118, 364–378. [Google Scholar] [CrossRef]
  9. Frame, D.J.; Rosier, S.M.; Noy, I.; Harrington, L.J.; Carey-Smith, T.; Sparrow, S.N.; Stone, D.A.; Dean, S.M. Climate change attribution and the economic costs of extreme weather events: A study on damages from extreme rainfall and drought. Clim. Chang. 2020, 162, 781–797. [Google Scholar] [CrossRef]
  10. Eyink, H.; Heck, B.; Dosch, F.; Haury, S.; Skowski, J.; Wahler, B. Grün in der Stadt−Für Eine Lebenswerte Zukunft. Grünbuch Stadtgrün, in Grün in der Stadt-Für Eine Lebenswerte Zukunft; N. Bundesministerium für Umwelt, Bau und Reaktorsicherheit (BMUB); Referat Öffentlichkeitsarbeit: Berlin, Germany, 2015; Available online: https://www.bbsr.bund.de/BBSR/DE/veroeffentlichungen/ministerien/bmub/verschiedene-themen/2015/gruenbuch-2015-dl.pdf (accessed on 9 July 2021).
  11. Krüger, J. Entwicklung von Anwendungsfällen aus dem Bereich Bauwirtschaft für offene, föderierte digitale Plattformen (Development of use cases from the construction industry for open, federated digital platforms). In Department of Civil Engineering; University of Applied Sciences Konstanz (HTWG): Konstanz, Germany, 2021; p. 152. [Google Scholar]
  12. Ferguson, C.; Andandarajah, G.; Butnar, I.; Calzadilla, A.; Dessens, O. Costing the Earth-Climate Damage Cost and GDP: A Summary of the Report Produced by UCL Energy Institute for CDP. 2020. Available online: https://www.cdp.net/en/research/global-reports/costing-the-earth (accessed on 9 July 2021).
  13. Nitsch, J.; Pregger, T.; Naegler, T.; Heide, D.; Luca de Tena, D.; Trieb, F.; Scholz, Y.; Nienhaus, K.; Gerhardt, N.; Sterner, M.; et al. Langfristszenarien und Strategien Für den Ausbau der Erneuerbaren Energien in Deutschland bei Berücksichtigung der Entwicklung in Europa und Global (Long-Term Scenarios and Strategies for the Expansion of Renewable Energies in Germany, Taking into Account Developments in Europe and Globally); DLR Berichtsreihe: Stuttgart, Germany, 2012. [Google Scholar]
  14. Hirschfeld, J.; Pissarskoi, E.; Schulze, S.; Stöver, J. Kosten des Klimawandels und der Anpassung an den Klimawandel aus vier Perspektiven (Costs of climate change and adaptation from four perspectives). In Background Paper on the 1st Climate Economics Forum; Hamburgisches Weltwirtschaftsinstitut: Hamburg, Germany, 2015. [Google Scholar]
  15. Chu, E.; Anguelovski, I.; Carmin, J. Inclusive approaches to urban climate adaptation planning and implementation in the Global South. Clim. Policy 2016, 16, 372–392. [Google Scholar] [CrossRef] [Green Version]
  16. Basel Committee on Banking Supervision (BCBS). Climate-Related Risk Drivers and their Transmission Channels; Report; Bank for International Settlements (BIS): Basel, Switzerland, 2021; Available online: https://www.bis.org/bcbs/publ/d517.pdf (accessed on 9 July 2021).
  17. Basel Committee on Banking Supervision (BCBS). Climate-Related Financial Risks–Measurement Methodologies; Report; Bank for International Settlements (BIS): Basel, Switzerland, 2021; Available online: https://www.bis.org/bcbs/publ/d518.pdf (accessed on 9 July 2021).
  18. The Ever Growing Use of Copernicus Across Europe’s Regions-A Selection of 99 User Stories by Local and Regional Authorities. 2018. Available online: https://esamultimedia.esa.int/docs/EarthObservation/copernicus4regions_2018.pdf (accessed on 30 August 2021).
  19. Cogato, A.; Meggio, F.; De Antoni Migliorati, M.; Marinello, F. Extreme Weather Events in Agriculture: A Systematic Review. Sustainability 2019, 11, 2547. [Google Scholar] [CrossRef] [Green Version]
  20. Swiss Academy of Sciences (SCNAT). «Digitale Zwillinge» Unterstützen die Planung. In Scnat Network; The Swiss Academy of Sciences (SCNAT), Ed.; 2021; Available online: https://scnat.ch/en/uuid/i/a78523ec-7b42-51c0-b5e8-09081bad0e65-%C2%ABDigitale_Zwillinge%C2%BB_unterst%C3%BCtzen_die_Planung (accessed on 9 July 2021).
  21. Schrotter, G.; Hürzeler, C. The digital twin of the city of Zurich for urban planning. PFG J. Photogramm. Remote Sens. Geoinf. Sci. 2020, 88, 99–112. [Google Scholar] [CrossRef] [Green Version]
  22. StBE. Überflungsgefahrenkarten Köln (Flood Hazard Maps Cologne). 2021. Available online: https://www.steb-koeln.de/hochwasser-und-ueberflutungsschutz/akutes-hochwasser/ueberflutungsgefahrenkarten/ueberflutungsgefahrenkarten.jsp (accessed on 1 September 2021).
  23. Kreienkamp, F. Rapid Attribution of Heavy Rainfall Events Leading to the Severe Flooding in Western Europe during July 2021; Environmental Change Institute, University of Oxford: Oxford, UK, 2021. [Google Scholar]
  24. Jüpner, R.; Kathmann, M.; Müller, U.; Patt, H. Hochwasser-Handbuch: Auswirkungen und Schutz; Springer: Berlin, Germany, 2020; p. 341. [Google Scholar]
  25. Ziehm, H. Hochwasser-Management: Was ist zu tun, wenn der Pegel Steigt? (Flood Management: What to do When the Water Level Rises?). In Where Next; Esri Deutschland GmbH: Kranzberg, Germany, 2021; Available online: https://wherenext.esri.de/hochwasser-management/ (accessed on 9 July 2021).
  26. Mankowski, R. Digitale Zwillinge auf Städteebene für Hochwasserbeständigkeit. In GEObranchen Geobusiness & Geowissenschaft; 2021; Available online: https://www.geobranchen.de/mediathek/geonews/item/digitale-zwillinge-auf-st%C3%A4dteebene-f%C3%BCr-hochwasserbest%C3%A4ndigkeit (accessed on 9 July 2021).
  27. Mak, H.W.L.; Lam, Y.F. Comparative assessments and insights of data openness of 50 smart cities in air quality aspects. Sustain. Cities Soc. 2021, 69, 102868. [Google Scholar] [CrossRef]
  28. Raoult, B.; Bergeron, C.; Alós, A.L.; Thépaut, J.N.; Dee, D. Climate service develops user-friendly data store. ECMWF Newsl. 2017, 151, 22–27. [Google Scholar]
  29. Buontempo, C.; Hutjes, R.; Beavis, P.; Berckmans, J.; Cagnazzo, C.; Vamborg, F.; Thépaut, J.N.; Bergeron, C.; Almond, S.; Amici, A.; et al. Fostering the development of climate services through Copernicus Climate Change Service (C3S) for agriculture applications. Weather. Clim. Extrem. 2020, 27, 100226. [Google Scholar] [CrossRef]
  30. ESRI. Esri Products. 2021. Available online: https://www.esri.com/en-us/arcgis/products/ (accessed on 1 September 2021).
  31. Fotheringham, A.S.; Brunsdon, C.; Charlton, M. Quantitative Geography: Perspectives on Spatial Data Analysis; Sage: London, UK, 2000. [Google Scholar]
  32. ESRI. Spatial Analysis and Data Science: Analysis with The Science of Where. 2021. Available online: https://www.esri.com/en-us/arcgis/products/spatial-analytics-data-science/overview (accessed on 1 September 2021).
  33. Nübel, K.; Bühler, M.M.; Jelinek, T. Federated Digital Platforms: Value Chain Integration for Sustainable Infrastructure Planning and Delivery. Sustainability 2021, 13, 8996. [Google Scholar] [CrossRef]
  34. Jacob, D.; Teichmann, C.; Sobolowski, S.; Katragkou, E.; Anders, I.; Belda, M.; Benestad, R.; Boberg, F.; Buonomo, E.; Cardoso, R.M.; et al. Regional climate downscaling over Europe: Perspectives from the EURO-CORDEX community. Reg. Environ. Chang. 2020, 20, 1–20. [Google Scholar] [CrossRef]
  35. Jacob, D.; Petersen, J.; Eggert, B.; Alias, A.; Christensen, O.B.; Bouwer, L.M.; Braun, A.; Colette, A.; Déqué, M.; Georgievski, G.; et al. EURO-CORDEX: New high-resolution climate change projections for European impact research. Reg. Environ. Chang. 2014, 14, 563–578. [Google Scholar] [CrossRef]
  36. Taylor, K.E.; Stouffer, R.J.; Meehl, G.A. An overview of CMIP5 and the experiment design. Bull. Am. Meteorol. Soc. 2012, 93, 485–498. [Google Scholar] [CrossRef] [Green Version]
  37. Hemri, S.; Bhend, J.; Manzanas, R.; Gutiérrez, J.M.; Manubens, N.; Hunter, A.; Soares, M.B.; Bedia, J.; Martín, D.S.; Siegert, S.; et al. Evaluation and quality control for seasonal forecasts of the Copernicus Climate Change Service. In Geophysical Research Abstracts; European Geosciences Union (EGU): Vienna, Austria, 2019; Volume 21. [Google Scholar]
  38. Hewitt, C.D.; Lowe, J.A. Toward a European Climate Prediction System. Bull. Am. Meteorol. Soc. 2018, 99, 1997–2001. [Google Scholar] [CrossRef]
  39. Oses, N.; Azpiroz, I.; Marchi, S.; Guidotti, D.; Quartulli, M.; GOlaizola, I. Analysis of Copernicus’ ERA5 Climate Reanalysis Data as a Replacement for Weather Station Temperature Measurements in Machine Learning Models for Olive Phenology Phase Prediction. Sensors 2020, 20, 6381. [Google Scholar] [CrossRef]
  40. Benveniste, J.; Mandea, M.; Melet, A.; Ferrier, P. Earth Observations for Coastal Hazards Monitoring and International Services: A European Perspective. Surv. Geophys. 2020, 41, 1185–1208. [Google Scholar] [CrossRef]
  41. Kettle, N.P.; Walsh, J.E.; Heaney, L.; Thoman, R.L.; Redilla, K.; Carroll, L. Integrating archival analysis, observational data, and climate projections to assess extreme event impacts in Alaska. Clim. Chang. 2020, 163, 669–687. [Google Scholar] [CrossRef]
  42. Kundzewicz, Z.W.; Su, B.; Wang, Y.; Wang, G.; Wang, G.; Huang, J.; Jiang, T. Flood risk in a range of spatial perspectives–from global to local scales. Nat. Hazards Earth Syst. Sci. 2019, 19, 1319–1328. [Google Scholar] [CrossRef] [Green Version]
  43. Vitolo, C.; Di Giuseppe, F.; Barnard, C.; Coughlan, R.; San-Miguel-Ayanz, J.; Libertá, G.; Krzeminski, B. ERA5-based global meteorological wildfire danger maps. Sci. Data 2020, 7, 1–11. [Google Scholar] [CrossRef]
  44. Hoffmann, E.; Rupp, J.; Sander, K. What do users expect from climate adaptation services? Developing an information platform based on user surveys. In Handbook of Climate Services; Springer: Berlin, Germany, 2020; pp. 105–134. [Google Scholar]
  45. Leal Filho, W.; Jacob, D. Handbook of Climate Services; Springer: Berlin, Germany, 2020. [Google Scholar]
  46. Lemos, M.C.; Kirchhoff, C.J.; Ramprasad, V. Narrowing the climate information usability gap. Nat. Clim. Chang. 2012, 2, 789–794. [Google Scholar] [CrossRef]
  47. Daniels, E.; Bharwani, S.; Butterfield, R. The Tandem Framework: A Holistic Approach to Co-Designing Climate Services; Stockholm Environment Institute: Stockholm, Sweden, 2019. [Google Scholar]
  48. Jones, L.; Champalle, C.; Chesterman, S.; Cramer, L.; Crane, T.A. Constraining and enabling factors to using long-term climate information in decision-making. Clim. Policy 2017, 17, 551–572. [Google Scholar] [CrossRef]
  49. Flagg, J.A.; Kirchhoff, C.J. Context matters: Context-related drivers of and barriers to climate information use. Clim. Risk Manag. 2018, 20, 1–10. [Google Scholar] [CrossRef]
  50. Valeriano, O.C.S.; Koike, T.; Yang, D.; Nyunt, C.T.; Van Khanh, D.; Chau, N.L. Flood simulation using different sources of rainfall in the Huong River, Vietnam/Simulation d’inondation à l’aide de différentes sources d’information pluviométrique dans le bassin de la Rivière Huong, Vietnam. Hydrol. Sci. J. 2009, 54, 909–917. [Google Scholar] [CrossRef] [Green Version]
  51. Wang, X.; Li, B.; Chen, Y.; Guo, H.; Wang, Y.; Lian, L. Applicability Evaluation of Multisource Satellite Precipitation Data for Hydrological Research in Arid Mountainous Areas. Remote Sens. 2020, 12, 2886. [Google Scholar] [CrossRef]
  52. Hackenbruch, J.; Kunz-Plapp, T.; Müller, S.; Schipper, J.W. Tailoring Climate Parameters to Information Needs for Local Adaptation to Climate Change. Climate 2017, 5, 25. [Google Scholar] [CrossRef] [Green Version]
  53. Webb, R.; Rissik, D.; Petheram, L.; Beh, J.L.; Smith, M.S. Co-designing adaptation decision support: Meeting common and differentiated needs. Clim. Chang. 2019, 153, 569–585. [Google Scholar] [CrossRef] [Green Version]
  54. Giordano, R.; Pilli-Sihvola, K.; Pluchinotta, I.; Matarrese, R.; Perrels, A. Urban adaptation to climate change: Climate services for supporting collaborative planning. Clim. Serv. 2020, 17, 100100. [Google Scholar] [CrossRef]
  55. Groth, M.; Nuzum, A.-K. Informations- und Unterstützungsbedarf von Kommunen zur Anpassung an die Folgen des Klimawandels; GERICS: Hamburg, Germany, 2016. [Google Scholar]
  56. Street, R.B.; Pringle, P.; Lourenço, T.C.; Nicolletti, M. Transferability of decision-support tools. Clim. Chang. 2019, 153, 523–538. [Google Scholar] [CrossRef] [Green Version]
  57. Gidhagen, L.; Olsson, J.; Amorim, J.H.; Asker, C.; Belusic, D.; Carvalho, A.C.; Engardt, M.; Hundecha, Y.; Körnich, H.; Lind, P.; et al. Towards climate services for European cities: Lessons learnt from the Copernicus project Urban SIS. Urban Clim. 2020, 31, 100549. [Google Scholar] [CrossRef]
  58. Jagaille, M.; Bellec, N.; Garello, R. Regional Copernicus: Foster End Users Uptake By Co-Designing Regional EO-Based Products and Services. An Example with Local and Regional Authorities (LRAs) in Brittany; IEEE: Piscataway, NJ, USA, 2019. [Google Scholar]
  59. Kwak, E. Automatic 3D Building Model Generation by Integrating LiDAR and Aerial Images Using a Hybrid Approach. Ph.D. Thesis, University of Calgary, Calgary, AB, Canada, 2013. [Google Scholar]
  60. Girindran, R.; Boyd, D.S.; Rosser, J.; Vijayan, D.; Long, G.; Robinson, D. On the reliable generation of 3D city models from open data. Urban Sci. 2020, 4, 47. [Google Scholar] [CrossRef]
  61. Toschi, I.; Ramos, M.M.; Nocerino, E.; Menna, F.; Remondino, F.; Moe, K.; Poli, D.; Legat, K.; Fassi, F. Oblique photogrammetry supporting 3D urban reconstruction of complex scenarios. Int. Arch. Photogramm. Remote Sens. Spatial Inf. Sci. 2017, 42, 519–526. [Google Scholar] [CrossRef] [Green Version]
  62. Landesanstalt für Umwelt Baden-Württemberg (LUBW). Klimawandel Betrifft Alle. Klimawandel und Anpassung (Climate Change Affects All. Climate Change and Adaptation). 2021. Available online: https://www.lubw.baden-wuerttemberg.de/klimawandel-und-anpassung (accessed on 17 July 2021).
  63. The European Space Agency (ESA). Das Erdbeobactungsprogramm der ESA (The ESA Earth Observation Programme). Available online: https://www.esa.int/ (accessed on 9 July 2021).
  64. City of Konstanz Website. “Der Weg zur Smart Green City” (The path to the Smart Green City). 2021. Available online: https://www.konstanz.de/digital/digitales+konstanz/digitalstrategie/der+weg+zur+smart+green+city (accessed on 7 August 2021).
Figure 1. Data sources, data streams, and data processing functionalities in the present application context, including the AMCDS toolbox (highlighted in blue). Please note that the figure depicts exemplary commercial software applications (*), however, CoKLIMAx will also utilize and apply open-source software to complement the described components.
Remotesensing 13 03634 g001
Figure 2. Schematic representation of the intended design of intuitively usable, modular apps (basic function modules). CoKLIMAx flexibly combines data and evaluation tasks in a module-like manner (based on the basic functionalities and scope of services of the AMCDS toolbox).
Remotesensing 13 03634 g002
Publisher’s Note: MDPI stays neutral with regard to jurisdictional claims in published maps and institutional affiliations.

