1. Introduction
Natural disasters cause the loss of lives and assets, leaving a dent in the society, and the economy of the affected regions. These losses can be minimised by monitoring systems that may provide continuous information and early warnings in the areas at risk. However, for these monitoring systems to be performant, it is necessary to have dense coverage, and near real-time data, to be able to react to a potential natural disaster occurring.
One of the current monitoring and early warning systems for natural disasters are the networks of in-situ instruments, placed on the Earth’s surface. Often, instruments such as buoys or profiling floats are placed in remote areas and need satellite communications to retrieve the data. Some use geostationary orbit (GEO) satellites, such as INMARSAT or the global telecommunication system (GTS) [
1], since permanent coverage of the areas, except the poles, is ensured. Others use polar low earth orbit (LEO) satellite constellations, which provide global coverage, and the transmitted power is significantly lower. Either of these solutions often requires the in-situ instruments to have custom ad-hoc proprietary hardware, that is not modular. Moreover, once the satellite has retrieved the data, they have to be downloaded to the ground, which introduces a non-negligible latency. An example is the National Oceanic and Atmospheric Administration (NOAA) [
2] tsunami detection and monitoring buoys that have a latency of between 25 and 60 min [
3].
Another type of in-situ instruments are arrays of sensors located along the coastlines and on the land. Usually, they use a base station to retrieve the data, following a star-shaped topology, i.e., all instruments communicate independently with the nearest base station. Contrarily to the buoys example, the data of these sensors have a small latency, since these base stations have direct access to the monitoring and surveillance network. However, given the location of these sensors, the alert is given when the natural disaster has already reached populated areas. An example of such a system is the one deployed by NOAA along the United States and Canada coastlines [
4], to monitor ocean currents, wind, water levels, etc., and also detect tsunamis. Additionally, in California, the ShakeAlert [
5] system has been deployed. It consists of a series of seismic sensors placed in strategic areas that alert users whenever there is a potential risk of an earthquake.
Aside from in-situ instruments, satellites are also used for natural disaster monitoring. Earth observation (EO) satellites can carry payloads, such as synthetic aperture radars (SAR), radiometers, or optical imager spectrometers, among others [
6], that have been proven to be useful in natural disaster monitoring and early warning systems. For instance, the data from the moderate resolution imaging spectroradiometer (MODIS) [
7] sensors are used to create fire detection maps [
8]. Additionally, an algorithm has been developed to identify areas that will be affected by drought [
9]. However, to have a high percentage of the Earth’s surface covered, satellite payloads should be executed constantly and possibly many sensors on-board many spacecraft are needed. Often, satellite platforms have limited resources, particularly in terms of power and data, which conditions the duty cycle of the payloads to be executed to a limited extent each orbit. This implies that some payloads may not be able to execute during the whole orbit, because there is not enough power, or even if they do, it might not be feasible to download the data generated during the contacts with the ground station. For instance, Sentinel-1 [
10] carries a C-Band SAR instrument that can only be executed during 30% of the orbit [
11], or the coastal zone colour scanner (CZCS) that flew on-board the Nimbus 7 satellite with a duty cycle of 10%.
Overall, both in-situ instruments and EO payloads contribute to detect and monitor natural disasters. However, comparing the requirements identified in 2013 by the United Nations (UN) as part of the “Value of Geoinformation and Risk Management: benefits analysis and stakeholder assessment (VALID)” [
12] study, with the in-situ instruments, the density of sensors and the latency at which the information is available is insufficient. Additionally, a similar issue happens with EO satellite payloads, due to the duty cycle limitation. As part of the study presented in our paper, a new paradigm for natural disaster monitoring called
on-demand satellite payload execution is presented. This paradigm combines a network of sensors deployed on the surface of the Earth with satellite EO payloads. It offers an optimisation to current monitoring systems, by having the density of sensors required for monitoring, and the flexibility to have different types of sensors for each of the natural disasters. Thus, when a sensor (or sensors) detects an event, they will send the data to a satellite and will wake up the satellite payload on-demand. This way, satellite payloads are executed specifically over areas where it is really necessary, although it was not originally foreseen, saving resources. Moreover, with this early notification, natural disasters can be detected prematurely, leaving time to react and reduce the overall number of casualties.
In this article, as a contribution to the on-demand execution paradigm, an architecture for the paradigm is proposed. Additionally, the monitoring requirements of the different natural disasters are identified. Being the crucial requirements: the spatial density of nodes, the update frequency of the measurements, and the update frequency when a critical event occurs. Given that, having a certain density of nodes transmitting simultaneously can be challenging in terms of MAC protocol. Then, for this particular case, a survey of different MAC layer mechanisms used for IoT communications with satellites [
13] is conducted, and the maximum density of nodes that can be deployed with each of the protocols is computed and compared to the monitoring requirements.
This study is organised as follows:
Section 2 contains the proposed architecture for the on-demand paradigm.
Section 3 presents the requirements for each of the disaster monitoring use cases, identifying the types of sensors that can be used for each case.
Section 4 presents the different MAC layer mechanisms and defines the packets’ size.
Section 5 presents the results on the maximum number of nodes that the network can handle for each of the MAC layer mechanisms.
Section 6 contains a discussion of the results obtained. Finally,
Section 7 presents the conclusions.
2. On-Demand Satellite Payload Execution Strategy Architecture
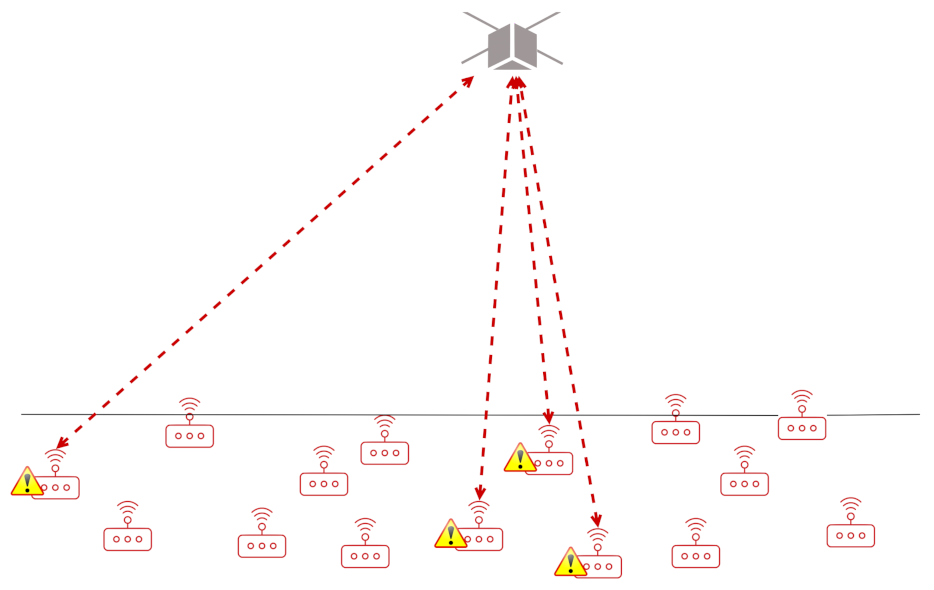
The architecture proposed in this article for the on-demand satellite payload execution strategy has to offer global coverage and be modular. However, additionally, the costs for deploying the constellation and network of sensors have to be kept low. A visual representation of the scenario is shown in
Figure 1. In the scenario, there are the Earth-based sensors located on the Earth surface and also there are the satellite or satellites. It can be seen that when one or multiple Earth-based sensors detect a warning, this is forwarded to the satellite, and the satellite can then execute an EO payload if necessary.
For the space segment, a constellation of LEO satellites may be a suitable solution [
14]. As compared to GEO satellite constellations, this constellation can provide global coverage, low latency, and low communication losses. Moreover, since the emergence of the CubeSat standard [
15], massive production of the satellite avionics has boosted, and launch costs slightly reduced. Additionally, some EO payloads that were considered either problematic or not feasible for CubeSats in 2012 [
16], they are now flying in various CubeSat-based missions [
17].
Additionally, concerning the Earth-based sensors, the emergence of the Internet of Things (IoT) paradigm can be a solution to these flexible sensor networks. IoT are devices (or “things”) that can sense, transmit and receive information, and can connect to a network, such as the Internet, or other private networks. In recent years, IoT technologies classified as a low power wide area network (LPWAN) [
18] have emerged, having longer communication ranges, while still having a low power consumption. This enables the deployment of IoT devices in rural areas. Each of these devices communicates independently with a gateway or base station, which is then connected to the network, for the data to be available. However, in remote areas, where placing gateways requires the deployment of a considerable infrastructure, satellites are used to communicate with the devices [
19].
The main LPWAN technologies are: Sigfox [
20], NB-IoT [
21], and LoRa [
22]. Out of these, for various different reasons, LoRa seems to be the most promising one for satellite communications. First of all, LoRa devices transmit in the ISM bands, making unnecessary any type of licensing or contracting services from private companies. Additionally, although the MAC mechanism is by default LoRaWAN [
23,
24], it can be customised, and whichever protocol the user requires can be implemented. Additionally, the architecture is modular, so the devices can either communicate to a gateway using LoRaWAN, or to other devices or gateways, with other protocols. Moreover, since the modulation can compensate the Doppler effect experienced from a LEO [
25], it is capable to communicate ground devices and satellites, just adding some complexity to the satellite transceiver [
26]. Finally, LoRa devices can include multiple sensors that measure different parameters. This ensemble of device and sensor is referred to as a node.
3. Ground Nodes Requirements Identification
This section presents the requirements identified for each of the natural disasters, in terms of spatial node density, update frequency, and critical update frequency of the readings. This
spatial node density determines how close or apart the nodes are located on the Earth’s surface. The
update frequency determines how often nodes have to retrieve measures if no risk of natural disaster is detected. However, if a risk is detected, the nodes may take measurements more frequently, and this is identified in our study as the
critical update frequency. The reference study to identify these requirements is VALID [
12]. However, this study was done assuming that the observations were done from satellite EO payloads. Thus, it identifies resolution requirements for the payloads, which are assumed to be the radius that the nodes cover in our study.
Aside from the requirements, the necessary sensors that each node shall include are also identified. To select these sensors, first, the state of the art of natural disaster monitoring using IoT is surveyed. Then, out of the sensors identified in these studies, the ones with available commercial solutions are considered in our study.
The natural disasters identified [
12] are floods, landslides, forest fires, sea ice, earthquakes, droughts, and tsunamis. The particular study for each of the cases can be found in the subsections below.
Table 1 summarises the requirements, and necessary measurements for each disaster.
3.1. Floods
To monitor flooding events using IoT technologies, several sensors can be used. In [
27] a flooding monitoring system using IoT ultrasonic sensors is proposed. Additionally, Nevon Projects [
28] provide an IoT kit for flooding monitoring, including rain and water sensors. Finally, Envira IoT [
29] has a real-time warning system that uses IoT technologies with sensors, although the particular types of sensors are not specified. Among the solutions available, the ultrasonic, rain, and water sensors are considered in our study.
To determine the spatial node density of nodes and the update frequency, the VALID study [
12] identifies the specific requirements for flood risk mapping and flooded areas. In the case of flood risk mapping it is identified that one node should be placed every 1 km and for flood risk mapping every 0.25 km. For our study a midpoint between the two requirements is chosen, having one node cover 0.5 km in radius. Overall, it leads to a spatial node density of 1273 nodes/1000 km
. The update frequency in the VALID study [
12] is stated to be less than one week, for flood risk mapping, and from hours of up to 1 day, for flooded areas. In our study, these two requirements will be considered for the update frequency, and the critical update frequency, respectively.
3.2. Landslides
In [
30] an IoT monitoring system using IoT is proposed. As part of that study soil moisture sensors, pressure piezometers, strain gauges, tilt-meters, geophones, rain gauges, and temperature sensors are identified. Having all those sensors would be ideal, however, only soil moisture, rain, and temperature sensors are broadly available. Additionally, in [
31] two different modules are used for IoT landslide monitoring. One of these modules is a weather monitoring station, and the other one has to be placed on the ground. The weather monitoring station measures the air temperature, relative humidity, barometric pressure, rainfall, and wind speed, whilst the ground monitoring station contains a gyroscope, a compass, a GPS, an accelerometer, and a soil moisture sensor. Thus, as part of our study accelerometers, soil moisture, rain, temperature sensors, and anemometers are considered.
To identify the requirements, the VALID study [
12] states that, to study areas prone to landslides, one node should be located every 10 m. However, this is a very restrictive requirement for nodes. To determine an optimum requirement, the mean distance between landslides has been calculated from the landslides database in the U.S. Landslide Inventory [
32]. Selecting an area with has high landslide activity, such as the West Coast, it can be seen that these events are generally 5 km apart, but for this study, a safety margin of 10 is taken. Thus, in our study the most restrictive requirement is that nodes cover 0.5 km in radius, leading to a spatial node density of 1273 nodes/1000 km
. For the update and critical update frequencies, the value of 1 day, from VALID, is considered in our study.
3.3. Forest Fires
In [
33], the benefits of using IoT sensors for fire monitoring were identified. For instance, the fire that occurred in the Notre-Dame cathedral in July 2020, could have been detected earlier, preventing damage, if an IoT system had been installed. Additionally, in [
34], an architecture for a monitoring solution is proposed, placing sensors both in rural and urban areas, using satellite communications and gateways to connect the sensors. In this study, the sensors identified for fire monitoring are temperature, humidity, solar radiation, and smoke. Thus, the sensors considered in our study are the previous ones and an anemometer, as it could be useful to predict the fire direction of propagation.
Again, the requirements identified are based on the VALID study [
12]. In this study, it is stated that the monitoring of areas prone to wildfire risk due to natural or human factors, should have nodes cover between 0.25 to 1 km in radius. As part of our study, the more relaxed requirement of 1 km is considered, since having nodes cover a quarter of a km is restrictive compared to 1 km. This provides a spatial node density of 318 nodes/1000 km
. Regarding the update frequency, the VALID study states that less than one week is enough, and for critical update frequency measures should be taken once a day. These two update frequency requirements are the ones considered in our study.
3.4. Sea Ice
Although sea ice cannot be considered a natural disaster, in recent years it has been a hot topic, due to the sea level increase [
35], and because of the opening of commercial navigation through the Arctic. Thus, it is also considered as part of our study. To identify the requirements for our study, the cases presented in [
36] are considered. This study identifies the different measurements, and resolution requirements required to monitor sea ice.
In [
37] different monitoring systems for the oceans were surveyed, identifying sensors to measure the main physical parameters. These are temperature, humidity, pressure, wind speed, and wind direction sensors. Aside from ocean monitoring, also sea ice monitoring is critical, Smartice [
38] proposes to monitor sea ice thickness with a snowmobile. Although Smartice does not clarify the types of sensors used for this purpose, some other studies [
39] suggest the use of ultrasonic sensors to measure sea ice thickness. Overall, as part of our study, the sensors considered are temperature, humidity, pressure, wind speed, and ultrasonic sensors.
The requirements identified in [
36] for the applications that can be covered using IoT nodes have resolution requirements ranging between 1 and 25 km. The most restrictive requirement of having 1 node cover 1 km in radius, is considered for our study, providing a spatial node density of 318 nodes/1000 km
. The update frequency in the article is set to 1 h, so the same requirement is assumed for our study.
3.5. Earthquakes
When monitoring earthquakes it is necessary to detect seismic waves first. These seismic waves can be classified as primary, secondary, and surface waves. To detect these seismic waves in-situ it is necessary to do it with accelerometers, to sense the movement. For instance, in [
40] a specific device using an IoT technology is proposed, comparing the performance of four different accelerometers. Additionally, in [
41] a Zigbee-based monitoring system is proposed. Moreover, there are already some early warning systems deployed, such as ShakeAlert [
5], but neither cover the whole globe, nor have the optimum spatial nodes density.
The spatial nodes density is selected based on the dimensions of the epicenter of the earthquake so that the coverage radius of nodes is the same as the earthquake’s center. This way, earthquakes will be detected as soon as they start occurring. Looking at the latest earthquakes database from the U.S. Geological Survey [
42], it can be seen that the epicenter of most earthquakes has between 3 and 5 km in radius. Thus, the most restrictive case of having a node cover 3 km in radius is considered for our study, which gives a spatial node density of 36 nodes/1000 km
.
To determine the update frequency of the nodes it should be noted that the monitoring of earthquakes is extremely time-constrained since seismic waves travel at rapid velocities. For instance, the primary wave travels at a speed of 13 km/s, whilst the secondary wave varies in speed depending on the medium that it is travelling in, and it can range from 1 to 8 km/s. These secondary waves are the ones that can be sensed with accelerometers, so the speed of these waves is used to compute the update frequency for the nodes. Considering the coverage radius between the nodes, it would take 0.37 s in the worse case and 3 s in the best case for the wave to travel from one node to the next one. Given that 0.37 s is very restrictive for IoT systems, 1 s of update frequency is chosen for our study.
3.6. Droughts
In [
43] a framework to perform drought prediction is proposed, identifying the sensors that can contribute to drought prediction. These are piezometers, groundwater level, water flow, soil moisture, and tensiometer sensors. However, comparing the sensors mentioned with current IoT solutions only water flow and soil moisture sensors were found. Moreover, groundwater level sensors were not specifically found, ultrasonic sensors can also detect water contents, and also rain sensors can contribute to the monitoring and identification of the water contents. Overall, the sensors considered as part of our study are water flow, soil moisture, ultrasonic, and rain sensors.
The definition of the requirements is based on the U.S. drought monitoring system [
44], which provides regular maps of risk areas. Overall, a spatial node density of 0.1 nodes/1000 km
with an update frequency of less than one week is considered in our case.
3.7. Tsunamis
There are already some proposals using IoT sensors to monitor tsunamis. For instance, in [
45], an architecture consisting of an underwater WSN is presented, with relay nodes connected to a cloud. Additionally, in [
46] it is proposed to use the induced electric, and magnetic fields, the wave energy gradient, and heat/chemical energy sensors. For our study, these same four sensors will be considered.
To determine the spatial nodes density, current monitoring systems are surveyed, one of them is the NOAA system [
47]. These buoys are placed approximately 300 km apart and distributed along the coastlines, with a total of 389 meteorological stations deployed in the U.S. Additionally, the Argo profiling floats [
48] is another system that monitors the oceans and implements a tsunami warning system. There are a total of 4600 floats distributed along the oceans, most of them along the Pacific and Atlantic oceans. To assess if the density of these current monitoring systems is enough, it is necessary to see the speed at which tsunamis propagate. This velocity depends on the depth of the ocean, so it can range from 800 km/h down to 30 km/h [
49]. Since the maximum speed is 800 km/h, having buoys 300 km cover is a good requirement, which provides a spatial node density of 0.004 nodes/1000 km
. In terms of the update frequency, the minimum travel time from one node to the other is 22 min, so these requirements are the ones considered for our study.
4. Medium Access Layer Mechanisms Survey
In this section, the best suited protocols for IoT satellite communications are presented for our case study. These are evaluated for the LoRa modulation, to determine the density of nodes that can communicate with a satellite at a given time. To obtain this density, the packets exchanged in the network, their fields, and sizes have been identified. Moreover, the assumptions considered for each of the protocols are also stated.
MAC protocols have been extensively studied for the LoRa modulation. The most frequently used one is LoRaWAN [
23,
24], proposed by the LoRa Alliance, and it uses an extensive network of gateways denominated the Things Network. However, it has been demonstrated that this MAC protocol has certain capacity limitations [
50,
51,
52]. Aside from LoRaWAN, other protocols have been studied to enhance the capacity and the range of LoRa networks. Some studies propose to use different spreading factors or scheduling to benefit from the co-channel rejection [
53,
54]. Other studies propose using time division multiple access-based protocols [
55,
56]. Additionally, some propose protocols that sense the medium, such as CSMA/CA [
57]. However, all these studies consider an architecture where the nodes are always in range of its gateway. In the particular scenario considered as part of our study, the satellite is the gateway, which is orbiting in LEO and is not always available for the nodes. Additionally, if instead of one satellite there is a constellation, the nodes would not always be communicating with the same satellite.
Apart from the protocols studied specifically for LoRa, protocols used for regular satellite communications have been considered [
58] for our study. However, most of these protocols are not well suited for IoT satellite communications, since the link considered is from one satellite to one ground station, but not for high density scenarios where there is more than one node accessing the medium.
Overall, the best suited protocols for IoT satellite communications scenario were identified in [
13], where a survey of state of the art proposed protocols is presented providing metrics of maximum normalised throughput and a trade-off between complexity, energy efficiency, and scalability. These are the ones that have been considered in our study. It should be noted that all protocols are compliant with the 1% duty cycle restriction stipulated by the International Telecommunication Union (ITU) [
59].
In this section, first, the scenario considered for the different packets exchanged is presented. Then, the different protocols are explained. These protocols are classified depending on the medium usage, being the classifications random access asynchronised protocols, random access synchronised protocols, medium sensing protocols, reservation protocols, and hybrid protocols. For each of them, the sequence diagram is presented, showing the handling of the medium and the packets that are going to be exchanged in the network, as well as its fields.
4.1. Scenario
Our particular case study considers a scenario where satellites receive the messages sent by the nodes. These satellites are in polar LEO orbits, and the nodes are located on the Earth’s surface. Given the low altitude of the satellites, these are not seen as static from Earth. In fact, from a fixed point on Earth, a satellite in LEO is only seen between 8 and 10 min depending on the latitude and longitude, where the node is located. This creates a disruption from the nodes’ point of view since they might not know when a satellite is available to transmit an alert. For that reason, the satellite transmits a periodic beacon (every 8 min in our study), ensuring that all nodes receive a beacon and are aware that a satellite is ready to transmit data or execute the satellite’s payload on-demand.
Aside from the beacon, also data packets, acknowledgement (ACK) packets, and control packets are sent. These packets contain different fields and as a consequence have different lengths, depending on the MAC protocol used. These different fields are explained below:
Timestamp: the timestamp provides the actual time when sending the Beacon, in Unix timestamp format. This field occupies 64 bits, and it is used to time tag the packets. Both the satellite and the nodes obtain the time from a GPS module;
Satellite ID: this field provides an identification of the particular satellite sending/receiving the beacon. This is necessary in case a constellation of satellites is launched but can be omitted otherwise. It has a length of 16 bits, and this would allow up to 65,536 satellites to be launched in the same constellation;
Sync slots: this field is used in slotted MAC protocols to synchronise the slots amongst the satellite and nodes, and also to provide the length, in milliseconds, of the slots. The field has a length of 16 bits which allows enough values to contain the synchronisation and the length of the slots;
N slots (number of slots): this field is used in protocols that not only divide the medium into slots but group a number of these slots into a frame. It provides the number of slots within each of the frames. To do that, 16 bits are allocated, to have up to 65,536 different slots per frame;
Free slots: this field is also used in protocols that not only divide the medium into slots, but group a number of these slots into a frame, and reserve slots within each frame to particular nodes. In this field, 16 bits are allocated, to have up to 65,536 different slots;
Time window: this field, in ms, is used in protocols that define a time window in which the data packet has to be sent. The field has 16 bits, as these time windows are not larger than 65,536 ms;
Packet size: this field is used in protocols that limit the maximum packet size sent over the medium. The field has 8 bits reserved, for packets with up to 255 bits of payload data;
Node ID: this field identifies the node, in particular, that is sending or receiving the packet. This field has 32 bits, to place a maximum of billion nodes on the surface of the Earth, which even for the worse density is enough to offer complete coverage;
Packet ID: this field identifies the packet that a given node is sending or has sent. The field is reset to 0 after 10 min, so each time the satellite receives a Beacon the packet ID is 0 and it increases as retransmissions occur. This way, this parameter has 8 bits of length, which means that one packet can be retransmitted up to 255 times;
Position: the nodes also include their position on the Earth, so the satellite knows where to execute the payload. This position is obtained from the GPS module the nodes include. The field has a length of 80 bits;
Sensors data: this field is variable depending on the natural disaster monitored. As identified in the requirements (
Section 3), the number of sensors per node can range between 3 or 5. For each of the sensors, 16 bits of length, to include the type of sensor, and the data;
Duration: this field informs on the time that should be reserved or has been reserved to a given node to transmit their data packet. The field has been set to 16 bits, so a maximum of 65,536 ms can be reserved.
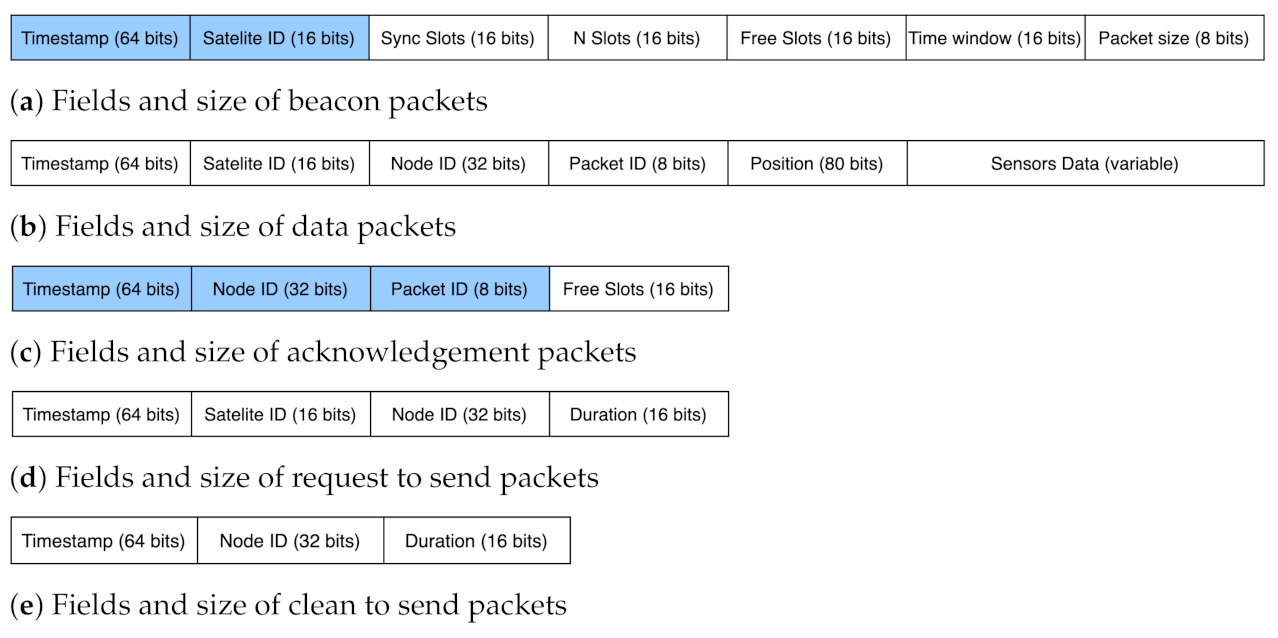
Beacon
The beacon format can be seen in
Figure 2a. There are two common fields that all beacons contain, highlighted in blue, and the others may be included or not depending on the protocol used. It should be noted that independently from the protocol used the beacon can be considered collision free since the nodes are in receiving mode until they receive this packet.
Data packets
The data packets, which are presented in
Figure 2b, are the packets that the nodes send to the satellite, asking for a specific execution. These packets include the sensors’ data, and based on these data the satellite decides which payload to execute.
Acknowledgement packet
The acknowledgement (ACK) packets can be seen in
Figure 2c. This packet is sent by the satellite whenever a data packet is correctly received. It has some common fields, highlighted in blue, which are always sent.
Control packets
Control packets are used in some particular protocols, that require an orchestration from the satellite to transmit. These packets are the request to send (RTS), and the clear to send (CTS), whose format can be seen in
Figure 2d,e.
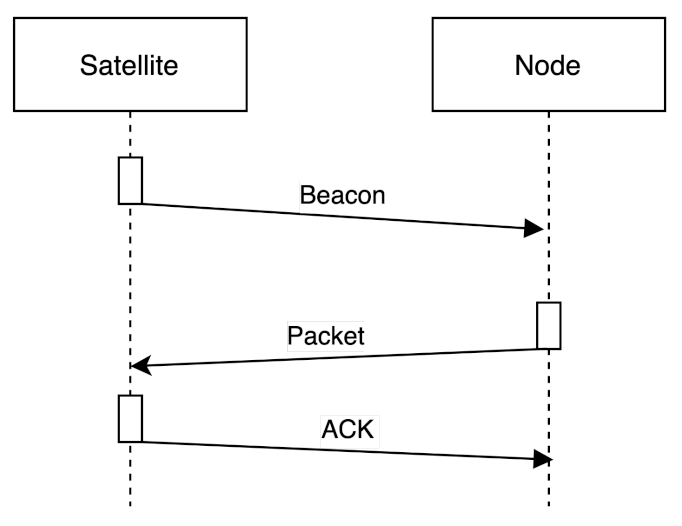
4.2. Random Access Asynchronised Protocols
Random access asynchronised protocols allow contention-based access to the medium to all devices willing to transmit. The sequence diagram is shown in
Figure 3. The packets exchanged are the beacon, which is first sent by the satellite to let the nodes know that they can transmit data, if necessary. After the beacon, the nodes send their data packets. In case of a collision free data packet transmission, the satellite responds with the ACK.
These protocols require sending the basic beacon and ACK, with only the common fields. If any other field is necessary, it will be specified in the specific protocol explanation.
Aloha
The simplest protocol is the Aloha one [
60]. The network devices can always send the packets, and it does not have any additional complexity added to it. Thus, once the nodes have received a satellite beacon, they can choose when to transmit in a contention-based manner. If the transmitted data packet has been correctly received, the satellite responds with an ACK. In case the node does not receive any ACK, it re-transmits the packet after a random time-out.
Enhanced Aloha (E-Aloha)
The E-Aloha [
61] protocol proposes a solution to packets that are transmitted always with the same periodicity, to avoid permanent collisions. The access to the medium is also random, as with traditional Aloha, however, it proposes to fix a time window larger than the transmission time of the packets, so the nodes can select randomly the time at which they transmit within that time window, after receiving the beacon. By having this time window, nodes that have the same periodicity to send packets, vary the instant at which they transmit.
This protocol has the same sequence as the classical Aloha protocol. However, the beacon packet contains also the time window field. Additionally, if the node does not receive any ACK after sending a data packet, it would re-transmit it after a random time-out.
Spread Spectrum Aloha (SS-Aloha)
The SS-Aloha protocol [
62] uses spread-spectrum techniques to separate the channels in which each of the packets are sent. By using a spread-spectrum technique, each of the samples received contains more than one bit [
63]. In our particular case study, the sequence diagram is the same as with Aloha.
Enhanced Spread Spectrum Aloha (E-SSA)
This protocol [
64] combines the same spread-spectrum Aloha technique, as with SS-Aloha, with a recursive successive interference cancellation (R-SIC) algorithm. This R-SIC algorithm works at packet level and exploits a sliding window on the receiver side, which captures all received packets and discriminates between them based on the spreading sequence, the time offset, and the carrier frequency.
For our case study, the R-SIC algorithm is only implemented in the satellite’s receiver, since it is the worse case in terms of density, i.e., all nodes may be trying to transmit their data packets to the satellite. Additionally, thanks to the R-SIC algorithm, nodes do not require to receive an ACK from the satellite. Thus, once the nodes have received the satellite beacon, they transmit the data packet once.
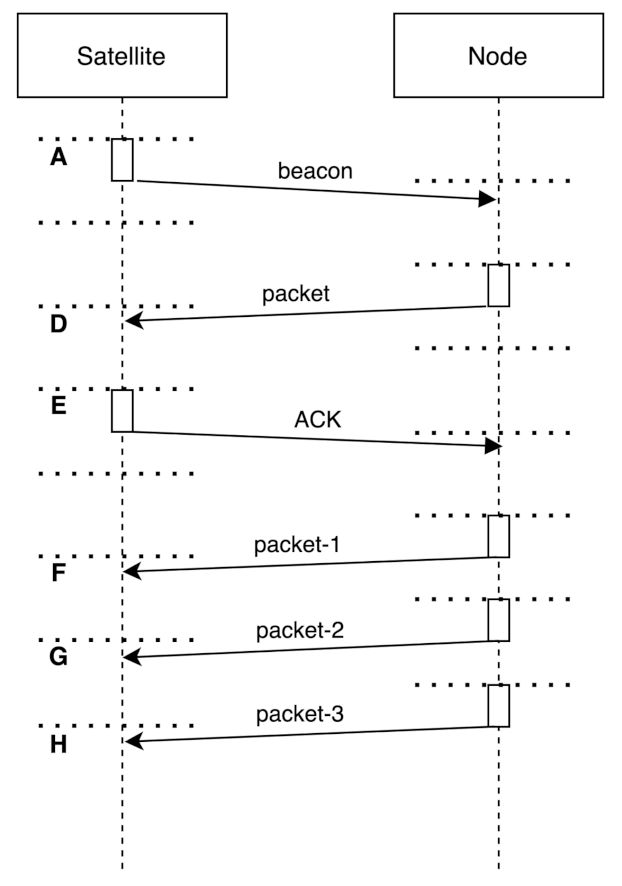
4.3. Random Access Synchronised Protocols
Random access synchronised protocols divide the channel into slots, so the nodes in the network can access the medium, starting their transmission at the begging of one of these time slots. These slots have the duration of the transmission time of the packets and have to be synchronised amongst all nodes in the network, so a precise time synchronisation is crucial. The sequence diagram for these types of protocols is shown in
Figure 4. As with the asynchronised protocols presented in the previous section, the satellite first sends the beacon (A), so that nodes are aware that they can send their data packets to it. Then, in most cases, a given node transmits the data packet (D), and the satellite responds with an ACK (E) if it has been received correctly. However, some slotted protocols instead of using ACKs, send the same packet multiple times (F,G,H).
All random access synchronised protocols send the beacon with the common fields, and the sync slots. The ACK contains solely the common fields.
Slotted Aloha (S-Aloha)
S-Aloha [
65] is similar to Aloha, with the difference that the medium is slotted, and the devices that want to transmit have to wait until one slot begins to transmit the packet. As Aloha, in S-Aloha nodes expect to receive ACKs from the data packets sent. Thus, if no ACK is received, the node retransmits the packet after a random time-out.
Contention Resolution Diversity Slotted Aloha (CRDSA)
The CRDSA protocol [
66], aside from having the medium slotted, implements a successive interference cancellation (SIC) mechanism in the receiver, so it can cancel interferences cancellation with the packets. Additionally, the data packets are sent three times, and no ACK is expected.
For our case study, the SIC algorithm is only implemented on the satellite receivers side, since it is the critical medium access scenario when all the nodes are trying to send packets to a single satellite.
Irregular Repetition Slotted Aloha (IRSA)
This protocol [
67] is similar to CRDSA, where the nodes also send multiple times the same packet, randomly choosing the slots in which these packets are sent, but the number of copies sent is chosen in an optimised manner.
For our particular case, since the scope of this article is not to optimise the number of redundant packets sent by each node, the same assumption of three packets as in CRDSA is made.
Coded Slotted Aloha (CSA)
In this protocol, [
68] the node divides the packets into different sub-packets of the same length. These packets include error correction codes, and the receiver applies a maximum-a-posteriori (MAP) decoder, to be able to recover subpackets that are lost. Additionally, the receiver also implements an interference cancellation scheme to receive from multiple senders. Since it has error correction codes data packets do not require an ACK from the satellite.
In our study, we assume the beacon includes the packet size field, aside from the common ones. Additionally, the division of the packets is done in 112 bits, since it is the size of the beacon, and it would not be practical to divide this packet. This means that any packets that have a payload larger than 112 bits will be divided into subpackets. Finally, regarding the error correction code, according to [
68], a forward error correction (FEC) code at physical level is implemented. However, since no details are provided on the code redundancy, the code that adds more redundancy in the LoRa modulation is used. More details on the implementation are provided in
Section 5.
Multi-Slots Coded Aloha (MuSCA)
The MuSCA protocol [
69] implements an error correction code for a SNIR, so it can decode packets when there are collisions in a slot. As with CSA protocol, no ACKs are sent when a packet is received.
The error correction code is a 1/4 Turbo code [
69]. The LoRa modulation does not have a 1/4 error correction code, and the code with the largest redundancy is a 4/8. Given this limitation of the LoRa modulation, this case of a redundancy of 4/8 is considered for this study.
4.4. Medium Sensing Protocols
Medium sensing protocols function by “listening” to the channel before transmitting. If it is busy the node performs a random back-off, and senses the medium again, until it is free to transmit.
Carries Sense Multiple Access/Collision Avoidance with RTS/CTS (CSMA/CA)
In CSMA/CA with RTS/CTS [
70] once the node has sensed that the medium is free, it transmits the request to send (RTS) packet, and if it is received and the medium is free, the receiver responds with a clear to send (CTS), reserving the channel to that particular node. Once the node receives the CTS, it sends the data packet, which has to be acknowledged. The sequence diagram for CSMA/CA can be seen in
Figure 5. As it can be seen in the diagram, only the data packets require the RTS/CTS, since no collisions can be assumed for the beacon.
Regarding the format of the packets this protocol sends the regular beacon, data packet, and ACK with the common fields, and also the RTS and CTS control packets.
4.5. Reservation Protocols
Reservation protocols divide the medium into different slots and reserve certain slots of the medium to certain nodes. In these protocols, nodes have to be aware of which slots are reserved, and which ones are free. Given that this protocol has also a division of the medium, it also requires precise time synchronisation as the random access synchronised protocols do.
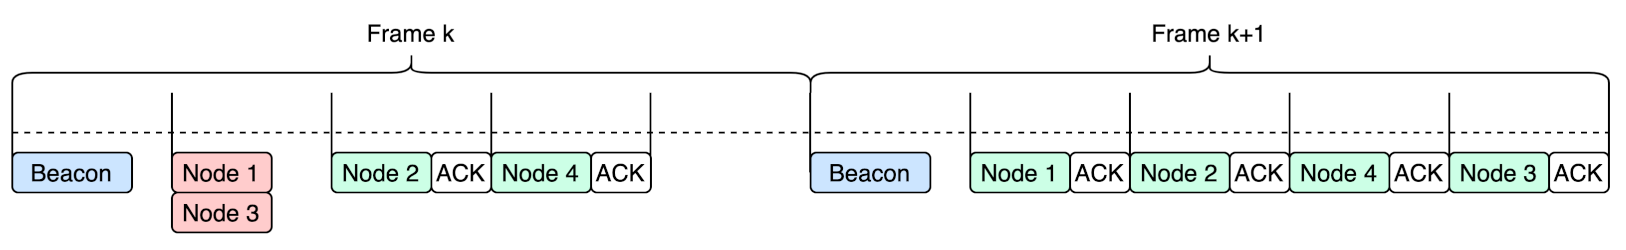
R-Aloha
R-Aloha [
71,
72] defines frames, which are further divided into several slots. Nodes can transmit randomly in any of these slots within a frame, and if the communication has been successful (i.e., an ACK is received) that slot is reserved for that node. Contrarily, if no ACK is received the node tries another slot in the following frame. The frames and the collision of messages in a slot and reservation for this protocol are shown in
Figure 6. In the Figure, the packets Node 1 to 4 represent the data packets for each of the Nodes.
For this protocol, the beacon includes a sync, number of slots, and free slots fields, aside from the common fields. In the case of the ACK, it also contains the free slots field. Moreover, given that in this protocol the beacon has to be sent at the beginning of each frame, the periodicity of the beacon cannot be considered to be the 8 min fixed for the rest of the protocols. Thus, for our study it is assumed that the frames have a 1 min length, sending one beacon each minute. This would allow having up to 8 retransmissions for the data packet of each node. It should be noted that this beacon can still be considered collision free since the nodes know when to expect it.
4.6. Hybrid Protocols
Hybrid protocols combine different traditional medium access techniques, and cannot be classified in the previously mentioned sections.
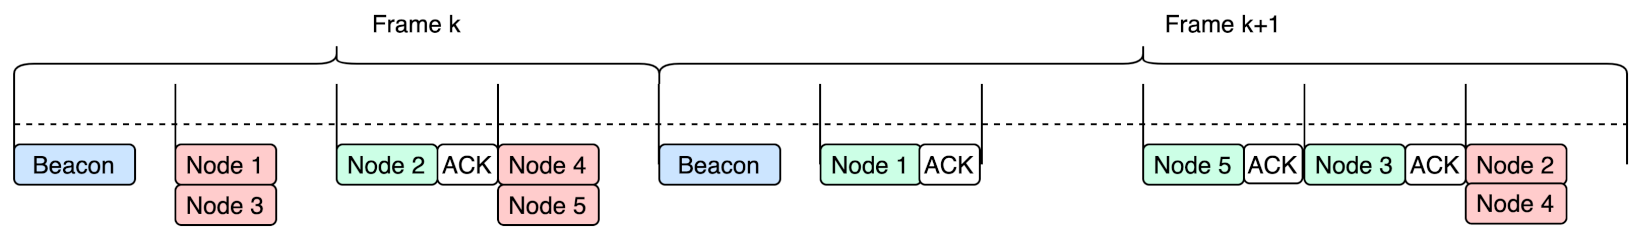
Fixed Competitive Time Division Multiple Access (FC-TDMA)
In this protocol, [
73] the channel is divided into frames, and each of these frames contains a configurable number of slots. The nodes select the slot in which they want to transmit. Once the satellite has received all the packets and based on the collisions that have occurred in the previous frame, it has to estimate the number of slots needed for the following one. This protocol requires time synchronisation between all the nodes.
Figure 7 shows an example of the adaptative slots within a frame.
For this protocol, the beacon contains the sync and number of slots fields, and the ACK has only the common fields. For this protocol, the same assumption as with R-Aloha is taken for the beacon, since the medium is divided into frames and a beacon is sent, collision free, at the beginning of each frame. Thus, for our study, a periodicity of 1 min in the beacon is considered.
Random Frequency Time Division Multiple Access (RFTDMA)
In this protocol [
74], the transmitter node selects a random carrier frequency within a range to transmit the packets and transmits them in a contention based manner in time. This protocol benefits from poor quality oscillators included in most IoT nodes since these oscillators can cause a deviation in the central frequency of the transmitted signal. It is especially useful for narrowband signals since the deviation in the carrier frequency separates the packets in the frequency domain.
Overall, along with the presentation of the different protocols the packets that are exchanged for each of them, and the fields sent in each one have been identified. This information is summarised in
Table 2, and it is necessary to calculate the maximum number of nodes and their density.
5. Capacity and Sensors Density Results
Now that the packets are to be sent for each protocol and the sizes of the payloads are defined, it is necessary to add the LoRa modulation header and the cyclic redundancy check. To obtain this, first, the total number of symbols (
) of each packet has to be calculated, as shown in Equation (
1) [
75].
Several fields have to be determined from the LoRa packet headers. Starting with the number of symbols in the preamble (
), the standard value is 8 symbols. The next field is the number of symbols in the payload field (
), which are the values identified in
Table 3, converted into symbols. The next field is the number of bits in the CRC (
), which is by default fixed to 16 bits. Regarding the number of symbols in the header (
), this value is set to 0 if the payload size is fixed, and to 20 symbols if the size of the payload is variable. Given that the size of the payload is variable for this application, it is necessary to include these 20 symbols of the header.
Finally, there are three modulation parameters: the bandwidth (BW), the spreading factor (SF), and the coding rate (CR). BW determines the bandwidth of the signal, and, based on the standard, it can be set to 125, 250, or 500 kHz. SF determines the chips in every symbol, having more chips for lower values of SF, and as a consequence a higher data rate. SF can be fixed between 7 and 12. CR determines the redundancy every 4 bits, having a total of 5, 6, 7, or 8 bits. The values of the SF and CR are based on a study of the physical layer of the LoRa modulation in the space-to-Earth communications environment [
26]. These values are a BW
kHz, so that the Doppler can be compensated, an SF
, so that there is a high data rate, and a CR =
, having one bit of redundancy every four bits. In the case of CSA and MuSCA protocols, it is set to CR
, since these protocols require a higher redundancy at physical level.
Once all the fields and modulation parameters are fixed, the total number of symbols and bits of each of the packets can be computed, using Equation (
1) to obtain the symbols, and then by multiplying the transmission time (
, Equation (
4)) by the data rate
. The results of this calculation can be seen in
Table 3. These packet dimensions will be used to calculate the maximum number of nodes that can transmit over the network.
Based on the size of the data packets, it ranges from 28 up to 38 symbols. For the rest of our study, we will consider the worst case of 38 symbols, since having longer packets means a lower density of nodes. To obtain the maximum number of nodes, the first step is to calculate the maximum capacity (
) that nodes can use of the network so that it does not saturate. To calculate
, the maximum throughput (
) has to be multiplied by the raw capacity that the LoRa nodes can offer (
), (Equation (
2)):
Given that
is computed as the messages received divided by the total number of messages sent, it already considers the retransmissions that have to be done due to collisions when accessing the medium. Thus, with this
the mean transmission time of each of the packets for each protocol is calculated as (Equation (
3)):
The next step is to calculate the maximum number of nodes (
) for each of the protocols. This is calculated by considering the total time that the nodes have the satellite in view, subtracting the transmission time of the beacon, and dividing it by the transmission times of the other packets that are sent, such as control packets, data packets, and ACKs. This calculation is shown in Equation (
5). If the protocol does not have control packets or ACKs the values of the corresponding
are set to zero.
Following the aforementioned calculations, the value of
in the footprint of the satellite simultaneously is given in
Table 4. As part of this table,
,
, and
are given for the case study where the data packets send 38 symbols.
Having the maximum number of nodes, the next step is to determine the density of nodes that can be achieved with each of the protocols, so that it can be related to the requirements identified in
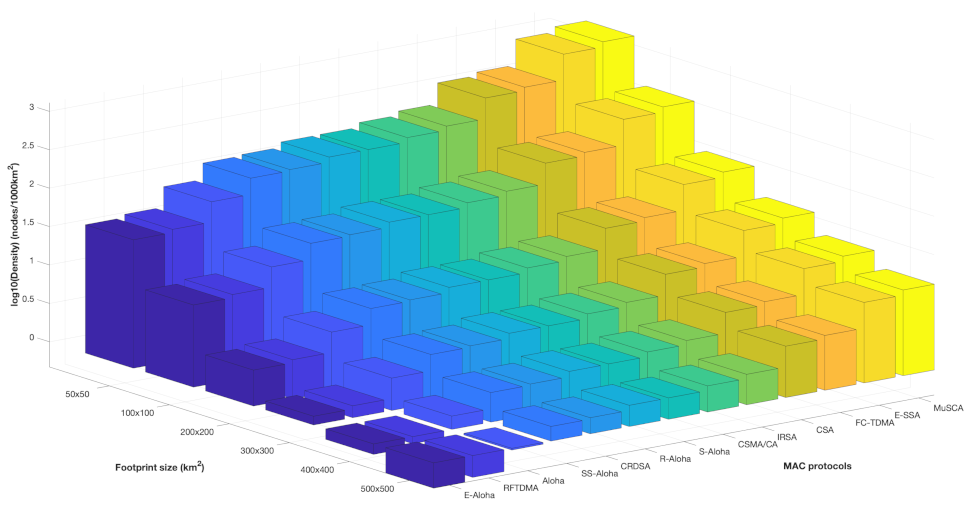
Section 3. This density is strictly depending on the footprint size of the antenna, and this footprint depends on the antenna’s directivity and the satellite orbital height. Thus, to make the results more general, the density is provided for different footprint sizes, so that the footprint size can be extrapolated to LEO satellites orbits, or even other types of platforms, such as high altitude balloons (HAPs), or drones.
Results are shown in
Table 5 and are classified with a colour scale based on the density of nodes per every 1000 km
. Additionally, in
Figure 8 a graphical representation of the densities achieved can be seen.
6. Discussion
Overall, our study has presented the density of nodes achievable with different MAC layer mechanisms, specific for IoT satellite communications. This allows assessing the requirements identified for natural disaster monitoring in
Section 3. As it can be seen all requirements can be fulfilled, which demonstrates the feasibility of the on-demand executions strategy. Applying this strategy is beneficial since natural disasters can be detected early and monitored both in-situ and remotely.
Taking a closer look at the results from
Table 5, and comparing them with the requirements identified in
Table 1 it can be seen that the densities are identified with a colour tag, and the following density ranges: over 1000, between 1000 and 100, between 100 and 10, and below 10 nodes/km
. Following, an analysis of each of these ranges is performed comparing the requirements with the suitable protocols.
Starting with the case of a density over 1000 nodes/km, the two cases that are within this range are floods, and landslides (1273 nodes/km). For these cases, the only protocol that can be used is MuSCA with a footprint of 50 × 50 km. However, if the requirements were more relaxed also the E-SSA protocol could be used.
Following with 1000 up to 100 nodes/km range, there are also two requirements for forest fires, and for sea ice being 318 nodes/km. The protocols that can fulfill the requirements are MusCa with a footprint of 100 × 100 km, and CSA, FC-TDMA, and E-SSA with a footprint of 50 × 50 km. To select the most suitable, there is a trade-off between the footprint size and the complexity of the protocol, depending on what can be implemented in the satellite and nodes. Smaller footprints require a bigger and more complex antenna, and more complex protocols require extra processing resources. Thus, if the objective is to have a simpler antenna the MuSCA protocol is the best option. In case the objective is to optimise the processing, the best option would be the FC-TDMA protocol since CSA requires to divide packets into subpackets, and E-SSA includes an interference cancellation algorithm, requiring more processing.
The next case is for densities between 100 and 10 nodes/km, the requirement that is in this range is for earthquakes with a density of 36 nodes/km. For this density, the protocols that could be used are MusCa with a footprint of 300 × 300 km, and E-SSA with 200 × 200 km footprint. Additionally, with a footprint of 100 × 100 km the protocols FC-TDMA, CSA, IRSA, CSMA/CA, S-Aloha, R-Aloha, CRDSA, and SS-Aloha could be used. Finally, for a footprint of 50 × 50 km the protocols Aloha, RFTDMA, and E-ALOHA can be used. In this particular scenario, MuSCA is the best option if the complexity of the antenna wants to be low. Either Aloha or S-Aloha can be used if processing wants to be optimised since the usage of these two protocols is broadly extended.
Finally, for scenarios below 10 nodes/km, there is drought with 0.1 nodes/km, and tsunamis with 0.004 nodes/km. In this case, all protocols can be used with a footprint of 500 × 500 km. Thus, the best option for implementation simplicity and processing resources would be to use the Aloha protocol.
7. Conclusions
This study has presented a novel strategy for disasters monitoring of flooding, landslides, fires, sea ice monitoring, earthquakes, drought, and tsunamis, based on an on-demand execution of the satellite payload. This approach optimises the use of both in-situ and spaceborne instruments. In order to quantify the proposed strategy for each disaster, the different types of IoT in-situ sensors, the spatial density, and update frequency requirements have been evaluated, and also whether or not these requirements can be met with existing MAC protocols specific for IoT satellite communications.
Having such a large quantity of sensors that may try to send their data and request a satellite payload execution poses a challenge in terms of MAC layer. Thus, as part of this study, a review on different MAC protocols has been conducted, identifying which protocols are more suitable for IoT satellite communications environment. For each protocol, the particular implementation for this case study is provided, identifying the packets exchanged and their sizes, and the sequence diagram. Then, the maximum number of nodes and the density have been evaluated and compared with the identified monitoring requirements. The antenna footprint depends on the antenna directivity, and the altitude of the platform, varying from 50 × 50 km to 500 × 500 km.
In general, it can be seen that the predictions fulfill the spatial density requirements to monitor natural disasters. Regarding the update frequency requirements, these are related and will determine the size of the constellation. Some companies are already launching IoT satellite constellations (e.g., Lacuna Space [
76], Fossa Systems [
77], or SatelIoT [
78]), which can be a good asset to monitor natural disasters.


