
Integrating Multiple Datasets and Machine Learning Algorithms for Satellite-Based Bathymetry in Seaports


1
Collaborative Innovation Center for the South China Sea Studies, Nanjing University, Nanjing 210023, China
2
States Key Laboratory of Satellite Ocean Environment Dynamics, Second Institute of Oceanography, Natural Resources Ministry, Hangzhou 310012, China
3
School of Geographic and Oceanographic Sciences, Nanjing University, Nanjing 210023, China
4
School of Marine Science, Shanghai Ocean University, Shanghai 201306, China
5
Marine Surveying and Mapping Engineering and Technology Research Center, Shanghai 201306, China
*
Author to whom correspondence should be addressed.
Remote Sens. 2021, 13(21), 4328; https://0-doi-org.brum.beds.ac.uk/10.3390/rs13214328
Submission received: 15 September 2021
/
Revised: 22 October 2021
/
Accepted: 26 October 2021
/
Published: 28 October 2021
(This article belongs to the Special Issue GIS and RS in Ocean, Island and Coastal Zone)
Abstract
:Water depth estimation in seaports is essential for effective port management. This paper presents an empirical approach for water depth determination from satellite imagery through the integration of multiple datasets and machine learning algorithms. The implementation details of the proposed approach are provided and compared against different existing machine learning algorithms with a single training set. For a single training set and a single machine learning method, our analysis shows that the proposed depth estimation method provides a better root-mean-square error (RMSE) and a higher coefficient of determination (R2) under turbid water conditions, with overall RMSE and R2 improvements of 1 cm and 0.7, respectively. The developed method may be employed in monitoring dredging activities, especially in areas with polluted water, mud and/or a high sediment content.
1. Introduction
Bathymetry or measurement of water depth in coastal areas is crucial in many fields such as coastal shipping, dredging activity monitoring, coastal ecosystem management, fishery development, mineral exploration, natural disaster management, as well as coastal research and modeling [1,2]. Moreover, the availability of accurate water depth data is also critical for the stability and safety of beaches and waterfront buildings. Bathymetric measurements are also necessary for the exploration, development, protection and management of natural resources, especially coastal environments [3]. Furthermore, dredging and maintenance of wharves and waterways are crucial for ensuring proper ship navigation and safe operation of port infrastructure and facilities. In fact, most seaports have channels that can suffer from sedimentation, which reduces the water depth and hence impedes navigation [4]. Thus, maintenance and dredging are needed to improve and facilitate navigation; deeper port drafts are sought to accommodate bigger ships; and marine and river environments should be developed and maintained [5,6]. In order to minimize the efforts and costs associated with dredging operations, the seabed water level must be accurately estimated. Conventional methods for water depth estimation require ship-enabled detailed measurements which are time-consuming, expensive, and sometimes dangerous. In addition, these methods are difficult to apply in remote areas. Also, echo detectors are usually used to measure water depth [7]. In fact, the single-beam echo sounder is the most commonly used technique for measuring the water depth in seaports. Other common techniques utilize echo generators. Currently, multi-beam echo detectors and light detection and ranging (LiDAR) devices are usually used for high-resolution water depth estimation in shallow waters. However, these devices have high operating costs; their use requires many safety precautions; and they are more applicable only in small areas [8,9].
The aforementioned considerations have motivated the exploitation of emerging remote-sensing technologies in order to achieve more reliable water depth estimation at a lower cost [10]. For example, the combination of an echo sounder and remote-sensing satellite data leads to enhanced water depth estimation. The remote-sensing bathymetry methods generally can be categorized into physics-based methods and empirical methods. The physics-based methods simulate the interactions of light through water columns, while the empirical methods seek to build regression models between the spectral radiation patterns and the in situ calibration data [11,12]. Nevertheless, the accuracy of the remote-sensing bathymetry methods is typically limited for water depth estimation in shallow areas. The decline in accuracy is essentially due to the limited coverage and space of these methods, as well as the wide variations in water clarity.
Machine learning methods have been also considered for constructing more general models for water depth estimation. These methods could be employed to better exploit the multi-dimensional characteristics of multi-spectral sensor data. Although inferring and explaining the relationship between the water depth and these characteristics is quite challenging especially under different observation conditions, the machine learning methods can be effectively employed to face this challenge through different numerical models and hence provide superior solutions [13]. In recent years, water depth estimation has been addressed through various machine learning methods including those based on neural networks [14], random forests [15], support vector machines [16], and others [16,17]. Traditionally, training and optimizing a water depth model is carried out with one set of multi-spectral images and a single machine learning algorithm [16]. A prominent example of port bathymetry is the work of Mateo-Pérez et al. [16], who used a support vector machine and Sentinel-2 satellite imagery data of 2020 to find interval estimates of the water depths at the Spanish ports of Candás and Luarca as 0–4.5 m and 0–12 m, with corresponding root-mean-square error (RMSE) values of 0.37 m and 0.44 m, respectively. In 2021, Mateo-Pérez et al. [17], obtained further depth estimates at the port of Candás with RMSE values of 0.33 m and 0.46 m for random-forest and RBF-kernel SVM techniques, respectively. Since multiple water depth control points are required for model training, the model accuracy depends on the number of control points and hence the performance outcomes of different models are not easily comparable.
Apart from ports, the same or similar techniques were also exploited for retrieving bathymetry in shallow turbid waters in the last few decades [18,19,20], and many improvements have been made recently [21,22,23,24]. In 2002, V. Lafon et al. [18], carried out a simple method applied to shallow waters of a moderately turbid tidal inlet by using an SOPT image, and the mean difference between measured depths and computed depths is about 20%. In 2020, Caballero et al. [25], using a Sentinel-2A/B image to estimate bathymetry with median errors of under 0.5 m for depths 0–13 m when validated with lidar survey. An alternative approach is to combine ensemble learning methods with multi-spectral imaging data [25,26]. For example, Mohamed et al. [18], used ensemble learning algorithms and SPOT-4 images to estimate the water depth at El-Burullus Lake in Egypt as 0.3–1.3 m with an RMSE value of 0.15 m. Also, Surisetty et al. [19], explored multiple Sentinel-2 image datasets and machine learning algorithms for high-precision water depth estimation at Rushikonda Beach in India. A water depth estimation of 0–13 m (with a RMSE of 0.36 m) was obtained through the combination of the log-linear model (LLM) and support vector regression (SVR).
The aforementioned methods have generally improved the accuracy of bathymetry by utilizing remote-sensing images and algorithms. However, the useful information of the water depth control points has not yet been fully exploited. In order to boost the accuracy and robustness of the current methods for water depth estimation, adaptive exploration of this type of information should be carried out in conjunction with ensemble machine learning algorithms. In our work, we integrate control-point information of the water depth along with machine learning methods, use the control points twice to perform depth regression, and finally obtain water depth estimates. The feasibility of the proposed approach is demonstrated for a test site.
2. Proposed Machine Learning Algorithms for Bathymetry Mapping
2.1. Neural Networks (NN)
A conventional artificial neural network (NN) mimics the biological processes in which neurons learn from feedback. A NN architecture consists of an input layer, an output layer, and some hidden layers. The interconnections between neurons of adjacent layers are established by weights which are tuned in the NN learning phase. The input of every neuron is the weighted summation of the total outputs of the previous layer, and an activation function is used to generate the neuron output. The NN architectures can be generally divided based on their connection patterns into feed forward and feedback (recurrent) networks [14].
2.2. Random Forests (RF)
The random forest (RF) model is a supervised ensemble learning model. In this model, multiple prediction models are simultaneously generated, and the prediction results of each model are comprehensively analyzed to improve the overall prediction accuracy. Specifically, a large number of decision trees is generated through data and variable sampling. For each tree, self-help sampling is carried out, and out-of-bag data samples are used for error estimation. For decision tree generation, the variables are randomly selected, and hence the random forests do not experience overfitting with the increase in the number of trees. The random forest algorithm can still demonstrate good learning performance for large datasets. Furthermore, for this algorithm, the relative importance of each variable can be assessed, and the results can be explained [15].
2.3. Support Vector Regression (SVR)
Support vector regression (SVR) is one of the key statistical models for machine learning. For the linear case, regression is directly performed by the decision function. For the non-linear case, regression is realized by constructing the decision function in a high-dimensional space. This enables the construction of a small-sample multidimensional regression model [11].
2.4. Multi-Adaptive Regression Splines (MARS)
The multi-adaptive regression splines (MARS) algorithm is a non-parametric multiple regression method that uses adaptively-selected spline functions. Although linearity is assumed in this method, models can be constructed with coefficients that depend on the predictor variables.
All models for water depth estimation were constructed in a Python environment [27].
2.5. Bathymetry Mapping
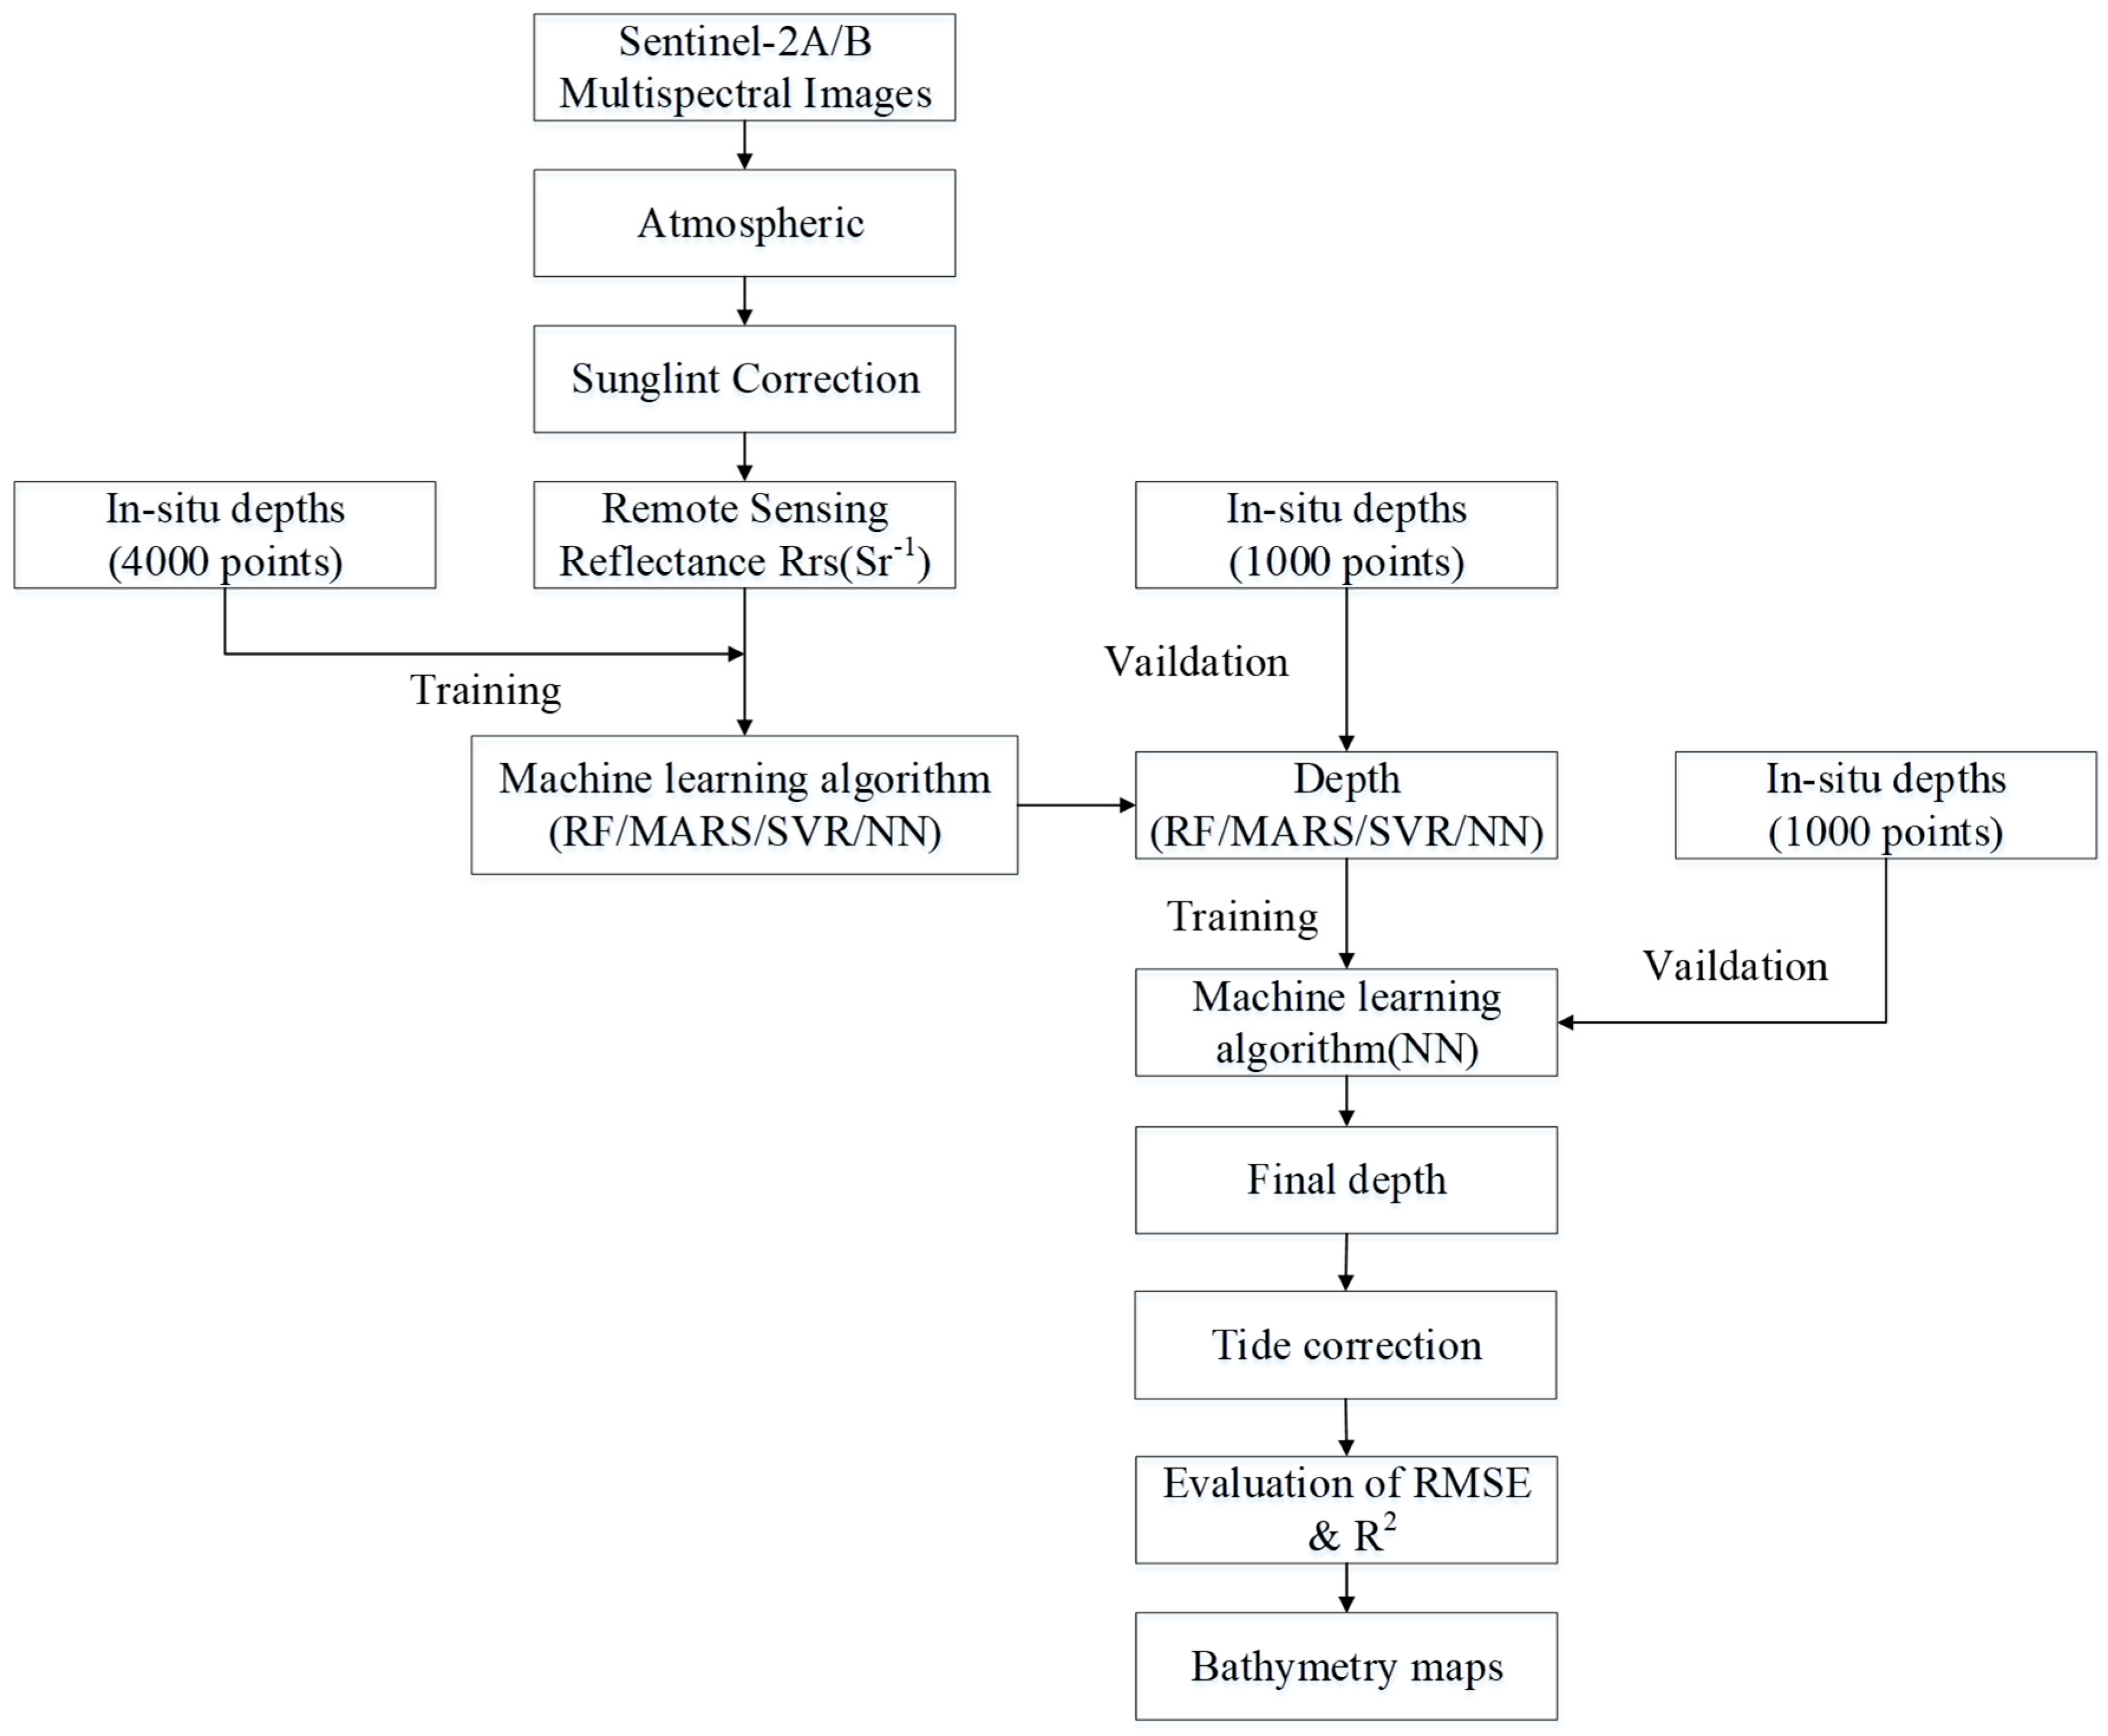
Based on a single image of each study area, a certain number of water depth control points is usually selected randomly. However, this may not be a reliable method for satellite-derived bathymetry (SDB), because the water depth estimates may depend on the number and locations of the control points. Also, high water turbidity can lead to higher reflectivity values for the visible and near infrared (NIR) channels. This high reflectivity may result in depth overestimation in shallow water areas (<6 m) and depth underestimation in relatively deep water areas (6–10 m). These effects typically produce false mappings between the control points and the reflectivity values, and hence reduce the depth estimation accuracy. In this paper, water depth retrieval is performed as follows. As Figure 1 shows, first of all, a remote-sensing image of good quality is selected, where the image is consistent with the timing of the captured scene and the measured data. Then, atmospheric correction and sunlight removal are performed to obtain the corresponding reflectance data. The water depth is thus estimated using four machine learning algorithms, the tide is corrected, and hence the accuracy of the water depth estimates is evaluated. Finally, a topographic map is created based on the obtained estimates and the integrated approach. In our integrated approach, we estimate the water depths by employing the control points in two steps. In the first step, four water depth estimates are obtained using the control points and four machine learning algorithms. In the second step, new depth estimates are obtained using the existing depth estimates and a new control-point training set. We compared the estimated depth with the in-situ depth values in order to evaluate the accuracy of the proposed SDB estimation method. Indeed, our method thoroughly exploits the water depth control-point information, in order to effectively reduce the depth estimation error and boost the accuracy of water depth inversion.
3. Experimental Data Collection
3.1. Sentinel-2 Imagery
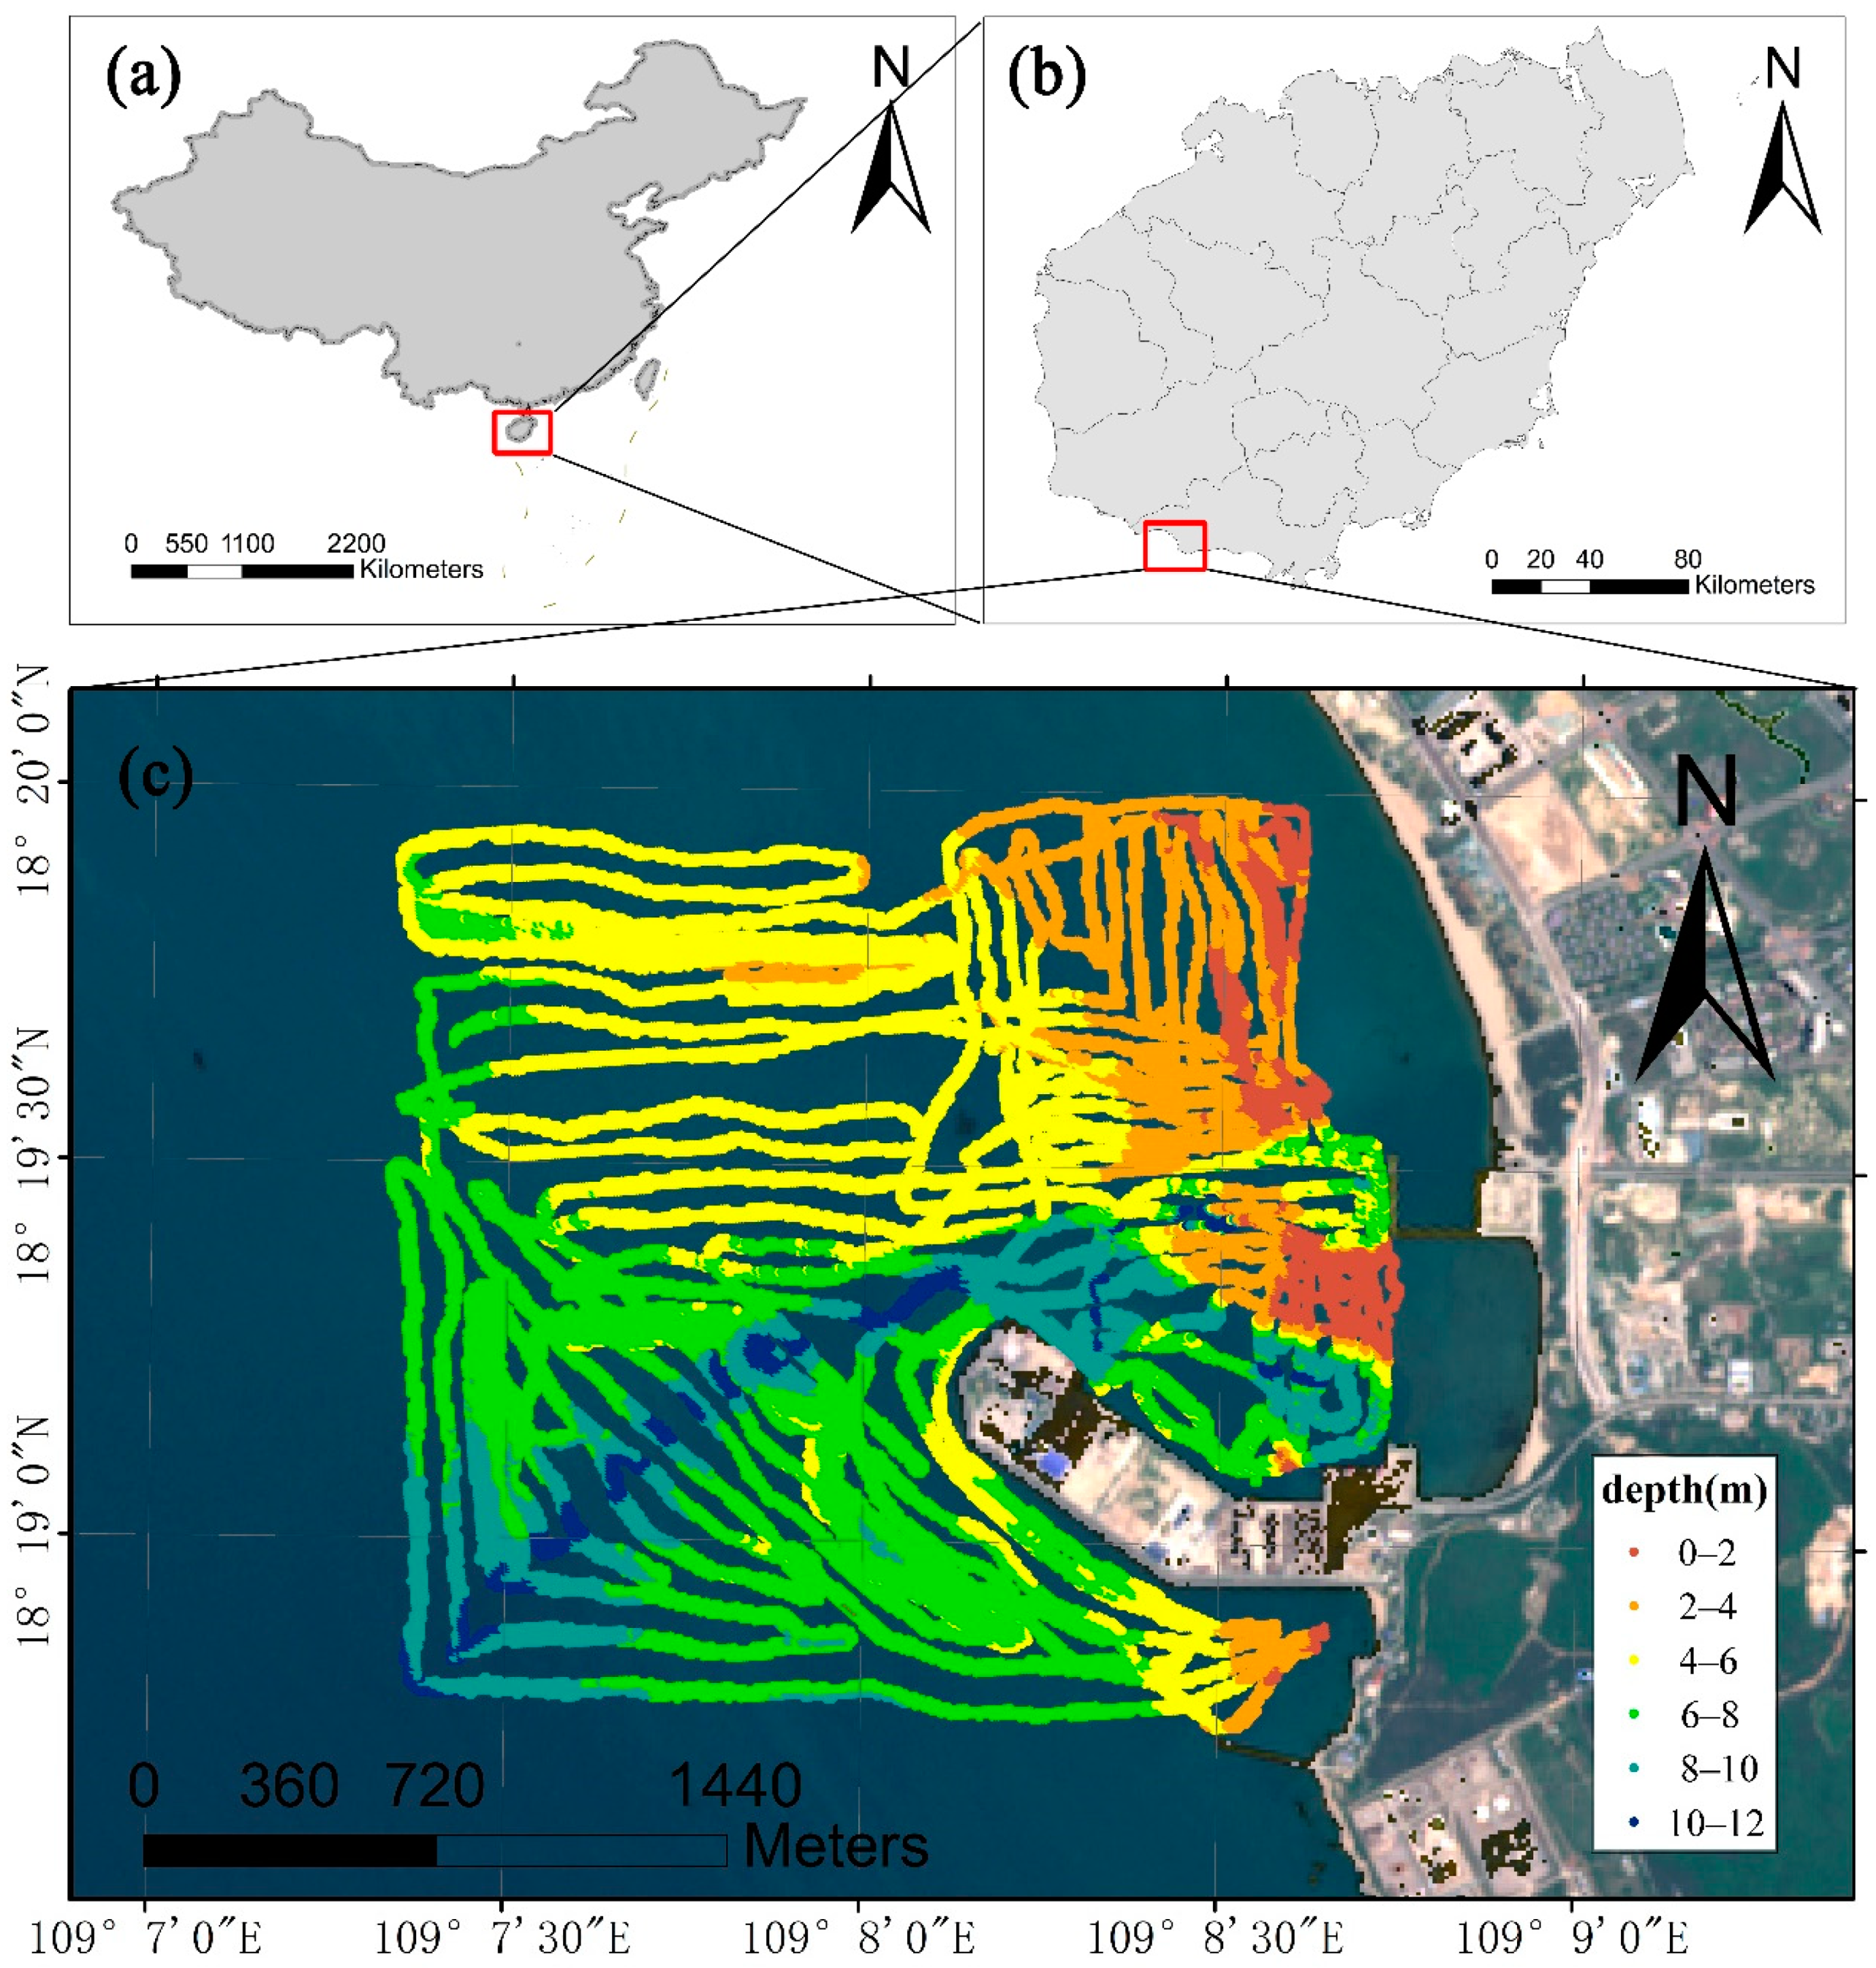
The experimental work was carried out at Nanshan port (18°18′30″N to 109°7′00″E), located to the south of Hainan Province, China. Nanshan port (Figure 2) and the wharf there have been the target for large-scale reconstruction and expansion since 2005. This port is one of the most important in Southeast Asia, but its water is mostly turbid, muddy and opaque (as its Chinese name implies).
The Sentinel-2 satellite is currently in orbit, and the data collected by this satellite is available free of charge under an open license through several portals including the Copernicus Open Hub. In this work, we explored data collected on 17 July 2021. For data preprocessing and analysis, we used the sentinel application platform (SNAP) software [28], which is an open-source architecture that combines several toolkits provided by the European Space Agency (ESA). The water depth map at Nanshan port is predicted based on Sentiel-2 imagery data for several spectral reflection bands (namely, 1, 2, 3, 4, 5, 6, 7, 8, 8a, 9, 11 and 12). All spectral images were downsampled to a resolution of 10 × 10 m. The Sen2Cor software was used to perform atmospheric correction and to convert the sensor-based reflectance to surface reflectance. Finally, the sunlight effects were removed through S2 view resampling in the SNAP software.
3.2. In Situ Data
From 11–13 July 2021, two acoustic surveys were conducted in the Nanshan port, using an R2Sonic 2024 Wideband Multibeam Echo Sounder, an Octans all-in-one gyrocompass and motion sensor, Trimble Beacon differential global positioning systems (GPS), a Teledyne Odom surface sound velocity probe, and a sound velocity profiler. In particular, the differential GPS modules were used for navigation and positioning in multibeam bathymetry and sea sweeping (where the positioning system had a nominal dynamic accuracy of ±1 m). The R2Sonic 2024 Sounder is a 5G broadband high-resolution shallow-water multibeam system (R2Sonic, Austin, TX, USA). In addition, the Octans optical-fiber-equipped compass and motion sensor represent the only measurement-level compass certified by the International Maritime Organization (IMO). This all-in-one device contains three optical-fiber gyroscopes and three accelerometers, which allow a six-degree-of-freedom motion and provide the true-north potential angle of the carrier. This device has also a built-in adaptive heave prediction filter, which can provide real-time accurate and reliable motion attitude data. During the measurement process, the wind speed was at a level of 2–3 and the wave height is between 0.1–0.2 m. These conditions satisfied the basic requirements of satellite bathymetry. Tidal offset correction for the study area was performed based on tidal data obtained from the China Maritime Service website.
In the topographic map, the water depth is irregularly distributed. Indeed, the water near the shore is shallow, about 0–2 m, while the water is deep near the wharf. Moreover, the minimum water depth near the wharf is more than 4 m, while the water depth on the north side of the wharf exceeds 8 m. In the middle of the investigated area, there is a channel with water depth above 10 m.
4. Experimental Setup and Results
We investigated the accuracy of water depth estimation based on integrating multiple training datasets of Sentinel-2 images and machine learning algorithms. The performance of the proposed approach is compared against that of a single training dataset. Note that the number of samples affects the depth estimation results, and that the higher the number of training samples, the higher the accuracy. Therefore, we chose a high sample size for water depth estimation, and randomly selected calibration and verification samples from the in situ measurements. Each training set has 4000 points; the first layer of the ensemble training set has 4000 points; and its second layer has a training set of 1000 points. Firstly, a training set of 4000 points and a machine learning algorithm were used to estimate the water depth, and a 1000-point training set was used for inversion to obtain the value of the first layer. The water depth was retrieved based on the control points associated with the 1000-point training set. Then, this training set was used for inversion to obtain the final depth results. Finally, the final results obtained by different machine learning algorithms in the first layer were used to obtain the values of the RMSE and the coefficient of determination R2.
The experiments were carried out in a Python environment. In order to ensure the consistency and stability of different algorithms, each experiment was repeated 20 times. In addition, in order to reduce the influence of the uneven spatial distribution of the water depth control points, the training and verification points were selected using spatial uniform sampling instead of equal sampling. Random calibration samples were selected with the same relative percentage as that of the depth distribution. For each sample, the RMSE and R2 values were calculated between the retrieved and ground-truth water depth values, and the final result was set as the average value over all samples.
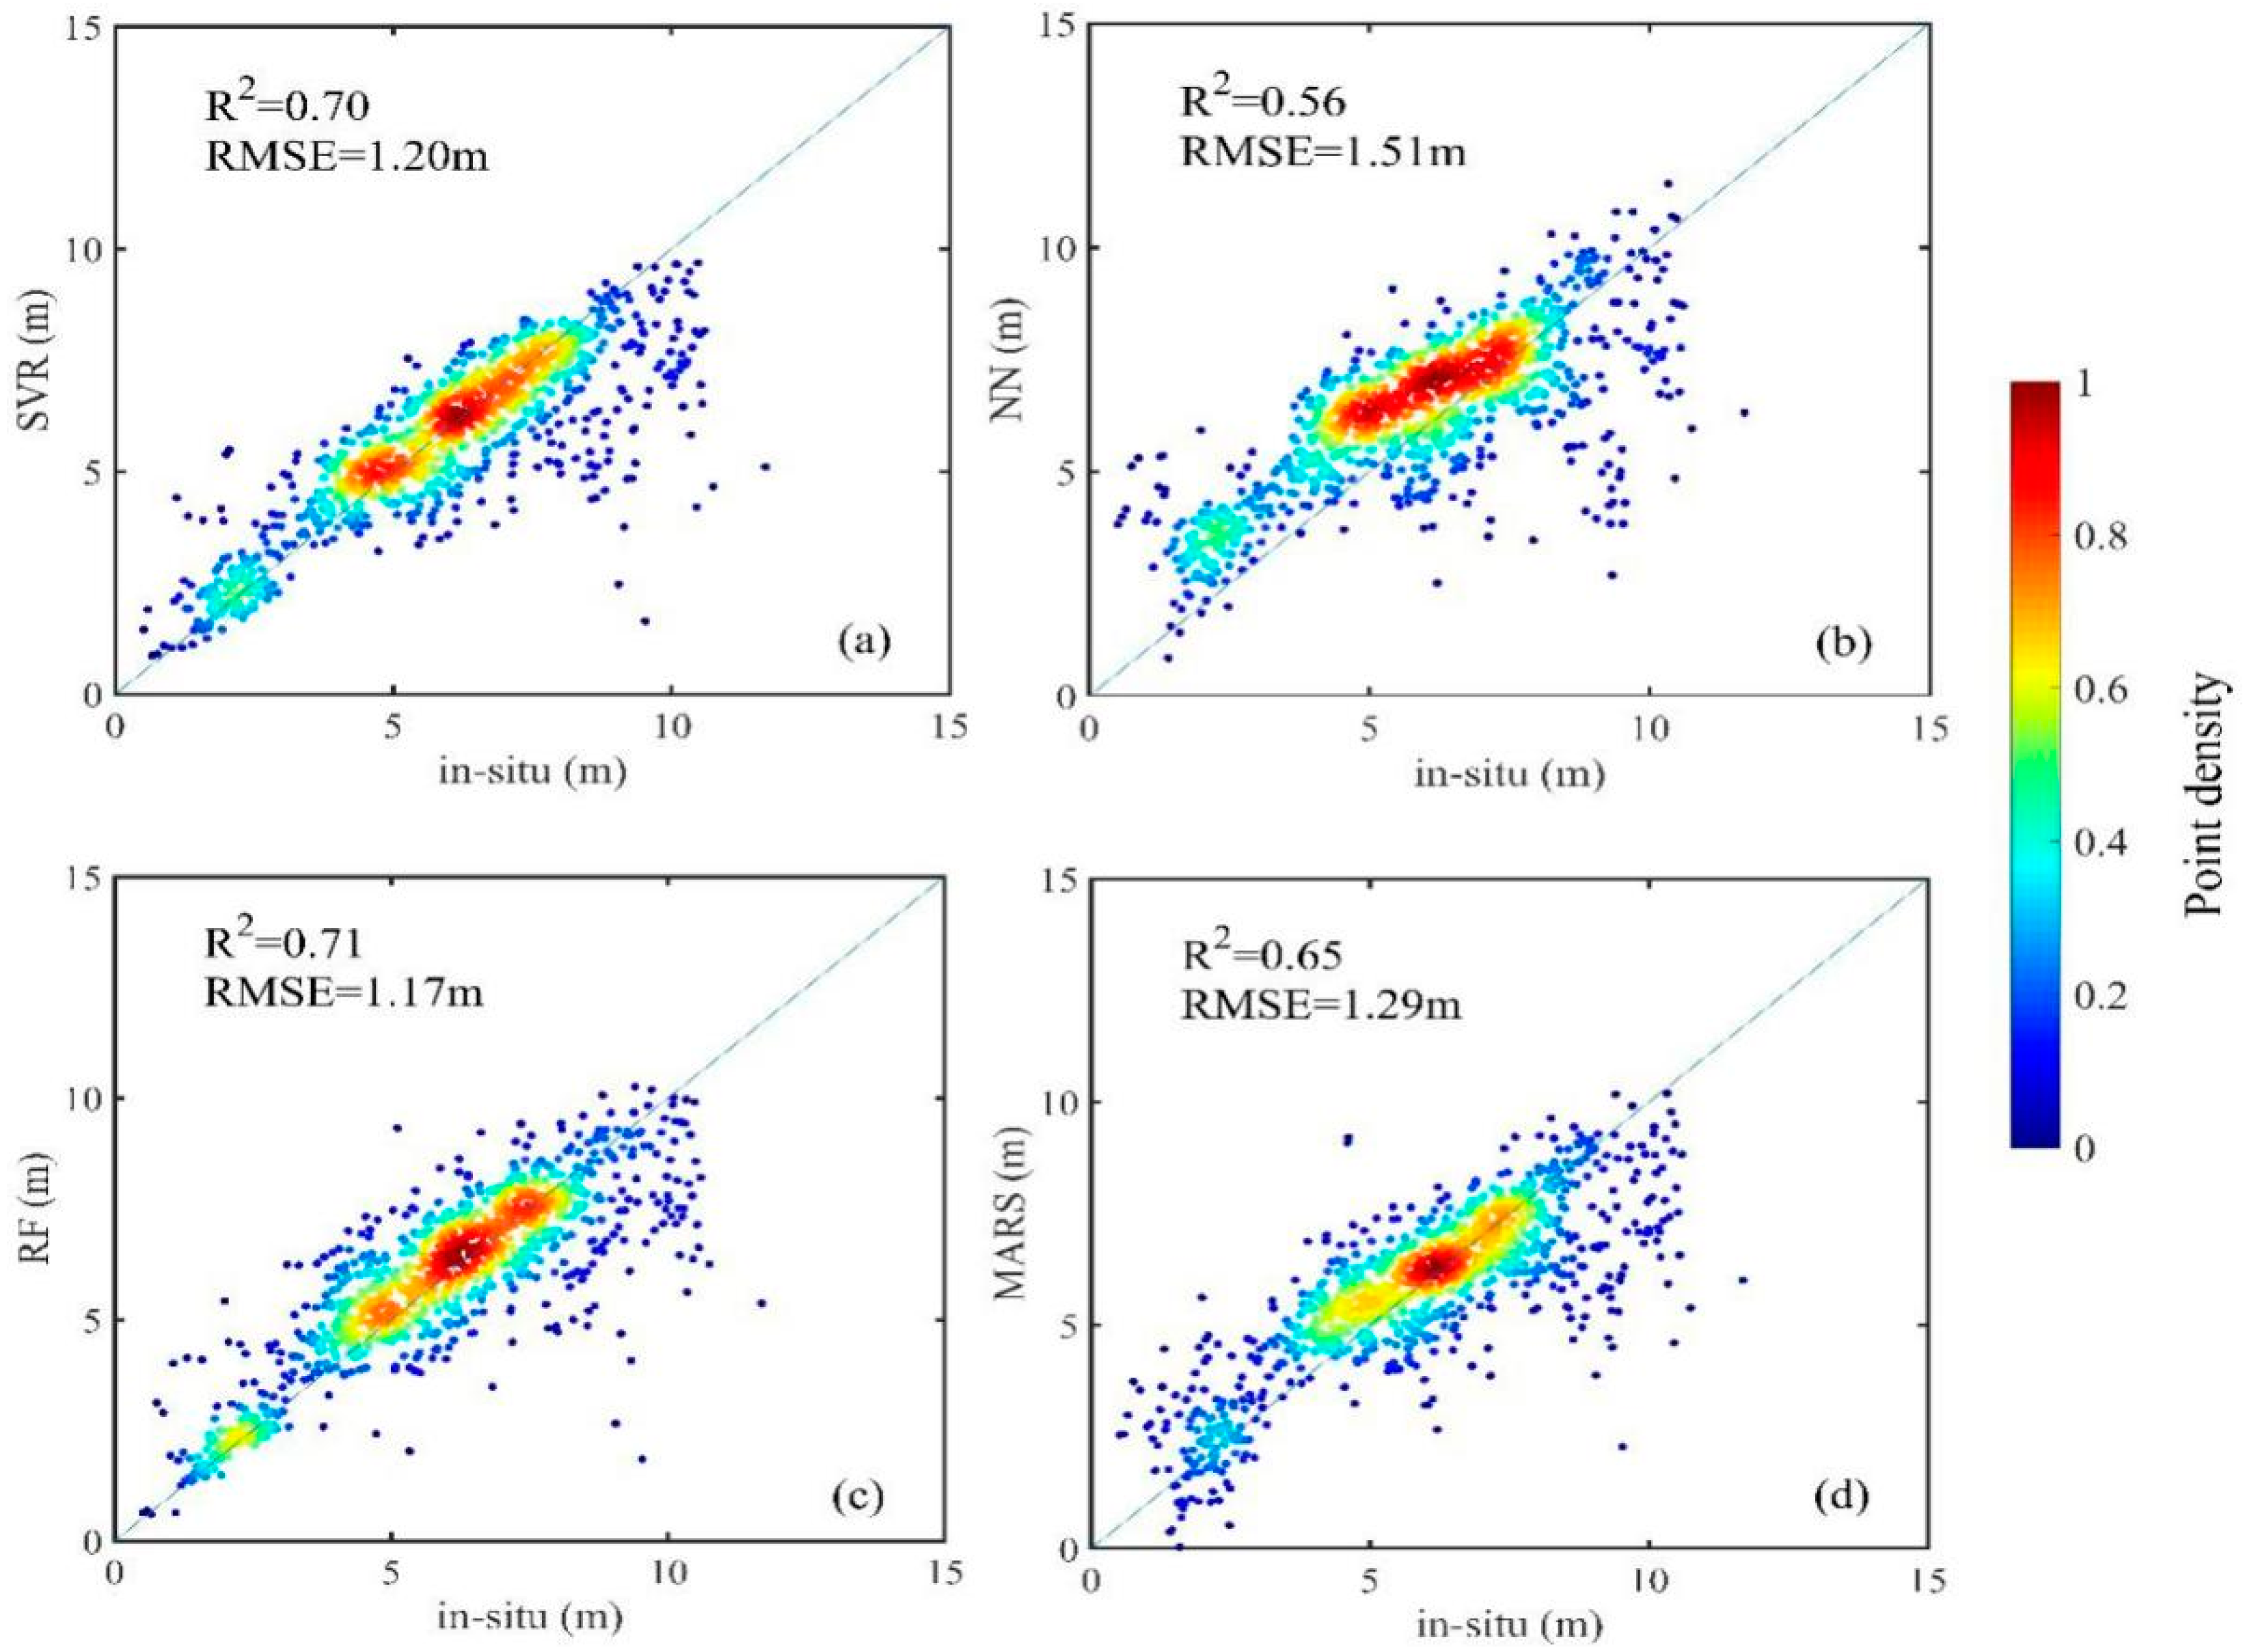
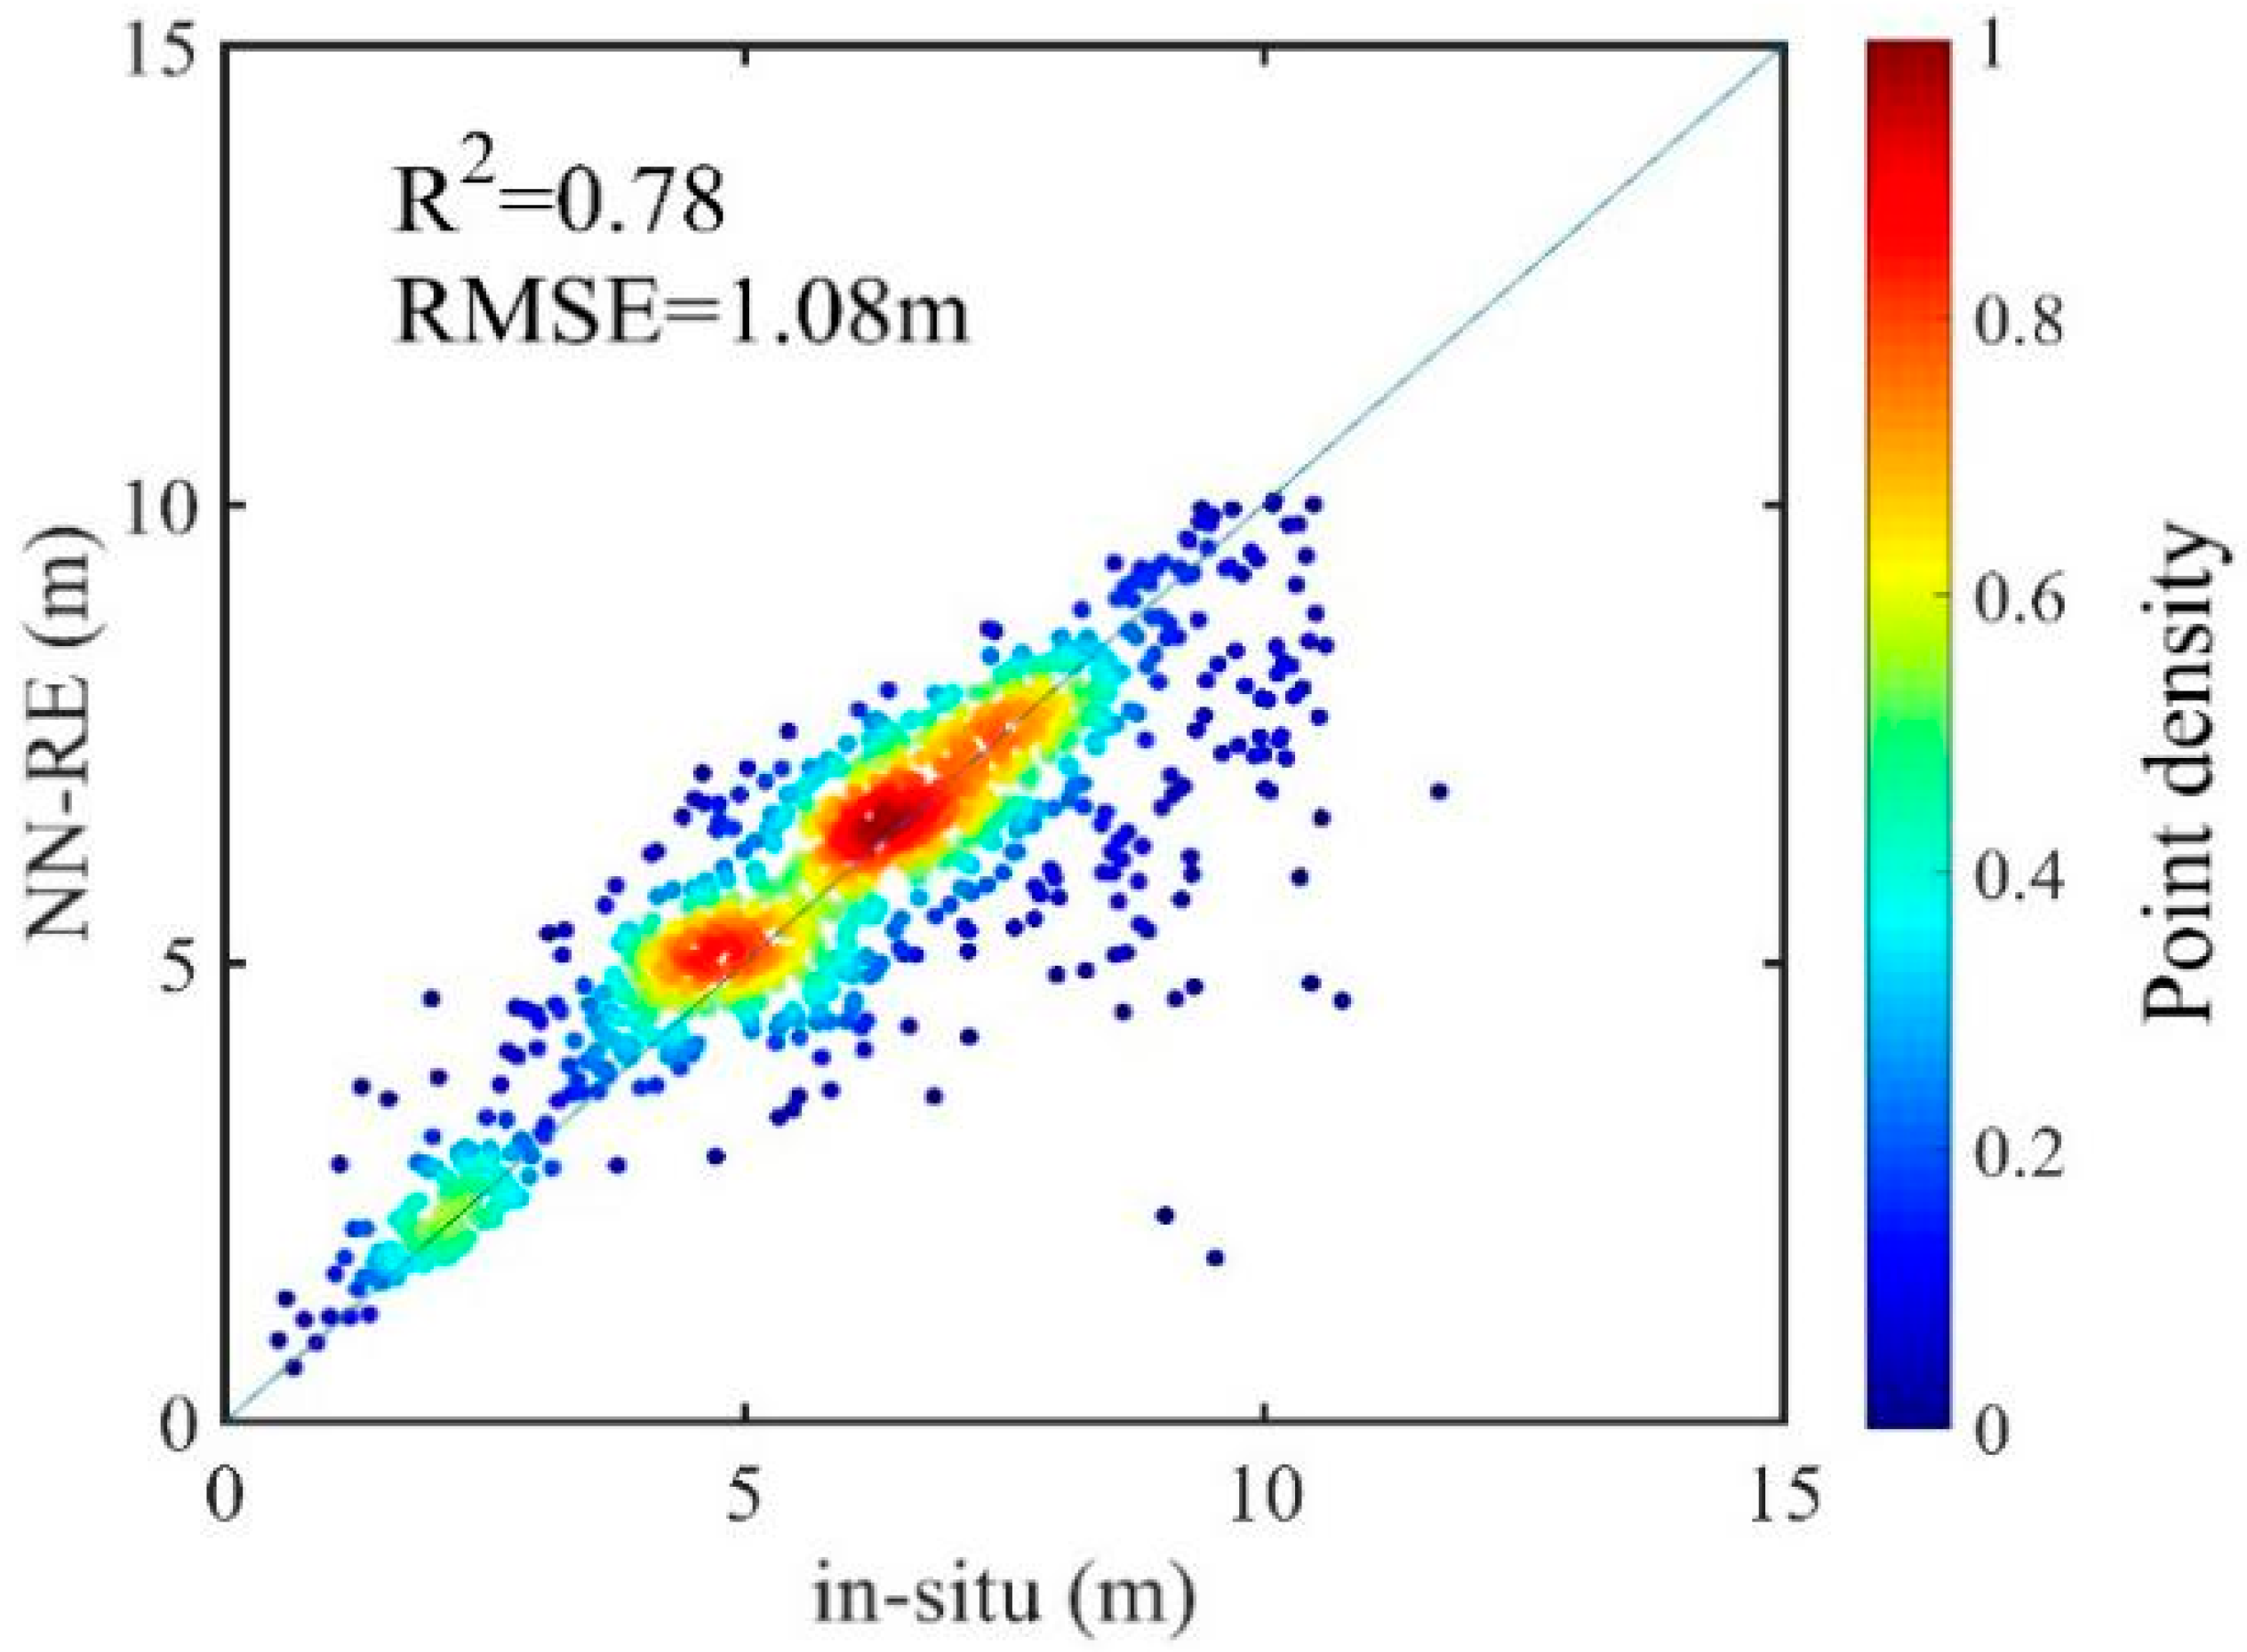
The water depth estimation results varied among the different machine learning algorithms. As the training dataset size increases, the RMSE value decreases while the R2 value increases (see Figure 3 and Figure 4). Although the number of samples influences the results, the conclusions are consistent with those of a moderate number of training samples. For Nanshan port, when one training dataset was used, the regression result based on random forests was the best while the neural-network-based result was the worst. However, the neural-network result with two training datasets was significantly better than that with one training dataset (see Figure 3 and Figure 4).
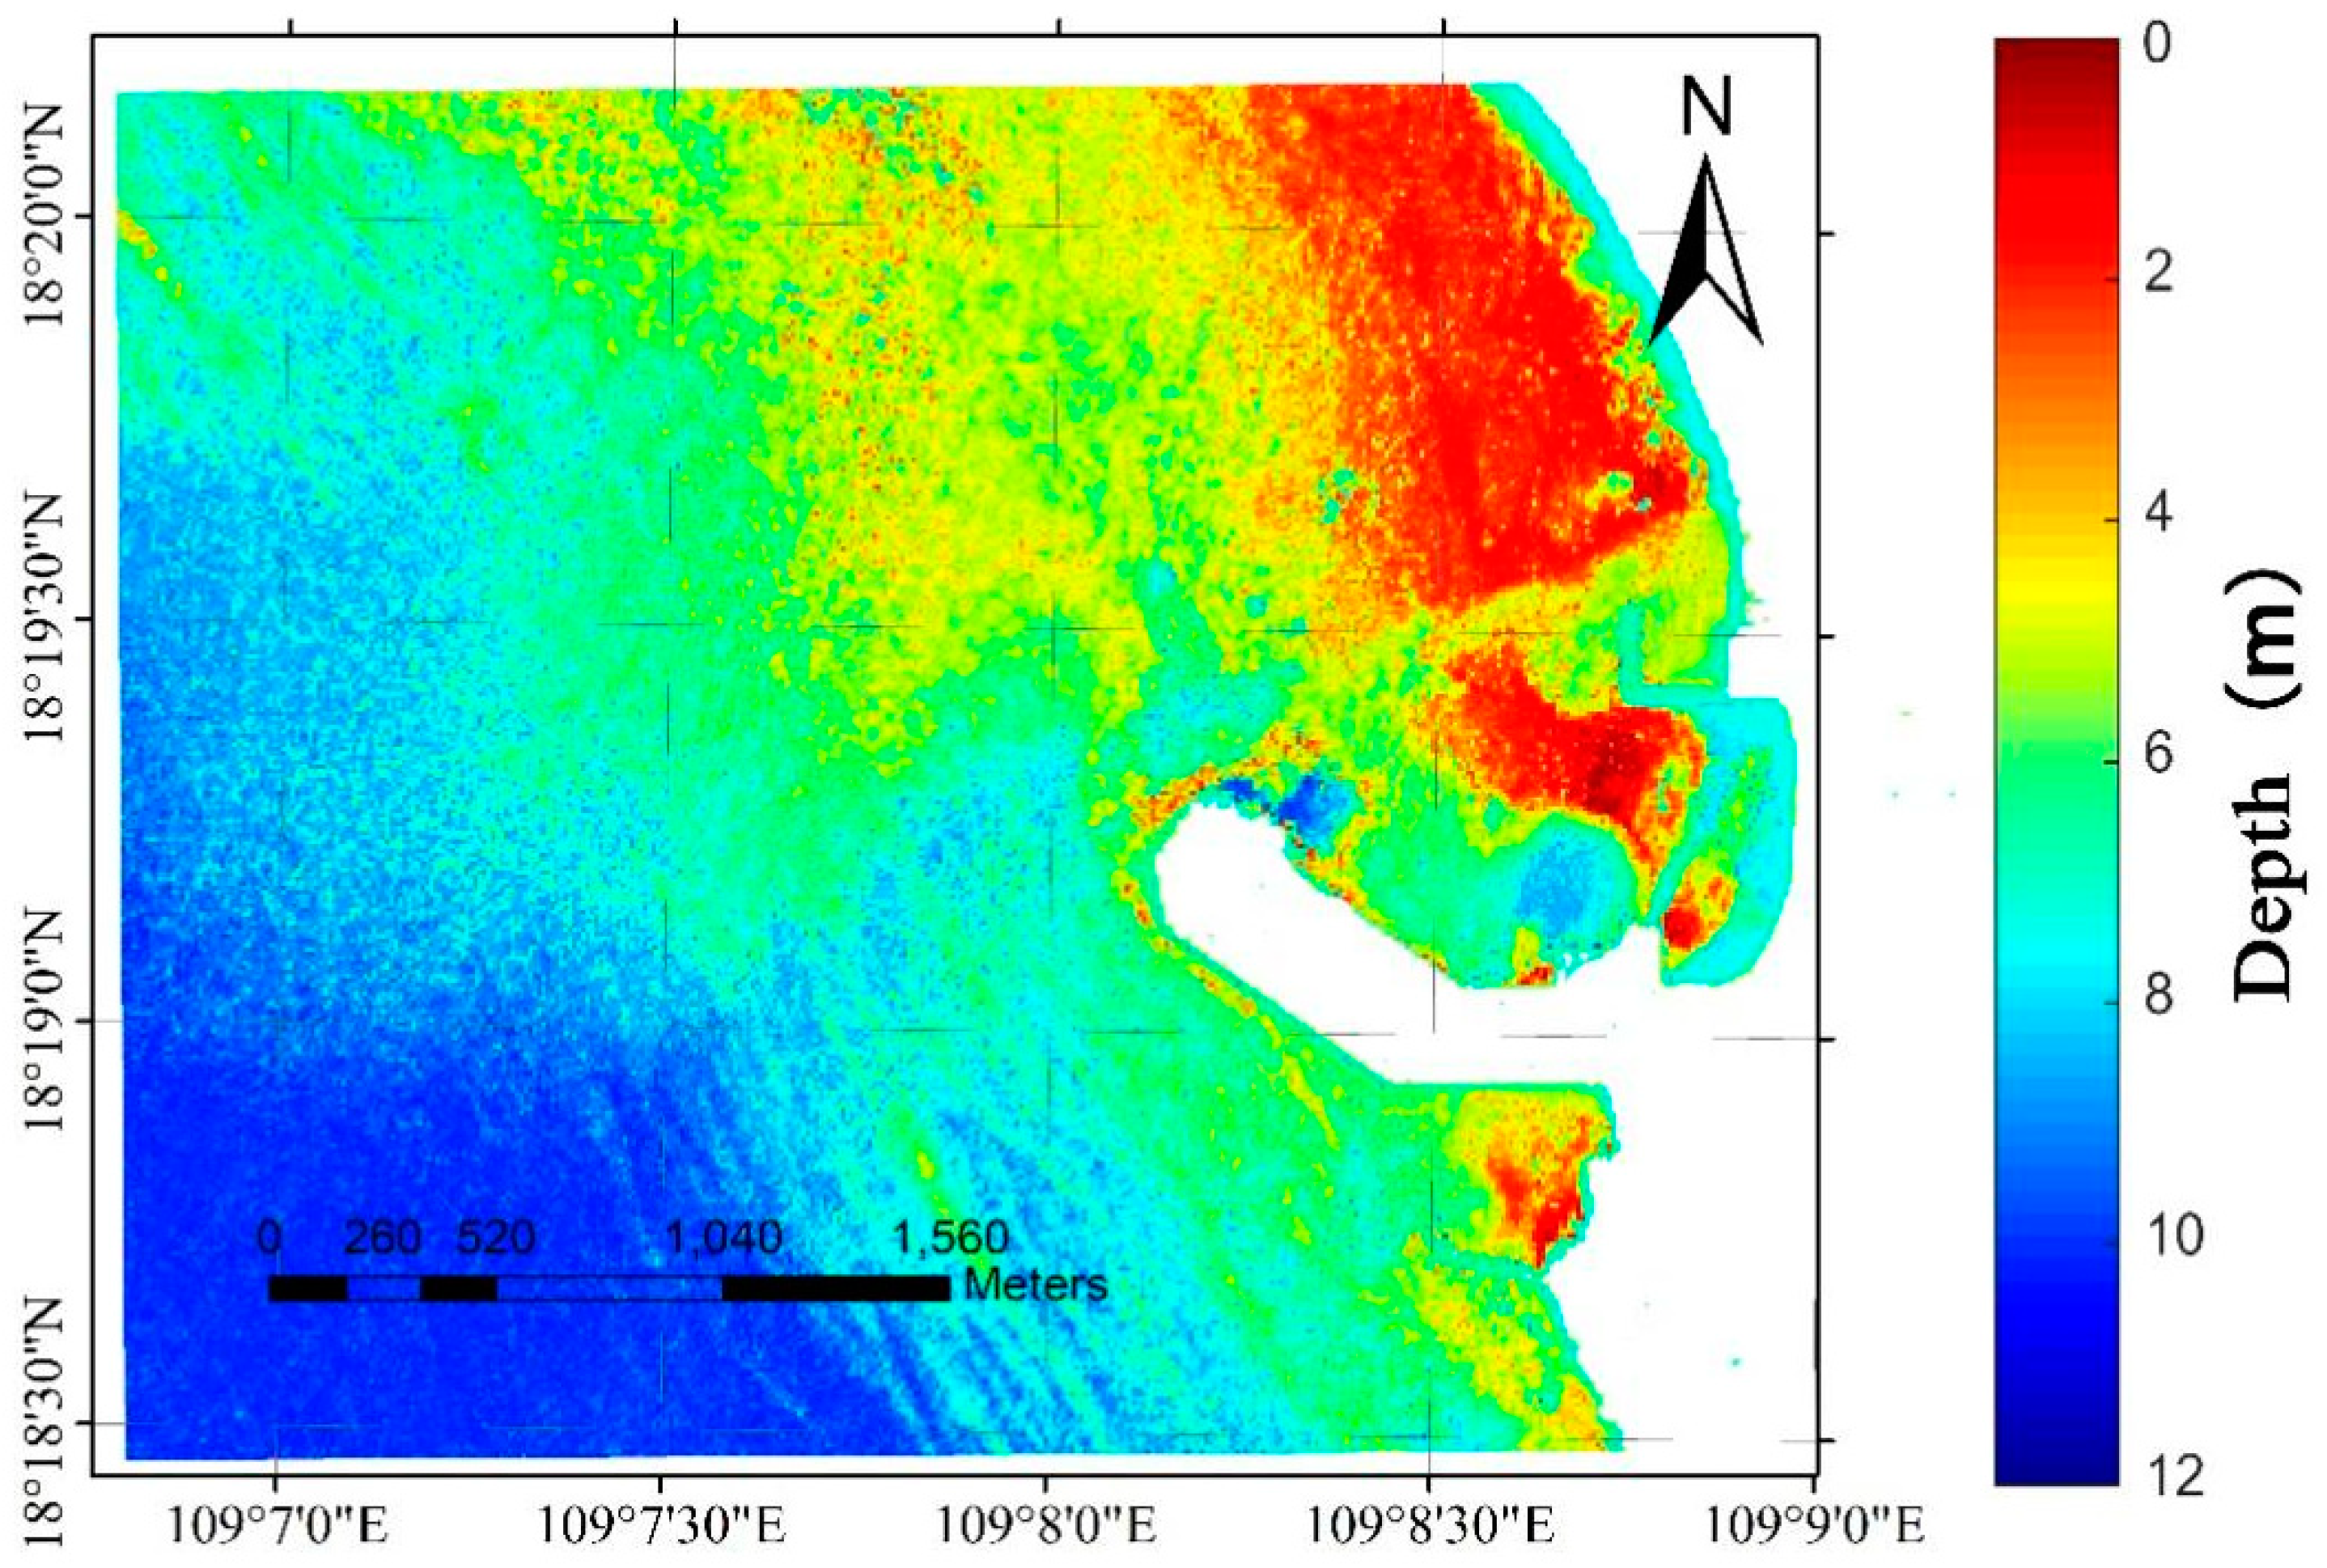
Collectively, Figure 5 shows a map of the estimated water depth for the study area with a depth range of 0–12 m. The results show lower accuracies at shallow depths (<0.5 m) and high depths (>11 m) for Nanshan port, and this is especially true in the vicinity of the shoreline. However, the depth estimation results are more accurate for the depth range of 1–10 m. In addition, flare removal is applied only to the visible band (but not the infrared one), and the depth mapping results have significant noise due to the presence of the flare-contaminated infrared band patterns. Compared with the measured data, the satellite-based topographic map can better reflect the trend of the water depth variability, except for some minor errors in the details. At 0–4 m, the trend of both is basically the same, and the area in the upper left corner of the 4–6 m study area is estimated to be very deep. At depths of 6–8 m, the trend of water depth is similar, and the satellite-based depth result can reflect the channel in the field survey, but underestimates the actual water depth. The depth around the wharf has been well estimated (except for the northern part of the wharf; this might be a result of water conditions, which allow a clear boundary between images and depth estimation results). The result map shows that the satellite-based water depth estimation is highly reliable.
5. Discussion
No machine learning algorithm or solution can generally perform well on all sets of data. Therefore, multiple algorithms are usually employed to find the best solution. Here, we compare bathymetry results for different water depth ranges based on the root-mean-square errors of the NN, RF, SVM and MARS classifiers as well as the proposed integrating method (Table 1). These methods enable water depth estimation under different conditions of human activities, pollution, or sediment accretion. The proposed ensemble method has the highest overall accuracy with a RMSE that is 0.1 m less than the closest RMSE value among all other methods. However, the proposed method achieves the best accuracy for only some water depth ranges, namely the 0–3 m and 6–9 m ranges. At the 3–6 m depth range, the SVM method shows the highest accuracy, while the RF method has the highest accuracy at water depths greater than 9 m. Because the machine learning methods exploit all reflectance data and water-depth training points, only the overall best depth estimates are obtained, while the locally optimal estimates are ignored.
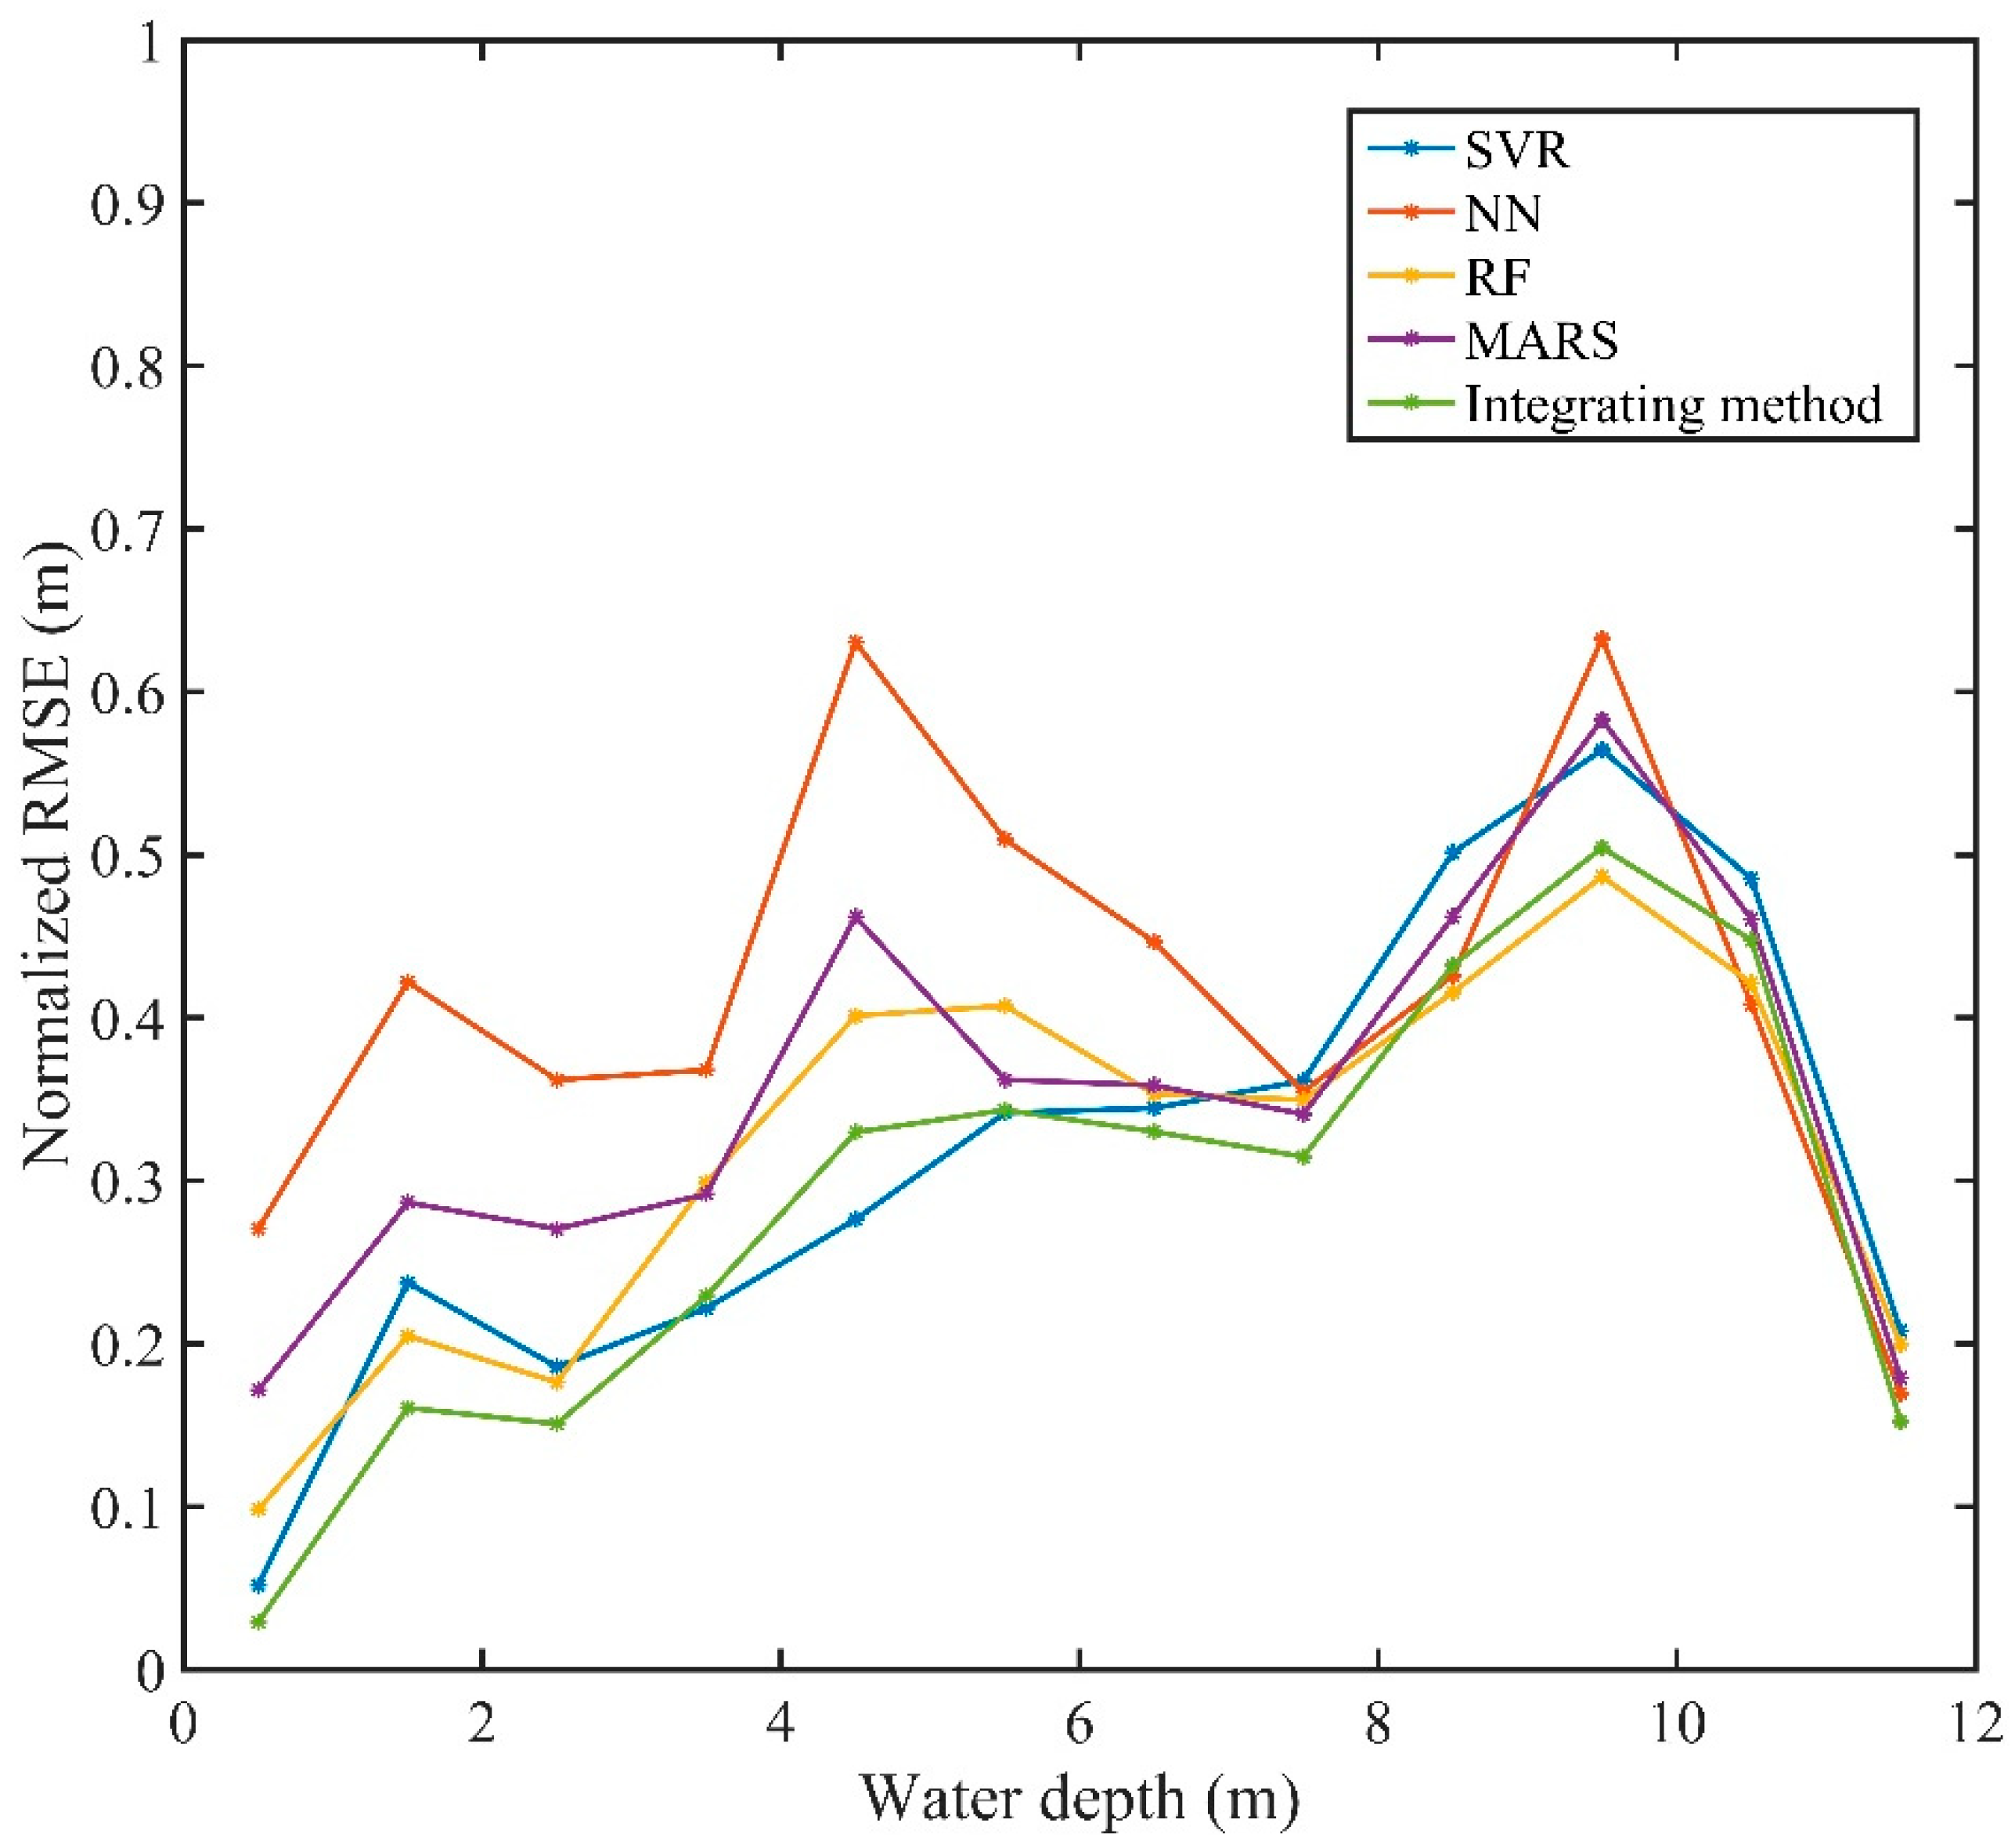
Although the normalized RMSE is greatly affected by the distribution of verification points, it is still an important index with which to measure the accuracy of water depth retrieval. As shown in Figure 6, the normalized RMSE with different water depth range of different methods was plotted. At 0–3 m, the accuracy of the integration method is the highest and that of the neural network is the worst. However, at 3–6 m, the error of the integration method is higher than that of SVR, which is not the optimal method. The error of the integration method is the smallest at 6–9 m, and the error of RF is the smallest in the range greater than 9 m. It can be seen that the optimal algorithms in different water depth ranges are different, but in conclusion, the error of the integrated method is the smallest, and this result from Figure 6 is consistent with Table 1, which means the integrated method can be used in the water depth retrieval of the port.
As Nanshan port is an open port, the ambient water environment is significantly affected by other factors, especially the sediment content. Although no turbidity measurements are available on site, the geographical environment and the remote-sensing image data indicate that Nanshan port is particularly and greatly affected by sedimentation. In fact, the water depth estimation errors of all methods are relatively large, where the RMSE is typically more than 1 m. This RMSE is much higher than the 0.44 m RMSE value of Luarca port at the depth range of 0–12 m [16], and is also much higher than the 0.44-m RMSE value of the turbid waters studied in [19], (where the RMSE was obtained using WorldView-2 data and the Lyzenga method). Due to the availability of a large number of bathymetric in situ data sets for our study, the selected verification and training points do not coincide completely. This eliminates the autocorrelation problem that typically occurs in other machine learning methods for bathymetric estimation. The first set of machine learning results also affect the water depth estimation. The learning parameters of all models are all set up appropriately. In fact, different parameter settings could lead to different estimation results. However, the depth inversion results based on the ensemble training are still better than the single-model ones. Meanwhile, the water depth mapping results are also affected by the image quality and the processing methods.
6. Conclusions
In this paper, a water depth estimation method is proposed for turbid seaport environments. This method combines several training datasets and machine learning algorithms. The results obtained from a single training dataset are compared with those obtained using multiple datasets. Because all spectral bands are affected by water attenuation and reflections of the seabed, the band ratio method is not suitable for water depth estimation. Moreover, the machine learning algorithms show clearly different estimates of water depth. By contrast, the ensemble learning methods can combine such algorithms to further improve the depth estimation accuracy and generally reduce the RMSE by 0.1 m. The depth estimates obtained based on multiple datasets are better than those based on individual datasets, with lower RMSE values and higher R2 values. The experimental results show that the proposed method can improve the depth estimates to a certain extent with a RMSE of 1.07 m for the depth range of 0–13 m. The inversion accuracy for all water depth levels is very high, except for the water channel were the depth exceeds 9 m. This drop in performance can be ascribed to the fact that the water quality conditions are similar, the water depth is very large, and the remote-sensing reflectance data cannot then correctly reflect the change in the water depth. Although the number of training samples has a visible impact on the depth estimation performance, the overall trend is largely unaffected. Since there is no clear relationship between the observed results and the estimated physical parameters, the proposed method can potentially be extended to estimate other physical parameters (including water turbidity and sediment content) based on remote-sensing image analysis.
In summary, the proposed method combining multiple training datasets and machine learning methods is effective in estimating water depth from satellite images, and this method is indeed better than those based on individual training datasets. Due to the non-parametric nature of the machine learning method, it can successfully retrieve the water depth from the observed satellite images with a relatively higher degree of coherence and consistency compared to the depth estimates made by the acoustic method. In future work, the water depth estimation accuracy can be improved through atmospheric correction algorithms for high-resolution remote-sensing images. These algorithms can be applied with ensemble learning to deal with different depths of coastal turbid water.
Author Contributions
Z.M. conceptualized the BATHYMETRY project, secured funding and collected the Sentinel-2 data and Sonar data. Z.W. and W.S. developed the algorithm with input from W.S.; Z.W. performed analysis and wrote manuscript. All authors have read and agreed to the published version of the manuscript.
Funding
This study is supported by the High Resolution Earth Observation Systems of National Science and Technology Major Projects (05-Y30B01-9001-19/20-2), the National Key Research and Development Program of China (2016YFC1400901), and the National Science Foundation of China (61991454).
Acknowledgments
The authors would like to thank all the reviewers who participated in the review and MJEditor (www.mjeditor.com) for its linguistic assistance during the preparation of this manuscript.
Conflicts of Interest
The authors declare no conflict of interest.
References
- Moberg, F.; Folke, C. Ecological goods and services of coral reef ecosystems. Ecol. Econ. 1999, 29, 215–233. [Google Scholar] [CrossRef]
- Horta, J.; Pacheco, A.; Moura, D.; Ferreira, Ó. Can recreational echosounder-chartplotter systems be used to perform accurate nearshore bathymetric surveys? Ocean Dyn. 2014, 64, 1555–1567. [Google Scholar] [CrossRef]
- Purkis, S.J.; Gleason, A.C.R.; Purkis, C.R.; Dempsey, A.C.; Renaud, P.G.; Faisal, M.; Saul, S.; Kerr, J.M. High-resolution habitat and bathymetry maps for 65,000 sq. km of Earth’s remotest coral reefs. Coral Reefs 2019, 38, 467–488. [Google Scholar] [CrossRef] [Green Version]
- Norén, A.; Karlfeldt Fedje, K.; Strömvall, A.-M.; Rauch, S.; Andersson-Sköld, Y. Integrated assessment of management strategies for metal-contaminated dredged sediments—What are the best approaches for ports, marinas and waterways? Sci. Total Environ. 2020, 716, 135510. [Google Scholar] [CrossRef]
- Wang, L.; Chen, L.; Tsang, D.C.W.; Li, J.-S.; Baek, K.; Hou, D.; Ding, S.; Poon, C.-S. Recycling dredged sediment into fill materials, partition blocks, and paving blocks: Technical and economic assessment. J. Clean. Prod. 2018, 199, 69–76. [Google Scholar] [CrossRef]
- Cecchi, G.; Vagge, G.; Cutroneo, L.; Greco, G.; Di Piazza, S.; Faga, M.; Zotti, M.; Capello, M. Fungi as potential tool for polluted port sediment remediation. Environ. Sci. Pollut. Res. 2019, 26, 35602–35609. [Google Scholar] [CrossRef] [PubMed]
- Kearns, T.A.; Breman, J. Bathymetry-The art and science of seafloor modeling for modern applications. Ocean Globe 2010, 1–36. [Google Scholar]
- Lyzenga, D.R.; Malinas, N.R.; Tanis, F.J. Multispectral bathymetry using a simple physically based algorithm. IEEE Trans. Geosci. Remote Sens. 2006, 44, 2251–2259. [Google Scholar] [CrossRef]
- Coggins, L.X.; Ghadouani, A. High-Resolution Bathymetry Mapping of Water Bodies: Development and Implementation. Front. Earth Sci. 2019, 7, 330. [Google Scholar] [CrossRef]
- Gao, J. Bathymetric mapping by means of remote sensing: Methods, accuracy and limitations. Prog. Phys. Geogr. Earth Environ. 2009, 33, 103–116. [Google Scholar] [CrossRef]
- Zhigang, P.; Glennie, C.; Legleiter, C.; Overstreet, B. Estimation of Water Depths and Turbidity From Hyperspectral Imagery Using Support Vector Regression. IEEE Geosci. Remote Sens. Lett. 2015, 12, 2165–2169. [Google Scholar] [CrossRef]
- Stumpf, R.P.; Holderied, K.; Sinclair, M. Determination of water depth with high-resolution satellite imagery over variable bottom types. Limnol. Oceanogr. 2003, 48, 547–556. [Google Scholar] [CrossRef]
- Sagawa, T.; Yamashita, Y.; Okumura, T.; Yamanokuchi, T. Satellite Derived Bathymetry Using Machine Learning and Multi-Temporal Satellite Images. Remote Sens. 2019, 11, 1155. [Google Scholar] [CrossRef] [Green Version]
- Ceyhun, O.; Yalcin, A. Remote sensing of water depths in shallow waters via artificial neural networks. Estuar Coast Shelf S 2010, 89, 89–96. [Google Scholar] [CrossRef]
- Liaw, A.; Wiener, M. Classification and regression by randomForest. R News 2002, 2, 18–22. [Google Scholar]
- Mateo-Pérez, V.; Corral-Bobadilla, M.; Ortega-Fernández, F.; Vergara-González, E.P. Port Bathymetry Mapping Using Support Vector Machine Technique and Sentinel-2 Satellite Imagery. Remote Sens. 2020, 12, 2069. [Google Scholar] [CrossRef]
- Mateo-Pérez, V.; Corral-Bobadilla, M.; Ortega-Fernández, F.; Rodríguez-Montequín, V. Determination of Water Depth in Ports Using Satellite Data Based on Machine Learning Algorithms. Energies 2021, 14, 2486. [Google Scholar] [CrossRef]
- Lafon, V.; Froidefond, J.; Lahet, F.; Castaing, P. SPOT shallow water bathymetry of a moderately turbid tidal inlet based on field measurements. Remote Sens. Environ. 2002, 81, 136–148. [Google Scholar] [CrossRef]
- Bramante, J.F.; Raju, D.K.; Sin, T.M. Multispectral derivation of bathymetry in Singapore’s shallow, turbid waters. Int. J. Remote Sens. 2013, 34, 2070–2088. [Google Scholar] [CrossRef]
- Sánchez-Carnero, N.; Ojeda-Zujar, J.; Rodríguez-Pérez, D.; Marquez-Perez, J. Assessment of different models for bathymetry calculation using SPOT multispectral images in a high-turbidity area: The mouth of the Guadiana Estuary. Int. J. Remote Sens. 2014, 35, 493–514. [Google Scholar] [CrossRef]
- Caballero, I. Assessment of a multi-scene approach with sentinel-2A/B imagery to estimate satellite-derived Bathymetry over moderately turbid regions. In Proceedings of the Living Planet Symposium, Milan, Italy, 13–17 May 2019. [Google Scholar]
- Caballero, I.; Stumpf, R.P.; Meredith, A. Preliminary assessment of turbidity and chlorophyll impact on bathymetry derived from Sentinel-2A and Sentinel-3A satellites in South Florida. Remote Sens. 2019, 11, 645. [Google Scholar] [CrossRef] [Green Version]
- Caballero, I.; Stumpf, R.P. Towards routine mapping of shallow bathymetry in environments with variable turbidity: Contribution of Sentinel-2A/B satellites mission. Remote Sens. 2020, 12, 451. [Google Scholar] [CrossRef] [Green Version]
- Liu, Y.; Zhao, J.; Deng, R.; Liang, Y.; Gao, Y.; Chen, Q.; Xiong, L.; Liu, Y.; Tang, Y.; Tang, D. A downscaled bathymetric mapping approach combining multitemporal Landsat-8 and high spatial resolution imagery: Demonstrations from clear to turbid waters. ISPRS J. Photogramm. Remote Sens. 2021, 180, 65–81. [Google Scholar] [CrossRef]
- Mohamed, H.; Negm, A.; Zahran, M.; Saavedra, O.C. Bathymetry Determination from High Resolution Satellite Imagery Using Ensemble Learning Algorithms in Shallow Lakes: Case Study El-Burullus Lake. Int. J. Environ. Sci. Dev. 2016, 7, 295–301. [Google Scholar] [CrossRef] [Green Version]
- Surisetty, V.V.A.K.; Venkateswarlu, C.; Gireesh, B.; Prasad, K.V.S.R.; Sharma, R. On improved nearshore bathymetry estimates from satellites using ensemble and machine learning approaches. Adv. Space Res. 2021, 68, 3342–3364. [Google Scholar] [CrossRef]
- Friedman, J.H. Multivariate adaptive regression splines. Ann. Stat. 1991, 19, 1–67. [Google Scholar] [CrossRef]
- Cao, B.; Deng, R.; Zhu, S. Universal algorithm for water depth refraction correction in through-water stereo remote sensing. Int. J. Appl. Earth Obs. Geoinf. 2020, 91, 102108. [Google Scholar] [CrossRef]
Figure 1.
The general workflow of the proposed system for water depth estimation from satellite images.
Figure 1.
The general workflow of the proposed system for water depth estimation from satellite images.

Figure 2.
The geographical location of the study area: (a) Hainan Province, (b) Nanshan port, (c) the data collection area where the different colors represent the variations of the in-situ depth data.
Figure 2.
The geographical location of the study area: (a) Hainan Province, (b) Nanshan port, (c) the data collection area where the different colors represent the variations of the in-situ depth data.

Figure 3.
Correlation between the in-situ depths and the water depth estimation results based on one training set of satellite image data and one machine learning method: (a) support vector regression (SVR); (b) neural networks (NN); (c) random forests (RF); (d) multi-adaptive regression splines (MARS).

Figure 4.
Correlation between the in situ depths and the water depth estimation results based on multiple training sets of satellite image data and neural networks (NN).
Figure 4.
Correlation between the in situ depths and the water depth estimation results based on multiple training sets of satellite image data and neural networks (NN).

Figure 5.
The water depth map estimated based on multiple training sets of satellite image data and neural networks (NN).
Figure 5.
The water depth map estimated based on multiple training sets of satellite image data and neural networks (NN).

Figure 6.
The normalized RMSE with different water depth ranged of different methods.


Table 1.
A comparison of the root-mean-square error (RMSE) errors for different water depths and machine learning methods.
Table 1.
A comparison of the root-mean-square error (RMSE) errors for different water depths and machine learning methods.
| Training Method | RMSE | ||||
|---|---|---|---|---|---|
| 0–3 m (127 Points) | 3–6 m (367 Points) | 6–9 m (433 Points) | >9 m (73 Points) | Overall (1000 Points) | |
| NN | 1.74 | 1.47 | 1.08 | 2.86 | 1.51 |
| RF | 0.81 | 1.06 | 0.98 | 2.50 | 1.17 |
| SVR | 0.86 | 0.81 | 1.07 | 2.86 | 1.20 |
| MARS | 1.21 | 1.08 | 1.02 | 2.83 | 1.29 |
| Integrating method | 0.62 | 0.87 | 0.95 | 2.56 | 1.08 |
Publisher’s Note: MDPI stays neutral with regard to jurisdictional claims in published maps and institutional affiliations. |
© 2021 by the authors. Licensee MDPI, Basel, Switzerland. This article is an open access article distributed under the terms and conditions of the Creative Commons Attribution (CC BY) license (https://creativecommons.org/licenses/by/4.0/).
Share and Cite
MDPI and ACS Style
Wu, Z.; Mao, Z.; Shen, W. Integrating Multiple Datasets and Machine Learning Algorithms for Satellite-Based Bathymetry in Seaports. Remote Sens. 2021, 13, 4328. https://0-doi-org.brum.beds.ac.uk/10.3390/rs13214328
AMA Style
Wu Z, Mao Z, Shen W. Integrating Multiple Datasets and Machine Learning Algorithms for Satellite-Based Bathymetry in Seaports. Remote Sensing. 2021; 13(21):4328. https://0-doi-org.brum.beds.ac.uk/10.3390/rs13214328
Chicago/Turabian StyleWu, Zhongqiang, Zhihua Mao, and Wen Shen. 2021. "Integrating Multiple Datasets and Machine Learning Algorithms for Satellite-Based Bathymetry in Seaports" Remote Sensing 13, no. 21: 4328. https://0-doi-org.brum.beds.ac.uk/10.3390/rs13214328
Note that from the first issue of 2016, this journal uses article numbers instead of page numbers. See further details here.