
Merging High-Resolution Satellite Surface Radiation Data with Meteorological Sunshine Duration Observations over China from 1983 to 2017


1
Research Center for Urban Forestry, College of Forestry, Beijing Forestry University, Beijing 100083, China
2
State Key Laboratory of Earth Surface Processes and Resource Ecology, College of Global Change and Earth System Science, Beijing Normal University, Beijing 100875, China
*
Author to whom correspondence should be addressed.
†
These authors contributed equally to this work.
Remote Sens. 2021, 13(4), 602; https://0-doi-org.brum.beds.ac.uk/10.3390/rs13040602
Submission received: 25 December 2020
/
Revised: 4 February 2021
/
Accepted: 5 February 2021
/
Published: 8 February 2021
(This article belongs to the Section Atmospheric Remote Sensing)
Abstract
:Surface solar radiation (Rs) is essential to climate studies. Thanks to long-term records from the Advanced Very High-Resolution Radiometers (AVHRR), the recent release of International Satellite Cloud Climatology Project (ISCCP) HXG cloud products provide a promising opportunity for building long-term Rs data with high resolutions (3 h and 10 km). In this study, we compare three satellite Rs products based on AVHRR cloud products over China from 1983 to 2017 with direct observations of Rs and sunshine duration (SunDu)-derived Rs. The results show that SunDu-derived Rs have higher accuracy than the direct observed Rs at time scales of a month or longer by comparing with the satellite Rs products. SunDu-derived Rs is available from the 1960s at more than 2000 stations over China, which provides reliable decadal estimations of Rs. However, the three AVHRR-based satellite Rs products have significant biases in quantifying the trend of Rs from 1983 to 2016 (−4.28 W/m2/decade to 2.56 W/m2/decade) due to inhomogeneity in satellite cloud products and the lack of information on atmospheric aerosol optical depth. To adjust the inhomogeneity of the satellite Rs products, we propose a geographically weighted regression fusion method (HGWR) to merge ISCCP-HXG Rs with SunDu-derived Rs. The merged Rs product over China from 1983 to 2017 with a spatial resolution of 10 km produces nearly the same trend as that of the SunDu-derived Rs. This study makes a first attempt to adjust the inhomogeneity of satellite Rs products and provides the merged high-resolution Rs product from 1983 to 2017 over China, which can be downloaded freely.
1. Introduction
Long-term changes in surface solar radiation (Rs, spectral range of 0.3–3.0 μm) with a decrease (global dimming) from the 1950s to the late 1980s and a subsequent increase (global brightening) have been observed worldwide [1,2,3,4,5]. Global dimming and brightening inevitably lead to energy balance changes and have substantial impacts on land surface climate, hydrologic cycle, carbon cycle and human activity [6,7,8,9]. However, high-quality Rs observations are very sparsely distributed.
Direct observations can provide accurate Rs records. Careful calibration and instrument maintenance are needed to guarantee the accuracy of observations. Before 1990, the USSR pyranometer imitations had different degradation rates in the thermopile, resulting in an important sensitivity drift [10,11,12]. To overcome radiometer aging, China replaced its instruments from 1990 to 1993. However, the new solar trackers frequently failed and introduced a high missing data rate for the direct radiation component of Rs [13,14]. After 1993, although the instruments were substantially improved, the Chinese-developed pyranometers still had a high thermal offset with directional response errors, and the stability of these instruments was also worse than that of the World Meteorological Organization (WMO)-recommended first-class pyranometers [13,15,16].
Since the 1960s, the possibility of estimating Rs from satellites has been examined in many studies [17,18]. To date, satellite measurement records have grown to cover more than 40 years. In 1983, the International Satellite Cloud Climatology Project (ISCCP) began its operational phase [19]. Many long-term satellite-based climatologies of cloud cover and cloud radiative property data have been released, such as the ISCCP [20], the PATHFINDER Atmospheres-Extended (PATMOS-x; [21]), Maryland version of the Global Energy and Water Cycle Experiment (GEWEX; [22]), EUMETSAT Climate Monitoring Satellite Application Facility (CMSAF) cloud and radiation data record (CLARA-A2; [23]) and the Climate Change Initiative Cloud project (Cloud_cci; [24]) funded by the European Space Agency (ESA). Due to the capability of capturing the spatial distribution and dynamic evolution of clouds from satellite data [10,25], satellite-derived Rs products have long been recognized as better methods to estimate regional and global Rs than numerical modeling [26,27]. Improvement have also been shown in Rs data from DISORT radiation transfer model of the China Meteorological Administration Land Data Assimilation System (CLDAS) by assimilating satellite Rs retrievals from FY2E and ISCCP cloud data [28].
The trend of Rs derived from satellites has been shown to be consistent with ground observations but differs in sign and magnitude [29]. Satellite Rs products based on the early version of the ISCCP cloud dataset show quite different interannual variations in Rs from 1984 to 2000, which are only approximately one half to one third of the direct Rs surface observations over China [30]. The assessment of cloud fraction from ISCCP, PATMOS-x and CLARA-A1 for 1982–2009 over the United States indicates that the ISCCP tends to show less year-to-year variability, while PATMOS-x and CLARA-A1 tend to show higher variability [31]. Wang et al. (2018) [31] also noticed that when neglecting temporal aerosol variability in the satellite algorithms in CLARA-A1 and SARAH-E, the discrepancy between the satellite-estimated and ground-observed SSR trends slightly increased over China in 1999–2015 compared with 1993–2015.
Efforts have been made to obtain optimized Rs data and produce reliable historical Rs data records [4,32,33]. Various methods used to identify and adjust these artifacts in the Rs records have been widely developed. These inhomogeneity test methods mostly require reference series constructed from highly correlated nearby stations [34]. For example, the standard normal homogeneity test (SNHT), Pettitt test, Buishand test and Von Neumann test have been applied to adjust the Rs data in the Global Energy Balance Archive (GEBA) dataset due to the impacts of station relocation and instrument change [35]. Relative tests developed by (Brunetti et al. 2006) [36] were used to correct the Italian Rs data before 1980 [34,37].
The surface sunshine duration (SunDu) is the sum of the time for which the ground surface is irradiated by a direct solar irradiance beam exceeding a certain threshold (usually 120 W/m2) and is considered to be a reliable proxy of Rs [38,39,40,41,42]. Since SunDu is widely recorded at many stations, Tang et al. (2013) [32] extended Rs records to 716 China Meteorological Administration (CMA) routine weather stations from 96 radiation stations based on an artificial neutral network model. SunDu has been used as reference data to adjust the inhomogeneity of direct observations over China. With the improved Angstrom–Prescott model, Tang et al. (2013) [32] show that SunDu data can derive accurate estimates of hourly, daily and monthly Rs. Previous studies further demonstrate that SunDu can be used as a reliable proxy for direct Rs observed data to reconstruct long-term Rs [2,5,43,44,45,46,47]. By using global SunDu-derived Rs records, He et al. (2018) [2] show that SunDu permitted a revisit of global dimming from the 1950s to the 1980s over China, Europe and the USA, with brightening from 1980 to 2009 in Europe and a declining trend of Rs from 1994 to 2010 in China. Wang et al. (2015) [10] also found that the dimming trend from 1961 to 1990 and nearly constant zero trend after 1990 over China, as calculated from the SunDu-derived Rs, were consistent with independent estimates of AOD [48]; they also observed changes in the diurnal temperature range [49] and the observed pan evaporation [50].
The previously mentioned inhomogeneity adjustment methods mainly focus on Rs data over observation sites, and the adjustment processes are generally “point to point” corrections. Comparatively, inhomogeneities in the satellite Rs gridded data have attracted little attention due to the lack of reliable Rs reference data with large spatial coverage. As systematic Rs biases in gridded data can be removed by simple bias correction methods, uncertainties in the long-term variations in the Rs values of gridded data cannot be easily eliminated [51]. As long-term reliable aerosol data are rarely available, especially for data extended before 2000, improved gridded surface radiation data, such as satellite retrievals, will be more challenging.
Merging multisource data can be a practical way to improve Rs data with accurate long-term variations [51,52,53,54,55,56]. The large number of SunDu observations (~2400 stations) with large spatial coverage (Figure 1) can provide substantial benefits to obtain better estimations of Rs over China. On the other hand, based on the ISCCP-HXG cloud products and new ERA5 reanalysis data, Tang et al. (2019) [57] built global satellite Rs products with a 10 km spatial resolution from 1983 to 2017. However, Tang et al. (2019) claimed that its application in quantifying long-term variability should be considered cautiously.
Our previous studies have shown reanalyses have substantial biases due to imperfect parameterization of cloud and aerosols [26,51,58]. Considering the advantages of SunDu-derived Rs and reliable cloud distribution from satellite retrievals, we recently combined ground-based sunshine duration with satellite cloud and aerosol data to produce high resolution long-term Rs [59]. Another approach is to directly merge current high resolution Rs product with SunDu-derived Rs. Therefore, the purpose of this study is to develop a fusion algorithm based on a geographically weighted regression model to improve current Rs satellite gridded data by using surface sunshine duration-derived Rs site data as references over China. First, we use direct Rs observations and SunDu-derived Rs to assess the performances of these long-term satellite Rs products, including CMSAF CLARA-A2 (CMSAF), GEWEX-SRB (GEWEX) and ISCCP-HXG (HXG), over China, especially for the long-term Rs trends. These comparisons demonstrate that SunDu-derived Rs is a reliable data source and that satellite products have significant inhomogeneity in quantifying the long-term variability in Rs over China. In terms of the longest time span (1983~2017) of ISCCP-HXG, we merge ISCCP-HXG with SunDu-derived Rs to obtain the best estimate of Rs over China.
2. Data and Methodology
2.1. Satellite Retrievals of Surface Solar Radiation
We collect three AVHRR based satellite monthly Rs data including: (1) the Satellite Application Facility on Climate Monitoring cLoud, Albedo and surface RAdiation dataset from AVHRR data—Edition 2 (CMSAF CLARA-A2), (2) The Global Energy and Water Exchanges-surface radiation budget (GEWEX-SRB), (3) the level 2 International Satellite Cloud Climatology Project ISCCP H-series cloud product HXG (ISCCP-HXG) based Rs product. In addition, Clouds and the Earth’s Radiant Energy System energy balanced and filled product (CERES EBAF) surface product (Edition 4.1) are also used in this study. The brief summary of these satellite Rs data are shown in Supplementary Material Table S1.
The retrieval algorithms of CLARA-A2 are the same as those of CLARA-A1, which is based on the mesoscale atmospheric global irradiance code (MAGIC) and related look-up-table algorithms driven with cloud data from CLARA-A2 and auxiliary data, including surface albedo, monthly averaged integrated water vapor and aerosol climatology derived from the Aerocom model median merged with AERONET in situ data [60,61].
GEWEX-SRB V3.0 estimates Rs by using a modified radiation transfer model from [62]. The input cloud properties are derived from ISCCP DX data,; temperature and moisture profiles are derived from GMAO-GSFC [63], and ozone-column data are primarily from TOMS, TOVS and SMOBA analyses. Aerosol extinction and absorption by ozone and water vapor are calculated following (Pinker et al. 2003) [22].
The ISCCP-HXG-based Rs product is retrieved based on the SUNFLUX scheme [64,65]. Input data are used to drive the model, including cloud mask, visible (VIS)-retrieved liquid cloud optical depth, VIS-retrieved ice cloud optical depth and cloud top temperature from ISCCP-HXG. Surface pressure, total column water vapor and total column ozone are from ERA5 reanalysis data. Aerosol and albedo data are from MOD08_D3 and MCD43A3. Missing values in the aerosol and albedo data were replaced with the corresponding values from the monthly mean climatological data.
CERES EBAF is the level 3b product based on the CERES radiometer-measured filtered shortwave radiances (0.3–5 µm, 0.3–200 µm and 8–12 µm). The cloud properties are collected from MODIS and geostationary imagers [66]. MODIS AOD C6.1 assimilated into an aerosol transport model (MATCH) are used as aerosol input data for the CERES EBAF product [67].
2.2. Ground-Based Estimations of Surface Solar Radiation
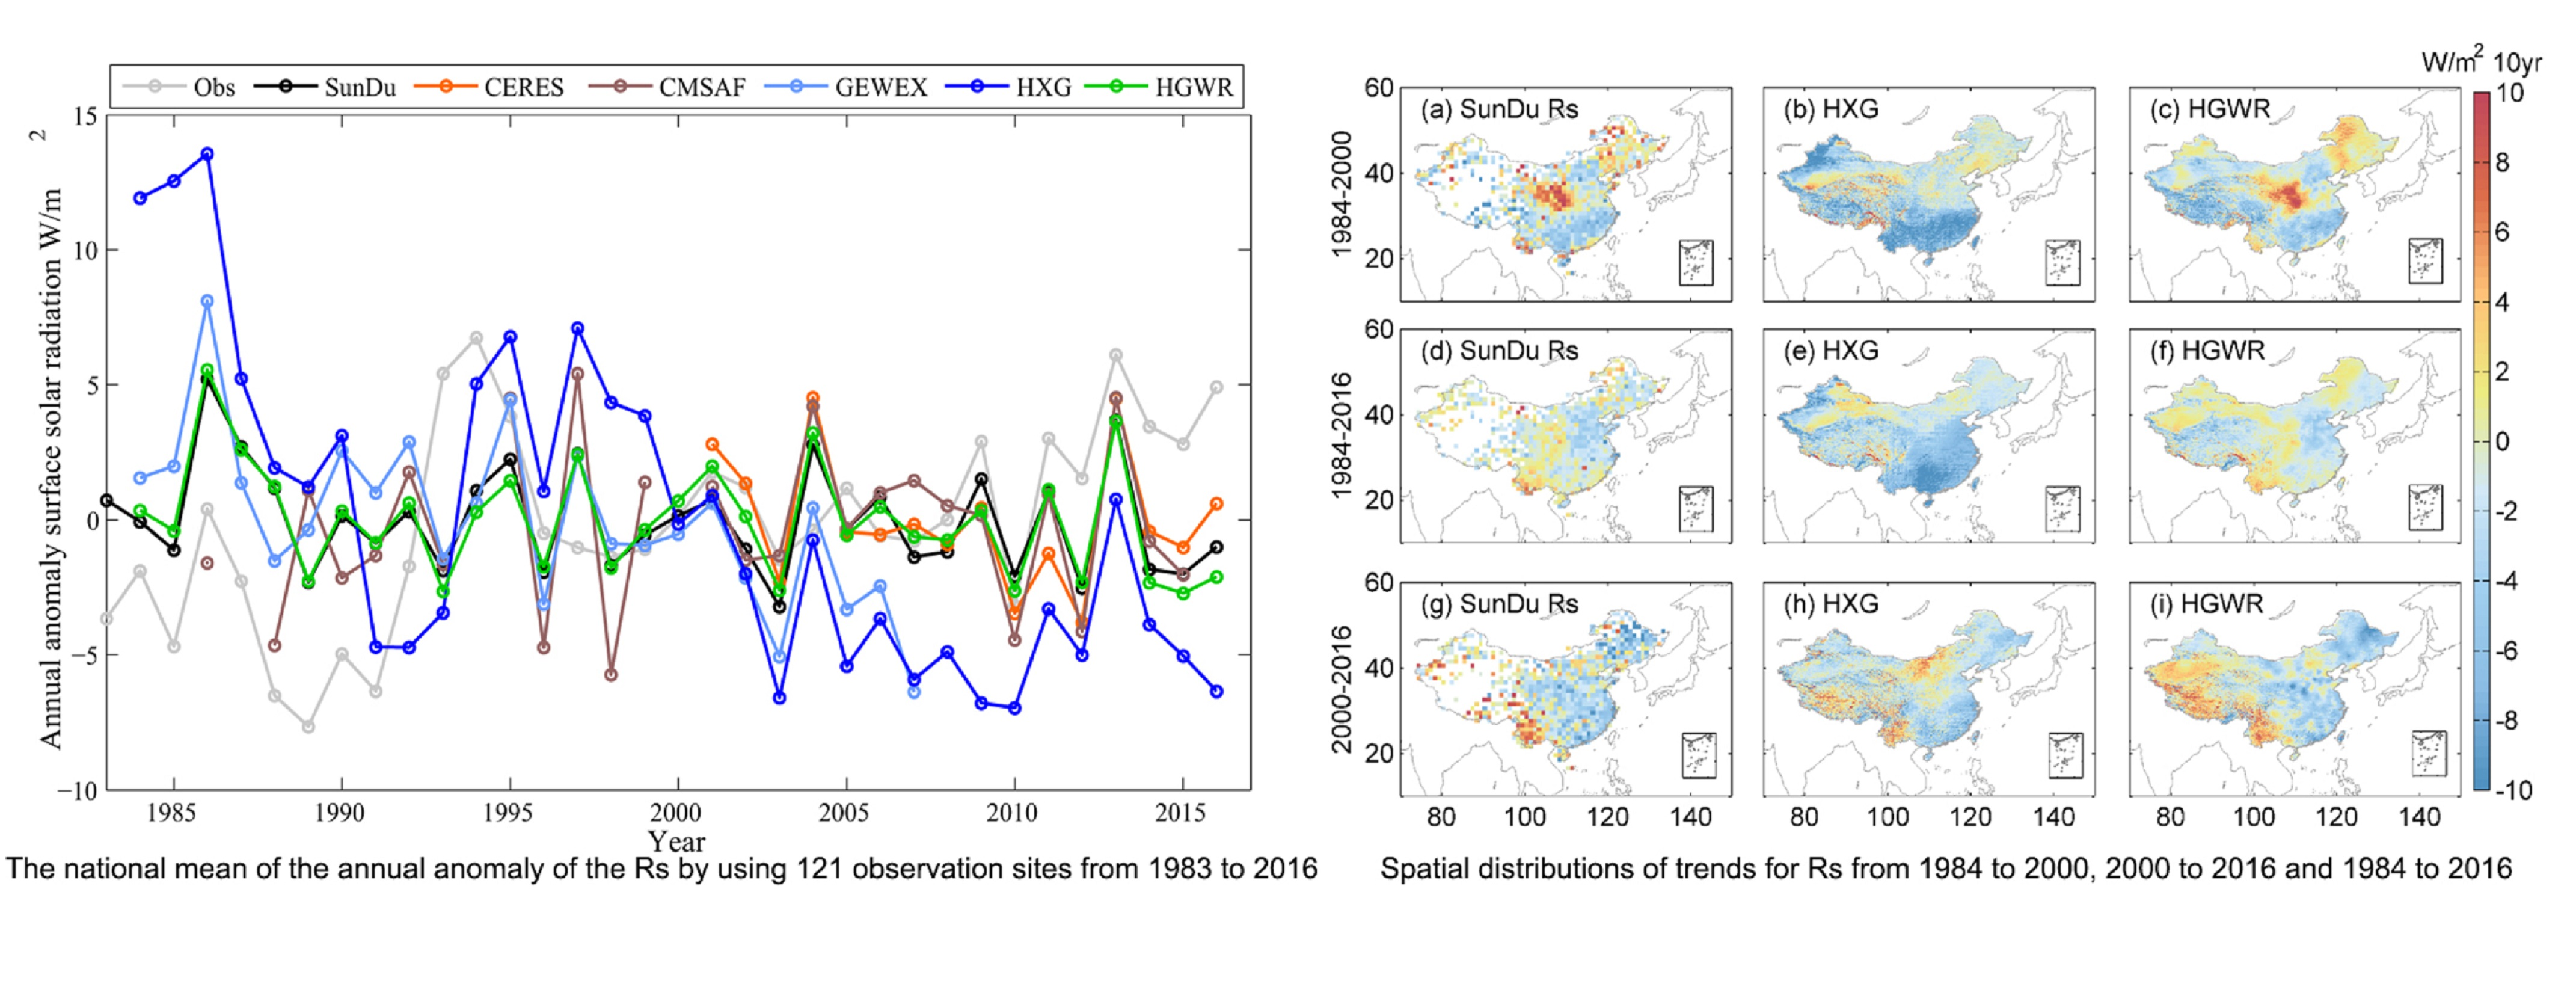
We used direct Rs measurements from 121 radiation stations collected from 1983 to 2016 by the China Meteorological Data Service Center (CMDC, http://data/cma/cn/) of the CMA. Monthly Rs values are calculated by averaging daily Rs values when daily observed data are available for more than 15 days for each month at each radiation station (Figure 1).
Sunshine durations from 1983 to 2017 are obtained from approximately 2400 CMA weather stations. These sunshine durations are used to calculate monthly mean Rs following the method of the revised Ångström-Prescott Equation (1) [10,11,68].
where n is the measured sunshine duration and K is the theoretical value of sunshine duration. a0, a1 and a2 are determined according to (Wang 2014) [11]. Rc is the daily total solar radiation under clear-sky conditions.
Sunshine duration-derived Rs has been shown to be a good proxy of directly observed Rs at time scales ranging from monthly to decadal and can reveal the impact of aerosols and clouds on Rs over China [69,70,71,72]. The long-term coverage of the relatively widely distributed sunshine duration data permits the long-term trend analysis of Rs with large spatial coverage [3,73]. In addition, SunDu-derived Rs values are nearly free from the sensitivity drift problem, which hampers traditional Rs observation data applications over China.
2.3. The Fusion Method
Geographically weighted regression (GWR) is used as a fusion method to merge the ISCCP-HXG-derived Rs with ground-based SunDu-derived Rs (HGWR). GWR is an extension of the traditional regression model by allowing the spatial modeling of nonstationary processes. The principle of GWR is provided as follows:
where yi is the value of the merged Rs unit i; i = 1, 2, …, n, n denotes location i, xik indicates the corresponding values of ISCCP-HXG-derived Rs, and ε denotes the residuals. δ(i) is the regression intercept. δk(i) is the regression coefficient calculated from the spatial weighting function w(i), which quantifies the proximities of location i to its neighboring observation sites; X is the variable matrix; and b is the bias vector.
Owing to the irregular distribution of observation sites and computer ability, the adaptive Gaussian function method is selected as a weighting function that varies in extent as a function of Rs observation site density.
where wij is the weighting function for SunDu derived Rs observation site j that refers to location i; dij denotes the Euclidian distance between j and i; and b is the size of the neighborhood and the maximum distance away from regression location i, known as “bandwidth”, which is determined by the number of nearest neighbor points (NNPs). The NNPs are set to 30 following our parameterization experiment (Table S2, Feng and Wang, 2020 under review). The regression coefficients are then determined by Equations (3) and (4) using the ground-based SunDu Rs as the dependent variable and ISCCP-HXG Rs at corresponding observation site as the independent variable. The final merged Rs can be obtain by the regression coefficient and ISCCP-HXG Rs for the whole regions by Equation (1), which can be applied in ArcGIS or R. Previous studies have shown that GWR performs better than other regression methods, especially for analyzing spatial data [74,75,76,77,78,79].
2.4. Preprocessing and Metrics for Evaluation
All the 121 direct Rs observation sites, where both direct observed Rs data and SunDu-derived Rs data are recorded, are used as validation sites, and the remaining 2261 sites are merged with HXG by GWR (Figure 1). We obtain monthly Rs from three AVHRR-based Rs data and CERES EBAF. HXG only provide 3 hourly Rs estimates. We calculate daily mean Rs and obtain monthly average estimates for the Rs data. The CMSAF data contain a large amount of missing data before 2000. To avoid the impacts of missing data in CMSAF, we only use data with less than 20% of the data missing from the total number of validation sites.
To make inter-comparisons, we chose the years 2000 to 2007, a period common to all three AVHRR-based datasets and CERES EBAF. The determination coefficient (R2), root mean square error (RMSE), bias error and mean absolute bias (MAB) are calculated for validation. When performing the trend analysis, all data from 1983 to 2016 are used if the product is available. Rs validation results and long-term variation patterns are also presented for the nine subzones by the K-means clustering algorithm based on geographic locations and multiyear mean Rs derived from all SunDu-derived Rs sites. For comparisons of the spatial distribution of multiyear mean Rs and long-term trends, the SunDu-derived Rs are interpolated to 1° × 1° grids following (Du et al. 2017) [80]. For long-term Rs variation evaluation, the linear trends in Rs are calculated by the least squares method for different time periods, including 1983 to 2007, 2000 to 2007, 2000 to 2016 and 1983 to 2016.
3. Results
3.1. Site Validations
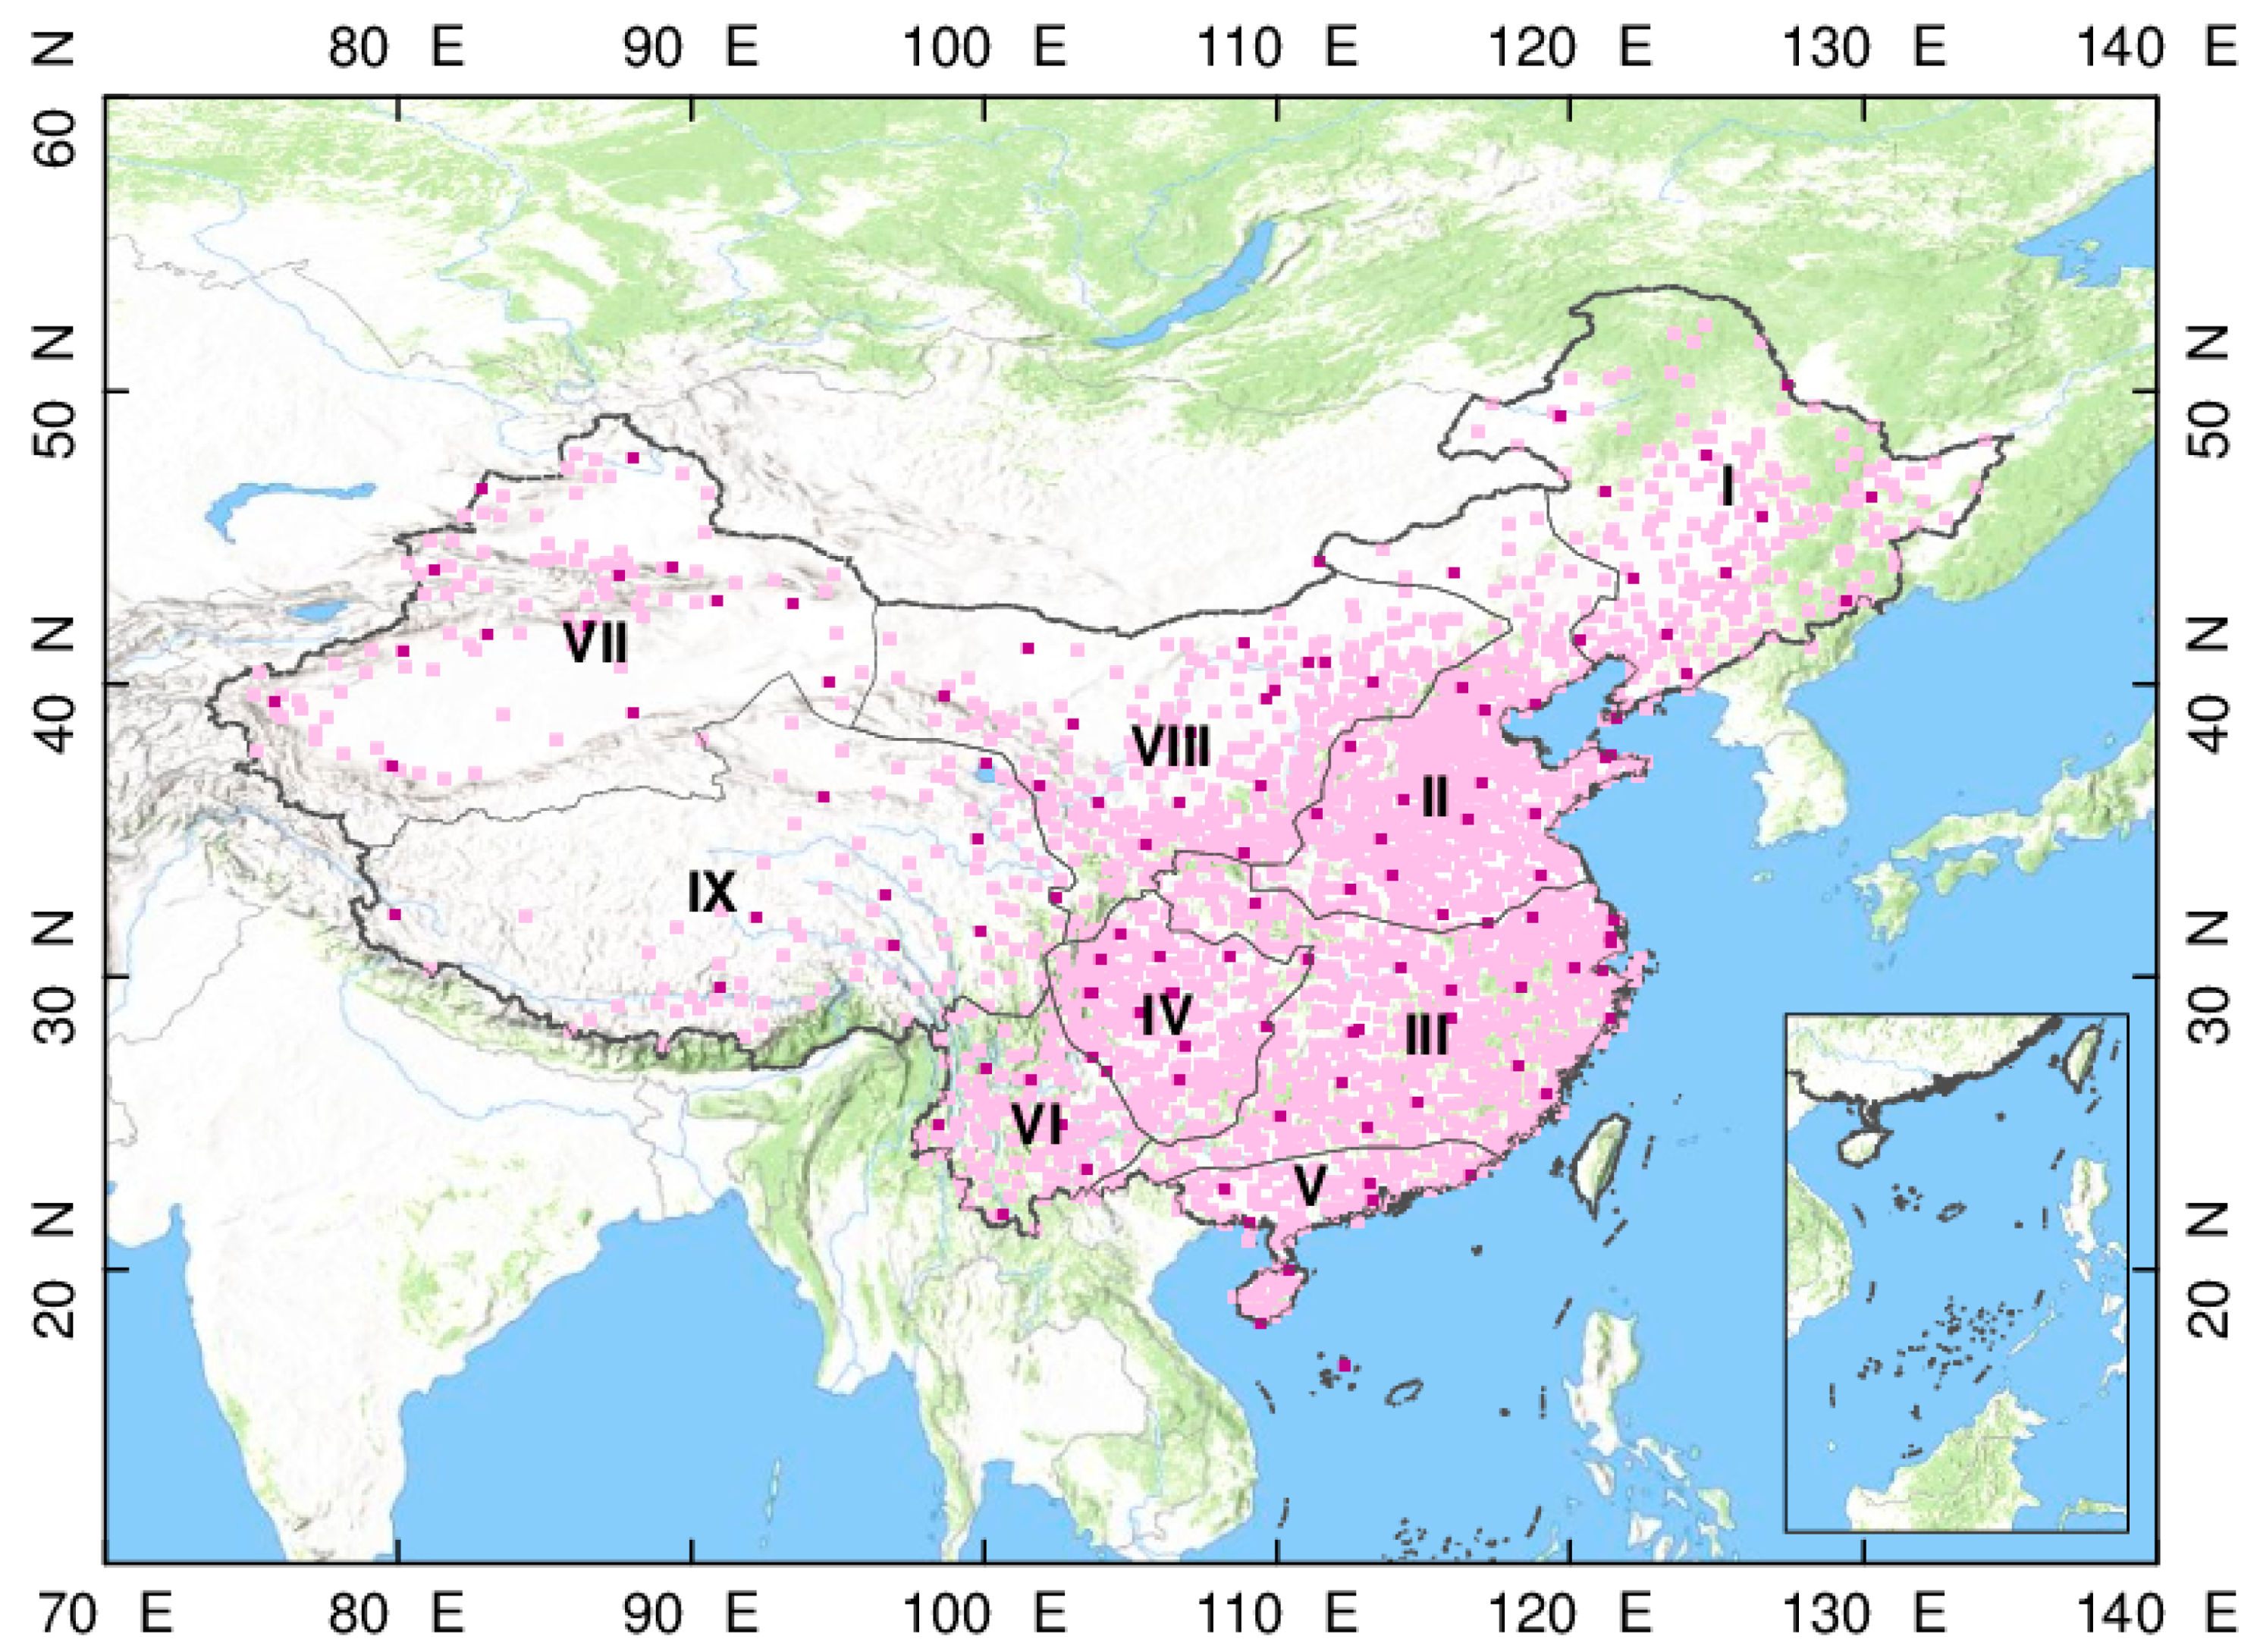
All these four AVHRR-based Rs products showed high R2 values ranging from 0.89 to 0.97 (Figure 2). Generally, HGWR show best performances followed by HXG, GEWEX and CMSAF. Specifically, CMSAF has the largest MAB and RMSE (18.96 W/m2 and 24.08 W/m2, respectively) followed by GEWEX and HXG, compared with direct observations. Similar results can also be seen when validating against the SunDu-derived Rs. When comparing with SunDu-derived Rs, GEWEX has the largest MAB and RMSE (17.46 W/m2 and 22.17 W/m2, respectively) followed by CMSAF and HXG (Table S3). The good performances of HXG might be attributed to the improvements of high resolution of cloud from latest ISCCP-H series product and auxiliary data from ERA5. By merging SunDu Rs data, HGWR showed the lowest biases with MAB = 13.86 W/m2 and RMSE = 19.16 W/m2 compared with direct observations. Obvious improvements in HGWR are shown in comparison with SunDu Rs reference data, with the MAB reduced by 33%. Similar results can also been seen in different seasonal (Figures S2–S5).
Generally, this is likely because satellite derived Rs products are at grid of 1 degree, and both direct observation and SunDu are ground-based point observations. However, the time span of CERES EBAF is 2000 to present. As direct Rs observation, SunDu derived Rs and CERES are three independent measurements, the inter-comparison show that direct Rs observation is neither consistent with CERES EBAF nor SunDu derived Rs and the latter two show more consistent results, which again indicates that the SunDu derived Rs can be used to produce reliable Rs data in monthly time scale. The detailed validation results are summarized in Table S3.
The monthly validation results for each subzone (Figure 1) from 2000 to 2007 are shown in Figure S1. In subzone I, which is located on the North China Plain, GEWEX has the largest biases (MAB = 15.74 W/m2) and the HGWR has the lowest (MAB = 7.20 W/m2) compared with independent SunDu-derived Rs. These results suggest that without the SunDu derived Rs constraint, these AVHRR based satellite Rs retrievals still have uncertainties in simulating aerosols. Similar performances of GEWEX and HGWR are shown in the other eight regions, except that CMSAF has the largest MAB (16.06 W/m2) in zone V. By merging the SunDu-derived Rs site data, the MAB of HXG was reduced by 31% in zone I, 36% in zone II/III, 27% in zone IV, 31% in V, 32% in zone VI, 44% in zone VII, 33% in zone VIII and 22% in zone IX. The areas with significant improvement of HXG are mainly distributed in east part of China, which might be the improvement in simulating the impact of aerosols loading by merging SunDu derived Rs.
3.2. Spatial Distribution
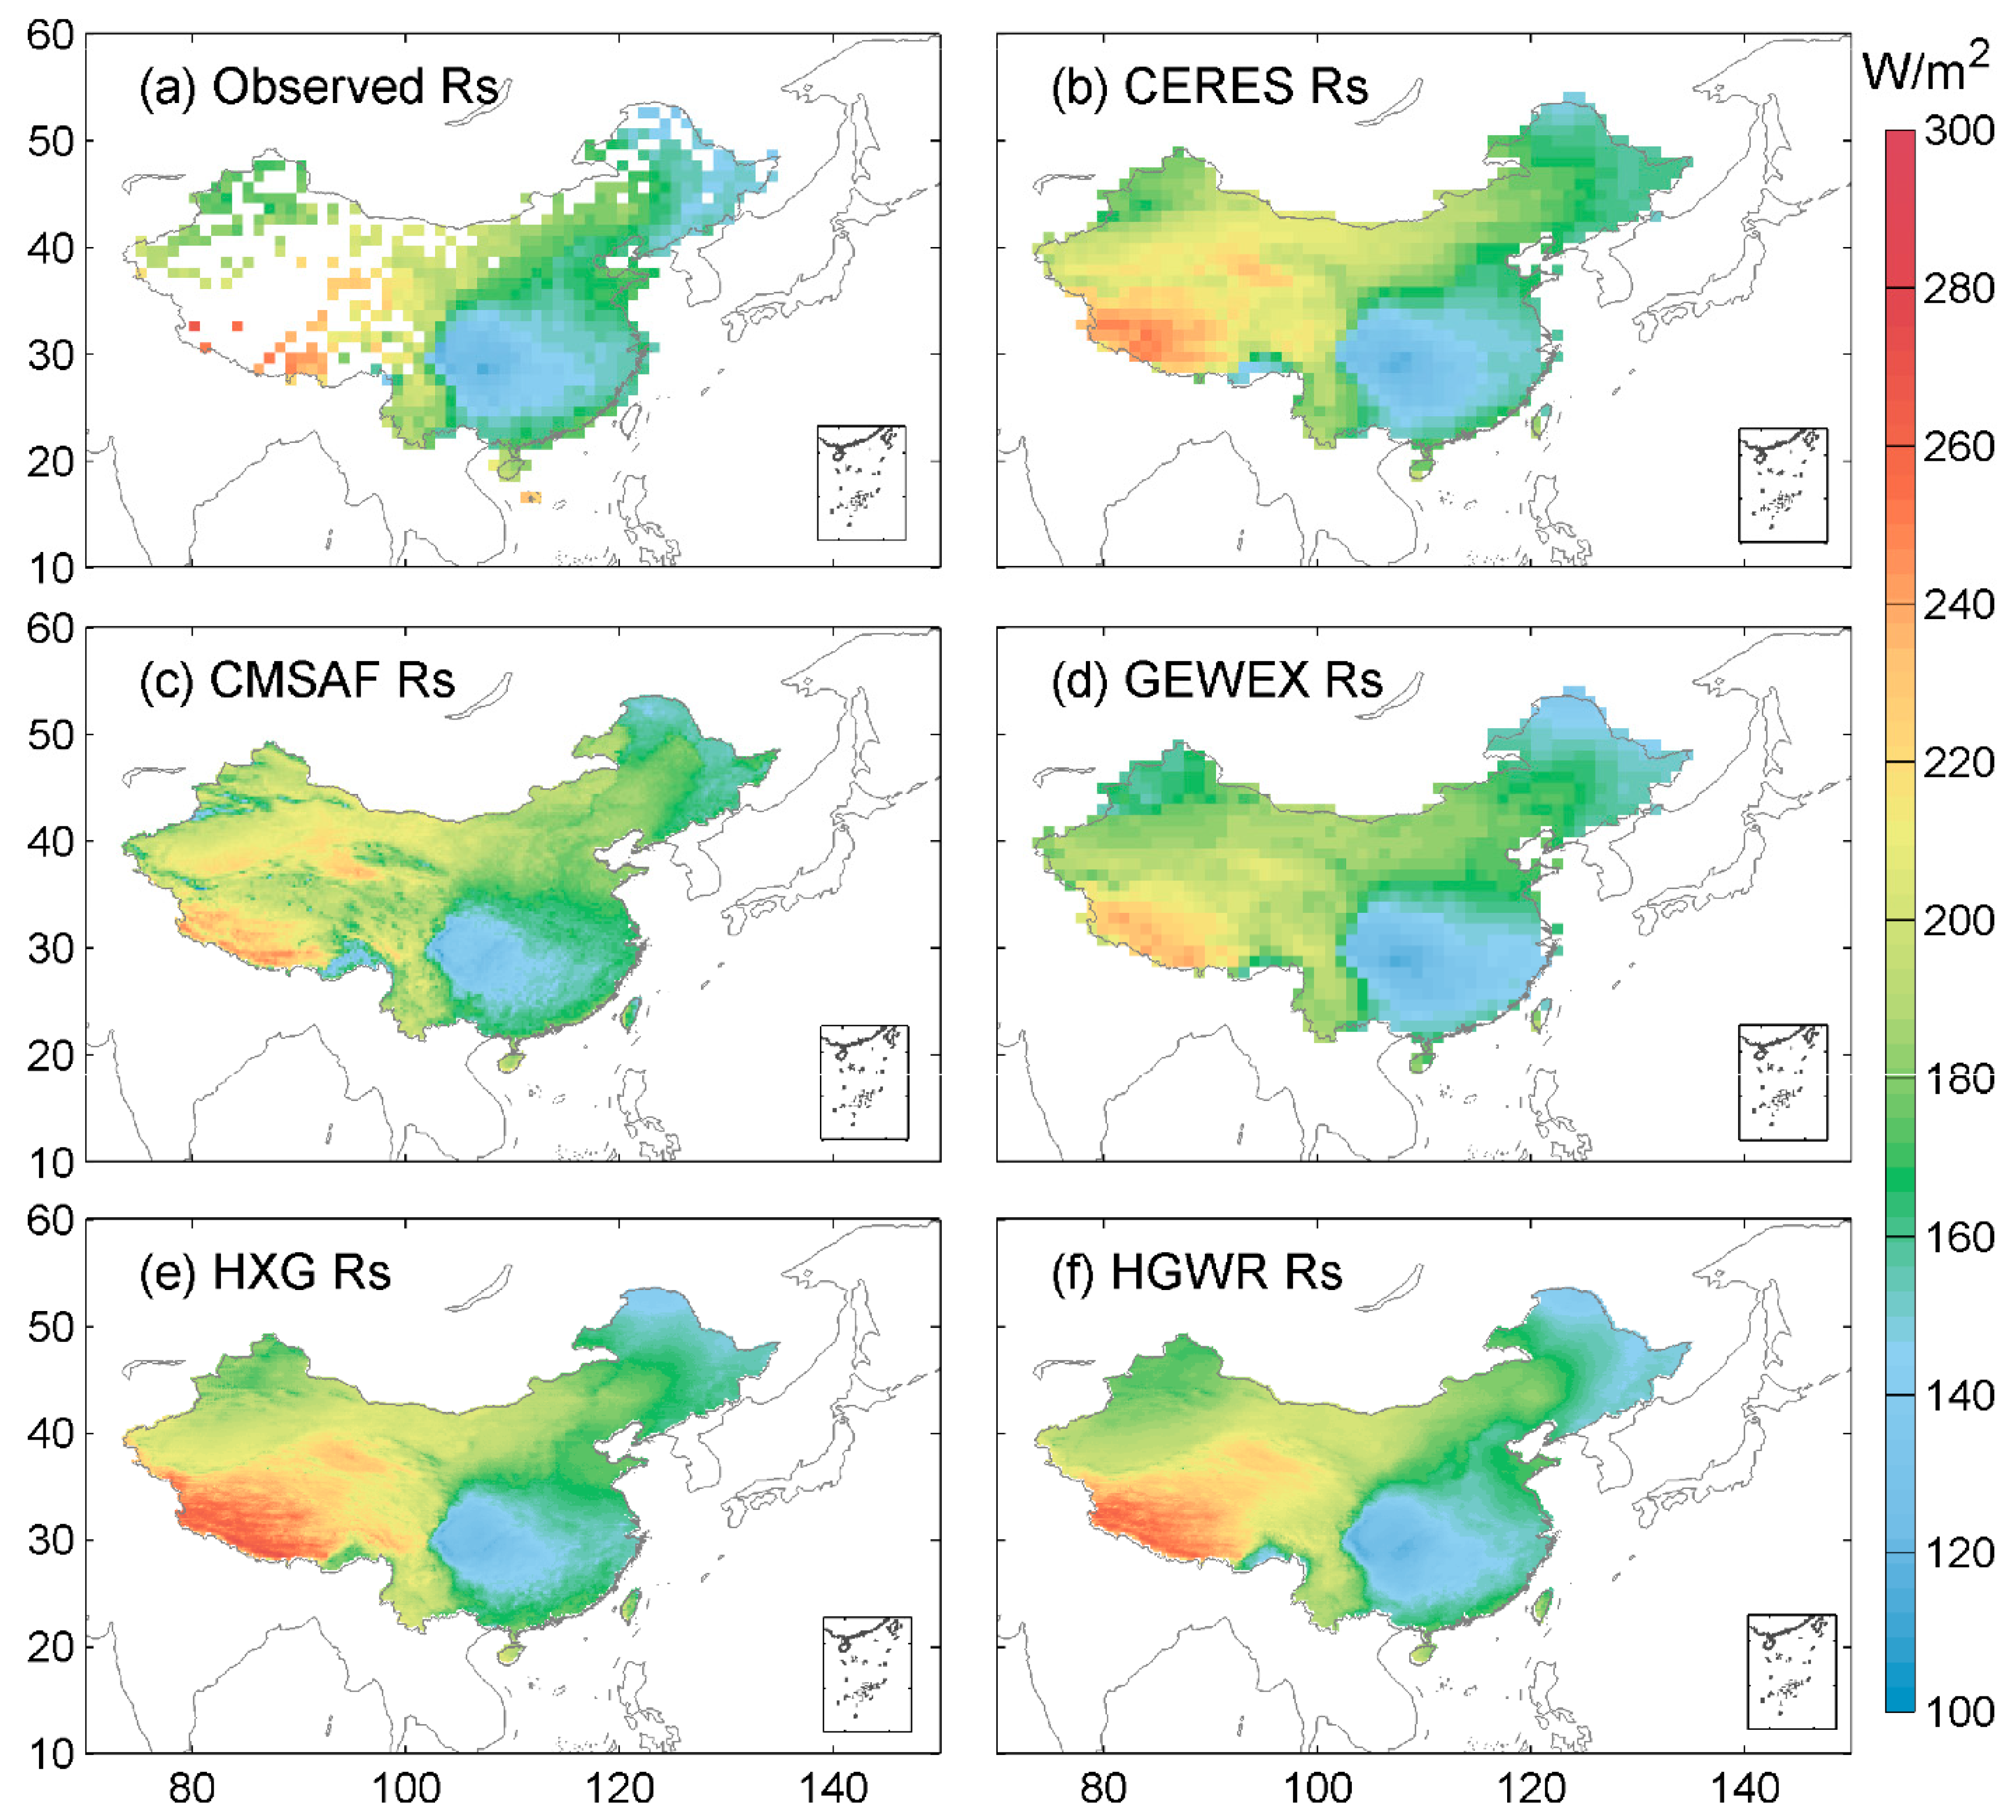
As shown in Figure 3, the multiyear means of Rs from 2000 to 2007 derived from the SunDu sites are high in west China, ranging from 180 to 300 W/m2, and low in eastern China, ranging from 120 to 180 W/m2. CERES EBAF, CMASF, GEWEX, HXG and HGWR have similar spatial patterns of Rs. Slight differences are found in west China. HXG and HGWR show better performances than other Rs products compared with the SunDu-derived Rs reference data, which might be attributed to the high spatial resolution of cloud input data from ISCCP-HXG (Table S3). By merging the SunDu-derived Rs, HGWR showed an improved performance compared with HXG at independent SunDu sites, with R2 values from 0.91 to 0.95 MAB reduced from 27.6% to 4.97 W/m2 and RMSE reduced from 25.2% to 6.13 W/m2 (Table S3).
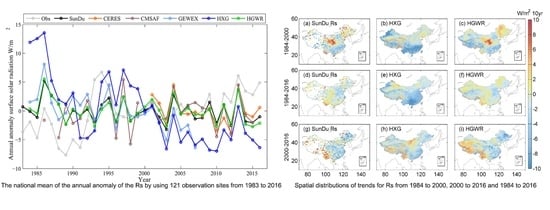
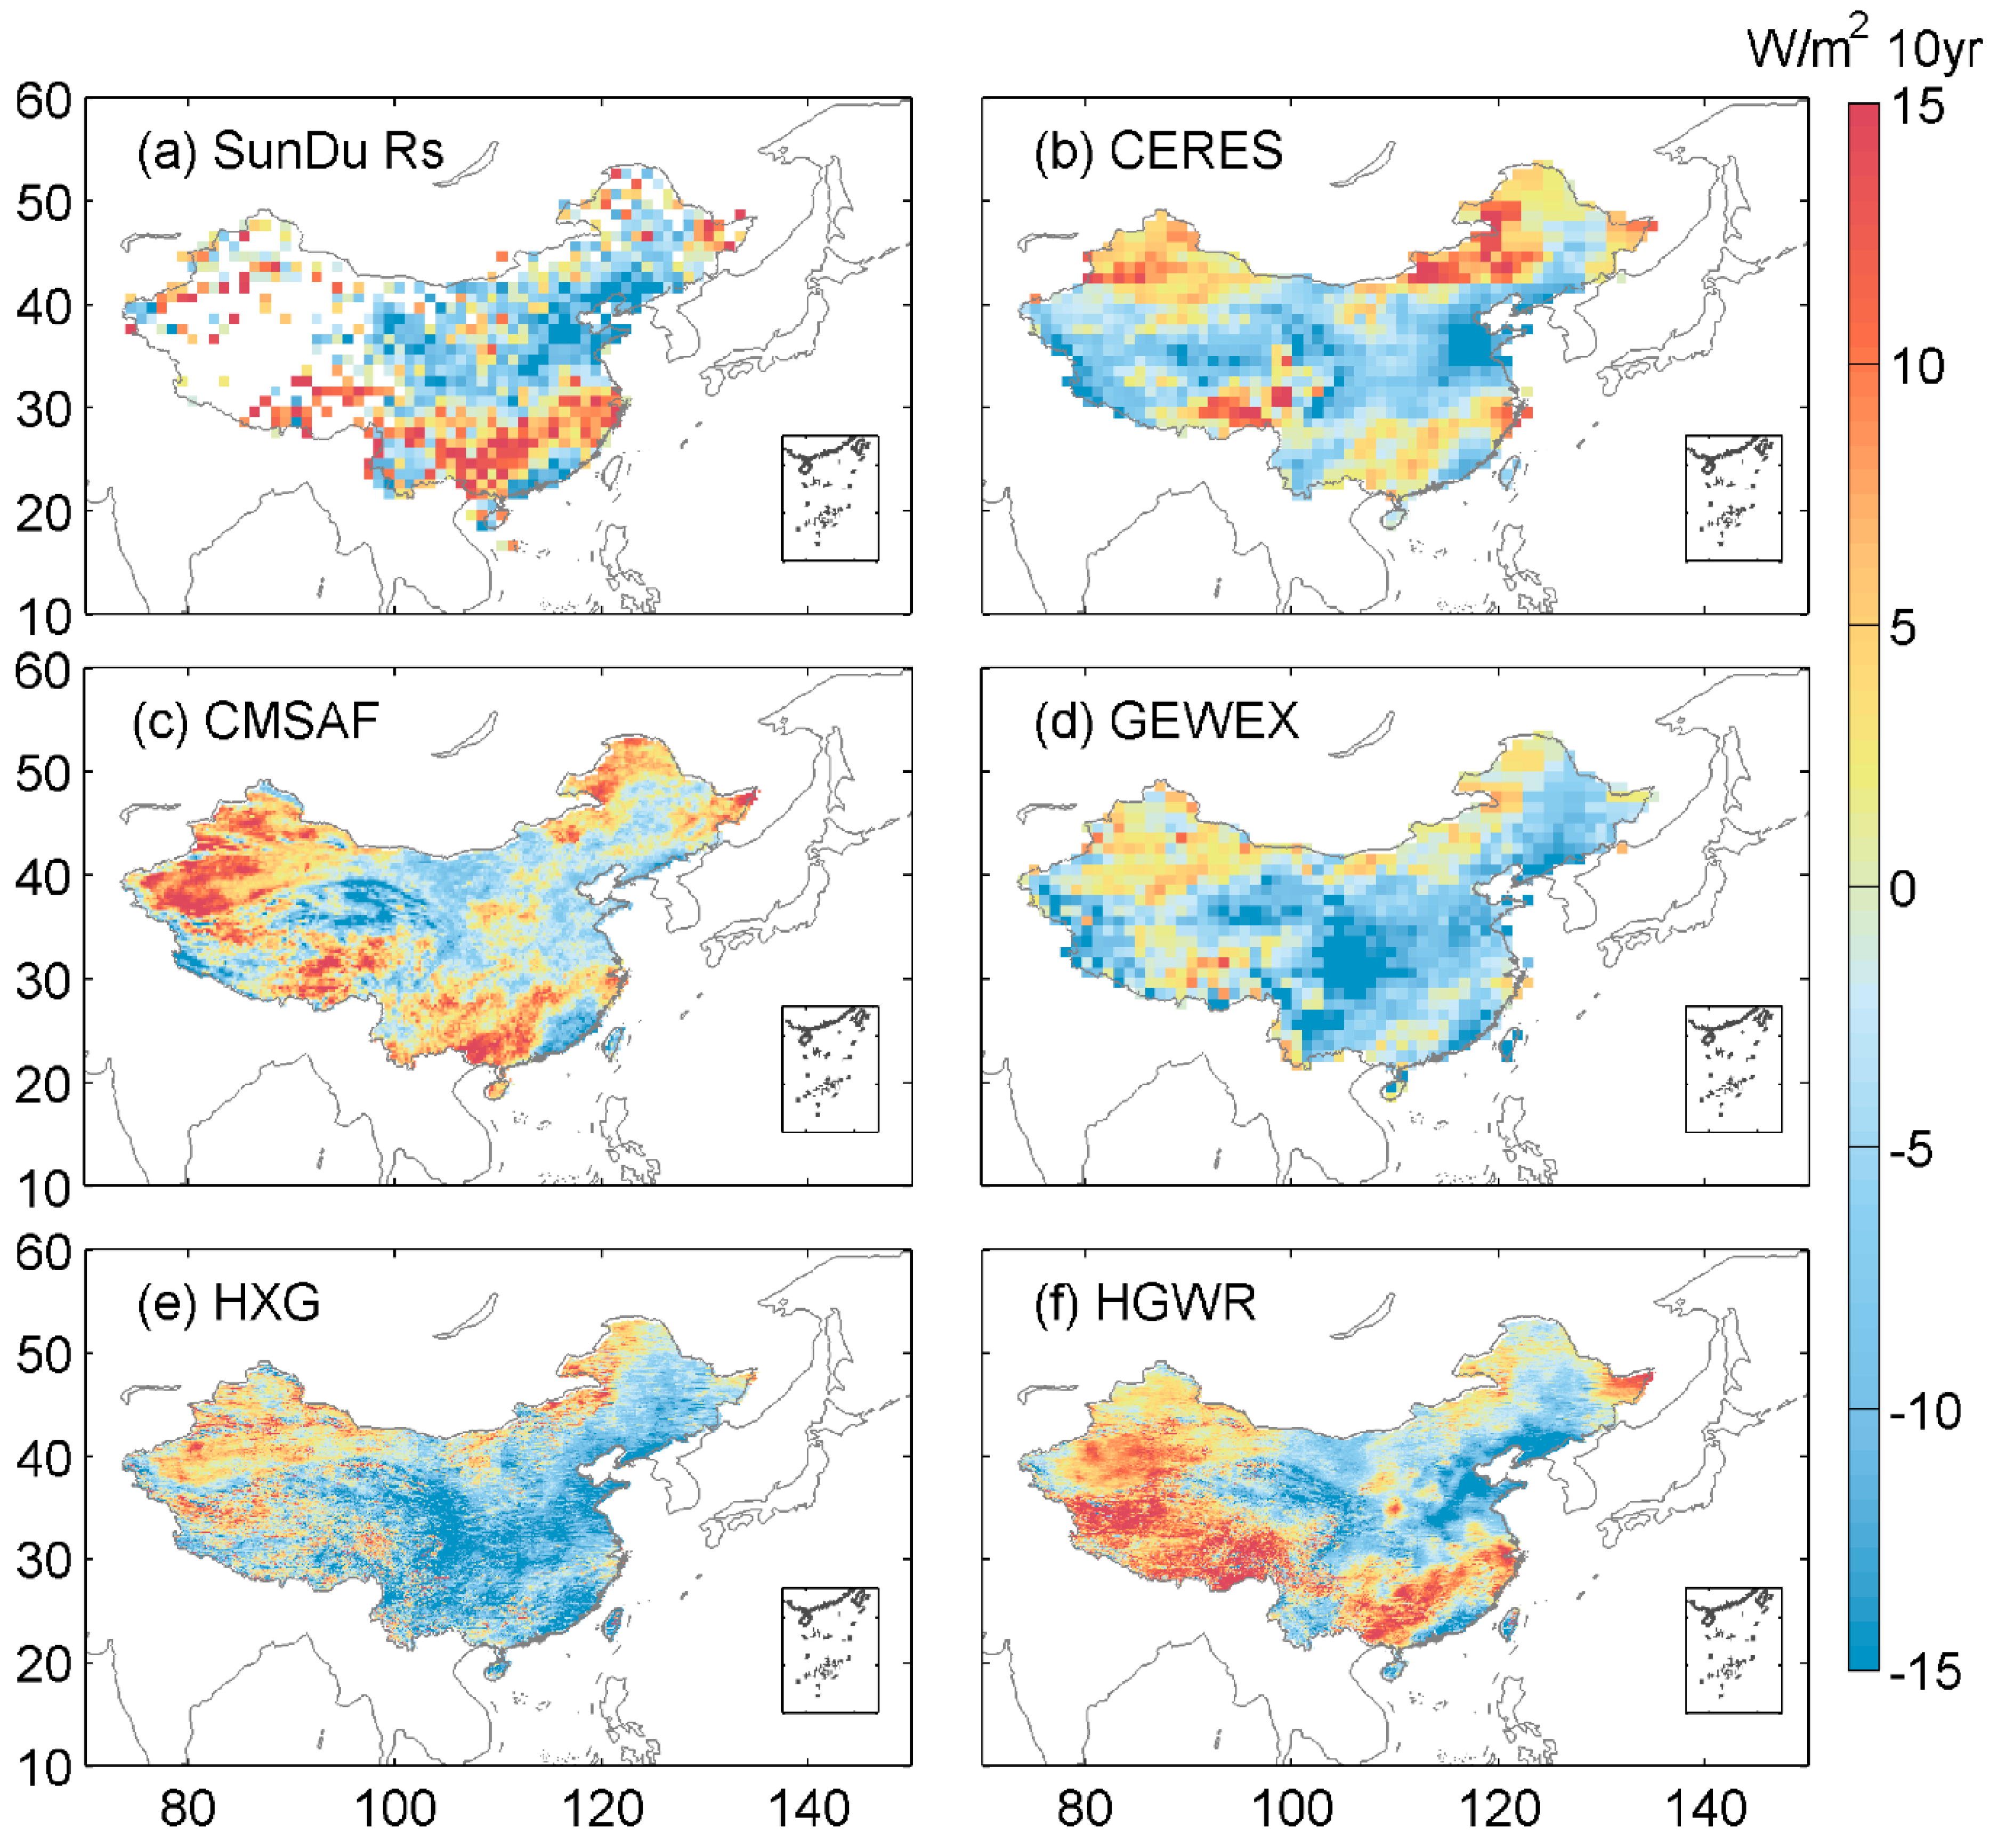
The spatial distribution of trends in Rs over China from 2000 to 2007 is shown in Figure 4. Based on the SunDu-derived Rs data, Rs shows an increasing trend in South China and a decreasing trend in most parts of the North China Plain. CERES EBAF and CMSAF have consistent spatial distributions of Rs trends over most parts of China compared with the SunDu-derived Rs. The results demonstrate that the SunDu-derived Rs can produce reliable Rs trends with large spatial coverage. GEWEX and HXG produce decreasing trends in most parts of China, which is inconsistent with the SunDu Rs and CERES EBAF data. By merging the SunDu-derived Rs site data, the inconsistent Rs trends from HXG are corrected and compared with the CERES and CMSAF Rs data. The difference spatial distribution of Rs trend might be attributed to the input of cloud and aerosols data. Both CERES EBAF and CMSAF use CALIPSO-CALIOP cloud information to adjust the cloud input data. Both GEWEX and HXG use climatology of aerosol data [22]. In southern coastal regions of China, all Rs products show decreasing trend, which might be the dominated impacts of clouds. However, in the southern inland regions of China, the Rs trend from these Rs products is quite different, which might be the different ability of simulating the aerosols loading in these regions. In the western part of China, largest differences in Rs trend from these Rs products show in the Qinghai-Tibet Plateau and Tianshan Mountains, which might be attributed to impacts of the complex terrain. Similar results also show in Daxinganling Mountain in Northeast China.
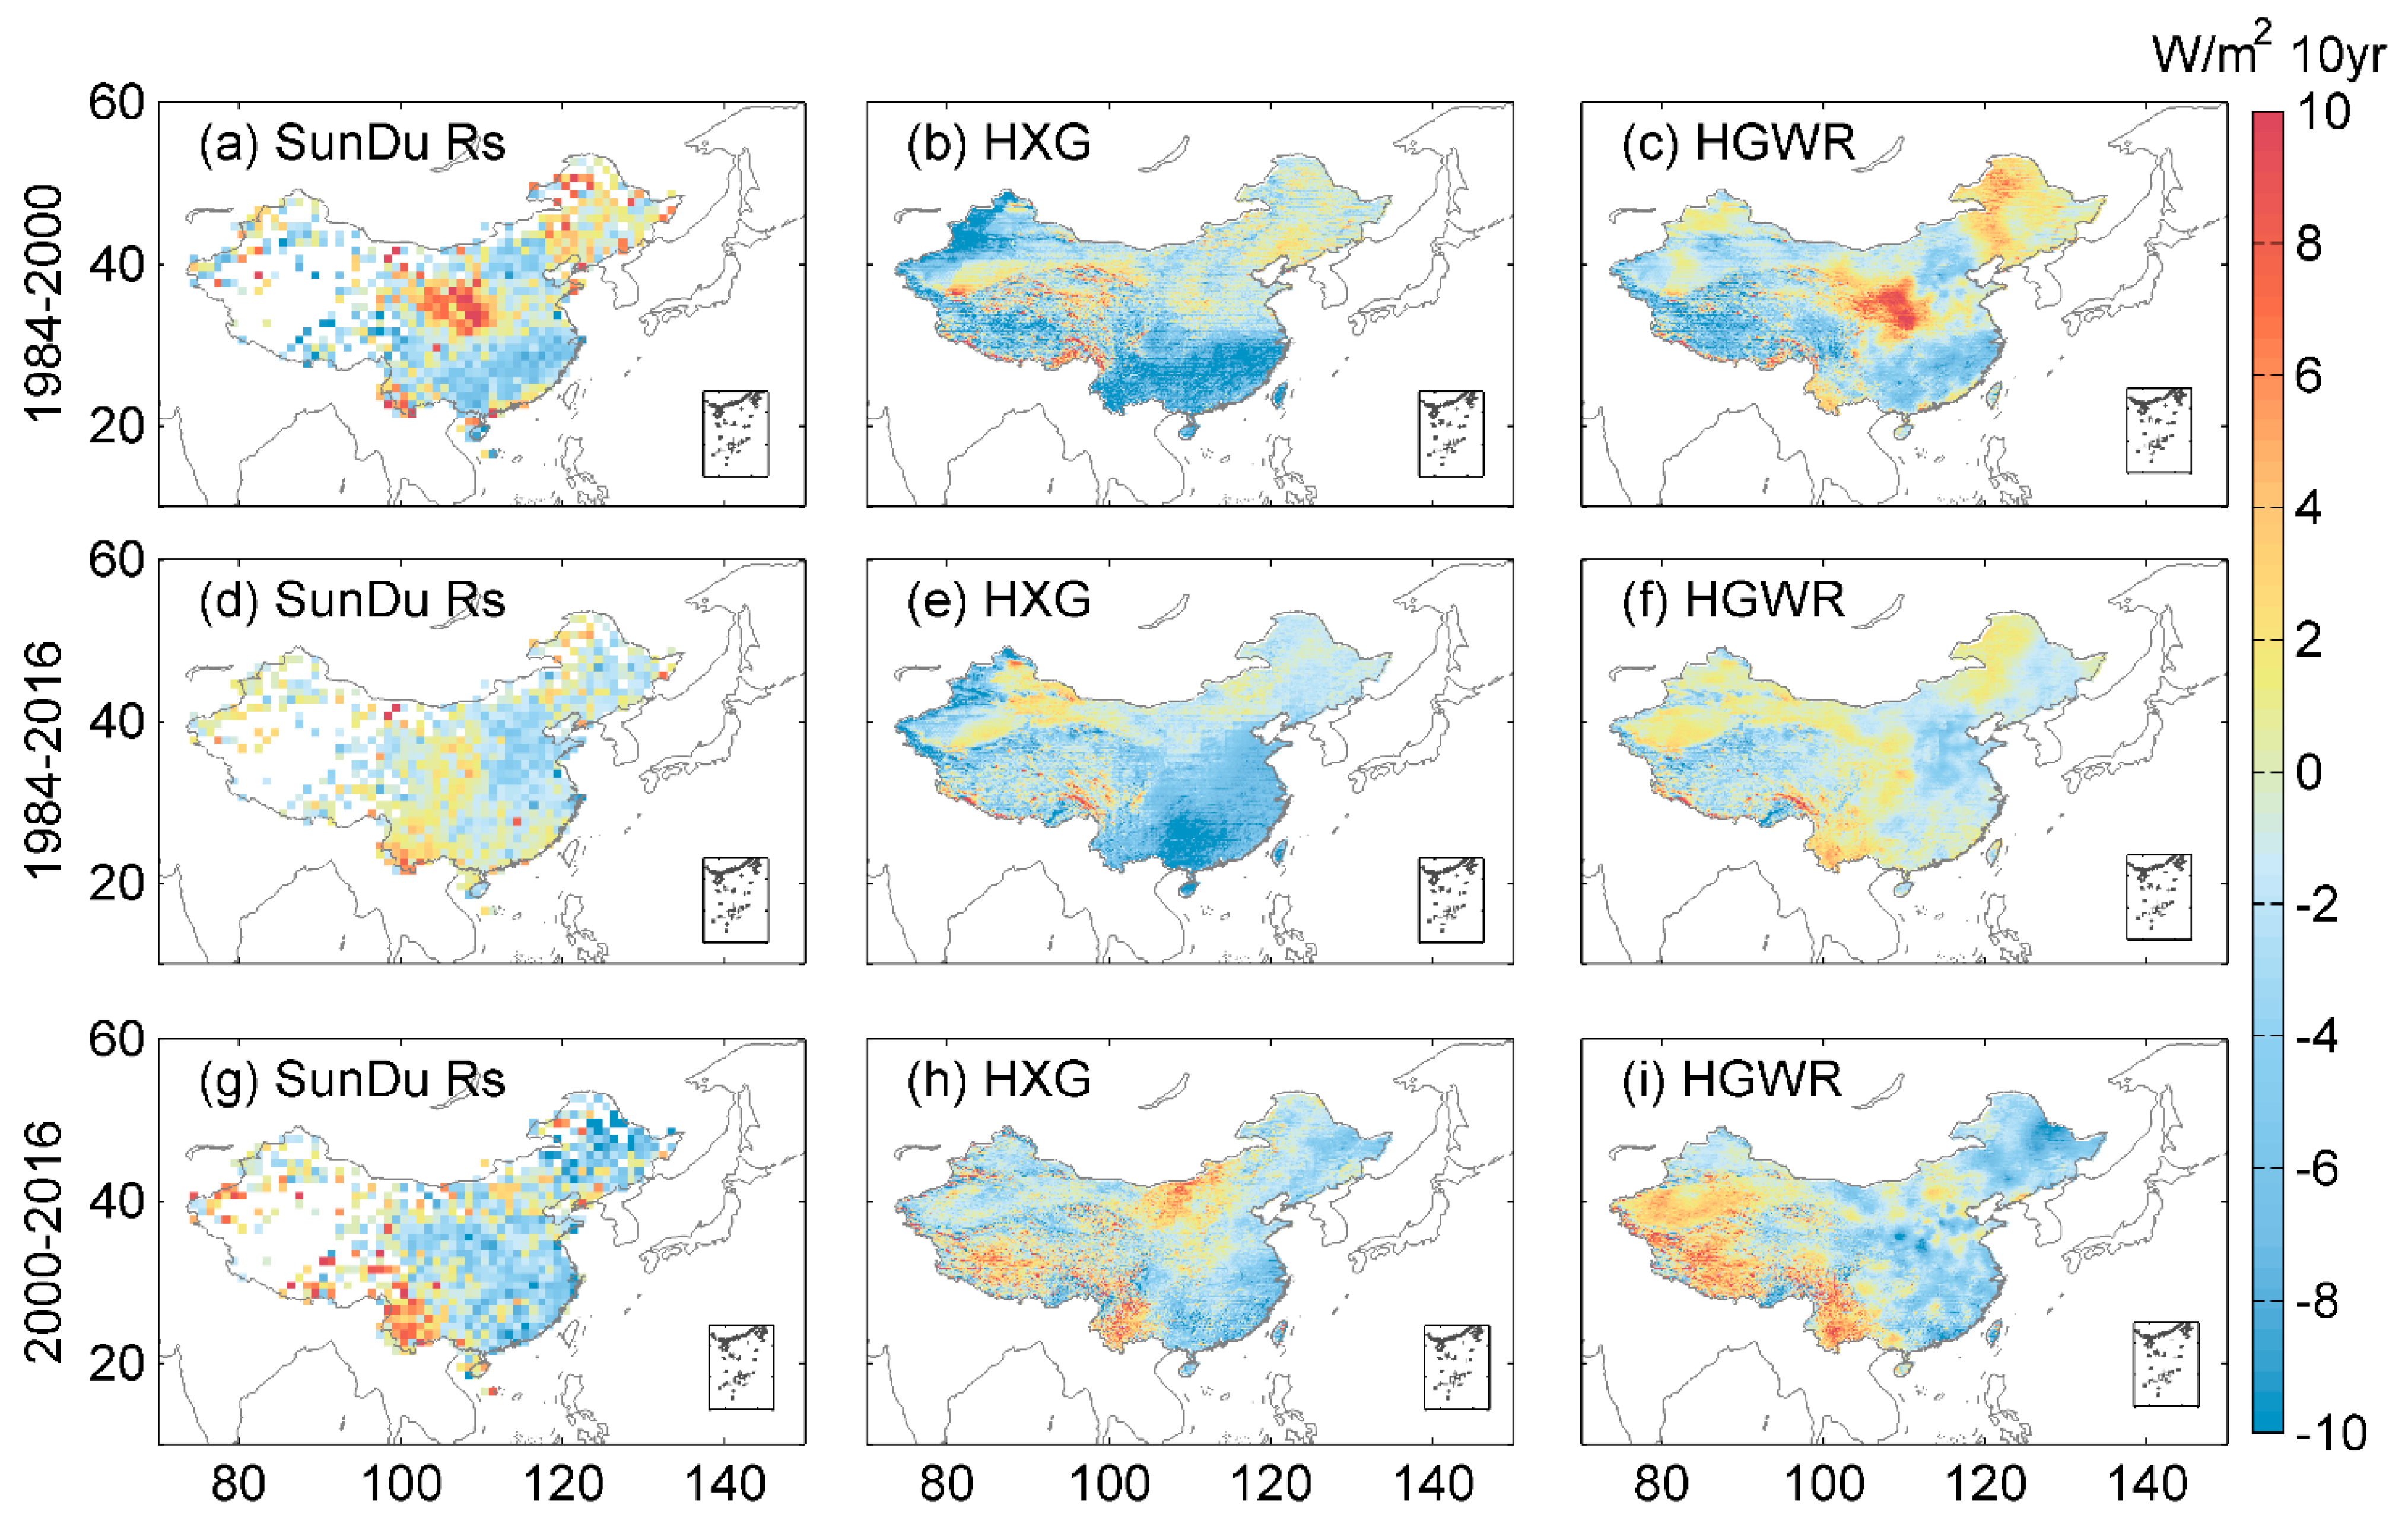
To further assess the spatial distribution of the Rs trend, we compared the spatial distribution of the Rs trends over three time periods, including 1984 to 2000, 2000 to 2016 and 1984 to 2016 (Figure 5). For 1984 to 2000, SunDu-derived Rs showed an increasing Rs trend over central and northeastern China and a slight decreasing trend for the southern part of China. HXG overestimates the decreasing Rs trend in southern China and underestimates the increasing Rs trend over central and northeastern China. For 2000 to 2016, the SunDu-derived Rs and HXG produced similar Rs trends over China. For 1984 to 2016, the SunDu-derived Rs showed a levelling off trend over most parts of China, with a slight increasing trend over Southwest China and a decreasing trend over the North China Plain. Comparatively, HXG produces an overestimated decreasing trend in most parts of China. By merging the SunDu-derived Rs data, the inconsistent Rs trends in these time periods are corrected in HGWR. The different spatial distribution of Rs trends between SunDu derived Rs and HXG might be that HXG use climatology aerosol data.
3.3. Long-Term Variation
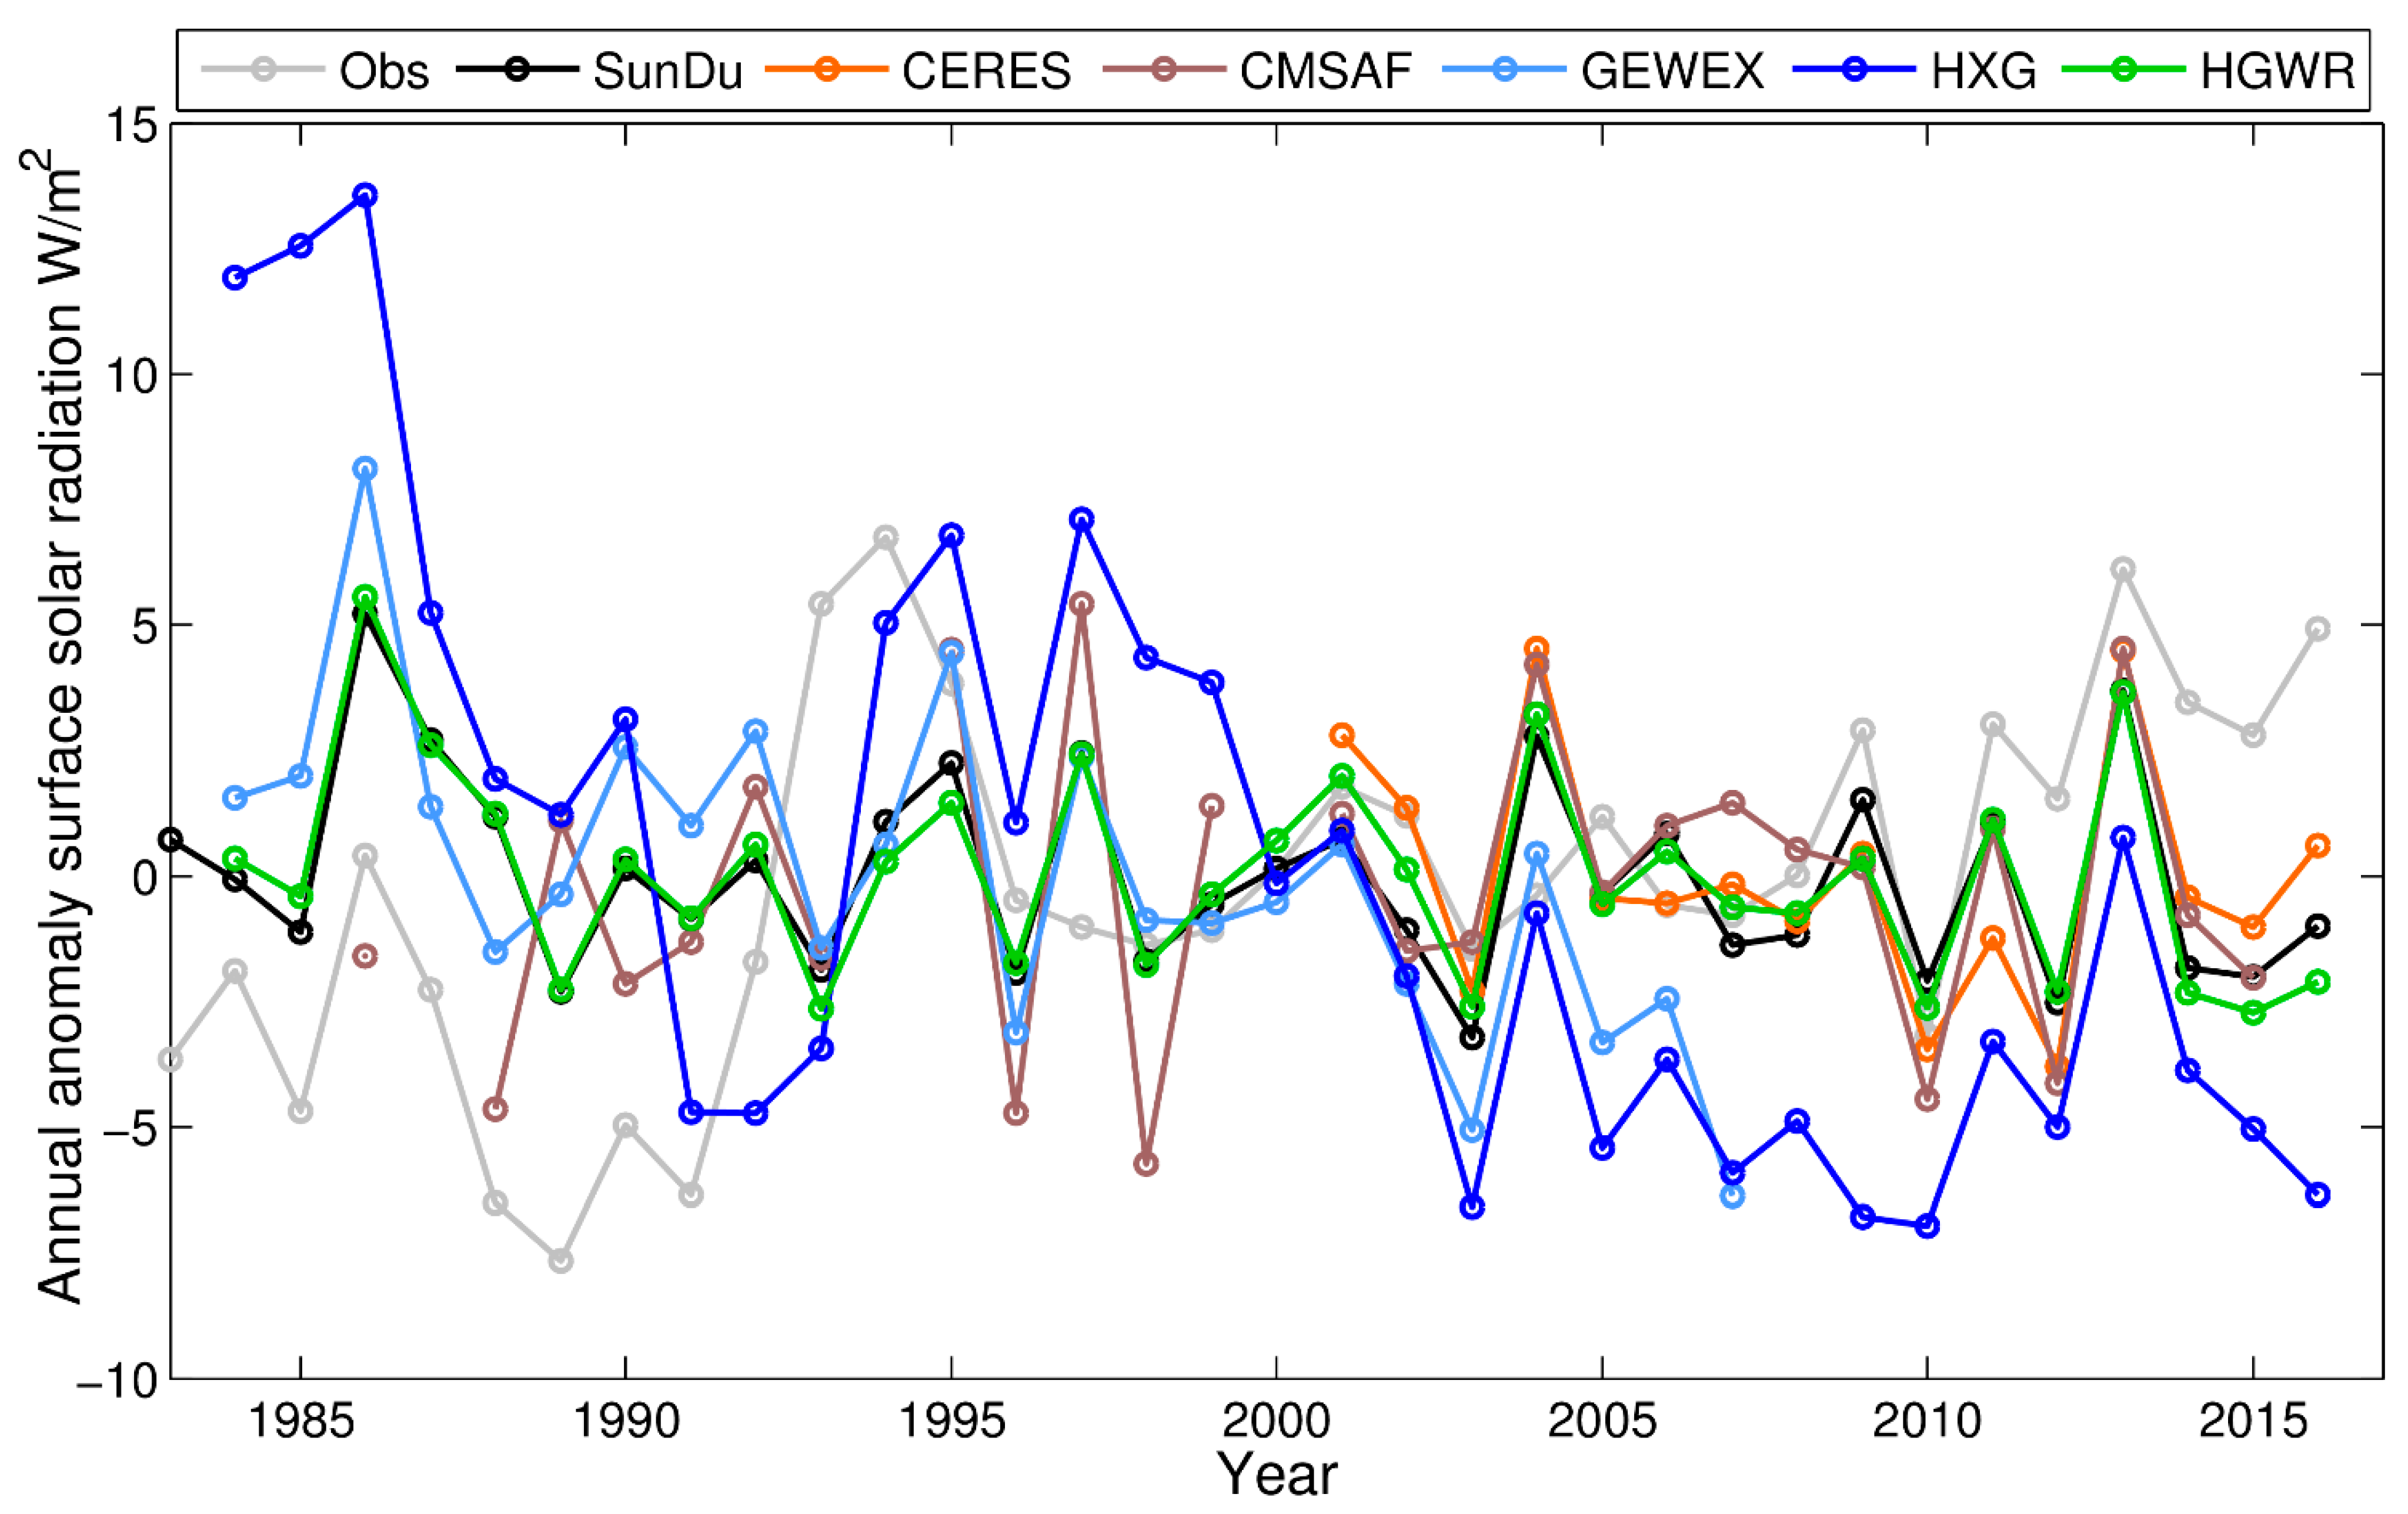
Figure 6 shows the national mean long-term variation in Rs from observations and satellite retrievals. The directly observed Rs showed a decreasing trend before 1990, an abrupt increase from 1990 to 1994, and an increasing trend after 2000. The SunDu-derived Rs showed a decreasing trend before 1990 and a levelling off trend afterward. Comparatively, the SunDu-derived Rs, CERES EBAF and CMSAF produce consistent Rs annual variations after 2000. Before 2000, large numbers of missing data eliminated the CMSAF to produce continuous Rs variations over China. GEWEX has a nearly consistent Rs variation compared with the SunDu-derived Rs, except it underestimates the Rs variation from 2002 to 2004. HXG shows a large, inconsistent Rs variation compared with the SunDu-derived Rs. By merging the SunDu-derived Rs data, the inconsistent Rs variation in HXG is corrected in HGWR. Table 1 also shows that the HGWR produces the closest national mean trend (−0.64 W/m2/decade) from 1983 to 2016 compared with SunDu (−0.57 W/m2/decade).
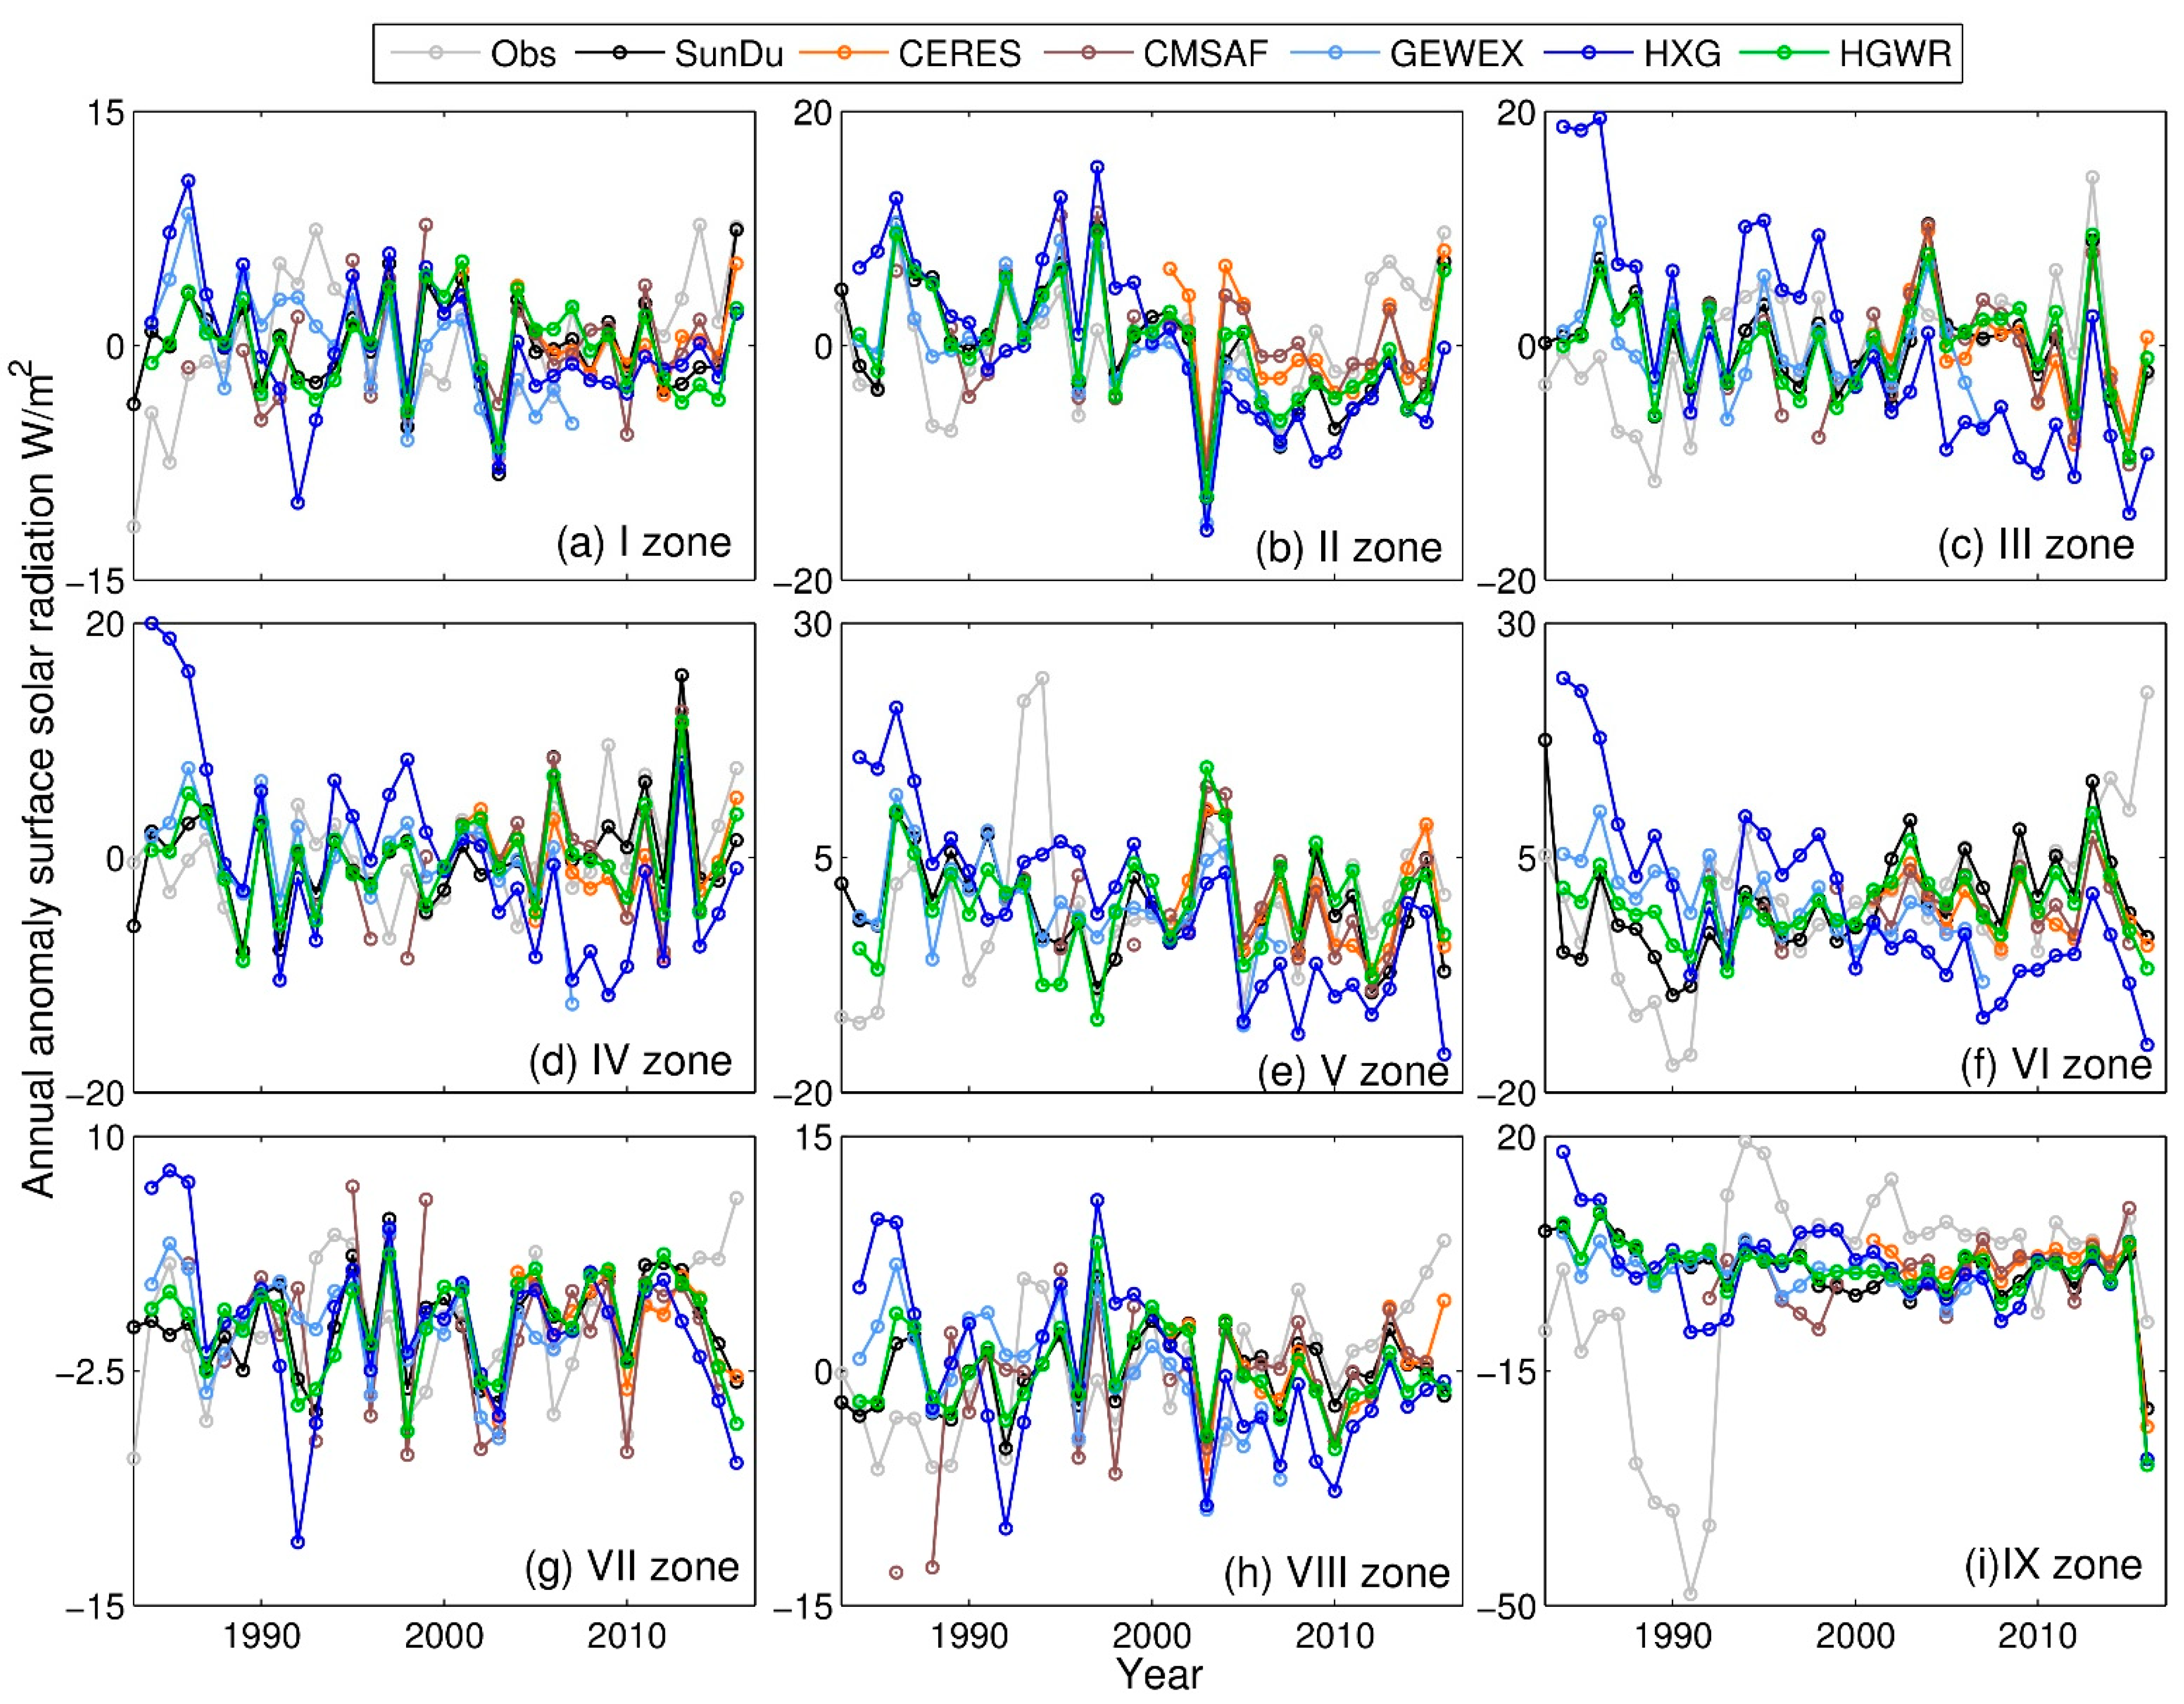
Based on the classified subregions shown in Figure 1, we further evaluated the regional mean long-term variation in Rs from the observations and satellite retrievals (Figure 7). The abrupt increasing Rs trends of the observed Rs from 1990 to 1994 are shown in zone V (southern China) and zone IX (Qinghai-Tibet Plateau), which might be caused by the instrument replacements in this period [10]. Compared with other data, a high increasing trend after 2000 from the directly observed Rs is shown in zones II, VI and VII. The SunDu-derived Rs generally showed consistent Rs variations with CERES in all regions. In zone II, Li et al. (2018) [81] reports a sharply increasing Rs trend in the North China Plain due to controlling air pollution and reducing aerosol loading, which is consistent with our results. A slightly inconsistent Rs variation in GEWEX is seen in zones I and V. It is probably because the high aerosols loading caused by factories and commercial activities in these regions, while GEWEX only use climatology aerosol data. Similar reasons might also result in an inconsistent Rs variation in southern China from HXG, including zones III, IV, V and VI. By merging SunDu-derived Rs data, HGWR can produce a consistent Rs variation with the SunDu-derived Rs and CERES. CMSAF have large different Rs variation compared with other datasets, including zones IV, VII, VIII and IX. This might because that large amount of invalid value in CMSAF especially before 2000.
4. Discussion
The results comparison indicates that the Rs retrievals from HXG and HGWR show better performances than CMSAF and GEWEX. The global validation of hourly Rs from HXG reported by (Tang et al. 2019) [57] suggests that HXG shows a better performance than ISCCP-FD. A comparison of GEWEX with direct observations over China suggests that GEWEX has large biases ranging from 8 to 9 W/m2 [82]. Biases in cloud optical thickness have been shown to lead to large relative errors in the radiance fluxes over the Arctic when derived from GEWEX and CMSAF compared with CERES [83]. The validation results of HGWR illustrate that the impact of inhomogeneous input data can be reduced by merging with ground-based observations.
The GWR has been demonstrated to be quite flexible in many previous study areas, including geography [78,84], economics [85], meteorology [79,84,86] and epidemiology [87]. The results comparison from previous studies also suggests that GWR has a better performance than other methods, including the linear regression method and spline interpolation [79,88].
Previous studies have shown that Rs over China has a decreasing trend from 1961 until approximately 1990 and levels off in approximately 1990 [42,89,90,91], which is consistent with our results. Except for the instrument replacement from 1990 to 1993 [10,11,12], the consistent trend from the direct observations and SunDu-derived Rs indicates that the merged Rs data by combined HXG and SunDu-derived Rs can produce a reasonable long-term Rs variation in China. Our previous study also demonstrates that the impact of aerosols can be included in SunDu derived Rs; the disadvantages of using constant aerosol value in Rs satellite retrievals can be overcome by merging SunDu derived Rs [59], and the product of this study is merged high resolution surface solar radiation data over 1983 to 2017 while the time period of products of [59] is from 2000 to 2017 based on MODIS cloud retrievals. We also compare the merged products with the MODIS based merged products of [59], all these datasets show generally similar Rs trend from 2000 to 2016 (Figure S6). Slight differences exist which are closed with the relationship of input satellite data. We notice that the original MODIS cloud data are more spatially consistent, and the original ISCCP-HXG have more mosaic patterns. Most of these differences are eliminated by merged with SunDu derived Rs. The advantages of the MODIS based merged products is that the cloud and AOD are derived from MODIS retrievals. The advantage of the merged dataset from this study is the long-term record from 1983 to 2017.
The reduced performances of GEWEX and HXG might have been attributed to the inhomogeneity of cloud and aerosol input data in the radiation transfer model. Hayasaka (2016) [91] points out that discontinuities exist in the long-term variation in the Rs from GEWEX-SRB due to the transition from one reference satellite to the next satellite. Wang et al. (2015) [10] also noticed that different amounts of data from polar orbits and geostationary satellites and their different capabilities for detecting low-level clouds introduced inhomogeneity into the ISCCP-derived Rs data. For aerosols, the recent comparison work with CMSAF on the Iberian Peninsula for the period of 1985 to 2015 also suggests that the reason for the disagreement in trends between the satellite and reference ground-based SIS data over the Iberian Peninsula may be related to aerosols. Tang et al. (2019) [57] also noted that care should be taken when using HXG-derived Rs for trend analysis due to the use of climatological aerosol and albedo data.
Uncertainties might be introduced when comparing ground observations with satellite data. However, Huang et al. (2016) [92] show that the sampling error for a 5 × 5 km2 area ranged from 1.4 to 8.1% on monthly to “instantaneous” timescales, respectively. The direct comparisons between the Rs from the Geostationary Operational Environmental Satellite (GOES) and that measured at the Atmospheric Radiation Measurement (ARM) Southern Great Plains (SGP) site show that the sampling error decreases and levels off to a relatively small and stable value when averaged over periods greater than 5 days [93]. Hakuba et al. (2013a) [94] found that either a site-specific correction factor or increasing the number of sites in a grid box would reduce the sampling bias. These findings indicate that the sampling error would be small on a monthly timescale. We notice that SunDu data are not evenly distributed, especially in the northwestern region. The accuracy of applying spatial interpolation methods will decrease significantly when ground stations are sparse and non-uniform [95]. GWR can overcome this deficiency of spatial interpolation by taking account of spatially heterogeneous relationships between the dependent variable and regressors. The results also demonstrate that our GWR based fusion methods have better performance in the northwestern region (Figure S1), However, the uncertainties cannot be ruled out entirely, which need more ground-based study in the northwestern region of China in the future.
5. Conclusions
We compared four long-term AVHRR Rs products (GEWEX, CMSAF, HXG and HGWR) by using direct Rs observations, SunDu-derived Rs and CERES EBAF data as references. The spatial distribution of Rs and long-term trends over China are evaluated from 1983 to 2016. The results show that the four Rs products produce similar multiyear mean Rs values, but there are large differences in simulating the Rs variability and long-term trends.
Among these four Rs products, HXG produced the longest Rs records from 1983 to 2016 and few missing data. However, the long-term variability in Rs from HXG is slightly inconsistent with the observations. Comparatively, HGWR shows the best performance with a high R2 and lower RMSE and has a consistent long-term Rs trend and variability. The results suggest that further improvement in long-term trend Rs simulations is still needed. The merged Rs product (HGWR) can contribute to hydrology and ecology applications and research related to the simulation of land surface processes.
Supplementary Materials
The following are available online at https://0-www-mdpi-com.brum.beds.ac.uk/2072-4292/13/4/602/s1. Figure S1: The regional validations of monthly surface solar radiation (Rs). Table S1: Details of the data products used in this comparison, Statistical summary of GWR parameter optimization. Table S3: Statistical comparison of surface solar radiation Rs.
Author Contributions
All of the authors collected data, designed the study, analyzed the data, and prepared the manuscript. All of the authors contributed to the main research ideas and manuscript organization. All of the authors thoroughly reviewed and edited this paper. All authors have read and agreed to the published version of the manuscript.
Funding
This study was funded by the Fundamental Research Funds for the Central Universities (#BLX201907), the National Key Research & Development Program of China (2017YFA06036001), the National Natural Science Foundation of China (41525018 and 41930970) and the State Key Laboratory of Earth Surface Processes and Resource Ecology (U2020-KF-02).
Institutional Review Board Statement
Not applicable.
Data Availability Statement
The merged high-resolution Rs product from 1983 to 2017 over China, which can be downloaded at https://data.tpdc.ac.cn/zh-hans/data/a82849b0-9af5-457d-8968-4471dd845f2e/.
Acknowledgments
This study was funded by the Fundamental Research Funds for the Central Universities (#BLX201907), the National Key Research & Development Program of China (2017YFA06036001), the National Natural Science Foundation of China (41525018 and 41930970) and the State Key Laboratory of Earth Surface Processes and Resource Ecology (U2020-KF-02). We would like to thank Yuna Mao, Jizeng Du, Runze Li, Qian Ma, Guocan Wu and Chunlue Zhou for their insightful comments. The CERES SYN data can be downloaded from https://ceres.larc.nasa.gov/data/.
Conflicts of Interest
The authors declare no conflict of interest.
References
- Wang, Y.; Yang, S.; Sanchez-Lorenzo, A.; Yuan, W.; Wild, M. A revisit of direct and diffuse solar radiation in China based on homogeneous surface observations: Climatology, trends, and their probable causes. J. Geophys. Res. 2020, 125. [Google Scholar] [CrossRef]
- He, Y.; Wang, K.; Zhou, C.; Wild, M. A revisit of global dimming and brightening based on the sunshine duration. Geophys. Res. Lett. 2018, 45, 4281–4289. [Google Scholar] [CrossRef]
- Wild, M. Global dimming and brightening: A review. J. Geophys. Res. Atmos. 2009, 114, D00D16. [Google Scholar] [CrossRef] [Green Version]
- Wang, Y.; Wild, M. A new look at solar dimming and brightening in China. Geophys. Res. Lett. 2016, 43, 11–777. [Google Scholar] [CrossRef]
- He, Y.; Wang, K.C. Variability in direct and diffuse solar radiation across China from 1958 to 2017. Geophys. Res. Lett. 2020, 47. [Google Scholar] [CrossRef] [Green Version]
- You, Q.; Sanchez-Lorenzo, A.; Wild, M.; Folini, D.; Fraedrich, K.; Ren, G.; Kang, S. Decadal variation of surface solar radiation in the Tibetan Plateau from observations, reanalysis and model simulations. Clim. Dyn. 2013, 40, 2073–2086. [Google Scholar] [CrossRef]
- Wild, M.; Ohmura, A.; Makowski, K. Impact of global dimming and brightening on global warming. Geophys. Res. Lett. 2007, 34. [Google Scholar] [CrossRef] [Green Version]
- Roderick, M.L.; Farquhar, G.D. The cause of decreased pan evaporation over the past 50 years. Science 2002, 298, 1410–1411. [Google Scholar] [PubMed]
- Mercado, L.M.; Bellouin, N.; Sitch, S.; Boucher, O.; Huntingford, C.; Wild, M.; Cox, P.M. Impact of changes in diffuse radiation on the global land carbon sink. Nature 2009, 458, 1014–1017. [Google Scholar] [CrossRef] [Green Version]
- Wang, K.C.; Ma, Q.; Li, Z.; Wang, J. Decadal variability of surface incident solar radiation over China: Observations, satellite retrievals, and reanalyses. J. Geophys. Res. Atmos. 2015, 120, 6500–6514. [Google Scholar] [CrossRef]
- Wang, K.C. Measurement biases explain discrepancies between the observed and simulated decadal variability of surface incident solar radiation. Sci. Rep 2014, 4, 6144. [Google Scholar] [CrossRef] [Green Version]
- Yang, S.; Wang, X.L.; Wild, M. Homogenization and trend analysis of the 1958–2016 in situ surface solar radiation records in China. J. Clim. 2018, 31, 4529–4541. [Google Scholar] [CrossRef]
- Lu, W.H.; Bian, Z.Q. Station experiment and preliminary data analysis of high-precision solar radiation measurement system. Meteorol. Hydrol. Mar. Instrum. 2012, 3, 1–5. [Google Scholar]
- Mo, Y.Q.; Yang, Y.; Liang, H.L.; Wang, D. Investigation report on technology of status and development of meteorological radiation observation in China. Chin. J. Sci. Instrum. 2008, 29, 518–522. [Google Scholar]
- Lu, W.; Mo, Y.; Wang, D. Characteristics investigation for pyranometers. Acta Energi Sin. 2002, 23, 313–316. [Google Scholar]
- Yang, Y.; Ding, L.; Wang, D. Experiments and analysis of pyranometer on nighttime zero offset. Meteorol. Mon. 2010, 36, 100–103. [Google Scholar]
- Fritz, S.; Krishna Rao, P.; Weinstein, M. Satellite measurements of reflected solar energy and the energy received at the ground. J. Atmos. Sci. 1964, 21, 141–151. [Google Scholar] [CrossRef] [Green Version]
- Haar, T.H.V.; Suomi, V.E. Satellite observations of the earth’s radiation budget. Science 1969, 163, 667–669. [Google Scholar] [CrossRef]
- Schiffer, R.A.; Rossow, W.B. The International Satellite Cloud Climatology Project (ISCCP): The first project of the world climate research programme. Bull. Am. Meteorol. Soc. 1983, 64, 779–784. [Google Scholar] [CrossRef] [Green Version]
- Young, A.H.; Knapp, K.R.; Inamdar, A.; Hankins, W.; Rossow, W.B. The International Satellite Cloud Climatology Project H-series climate data record product. Earth Syst. Sci. Data 2018, 10, 583–593. [Google Scholar] [CrossRef] [Green Version]
- Heidinger, A.K.; Foster, M.J.; Walther, A.; Zhao, X. The pathfinder atmospheres—Extended AVHRR climate dataset. Bull. Am. Meteorol. Soc. 2014, 95, 909–922. [Google Scholar] [CrossRef]
- Pinker, R.T.; Tarpley, J.D.; Laszlo, I.; Mitchell, K.E.; Houser, P.R.; Wood, E.F.; Schaake, J.C.; Robock, A.; Lohmann, D.; Cosgrove, B.A.; et al. Surface radiation budgets in support of the GEWEX Continental-Scale International Project (GCIP) and the GEWEX Americas Prediction Project (GAPP), including the North American Land Data Assimilation System (NLDAS) project. J. Geophys. Res. Atmos. 2003, 108. [Google Scholar] [CrossRef]
- Karlsson, K.-G.; Anttila, K.; Trentmann, J.; Stengel, M.; Meirink, J.F.; Devasthale, A.; Hanschmann, T.; Kothe, S.; Jääskeläinen, E.; Sedlar, J. CLARA-A2: The second edition of the CM SAF cloud and radiation data record from 34 years of global AVHRR data. Atmos. Chem. Phys. 2017, 17, 5809–5828. [Google Scholar] [CrossRef] [Green Version]
- Stengel, M.; Stapelberg, S.; Sus, O.; Finkensieper, S.; Würzler, B.; Philipp, D.; Hollmann, R.; Poulsen, C.; Christensen, M.; McGarragh, G. Cloud_cci Advanced Very High Resolution Radiometer post meridiem (AVHRR-PM) dataset version 3: 35-year climatology of global cloud and radiation properties. Earth Syst. Sci. Data 2020, 12, 41–60. [Google Scholar] [CrossRef] [Green Version]
- Zhang, X.; Liang, S.; Wang, G.; Yao, Y.; Jiang, B.; Cheng, J. Evaluation of the reanalysis surface incident shortwave radiation products from NCEP, ECMWF, GSFC, and JMA using satellite and surface observations. Remote Sens. 2016, 8, 225–249. [Google Scholar] [CrossRef] [Green Version]
- Feng, F.; Wang, K. Determining factors of monthly to decadal variability in surface solar radiation in China: Evidences from current reanalyses. J. Geophys. Res. Atmos. 2019, 124, 9161–9182. [Google Scholar] [CrossRef] [Green Version]
- Zhao, L.; Lee, X.; Liu, S. Correcting surface solar radiation of two data assimilation systems against FLUXNET observations in North America. J. Geophys. Res. Atmos. 2013, 118, 9552–9564. [Google Scholar] [CrossRef]
- Qin, Y.; Wu, T.; Wu, X.; Li, R.; Xie, C.; Qiao, Y.; Hu, G.; Zhu, X.; Wang, W.; Shang, W. Assessment of reanalysis soil moisture products in the permafrost regions of the central of the Qinghai—Tibet Plateau. Hydrol. Process 2017, 31, 4647–4659. [Google Scholar] [CrossRef]
- Pinker, R.T.; Zhang, B.; Dutton, E.G. Do satellites detect trends in surface solar radiation. Science 2005, 308, 850–854. [Google Scholar] [CrossRef] [Green Version]
- Xia, X.A.; Wang, P.C.; Chen, H.B.; Liang, F. Analysis of downwelling surface solar radiation in China from National Centers for Environmental Prediction reanalysis, satellite estimates, and surface observations. J. Geophys. Res. Atmos. 2006, 111, 2105–2117. [Google Scholar] [CrossRef] [Green Version]
- Wang, Y.; Trentmann, J.; Yuan, W.; Wild, M. Validation of CM SAF CLARA-A2 and SARAH-E surface solar radiation datasets over China. Remote Sens. 2018, 10, 1977. [Google Scholar] [CrossRef] [Green Version]
- Tang, W.J.; Yang, K.; Qin, J.; Min, M. Development of a 50-year daily surface solar radiation dataset over China. Sci. China Earth Sci. 2013, 56, 1555–1565. [Google Scholar] [CrossRef]
- Manara, V.; Brunetti, M.; Celozzi, A.; Maugeri, M.; Sanchez-Lorenzo, A.; Wild, M. Detection of dimming/brightening in Italy from homogenized all-sky andclear-sky surface solar radiation records and underlying causes (1959–2013). Atmos. Chem. Phys. 2016, 16, 11145–11161. [Google Scholar] [CrossRef] [Green Version]
- Sanchez-Lorenzo, A.; Calbó, J.; Wild, M. Global and diffuse solar radiation in Spain: Building a homogeneous dataset and assessing their trends. Glob. Planet. Chang. 2013, 100, 343–352. [Google Scholar] [CrossRef]
- Hakuba, M.Z.; Sanchez-Lorenzo, A.; Folini, D.; Wild, M. Testing the homogeneity of short-term surface solar radiation series in Europe. AIP Conf. Proc. 2013, 1531, 700–703. [Google Scholar] [CrossRef]
- Brunetti, M.; Maugeri, M.; Monti, F.; Nanni, T. Temperature and precipitation variability in Italy in the last two centuries from homogenised instrumental time series. Int. J. Climatol. 2006, 26, 345–381. [Google Scholar] [CrossRef]
- Manara, V.; Brunetti, M.; Maugeri, M.; Sanchez-Lorenzo, A.; Wild, M. Homogenization of a surface solar radiation dataset over Italy. AIP Conf. Proc. 2017, 1810. [Google Scholar] [CrossRef]
- Sánchez-Romero, A.; González, J.A.; Calbó, J.; Sánchez-Lorenzo, A. Using digital image processing to characterize the Campbell-Stokes sunshine recorder and to derive high-temporal resolution direct solar irradiance. Atmos. Meas. Tech. 2014, 8, 183–194. [Google Scholar] [CrossRef] [Green Version]
- Stanhill, G.; Achiman, O. Early global radiation measurements: A review. Int. J. Climatol. 2017, 37, 1665–1671. [Google Scholar] [CrossRef]
- Fan, J.; Wu, L.; Zhang, F.; Cai, H.; Zeng, W.; Wang, X.; Zou, H. Empirical and machine learning models for predicting daily global solar radiation from sunshine duration: A review and case study in China. Renew. Sust. Energy Rev. 2019, 100, 186–212. [Google Scholar] [CrossRef]
- Rohani, A.; Taki, M.; Abdollahpour, M. A novel soft computing model (Gaussian process regression with K-fold cross validation) for daily and monthly solar radiation forecasting (Part: I). Renew. Energy 2018, 115, 411–422. [Google Scholar] [CrossRef]
- Che, H.Z.; Shi, G.Y.; Zhang, X.Y.; Arimoto, R.; Zhao, J.Q.; Xu, L.; Wang, B.; Chen, Z.H. Analysis of 40 years of solar radiation data from China, 1961–2000. Geophys. Res. Lett. 2005, 1029, 2341–2352. [Google Scholar] [CrossRef]
- Feng, Y.; Chen, D.; Zhao, X. Estimated long-term variability of direct and diffuse solar radiation in North China during 1959–2016. Theor.Appl. Climatol. 2019, 137, 153–163. [Google Scholar] [CrossRef]
- Yang, L.; Cao, Q.; Yu, Y.; Liu, Y. Comparison of daily diffuse radiation models in regions of China without solar radiation measurement. Energy 2020, 191. [Google Scholar] [CrossRef]
- Belaid, S.; Mellit, A. Prediction of daily and mean monthly global solar radiation using support vector machine in an arid climate. Energy Convers. Manag. 2016, 118, 105–118. [Google Scholar] [CrossRef]
- Soni, V.K.; Pandithurai, G.; Pai, D.S. Is there a transition of solar radiation from dimming to brightening over India. Atmos. Res. 2016, 169, 209–224. [Google Scholar] [CrossRef]
- Kazadzis, S.; Founda, D.; Psiloglou, B.; Kambezidis, H.; Mihalopoulos, N.; Sanchez-Lorenzo, A.; Meleti, C.; Raptis, P.I.; Pierros, F.; Nabat, P. Long-term series of surface solar radiation at Athens, Greece. Atmos. Chem. Phys. 2017. [Google Scholar] [CrossRef] [Green Version]
- Luo, Y.; Lu, D.; Zhou, X.; Li, W.; He, Q. Characteristics of the spatial distribution and yearly variation of aerosol optical depth over China in last 30 years. J. Geophys. Res. 2001, 106, 14501–14513. [Google Scholar] [CrossRef]
- Wang, K.C.; Dickinson, R.E. Contribution of solar radiation to decadal temperature variability over land. Proc. Natl. Acad. Sci. USA 2013, 110, 14877–14882. [Google Scholar] [CrossRef] [Green Version]
- Yang, H.; Li, Z.; Li, M.; Yang, D. Inconsistency in Chinese solar radiation data caused by instrument replacement: Quantification based on pan evaporation observations. J. Geophys. Res. 2015, 120, 3191–3198. [Google Scholar] [CrossRef]
- Feng, F.; Wang, K.C. Merging satellite retrievals and reanalyses to produce global long-term and consistent surface incident solar radiation datasets. Remote Sens. 2018, 10, 115. [Google Scholar] [CrossRef] [Green Version]
- Journée, M.; Müller, R.; Bertrand, C. Solar resource assessment in the Benelux by merging Meteosat-derived climate data and ground measurements. Sol. Energy 2012, 86, 3561–3574. [Google Scholar] [CrossRef]
- Ruiz-Arias, J.A.; Quesada-Ruiz, S.; Fernández, E.F.; Gueymard, C.A. Optimal combination of gridded and ground-observed solar radiation data for regional solar resource assessment. Sol. Energy 2015, 112, 411–424. [Google Scholar] [CrossRef]
- Lorenzo, A.T.; Morzfeld, M.; Holmgren, W.F.; Cronin, A.D. Optimal interpolation of satellite and ground data for irradiance nowcasting at city scales. Sol. Energy 2017, 144, 466–474. [Google Scholar] [CrossRef] [Green Version]
- Camargo, L.R.; Dorner, W. Integrating satellite imagery derived data and GIS-based solar radiation algorithms to map solar radiation in high temporal and spatial resolutions for the province of Salta, Argentina. In Proceedings of the SPIE Remote Sensing, Edinburgh, UK, 18 October 2016; p. 100050E. [Google Scholar]
- Hakuba, M.Z.; Folini, D.; Schaepman-Strub, G.; Wild, M. Solar absorption over Europe from collocated surface and satellite observations. J. Geophys. Res. 2014, 119, 3420–3437. [Google Scholar] [CrossRef]
- Tang, W.; Yang, K.; Qin, J.; Li, X.; Niu, X. A 16-year dataset (2000–2015) of high-resolution (3 h, 10 km) global surface solar radiation. Earth Syst. Sci. Data 2019, 11, 1905–1915. [Google Scholar] [CrossRef] [Green Version]
- Feng, F.; Wang, K. Does the modern—era retrospective analysis for research and applications—2 aerosol reanalysis introduce an improvement in the simulation of surface solar radiation over China? Int. J. Climatol. 2019, 39, 1305–1318. [Google Scholar] [CrossRef]
- Feng, F.; Wang, K. Merging ground-based sunshine duration with satellite cloud and aerosol data to produce high resolution long-term surface solar radiation over China. Earth Syst. Sci. Data Discuss 2020, 2020. [Google Scholar] [CrossRef]
- Kinne, S.; Schulz, M.; Textor, C.; Guibert, S.; Balkanski, Y.; Bauer, S.E.; Berntsen, T.; Berglen, T.F.; Boucher, O.; Chin, M.; et al. An aerocom initial assessment—Optical properties in aerosol component modules of global models. Atmos. Chem. Phys. 2006, 6, 1815–1834. [Google Scholar] [CrossRef] [Green Version]
- Karlsson, K.G.; Riihelä, A.; Müller, R.; Meirink, J.F.; Sedlar, J.; Stengel, M.; Lockhoff, M.; Trentmann, J.; Kaspar, F.; Hollmann, R.; et al. CLARA-A1: A cloud, albedo, and radiation dataset from 28 years of global AVHRR data. Atmos. Chem. Phys. 2013, 13, 5351–5367. [Google Scholar] [CrossRef] [Green Version]
- Pinker, R.T.; Laszlo, I. Modeling surface solar irradiance for satellite applications on a global scale. J. Appl. Meteorol. Climatol. 1992, 31, 194–211. [Google Scholar] [CrossRef] [Green Version]
- Suarez, M.; daSilva, A.; Dee, D.; Bloom, S.; Bosilovich, M.; Pawson, S.; Schubert, S.; Wu, M.-L.; Sienkiewicz, M.; Stajner, I. Documentation and Validation of the Goddard Earth Observing System (GEOS) Data Assimilation System, Version 4; NASA Technical Reports Server (NTRS): Washington, DC, USA, 2005. [Google Scholar]
- Sun, Z.; Liu, J.; Zeng, X.; Liang, H. Parameterization of instantaneous global horizontal irradiance: Cloudy-sky component. J. Geophys. Res. 2012, 117. [Google Scholar] [CrossRef] [Green Version]
- Sun, Z.; Zeng, X.; Liu, J.; Liang, H.; Li, J. Parametrization of instantaneous global horizontal irradiance: Clear-sky component. Q. J. R. Meteorol. Soc. 2014, 140, 267–280. [Google Scholar] [CrossRef]
- Minnis, P.; Sun-Mack, S.; Chen, Y.; Chang, F.-L.; Yost, C.R.; Smith, W.L.; Heck, P.W.; Arduini, R.F.; Bedka, S.T.; Yi, Y.; et al. CERES MODIS cloud product retrievals for edition 4—Part I: Algorithm changes. IEEE Trans. Geosci. Remote Sens. 2020. [Google Scholar] [CrossRef]
- Kato, S.; Rose, F.G.; Rutan, D.A.; Thorsen, T.J.; Loeb, N.G.; Doelling, D.R.; Huang, X.; Smith, W.L.; Su, W.; Ham, S.-H. Surface irradiances of edition 4.0 Clouds and the Earth’s Radiant Energy System (CERES) Energy Balanced and Filled (EBAF) data product. J. Clim. 2018, 31, 4501–4527. [Google Scholar] [CrossRef]
- Yang, K.; Koike, T.; Ye, B. Improving estimation of hourly, daily, and monthly solar radiation by importing global data sets. Agric. For. Meteorol. 2006, 137, 43–55. [Google Scholar] [CrossRef]
- Manara, V.; Beltrano, M.C.; Brunetti, M.; Maugeri, M.; Sanchez-Lorenzo, A.; Simolo, C.; Sorrenti, S. Sunshine duration variability and trends in Italy from homogenized instrumental time series (1936–2013). J. Geophys. Res. Atmos. 2015, 120, 3622–3641. [Google Scholar] [CrossRef]
- Sanchezlorenzo, A.; Azorinmolina, C.; Wild, M.; Vicenteserrano, S.M.; Lópezmoreno, J.I.; Corellcustardoy, D. Feasibility of sunshine duration records to detect changes in atmospheric turbidity: A case study in Valencia (Spain). In Proceedings of the AIP, Berlin, Germany, 6–10 August 2012; Volume 1531, pp. 736–739. [Google Scholar]
- Tang, W.J.; Yang, K.; Qin, J.; Cheng, C.C.K.; He, J. Solar radiation trend across China in recent decades: A revisit with quality-controlled data. Atmos. Chem. Phys. 2011, 11, 393–406. [Google Scholar] [CrossRef] [Green Version]
- Wang, Y.; Yang, Y.; Zhao, N.; Liu, C.; Wang, Q. The magnitude of the effect of air pollution on sunshine hours in China. J. Geophys. Res. Atmos. 2012, 117, D00V14. [Google Scholar] [CrossRef]
- Sanchezlorenzo, A.; Calbó, J.; Brunetti, M.; Deser, C. Dimming/brightening over the Iberian Peninsula: Trends in sunshine duration and cloud cover and their relations with atmospheric circulation. J. Geophys. Res. Atmos. 2009, 114, D100D109. [Google Scholar] [CrossRef] [Green Version]
- Ali, K.; Partridge, M.D.; Olfert, M.R. Can geographically weighted regressions improve regional analysis and policy making? Int. Reg. Sci. Rev. 2007, 30, 300–329. [Google Scholar] [CrossRef]
- Gao, X.; Asami, Y.; Chung, C.-J.F. An empirical evaluation of spatial regression models. Comput. Geosci. 2006, 32, 1040–1051. [Google Scholar] [CrossRef]
- LeSage, J.P. A family of geographically weighted regression models. Adv. Spat. Econom. 2004, 241–264. [Google Scholar] [CrossRef] [Green Version]
- Sheehan, K.R.; Strager, M.P.; Welsh, S.A. Advantages of geographically weighted regression for modeling benthic substrate in two greater yellowstone ecosystem streams. Environ. Monit. Assess. 2012, 18, 209–219. [Google Scholar] [CrossRef]
- Georganos, S.; Abdi, A.M.; Tenenbaum, D.E.; Kalogirou, S. Examining the NDVI-rainfall relationship in the semi-arid Sahel using geographically weighted regression. J. Arid Environ. 2017, 146, 64–74. [Google Scholar] [CrossRef]
- Zhou, Q.; Wang, C.; Fang, S. Application of geographically weighted regression (GWR) in the analysis of the cause of haze pollution in China. Atmos. Pollut.Res. 2019, 10, 835–846. [Google Scholar] [CrossRef]
- Du, J.; Wang, K.C.; Wang, J.; Ma, Q. Contributions of surface solar radiation and precipitation to the spatiotemporal patterns of surface and air warming in China from 1960 to 2003. Atmos. Chem. Phys. 2017, 17, 4931–4944. [Google Scholar] [CrossRef] [Green Version]
- Li, J.; Jiang, Y.W.; Xia, X.G.; Hu, Y.Y. Increase of surface solar irradiance across East China related to changes in aerosol properties during the past decade. Environ. Res. Lett. 2018, 13, 034006. [Google Scholar] [CrossRef]
- Hayasaka, T.; Kawamoto, K.; Shi, G.; Ohmura, A. Importance of aerosols in satellite-derived estimates of surface shortwave irradiance over China. Geophys. Res. Lett. 2006, 33. [Google Scholar] [CrossRef]
- Riihelä, A.; Key, J.R.; Meirink, J.F.; Kuipers Munneke, P.; Palo, T.; Karlsson, K.-G. An intercomparison and validation of satellite-based surface radiative energy flux estimates over the Arctic. J. Geophys. Res. Atmos. 2017, 122, 4829–4848. [Google Scholar] [CrossRef]
- Chao, L.; Zhang, K.; Li, Z.; Zhu, Y.; Wang, J.; Yu, Z. Geographically weighted regression based methods for merging satellite and gauge precipitation. J. Hydrol. 2018, 558, 275–289. [Google Scholar] [CrossRef]
- Ma, Y.; Gopal, S. Geographically weighted regression models in estimating median home prices in towns of Massachusetts based on an urban sustainability framework. Sustainability 2018, 10, 1026. [Google Scholar] [CrossRef] [Green Version]
- Li, T.; Meng, Q. Forest dynamics to precipitation and temperature in the Gulf of Mexico coastal region. Int. J. Biometeorol. 2017, 61, 869–879. [Google Scholar] [CrossRef] [PubMed]
- Tsai, P.; Teng, H. Role of Aedes aegypti (Linnaeus) and Aedes albopictus (Skuse) in local dengue epidemics in Taiwan. BMC Infect. Dis. 2016, 16, 662. [Google Scholar] [CrossRef] [Green Version]
- Wang, M.; He, G.; Zhang, Z.; Wang, G.; Zhang, Z.; Cao, X.; Wu, Z.; Liu, X. Comparison of spatial interpolation and regression analysis models for an estimation of monthly near surface air temperature in China. Remote Sens. 2017, 9, 1278–1294. [Google Scholar] [CrossRef] [Green Version]
- Liang, F.; Xia, X.A. Long-term trends in solar radiation and the associated climatic factors over China for 1961–2000. Ann. Geophys. 2005, 23, 2425–2432. [Google Scholar] [CrossRef] [Green Version]
- Shi, G.-Y.; Hayasaka, T.; Ohmura, A.; Chen, Z.-H.; Wang, B.; Zhao, J.-Q.; Che, H.-Z.; Xu, L. Data quality assessment and the long-term trend of ground solar radiation in China. J. Appl. Meteorol. Climatol. 2008, 47, 1006–1016. [Google Scholar] [CrossRef]
- Hayasaka, T. The Long-term variation in surface shortwave irradiance in China and Japan: A review. J. Meteorol. Soc. Jpn. 2016, 94, 393–414. [Google Scholar] [CrossRef] [Green Version]
- Huang, G.H.; Li, X.; Huang, C.L.; Liu, S.M.; Ma, Y.F.; Chen, H. Representativeness errors of point-scale ground-based solar radiation measurements in the validation of remote sensing products. Remote Sens. Environ. 2016, 181, 198–206. [Google Scholar] [CrossRef]
- Li, Z.; Cribb, M.; Chang, F.L.; Trishchenko, A.; Luo, Y. Natural variability and sampling errors in solar radiation measurements for model validation over the Atmospheric Radiation Measurement Southern Great Plains region. J. Geophys. Res. Atmos. 2005, 110. [Google Scholar] [CrossRef] [Green Version]
- Hakuba, M.Z.; Folini, D.; Sanchez-Lorenzo, A.; Wild, M. Spatial representativeness of ground-based solar radiation measurements. J. Geophys. Res. Atmos. 2013, 118, 8585–8597. [Google Scholar] [CrossRef] [Green Version]
- Li, J.; Heap, A.D. A review of comparative studies of spatial interpolation methods in environmental sciences: Performance and impact factors. Ecol. Inform. 2011, 6, 228–241. [Google Scholar] [CrossRef]
Figure 1.
The ~2400 sunshine duration (SunDu) merged sites are shown as light pink points, and 121 independent validation sites are shown as dark pink points. The whole region is classified into nine subregions (I to IX) by the K-mean cluster method based on geographic locations and multiyear mean Rs using 121 Rs validation sites. The base hill shade map was produced by an elevation map of China using the global digital elevation model (DEM) derived from the Shuttle Radar Topography Mission 30 (SRTM30) dataset.

Figure 2.
Comparison of monthly surface solar radiation (Rs) from the Climate Monitoring Satellite Application Facility (CMSAF)cloud and radiation data record (CLARA-A2) (CMSAF), Global Energy and Water Exchanges-surface radiation budget (GEWEX-SRB) (GEWEX), International Satellite Cloud Climatology Project ISCCP H-series cloud product HXG (ISCCP-HXG)-based Rs data (HXG) and the merged product (HGWR) by using different validation data from 2000 to 2007. Subplots (a,d,g,j) represent validation results using direct observations, while (b,e,h,k) represent SunDu-derived Rs data (SunDu Rs), and subplots (c,f,i,l) represent Clouds and the Earth’s Radiant Energy System energy balanced and filled product (CERES EBAF) data (CERES).

Figure 3.
Spatial distribution of multiyear mean Rs from 2000 to 2007. The first line (a,b) shows the observed multiyear mean Rs from SunDu and CERES EBAF (CERES); the multiyear mean Rs derived from the CMSAF CLARA-A2 (CMSAF) and GEWEX-SRB (GEWEX) are shown in the second line (c,d), respectively. The third line (e,f) shows the observed multiyear mean monthly Rs from ISCCP-HXG (HXG) and ISCCP-HXG merged with SunDu-derived Rs (HGWR).

Figure 4.
Spatial distributions of trends for Rs from 2000 to 2007. The first line (a,b) shows the SunDu-derived Rs and CERES EBAF Rs (CERES); the Rs-derived CMSAF CLARA-A2 (CMSAF) and GEWEX-SRB (GEWEX) are shown in the second line (c,d). Subplots (e,f) represent ISCCP-HXG-derived Rs (HXG) and ISCCP-HXG merged with SunDu-derived Rs (HGWR).

Figure 5.
Spatial distributions of trends for Rs from 1984 to 2000, 2000 to 2016 and 1984 to 2016. The first line (a,b,c) shows the Rs trends from 1984 to 2000 based on SunDu-derived Rs (SunDu Rs), ISCCP-HXG-derived Rs (HXG) and ISCCP-HXG merged with SunDu-derived Rs (HGWR). The second (d,e,f) and third lines (g,h,i) show the Rs trends from 1984 to 2016 and 2000 to 2016, respectively.

Figure 6.
The national mean of the annual anomaly of the Rs by using 121 observation sites from 1983 to 2016 derived from observations and satellite-derived Rs, including direct Rs observations (Obs), SunDu derived Rs (SunDu), CERES EBAF (CERES), GEWEX-SRB (GEWEX), ISCCP-HXG (HXG) and the merged Rs data (HGWR). Direct observed Rs data, SunDu-derived Rs and CERES EBAF are shown as the light grey line, the black line and the orange line, respectively. The brown line, the light blue line and the blue line represent the Rs variations derived from CMSAF CLARA-A2 (CMSAF), GEWEX-SRB (GEWEX) and ISCCP-HXG derived Rs (HXG), respectively. The ISCCP-HXG derived Rs merged with SunDu derived Rs (HGWR) is shown as the green line.

Figure 7.
The regional mean of the annual anomaly of the Rs for different subregions. Nine subregions (I to IX) over China are shown in Figure 1. The direct observed Rs data, SunDu-derived Rs and CERES EBAF are shown as the light grey lines, the black lines and the orange lines. The brown lines, the light blue lines and the blue lines represent the Rs variation derived from the CMSAF CLARA A2 (CMSAF), GEWEX-SRB (GEWEX) and ISCCP-HXG derived Rs (HXG), respectively. The ISCCP-HXG derived Rs merged with SunDu derived Rs (HGWR) is shown as the green lines.


Table 1.
Statistical summary of national mean linear trends of monthly anomalous surface solar radiation (Rs) (10 years) derived from observations and satellite retrievals, including direct observations (Obs), SunDu-derived Rs (SunDu), CERES EBAF (CERES), GEWEX-SRB (GEWEX), CMSAF CLAR A2 (CMSAF), ISCCP-HXG (HXG) and merged Rs data (HGWR).
| 1983–2007 | 2000–2007 | 2000–2016 | 1983–2016 | |
|---|---|---|---|---|
| Obs | −2.52 | −1.81 | 2.87 | −0.07 |
| SunDu | −0.77 | −0.76 | −0.26 | −0.57 |
| CERES | −3.25 | −1.25 | ||
| CMSAF | 5.46 | 1.36 | −1.16 | 2.56 |
| GEWEX | −2.88 | −6.96 | −6.96 | −2.88 |
| HXG | −5.28 | −8.40 | −2.12 | −4.28 |
| HGWR | −0.49 | −1.89 | −1.53 | −0.64 |
Publisher’s Note: MDPI stays neutral with regard to jurisdictional claims in published maps and institutional affiliations. |
© 2021 by the authors. Licensee MDPI, Basel, Switzerland. This article is an open access article distributed under the terms and conditions of the Creative Commons Attribution (CC BY) license (http://creativecommons.org/licenses/by/4.0/).
Share and Cite
MDPI and ACS Style
Feng, F.; Wang, K. Merging High-Resolution Satellite Surface Radiation Data with Meteorological Sunshine Duration Observations over China from 1983 to 2017. Remote Sens. 2021, 13, 602. https://0-doi-org.brum.beds.ac.uk/10.3390/rs13040602
AMA Style
Feng F, Wang K. Merging High-Resolution Satellite Surface Radiation Data with Meteorological Sunshine Duration Observations over China from 1983 to 2017. Remote Sensing. 2021; 13(4):602. https://0-doi-org.brum.beds.ac.uk/10.3390/rs13040602
Chicago/Turabian StyleFeng, Fei, and Kaicun Wang. 2021. "Merging High-Resolution Satellite Surface Radiation Data with Meteorological Sunshine Duration Observations over China from 1983 to 2017" Remote Sensing 13, no. 4: 602. https://0-doi-org.brum.beds.ac.uk/10.3390/rs13040602
Note that from the first issue of 2016, this journal uses article numbers instead of page numbers. See further details here.