
Groundwater Depletion Signals in the Beqaa Plain, Lebanon: Evidence from GRACE and Sentinel-1 Data


1
Jet Propulsion Laboratory, California Institute of Technology, Pasadena, CA 91109, USA
2
National Center for Remote Sensing, CNRS Lebanon, Beirut, Lebanon
3
Geospatial Studies Laboratory, Lebanese University, Tripoli, Lebanon
*
Author to whom correspondence should be addressed.
Remote Sens. 2021, 13(5), 915; https://0-doi-org.brum.beds.ac.uk/10.3390/rs13050915
Submission received: 3 February 2021
/
Revised: 19 February 2021
/
Accepted: 25 February 2021
/
Published: 1 March 2021
(This article belongs to the Special Issue GRACE Satellite Gravimetry for Geosciences)
Abstract
:Regions with high productivity of agriculture, such as the Beqaa Plain, Lebanon, often rely on groundwater supplies for irrigation demand. Recent reports have indicated that groundwater consumption in this region has been unsustainable, and quantifying rates of groundwater depletion has remained a challenge. Here, we utilize 15 years of data (June 2002–April 2017) from the Gravity Recovery and Climate Experiment (GRACE) satellite mission to show Total Water Storage (TWS) changes in Lebanon’s Beqaa Plain. We then obtain complimentary information on various hydrologic cycle variables, such as soil moisture storage, snow water equivalent, and canopy water storage from the Global Land Data Assimilation System (GLDAS) model, and surface water data from the largest body of water in this region, the Qaraaoun Reservoir, to disentangle the TWS signal and calculate groundwater storage changes. After combining the information from the remaining hydrologic cycle variables, we determine that the majority of the losses in TWS are due to groundwater depletion in the Beqaa Plain. Results show that the rate of groundwater storage change in the West Beqaa is nearly +0.08 cm/year, in the Rashaya District is −0.01 cm/year, and in the Zahle District the level of depletion is roughly −1.10 cm/year. Results are confirmed using Sentinel-1 interferometric synthetic aperture radar (InSAR) data, which provide high-precision measurements of land subsidence changes caused by intense groundwater usage. Furthermore, data from local monitoring wells are utilized to further showcase the significant drop in groundwater level that is occurring through much of the region. For monitoring groundwater storage changes, our recommendation is to combine various data sources, and in areas where groundwater measurements are lacking, we especially recommend the use of data from remote sensing.

1. Introduction
During the past few decades, the demanding needs for fresh water resources in various locations of the globe have exceeded the supply that is renewed naturally, and this has impacted agricultural industries, urban areas, and the environment [1,2,3]. This is especially the case for semi-arid regions such as the Beqaa Plain in Lebanon. Until now, there has been a large gap between water supplies that are available on the surface and water demands that are growing annually, and this has caused immense stress on freshwater systems around the globe. To fulfill the gap in demand for freshwater, a large dependence on groundwater, a convenient fossil resource stored in shallow aquifers below the ground, has occurred in various regions of the world. This is unsustainable, because groundwater recharge that replenishes the system is a slow process compared to the increasing rates of groundwater pumping. This has created a loss rate that is greater than the replenishing rate of groundwater, resulting in depletion of subsurface aquifers around the world [4,5,6]. Changing climates are further exacerbating this problem. With precipitation becoming more variable and droughts more frequent, groundwater pumping is becoming an increasingly relied upon resource, and the recharge needed to replenish the system is becoming more inadequate. Additionally, other variables in the hydrologic cycle are also impacted by a changing climate, such as soil moisture or snow packs, which are affected by increasing temperatures and precipitation variability [7,8,9]. The effects of unsustainable use of groundwater resources and resultant groundwater depletion have been observed through satellite measurements and/or model simulations in many systems of the world [6,10,11,12], but consistent monitoring of groundwater is still lacking.
Despite the critical need for freshwater supplies, the monitoring of water resource availability has often been inadequate. For instance, networks for monitoring groundwater are not set up at the broad scale of surface water observations [13]. Typically, groundwater data is collected at in-situ wells, yet these observations are expensive, spatially and temporally sparse, discontinuous, and often difficult to obtain. To deal with these issues, methods for interpolating model simulations of the hydrologic cycle are now used to calculate availability of fresh water sources [14,15]. Although hydrologic and land surface models can estimate the availability of water at high resolution, various commonly used models, such as the Global Land Data Assimilation System (GLDAS) [16,17], do not include anthropogenic processes like groundwater pumping. Without this proper representation of human interaction within the climate system, simulations can create a significant bias by underestimating groundwater pumping rates and the degree of groundwater depletion in a region [18]. Furthermore, information on other hydrologic variables is rarely available, such as accurate information on soil moisture or snow water equivalent. Even though there are ways to obtain details on these hydrologic variables of interest, for example through the use of remote sensing, field measurements, and the assimilation of data in model simulations [15,19,20], accurate knowledge on these processes is still not available.
Recently around the globe, various productive agricultural regions have seen declines in levels of total water storage. Depletion of groundwater storage in these regions has been suggested to be a major factor contributing to freshwater losses in these regions [10,21]. In the Beqaa Plain, Lebanon, a significant percentage of the annual freshwater usage comes from groundwater, and a large part of it is for use in agriculture [3]. Data from the United States Agency for International Development (USAID) show that since 1970 groundwater over-use in the region has caused the depletion of groundwater levels at various pumping wells. This is an anthropogenic effect on the system, where extensive groundwater pumping surpasses the natural rates of recharge, and this causes drops in the aquifer levels [10,22]. Furthermore, the freshwater that is stored in the snow pack in the local mountain areas can benefit the region during the spring and summer seasons, which are generally drier. Yet, increasing temperatures paired with decreasing, and sometimes major oscillations, in rainfall due to climate change has caused snow packs to be generally lower, such as in the mountain regions of the Middle East. Additionally, during droughts, large surface water reservoirs in the region, such as the Qaraaoun reservoir, can have depleted supplies of surface water. This further exacerbates the reliance on groundwater during droughts in this region. In this study, we aim to quantify the changes in groundwater storage for the Beqaa Plain, by utilizing information on hydrologic cycle variables from remote sensing, model simulations, and in-situ data.
In recent years, satellite data has emerged as a great tool to observe the Earth, including certain variables in the hydrologic cycle [5,10,11,12,23,24]. For example, NASA’s Gravity Recovery and Climate Experiment (GRACE) satellites [25] have been established as extremely valuable instruments for regional to global scale water cycle studies [6,26]. To obtain information on groundwater dynamics, gravimetric observations from GRACE are obtained and the signal is translated into a mass change signal, which can then be directly related to changes in freshwater sources. To estimate groundwater storage changes, information on other hydrological variables, obtained from in-situ data or model simulations, can be combined with information from the GRACE signal (e.g., [6,10,11,12,13]). Typically, the hydrologic variables that are needed for this problem include snow water equivalent and freshwater stored in soil moisture, and this information can be acquired from model simulations. Additionally, information on water that is stored in surface reservoirs is needed, and this type of data can be acquired from water resource managers in the region. Overall, combining these data sets provides the needed evidence to calculate GRACE-derived groundwater storage changes.
Total Water Storage (TWS) from GRACE is combined with data sets that represent hydrologic variables in order to estimate groundwater, or other water sources, in a region. In this study, information for many of these hydrologic variables are obtained from the GLDAS model [16], and this includes the soil moisture storage, snow water equivalent, and canopy water storage. For surface water, we utilize data from the Qaraaoun reservoir, which is the single largest body of water in the region. Ultimately, the groundwater variable is the only missing component needed to complete the water balance. Therefore, all of the information for the other hydrologic variables is fused, and we can quantify groundwater storage from the signal of the GRACE satellite data. By utilizing the different data sources available through remote sensing, model simulations, and in-situ observations, we estimate and make quantitative assessments of the evolution of groundwater in the Beqaa Plain.
The motivation for this study is based on recent reports that have brought attention to the fact that groundwater aquifers are depleting in the Beqaa Plain [3], and our hypotheses for this study are comprised of the following two points. (1) Groundwater is indeed depleting through much of the Beqaa Plain due to unsustainable groundwater pumping, and GRACE data can be effectively used to provide evidence of this on the basin scale. (2) Other data sources, such as Sentinel-1 interferometric synthetic aperture radar (InSAR) data and in-situ monitoring wells can confirm the GRACE results, and provide additional details on high spatial resolution that can pinpoint exact locations where groundwater depletion is most evident. The utilization of the techniques presented in this study provide a country like Lebanon, or similarly other regions with a lack of observational data, a framework to assess groundwater storage on the basin scale, where consistent data on water wells is mostly missing and during a time that chaotic, unchecked, and unsustainable groundwater pumping is being exacerbated in the region.
2. Materials and Methods
2.1. The Beqaa Plain, Lebanon
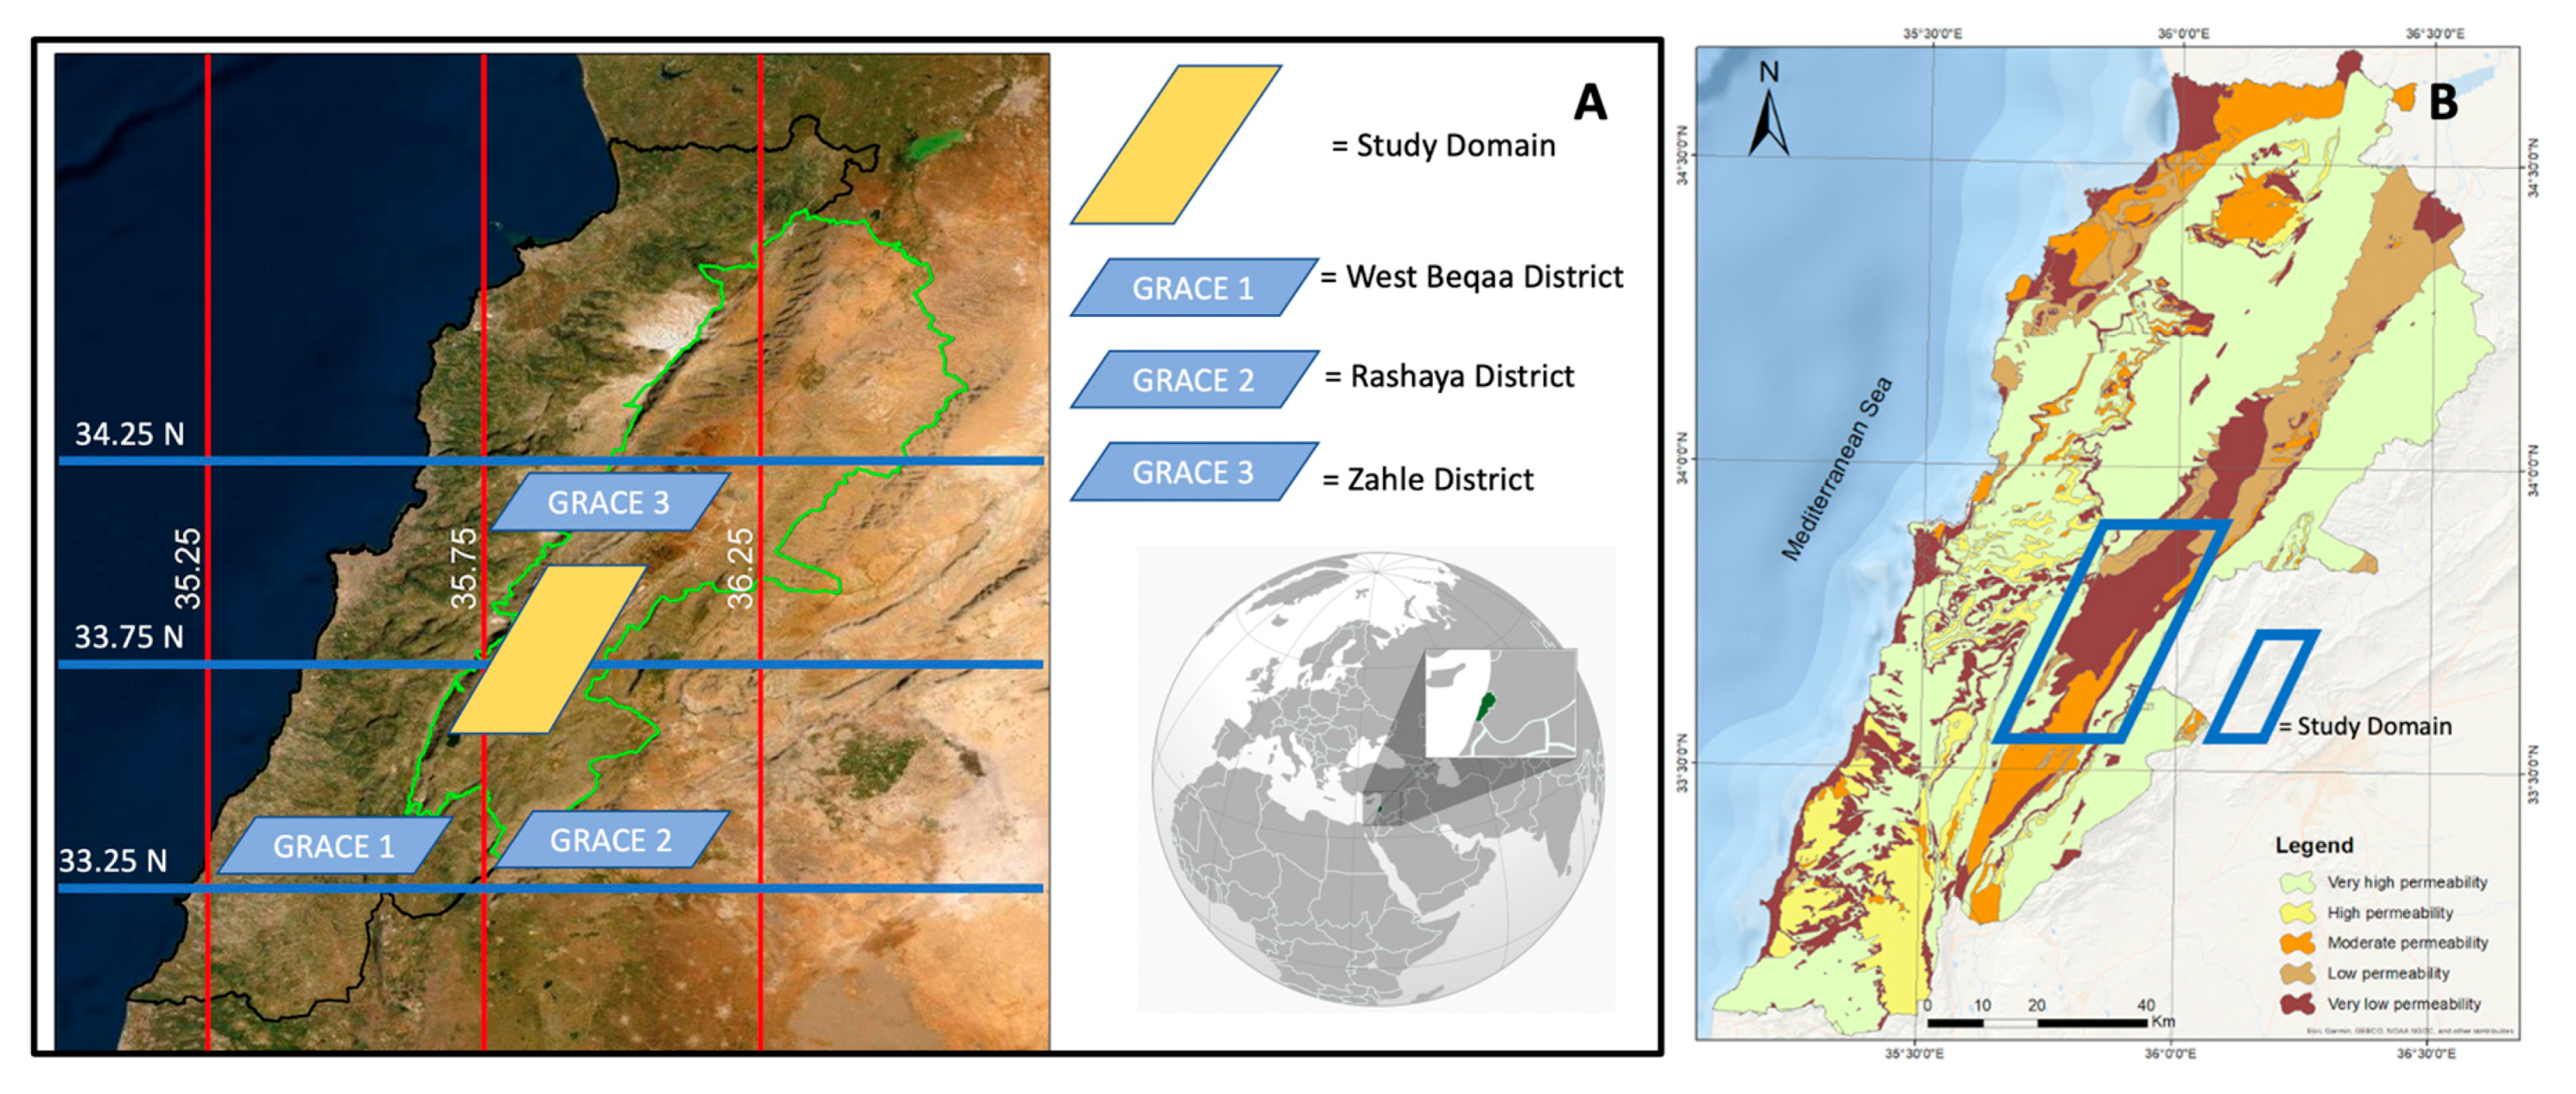
The Beqaa Plain (8–15 km wide), in the east part of Lebanon, is a fertile valley that is home to a flourishing industry related to agriculture, and is Lebanon’s most important farming region. The region is roughly 30 km (19 mi) to the east of the capitol city, Beirut, and is located in between Mount Lebanon (to the west) and the Anti-Lebanon mountains (to the east). The size of the valley is roughly 120 km (75 mi) from north to south and 11 km (9.9 mi) from west to east. The Beqaa has a Mediterranean climate, with winters that are wet and snowy and summers that are dry and warm. Due to the high peaks of Mount Lebanon to the west, a rain shadow is created that blocks precipitation from the sea, causing limited rainfall to occur in this region compared to other parts of the country. There is generally lower precipitation in the northern section of the Beqaa Plain with 230 mm (9.1 in), compared to 610 mm (24 in) in the southern portion. The majority of the lithological characteristics in the region implies that the Neogene and Quaternary rocks are mainly composed of rock mixture conglomerates, alluvial deposits and other detrital rocks. Figure 1A shows our study area within the context of greater Lebanon, and the location of the three GRACE grid cells that are examined in this study, defined as the West Beqaa, the Rashaya District, and Zahle District regions. Additionally, the map of Lebanon is shown in relation to the rest of the globe on the bottom right of this panel. Figure 1B shows the potential recharge map for the whole Lebanese territory, and in our study area there is a mixture of high to very high recharge (yellow) in the West Beqaa, moderate recharge (orange) in the Rashaya District, and low to very low recharge (purple) in the Zahle District [27,28].
2.2. GRACE Data
NASA and the DLR’s (German Aerospace Center) satellite mission, GRACE, offered a new way to monitor water storage from the vantage point of space [5,25,29]. For nearly 15 years, GRACE provided estimates of global mass change at monthly resolution, which have been heavily utilized in applications for water resources management and hydrologic studies. Recent literature has made evident the benefits that can be obtained with GRACE. These studies include applications to various regions around the globe, including the Middle East [30,31], California [5,10,11,13], Northern India [29,32] and Northern China [33,34], to list a few. For our study, we utilize the GRACE mascon product from JPL RL05M.1 Version 2, from April 2003 through June 2017, which can be downloaded at no cost at https://grace.jpl.nasa.gov/data/get-data/ [35,36]. We use the data to investigate the changes in TWS in the Beqaa Plain (Figure 2). The GRACE data product we use in this study has a spatial resolution of 0.5 degrees and a monthly temporal resolution. Please refer to [35] for details on the mascons and the scale factors used for the processing of the GRACE data.
For clarity, we briefly describe here how the GRACE data is utilized to measure changes in water mass. GRACE measures change in water mass (in kg), which can be converted to units of (m3) (volume of water) if we divide by the density of water. Then from this, we can divide by the total area of the GRACE grid cell, and that would give us a unit of (cm of water). This tells you how much cm of water is increased/decreased from the last time step over the whole region on average. So, it is not exactly measuring water change at any specific level below or above the surface, but is instead measuring the overall volume/mass of water change for that basin.
2.3. GLDAS Data
The GLDAS system [16] provides details and simulation outputs from various land surface models that simulate the globe based on incorporation of other data products. The system is forced with observed radiation, precipitation, temperature, humidity, and wind, to simulate the earth’s land surface and estimate the storage and movement of energy and water, globally. The system provides estimates of soil moisture storage in the top 2 m, but we only utilize the soil moisture storage in the top 10 cm for our study (SM). GLDAS also includes snow water equivalent (SWE) and water stored in vegetation (Canopy). GLDAS outputs are shown for the Beqaa region in Figure 3, Figure 4 and Figure 5, respectively. Note, we represent the soil moisture storage in the top 10 cm as the entirety of the water storage in soils, and the remaining water storage in the soil is counted as part of the groundwater storage component. We use monthly outputs from GLDAS to facilitate the combination with the GRACE data. The units of the GLDAS outputs are in (kg m−2) of fresh water. In order to match the units of the GRACE data in (cm), we perform a unit change on the outputs, which involves dividing by the density of water (1000 kg m−3), and converting from (m) to (cm). Water storage that is on the surface of the land, such as lakes, reservoirs, and rivers, is not explicitly simulated in the GLDAS model. Therefore, we utilize information on the Qaraaoun reservoir height to fulfill this requirement.
2.4. Qaraaoun Reservoir Data
The Qaraaoun Reservoir, or Lake Qaraaoun, is a manmade reservoir or lake situated in the south part of the Beqaa Plain. It was built in 1959 close to the Qaraaoun village, by erecting a concrete dam that is 61 m (200 ft) high. It is the largest dam in Lebanon, and is located in the middle reaches of the Litani River, which is the longest river in Lebanon. The reservoir provides numerous benefits, such as hydropower, water supply to the local population, and for the irrigation of 27,500 hectares (68,000 acres) of agricultural fields. Every year, the amount of water received at the Qaraaoun Reservoir by the Litani River is 420 million m3 (15 billion ft3). To satisfy the freshwater demand of the Kassmieh irrigation project during the dry summer months, 30 million m3 (1.1 billion ft3) of water is diverted from Markaba power station annually. In our study, we use timeline data of the Qaraaoun reservoir as information for surface water storage in the Beqaa region, shown in Figure 6 in units (meters above sea level). To match units of the GRACE data (cm), we perform a unit change on the data, which involves converting from (m) to (cm), and then scaling by the ratio of the area of the reservoir (11.9 km2) to the area of the GRACE grid cell (55 × 55 = 3025 km2).
2.5. Calculating Groundwater Storage
As indicated previously, the contributions of mass changes from each individual process of the hydrologic cycle must be disentangled from the GRACE signal in order to infer groundwater storage changes [5,11,24]. Here, we list the steps needed to derive groundwater estimates for this study. First, all data must be recalculated in order to have units of cm, to match the signal in the GRACE data (TWS(t)). The GLDAS outputs in our study have a resolution of 0.25 degrees, whereas the GRACE grid cell has resolution of 0.5 degrees. Before we process the data spatially, we make sure the units are all in volume of water. Once we combine the data that are in the same units of volume, we then combine all the information in each grid cell and convert the units to (cm) by dividing by the area of the respective grid cell. We convert all values to match the size of the GRACE grid cell of 0.5 degrees. Then, to process the temporal side of the data, we apply interpolation on the temporal data to make sure that we have a data point for each month (some monthly values are missing in the raw GRACE data).
We use information for water stored in the land as soil moisture storage in the top 10 cm (SM(t)), water stored in the snow pack as snow water equivalent (SWE(t)), water stored in vegetation as canopy water (Canopy(t)), and water stored on the land surface as surface water (SW(t)). We then subtract the combined value of all these variables from the TWS data (TWS(t)) obtained from GRACE. Here, t represents the month in which the estimate is being calculated. Therefore, groundwater (GW(t)) storage change estimates at each month for each location defined in this study in the Beqaa Plain is given by the following equation:
GW(t) = TWS(t) − [ SM(t) + SWE(t) + Canopy(t) + SW(t)].
After propagating the effect of all the hydrologic variables from the GRACE signal, we can estimate the temporal groundwater dynamics for the Beqaa Plain (Figure 7). Note, this equation is valid when assuming all components to be error-free. For our case study, this is assumed to be acceptable. Generally, to achieve this uncertainty assessment, some recent studies have applied Kalman Filters [37,38], while others propagated the sources of uncertainty in a Monte Carlo framework [11].
2.6. InSAR Estimates of Land Subsidence from Sentinel-1
The results are validated with signals from Sentinel-1 (S-1) interferometric synthetic aperture radar (InSAR) estimates of land subsidence change. InSAR is a method that can accurately capture vertical changes in land elevation to mm precision, and has been shown in various studies related to groundwater. Liu et al. (2019) [12] tried to match InSAR signals of vertical land deformation with groundwater depletion signals from GRACE. Levy et al. (2020) [39] evaluated subsidence patterns in the Central Valley, California, according to crop type. In this study, we use Sentinel-1A (S1A) satellite data from track 21 from 2014/10/07 to 2020/07/31 to estimate land subsidence associated with groundwater usage in the Beqaa Plain. S1A has been acquiring interferometric wide-swath (IW) mode data over the Beqaa plain at a regular interval of 12 days through the use of terrain observation by progressive scan (TOPS) technique. To mitigate temporal decorrelation due to farming activities and vegetation canopy change, we only form the interferometric pairs with temporal baseline no more than 24 days. We use the Sentinel-1 stack processor in the JPL/Caltech InSAR Scientific Computing Environment (ISCE) software to process the IW data and form interferograms. We use a variant of the Small Baseline Subset InSAR time series inversion approach to solve for line-of-sight (LOS) displacement time series and mean velocity and employ spatiotemporal filtering to remove high-frequency troposphere noise [12,40,41]. For more details about the InSAR processing and time series analysis, readers can refer to Liu et al. (2019) [12].
2.7. Data from In-Situ Wells
Additional information from local monitoring wells is also used in our study to further showcase the significant drops in groundwater level that is occurring through much of the region. Table 1 shows a list of 44 different monitoring wells in the region, and they all indicate a drop in the level of groundwater starting from 2015 and ending at the end of the study period in 2017.
3. Results—Hydrologic Variables in the Beqaa Plain, Lebanon
3.1. Total Water Storage from GRACE
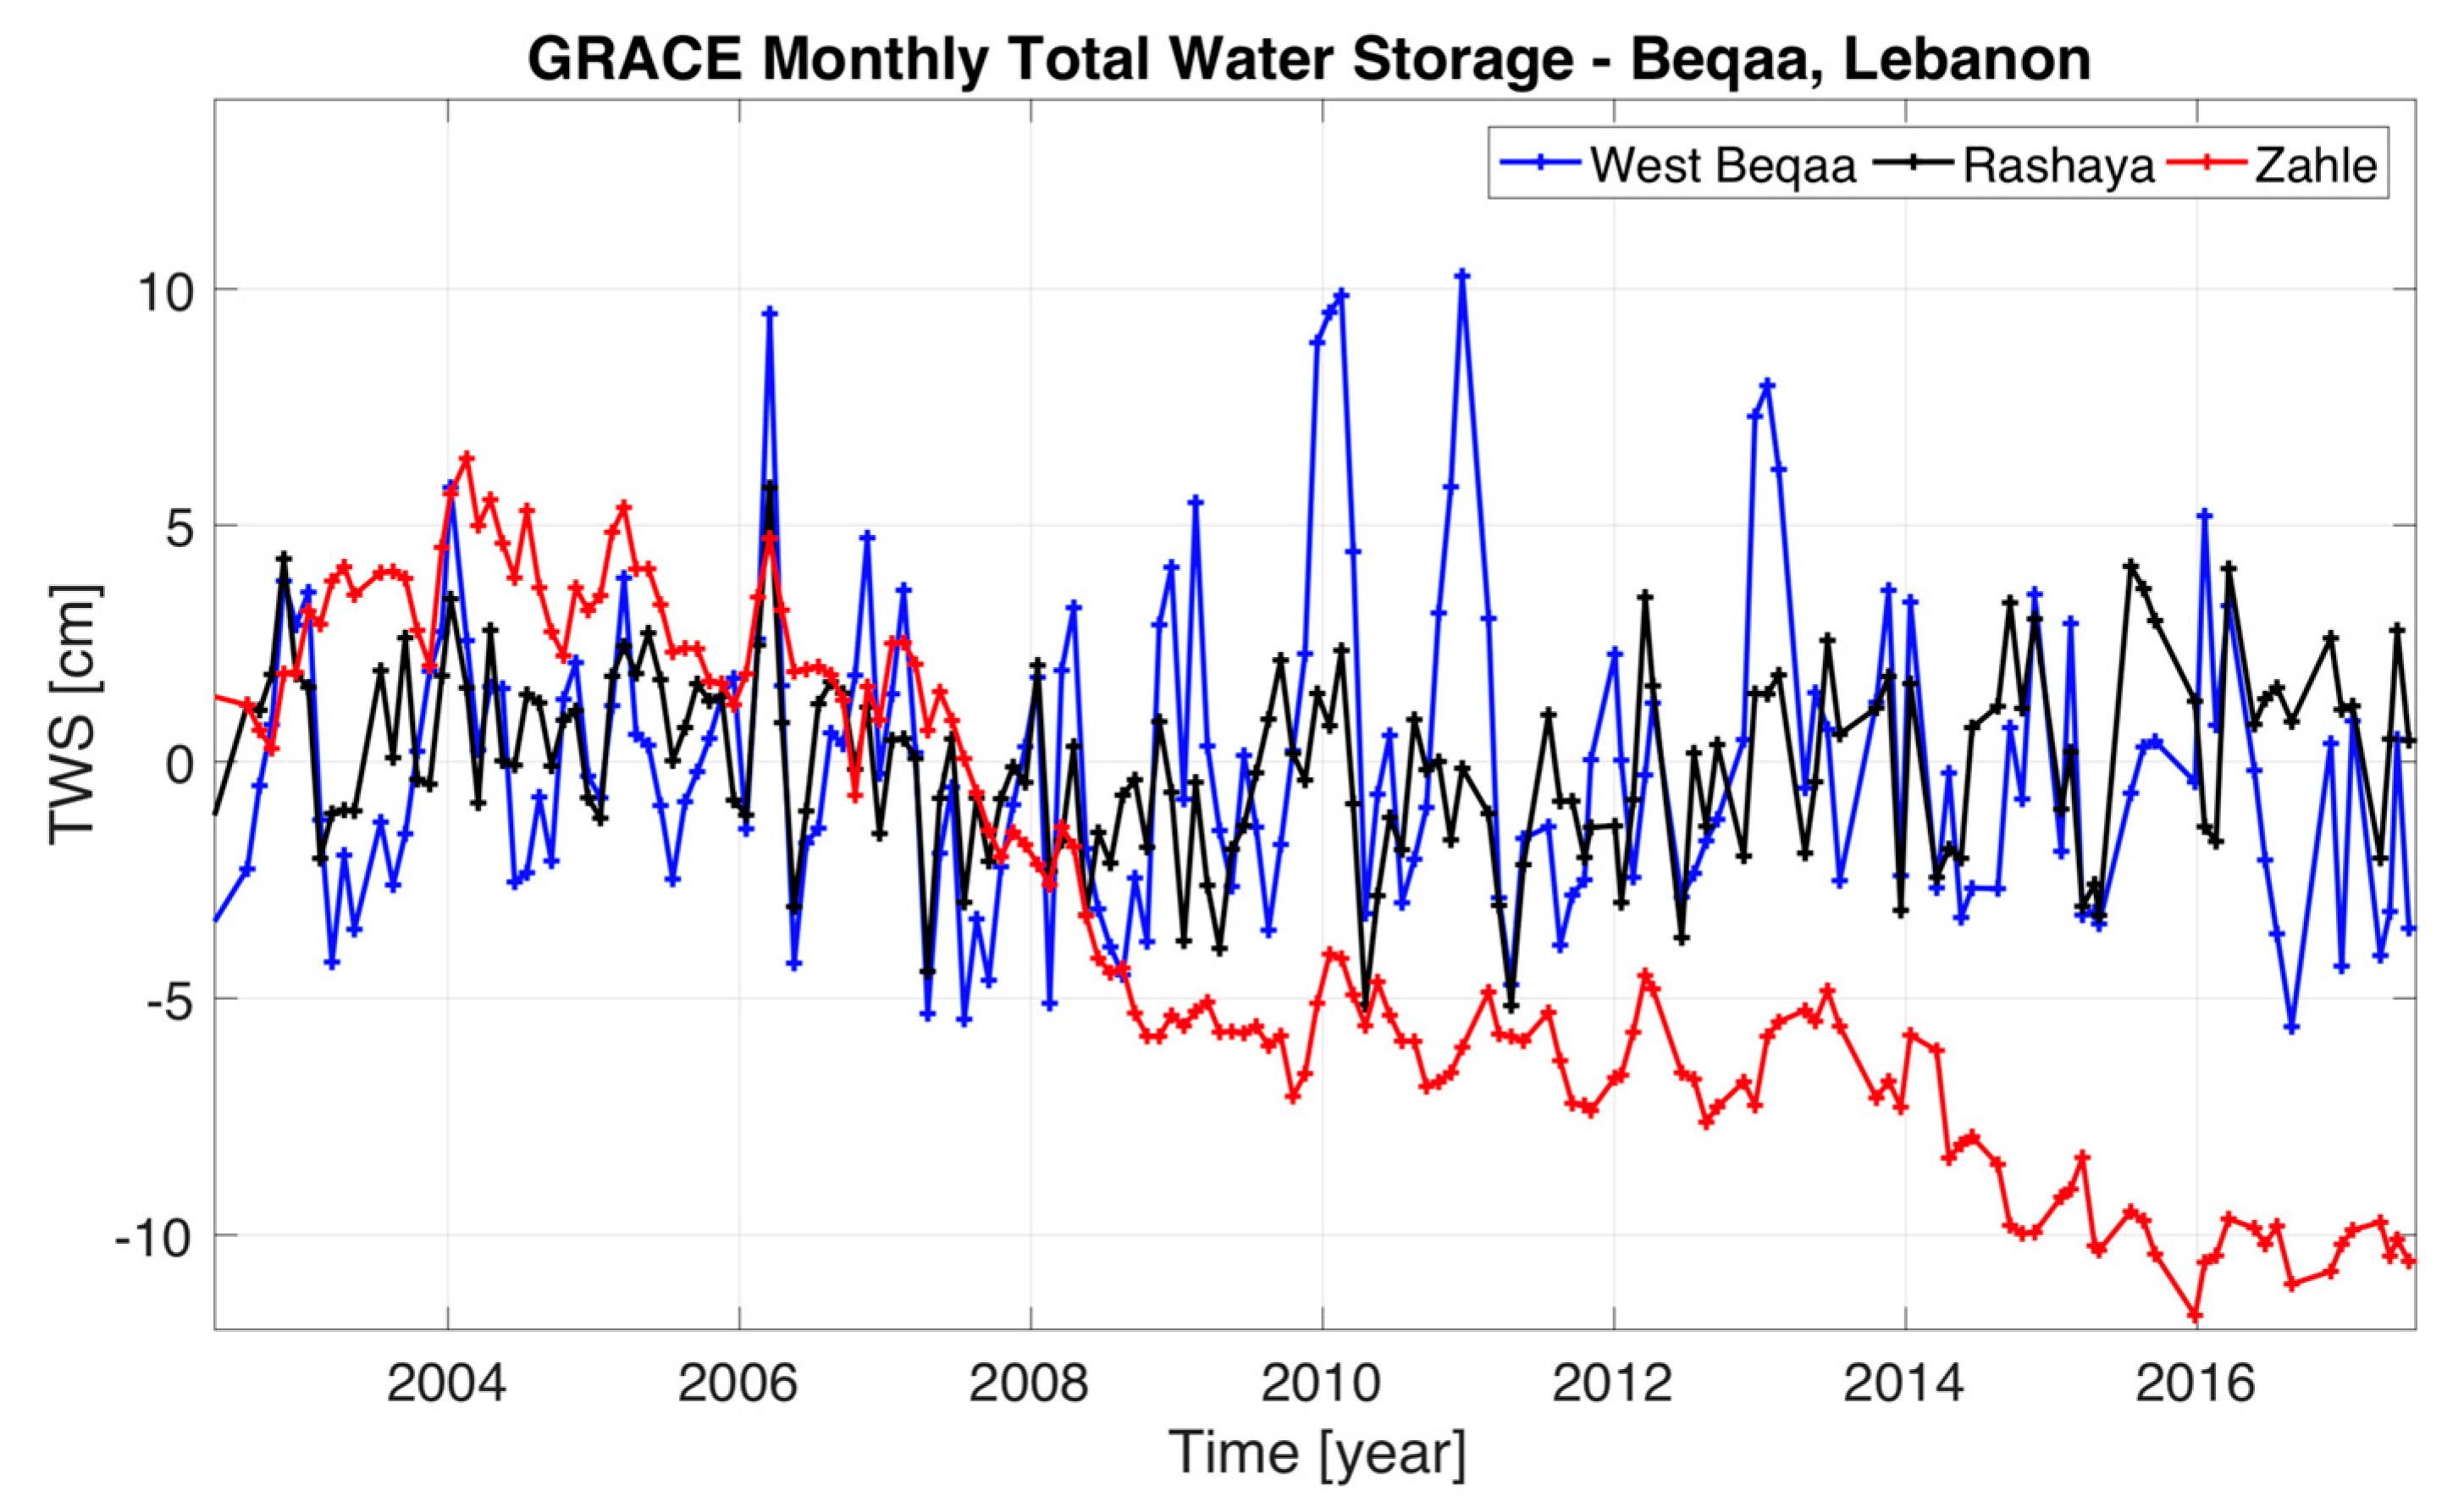
We display in Figure 2 the GRACE TWS signal for the different regions we defined in our study. The regions of West Beqaa and Rashaya District experience seasonal dynamics of TWS throughout the data record (blue and black lines in Figure 2), however there is no depletion signal for either of these regions. For the Zahle District (red line in Figure 2), significant water loss has been observed over the GRACE data record. The TWS dynamics for each of these regions will now be used to process groundwater storage change estimates derived by subtracting each of the remaining hydrologic variables from the GRACE signal. The next section reports on the hydrologic variables in the Beqaa.
3.2. GLDAS Outputs: Soil Moisture, Snow Water Equivalent, and Canopy Water
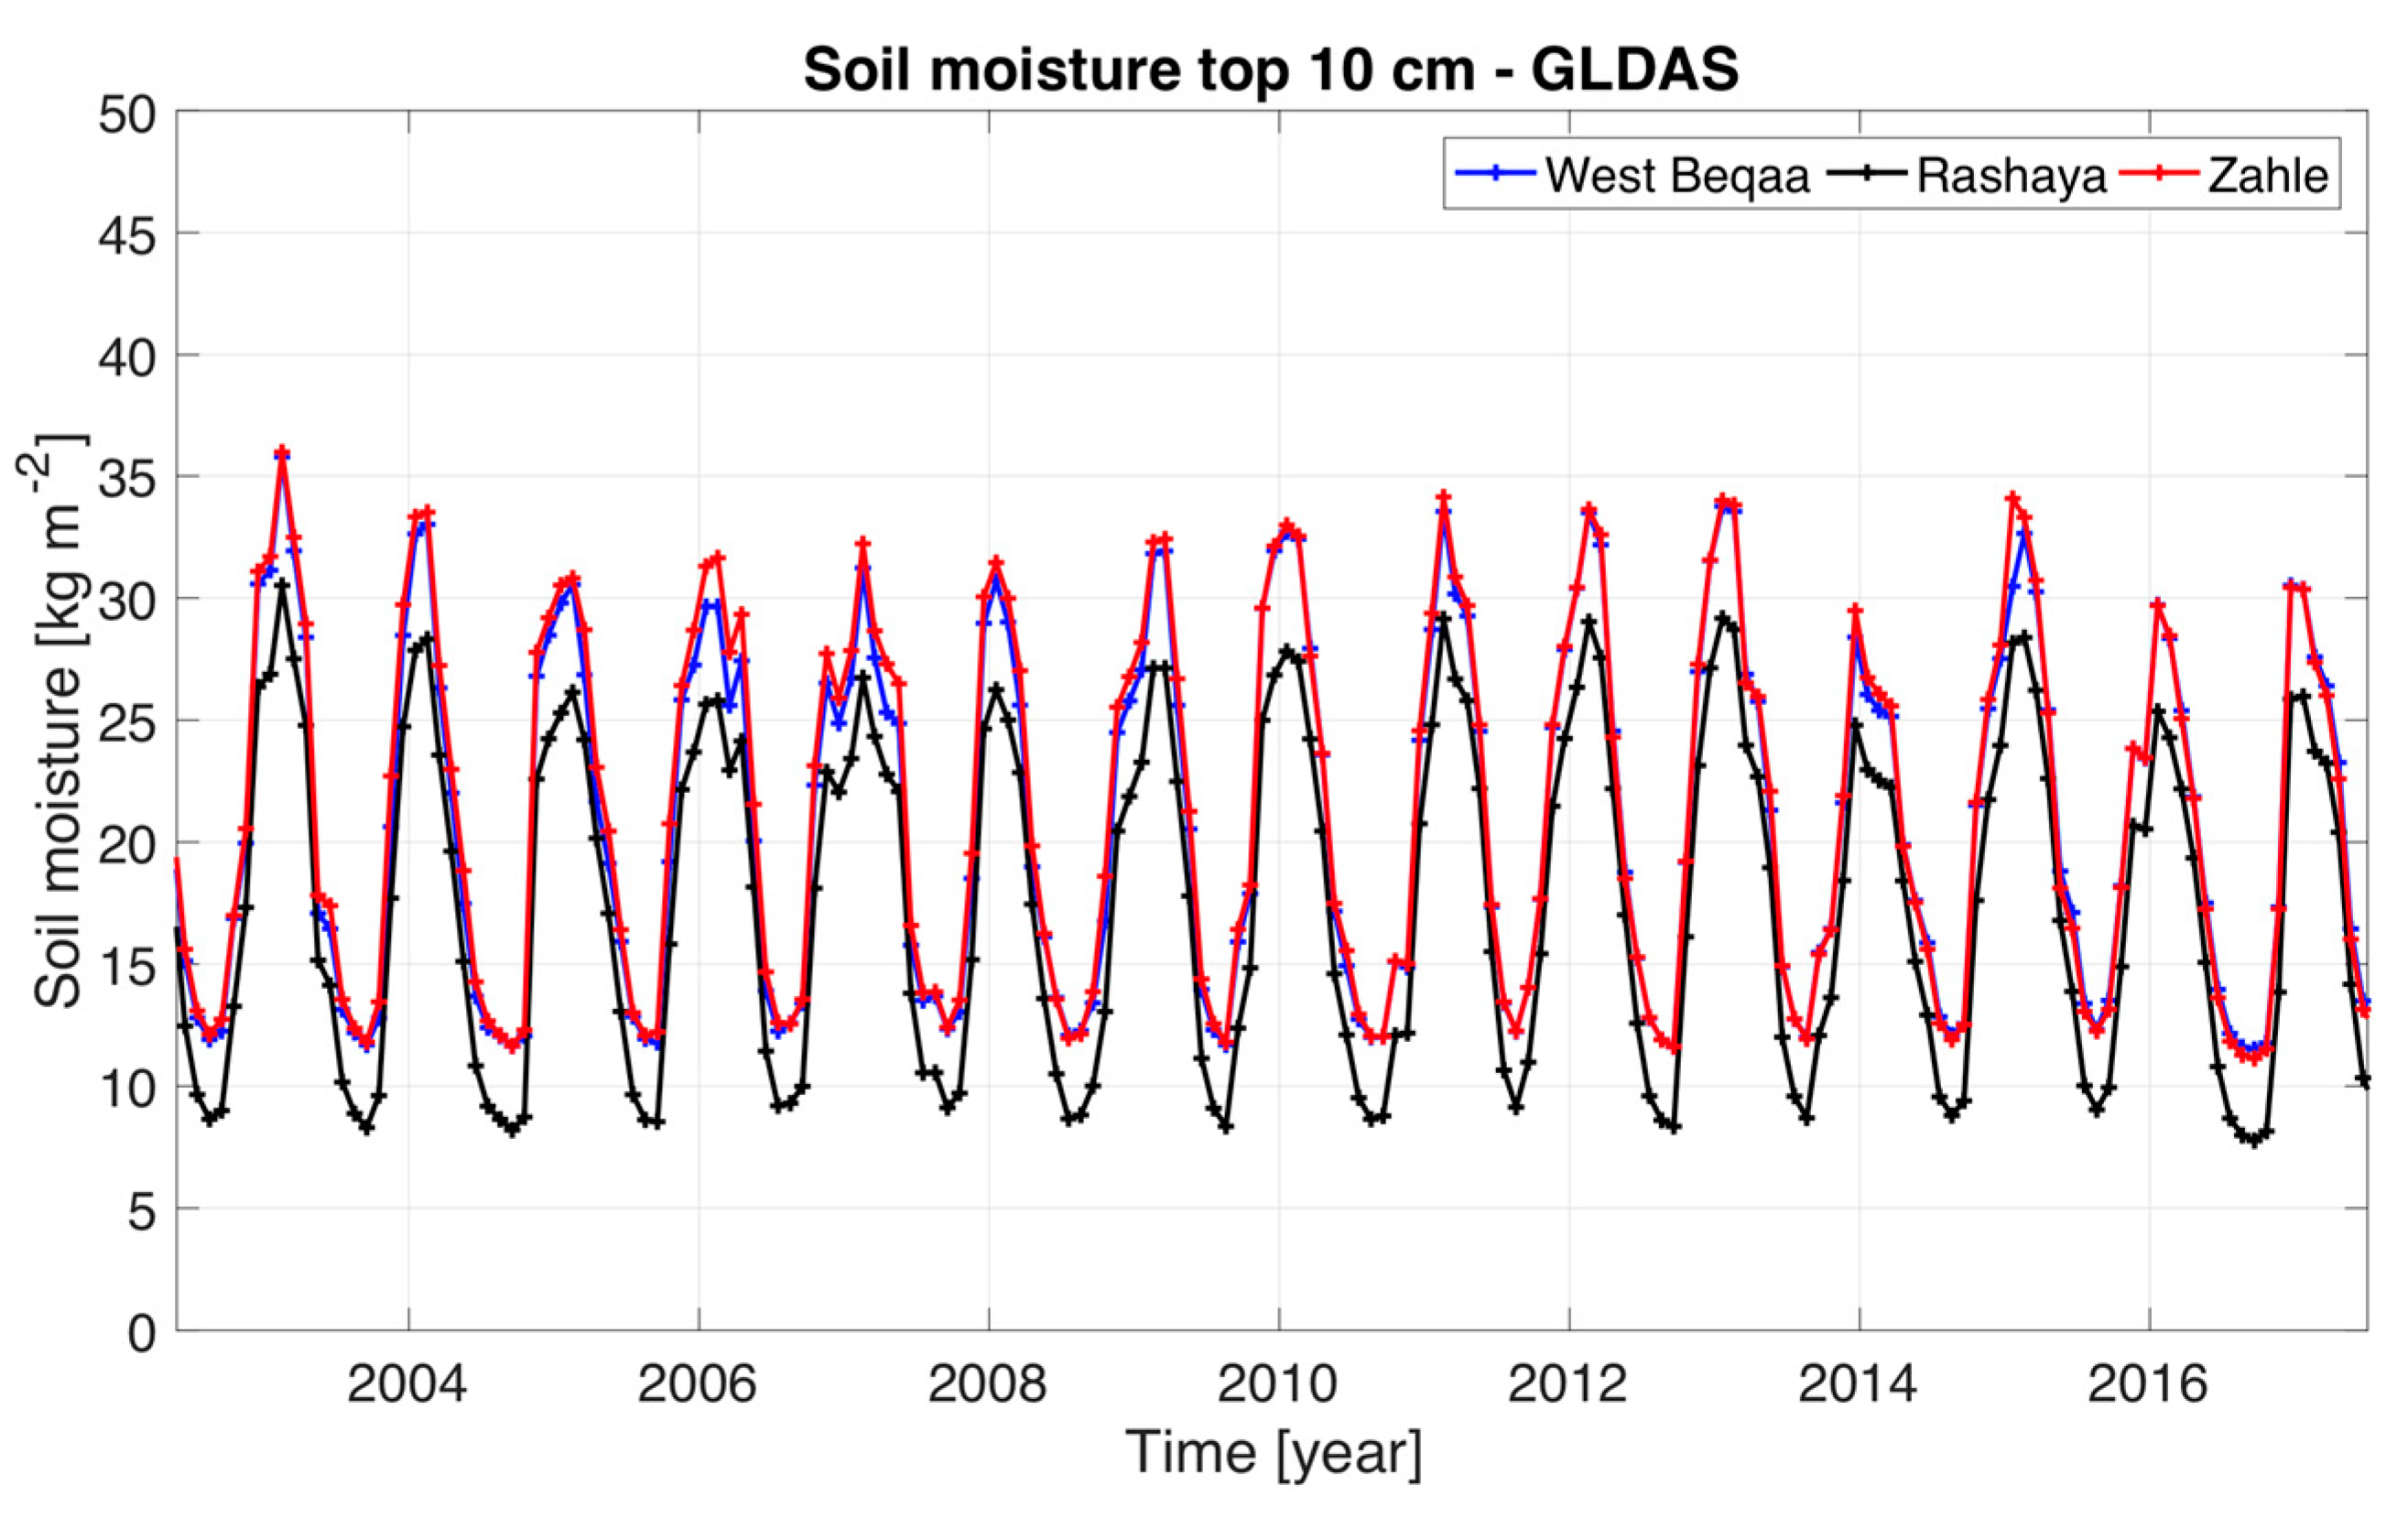
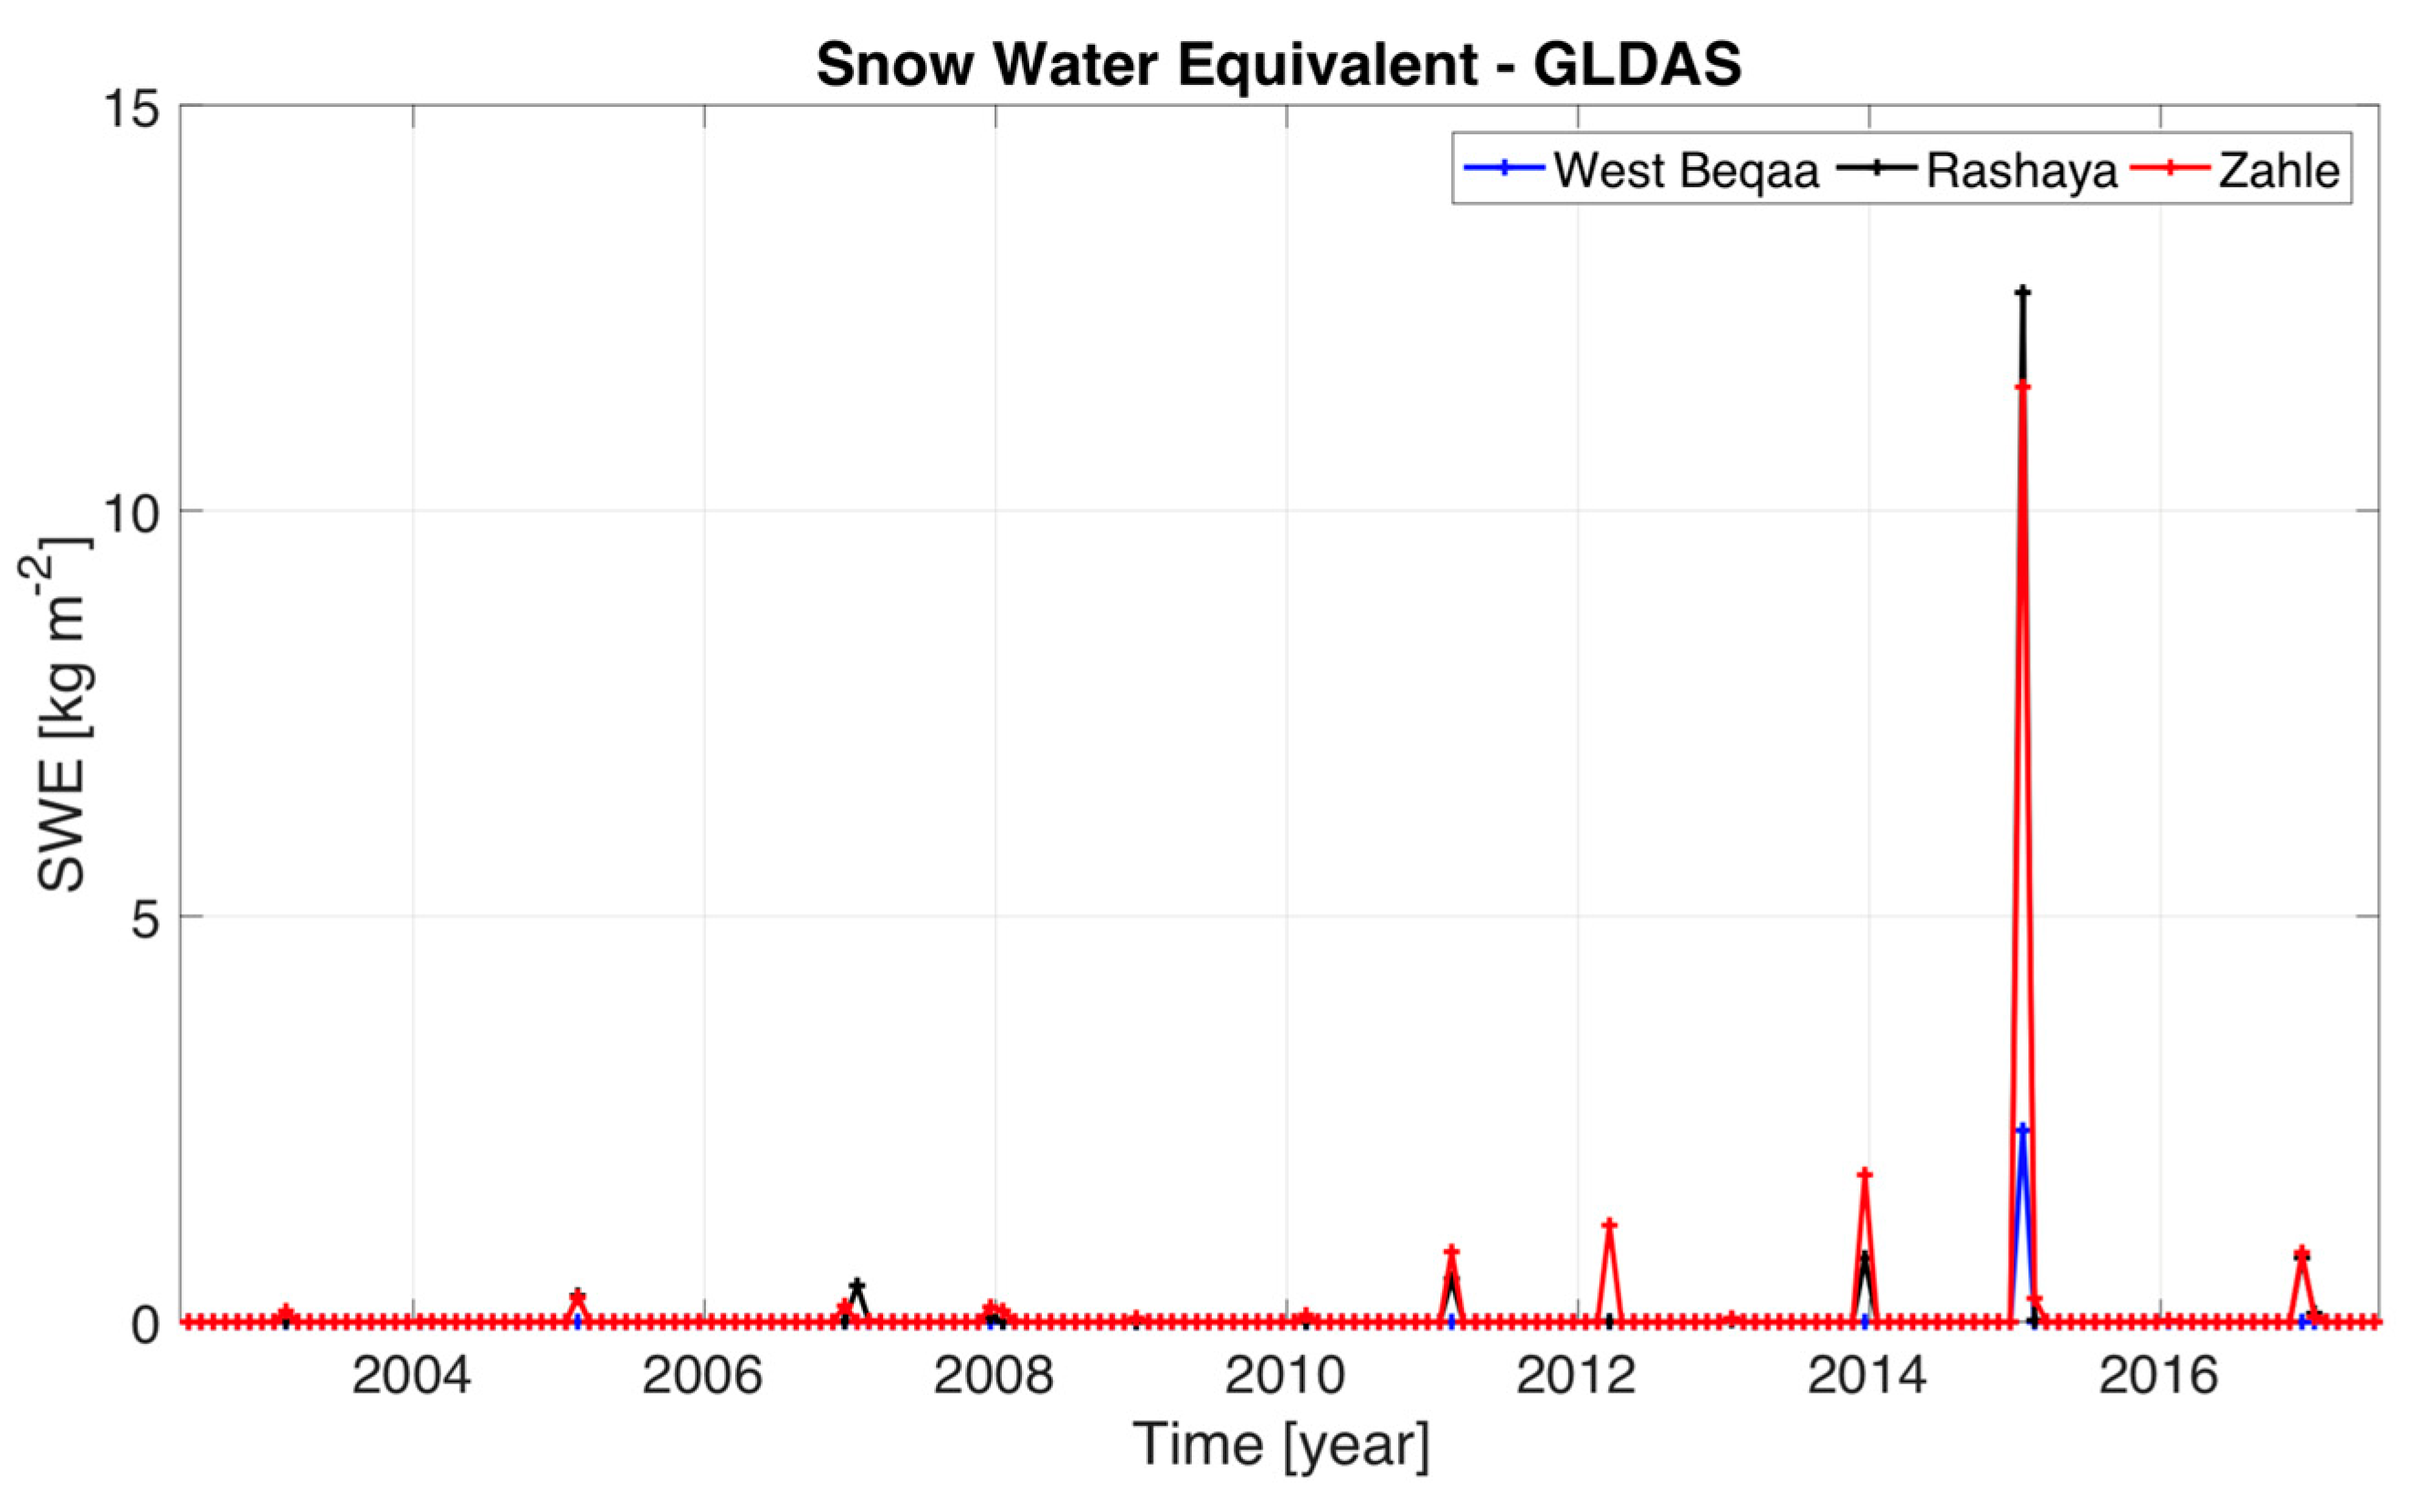
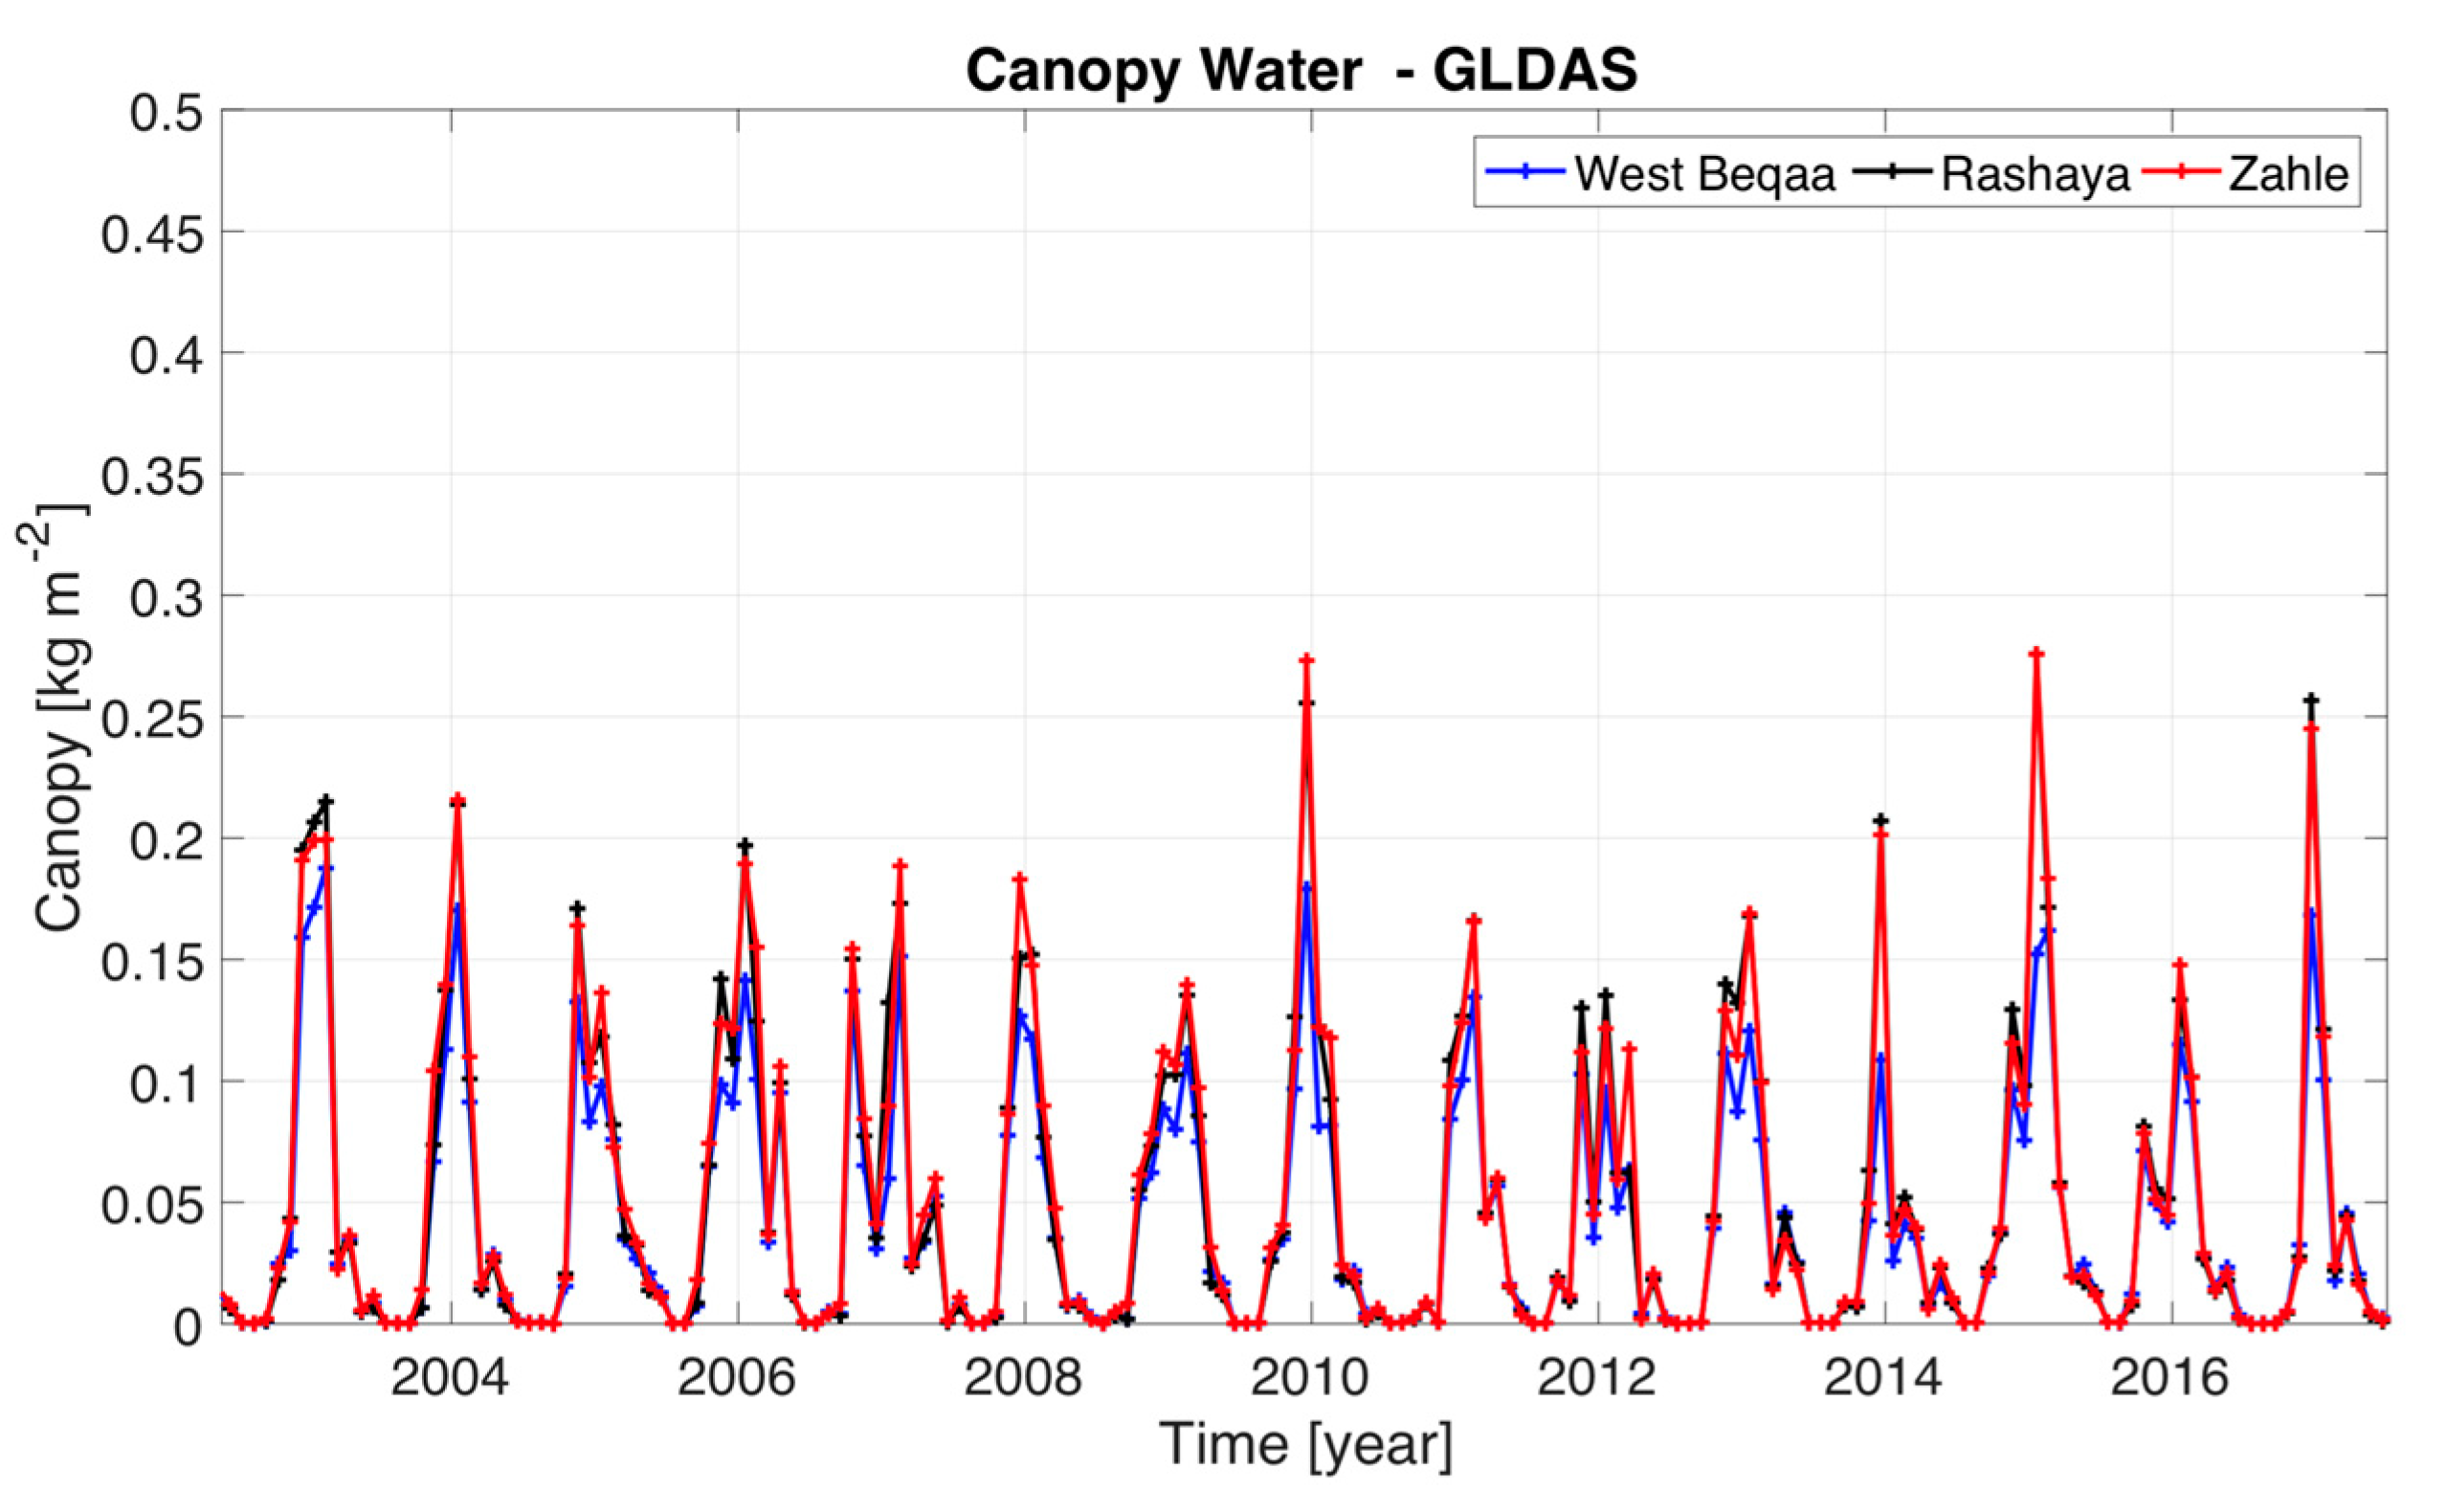
Temporal dynamics of SM, SWE, and Canopy water (in kg m−2) are simulated by the GLDAS model and are shown in Figure 3, Figure 4 and Figure 5 for each of the regions defined in our study. For SM (Figure 3), there are minor differences in the simulated dynamics between the three regions, and there is no clear signal of water loss from SM for any of the regions. For SWE (Figure 4), the dynamics simulated on an inter-annual basis are very different, with some years experiencing large peaks in SWE, especially in 2015. The Rashaya and Zahle Districts experience more SWE than the West Beqaa region, according to the GLDAS simulations. Again, there is no clear signal of water loss from SWE for any of the regions. For the final variable obtained from GLDAS, Canopy water (Figure 5) is shown for each of the regions, with minor differences reported between them. Similar to SM and SWE, there is no clear signal of water loss from Canopy water for any of the regions.
3.3. Surface Water—The Qaraaoun Reservoir
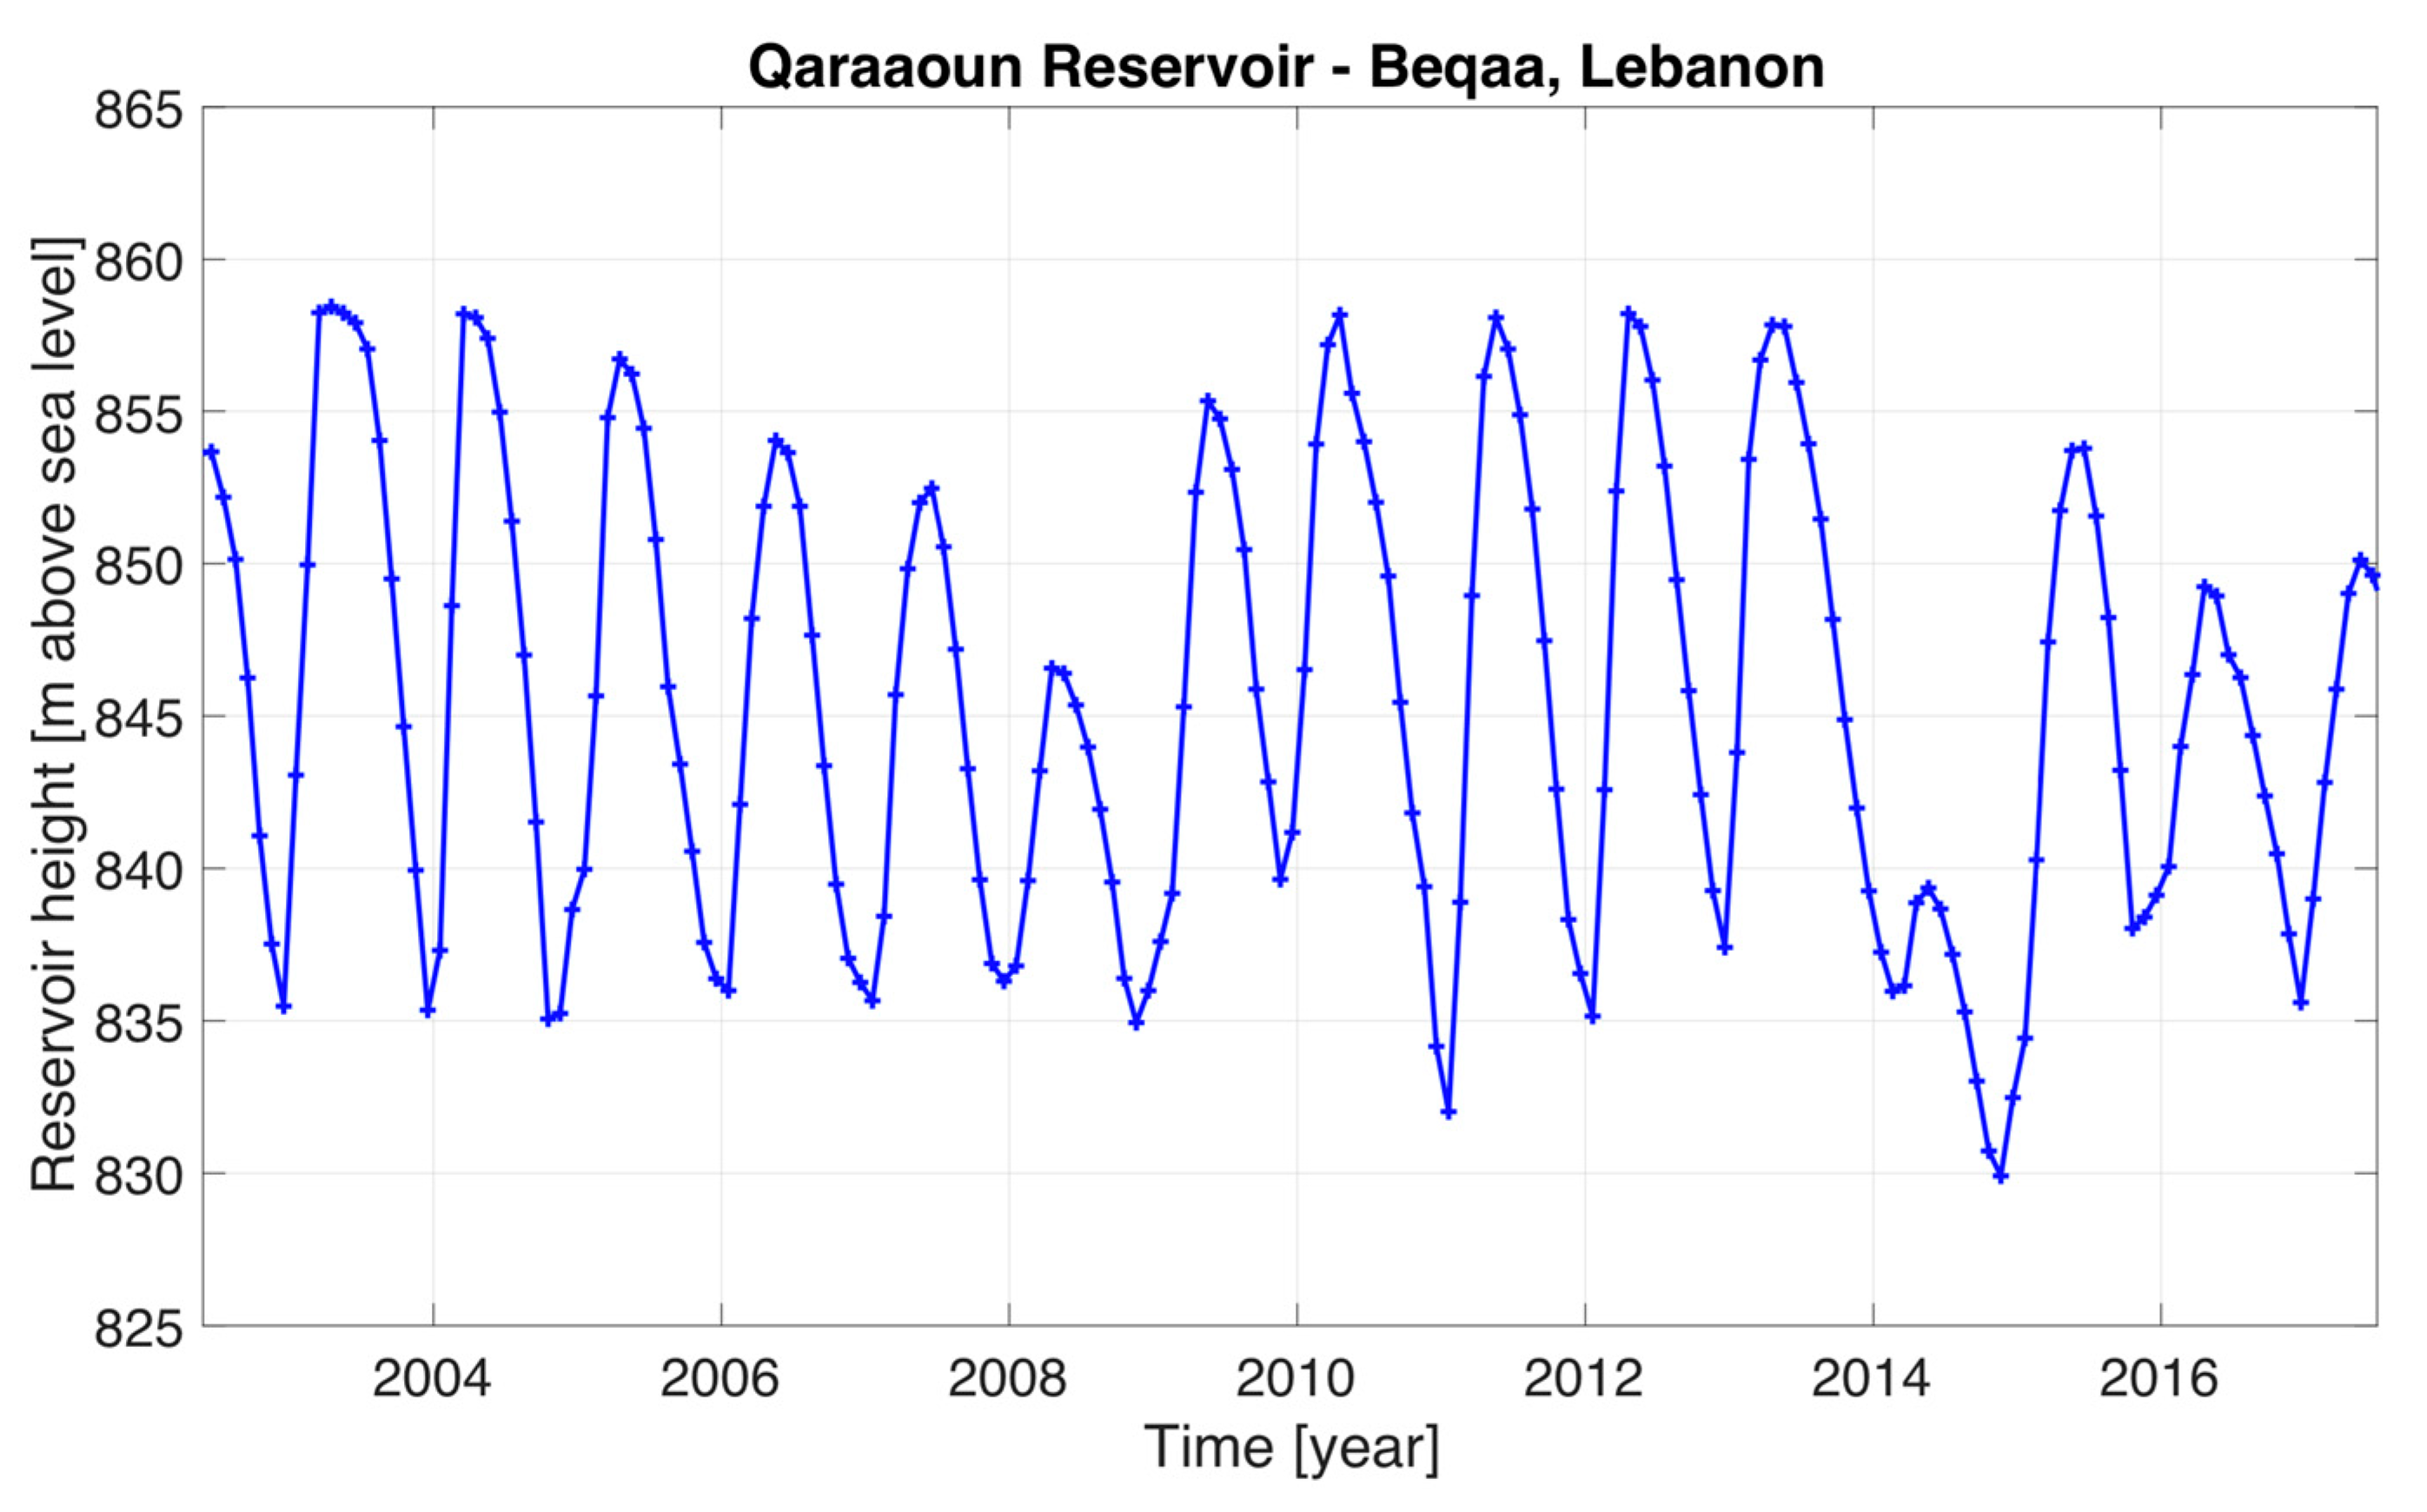
Surface water elevation from the Qaraaoun Reservoir is utilized in this study to represent the SW in the Beqaa Plain. Data was collected from the Litani River Authority on the temporal dynamics of the reservoir height (in meters above sea level) and are shown in Figure 6. The seasonal signal is clearly depicted in this timeline, with significant dips during drought years (e.g., 2014–2015) and recovery thereafter. In order to represent the aggregated values of the surface water over an entire GRACE grid cell, the timeline in the Qaraaoun data is converted to cm and combined with the other hydrologic variables to be subtracted from the GRACE signal. This calculation of groundwater is shown in the next section.
3.4. Groundwater Storage in the Beqaa Plain
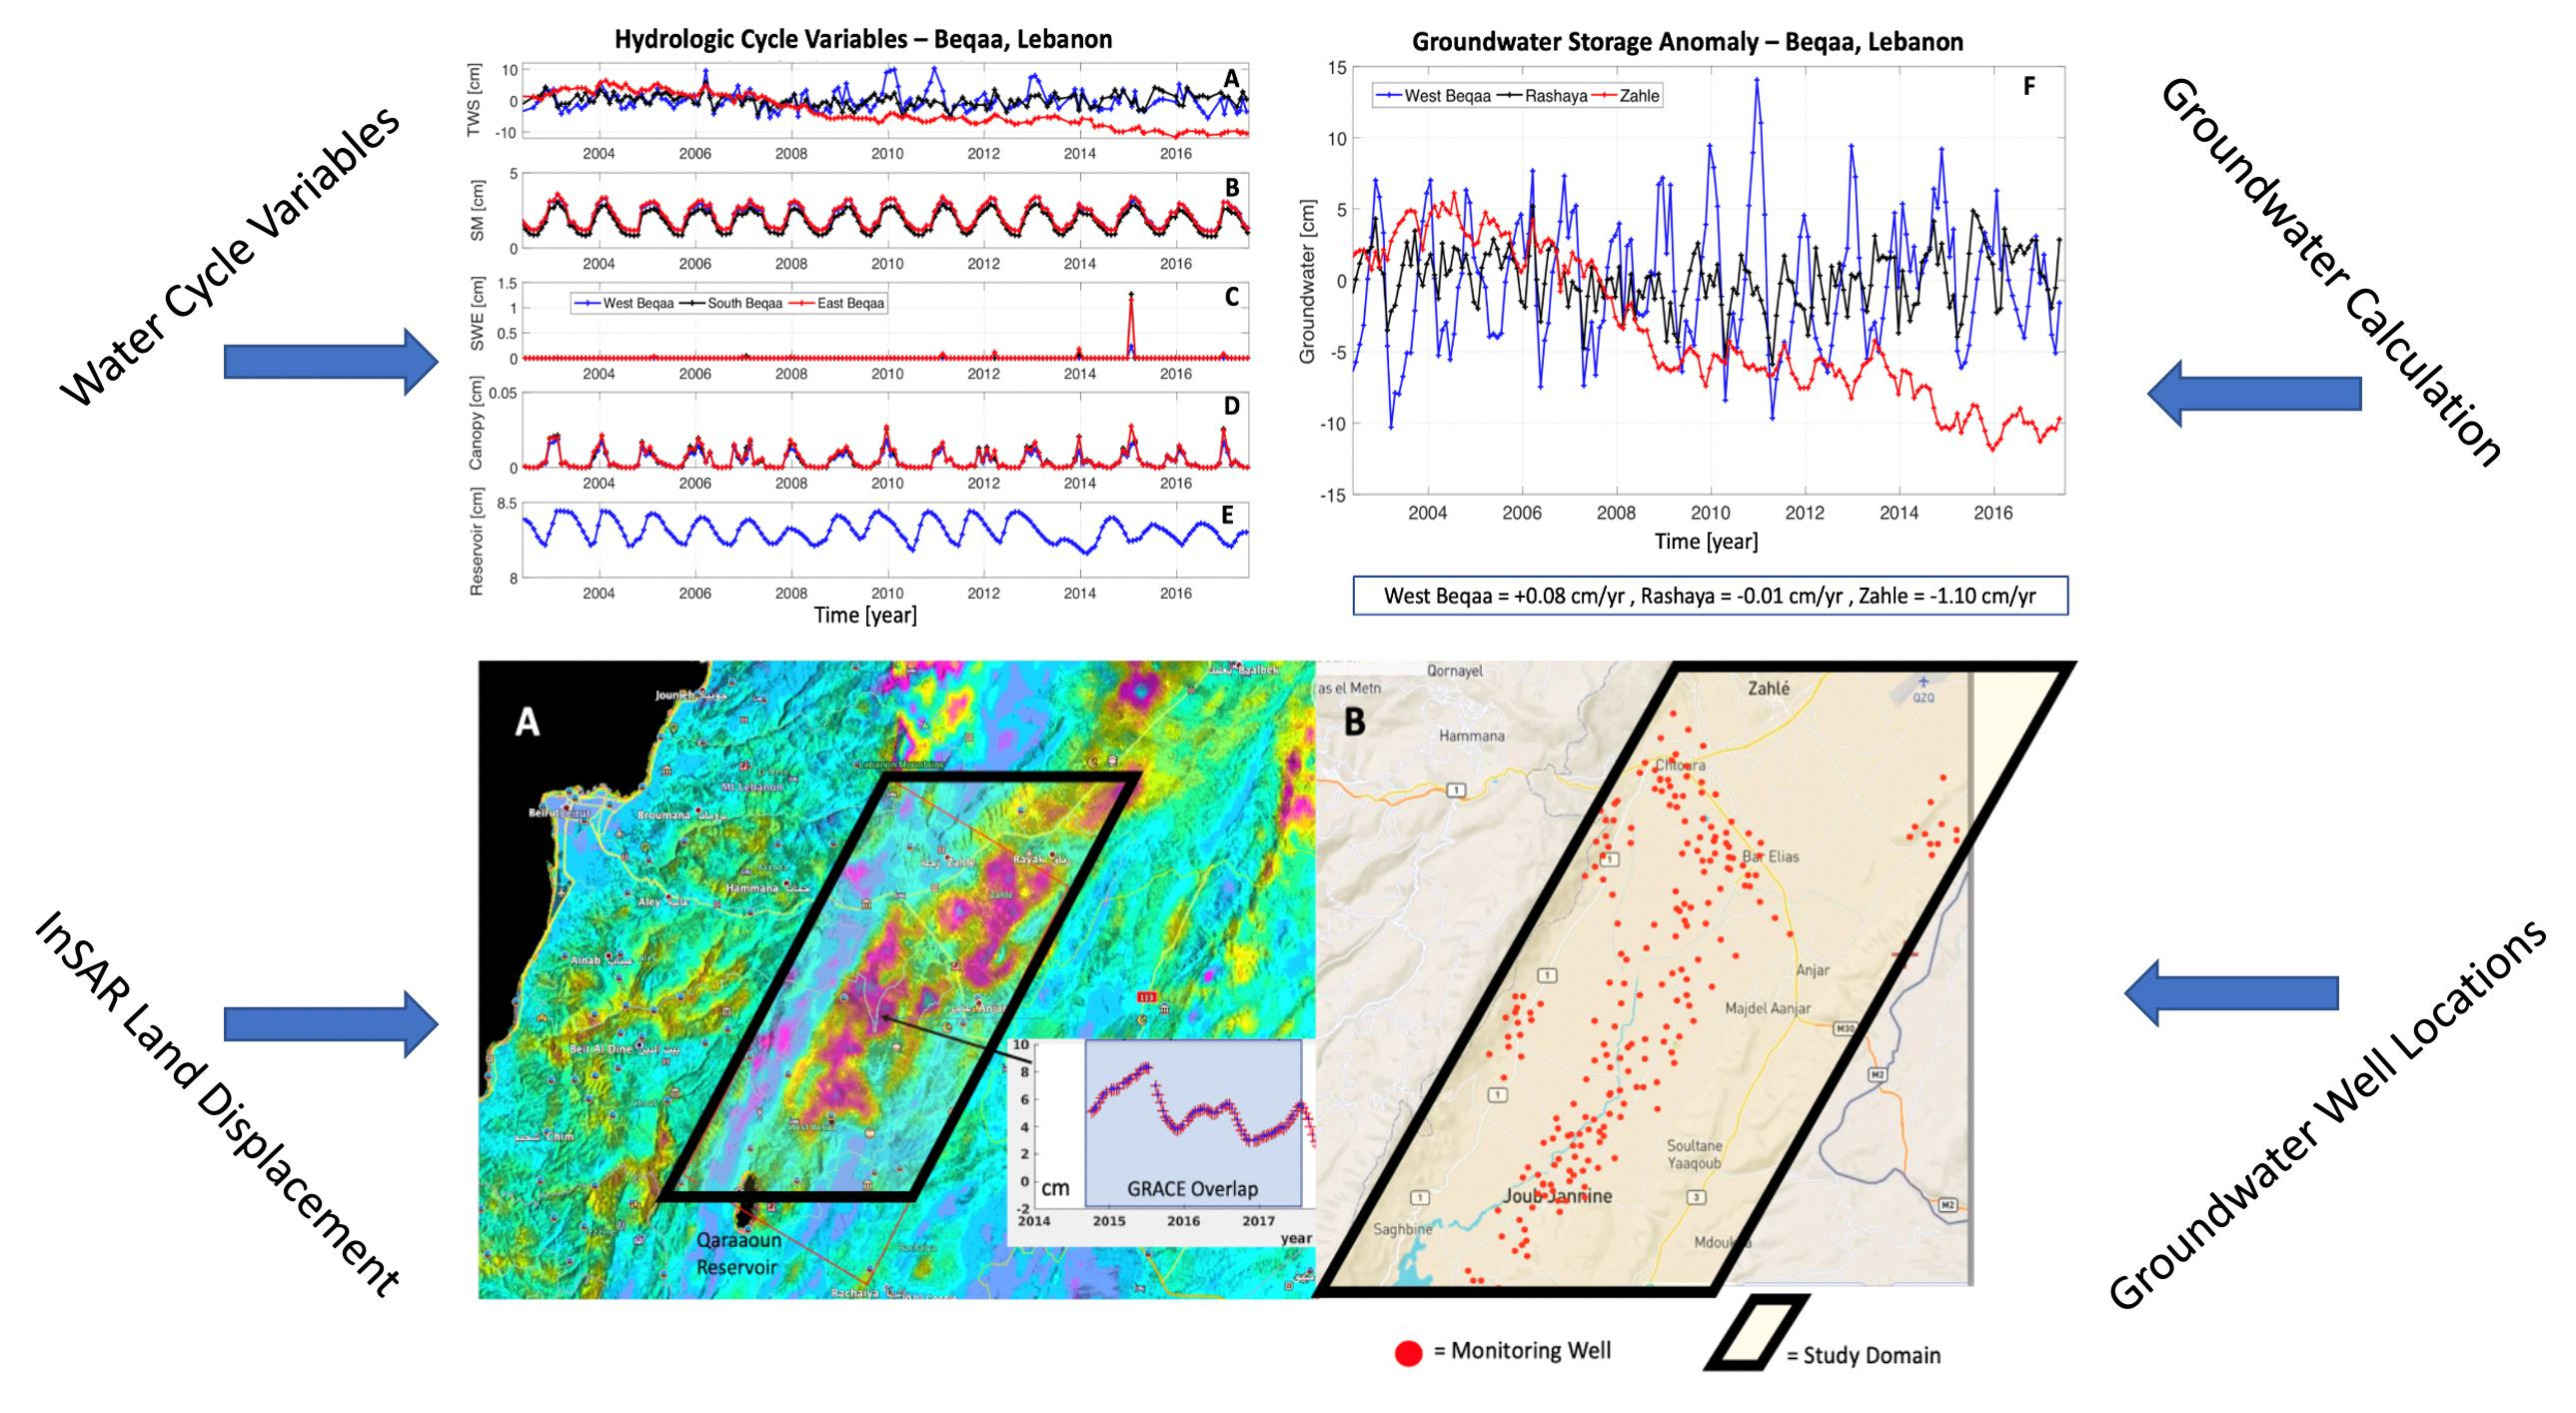
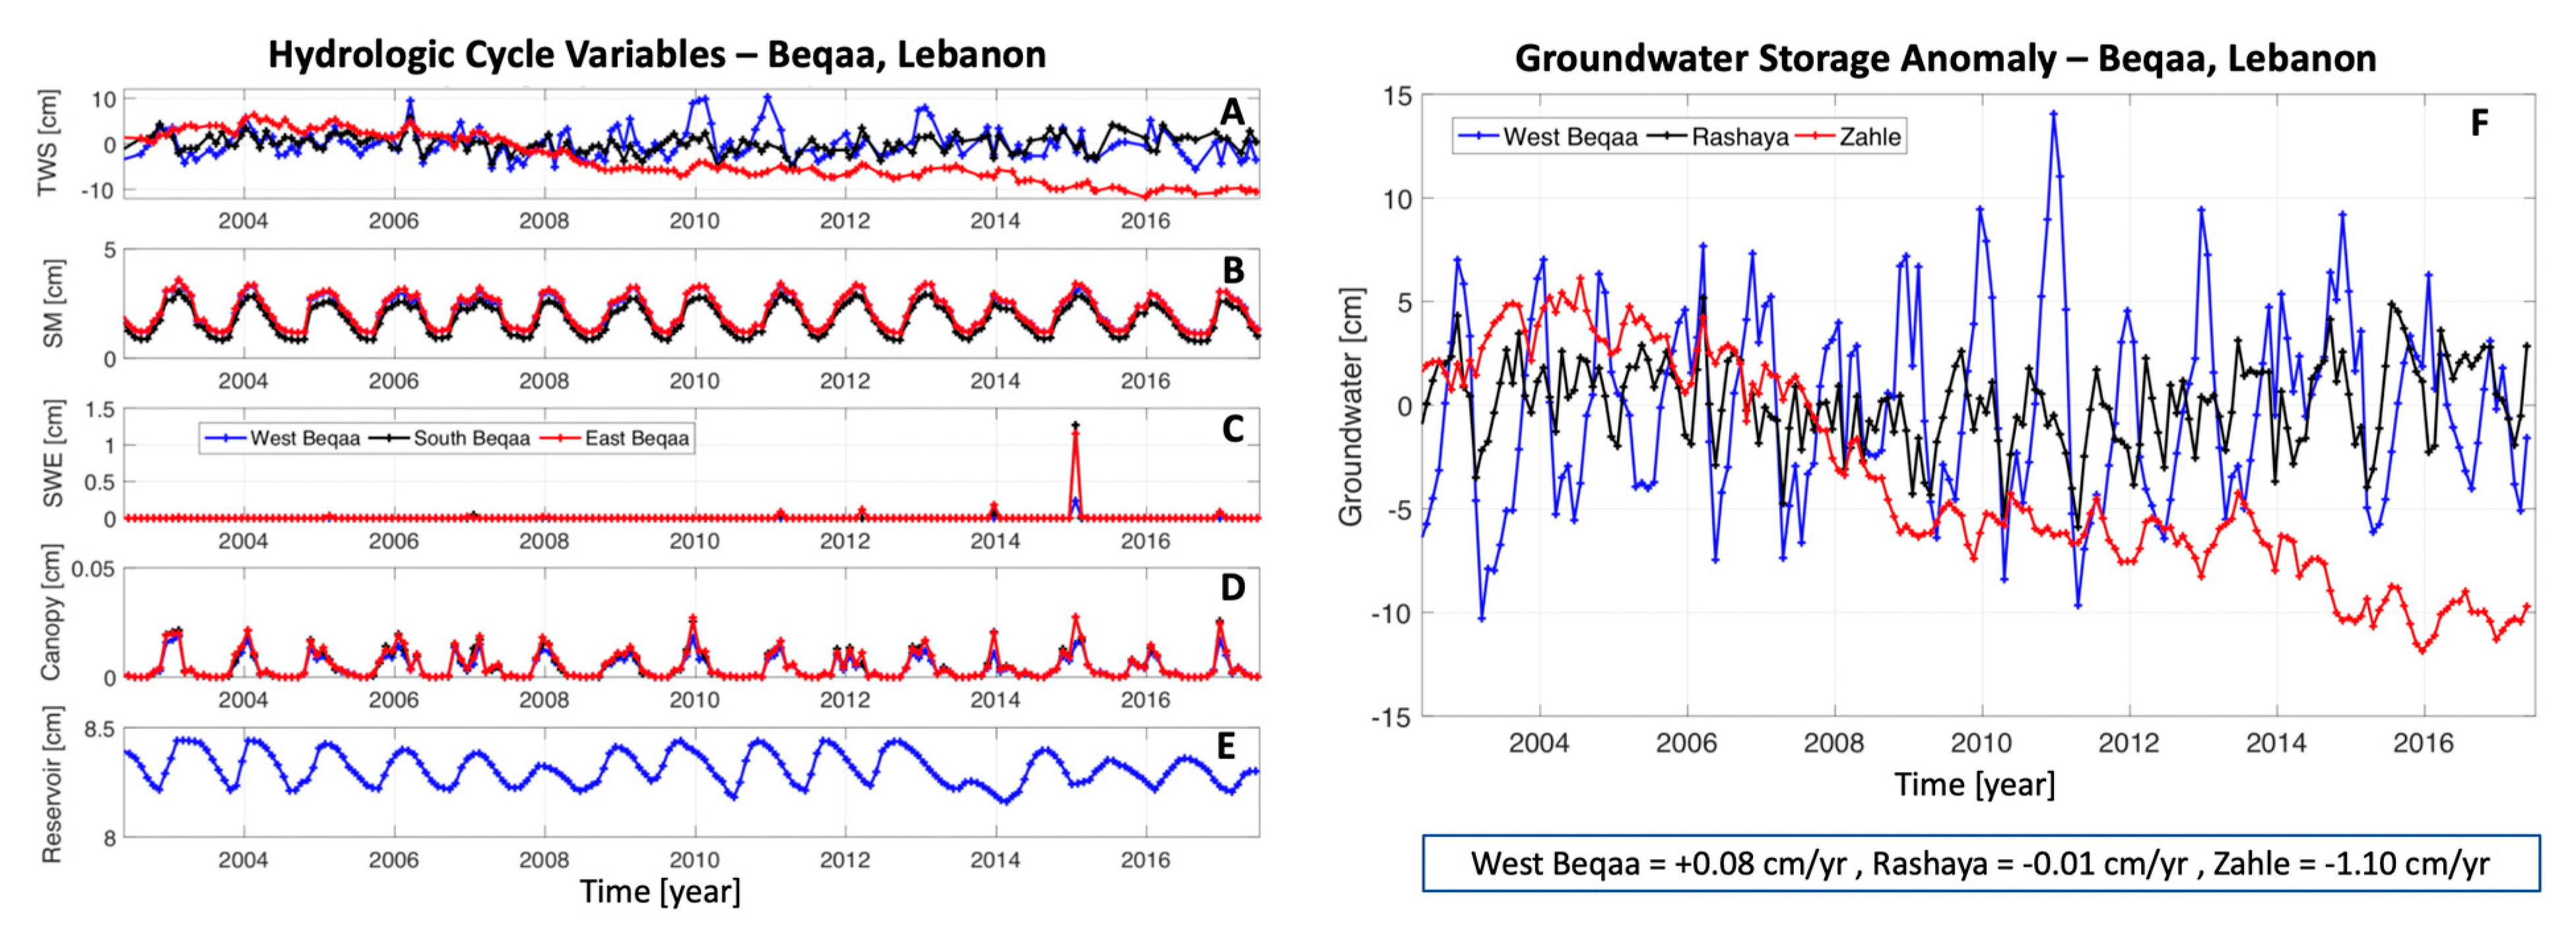
After converting all the hydrologic variables utilized in this study to cm, to match the units in the signal of the GRACE data, the variables are subtracted from TWS to estimate groundwater storage changes in each of the three regions. Figure 7A–E displays each of the hydrologic variables, in units (cm), and Figure 7F shows the calculated GW storage change anomalies (estimated using Equation (1)).
We see in Figure 7F that the region of West Beqaa experiences highly varying interannual dynamics of GW throughout the data record (blue line in Figure 7F). This can be attributed to the significant contribution of water from snow from the western Lebanese mountain ranges, i.e., 12 million m3/yearear to the Qaraaoun Reservoir [27]. The interannual variability of groundwater storage change in West Beqaa is much larger than that of the other regions, and there is no depletion signal for this region (+0.08 cm/year). For the Rashaya District (black line in Figure 7F), a smaller seasonal signal is detected, and similar to the West Beqaa, there is no groundwater depletion signal for this region (−0.01 cm/year). For the Zahle District (red line in Figure 7F), significant groundwater depletion is estimated over the length of data record (−1.10 cm/year). The depletion of the groundwater signal for this region explains the loss of total water seen in the GRACE signal for this region (i.e., Figure 2). This completes our analysis of groundwater storage changes for each of the three regions defined in the Beqaa Plain, Lebanon.
4. Verifying Results with Other Observations, Sentinel-1, and In-Situ Wells
4.1. Sentinel-1 Interferometric Synthetic Aperture Radar (InSAR) Signals of Land Subsidence
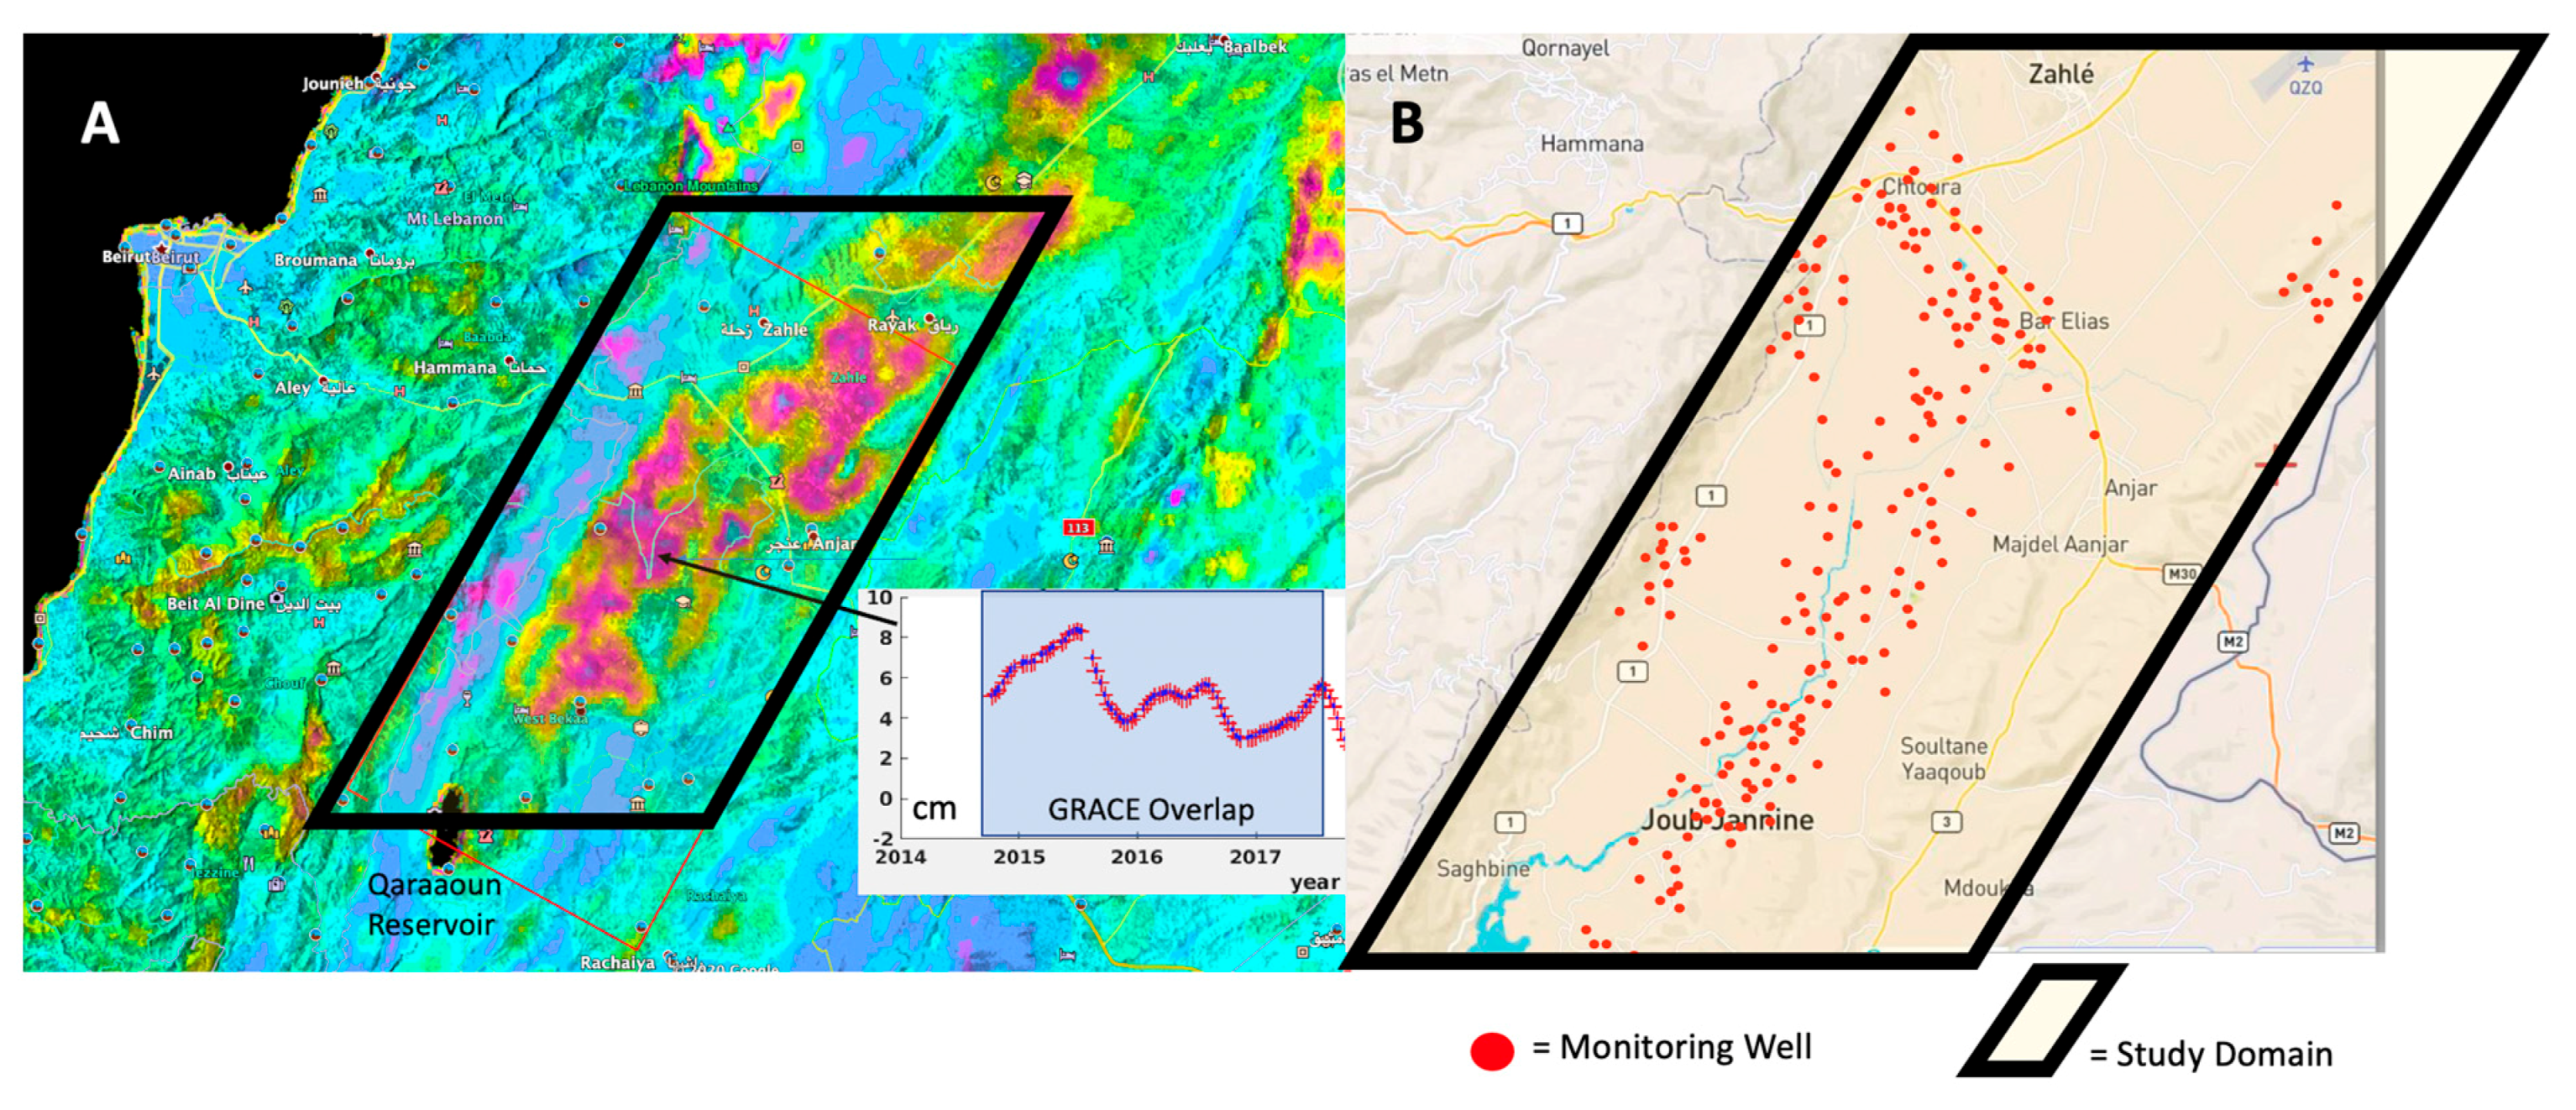
Land subsidence due to groundwater withdrawal provides independent information to cross-validate the groundwater loss signals as measured by GRACE. Figure 8A shows the Sentinel-1 InSAR estimates of land deformation since October 2014. There is a clear signal of land subsidence, especially in areas with higher density of groundwater pumping wells. Despite a short overlap period between GRACE and S-1, the ground subsidence as imaged by Sentinel-1 shows temporal variation that is consistent with GRACE estimates of groundwater depletion.
4.2. Monitoring Wells
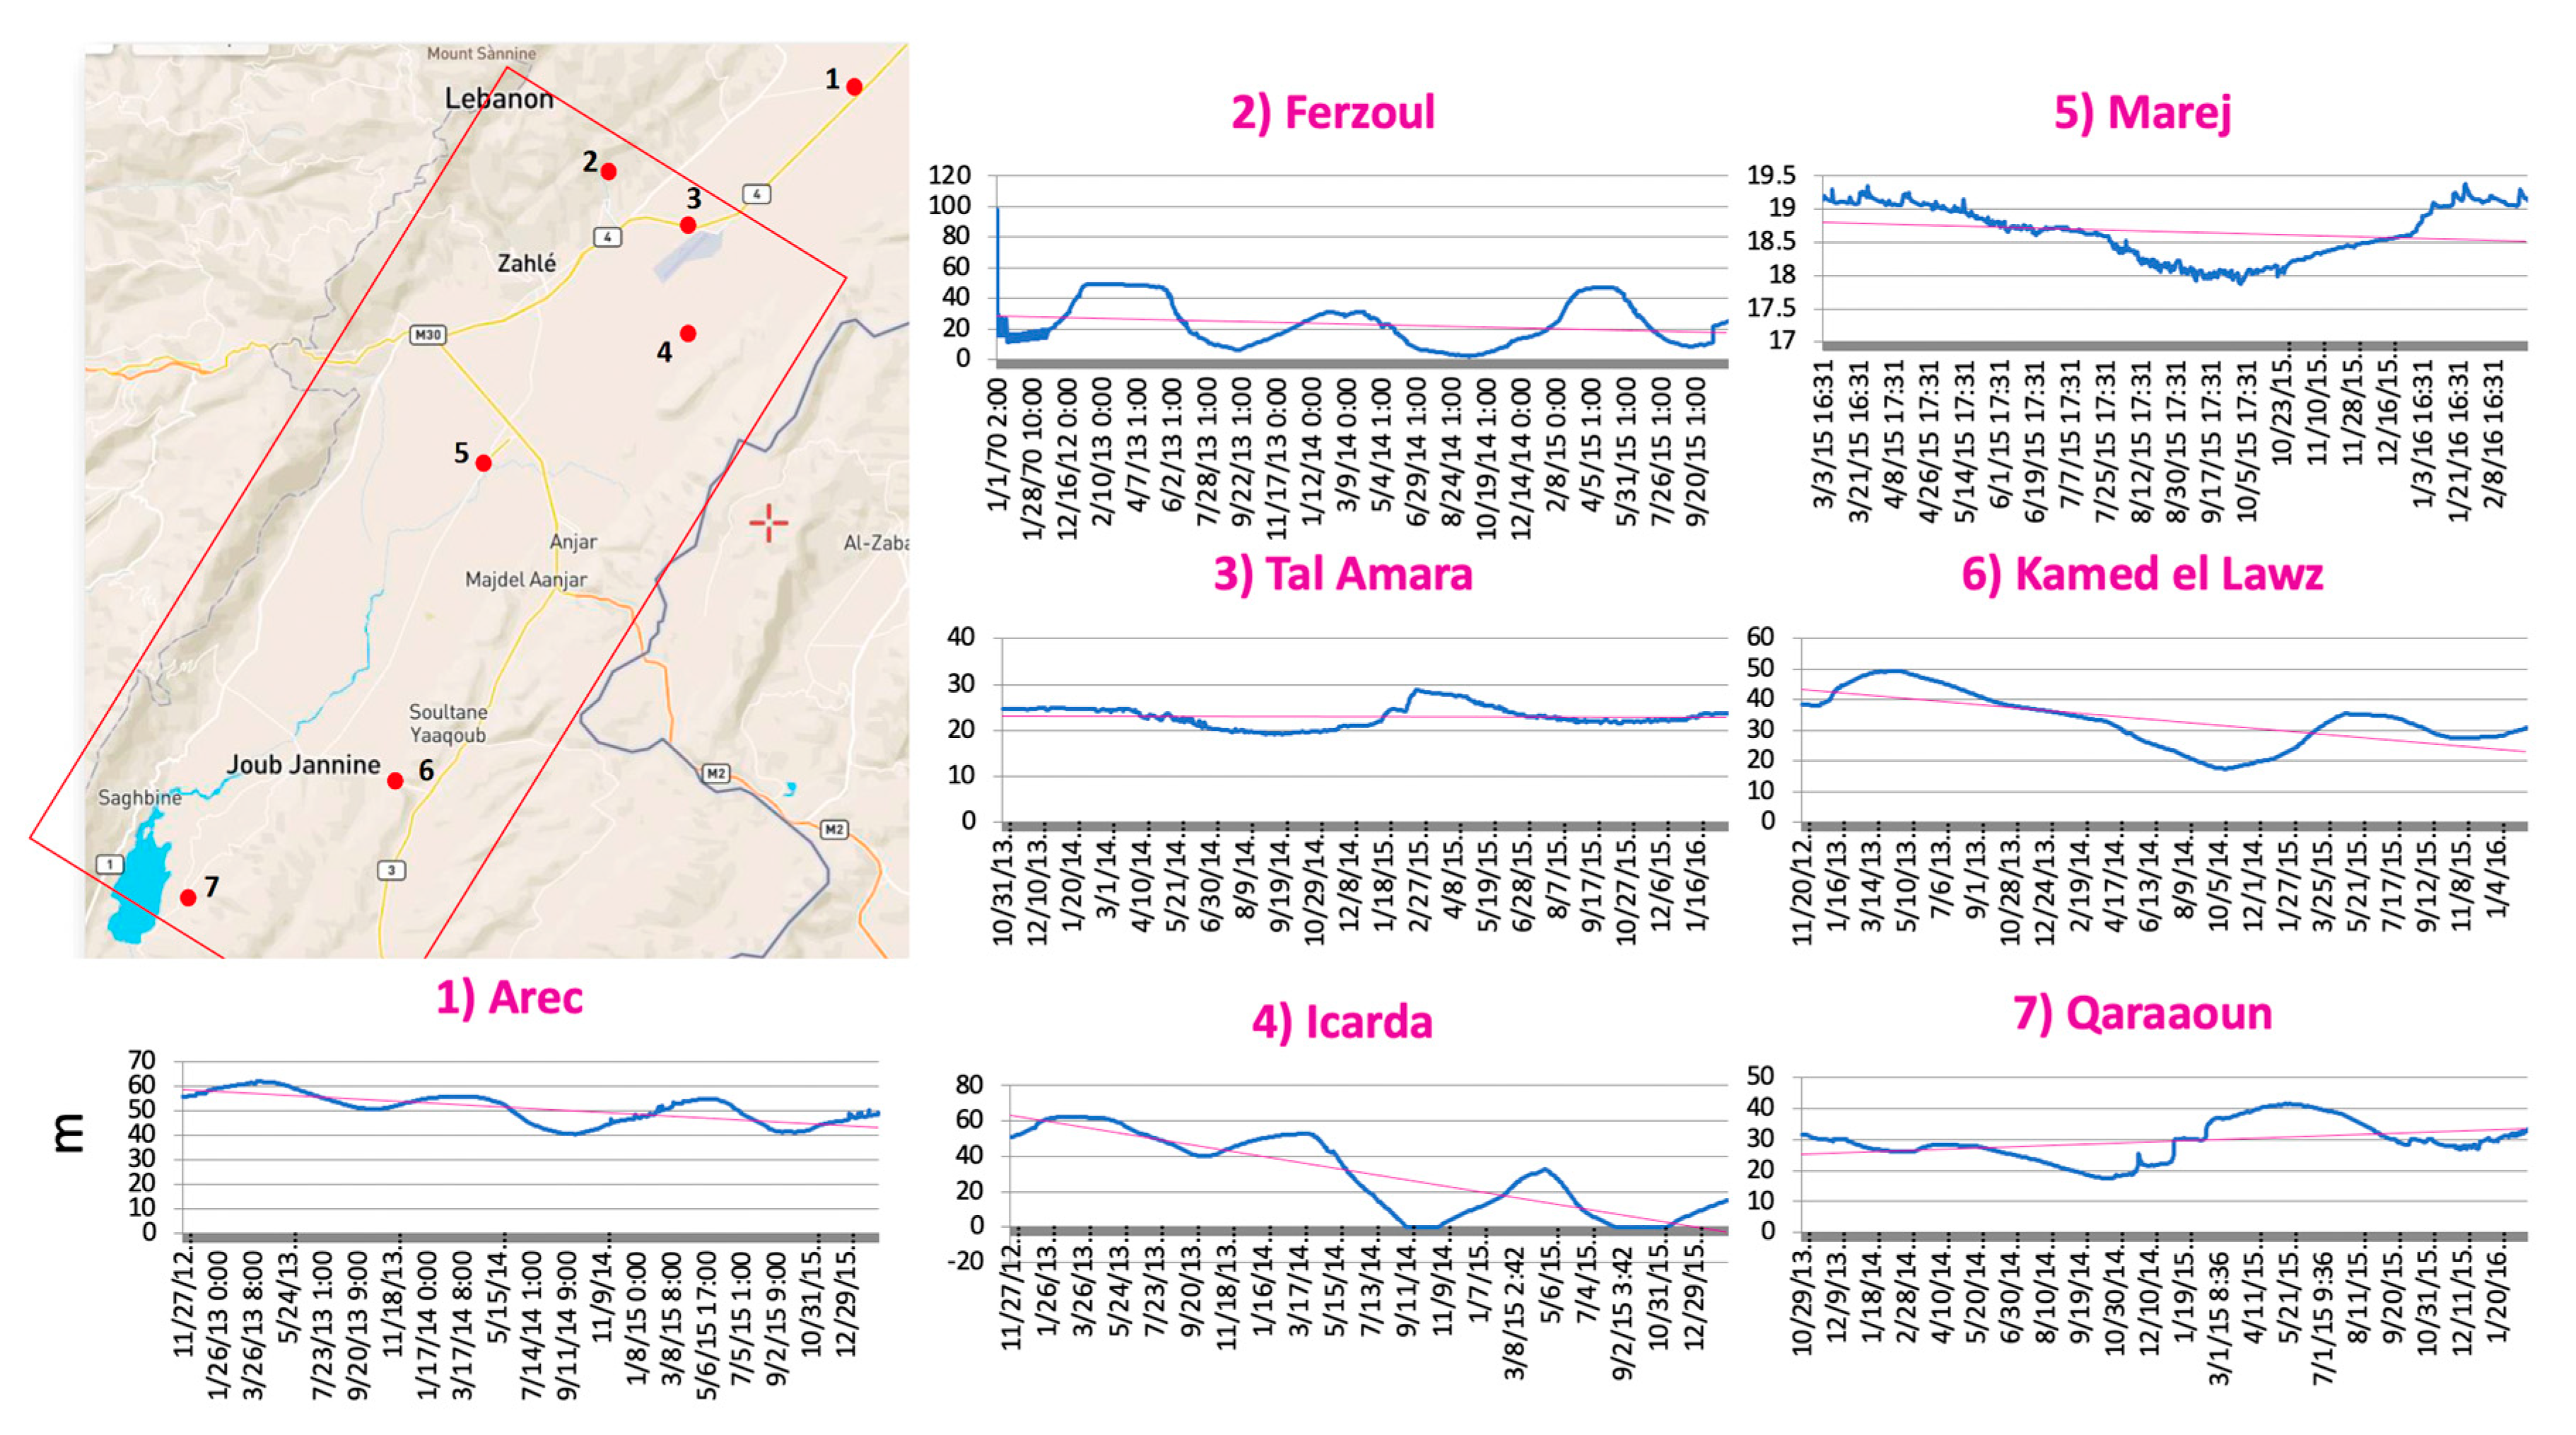
Figure 8B shows the locations of groundwater pumping wells. As a visual comparison at first, the locations depicted in Figure 8A that are experiencing land subsidence are the same locations shown in Figure 8B to have pumping wells. To have a closer look at individual wells, we pinpoint seven different monitoring locations and highlight the results in Figure 9. These plots show that, for the individual wells included, there is a strong seasonal signal of groundwater depletion and recovery, and that there is an overall long-term trend of groundwater depletion in most of these wells. These results in Figure 9 shown for individual wells are further confirmed by the data shown in Table 1, where 44 different wells all show a level of regression from 2015–2017. Note, the well measurements that are used for this study are processed from a larger data set containing well measurements for the region. There are limitations to using this data, such as continuity of data or the length of the data record. However, we extract data from different measurement wells that offer sufficient information at specific locations to gain insight on groundwater dynamics for the region.
5. Discussion and Conclusions
The Beqaa Plain, Lebanon, is one of the most agriculturally productive regions of the Middle East, and has a heavy reliance on groundwater supplies to meet irrigation demand, especially after the severe pollution witnessed in the Litani River. In this study, we investigated changes in water storage of various terms in the hydrologic cycle to ultimately estimate groundwater storage changes in the Beqaa Plain. To obtain our results, we utilized 15 years of Total Water Storage (TWS) data from the GRACE product for the Beqaa Plain (Figure 2), and combined this information with other hydrologic data to estimate groundwater storage change. The remaining hydrologic variables included soil moisture storage (Figure 3), snow water equivalent (Figure 4), and canopy water storage (Figure 5), from the GLDAS model. For surface water storage, we used data from the Qaraaoun reservoir (Figure 6), the largest body of water in this region. The results reported in our study (Figure 7) confirm recent findings that groundwater use in this region has been unsustainable and has caused depletion of the aquifer (cf. [3]). Our analysis defines three separate domains within the study region, and our findings indicate that the Zahle District is where water is being lost at a much higher rate compared with the West Beqaa and Rashaya District, due to very slow recharge rates (Figure 1B) and unsustainable groundwater pumping. We show that the rate of groundwater storage change in the West Beqaa is nearly +0.08 cm/year, in the Rashaya District is −0.01 cm/year, and in the Zahle District the level of depletion is roughly −1.10 cm/year. The results from the InSAR estimates from Sentinel-1 (Figure 8A) and the in-situ monitoring wells (Figure 9 and Table 1) also show the groundwater depletion feature in this region.
The groundwater depletion that occurs in semi-arid regions around the world, like the Beqaa Plain, not only causes stress on the water resources of the area, but also creates other issues such as subsidence of the land surface. We laid out two hypotheses for this study to investigate whether or not satellite data and information from other sources can be useful to provide evidence of groundwater depletion in the Beqaa. Our first hypothesis was addressed by showing the ability of the GRACE data to successfully capture the changes in groundwater storage for the region. Our second hypothesis was answered by validating the results with others sources of information, one being satellite InSAR and the other being in-situ measurements (monitoring wells). Initial results from the InSAR analysis support the findings from GRACE and highlight the regions that are experiencing groundwater depletion and land subsidence due to unsustainable groundwater pumping (50–60 wells/km2), namely in the Zahle District. Furthermore, the in-situ monitoring wells that provided sufficient data for this analysis show a depleting level of groundwater for most wells in the region.
Future efforts on this work will further focus on combining various sources of information, including satellite and in-situ measurements as well as model simulations, to obtain higher resolution estimates of groundwater storage change throughout the region. Efforts to combine GRACE with the newly launched GRACE Follow-On (GRACE-FO) data will be made to utilize longer time series of total water and groundwater storage changes. Additionally, gathering additional data from wells can be useful for inspecting the spatiotemporal variability of the ground response to water withdrawals, and to estimate elastic vs inelastic (i.e., seasonal vs long-term) properties of the groundwater system. This can provide information to identify specific regions that undergo irreversible compaction of the land surface and subsurface aquifers, which directly affects groundwater storage capacity of the area. These various questions can be investigated using the tools and methods presented in this study, and will be essential for long-term sustainability and effective groundwater management. With the availability of information from remote sensing and the wealth of data that is ready to be utilized for groundwater applications, it is becoming more possible to monitor the state of groundwater. Advancing this ability will be beneficial to local farmers, water managers, decision makers, and other entities or organizations that are stakeholders of groundwater resources.
Author Contributions
Conceptualization, E.C.M., Z.L., A.S. and M.E.H.; methodology, E.C.M.; formal analysis, E.C.M., Z.L., A.S. and M.E.H.; investigation, E.C.M., Z.L., A.S. and M.E.H.; resources, E.C.M., Z.L., A.S.; data curation, E.C.M., A.S.; writing—original draft preparation, E.C.M.; writing—review and editing, E.C.M., Z.L., A.S. and M.E.H.; project administration, E.C.M., A.S.; funding acquisition, Z.L. All authors have read and agreed to the published version of the manuscript.
Funding
This work was supported by the National Aeronautics and Space Administration, under Grant No. (80NM0018F0591).
Data Availability Statement
The data utilized in this study is available to the public at no cost. GRACE data is available at https://grace.jpl.nasa.gov/data/get-data/, GLDAS outputs are available at https://ldas.gsfc.nasa.gov/gldas/gldas-get-data, and the Qaraaoun Reservoir was obtained by the Litani River Authority and is available upon request. The ISCE software used for InSAR processing is available at https://github.com/isce-framework/isce2. Sentinel-1 data is provided by the European Space Agency (ESA) and available from the Alaska Satellite Facility (ASF) (https://vertex.daac.asf.alaska.edu).
Acknowledgments
The research was carried out at the Jet Propulsion Laboratory, California Institute of Technology, under a contract with the National Aeronautics and Space Administration (80NM0018F0591). Copyright 2021.
Conflicts of Interest
The authors declare no conflict of interest.
References
- McCallum, A.M.; Andersen, M.S.; Giambastiani, B.M.S.; Kelly, B.F.J.; Acworth, R.I. River-aquifer interactions in a semi-arid environment stressed by groundwater abstraction. Hydrol. Process. 2012, 27, 1072–1085. [Google Scholar] [CrossRef]
- Huang, J.; Ji, M.; Xie, Y.; Wang, S.; He, Y.; Ran, J. Global semi-arid climate change over last 60 years. Clim. Dyn. 2016, 46, 1131–1150. [Google Scholar] [CrossRef] [Green Version]
- Molle, F.; Marie-Hélène, N.; Bassam, J.; Alvar, C.; Safa, B. Groundwater Governance in Lebanon: The Case of Central Beqaa; A Policy White Paper. No. 615-2018-4008; International Water Management Institute (IWMI): Colombo, Sri Lanka, 2017. [Google Scholar]
- Woodhouse, C.A.; Meko, D.M.; Macdonald, G.M.; Stahle, D.W.; Cook, E.R. A 1,200-year perspective of 21st century drought in southwestern North America. Proc. Natl. Acad. Sci. USA 2010, 107, 21283–21288. [Google Scholar] [CrossRef] [Green Version]
- Famiglietti, J.S.; Lo, M.-H.; Ho, S.L.; Bethune, J.; Anderson, K.J.; Syed, T.H.; Swenson, S.C.; De Linage, C.R.; Rodell, M. Satellites measure recent rates of groundwater depletion in California’s Central Valley. Geophys. Res. Lett. 2011, 38, 471. [Google Scholar] [CrossRef] [Green Version]
- Famiglietti, J.S. The global groundwater crisis. Nat. Clim. Chang. 2014, 4, 945–948. [Google Scholar] [CrossRef]
- Massoud, E.; Espinoza, V.; Guan, B.; Waliser, D. Global Climate Model Ensemble Approaches for Future Projections of Atmospheric Rivers. Earth’s Future 2019, 7, 1136–1151. [Google Scholar] [CrossRef] [Green Version]
- Massoud, E.C.; Lee, H.; Gibson, P.B.; Loikith, P.; Waliser, D.E. Bayesian Model Averaging of Climate Model Projections Constrained by Precipitation Observations over the Contiguous United States. J. Hydrometeorol. 2020, 21, 2401–2418. [Google Scholar] [CrossRef]
- Wootten, A.M.; Massoud, E.C.; Sengupta, A.; Waliser, D.E.; Lee, H. The Effect of Statistical Downscaling on the Weighting of Multi-Model Ensembles of Precipitation. Climate 2020, 8, 138. [Google Scholar] [CrossRef]
- Massoud, E.C.; Purdy, A.J.; Miro, M.E.; Famiglietti, J.S. Projecting groundwater storage changes in California’s Central Valley. Sci. Rep. 2018, 8, 12917. [Google Scholar] [CrossRef] [PubMed]
- Massoud, E.; Turmon, M.; Reager, J.; Hobbs, J.; Liu, Z.; David, C.H. Cascading Dynamics of the Hydrologic Cycle in California Explored through Observations and Model Simulations. Geosciences 2020, 10, 71. [Google Scholar] [CrossRef] [Green Version]
- Liu, Z.; Liu, P.-W.; Massoud, E.; Farr, T.G.; Lundgren, P.; Famiglietti, J.S. Monitoring Groundwater Change in California’s Central Valley Using Sentinel-1 and GRACE Observations. Geoscience 2019, 9, 436. [Google Scholar] [CrossRef] [Green Version]
- Scanlon, B.R.; Longuevergne, L.; Long, D. Ground referencing GRACE satellite estimates of groundwater storage changes in the California Central Valley, USA. Water Resour. Res. 2012, 48, 04520. [Google Scholar] [CrossRef] [Green Version]
- Harbaugh, A.W.; Banta, E.R.; Hill, M.C.; McDonald, M.G. Modflow-2000, The U.S. Geological Survey Modular Ground—Water Model—User Guide to Modularization Concepts and the Ground-Water Flow Process; US Geological Survey: Reston, VA, USA, 2000. [Google Scholar]
- Margulis, S.A.; Cortés, G.; Girotto, M.; Durand, M. A Landsat-Era Sierra Nevada Snow Reanalysis (1985–2015). J. Hydrometeorol. 2016, 17, 1203–1221. [Google Scholar] [CrossRef]
- Rodell, M.; Houser, P.R.; Jambor, U.; Gottschalck, J.; Mitchell, K.; Meng, C.-J.; Arsenault, K.; Cosgrove, B.; Radakovich, J.; Bosilovich, M.; et al. The Global Land Data Assimilation System. Bull. Am. Meteorol. Soc. 2004, 85, 381–394. [Google Scholar] [CrossRef] [Green Version]
- Yang, Z.-L.; Niu, G.-Y.; Mitchell, K.E.; Chen, F.; Ek, M.B.; Barlage, M.; Longuevergne, L.; Manning, K.; Niyogi, D.; Tewari, M.; et al. The community Noah land surface model with multiparameterization options (Noah-MP): 2. Evaluation over global river basins. J. Geophys. Res. Space Phys. 2011, 116. [Google Scholar] [CrossRef]
- He, X.; Wada, Y.; Wanders, N.; Sheffield, J. Intensification of hydrological drought in California by human water management. Geophys. Res. Lett. 2017, 44, 1777–1785. [Google Scholar] [CrossRef] [Green Version]
- Zaitchik, B.F.; Rodell, M.; Reichle, R.H. Assimilation of GRACE Terrestrial Water Storage Data into a Land Surface Model: Results for the Mississippi River Basin. J. Hydrometeorol. 2008, 9, 535–548. [Google Scholar] [CrossRef]
- Xia, Y.L.; Mitchell, K.; Ek, M.; Sheffield, J.; Cosgrove, B.; Wood, E.; Luo, L.F.; Alonge, C.; Wei, H.L.; Meng, J.; et al. Continental-scale water and energy flux analysis and validation for the North American Land Data Assimilation System project phase 2 (NLDAS-2): 1. Intercomparison and application of model products. J. Geophys. Res. Atmos. 2012, 117, D03110. [Google Scholar] [CrossRef]
- Lo, M.; Famiglietti, J.S. Irrigation in California’s Central Valley strengthens the southwestern U.S. water cycle. Geophys. Res. Lett. 2013, 40, 301–306. [Google Scholar] [CrossRef] [Green Version]
- Faunt, C.C.; Hanson, R.; Belitz, K. Groundwater Availability of the Central Valley Aquifer, California; Professional Paper 1766; U.S. Geological Survey: Reston, VA, USA, 2009.
- Alley, W.M. Flow and Storage in Groundwater Systems. Science 2002, 296, 1985–1990. [Google Scholar] [CrossRef] [Green Version]
- Purdy, A.J.; David, C.H.; Sikder, S.; Reager, J.T.; Chandanpurkar, H.A.; Jones, N.L.; Matin, M.A. An Open-Source Tool to Fa-cilitate the Processing of GRACE Observations and GLDAS Outputs: An Evaluation in Bangladesh. Front. Environ. Sci. 2019, 7, 155. [Google Scholar] [CrossRef]
- Tapley, B.D.; Bettadpur, S.; Ries, J.C.; Thompson, P.F.; Watkins, M.M. Grace Measurements of Mass Variability in the Earth System. Science 2004, 305, 503–505. [Google Scholar] [CrossRef] [Green Version]
- Reager, J.T.; Thomas, A.C.; Sproles, E.A.; Rodell, M.; Beaudoing, H.K.; Li, B.; Famiglietti, J.S. Assimilation of GRACE Terres-trial Water Storage Observations into a Land Surface Model for the Assessment of Regional Flood Potential. Remote. Sens. 2015, 7, 14663–14679. [Google Scholar] [CrossRef] [Green Version]
- Shaban, A. Water Resources of Lebanon; Springer International Publishing: Berlin/Heidelberg, Germany, 2020; p. 229. [Google Scholar]
- El Hage, M.; Robinson, C.A.; El-Baz, F.; Shaban, A. Fracture-controlled groundwater seeps into the Mediterranean Sea along the coast of Lebanon. Arab. J. Geosci. 2020, 13, 1–14. [Google Scholar] [CrossRef]
- Rodell, M.; Velicogna, I.; Famiglietti, J.S. Satellite-based estimates of groundwater depletion in India. Nat. Cell Biol. 2009, 460, 999–1002. [Google Scholar] [CrossRef] [PubMed] [Green Version]
- Voss, K.A.; Famiglietti, J.S.; Lo, M.; De Linage, C.; Rodell, M.; Swenson, S.C. Groundwater depletion in the Middle East from GRACE with implications for transboundary water management in the Tigris-Euphrates-Western Iran region. Water Resour. Res. 2013, 49, 904–914. [Google Scholar] [CrossRef] [Green Version]
- Forootan, E.; Rietbroek, R.; Kusche, J.; Sharifi, M.; Awange, J.L.; Schmidt, M.W.; Omondi, P.; Famiglietti, J.S. Separation of large scale water storage patterns over Iran using GRACE, altimetry and hydrological data. Remote. Sens. Environ. 2014, 140, 580–595. [Google Scholar] [CrossRef] [Green Version]
- Tiwari, V.M.; Wahr, J.; Swenson, S. Dwindling groundwater resources in northern India, from satellite gravity observations. Geophys. Res. Lett. 2009, 36, 18401. [Google Scholar] [CrossRef] [Green Version]
- Moiwo, J.; Yang, Y.; Li, H.; Han, S.; Hu, Y. Comparison of GRACE with in situ hydrological measurement data shows stor-age depletion in Hai River basin, Northern China. Water SA 2009, 35, 663–670. [Google Scholar] [CrossRef] [Green Version]
- Feng, W.; Zhong, M.; Lemoine, J.M.; Biancale, R.; Hsu, H.T.; Xia, J. Evaluation of groundwater de-pletion in North China using the Gravity Recovery and Climate Experiment (GRACE) data and ground-based measure-ments. Water Resour. Res. 2013, 49, 2110–2118. [Google Scholar] [CrossRef]
- Watkins, M.M.; Wiese, D.N.; Yuan, D.-N.; Boening, C.; Landerer, F.W. Improved methods for observing Earth’s time variable mass distribution with GRACE using spherical cap mascons. J. Geophys. Res. Solid Earth 2015, 120, 2648–2671. [Google Scholar] [CrossRef]
- Wiese, D.N.; Yuan, D.-N.; Boening, C.; Landerer, F.W.; Watkins, M.M. JPL GRACE Mascon Ocean, Ice, and Hydrology Equivalent Water Height RL05M.1 CRI Filtered Version 2. PO.DAAC, CA, USA. Available online: http://0-dx-doi-org.brum.beds.ac.uk/10.5067/TEMSC-2LCR5 (accessed on 1 October 2018).
- Khaki, M.; Ait-El-Fquih, B.; Hoteit, I.; Forootan, E.; Awange, J.; Kuhn, M. A two-update en-semble Kalman filter for land hydrological data assimilation with an uncertain constraint. J. Hydrol. 2017, 555, 447–462. [Google Scholar] [CrossRef] [Green Version]
- Khaki, M.; Ait-El-Fquih, B.; Hoteit, I.; Forootan, E.; Awange, J.; Kuhn, M. Unsupervised ensemble Kalman filtering with an uncertain constraint for land hydrological data assimilation. J. Hydrol. 2018, 564, 175–190. [Google Scholar] [CrossRef]
- Levy, M.C.; Neely, W.R.; Borsa, A.A.; Burney, J.A. Fine-scale spatiotemporal variation in sub-sidence across California’s San Joaquin Valley explained by groundwater demand. Environ. Res. Lett. 2020, 15, 104083. [Google Scholar] [CrossRef]
- Mora, O.; Lanari, R.; Mallorqui, J.; Berardino, P.; Sansosti, E. A new algorithm for monitoring localized deformation phenomena based on small baseline differential SAR interferograms. IEEE Int. Geosci. Remote Sens. Symp. 2003, 2, 2375–2383. [Google Scholar] [CrossRef]
- Sansosti, E.; Casu, F.; Manzo, M.; Lanari, R. Space-borne radar interferometry techniques for the generation of deformation time series: An advanced tool for Earth’s surface displacement analysis. Geophys. Res. Lett. 2010, 37, 1–9. [Google Scholar] [CrossRef]
Figure 1.
(A) Study domain, shown in yellow. There are three Gravity Recovery and Climate Experiment (GRACE) grid cells that cover this area, defined as the West Beqaa, Rashaya, and Zahle Districts. Additionally, the map of Lebanon is shown in relation to the rest of the globe on the bottom right. (B) Permeability maps which indicate the potential recharge for Lebanon. Our study domain is a mixture of high to very high recharge (yellow) in the West Beqaa, moderate recharge (orange) in the Rashaya District, and low to very low recharge (purple) in the Zahle District.

Figure 2.
Total Water Storage (TWS) from the GRACE satellite data record. Three separate regions are shown, and the Zahle District is an area that is experiencing significant loss of water storage.
Figure 2.
Total Water Storage (TWS) from the GRACE satellite data record. Three separate regions are shown, and the Zahle District is an area that is experiencing significant loss of water storage.

Figure 3.
Soil Moisture storage in the top 10 cm (SM) from the Global Land Data Assimilation System (GLDAS) model simulations. Three separate regions are shown.
Figure 3.
Soil Moisture storage in the top 10 cm (SM) from the Global Land Data Assimilation System (GLDAS) model simulations. Three separate regions are shown.

Figure 4.
Snow Water Equivalent (SWE) from the GLDAS model simulations. Three separate regions are shown.
Figure 4.
Snow Water Equivalent (SWE) from the GLDAS model simulations. Three separate regions are shown.

Figure 5.
Canopy water (Canopy) from the GLDAS model simulations. Three separate regions are shown.

Figure 6.
Reservoir height, shown in meters above sea level, for the Qaraaoun Reservoir in Beqaa, Lebanon.
Figure 6.
Reservoir height, shown in meters above sea level, for the Qaraaoun Reservoir in Beqaa, Lebanon.

Figure 7.
(A–E) Hydrologic variables for the three regions in this study. All units are converted to cm in order to calculate groundwater anomalies from the GRACE signal. (F) Groundwater storage anomalies, calculated for the three regions in this study. The rate of loss (cm/year) for each region is noted on the bottom of the figure.

Figure 8.
(A) Interferometric synthetic aperture radar (InSAR) line-of-sight (LOS) velocity and displacement time series (inset) inferred from Sentinel-1 data. The shaded rectangle in the inset indicates the overlap period between GRACE and Sentinel-1 data, shown in units (cm). Regions with the shades of purple and red are where higher levels of land subsidence are observed. (B) These subsidence locations coincide with areas that have pumping wells, shown on the right with red dots.

Figure 9.
Monitoring wells for 7 chosen locations, indicated on the map with red dots. These individual cases show the seasonal signals of groundwater depletion and recovery, but overall, there is a long-term trend of depletion in most of these wells and this is due to unsustainable groundwater pumping. Units for the timelines showing the groundwater well dynamics are in (m).


Table 1.
Groundwater monitoring wells in the Beqaa Plain. All wells indicate a level of depletion since 2015.
Table 1.
Groundwater monitoring wells in the Beqaa Plain. All wells indicate a level of depletion since 2015.
| # | Name | Coordinates | Depth (m) | Estimated Depletion (m) from 2015–2017 | |
|---|---|---|---|---|---|
| 1 | AREC | 33°55′32″ | 36°04′49″ | 50 | 1 |
| 2 | El-Forzoul | 33°50′59″ | 35°57′24″ | 26 | 2 |
| 3 | ICARDA | 33°48′21″ | 35°59′31″ | 51 | 3 |
| 4 | Aamiq | 33°43′49″ | 35°47′07″ | 30 | 2–3 |
| 5 | Rayak | 33°51′09″ | 36°42′00″ | 95 | 10 |
| 6 | Tell Amara-1 | 33°51′45″ | 35°59′31″ | 25 | 3 |
| 7 | Tell Amara-2 | 33°51′42″ | 35°59′28″ | 78 | 3–5 |
| 8 | Tell Amara-3 | 33°51′40″ | 35°59′25″ | 64 | 3–5 |
| 9 | El-Marj | 33°45′49″ | 35°52′50″ | 20 | 1 |
| 10 | Ksara | 33°49′23″ | 35°53′50″ | 82 | 12 |
| 11 | Ta’anayel-1 | 33°48′13″ | 35°51′53″ | 10 | 2 |
| 12 | Ta’anayel-2 | 33°48′04″ | 35°51′47″ | 9 | 2 |
| 13 | Ta’anayel-3 | 33°48′01″ | 35°51′45″ | 9 | 1.5 |
| 14 | Dalhamieh | 33°48′35″ | 35°57′59″ | 60 | 6 |
| 15 | Jedieta -1 | 33°49′47″ | 35°50′24″ | 70 | 15 |
| 16 | Jedieta -2 | 33°49′40″ | 35°50′18″ | 65 | 12 |
| 17 | Jedieta -3 | 33°49′34″ | 35°50′15″ | 45 | 12 |
| 18 | Jedieta -4 | 33°49′37″ | 35°50′15″ | 30 | 8 |
| 19 | Ta’albaya | 33°48′38″ | 35°52′14″ | 126 | 5 |
| 20 | Mansoura-1 | 33°41′11″ | 35°48′37″ | 118 | 10 |
| 21 | Mansoura-2 | 33°40′55″ | 35°48′52″ | 85 | 10–12 |
| 22 | Mansoura-3 | 33°40′53″ | 35°48′41″ | 110 | 5-7 |
| 23 | Mansoura-4 | 33°40′47″ | 35°48′57″ | 97 | 5 |
| 24 | Kfer Zabad | 33°47′05″ | 35°59′46″ | 112 | 10 |
| 25 | Joub Jannine-1 | 33°38′29″ | 35°47′11″ | 125 | 8 |
| 26 | Joub Jannine-2 | 33°38′07″ | 35°46′59″ | 142 | 8 |
| 27 | Qaraaoun | 33°34′41″ | 35°43′21″ | 31 | 3 |
| 28 | Zahle-1 | 33°50′39″ | 35°54′16″ | 82 | 8–10 |
| 29 | Zahle-2 | 33°50′34″ | 35°54′04″ | 103 | 5 |
| 30 | Nasarieh | 33°45′54″ | 35°51′45″ | 56 | 3 |
| 31 | Houch Aamiq | 33°42′50″ | 35°47′00″ | 42 | 5 |
| 32 | Tell Al-Akhdar-1 | 33°44′09″ | 35°49′47″ | 65 | 2 |
| 33 | Tell Al-Akhdar-2 | 33°44′32″ | 35°49′20″ | 61 | 7 |
| 34 | Al- Manara-1 | 33°39′04″ | 35°52′48″ | 128 | 9 |
| 35 | Al-Manara-2 | 33°39′26″ | 35°52′49″ | 132 | 10–12 |
| 36 | A’ana-1 | 33°41′28″ | 35°45′41″ | 88 | 3 |
| 37 | A’ana-2 | 33°41′23″ | 35°45′42″ | 103 | 7 |
| 38 | Kob Elias-1 | 33°47′21″ | 35°49′29″ | 112 | 16 |
| 39 | Kob Elias-2 | 33°47′11″ | 35°49′30″ | 106 | 15 |
| 40 | Al-Khiyara-1 | 33°41′23″ | 35°51′08″ | 110 | 8 |
| 41 | Al-Khiyara-2 | 33°41′45″ | 35°50′42″ | 98 | 8–10 |
| 42 | Al-Khiyara-3 | 33°41′30″ | 35°50′41″ | 105 | 4–6 |
| 43 | Sa’ad Nayel-1 | 33°49′01″ | 35°52′55″ | 86 | 10 |
| 44 | Sa’ad Nayel-2 | 33°48′56″ | 35°52′27″ | 92 | 7 |
Publisher’s Note: MDPI stays neutral with regard to jurisdictional claims in published maps and institutional affiliations. |
© 2021 by the authors. Licensee MDPI, Basel, Switzerland. This article is an open access article distributed under the terms and conditions of the Creative Commons Attribution (CC BY) license (http://creativecommons.org/licenses/by/4.0/).
Share and Cite
MDPI and ACS Style
Massoud, E.C.; Liu, Z.; Shaban, A.; Hage, M.E. Groundwater Depletion Signals in the Beqaa Plain, Lebanon: Evidence from GRACE and Sentinel-1 Data. Remote Sens. 2021, 13, 915. https://0-doi-org.brum.beds.ac.uk/10.3390/rs13050915
AMA Style
Massoud EC, Liu Z, Shaban A, Hage ME. Groundwater Depletion Signals in the Beqaa Plain, Lebanon: Evidence from GRACE and Sentinel-1 Data. Remote Sensing. 2021; 13(5):915. https://0-doi-org.brum.beds.ac.uk/10.3390/rs13050915
Chicago/Turabian StyleMassoud, Elias C., Zhen Liu, Amin Shaban, and Mhamad El Hage. 2021. "Groundwater Depletion Signals in the Beqaa Plain, Lebanon: Evidence from GRACE and Sentinel-1 Data" Remote Sensing 13, no. 5: 915. https://0-doi-org.brum.beds.ac.uk/10.3390/rs13050915
Note that from the first issue of 2016, this journal uses article numbers instead of page numbers. See further details here.