
Chronology of the Basalt Units Surrounding Chang’e-4 Landing Area
by
 ,
,
Zongyu Yue
1,2, 
Ke Shi
1,3,
Gregory Michael
4,
Kaichang Di
1,2,
Sheng Gou
1,5,*,
Jianzhong Liu
2,6 and
Shengli Niu
5 1
State Key Laboratory of Remote Sensing Science, Aerospace Information Research Institute, Chinese Academy of Sciences, Beijing 100101, China
2
Center for Excellence in Comparative Planetology, Chinese Academy of Sciences, Hefei 230026, China
3
University of Chinese Academy of Sciences, Beijing 100049, China
4
Institute of Geological Sciences, Freie Unversitaet Berlin, Malteser Strasse 74-100, Haus D, 12249 Berlin, Germany
5
State Key Laboratory of Lunar and Planetary Sciences, Macau University of Science and Technology, Macau 999078, China
6
Institute of Geochemistry, Chinese Academy of Sciences, Guiyang 550081, China
*
Author to whom correspondence should be addressed.
Remote Sens. 2022, 14(1), 49; https://0-doi-org.brum.beds.ac.uk/10.3390/rs14010049
Submission received: 24 November 2021
/
Revised: 19 December 2021
/
Accepted: 21 December 2021
/
Published: 23 December 2021
(This article belongs to the Special Issue Planetary Geologic Mapping and Remote Sensing)
Abstract
:The Chang’e-4 (CE-4) lunar probe, the first soft landing spacecraft on the far side of the Moon, successfully landed in the Von Kármán crater on 3 January 2019. Geological studies of the landing area have been conducted and more intensive studies will be carried out with the in situ measured data. The chronological study of the maria basalt surrounding the CE-4 landing area is significant to the related studies. Currently, the crater size-frequency distribution (CSFD) technique is the most popular method to derive absolute model ages (AMAs) of geological units where no returned sample is available, and it has been widely used in dating maria basalt on the lunar surface. In this research, we first make a mosaic with multi-orbital Chang’e-2 (CE-2) images as a base map. Coupled with the elevation data and FeO content, nine representative areas of basalt units surrounding the CE-4 landing area are outlined and their AMAs are derived. The dating results of the nine basalt units indicate that the basalts erupted from 3.42 to 2.28 Ga ago in this area, a period much longer than derived by previous studies. The derived chronology of the above basalt units establishes a foundation for geological analysis of the returned CE-4 data.
1. Introduction
Chang’e-4 (CE-4) was the second soft landing mission in the China’s Lunar Exploration Program, and the probe successfully landed on the far side of the Moon in the Von Kármán crater inside the South Pole-Aitken (SPA) basin on 3 January 2019 [1,2]. The Yutu-2 rover was then successfully released from the lander on the same day, and it is still working as of now. The SPA basin is an elliptical impact basin with axes measuring 2400 × 2050 km [3], and it is considered as one of the three major lunar terranes according to its unique geochemistry and petrologic history [4]. Using three-dimensional numerical impact simulations, ref. [5] demonstrates that the SPA must have sampled the Moon’s upper mantle to depths of 100 km. Therefore, a number of fundamental lunar science questions, such as the composition of the lunar upper mantle [6] and the reason that far side maria differ from their near side counterparts [1], are expected to be addressed with the returned CE-4 data. As a result, many studies related to the CE-4 landing area have been recently carried out (e.g., [7,8,9,10,11,12,13]), and more works are in progress with the returned CE-4 data. To support reliable analysis and interpretation of the scientific data from the CE-4 mission, it is necessary to create a reliable chronology of the geological units surrounding the CE-4 landing area.
Chronology here refers to the occurrence order of a series of geological events, and the occurrence of the geological events can be expressed with the absolute age or the relative age. Figure 1 shows the context of the CE-4 landing area. The local relative chronology surrounding the CE-4 landing area may be determined according to the superpositional relationships of different geological units. However, determining their absolute model ages (AMAs) is always preferable and particularly important when it is difficult to derive the relative ages between two non-adjacent geological units [14]. The principle of determining the AMA of lunar geological units was elaborated in [15] and was the subject of many papers (e.g., [14,15,16]). The rationale of the approach is to fit the observed crater size-frequency distribution (CSFD) of a counting area that represents the geological unit to a known crater production function (PF) (e.g., [17]), which is further used to derive the AMA along with a chronology function (CF) calibrated to radiometric dating from lunar samples [16]. Currently, the method has been widely used in dating lunar mare basalts, e.g., [17,18,19]. With this method, the AMA of the mare unit on the floor of Von Kármán crater has been derived as 3.35 Ga [20], 3.6 Ga [7], and 3.15 Ga [21]. However, the mare surface on the floor of Von Kármán crater was interpreted to be emplaced by one episode of basaltic volcanism in these studies, which can only give a rough estimation of the average AMA of the maria basalt. As to the mare deposits in Von Kármán M crater [20], an AMA of 3.38 Ga was derived, while [21] mapped two mare basalt units in Von Kármán M crater and derived AMAs of 3.38 Ga and 3.52 Ga, respectively. In addition, the AMA of the basalt unit in Leibnitz crater was derived as 3.44 Ga [20] and 3.37 Ga [21]. The mare basalt in Leibnitz X crater (the crater diameter is about 19.71 km), which is inside Leibnitz crater, was dated as 3.68 Ga [21]. The different dating results of the above studies to the same maria unit may arise from the different data sources and counting areas. Therefore, a strict basalt unit mapping and AMA dating is urgent for the analysis of data acquired by the CE-4 rover. In addition, because there are many ejecta in this area, CE-4 rover would probably encounter the fragments from the maria basalts nearby. Thus, the AMAs of them are also necessary to understand the whole history of the basalt formation in this area.
In this research, nine basalt geological units were mapped in the CE-4 landing area according to the difference of brightness, FeO content, and the topography. Superposed craters in the counting areas used for deriving the AMAs of the above geological units were mapped in mosaics generated from the Chang’e-2 (CE-2) digital orthophoto map (DOM) [22]. The AMAs of all the nine measurement areas were obtained with the CSFD method.
2. Materials and Methods
2.1. Data
Craters for dating AMAs were mapped in a DOM mosaic generated from CE-2 orbital images. CE-2 mission was China’s second lunar spacecraft and it was launched on 1 October 2010. The onboard stereo camera obtained high-resolution images, and the returned data were processed with radiometric, geometric, and photometric calibration [22]. A DOM was finally generated with a resolution of ~7 m/pixel and divided into multiple regions. The data are now publicly available through the Data Release and Information Service System of China’s Lunar Exploration Program (http://moon.bao.ac.cn, accessed on 15 November 2021). Twelve DOM files were downloaded and merged to produce a DOM mosaic in ArcGIS®.
The merged digital elevation model from the Lunar Orbiter Laser Altimeter and SELENE Terrain Camera (designated as “SLDEM”) [23] was used for topographic analysis of the geological context surrounding the CE-4 landing site. The product has a typical vertical accuracy of ~3–4 m and a resolution of ~42 m/pixel around the CE-4 landing area [23]. To reveal the topographic detail of the region, the SLDEM was color coded and was registered.
The FeO content product derived from the Kaguya Multiband Imager data [24] is also used to evaluate the boundaries of maria basalt units in this research. The product is released with a spatial resolution of ~60 m/pixel between 50° N and 50° S and nine maria basalts units studied in this research are included.
2.2. Methods
The process of determining the AMA of the geological unit includes mapping the surface unit and identifying the superposed craters. The AMAs can be derived by comparing the CSFD of the counted craters with the CF [15]. Here, we present the principles of mapping the measurement areas and the crater counting method. We used Craterstats (http://www.geoinf.fu-berlin.de/mex4/software/craterstats2/, accessed on 15 November 2021) to derive the AMA of each geological unit [25].
2.2.1. Maria Basalt Measurement Areas Mapping
It only makes sense to assess the AMA of a surface with the same geological history, i.e., a geologically homogeneous region that had undergone the same geological processes [25]. Significant interruptions to the homogeneity should be considered as another geological unit. For the maria basalt in this study, this means only one episode of basaltic volcanism should be emplaced in each geological unit.
In maria units mapping, the brightness differences, spectral ratios, FeO and TiO2 contents, and morphology have usually been used to ensure homogeneity of the investigated basalts, e.g., [17,18,19,26,27,28]. In this study, we combined the derived FeO content, brightness difference from CE-2 DOM mosaic, and topographical difference from SLDEM to map the maria basalt units. The mapped measurement areas are the intersection of these above products if they are inconsistent. In addition, areas with identifiable secondary craters should be excluded in the geological mapping [25]. Finally, nine maria basalt units were outlined see below.
2.2.2. Crater Counting
The craters superimposed on the measurement areas have been mapped on the CE-2 DOM mosaics with the ArcGIS add-in “CraterTools”, which measures crater diameter correctly regardless of map projection [29]. CraterTools can work well with three reference points on the crater rims, even for craters where a part of the rim is obscured or even absent. When manually digitizing a crater, the three points on the crater rim should be as evenly distributed as possible, which can give the minimum error [30]. The secondary craters should be excluded in the dating process [31,32], and they are usually recognized in chains or clusters with irregular shape. This judgement is inevitably subjective, and we have conducted an analysis of spatial randomness and clustering of the mapped craters superimposed on each geological unit following the method of mean closest two neighbors’ distance (MC2ND) [32].
3. Results
3.1. Maria Basalt Units in Von Kármán Crater
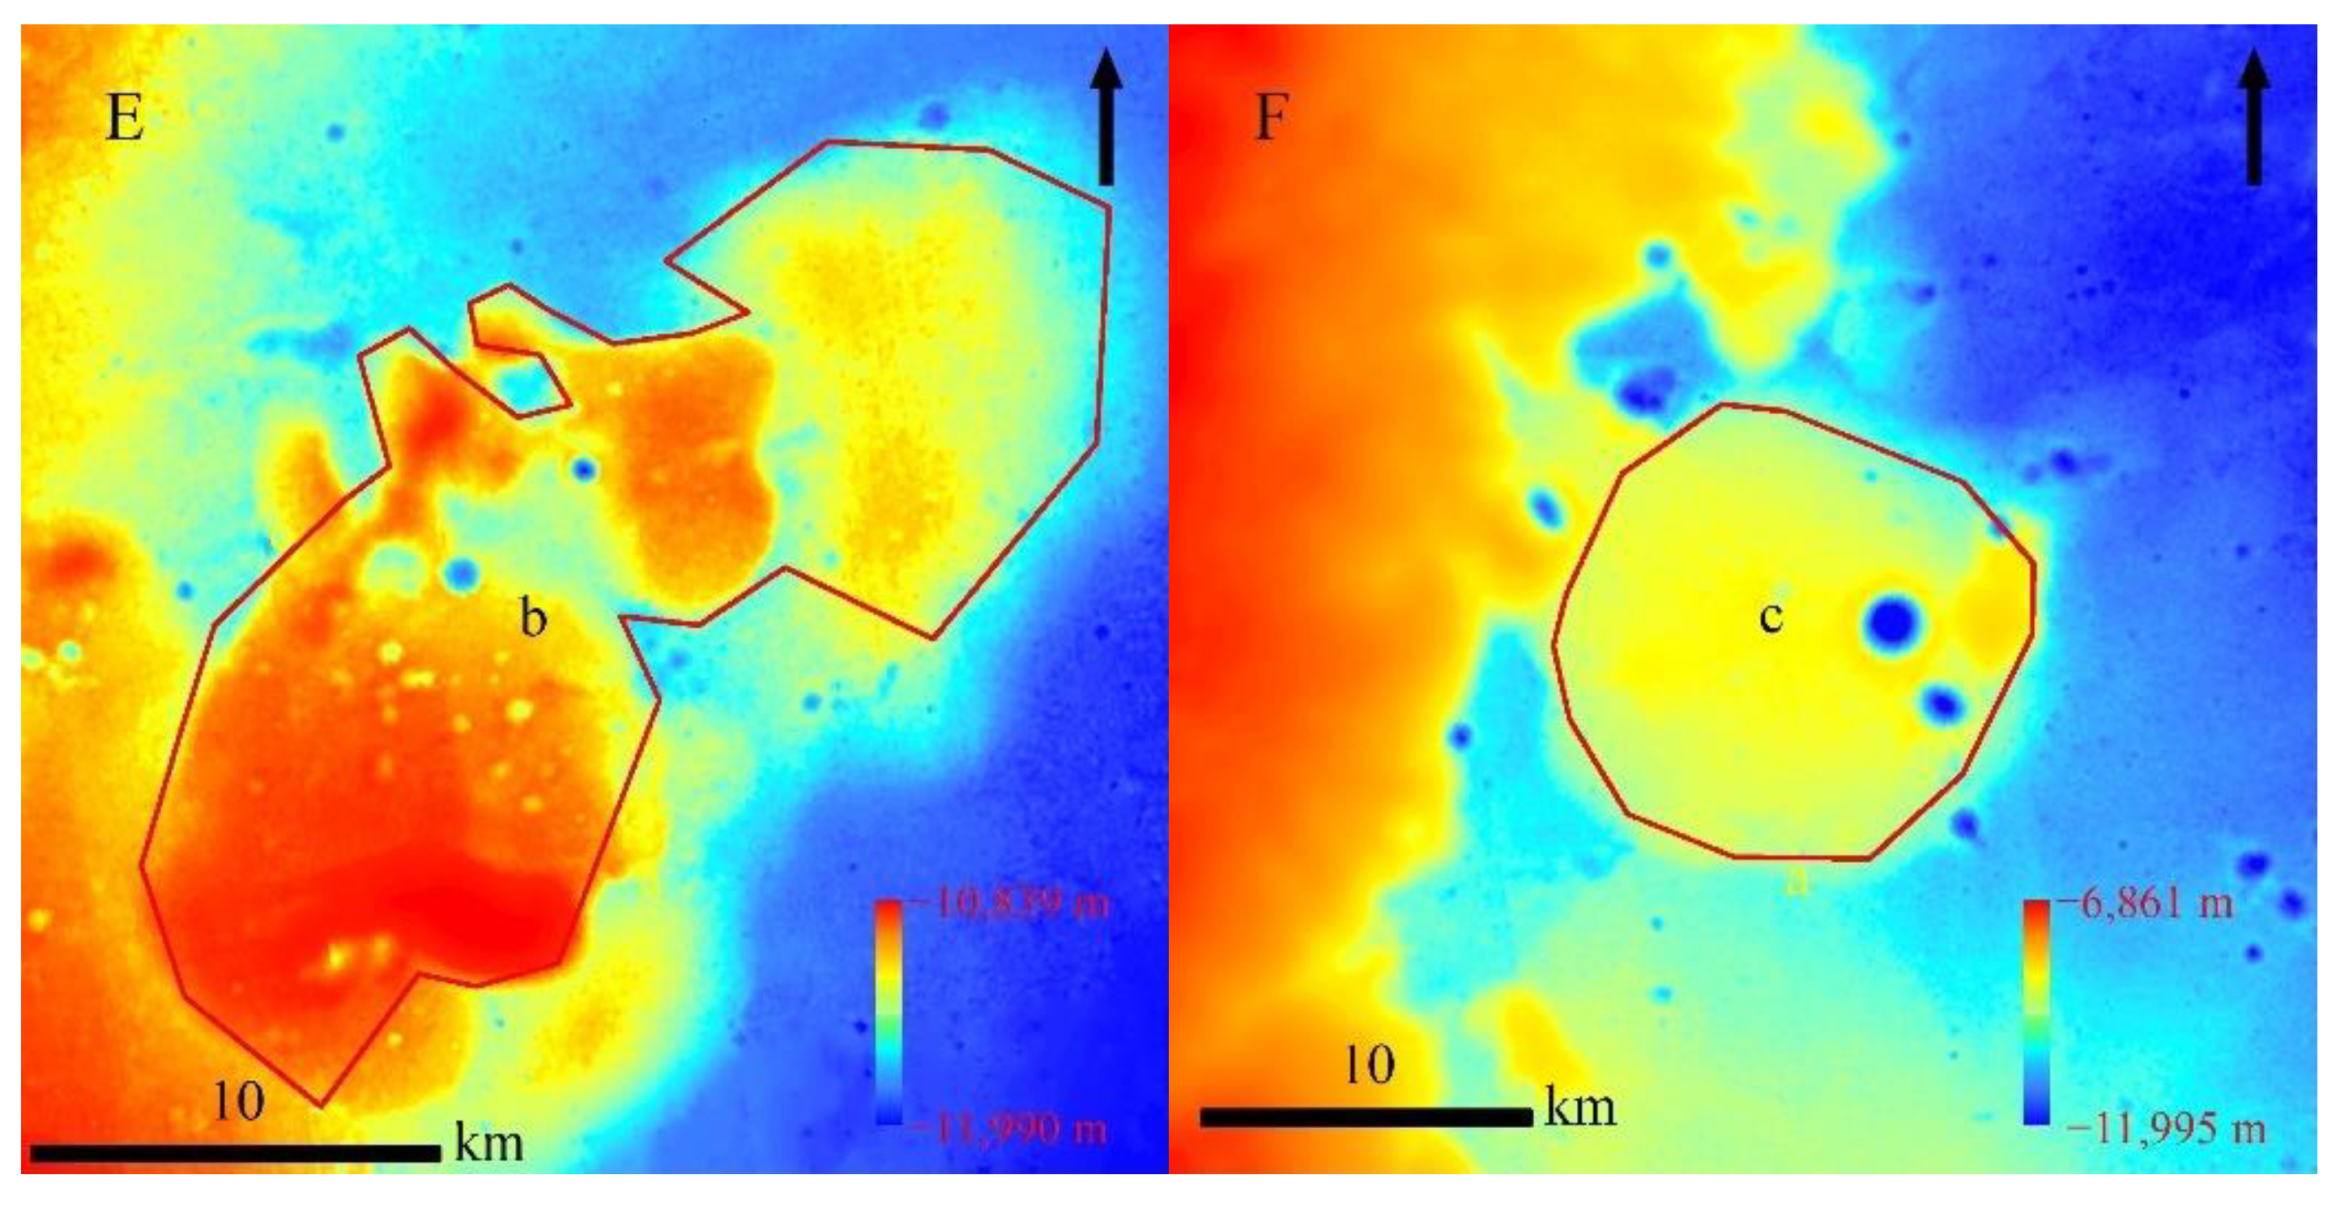
The floor of Von Kármán crater (Figure 2) was mapped as mare basalts by [33], and the crater floor has significantly higher FeO contents than the surrounding terrain (Figure 2C). However, the crater floor is extensively overprinted by ejecta from nearby craters [34], making the FeO content much lower in the northern and eastern part of the crater floor. In addition, the fresh Zhinyu crater obviously excavated mare basalt deposits from the subsurface resulted in much higher FeO content (Figure 2C). Thus, we selected a small area labeled as ‘a’ in Figure 2 to date the maria basalt in the Von Kármán crater floor (Figure 2A,D). Figure 2B shows two local upland structures in the SLDEM, and they are more clearly shown in Figure 2E,F, respectively. In this research, they are mapped as units ‘b’ and ‘c’ for subsequent surface dating.
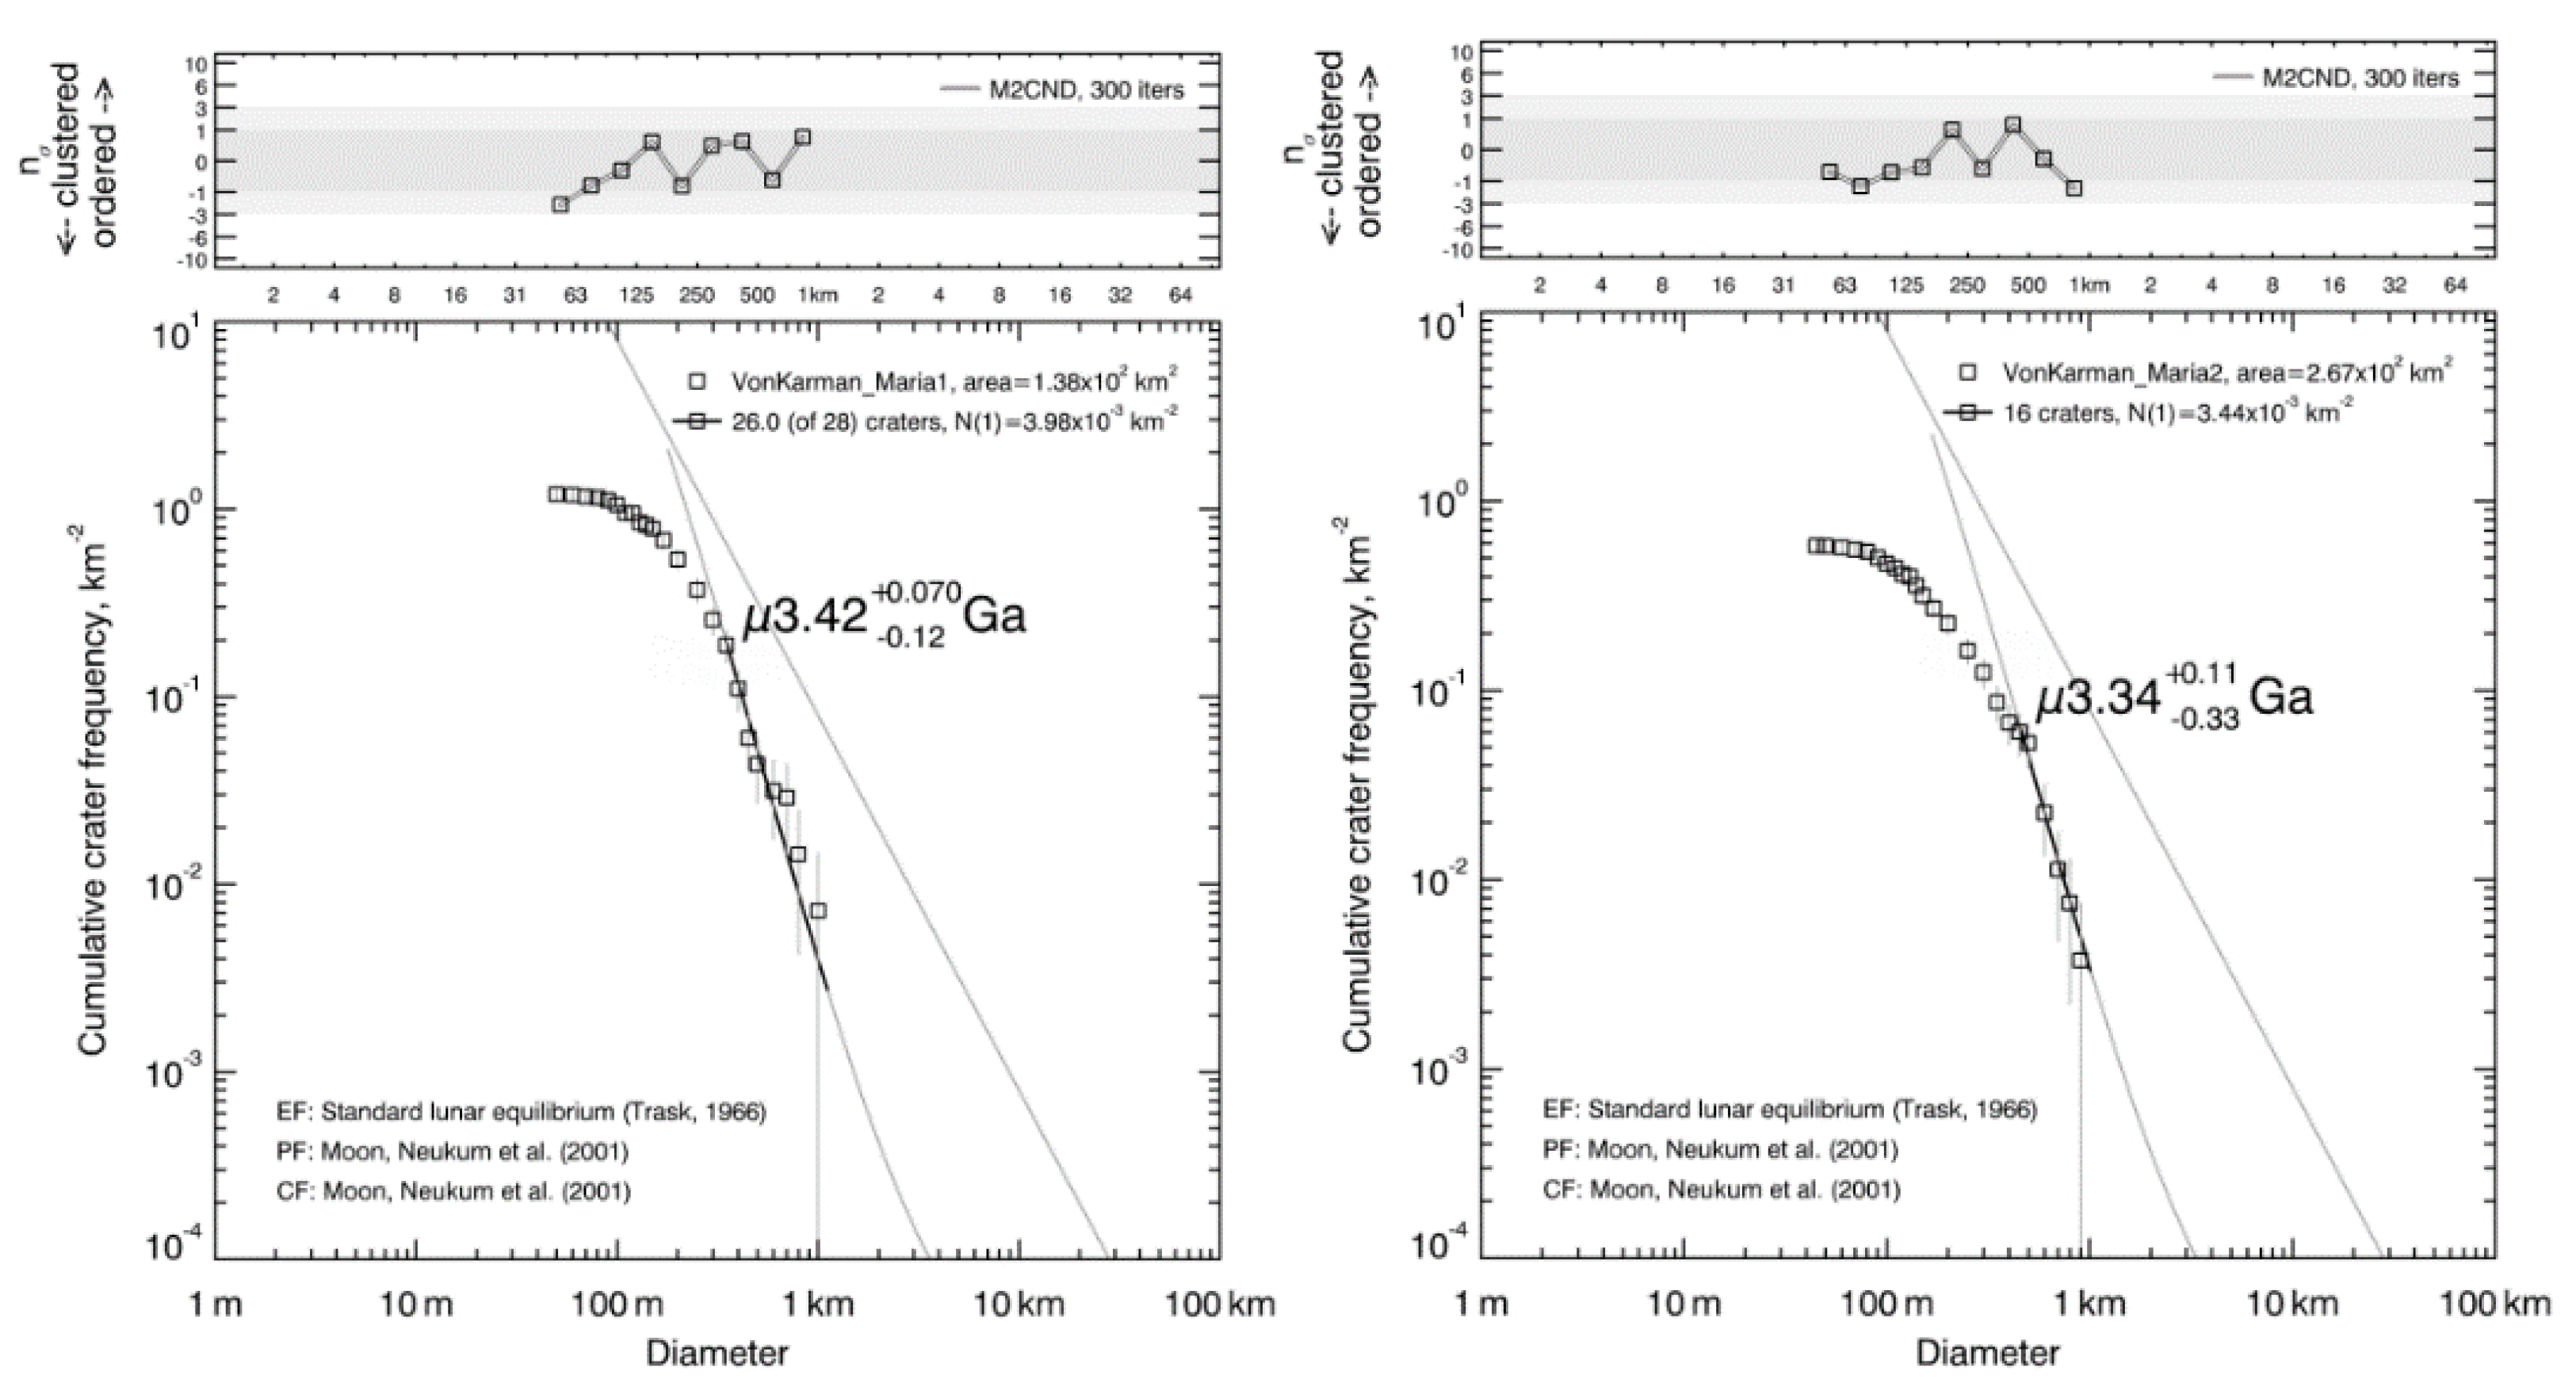
Our CSFD measurements of the mare units inside Von Kármán crater show AMAs of 3.42 Ga, 3.34 Ga, and 3.34 Ga for the basalt units ‘a’, ‘b’, and ‘c’, respectively (Figure 3). The analysis results of spatial randomness and clustering of the mapped craters are on the top of each group of CSFD fitting curve. It is clear that, for the crater diameters used for surface dating, almost each of the MC2ND of the mapped craters falls within ±3σ of the expectation value derived from Monte Carlo simulation, indicating that the spatial distribution of the mapped craters is random. Figure 3 also includes the areas of the counting regions, with the values ranging from 138 km2 to 267 km2.
3.2. Maria Basalt Units in Von Kármán M Crater
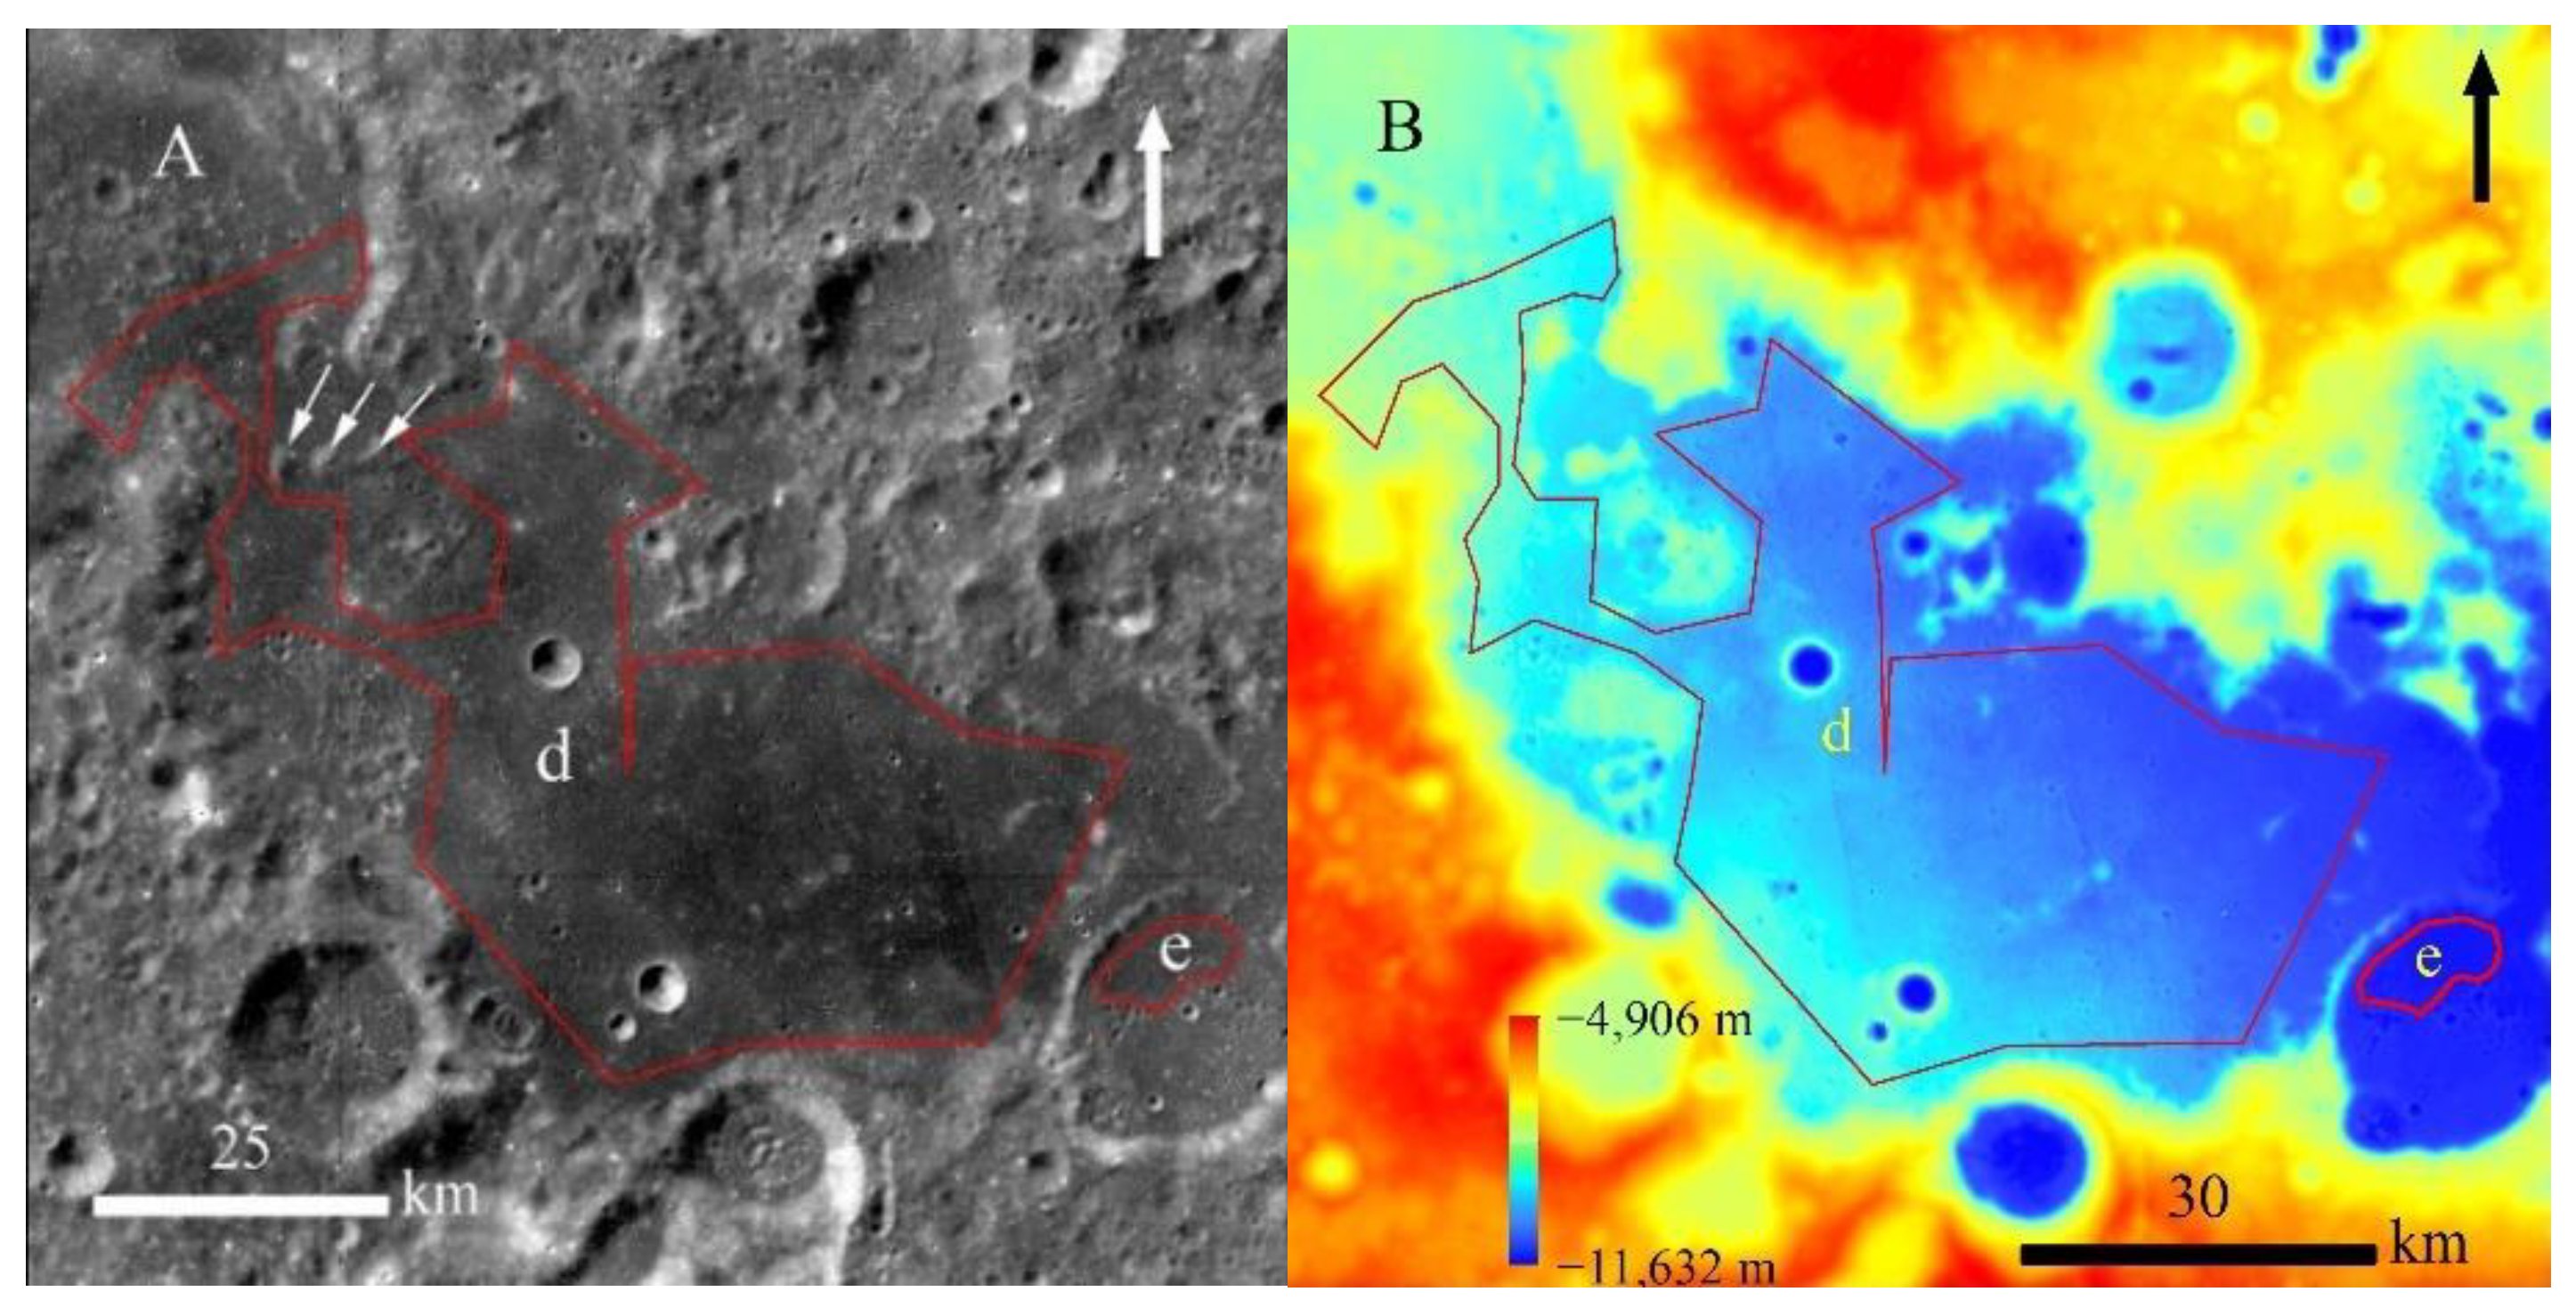
Most of the floor of Von Kármán M crater is superposed by Von Kármán crater, and the exposed southern half of the crater is filled with mare basalts [33]. The eastern part of the floor is covered by the ejecta from Alder crater (Figure 1), and there are several massifs protruding from the basalt units (Figure 4A). Similar to [21], two basalt units are mapped in this study (Figure 4), in which the raised massifs are excluded. The basalt units are relatively flat, and the topography gradually rises up from southeast to northwest (Figure 4B). The FeO contents of the basalt units are obviously much higher than surrounding terrains (Figure 4C).
The CSFD measurements of the mare units in Von Kármán M crater show AMAs of 2.36 Ga and 2.28 Ga for the basalt units ‘d’ and ‘e’, respectively (Figure 5). For the basalt unit ‘d’ (counting area is 2320 km2), the minimum result of the random analysis is about −6σ of the expectation value derived from Monte Carlo simulation at the diameter of ~144 m, and the random analysis results for D >= ~200 m are within ±3σ of the expectation value. The minimum diameter for fitting the isochron line is at ~400 m in this study, which thus does not affect the reliability of the dating results. For the basalt unit ‘e’ (counting areas is 59.3 km2), the analysis results of spatial randomness and clustering of the mapped craters fall within ±3σ of the expectation value derived from Monte Carlo simulation for all the diameters. The AMA difference (0.08 Ga) between the two basalt units is small, indicating the basalt in these two areas are probably from one episode.
3.3. Maria Basalt Unit in Hess Z Crater
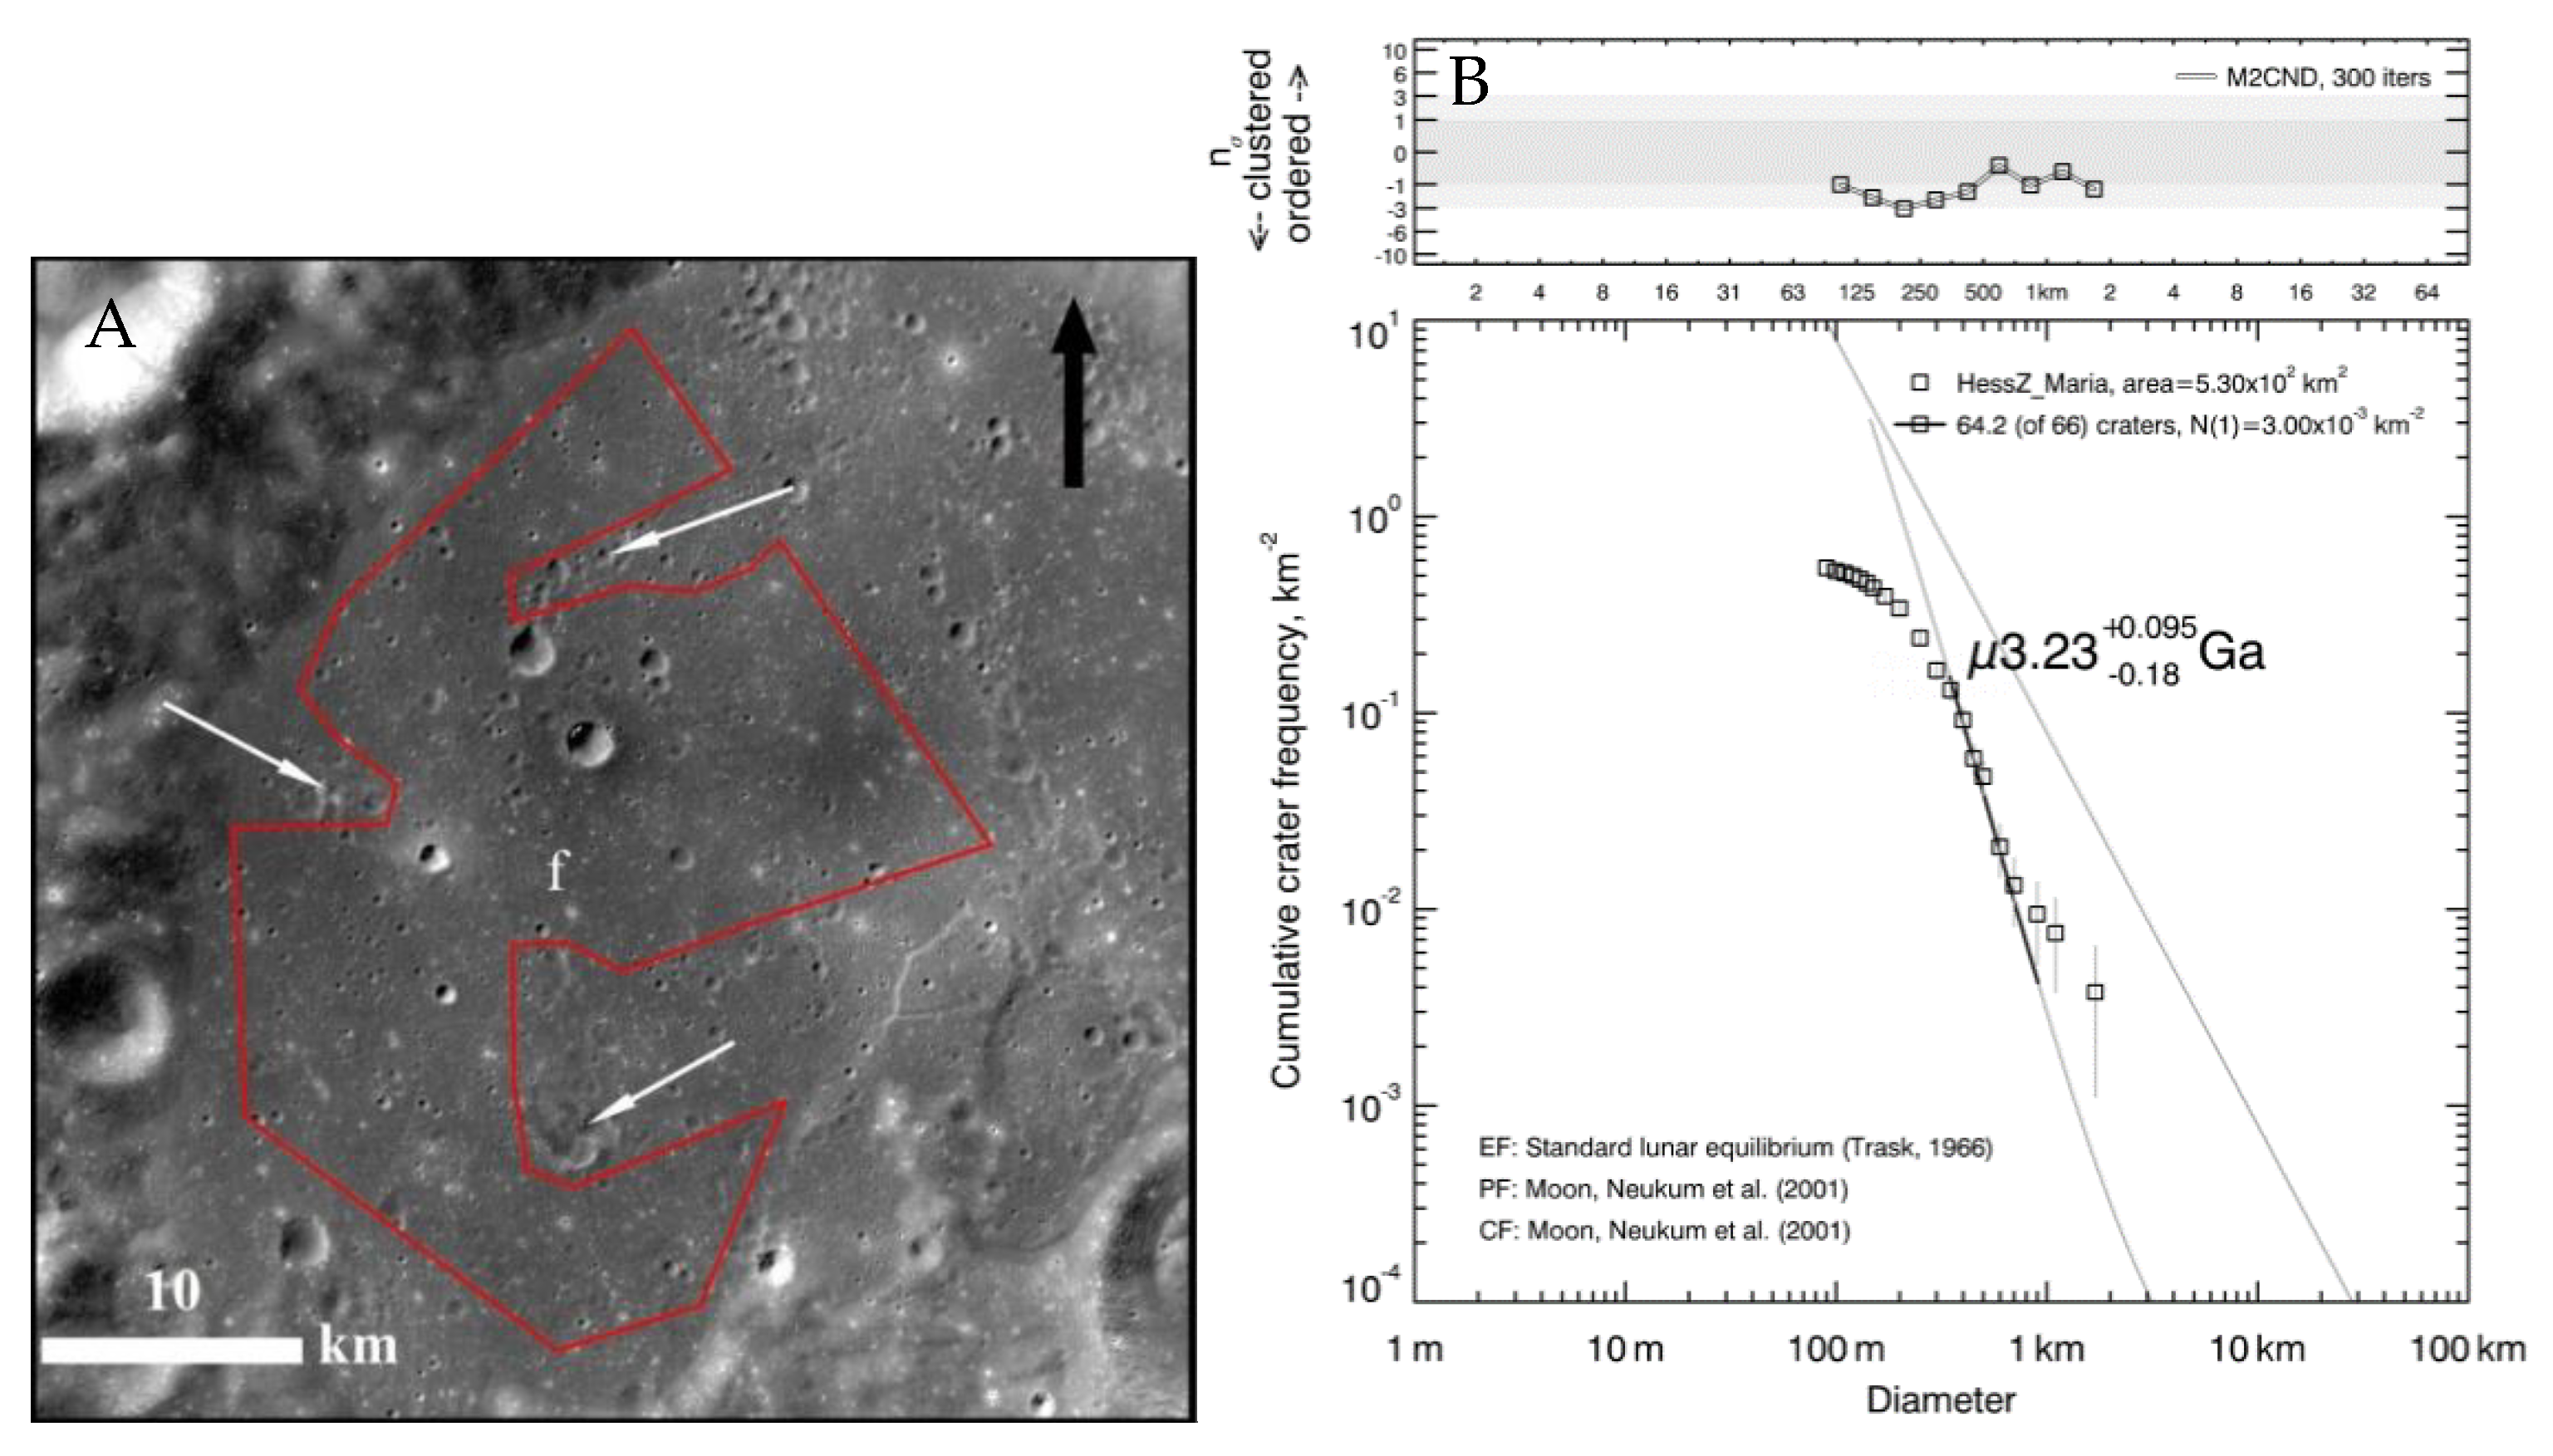
Figure 6 shows the mapped basalt unit (counting area is 530 km2) and the derived AMA in Hess Z crater. The southeastern part of the Hess Z crater rim was destroyed by the ejecta from the Hess crater nearby, which was superposed by the basalt herein. There are several clustered secondaries in the eastern floor of the Hess Z crater, which are deliberately avoided when map the countering area. The mapped basalt unit is relatively flat, although the topography is gradually lowered from east to west.
3.4. Maria Basalt Unit in Davisson Crater
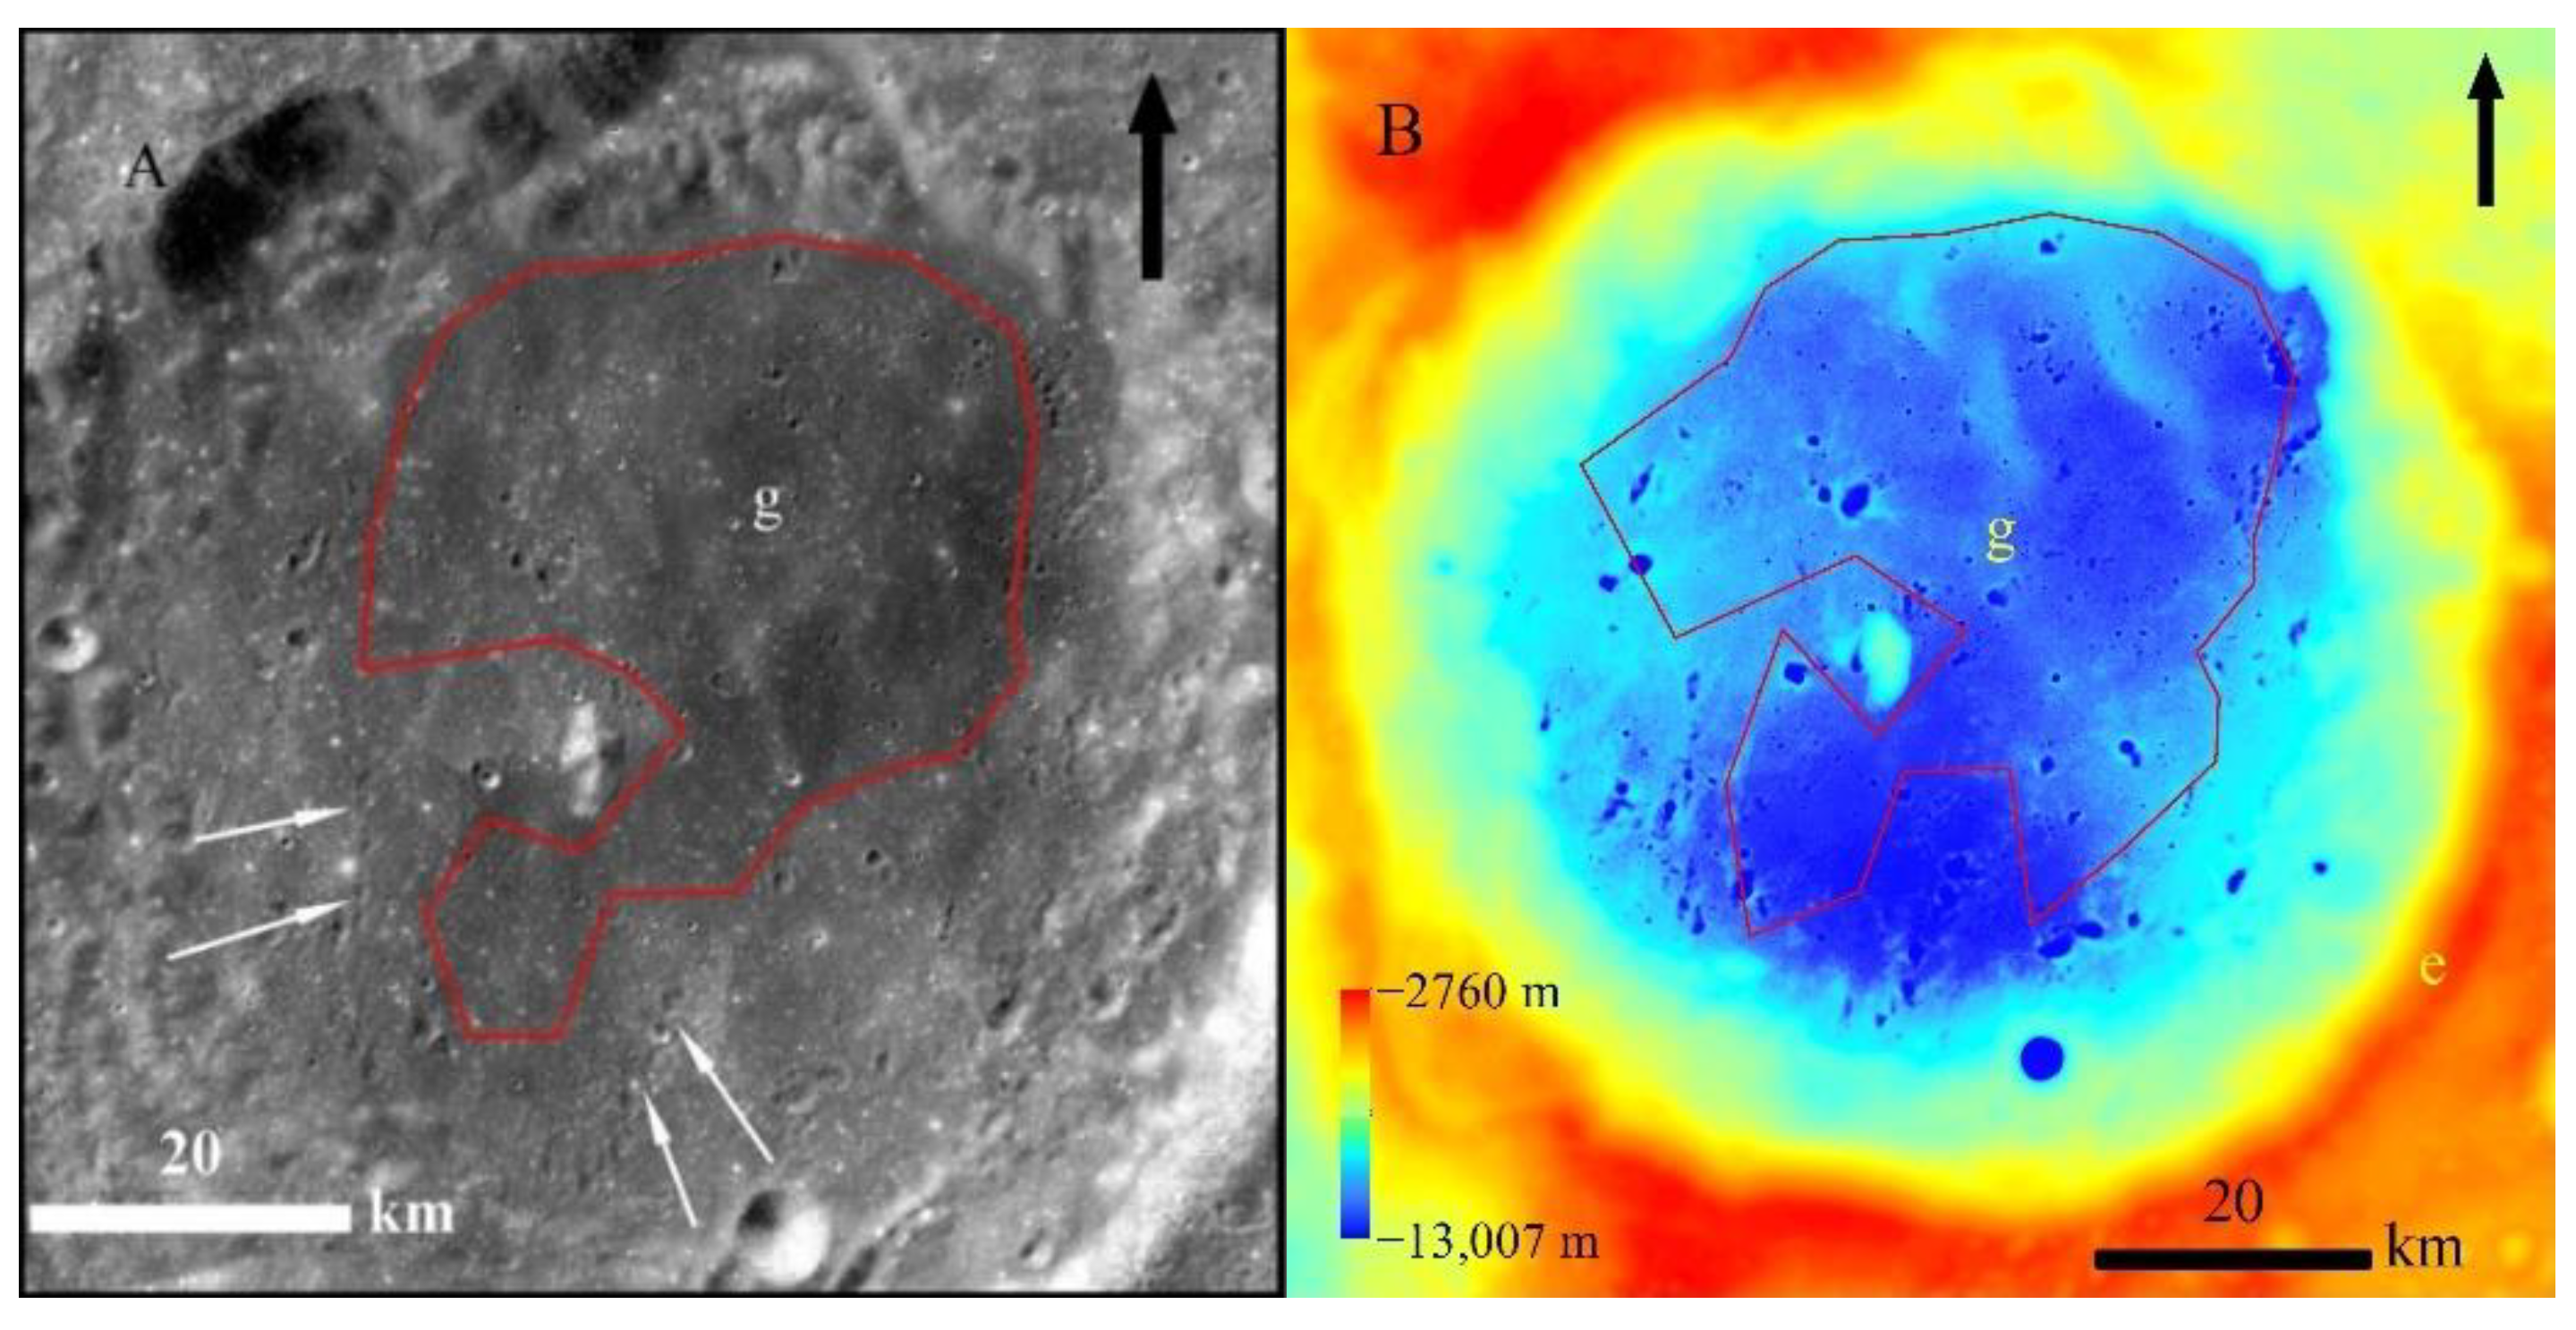
Most of the floor of Davisson crater is covered by basalt, as indicated by the high FeO content (Figure 7C). A central peak protrudes above the floor and several chained ejecta are distributed in the southeastern of the crater floor. They are deliberately excluded when mapping the counting area (Figure 7A). The mapped basalt unit is relatively flat, and it is lowest in the southern part of the floor (Figure 7B).
The CSFD measurement of the mare unit in Davisson crater shows an AMA of 3.27 Ga (Figure 8). For the craters used for dating, the MC2ND of the mapped craters falls within ±3σ of the expectation value derived from Monte Carlo simulation, indicating mapped craters in the counting area are random in spatial distribution.
3.5. Maria Basalt Units in Leibnitz and Leibnitz X Crater
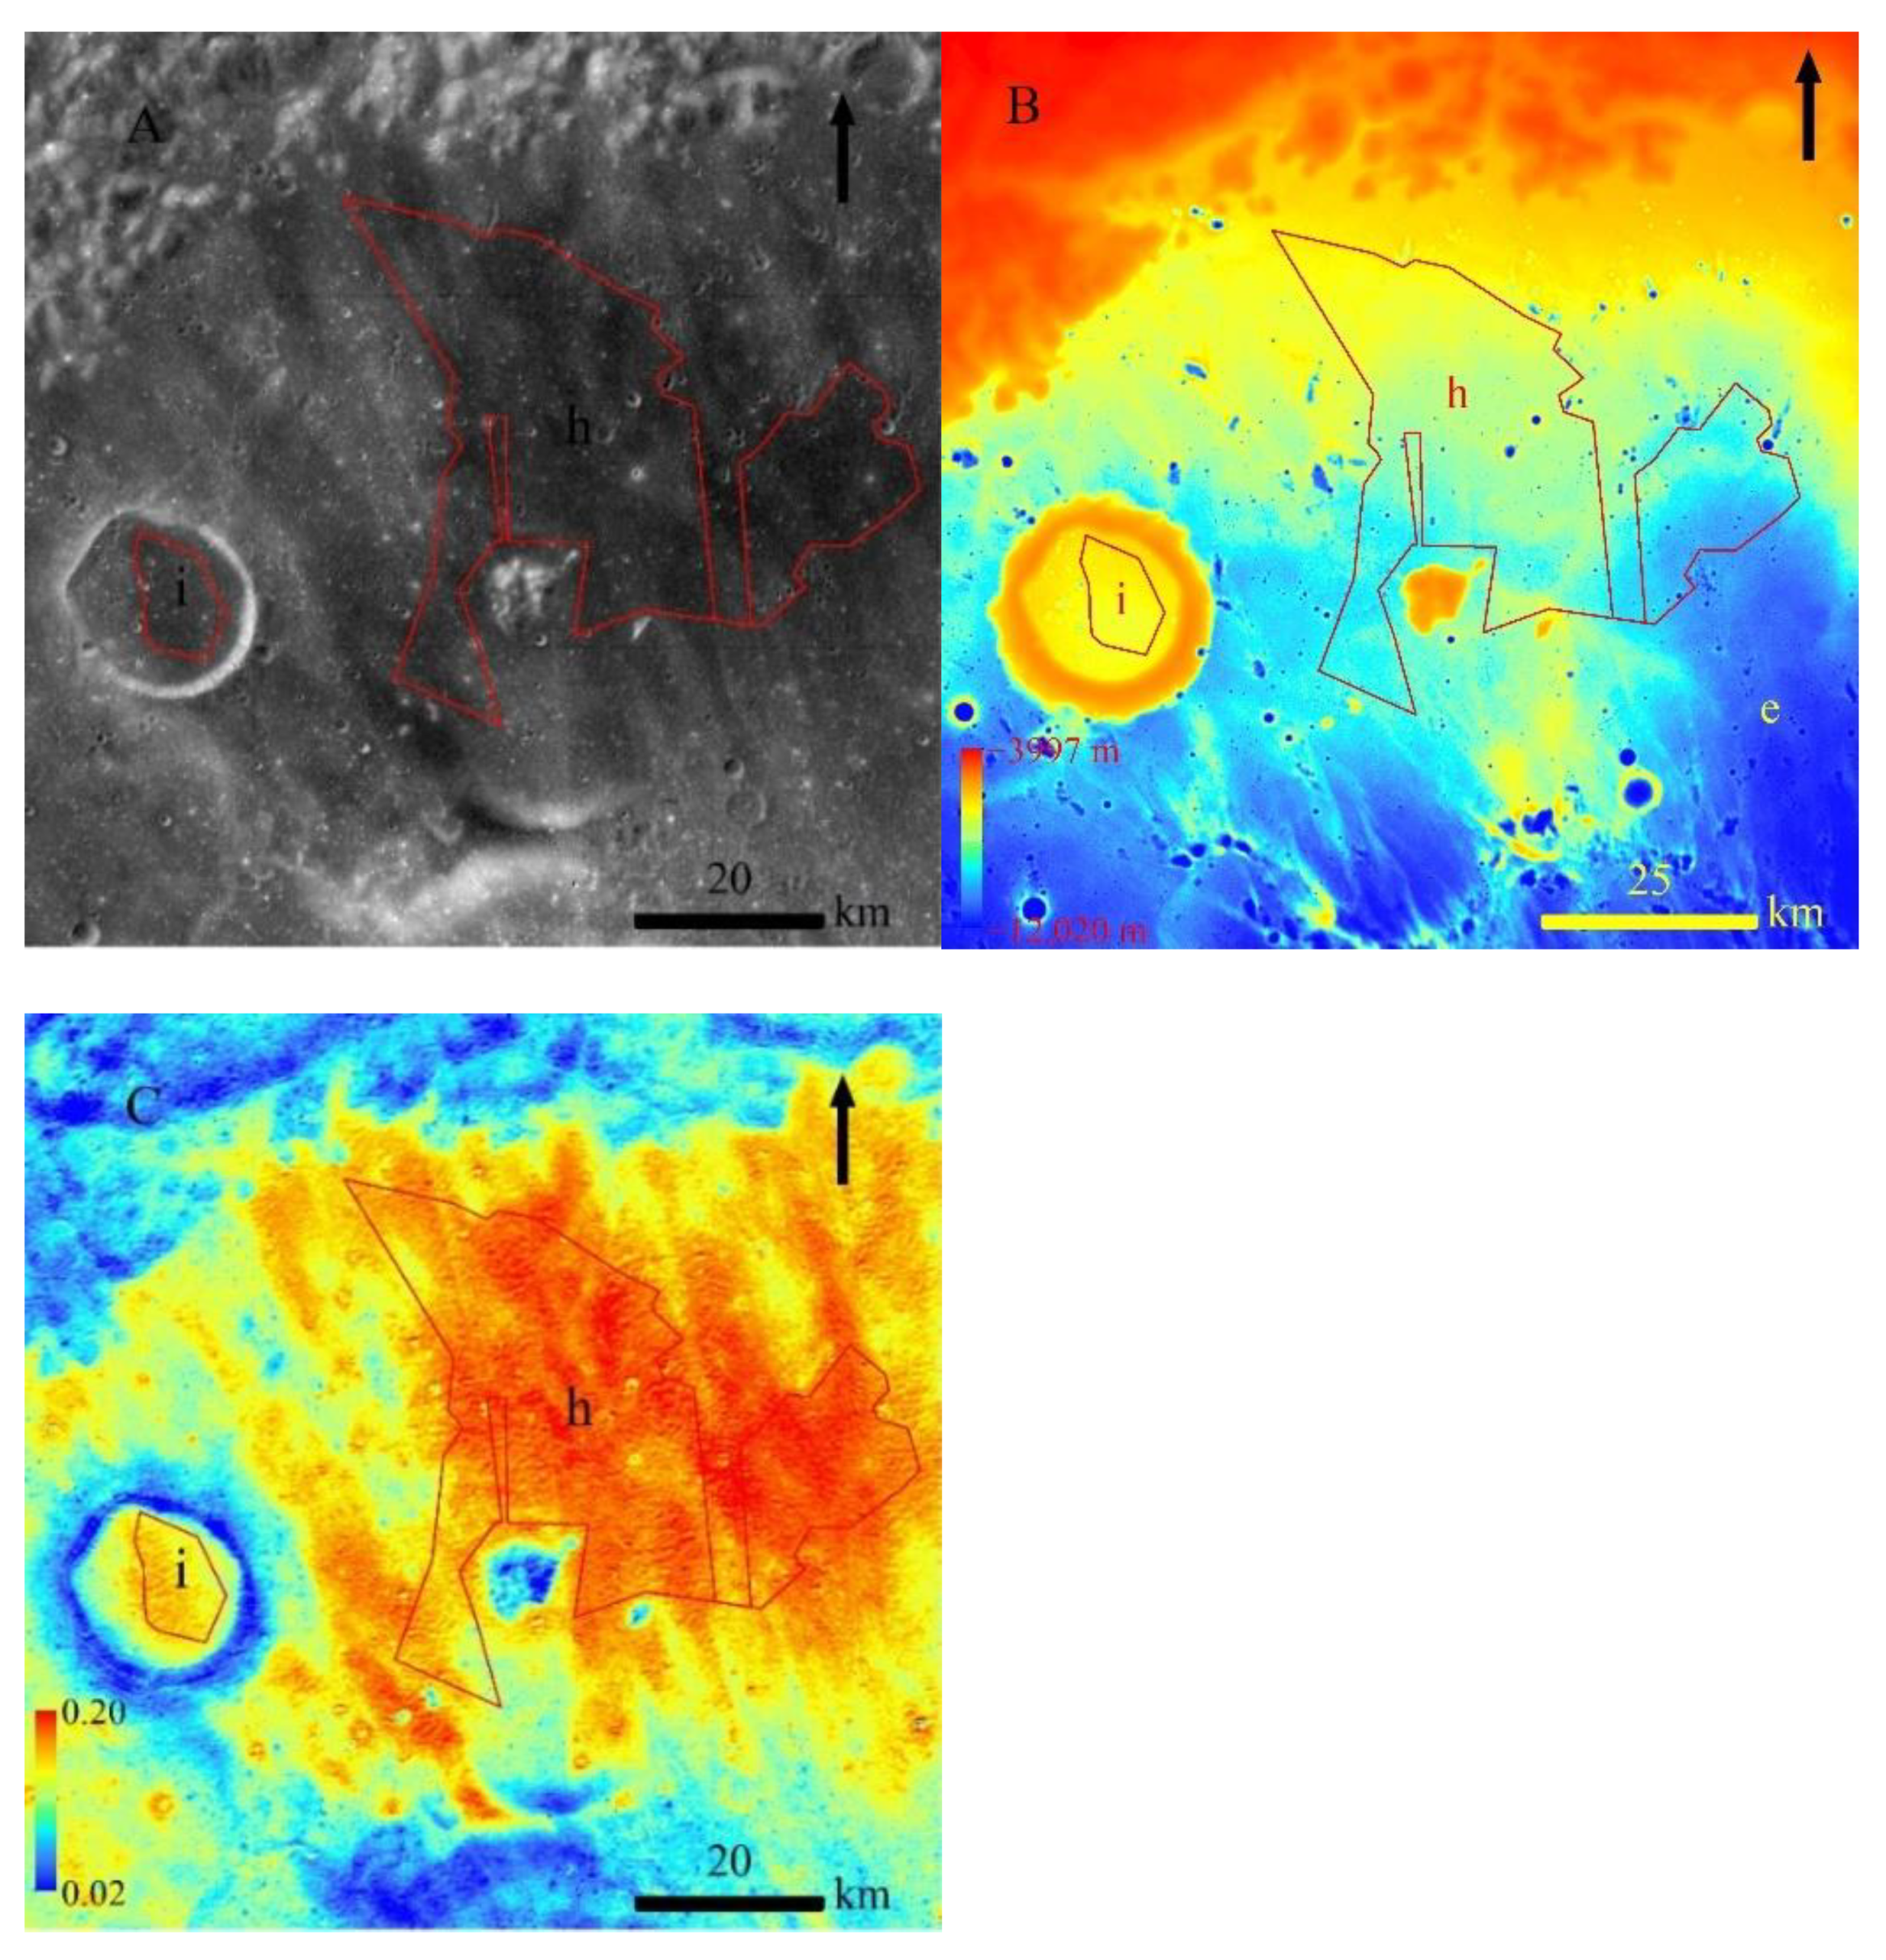
The southeast part of the Leibnitz crater is superposed by the ejecta from Finsen crater (Figure 1), and a large amount of linear ejecta are distributed in the floor of Leibnitz crater (Figure 9A). Thus, we carefully selected a small area in the north part of the crater floor as the counting area, which is covered by basalts as proven by the much higher FeO content than surrounding ejecta (Figure 9C). It is interesting to note that the north part is higher than the south part in the floor of Leibnitz crater (Figure 9B), although the ejecta is from south.
Leibnitz X crater is in the northwest of Leibnitz crater floor, and the floor of Leibnitz X crater can be divided into two parts according to the brightness difference (Figure 9A). We selected the east part of the floor as the counting area, which also has a higher FeO content than the west part (Figure 9C). The selected counting area seems unaffected by the linear ejecta from the Finsen crater. It is more interesting to note that the whole Leibnitz X crater, including its floor, is much higher than the surrounding terrains (Figure 9B). In addition, the FeO content of the maria in the counting area for Leibnitz X crater (Figure 9C) is lower than that for Leibnitz crater, indicating they are probably from different sources.
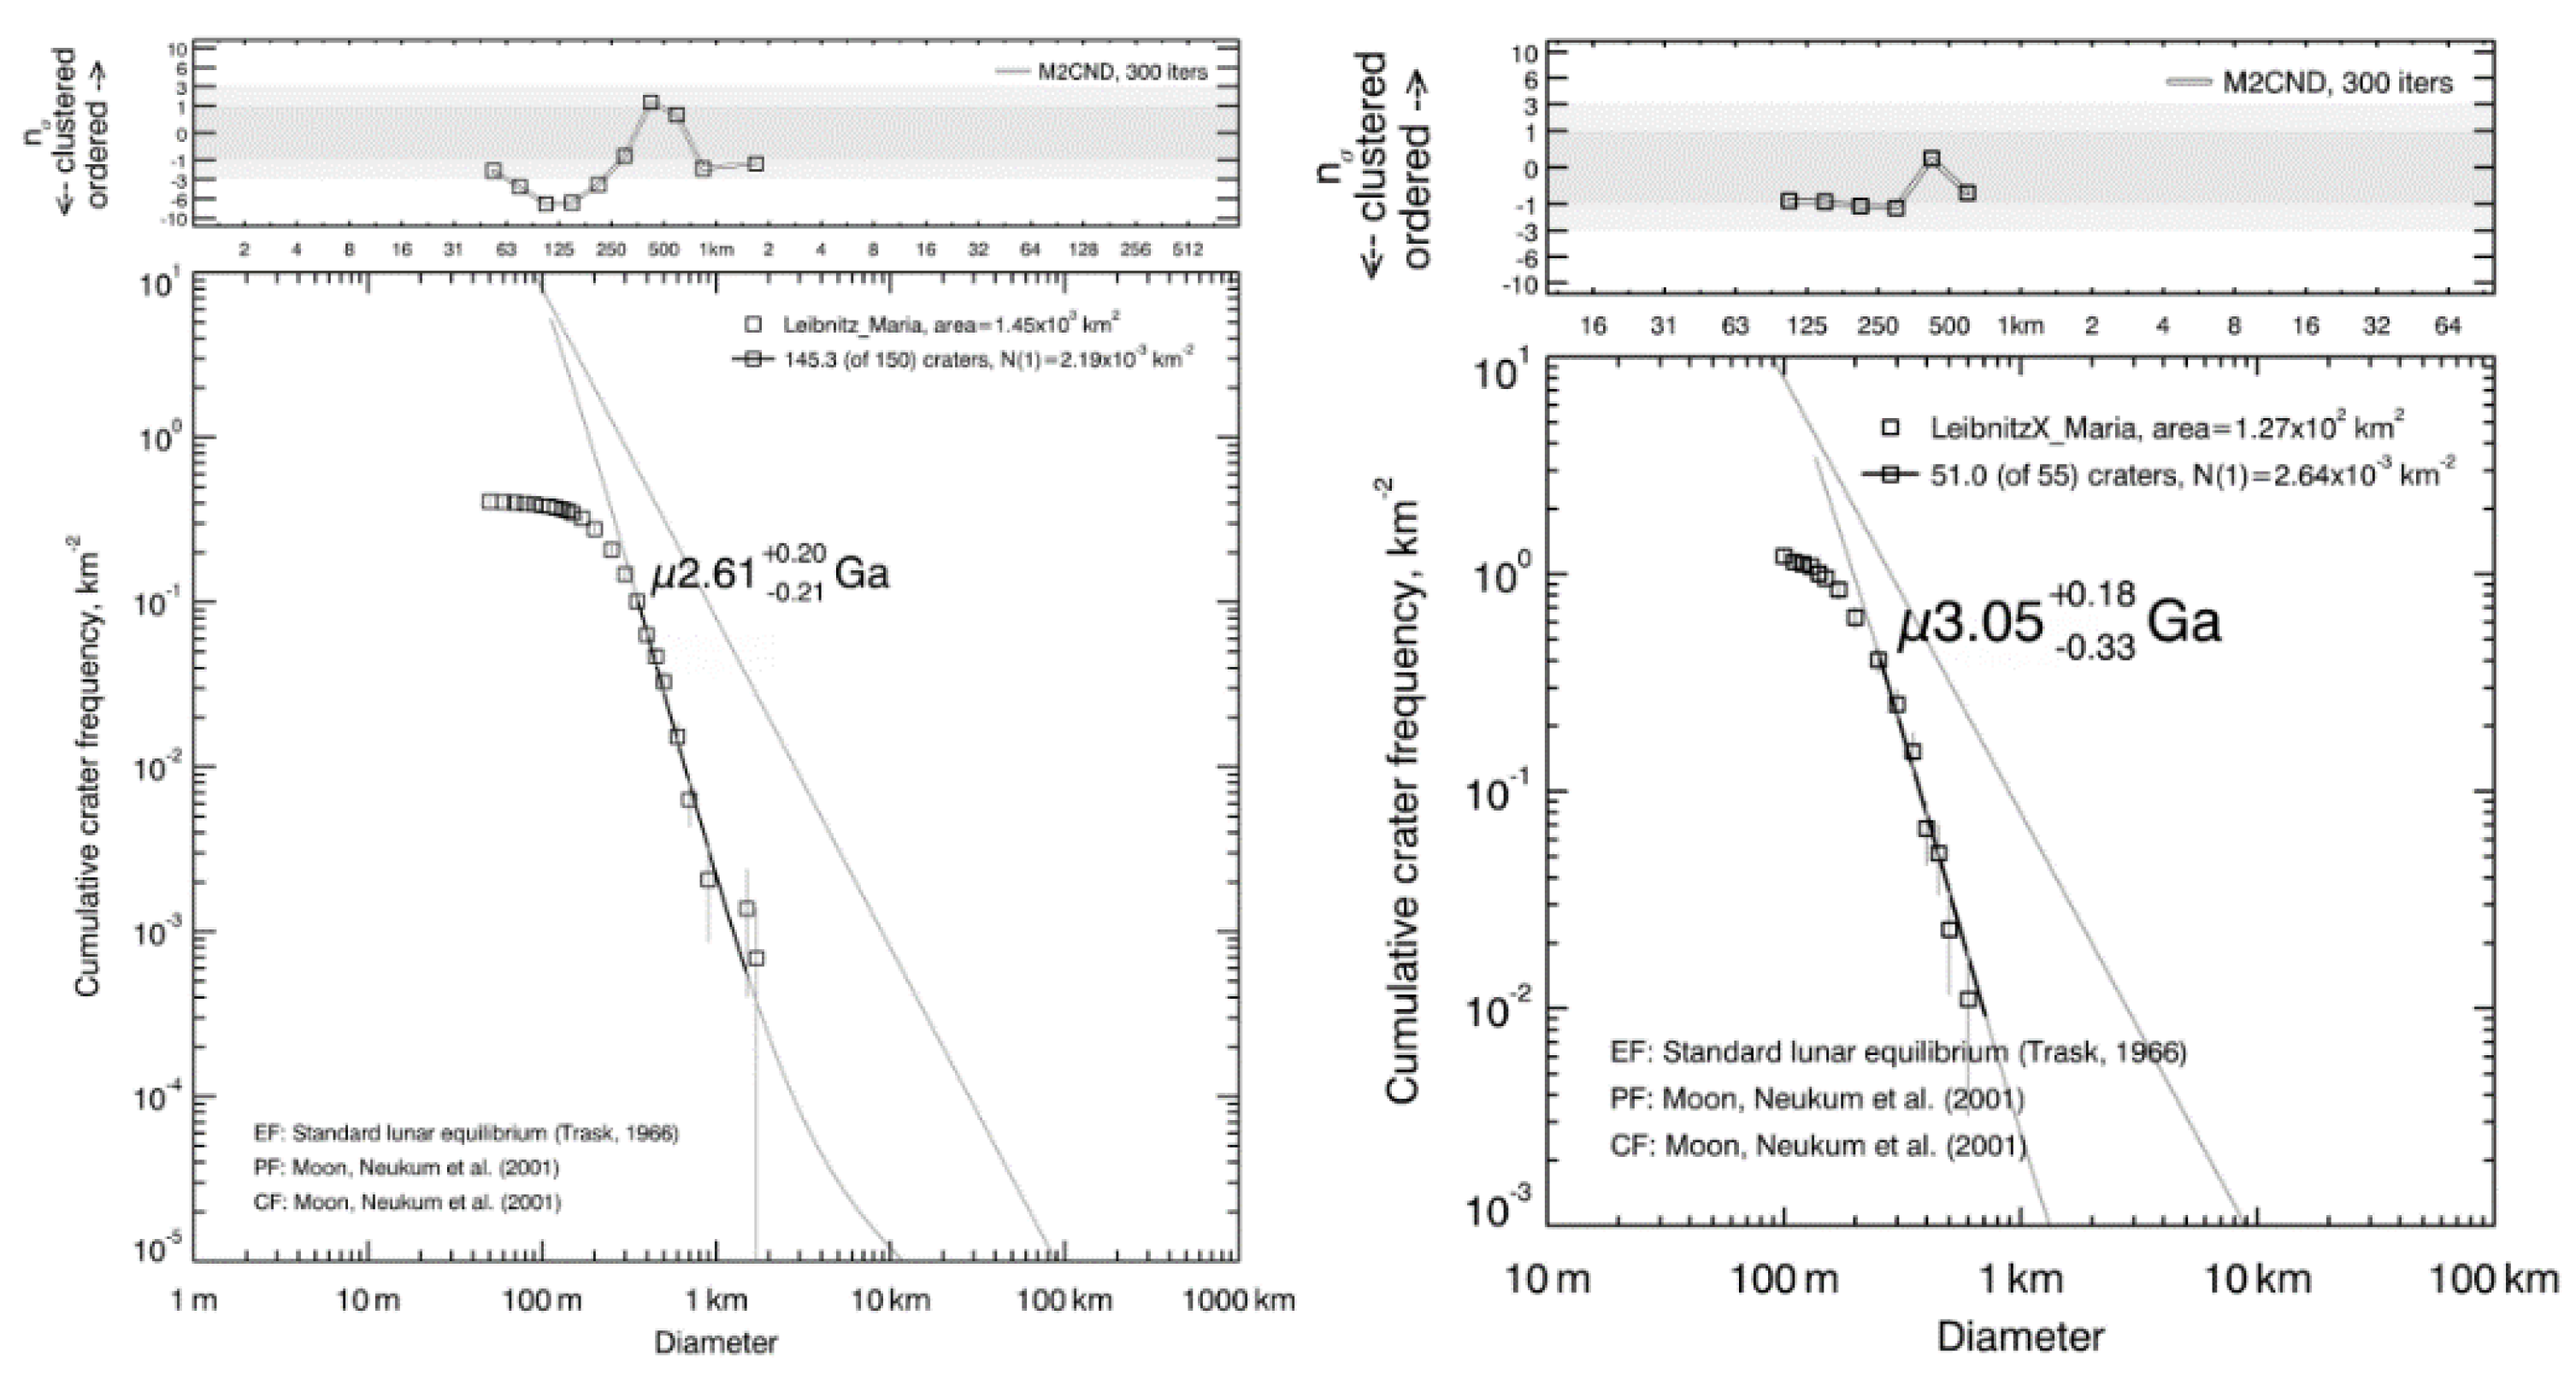
The CSFD measurements of the mare units in Leibnitz and Leibnitz X craters show AMAs of 2.61 Ga and 3.05 Ga (Figure 10). For the basalt unit in Leibnitz crater (i.e., unit ‘h’ in Figure 9), the random analysis is about −6σ of the expectation value at the diameter of 144 m, and the random analysis results for D >= ~400 m are within ±3σ of the expectation value. Therefore, this again does not affect the reliability of our dating results, as the minimum diameter for fitting the isochron line is at ~400 m. For all the counted craters in the mare unit in Leibnitz X crater (i.e., unit ‘i’ in Figure 9), the spatial randomness and clustering analysis result of the mapped craters falls within ±3σ of the expectation value derived from Monte Carlo simulation. It is obvious that the basalt unit in Leibnitz X crater is older than that in Leibnitz crater. Given this, coupled with the difference in FeO content, it is reasonable to conclude that they formed in two episodes of basalt formation.
3.6. Overview for AMAs of Basalt Units Surrounding CE-4 Landing Site
Table 1 lists all the derived AMAs for the basalt units mapped in this study, and the N(1), i.e., the number of craters with a diameter larger than or equal to 1 km per km2, derived by fitting a polynomial proposed in [36] to observed CSFDs, is also included for convenient comparison with other studies. The youngest basalt unit (i.e., unit ‘e’) is in the Von Kármán M crater, and unit ‘d’ in Von Kármán M crater is the second youngest among the studied basalt units. This perhaps certificates that the basalt inside Von Kármán M crater formed later than that in other places in the study region. Basalt unit ‘h’ in Leibnitz crater floor is the third youngest among the basalt units, and they are the only three basalt units younger than 3.0 Ga in this study. The oldest basalt unit ‘a’ is in the Von Kármán crater floor, which has an AMA of 3.42 Ga, and the three basalt units in the Von Kármán crater floor are the three oldest in this study. The similarity of the derived AMAs of the three basalt units inside Von Kármán crater indicates that the basalt should be first emplaced in the Von Kármán crater floor in this area. The second oldest basalt unit is in Davisson crater floor, and the above four basalt units belong to the Late Imbrian while others belong to Eratosthenian, according to [26].
4. Discussion
4.1. Comparison with Previous Studies
Table 1 also lists the dating results in previous studies. For the maria in Von Kármán crater, the dated AMAs range from 3.34 to 3.42 Ga for the three counting areas mapped in our research. The results are similar to the previous results (3.26 Ga for [26]; 3.35 Ga for [20]; 3.6 Ga for [7]; 3.15 Ga for [21]). Thus, we have much confidence to analyze the data returned by CE-4 rover, which is now traversing to this area. For the results of maria in Hess Z crater, there is also not too much difference (0.28 Ga) [21,26]. However, there is slight difference of 0.63 Ga in the case of Leibnitz X crater, and large differences of ~1.0 Ga [20,21,26] in the cases of Von Kármán M crater and Leibnitz crater. For the AMA difference between this research and that of [21], given similar counting areas are mapped, the possible reason might be different imagery data used. In our study, the CE-2 DOM mosaic at a resolution of 7 m/pixel was used, while the wide angle camera (WAC) images (~100 m/pixel) from the Lunar Reconnaissance Orbiter (LRO) were used in [21]. In fact, ref. [21] also found that their dating AMAs based on the WAC images are indeed much older than those based on narrow angle camera (NAC) images (~1 m/pixel) from the LRO for the maria basalts in Antoniadi crater. For the difference of the derived AMAs between this research and that of [20], given similar image resolution used in the two studies, the most probable reason is the different locations and sizes of the counting areas. We cannot find the counting area of [20]. However, ref. [20] usually mapped the basalt in the floor of Von Kármán M crater and Leibnitz crater as one unit. If the basalt was formed through different episodes, this is unsuitable. In addition, we obtained the AMA of the maria in the floor of Davisson crater for the first time.
In early geological mapping [26], most mare deposits within SPA were mapped as late Imbrian. Ref. [20] first showed that some mare deposits in the lunar farside may have much younger ages up to Eratosthenian. Ref. [37] also proposed that the lunar farside was volcanically active for nearly as long as the lunar nearside. Our dating results surrounding the CE-4 landing area support this conclusion and indicate that small-scale lunar farside volcanism might have continued longer than previously thought.
4.2. Implications for CE-4 Mission
The dating results for the maria basalts inside Von Kármán crater are significant to the interpretation of CE-4 data. It is interesting to note that AMAs of the three basalt units are very similar, indicating that the basalts in Von Kármán crater were formed within a short period. CE-4 landed on linear impact ejecta (Figure 1 and Figure 2), and Finsen crater was the major source [7,9,10,11,34]. The thickness of the ejecta might be several tens of meters in the landing area [10,11,34,38]. However, the ejecta here appear linear and are not continuous [34], and CE-4 rover may probably happen to encounter local mare basalt when it traverses westward, especially around new craters (e.g., Zhinyu crater) which can excavate subsurface material [39]. If CE-4 rover will traverse the exposed mare basalt in future, the dating results of the mare basalt inside the Von Kármán crater can provide information for analyzing the lunar regolith evolution and crater degradation, combing the spectral data and lunar ground penetrating radar data. For example, according to the data collected by the ground-penetrating radar onboard the CE-4 rover, several mare basalt layers were interpreted by [10,11]. The ejecta from Zhinyu crater also reveal at least three episodes of the basalt eruption [39], and the dating results can help to provide chronological information.
The dating results for other mare basalt is also useful in relevant studies. For example, through spatial density investigation and randomness analysis, ref. [40] pointed out that secondary craters cover at least one third of the 2.4° × 1° area surrounding CE-4 landing site. Therefore, it is very likely that CE-4 rover would encounter the fragments from the mare basalts inside Von Kármán crater dated in the manuscript, and the results in the research can provide geological context to these fragments. For example, the compositions of the fragments can be analyzed by the CE-4 rover, and their sources can thus be determined by comparing the compositions with the dated mare basalts, whose formation times have been constrained in this study.
5. Conclusions
In this research, we dated the AMAs of nine basalt measurement areas surrounding the CE-4 landing area using the crater counting method, including the mare deposits in Von Kármán, Von Kármán M, Hess Z, Davisson, Leibnitz, and Leibnitz X craters. Our results indicate that the youngest mare deposit is in the floor of Von Kármán M crater with AMAs of 2.28 Ga and 2.36 Ga. This research provides both systematic information on the history of the basalt in the region and constraints for the interpretation of the in situ measured data from the CE-4 rover. The results point to a much longer-lived volcanism in the region than was previously thought (e.g., ref. [26] proposed that most mare deposits in the SPA basin were formed during the late Imbrian epoch, i.e., 3.85–3.8 Ga.), which is also beneficial to the understanding of the evolution of lunar volcanism globally. We suggest that CE-4 rover may return data on local genetic basalts while it keeps moving westward, which will contribute to our understanding of basalt formation in the lunar farside.
Author Contributions
Conceptualization, Z.Y., K.D. and S.G.; methodology, Z.Y. and K.S.; software, Z.Y. and G.M.; investigation, Z.Y., K.S., S.G. and J.L.; data curation, S.N. and S.G.; writing—original draft preparation, Z.Y. and S.G.; writing—review and editing, Z.Y., G.M. and K.D.; funding acquisition, Z.Y., K.D., J.L. and S.G. All authors have read and agreed to the published version of the manuscript.
Funding
This research was supported by the Strategic Priority Research Program of Chinese Academy of Sciences (grant No. XDB41000000) and National Natural Science Foundation of China (grant Nos. 41972321 and 41941003), Macao Young Scholars Program (grant No. AM201902).
Institutional Review Board Statement
Not applicable.
Informed Consent Statement
Not applicable.
Data Availability Statement
All the mapped counting areas and craters are available as shapefiles in the Supporting Online Material.
Acknowledgments
The authors gratefully acknowledge China’s Lunar Exploration Program at National Astronomical Observatories of Chinese Academy of Sciences for providing CE-2 DOM data (http://moon.bao.ac.cn, accessed on 15 November 2021).
Conflicts of Interest
The authors declare no conflict of interest.
References
- Wu, W.; Li, C.; Zuo, W.; Zhang, H.; Liu, J.; Wen, W.; Su, Y.; Ren, X.; Yan, J.; Yu, D.; et al. Lunar farside to be explored by Chang’e-4. Nat. Geosci. 2019, 12, 222–223. [Google Scholar] [CrossRef]
- Di, K.; Liu, Z.; Liu, B.; Wan, W.; Peng, M.; Wang, Y.; Gou, S.; Yue, Z.; Xin, X.; Jia, M.; et al. Chang’e-4 lander localization based on multi-source data. J. Remote Sens. 2019, 23, 177–184. [Google Scholar] [CrossRef]
- Garrick-Bethell, I.; Zuber, M.T. Elliptical structure of the lunar South Pole-Aitken basin. Icarus 2009, 204, 399–408. [Google Scholar] [CrossRef]
- Jolliff, B.L.; Gillis, J.J.; Haskin, L.A.; Korotev, R.L.; Wieczorek, M.A. Major lunar crustal terranes: Surface expressions and crust-mantle origins. J. Geophys. Res. Planets 2000, 105, 4197–4216. [Google Scholar] [CrossRef] [Green Version]
- Melosh, H.J.; Kendall, J.; Horgan, B.; Johnson, B.C.; Bowling, T.; Lucey, P.G.; Taylor, G.J. South Pole–Aitken basin ejecta reveal the Moon’s upper mantle. Geology 2017, 45, 1063–1066. [Google Scholar] [CrossRef]
- Moriarty, D.P., III; Pieters, C.M. The Character of South Pole-Aitken Basin: Patterns of Surface and Subsurface Composition. J. Geophys. Res. Planets 2018, 123, 729–747. [Google Scholar] [CrossRef]
- Huang, J.; Xiao, Z.; Flahaut, J.; Martinot, M.; Head, J.; Xiao, X.; Xie, M.; Xiao, L. Geological Characteristics of Von Kármán Crater, Northwestern South Pole-Aitken Basin: Chang’E-4 Landing Site Region. J. Geophys. Res. Planets 2018, 123, 1684–1700. [Google Scholar] [CrossRef] [Green Version]
- Li, C.; Liu, D.; Liu, B.; Ren, X.; Liu, J.; He, Z.; Zuo, W.; Zeng, X.; Xu, R.; Tan, X.; et al. Chang’E-4 initial spectroscopic identification of lunar far-side mantle-derived materials. Nature 2019, 569, 378–382. [Google Scholar] [CrossRef]
- Gou, S.; Di, K.; Yue, Z.; Liu, Z.; He, Z.; Xu, R.; Lin, H.; Liu, B.; Peng, M.; Wan, W.; et al. Lunar deep materials observed by Chang’e-4 rover. Earth Planet. Sci. Lett. 2019, 528, 115829. [Google Scholar] [CrossRef]
- Zhang, J.; Zhou, B.; Lin, Y.; Zhu, M.-H.; Song, H.; Dong, Z.; Gao, Y.; Di, K.; Yang, W.; Lin, H.; et al. Lunar regolith and substructure at Chang’E-4 landing site in South Pole–Aitken basin. Nat. Astron. 2021, 5, 25–30. [Google Scholar] [CrossRef]
- Lai, J.; Xu, Y.; Bugiolacchi, R.; Meng, X.; Xiao, L.; Xie, M.; Liu, B.; Di, K.; Zhang, X.; Zhou, B.; et al. First look by the Yutu-2 rover at the deep subsurface structure at the lunar farside. Nat. Commun. 2020, 11, 3426. [Google Scholar] [CrossRef]
- Zhang, L.; Li, J.; Zeng, Z.; Xu, Y.; Liu, C.; Chen, S. Stratigraphy of the Von Kármán Crater Based on Chang’E-4 Lunar Penetrating Radar Data. Geophys. Res. Lett. 2020, 47, e2020GL088680. [Google Scholar] [CrossRef]
- Lin, H.; Xu, R.; Yang, W.; Lin, Y.; Wei, Y.; Hu, S.; He, Z.; Qiao, L.; Wan, W. In Situ Photometric Experiment of Lunar Regolith With Visible and Near-Infrared Imaging Spectrometer On Board the Yutu-2 Lunar Rover. J. Geophys. Res. Planets 2020, 125, e2019JE006076. [Google Scholar] [CrossRef]
- Stöffler, D.; Ryder, G.; Ivanov, B.A.; Artemieva, N.A.; Cintala, M.J.; Grieve, R.A.F. Cratering History and Lunar Chronology. Rev. Mineral. Geochem. 2006, 60, 519–596. [Google Scholar] [CrossRef]
- Neukum, G. Meteoriten Bombardement und Datierung Planetarer Oberflächen. Habilitation Dissertation, University of Munich, Munich, Germany, 1983. [Google Scholar]
- Stöffler, D.; Ryder, G. Stratigraphy and Isotope Ages of Lunar Geologic Units: Chronological Standard for the Inner Solar System. Space Sci. Rev. 2001, 96, 9–54. [Google Scholar] [CrossRef]
- Hiesinger, H.; Jaumann, R.; Neukum, G.; Head, J.W., III. Ages of mare basalts on the lunar nearside. J. Geophys. Res. Planets 2000, 105, 29239–29275. [Google Scholar] [CrossRef]
- Hiesinger, H.; Head, J.; Wolf, U.; Jaumann, R.; Neukum, G. Ages and stratigraphy of mare basalts in Oceanus Procellarum, Mare Nubium, Mare Cognitum, and Mare Insularum. J. Geophys. Res. Planets 2003, 108, 5065. [Google Scholar] [CrossRef] [Green Version]
- Hiesinger, H.; Head, J.W., III; Wolf, U.; Jaumann, R.; Neukum, G. Ages and stratigraphy of lunar mare basalts in Mare Frigoris and other nearside maria based on crater size-frequency distribution measurements. J. Geophys. Res. Planets 2010, 115, E03003. [Google Scholar] [CrossRef] [Green Version]
- Haruyama, J.; Ohtake, M.; Matsunaga, T.; Morota, T.; Honda, C.; Yokota, Y.; Abe, M.; Ogawa, Y.; Miyamoto, H.; Iwasaki, A.; et al. Long-Lived Volcanism on the Lunar Farside Revealed by SELENE Terrain Camera. Science 2009, 323, 905–908. [Google Scholar] [CrossRef] [Green Version]
- Pasckert, J.H.; Hiesinger, H.; van der Bogert, C.H. Lunar farside volcanism in and around the South Pole–Aitken basin. Icarus 2018, 299, 538–562. [Google Scholar] [CrossRef]
- Zuo, W.; Li, C.; Zhang, Z. Scientific data and their release of Chang’E-1 and Chang’E-2. Chin. J. Geochem. 2014, 33, 24–44. [Google Scholar] [CrossRef]
- Barker, M.K.; Mazarico, E.; Neumann, G.A.; Zuber, M.T.; Haruyama, J.; Smith, D.E. A new lunar digital elevation model from the Lunar Orbiter Laser Altimeter and SELENE Terrain Camera. Icarus 2016, 273, 346–355. [Google Scholar] [CrossRef] [Green Version]
- Lemelin, M.; Lucey, P.G.; Gaddis, L.R.; Hare, T.; Ohtake, M. Global map products from the Kaguya Multiband Imager at 512 ppd: Minerals, FeO and OMAT. In Proceedings of the 47th Lunar and Planetary Science Conference, The Woodlands, TX, USA, 21–25 March 2016; p. 2994. [Google Scholar]
- Michael, G.G.; Neukum, G. Planetary surface dating from crater size–frequency distribution measurements: Partial resurfacing events and statistical age uncertainty. Earth Planet. Sci. Lett. 2010, 294, 223–229. [Google Scholar] [CrossRef]
- Wilhelms, D.E.; McCauley, J.F.; Trask, N.J. The Geologic History of the Moon; U.S. Geological Survey Professional Paper 1348; U.S. Geological Survey: Denver, CO, USA, 1987. [Google Scholar] [CrossRef] [Green Version]
- Nelson, D.; Koeber, S.; Daud, K.; Robinson, M.; Watters, T.; Banks, M.; Williams, N. Mapping Lunar Maria Extents and Lobate Scarps Using LROC Image Products. In Proceedings of the 45th Lunar and Planetary Science Conference, The Woodlands, TX, USA, 17–21 March 2014; p. 2861. [Google Scholar]
- Ivanov, M.A.; Hiesinger, H.; van der Bogert, C.H.; Orgel, C.; Pasckert, J.H.; Head, J.W. Geologic History of the Northern Portion of the South Pole-Aitken Basin on the Moon. J. Geophys. Res. Planets 2018, 123, 2585–2612. [Google Scholar] [CrossRef]
- Kneissl, T.; van Gasselt, S.; Neukum, G. Map-projection-independent crater size-frequency determination in GIS environments—New software tool for ArcGIS. Planet. Space Sci. 2011, 59, 1243–1254. [Google Scholar] [CrossRef]
- Yue, Z.; Di, K.; Liu, Z.; Michael, G.; Jia, M.; Xin, X.; Liu, B.; Peng, M.; Liu, J. Lunar regolith thickness deduced from concentric craters in the CE-5 landing area. Icarus 2019, 329, 46–54. [Google Scholar] [CrossRef]
- McEwen, A.S.; Bierhaus, E.B. The Importance of Secondary Cratering to Age Constraints on Planetary Surfaces. Annu. Rev. Earth Planet. Sci. 2006, 34, 535–567. [Google Scholar] [CrossRef] [Green Version]
- Michael, G.G.; Platz, T.; Kneissl, T.; Schmedemann, N. Planetary surface dating from crater size–frequency distribution measurements: Spatial randomness and clustering. Icarus 2012, 218, 169–177. [Google Scholar] [CrossRef]
- Stuart-Alexander, D.E. Geologic Map of the Central Far Side of the Moon; U.S. Geological Survey IMAP 1047; U.S. Geological Survey: Denver, CO, USA, 1978. [Google Scholar] [CrossRef]
- Di, K.; Zhu, M.-H.; Yue, Z.; Lin, Y.; Wan, W.; Liu, Z.; Gou, S.; Liu, B.; Peng, M.; Wang, Y.; et al. Topographic evolution of Von Kármán crater revealed by the lunar rover Yutu-2. Geophys. Res. Lett. 2019, 46, 12764–12770. [Google Scholar] [CrossRef]
- Trask, N.J. Size and spatial distribution of craters estimated from the ranger photographs. In Ranger VIII and IX, Part II-Experimenters’ Analyses and Interpretations; Technical Report No. 32-800; Jet Propulsion Laboratory, California Institute of Technology: Pasadena, CA, USA, 1966; pp. 252–263. [Google Scholar]
- Neukum, G.; Ivanov, B.A.; Hartmann, W.K. Cratering records in the inner solar system in relation to the lunar reference system. Space Sci. Rev. 2001, 96, 55–86. [Google Scholar] [CrossRef]
- Pasckert, J.H.; Hiesinger, H.; van der Bogert, C.H. Small-scale lunar farside volcanism. Icarus 2015, 257, 336–354. [Google Scholar] [CrossRef]
- Fu, X.-H.; Qiao, L.; Zhang, J.; Ling, Z.-C.; Li, B. The subsurface structure and stratigraphy of the Chang’E-4 landing site: Orbital evidence from small craters on the Von Kármán crater floor. Res. Astron. Astrophys. 2020, 20, 8. [Google Scholar] [CrossRef]
- Gou, S.; Yue, Z.; Di, K.; Bugiolacchi, R.; Zhu, M.-H.; Pinet, P.; Cai, Z. Mare basalt flooding events surrounding Chang’e-4 landing site as revealed by Zhinyu crater ejecta. Icarus 2021, 360, 114370. [Google Scholar] [CrossRef]
- Jia, M.; Di, K.; Yue, Z.; Liu, B.; Wan, W.; Niu, S.; Liu, J.; Cheng, W.; Lin, Y. Multi-scale morphologic investigation of craters in the Chang’e-4 landing area. Icarus 2021, 355, 114164. [Google Scholar] [CrossRef]
Figure 1.
Geographical context of the CE4 landing area. The central location is (177.07° E, 43.19° S). The basemap is Chang’e-2 (CE-2) Digital Orthophoto Map (DOM) mosaic. The crater names are from the International Astronomical Union data base (https://planetarynames.wr.usgs.gov/, accessed on 15 November 2021). North is up.

Figure 2.
Three basalt measurement areas mapped by red polygons in Von Kármán crater. (A) CE-2 DOM mosaic (central location: 175.6° E, 44.64° S) of the Von Kármán crater with CE-4 landing site labeled. The fresh crater pointed by the white arrow is Zhinyu crater. (B) Local topography shown in SLDEM; the elevation ranges from −13,413 m to −421 m as coded from blue to red in this figure. (C) FeO content map [24] in Von Kármán crater; the values range from 0 to 24.73% as coded from blue to red in this figure. (D) Basalt unit ‘a’ shown in CE-2 DOM mosaic, with the white arrows indicating the chained secondaries. The area is 138 km2. (E) Basalt unit ‘b’ is located in a topographical elevated terrain, and the elevation ranges from −11,990 m to −10,839 m as coded from blue to red in this figure. The area is 267 km2. (F) Basalt unit ‘c’ is located in a topographical elevated terrain, and the elevation ranges from −11,995 m to −6861 m as coded from blue to red in this figure. The red polygon in each sub-figure is the outlined representative crater count area. The area is 151 km2. North is up in all sub-figures.


Figure 3.
Dating results for basalt units in Von Kármán crater. VonKarman_Maria1, VonKarman_Maria2, and VonKarman_Maria3 correspond to the basalt units ‘a’, ‘b’, and ‘c’ in Figure 2, respectively. The equilibrium function is the standard lunar equilibrium of [35], while both the production and chronology functions are from [36].


Figure 4.
Two basalt measurement areas d (2320 km2) and e (59 km2) mapped by red polygons in Von Kármán M crater. (A) CE-2 DOM mosaic (central location: 173.6° E, 48.76° S) of the Von Kármán M crater. The raised massifs are indicated by the white arrows. (B) Local topography shown in SLDEM, and the elevation ranges from −11,632 m to −4906 m as coded from blue to red in this figure. (C) FeO content map [24] in Von Kármán M crater, and the maximum value is up to 22.28% as coded from blue to red in this figure. The red polygon in each sub-figure is the outlined representative crater count area. North is up in all sub-figures.


Figure 5.
Dating results for basalt units in Von Kármán M crater. VonKarmanM_Maria1 and VonKarmanM_Maria2 correspond to the basalt units ‘d’ and ‘e’ in Figure 4. The equilibrium function is the standard lunar equilibrium of [35], while both the production and chronology functions are from [36].

Figure 6.
(A) CE-2 DOM mosaic of the mapped basalt unit in Hess Z crater (530 km2) (central location: 173.49° E, 51.94° S); North is up. (B) derived AMA. The equilibrium function is the standard lunar equilibrium of [35], while both the production and chronology functions are from [36]. The red polygon in the left sub-figure is the outlined representative crater count area, and the arrows indicate the excluded secondary craters.

Figure 7.
(A) CE-2 DOM mosaic (central location: 174.88° W, 37.52° S) of the mapped basalt unit (1280 km2) in Davisson crater. The central peak and clustered secondaries (arrows) are excluded when map the counting area. (B) Local topography shown in SLDEM, and the elevation ranges from −13,007 m to −2760 m as coded from blue to red in this figure. (C) FeO content map [24] of the counting area, and the values range from 1.94% to 21.94% as coded from blue to red in this figure. The red polygon in each sub-figure is the outlined representative crater count area. North is up in all sub-figures.


Figure 8.
Dating results for basalt unit mapped in Figure 7. The equilibrium function is the standard lunar equilibrium of [35], while both the production and chronology functions are from [36].

Figure 9.
(A) CE-2 DOM mosaic (central location: 178.91° E, 36.23° S) of the mapped basalt units ‘h’ (1450 km2) and ‘i’ (127 km2) in Leibnitz and Leibnitz X craters. The central peak and clustered secondaries are excluded in the counting area. (B) Local topography shown in SLDEM, and the elevation ranges from −12,020 m to −3997 m as coded from blue to red in this figure. (C) FeO content map [24] of the counting areas, and the values range from 2.27% to 19.69% as coded from blue to red in this figure. The red polygons in each sub-figure are the outlined representative crater count areas. North is up in all sub-figures.

Figure 10.
Dating results for the basalt units mapped in Figure 9. Leibnitz_Maria and LeibnitzX_Maria correspond to the basalt units ‘h’ and ‘i’ in Figure 9. The equilibrium function is the standard lunar equilibrium of [35], while both the production and chronology functions are from [36].


Table 1.
Results of AMAs for the groups of basalt units in this study.
| Basalt Unit | Location | N(1) (×10−3 km−2) | AMAs (Ga) | |
|---|---|---|---|---|
| This Study | Previous Studies 1 | |||
| a | Von Kármán crater floor | 3.98 | 3.42 | 3.35 *; E–I †; 3.6 ‡; 3.15 #; |
| b | 3.44 | 3.34 | ||
| c | 3.43 | 3.34 | ||
| d | Von Kármán M crater floor | 1.98 | 2.36 | 3.38 ##; E–I †; 3.38 ** |
| e | 1.91 | 2.28 | 3.52 ##; E–I †; 3.38 ** | |
| f | Hess Z crater floor | 3.00 | 3.23 | E–I †; 3.51 ## |
| g | Davisson crater floor | 3.11 | 3.27 | - |
| h | Leibnitz crater floor | 2.19 | 2.61 | 3.37 ###; |
| i | Leibnitz X crater floor 1 | 2.64 | 3.05 | 3.68 ##; |
1 Ref. [20] used the crater chronology and production functions proposed by [15], ref. [7,21] used the crater chronology and production functions proposed by [36]; * ref. [20] in which the maria in Von Kármán crater floor is measured together; ** ref. [20] in which the maria in Von Kármán M crater floor is measured together; † ref. [26] E–I refers to near the Imbrian-Eratosthenian boundary, i.e., 3.26 Ga; ‡ ref. [7] in which the maria in Von Kármán crater floor is measured by combing three subareas, while subarea 2 is approximately the same to the basalt unit ‘a’ in this research; # ref. [21] in which the maria in Von Kármán crater floor is measured by combing two subareas, which contain the counting areas of basalt units ‘a’, ‘b’, and ‘c’ in this research; ## ref. [21] in which the counting areas are roughly equivalent to that in this research; ### ref. [21] in which the counting areas are much larger than that in our research.
Publisher’s Note: MDPI stays neutral with regard to jurisdictional claims in published maps and institutional affiliations. |
© 2021 by the authors. Licensee MDPI, Basel, Switzerland. This article is an open access article distributed under the terms and conditions of the Creative Commons Attribution (CC BY) license (https://creativecommons.org/licenses/by/4.0/).
Share and Cite
MDPI and ACS Style
Yue, Z.; Shi, K.; Michael, G.; Di, K.; Gou, S.; Liu, J.; Niu, S. Chronology of the Basalt Units Surrounding Chang’e-4 Landing Area. Remote Sens. 2022, 14, 49. https://0-doi-org.brum.beds.ac.uk/10.3390/rs14010049
AMA Style
Yue Z, Shi K, Michael G, Di K, Gou S, Liu J, Niu S. Chronology of the Basalt Units Surrounding Chang’e-4 Landing Area. Remote Sensing. 2022; 14(1):49. https://0-doi-org.brum.beds.ac.uk/10.3390/rs14010049
Chicago/Turabian StyleYue, Zongyu, Ke Shi, Gregory Michael, Kaichang Di, Sheng Gou, Jianzhong Liu, and Shengli Niu. 2022. "Chronology of the Basalt Units Surrounding Chang’e-4 Landing Area" Remote Sensing 14, no. 1: 49. https://0-doi-org.brum.beds.ac.uk/10.3390/rs14010049
Note that from the first issue of 2016, this journal uses article numbers instead of page numbers. See further details here.