
Multi-Sensors Remote Sensing Applications for Assessing, Monitoring, and Mapping NPK Content in Soil and Crops in African Agricultural Land

 , ,
, ,  and
and
Abstract
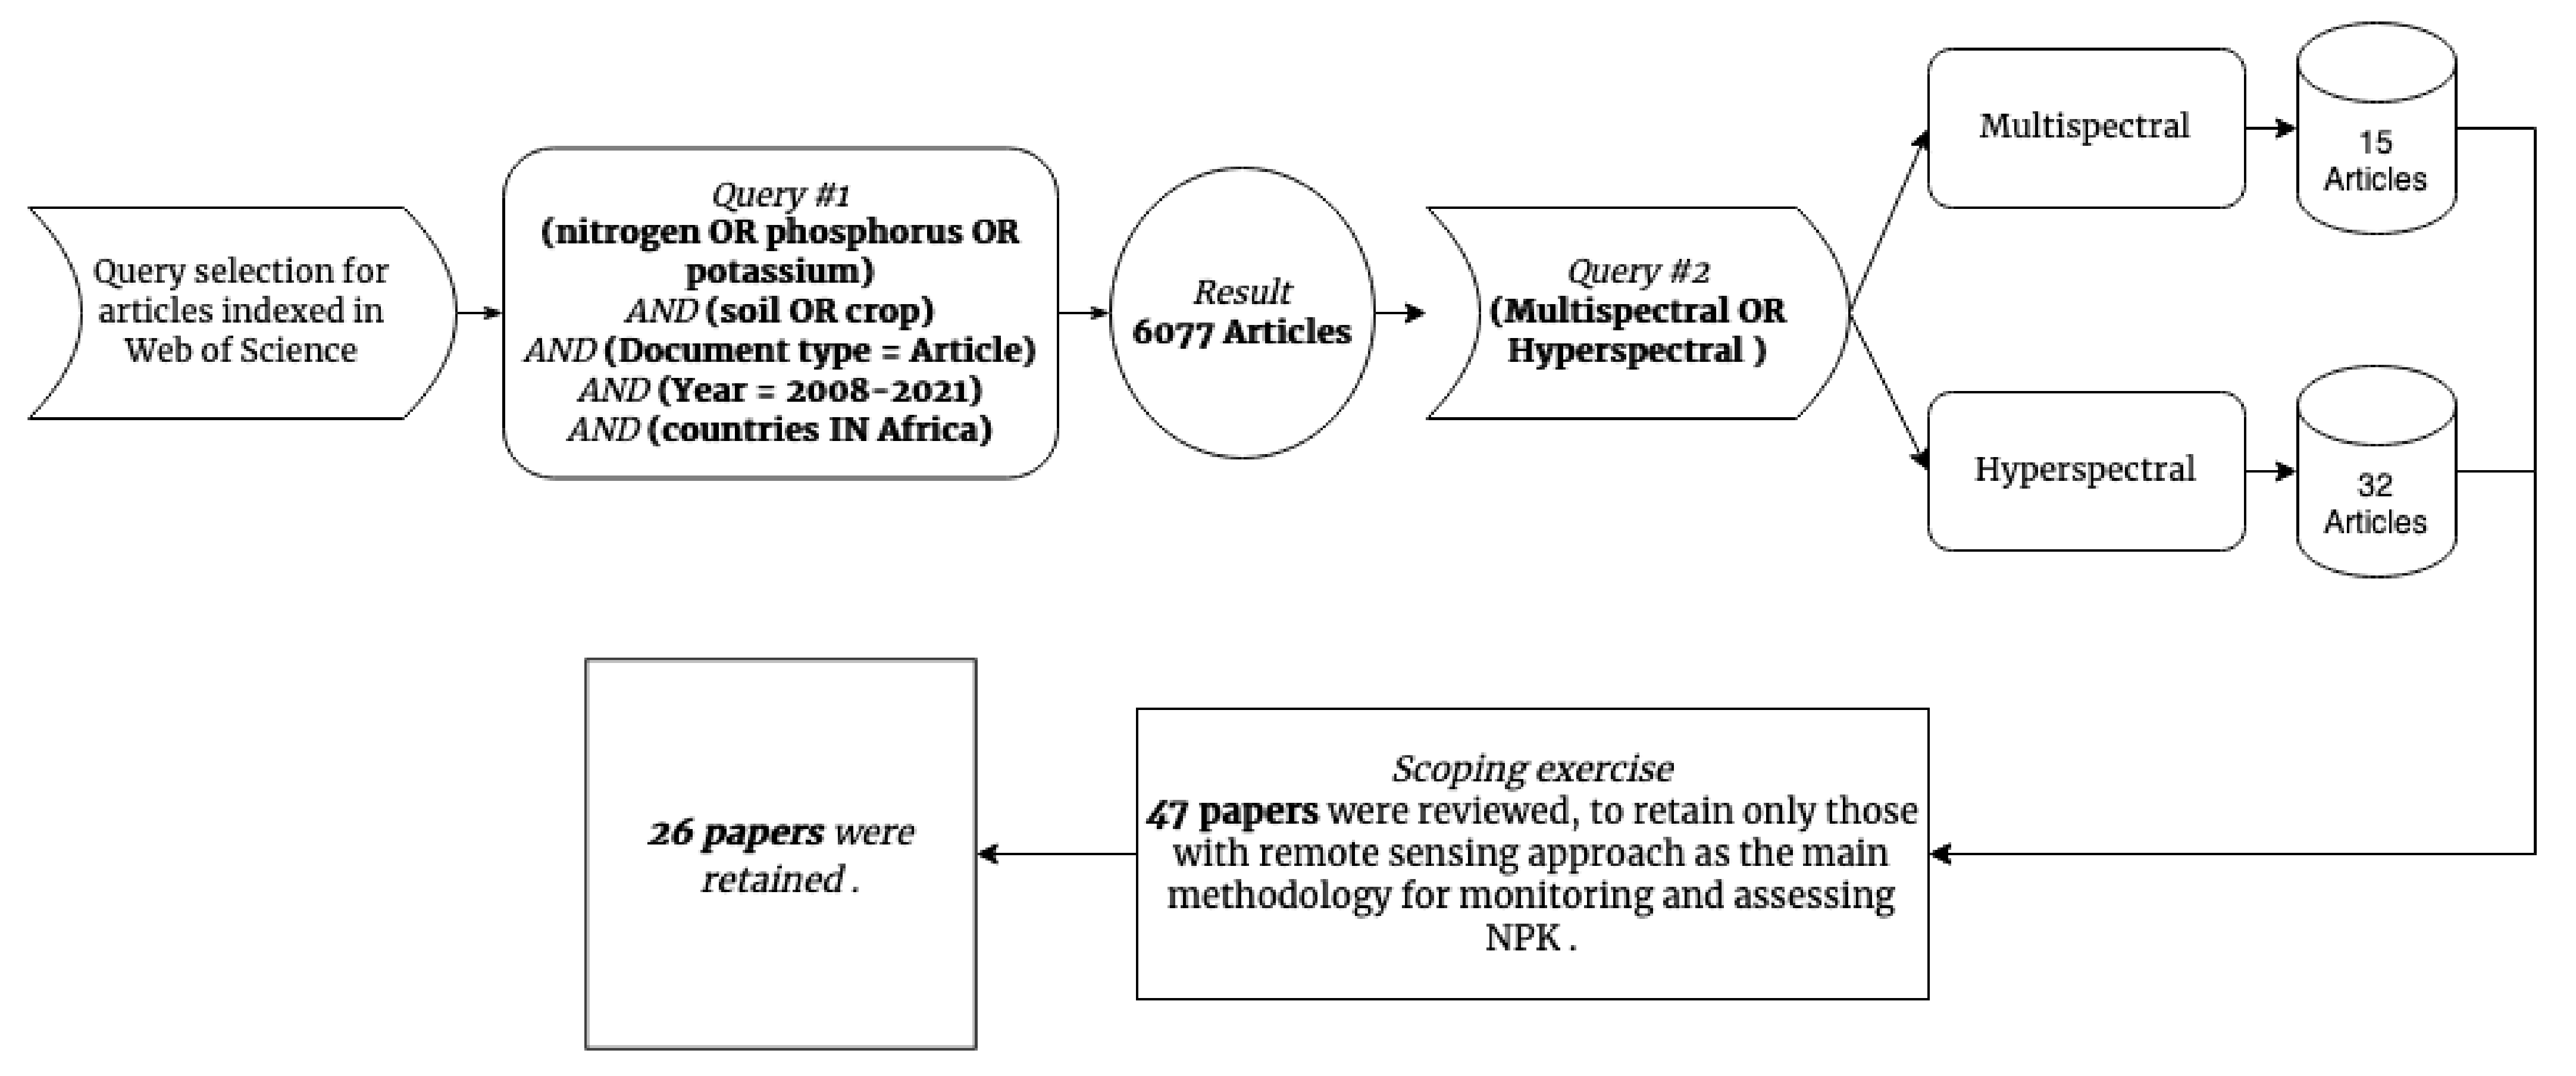
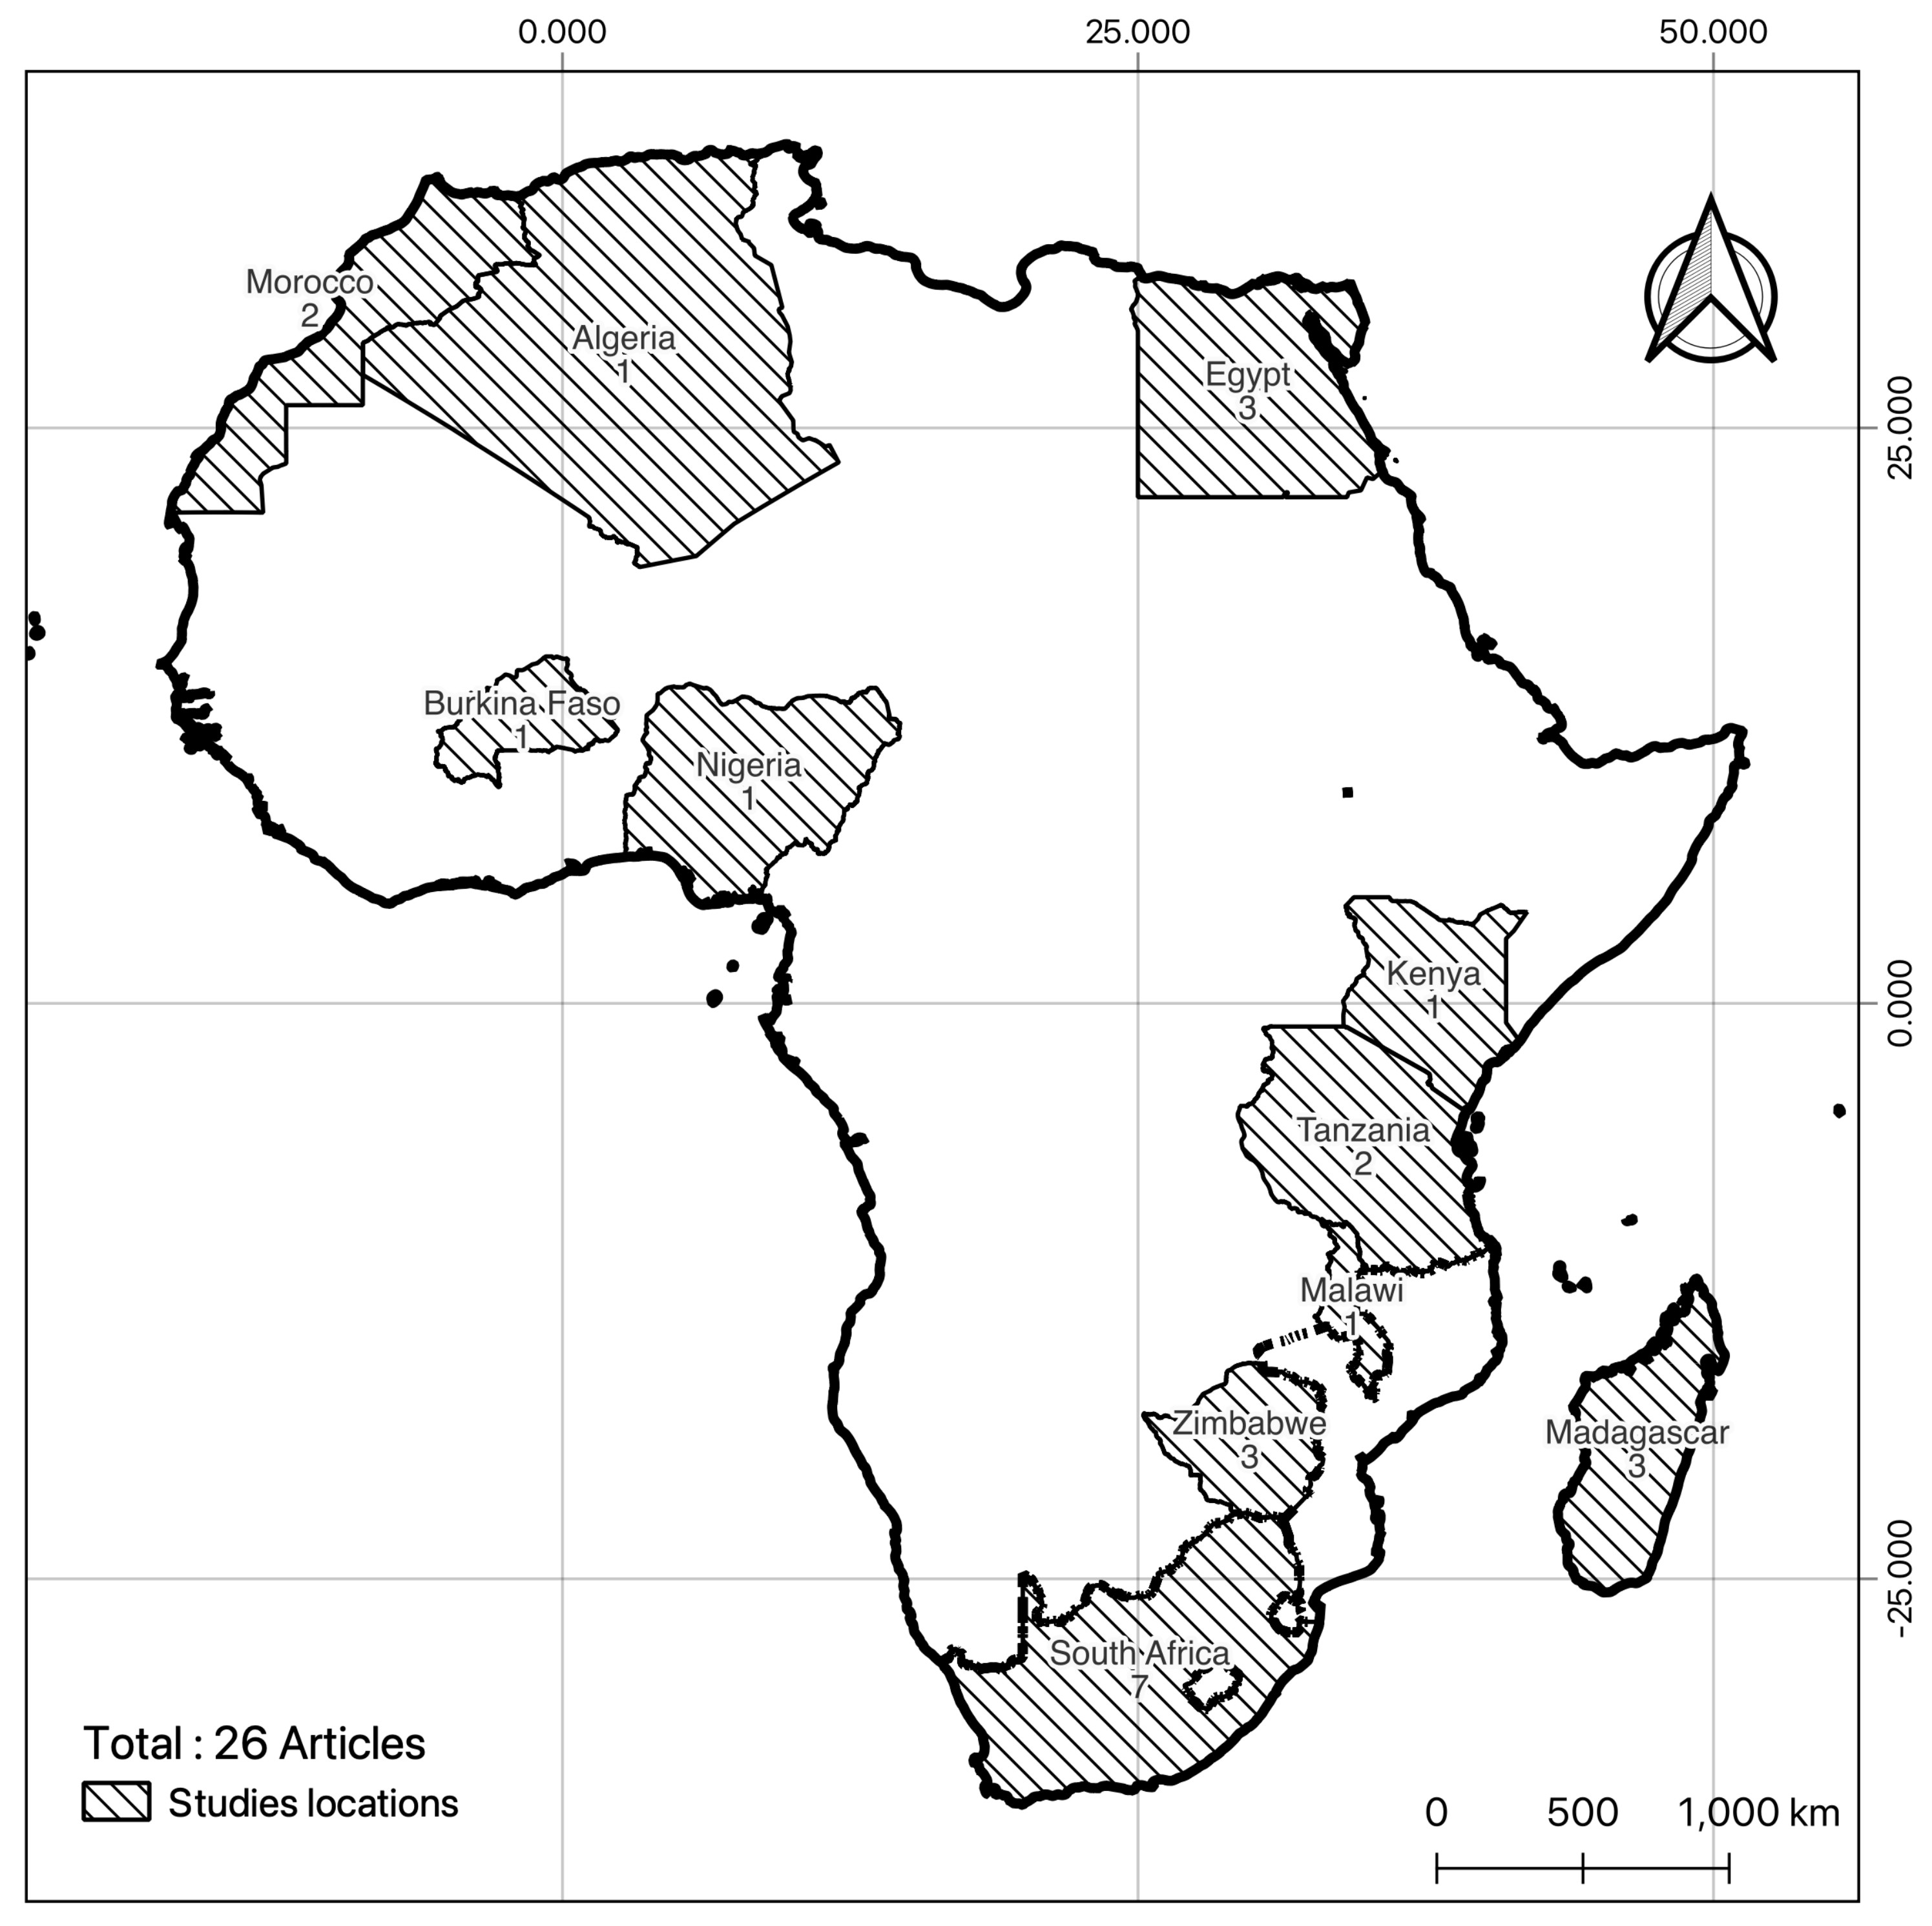
:1. Introduction
2. Overview of Remote Sensing Sensors Used for NPK Assessment and Mapping
2.1. Satellite Mounted Sensors
2.2. Airborne and Unmanned Aerial Vehicles (UAVs) Mounted Sensors
2.3. Ground-Based and Proximal Sensing
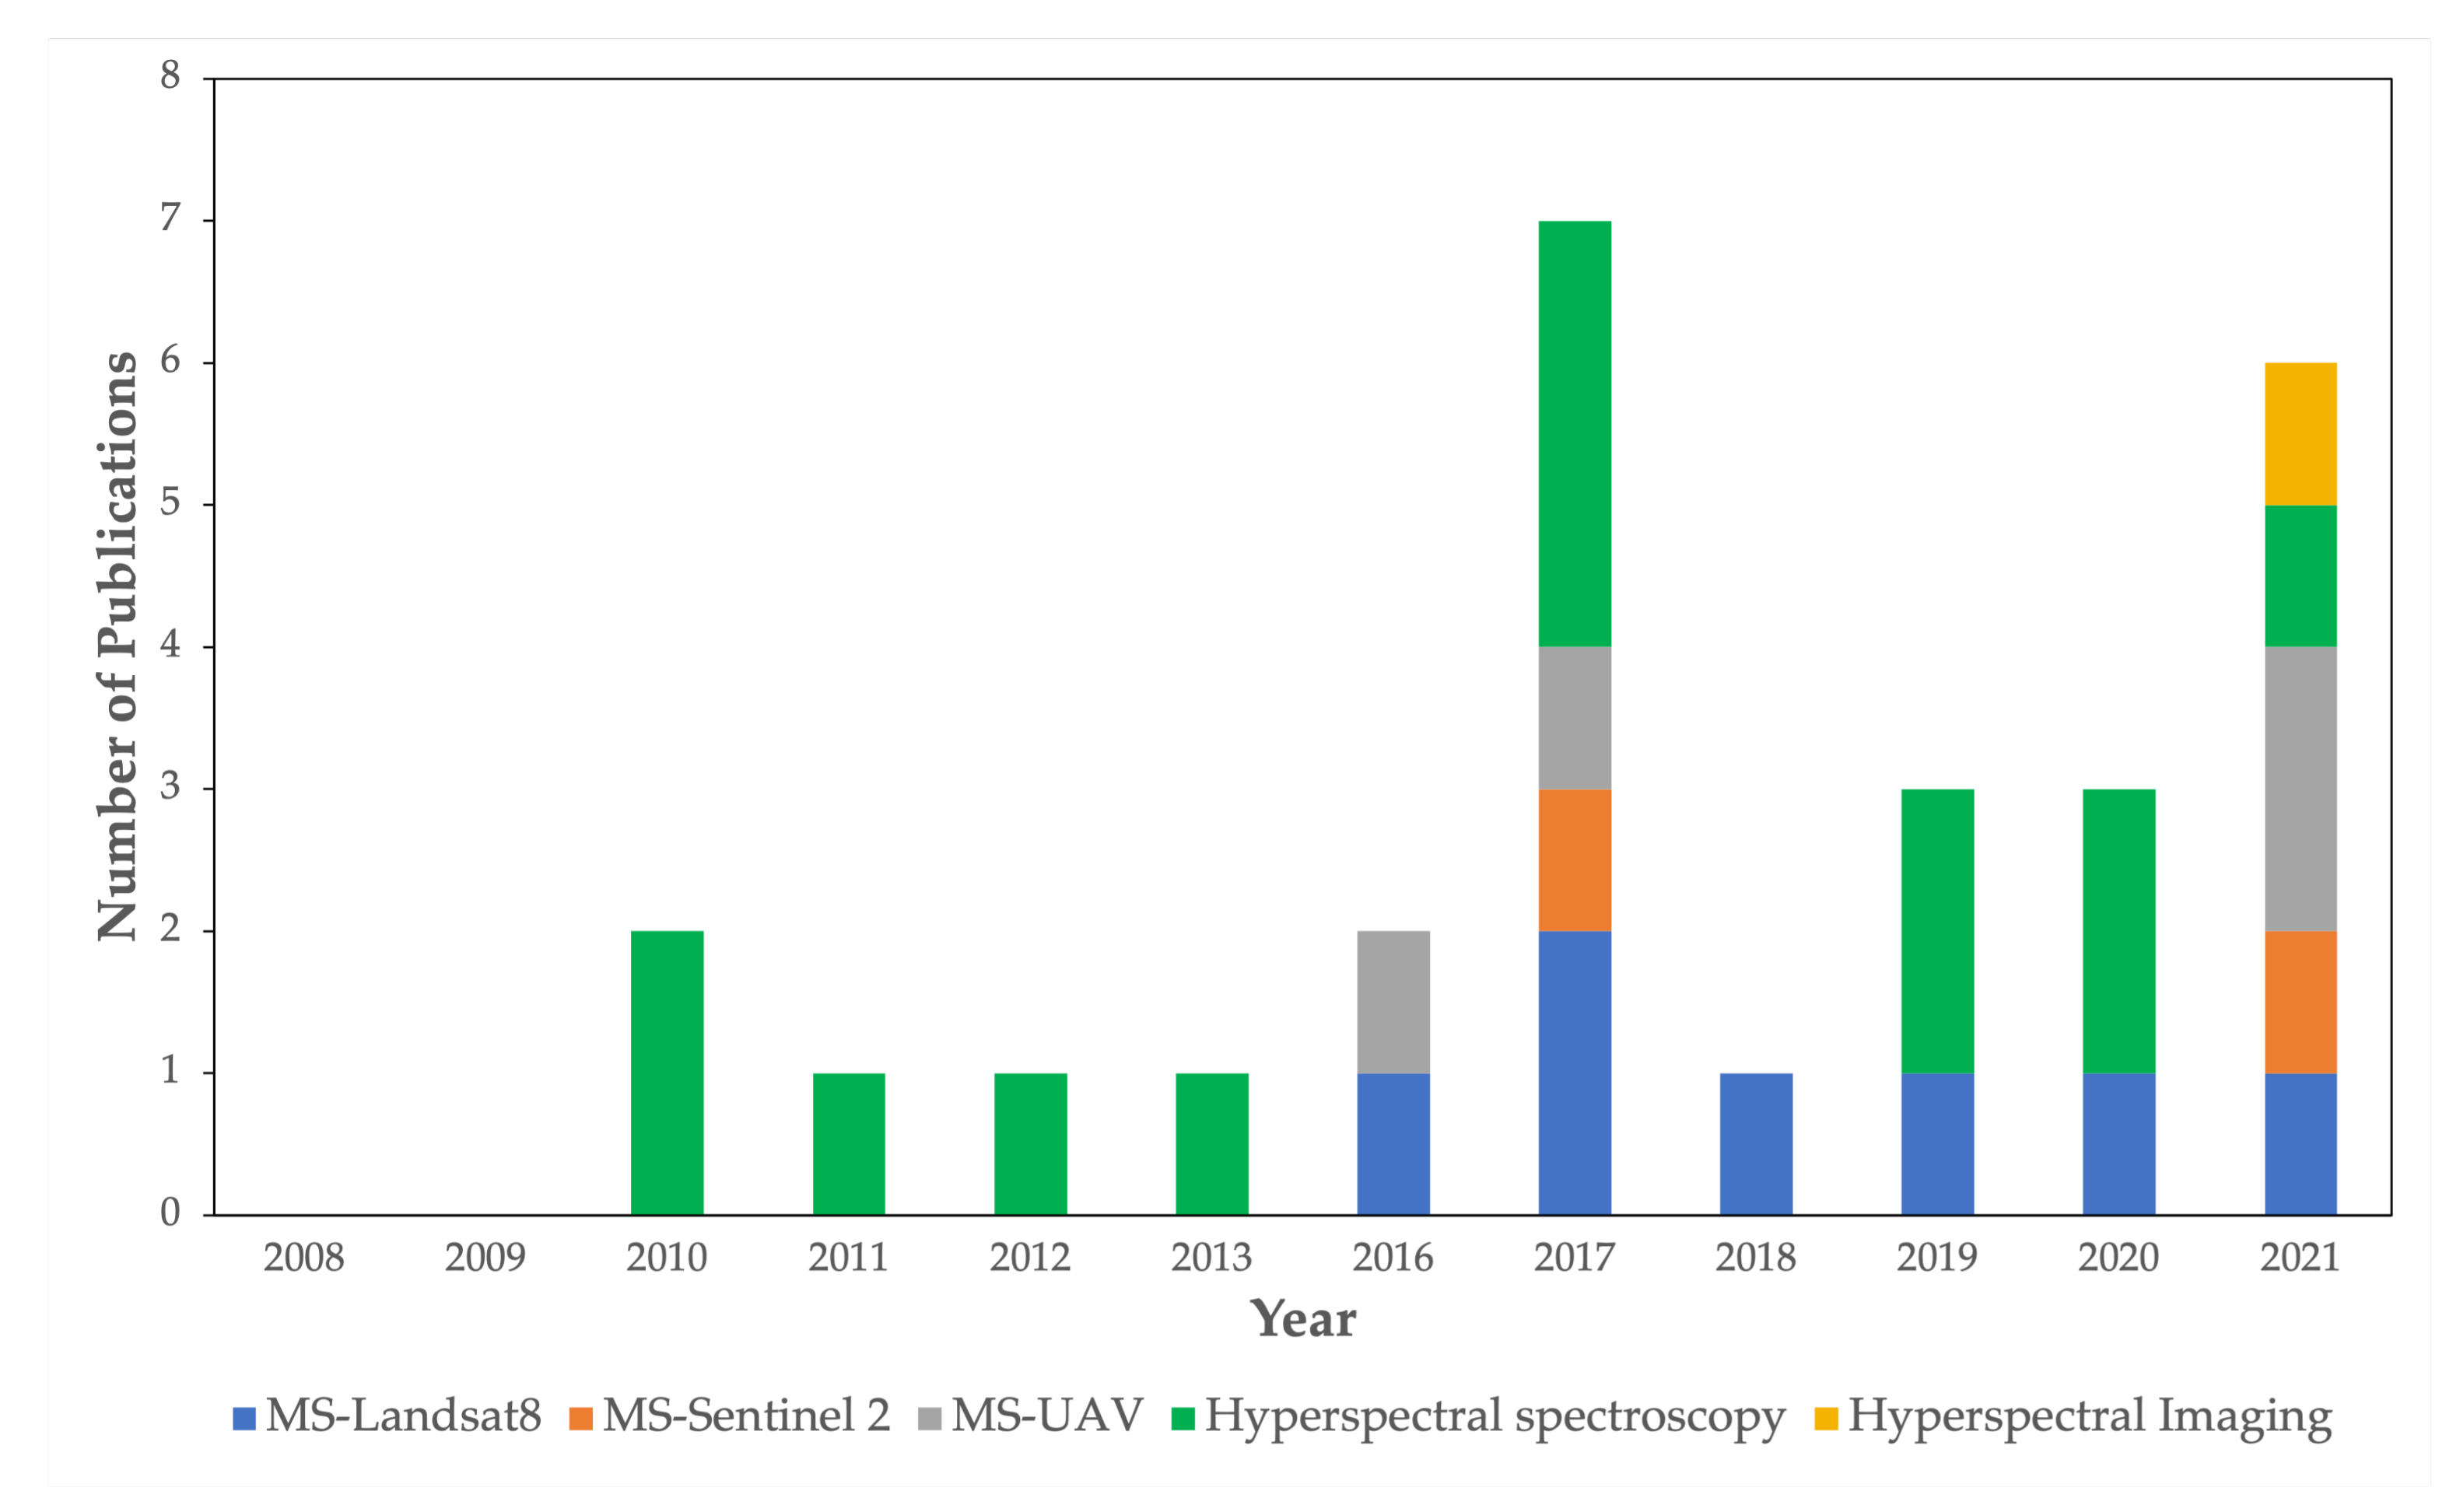
3. Synthesis of Reviewed and Retained Publications
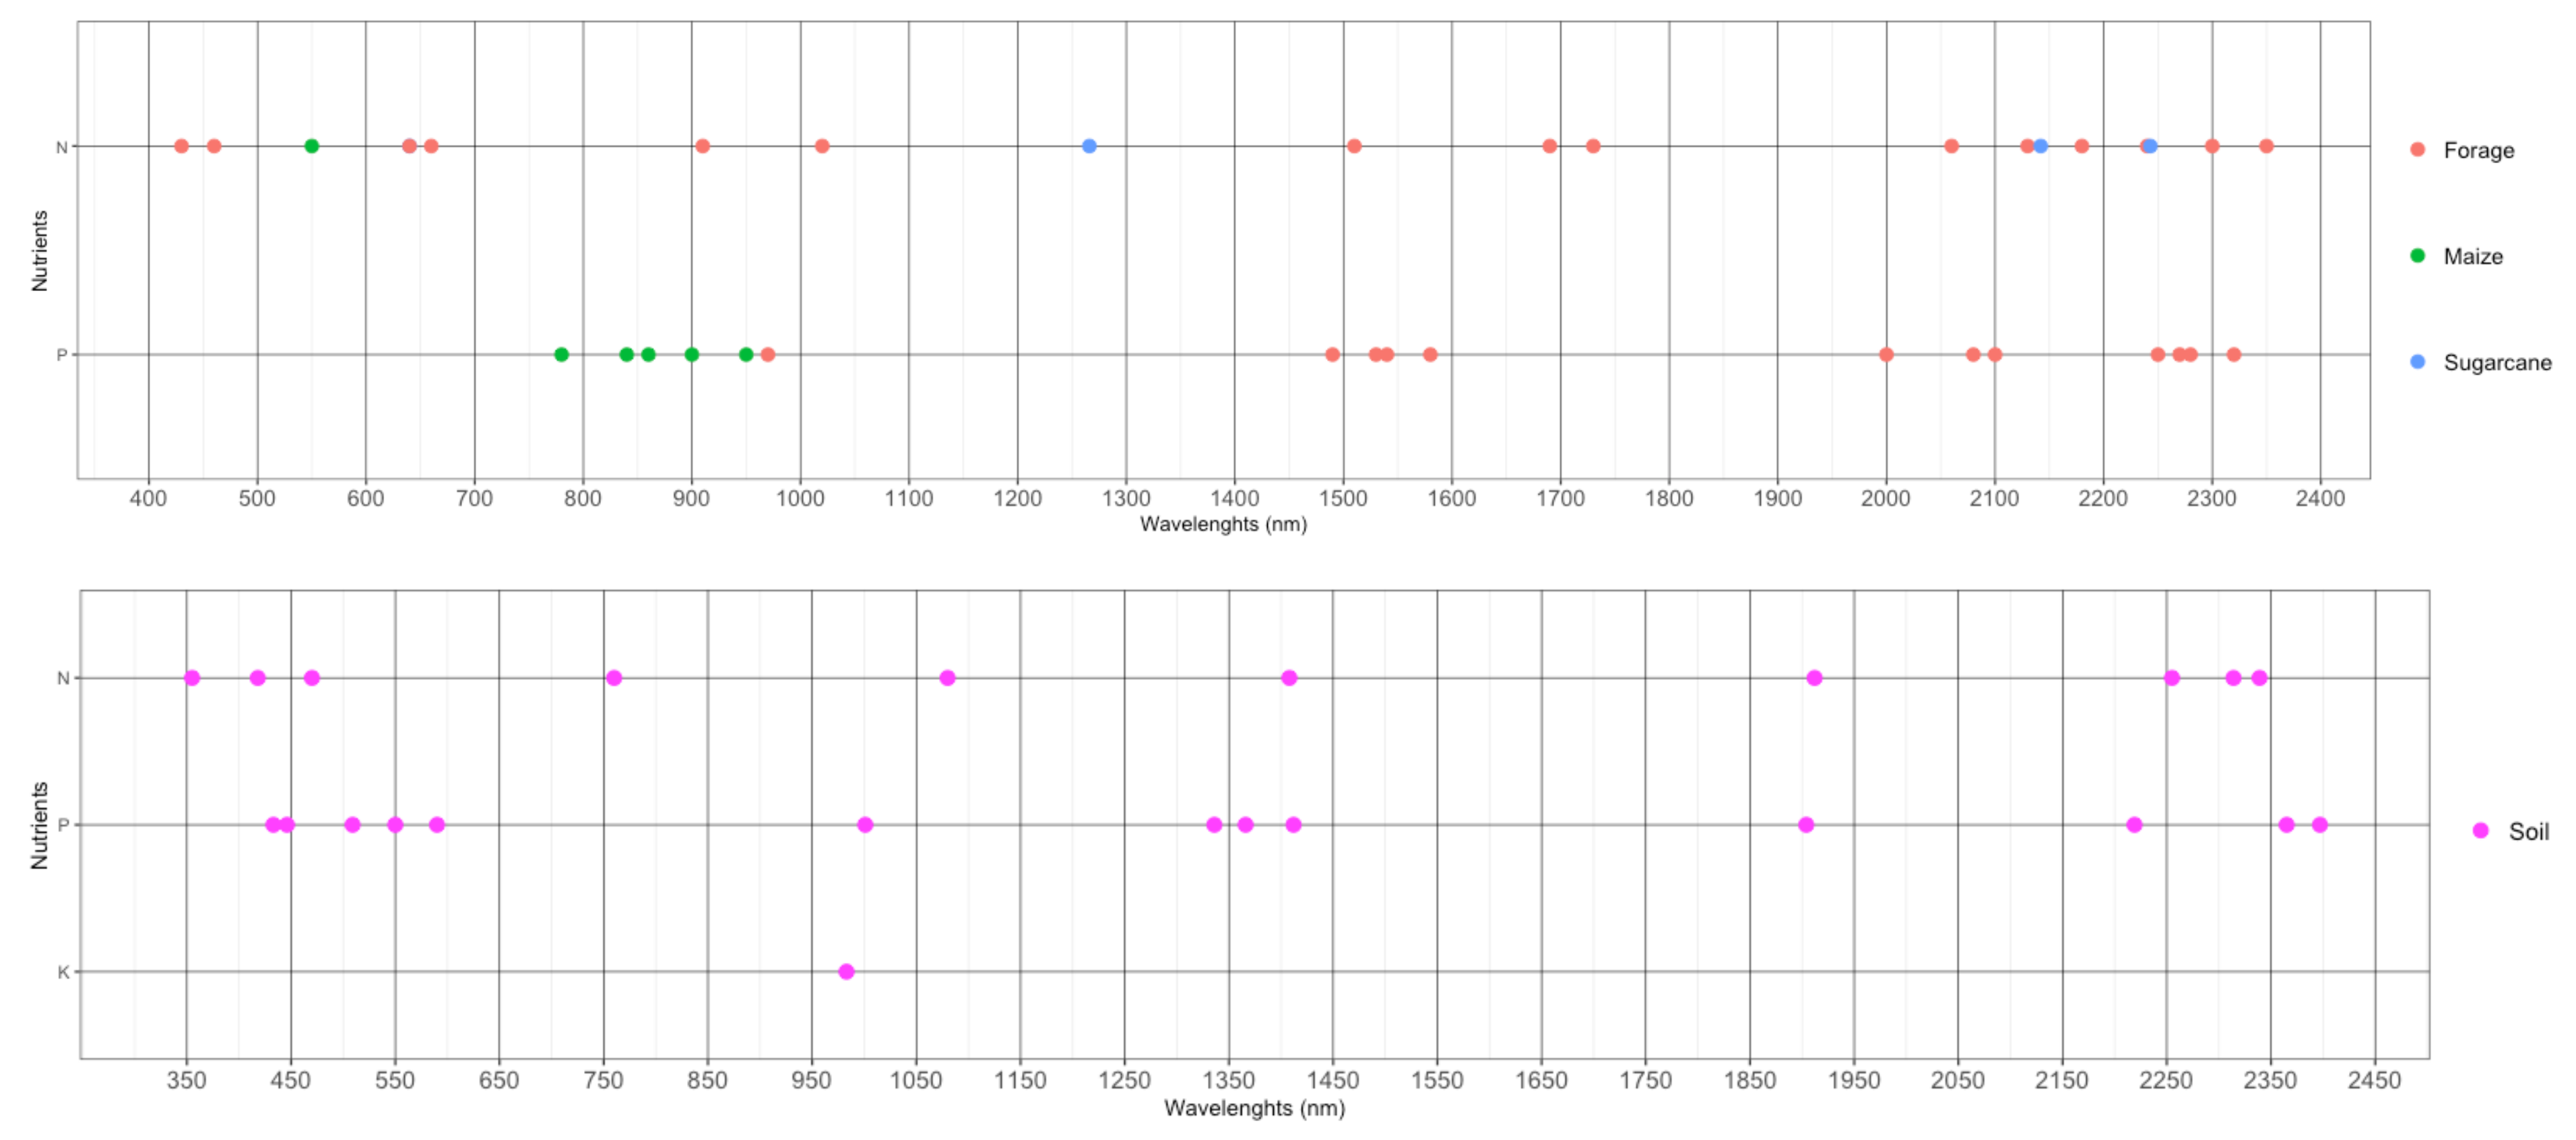
4. Results and Discussion
5. Conclusions
Author Contributions
Funding
Data Availability Statement
Acknowledgments
Conflicts of Interest
References
- Tripathi, A.D.; Mishra, R.; Maurya, K.K.; Singh, R.B.; Wilson, D.W. Estimates for World Population and Global Food Availability for Global Health. Role Funct. Food Secur. Glob. Health 2019, 3–24. [Google Scholar] [CrossRef]
- FAO. The Future of Food and Agriculture. Food Agric. Organ. United Nations 2017, 20, 1–52. [Google Scholar]
- Saito, K.; Vandamme, E.; Johnson, J.M.; Tanaka, A.; Senthilkumar, K.; Dieng, I.; Akakpo, C.; Gbaguidi, F.; Segda, Z.; Bassoro, I.; et al. Yield-limiting macronutrients for rice in sub-Saharan Africa. Geoderma 2019, 338, 546–554. [Google Scholar] [CrossRef]
- Lu, H.J.; Ye, Z.Q.; Zhang, X.L.; Lin, X.Y.; Ni, W.Z. Growth and yield responses of crops and macronutrient balance influenced by commercial organic manure used as a partial substitute for chemical fertilizers in an intensive vegetable cropping system. Phys. Chem. Earth 2011, 36, 387–394. [Google Scholar] [CrossRef]
- Sharpley, A.N.; Menzel, R.G. The impact of soil and fertilizer phosphorus on the environment. Adv. Agron. 1987, 41, 297–324. [Google Scholar] [CrossRef]
- Späti, K.; Huber, R.; Finger, R. Benefits of Increasing Information Accuracy in Variable Rate Technologies. Ecol. Econ. 2021, 185, 107047. [Google Scholar] [CrossRef]
- Saïdou, A.; Janssen, B.H.; Temminghoff, E.J. Effects of soil properties, mulch and NPK fertilizer on maize yields and nutrient budgets on ferralitic soils in southern Benin. In Agriculture, Ecosystems and Environment; Elsevier: Amsterdam, The Netherlands, 2003; Volume 100, pp. 265–273. [Google Scholar] [CrossRef]
- Patel, A.K.; Ghosh, J.K.; Sayyad, S.U. Fractional abundances study of macronutrients in soil using hyperspectral remote sensing. Geocarto Int. 2020, 1–20. [Google Scholar] [CrossRef]
- Blondlot, A.; Gate, P.; Poilvé, H.; Others. Providing operational nitrogen recommendations to farmers using satellite imagery. Precis. Agric. 2005, 5, 345. [Google Scholar]
- Gao, P.; Zuo, Z.; Zhang, R.; Qiu, Y.; He, R.; Gao, R.; Gui, R. Optimum nitrogen fertilization for phyllostachys edulis productivity and photosynthetic response. Agron. J. 2016, 108, 448–458. [Google Scholar] [CrossRef]
- Quemada, M.; Gabriel, J.L.; Zarco-Tejada, P. Airborne hyperspectral images and ground-level optical sensors as assessment tools for maize nitrogen fertilization. Remote Sens. 2014, 6, 2940–2962. [Google Scholar] [CrossRef] [Green Version]
- Jacquemoud, S.; Verhoef, W.; Baret, F.; Bacour, C.; Zarco-Tejada, P.J.; Asner, G.P.; François, C.; Ustin, S.L. PROSPECT + SAIL models: A review of use for vegetation characterization. Remote Sens. Environ. 2009, 113, S56–S66. [Google Scholar] [CrossRef]
- Thorp, K.R.; Wang, G.; West, A.L.; Moran, M.S.; Bronson, K.F.; White, J.W.; Mon, J. Estimating crop biophysical properties from remote sensing data by inverting linked radiative transfer and ecophysiological models. Remote Sens. Environ. 2012, 124, 224–233. [Google Scholar] [CrossRef] [Green Version]
- Wang, Z.; Skidmore, A.K.; Darvishzadeh, R.; Heiden, U.; Heurich, M.; Wang, T. Leaf Nitrogen Content Indirectly Estimated by Leaf Traits Derived from the PROSPECT Model. IEEE J. Sel. Top. Appl. Earth Obs. Remote Sens. 2015, 8, 3172–3182. [Google Scholar] [CrossRef]
- Li, Z.; Li, Z.; Fairbairn, D.; Li, N.; Xu, B.; Feng, H.; Yang, G. Multi-LUTs method for canopy nitrogen density estimation in winter wheat by field and UAV hyperspectral. Comput. Electron. Agric. 2019, 162, 174–182. [Google Scholar] [CrossRef]
- Reeves, J.B.; McCarty, G.W. Quantitative analysis of agricultural soils using near infrared reflectance spectroscopy and a fibre-optic probe. J. Near Infrared Spectrosc. 2001, 9, 25–34. [Google Scholar] [CrossRef]
- Viscarra Rossel, R.A.; Walvoort, D.J.; McBratney, A.B.; Janik, L.J.; Skjemstad, J.O. Visible, near infrared, mid infrared or combined diffuse reflectance spectroscopy for simultaneous assessment of various soil properties. Geoderma 2006, 131, 59–75. [Google Scholar] [CrossRef]
- Wijewardane, N.K.; Ge, Y.; Wills, S.; Libohova, Z. Predicting Physical and Chemical Properties of US Soils with a Mid-Infrared Reflectance Spectral Library. Soil Sci. Soc. Am. J. 2018, 82, 722–731. [Google Scholar] [CrossRef] [Green Version]
- Forkuor, G.; Hounkpatin, O.K.; Welp, G.; Thiel, M. High resolution mapping of soil properties using Remote Sensing variables in south-western Burkina Faso: A comparison of machine learning and multiple linear regression models. PLoS ONE 2017, 12. [Google Scholar] [CrossRef] [PubMed]
- Mohamed, E.S.; El Baroudy, A.A.; El-beshbeshy, T.; Emam, M.; Belal, A.A.; Elfadaly, A.; Aldosari, A.A.; Ali, A.M.; Lasaponara, R. Vis-nir spectroscopy and satellite landsat-8 oli data to map soil nutrients in arid conditions: A case study of the northwest coast of egypt. Remote Sens. 2020, 12, 3716. [Google Scholar] [CrossRef]
- Pierre, W.H. The Phosphorus Cycle and Soil Fertility 1. Agron. J. 1948, 40, 1–14. [Google Scholar] [CrossRef]
- Wollenhaupt, N.C.; Wolkowski, R.P.; Clayton, M.K. Mapping Soil Test Phosphorus and Potassium for Variable-Rate Fertilizer Application. J. Prod. Agric. 1994, 7, 441–448. [Google Scholar] [CrossRef]
- Sembiring, H.; Raun, W.R.; Johnson, G.V.; Stone, M.L.; Solie, J.B.; Phillips, S.B. Detection of nitrogen and phosphorus nutrient status in winter wheat using spectral radiance. J. Plant Nutr. 1998, 21, 1207–1233. [Google Scholar] [CrossRef]
- Lin, C.; Ma, R.; Zhu, Q.; Li, J. Using hyper-spectral indices to detect soil phosphorus concentration for various land use patterns. Environ. Monit. Assess. 2015, 187, 4130. [Google Scholar] [CrossRef] [PubMed]
- Kawamura, K.; Nishigaki, T.; Andriamananjara, A.; Rakotonindrina, H.; Tsujimoto, Y.; Moritsuka, N.; Rabenarivo, M.; Razafimbelo, T. Using a one-dimensional convolutional neural network on visible and near-infrared spectroscopy to improve soil phosphorus prediction in Madagascar. Remote Sens. 2021, 13, 1519. [Google Scholar] [CrossRef]
- Mahajan, G.R.; Sahoo, R.N.; Pandey, R.N.; Gupta, V.K.; Kumar, D. Using hyperspectral remote sensing techniques to monitor nitrogen, phosphorus, sulphur and potassium in wheat (Triticum aestivum L.). Precis. Agric. 2014, 15, 499–522. [Google Scholar] [CrossRef]
- Ansari, M.S.; Young, K.R.; Nicolas, M.E. Determining Wavelenth for Nitrogen and Phosphorus Nutrients Through Hyperspectral Remote Sensing in Wheat (Triticum aestivum L.) Plant. Int. J. -Bio-Resour. Stress Manag. 2016, 7, 653–662. [Google Scholar]
- Zhang, Y.; Sui, B.; Shen, H.; Ouyang, L. Mapping stocks of soil total nitrogen using remote sensing data: A comparison of random forest models with different predictors. Comput. Electron. Agric. 2019, 160, 23–30. [Google Scholar] [CrossRef]
- Lee, H.; Wang, J.; Leblon, B. Using linear regression, random forests, and support vector machine with unmanned aerial vehicle multispectral images to predict canopy nitrogen weight in corn. Remote Sens. 2020, 12, 2071. [Google Scholar] [CrossRef]
- Peng, J.; Manevski, K.; Kørup, K.; Larsen, R.; Andersen, M.N. Random forest regression results in accurate assessment of potato nitrogen status based on multispectral data from different platforms and the critical concentration approach. Field Crop. Res. 2021, 268, 108158. [Google Scholar] [CrossRef]
- Dong, Y.; Fu, Z.; Peng, Y.; Zheng, Y.; Yan, H.; Li, X. Precision fertilization method of field crops based on the Wavelet-BP neural network in China. J. Clean. Prod. 2020, 246, 118735. [Google Scholar] [CrossRef]
- Reda, R.; Saffaj, T.; Itqiq, S.E.; Bouzida, I.; Saidi, O.; Yaakoubi, K.; Lakssir, B.; El Mernissi, N.; El Hadrami, E.M. Predicting soil phosphorus and studying the effect of texture on the prediction accuracy using machine learning combined with near-infrared spectroscopy. Spectrochim. Acta Part A: Mol. Biomol. Spectrosc. 2020, 242, 118736. [Google Scholar] [CrossRef]
- Abdel-Rahman, E.M.; Mutanga, O.; Odindi, J.; Adam, E.; Odindo, A.; Ismail, R. Estimating Swiss chard foliar macro- and micronutrient concentrations under different irrigation water sources using ground-based hyperspectral data and four partial least squares (PLS)-based (PLS1, PLS2, SPLS1 and SPLS2) regression algorithms. Comput. Electron. Agric. 2017, 132, 21–33. [Google Scholar] [CrossRef]
- Khechba, K.; Laamrani, A.; Dhiba, D.; Misbah, K.; Chehbouni, A. Monitoring and Analyzing Yield Gap in Africa through Soil Attribute Best Management Using Remote Sensing Approaches: A Review. Remote Sens. 2021, 13, 4602. [Google Scholar] [CrossRef]
- Zhu, Z.; Wulder, M.A.; Roy, D.P.; Woodcock, C.E.; Hansen, M.C.; Radeloff, V.C.; Healey, S.P.; Schaaf, C.; Hostert, P.; Strobl, P.; et al. Benefits of the free and open Landsat data policy. Remote Sens. Environ. 2019, 224, 382–385. [Google Scholar] [CrossRef]
- Cilia, C.; Panigada, C.; Rossini, M.; Meroni, M.; Busetto, L.; Amaducci, S.; Boschetti, M.; Picchi, V.; Colombo, R. Nitrogen status assessment for variable rate fertilization in maize through hyperspectral imagery. Remote Sens. 2014, 6, 6549–6565. [Google Scholar] [CrossRef] [Green Version]
- Scudiero, E.; Teatini, P.; Manoli, G.; Braga, F.; Skaggs, T.H.; Morari, F. Workflow to establish time-specific zones in precision agriculture by spatiotemporal integration of plant and soil sensing data. Agronomy 2018, 8, 253. [Google Scholar] [CrossRef] [Green Version]
- Sishodia, R.P.; Ray, R.L.; Singh, S.K. Applications of remote sensing in precision agriculture: A review. Remote Sens. 2020, 12, 3136. [Google Scholar] [CrossRef]
- Candiago, S.; Remondino, F.; De Giglio, M.; Dubbini, M.; Gattelli, M. Evaluating multispectral images and vegetation indices for precision farming applications from UAV images. Remote Sens. 2015, 7, 4026–4047. [Google Scholar] [CrossRef] [Green Version]
- Vangi, E.; D’amico, G.; Francini, S.; Giannetti, F.; Lasserre, B.; Marchetti, M.; Chirici, G. The new hyperspectral satellite prisma: Imagery for forest types discrimination. Sensors 2021, 21, 1182. [Google Scholar] [CrossRef]
- Loizzo, R.; Daraio, M.; Guarini, R.; Longo, F.; Lorusso, R.; DIni, L.; Lopinto, E. Prisma Mission Status and Perspective. In Proceedings of the International Geoscience and Remote Sensing Symposium (IGARSS), Kuala Lumpur, Malaysia, 17–22 July 2022; pp. 4503–4506. [Google Scholar] [CrossRef]
- Bostan, S.; Ortak, M.A.; Tuna, C.; Akoguz, A.; Sertel, E.; Berk Ustundag, B. Comparison of classification accuracy of co-located hyperspectral and multispectral images for agricultural purposes. In Proceedings of the 2016 Fifth International Conference on Agro-Geoinformatics (Agro-Geoinformatics), Tianjin, China, 18–20 July 2016. [Google Scholar] [CrossRef]
- Lu, B.; Dao, P.D.; Liu, J.; He, Y.; Shang, J. Recent advances of hyperspectral imaging technology and applications in agriculture. Remote Sens. 2020, 12, 2659. [Google Scholar] [CrossRef]
- Zhu, H.; Liu, H.; Xu, Y.; Guijun, Y. UAV-based hyperspectral analysis and spectral indices constructing for quantitatively monitoring leaf nitrogen content of winter wheat. Appl. Opt. 2018, 57, 7722. [Google Scholar] [CrossRef]
- Pölönen, I.; Saari, H.; Kaivosoja, J.; Honkavaara, E.; Pesonen, L. Hyperspectral imaging based biomass and nitrogen content estimations from light-weight UAV. In Remote Sensing for Agriculture, Ecosystems, and Hydrology XV; Neale, C.M.U., Maltese, A., Eds.; SPIE: Bellingham, WA, USA, 2013; Volume 8887, p. 88870J. [Google Scholar] [CrossRef]
- Laamrani, A.; Joosse, P.; McNairn, H.; Berg, A.A.; Hagerman, J.; Powell, K.; Berry, M. Assessing soil cover levels during the non-growing season using multitemporal satellite imagery and spectral unmixing techniques. Remote Sens. 2020, 12, 1397. [Google Scholar] [CrossRef]
- Osco, L.P.; de Arruda, M.d.S.; Marcato Junior, J.; da Silva, N.B.; Ramos, A.P.M.; Moryia, É.A.S.; Imai, N.N.; Pereira, D.R.; Creste, J.E.; Matsubara, E.T.; et al. A convolutional neural network approach for counting and geolocating citrus-trees in UAV multispectral imagery. ISPRS J. Photogramm. Remote Sens. 2020, 160, 97–106. [Google Scholar] [CrossRef]
- Astaoui, G.; Dadaiss, J.E.; Sebari, I.; Benmansour, S.; Mohamed, E. Mapping Wheat Dry Matter and Nitrogen Content Dynamics and Estimation of Wheat Yield Using UAV Multispectral Imagery Machine Learning and a Variety-Based Approach: Case Study of Morocco. AgriEngineering 2021, 3, 29–49. [Google Scholar] [CrossRef]
- Mazzia, V.; Comba, L.; Khaliq, A.; Chiaberge, M.; Gay, P. UAV and machine learning based refinement of a satellite-driven vegetation index for precision agriculture. Sensors (Switzerland) 2020, 20, 2530. [Google Scholar] [CrossRef]
- Ahmed, F.B. Estimation of leaf nitrogen and silicon using hyperspectral remote sensing. J. Appl. Remote Sens. 2010, 4, 043560. [Google Scholar] [CrossRef]
- Laamrani, A.; Berg, A.A.; Voroney, P.; Feilhauer, H.; Blackburn, L.; March, M.; Dao, P.D.; He, Y.; Martin, R.C. Ensemble identification of spectral bands related to soil organic carbon levels over an agricultural field in southern Ontario, Canada. Remote Sens. 2019, 11, 1298. [Google Scholar] [CrossRef] [Green Version]
- Hansen, P.M.; Schjoerring, J.K. Reflectance measurement of canopy biomass and nitrogen status in wheat crops using normalized difference vegetation indices and partial least squares regression. Remote Sens. Environ. 2003, 86, 542–553. [Google Scholar] [CrossRef]
- Mistele, B.; Schmidhalter, U. Estimating the nitrogen nutrition index using spectral canopy reflectance measurements. Eur. J. Agron. 2008, 29, 184–190. [Google Scholar] [CrossRef]
- Li, F.; Miao, Y.; Hennig, S.D.; Gnyp, M.L.; Chen, X.; Jia, L.; Bareth, G. Evaluating hyperspectral vegetation indices for estimating nitrogen concentration of winter wheat at different growth stages. Precis. Agric. 2010, 11, 335–357. [Google Scholar] [CrossRef]
- Islam, K.; Singh, B.; McBratney, A. Simultaneous estimation of several soil properties by ultra-violet, visible, and near-infrared reflectance spectroscopy. Aust. J. Soil Res. 2003, 41, 1101–1114. [Google Scholar] [CrossRef]
- César de Mello, D.; Alexandre Melo Demattê, J.; Alcantara de Oliveira Mello, F.; Roberto Poppiel, R.; ElizabetQuiñonez Silvero, N.; Lucas Safanelli, J.; Barros e Souza, A.; Augusto Di Loreto Di Raimo, L.; Rizzo, R.; Eduarda Bispo Resende, M.; et al. Applied gamma-ray spectrometry for evaluating tropical soil processes and attributes. Geoderma 2021, 381, 114736. [Google Scholar] [CrossRef]
- Kuang, B.; Mahmood, H.S.; Quraishi, M.Z.; Hoogmoed, W.B.; Mouazen, A.M.; van Henten, E.J. Sensing soil properties in the laboratory, in situ, and on-line. A review. In Advances in Agronomy; Academic Press: New York, NY, USA, 2012; Volume 114, pp. 155–223. [Google Scholar] [CrossRef]
- Abdel-Rahman, E.M.; Ahmed, F.B.; van den Berg, M. Estimation of sugarcane leaf nitrogen concentration using in situ spectroscopy. Int. J. Appl. Earth Obs. Geoinf. 2010, 12, S52–S57. [Google Scholar] [CrossRef]
- Main, R.; Cho, M.A.; Mathieu, R.; O’Kennedy, M.M.; Ramoelo, A.; Koch, S. An investigation into robust spectral indices for leaf chlorophyll estimation. ISPRS J. Photogramm. Remote Sens. 2011, 66, 751–761. [Google Scholar] [CrossRef]
- Knox, N.M.; Skidmore, A.K.; Prins, H.H.; Heitkönig, I.M.; Slotow, R.; van der Waal, C.; de Boer, W.F. Remote sensing of forage nutrients: Combining ecological and spectral absorption feature data. ISPRS J. Photogramm. Remote Sens. 2012, 72, 27–35. [Google Scholar] [CrossRef]
- Ramoelo, A.; Skidmore, A.K.; Cho, M.A.; Mathieu, R.; Heitkönig, I.M.; Dudeni-Tlhone, N.; Schlerf, M.; Prins, H.H. Non-linear partial least square regression increases the estimation accuracy of grass nitrogen and phosphorus using in situ hyperspectral and environmental data. ISPRS J. Photogramm. Remote Sens. 2013, 82, 27–40. [Google Scholar] [CrossRef]
- Were, K.; Singh, B.R.; Dick, Ø.B. Spatially distributed modelling and mapping of soil organic carbon and total nitrogen stocks in the Eastern Mau Forest Reserve, Kenya. J. Geogr. Sci. 2016, 26, 102–124. [Google Scholar] [CrossRef] [Green Version]
- Vergara-Díaz, O.; Zaman-Allah, M.A.; Masuka, B.; Hornero, A.; Zarco-Tejada, P.; Prasanna, B.M.; Cairns, J.E.; Araus, J.L. A novel remote sensing approach for prediction of maize yield under different conditions of nitrogen fertilization. Front. Plant Sci. 2016, 7, 666. [Google Scholar] [CrossRef] [PubMed] [Green Version]
- Elsayed, S.; Elhoweity, M.; El-Hendawy, S.; Schmidhalter, U. Non-invasive spectral detection of the beneficial effects of Bradyrhizobium spp. And plant growth-promoting rhizobacteria under different levels of nitrogen application on the biomass, nitrogen status, and yield of peanut cultivars. Bragantia 2017, 76, 189–202. [Google Scholar] [CrossRef] [Green Version]
- Kawamura, K.; Tsujimoto, Y.; Rabenarivo, M.; Asai, H.; Andriamananjara, A.; Rakotoson, T. Vis-NIR spectroscopy and PLS regression with waveband selection for estimating the total C and N of paddy soils in Madagascar. Remote Sens. 2017, 9, 1081. [Google Scholar] [CrossRef] [Green Version]
- Chemura, A.; Mutanga, O.; Odindi, J.; Kutywayo, D. Mapping spatial variability of foliar nitrogen in coffee (Coffea arabica L.) plantations with multispectral Sentinel-2 MSI data. ISPRS J. Photogramm. Remote Sens. 2018, 138, 1–11. [Google Scholar] [CrossRef]
- Gracia-Romero, A.; Kefauver, S.C.; Vergara-Díaz, O.; Zaman-Allah, M.A.; Prasanna, B.M.; Cairns, J.E.; Araus, J.L. Comparative performance of ground vs. Aerially assessed rgb and multispectral indices for early-growth evaluation of maize performance under phosphorus fertilization. Front. Plant Sci. 2017, 8, 2004. [Google Scholar] [CrossRef] [PubMed] [Green Version]
- Ojoyi, M.M.; Mutanga, O.; Odindi, J.; Kahinda, J.M.M.; Abdel-Rahman, E.M. Implications of land use transitions on soil nitrogen in dynamic landscapes in Tanzania. Land Use Policy 2017, 64, 95–100. [Google Scholar] [CrossRef]
- Yonah, I.B.; Mourice, S.K.; Tumbo, S.D.; Mbilinyi, B.P.; Dempewolf, J. Unmanned aerial vehicle-based remote sensing in monitoring smallholder, heterogeneous crop fields in Tanzania. Int. J. Remote Sens. 2018, 39, 5453–5471. [Google Scholar] [CrossRef]
- Kawamura, K.; Tsujimoto, Y.; Nishigaki, T.; Andriamananjara, A.; Rabenarivo, M.; Asai, H.; Rakotoson, T.; Razafimbelo, T. Laboratory visible and near-infrared spectroscopy with genetic algorithm-based partial least squares regression for assessing the soil phosphorus content of upland and lowland rice fields in Madagascar. Remote Sens. 2019, 11, 506. [Google Scholar] [CrossRef] [Green Version]
- Masemola, C.; Cho, M.A. Estimating leaf nitrogen concentration from similarities in fresh and dry leaf spectral bands using a model population analysis framework. Int. J. Remote Sens. 2019, 40, 6841–6860. [Google Scholar] [CrossRef]
- Yousfi, S.; Gracia-Romero, A.; Kellas, N.; Kaddour, M.; Chadouli, A.; Karrou, M.; Araus, J.L.; Serret, M.D. Combined use of low-cost remote sensing techniques and δ13C to assess bread wheat grain yield under different water and nitrogen conditions. Agronomy 2019, 9, 285. [Google Scholar] [CrossRef] [Green Version]
- Elmetwalli, A.H.; Tyler, A.N. Estimation of maize properties and differentiating moisture and nitrogen deficiency stress via ground—Based remotely sensed data. Agric. Water Manag. 2020, 242. [Google Scholar] [CrossRef]
- Hengl, T.; Miller, M.A.; Križan, J.; Shepherd, K.D.; Sila, A.; Kilibarda, M.; Antonijević, O.; Glušica, L.; Dobermann, A.; Haefele, S.M.; et al. African soil properties and nutrients mapped at 30 m spatial resolution using two-scale ensemble machine learning. Technical Report 1. Sci. Rep. 2021, 11, 1–18. [Google Scholar] [CrossRef]
- Peter, B.G.; Messina, J.P.; Carroll, J.W.; Chikowo, R. A case for green-based vegetation indices: Plot-scale sUAS imagery related to crop chlorophyll content on smallholder maize farms in Malawi. Remote Sens. Lett. 2021, 12, 778–787. [Google Scholar] [CrossRef]
- Misbah, K.; Laamrani, A.; Chehbouni, A.; Dhiba, D.; Ezzahar, J. Use of Hyperspectral Prisma Level-1 Data and ISDA Soil Fertility Map for Soil Macronutrient Availability Quantification in a Moroccan Agricultural Land. In Proceedings of the 2021 IEEE International Geoscience and Remote Sensing Symposium IGARSS, Brussels, Belgium, 11–16 July 2021; pp. 7051–7054. [Google Scholar] [CrossRef]
- Komolafe, A.A.; Olorunfemi, I.E.; Oloruntoba, C.; Akinluyi, F.O. Spatial prediction of soil nutrients from soil, topography and environmental attributes in the northern part of Ekiti State, Nigeria. Remote Sens. Appl. Soc. Environ. 2021, 21. [Google Scholar] [CrossRef]
- Mariotto, I.; Thenkabail, P.S.; Huete, A.; Slonecker, E.T.; Platonov, A. Hyperspectral versus multispectral crop-productivity modeling and type discrimination for the HyspIRI mission. Remote Sens. Environ. 2013, 139, 291–305. [Google Scholar] [CrossRef]
- Pierce, F.J.; Nowak, P. Aspects of Precision Agriculture. Adv. Agron. 1999, 67, 1–85. [Google Scholar] [CrossRef]
- Gebbers, R.; Adamchuk, V.I. Precision agriculture and food security. Science 2010, 327, 828–831. [Google Scholar] [CrossRef] [PubMed]
- Manfreda, S.; McCabe, M.F.; Miller, P.E.; Lucas, R.; Madrigal, V.P.; Mallinis, G.; Dor, E.B.; Helman, D.; Estes, L.; Ciraolo, G.; et al. On the use of unmanned aerial systems for environmental monitoring. Remote Sens. 2018, 10, 641. [Google Scholar] [CrossRef] [Green Version]
- Mponela, P.; Snapp, S.; Villamor, G.B.; Tamene, L.; Le, Q.B.; Borgemeister, C. Digital soil mapping of nitrogen, phosphorus, potassium, organic carbon and their crop response thresholds in smallholder managed escarpments of Malawi. Appl. Geogr. 2020, 124, 102299. [Google Scholar] [CrossRef]
- Hengl, T.; Leenaars, J.G.; Shepherd, K.D.; Walsh, M.G.; Heuvelink, G.B.; Mamo, T.; Tilahun, H.; Berkhout, E.; Cooper, M.; Fegraus, E.; et al. Soil nutrient maps of Sub-Saharan Africa: Assessment of soil nutrient content at 250 m spatial resolution using machine learning. Nutr. Cycl. Agroecosystems 2017, 109, 77–102. [Google Scholar] [CrossRef] [Green Version]


| Country | Publication Year | Targeted Nutrient | Soil/Crop | Remote Sensing Source | Reference |
|---|---|---|---|---|---|
| South Africa | 2010 | N | Sugarcane | HSS | [58] |
| South Africa | 2010 | N | Sugarcane | HSS | [50] |
| South Africa | 2011 | N | Maize | HSS | [59] |
| South Africa | 2012 | NP | Forage | HSS | [60] |
| South Africa | 2013 | NP | Grass | HSS | [61] |
| Kenya | 2016 | N | Mixte * | MS-L8 | [62] |
| Zimbabwe | 2016 | NP | Maize | UAV | [63] |
| Burkina Faso | 2017 | N | Soil | MS-L8, RE | [19] |
| Egypt | 2017 | N | Peanut | HSS | [64] |
| Madagascar | 2017 | N | Soil | HSS | [65] |
| South Africa | 2017 | NPK | Swiss chard | HSS | [33] |
| Tanzania | 2017 | N | Coffee | MS-S2 | [66] |
| Zimbabwe | 2017 | N | Maize | UAV | [67] |
| Zimbabwe | 2017 | P | Wheat | MS-L8 | [68] |
| Tanzania | 2018 | NP | Rice | UAV | [69] |
| Madagascar | 2019 | P | Maize | HSS | [70] |
| South Africa | 2019 | P | Eucalyptus | HSS | [71] |
| Algeria | 2019 | N | Wheat | HSS | [72] |
| Egypt | 2020 | NPK | Soil | MS-L8, HSS | [20] |
| Egypt | 2020 | N | Maize | HSS | [73] |
| Africa | 2021 | NPK | Soil | HSS | [74] |
| Madagascar | 2021 | NPK | Soil | UAV | [25] |
| Malawi | 2021 | N | Maize | UAV | [75] |
| Morocco | 2021 | N | Wheat | MS-L8 | [48] |
| Morocco | 2021 | NPK | Soil | HSI | [76] |
| Nigeria | 2021 | NPK | Soil | MS-S2, MS-L8 | [77] |
| Findings | Remote Sensing Source | Modeling Approach | Reference |
|---|---|---|---|
| First-order derivatives of sugarcane leaf reflectance in VIS_NIR demonstrated high correlation with the underlying N concentration. | Spectroscopy | Simple linear regression | [58] |
| Red-edge Index based on leaf reflectance exhibited a linear relation to N concentration. | Spectroscopy | Spectral vegetation indices | [50] |
| Chlorophyll absorption centre wavebands-based indices were the best performers in estimating N concentration. | Spectroscopy | Spectral vegetation indices Linear regression and bootstrapping | [59] |
| Red-Edge Position showed a significant association to forage nitrogen content, whereas the variation in foliar phosphorus concentrations seemed to be associated with sugars and starch absorption features. | Spectroscopy | Linear regression | [60] |
| Grass Protein absorption features contributes significantly to the prediction of foliar N content. However no spectral features were found to be explaining the foliar P concentration. | Spectroscopy | Non-linear PLSR | [61] |
| The topographical and climatic parameters showed significant influence on the spatial variation of the estimated total nitrogen stock in soil | Landsat | Bivariate Correlations | [62] |
| High correlation between Leaf Chlorophyll content and the associated N concentration across under different N fertilization rates. | Multispectral UAV | Multiple linear regression Multiple Linear Regression-Kriging Geographically Weighted Re-gression Geographically Weighted Regression-Kriging | [63] |
| The weak association observed between soil N and soil reflectance data is due to the heterogenity in the agricultural soil management practices, and the variability of the climatic factors. | Landsat-RapidEye | PLSR | [19] |
| Studied spectral indices showed a significant relationship with nitrogen concentration and peanut nitrogen uptake. | Spectroscopy | Random Forest | [64] |
| Iterative stepwise elimination-based PLS performed a high prediction of soil total nitrogen from the first derivative of the Visible and Near-Infrared diffuse reflectance spectra. | Spectroscopy | regression analys | [65] |
| Inspite of the good performance of the model in predicting foliar NPK content from hyperspectral data, no specific region in the VIS-NIR spectra has made a particular absorption feature for foliar NPK concentration. | Spectroscopy | PLSR | [33] |
| Combining optimized bands of Sentinel 2 and derived vegetation indices achieved optimal models for the estimation of coffee foliar N | Sentinel 2 | MLR, RF, SVM Stochastic Gradient Boosting (SGB) | [66] |
| Some visible bands showed a significant but weak correlation with P content in maize leave, In contrast to the multispectral bands that significantly correlated with the difference in grain yield and N content under different P fertilization methods. | UAV | Multi Linear Regression | [67] |
| The relative greener area index showed a significant association with N status in wheat crop under different N fertilizers treatments. | Multispectral UAV | PLSR | [70] |
| Wavenbands that are sensitive to Al and Fe are found to be informative for estimating bound Extractable P bound contents. | Multispectral UAV | PLSR | [71] |
| The Model population Analysis framework associated with PLSR algorithm accurately selected optimal spectral absorption signals in the SWIR region that precdicts of leaf nitrogen content. | Landsat-Spectroscopy | Simple linear regression (SLR) Multivariate Regression Analyses | [20] |
| Reflectance resulting from spectroscopy demonstrated better estimation of soil NPK than satellite band reflectance | Spectroscopy | Multi Linear Regression | [73] |
| Penalized linear discriminant analysis (PLDA) applied on crop reflectance response was able to distinguish between different gradients of moisture and nitrogen induced stress. | Spectroscopy | PLSR, RF | [25] |
| The 1D-Convolutional Neural Network model showed a significant improvement in predicting soil P and the associated spectral wavebands. | Multispectral UAV | [75] | |
| RTVI index highly correlated with N uptake for all tested wheat varieties. | Multispectral UAV | Random Forest | [48] |
| The topographic attributes, Land surface temperature, soil bulk density, water holding capacity and soil organic matter significantly contributed to the variation of soil NPK. | Landsat | [77] |
Publisher’s Note: MDPI stays neutral with regard to jurisdictional claims in published maps and institutional affiliations. |
© 2021 by the authors. Licensee MDPI, Basel, Switzerland. This article is an open access article distributed under the terms and conditions of the Creative Commons Attribution (CC BY) license (https://creativecommons.org/licenses/by/4.0/).
Share and Cite
Misbah, K.; Laamrani, A.; Khechba, K.; Dhiba, D.; Chehbouni, A. Multi-Sensors Remote Sensing Applications for Assessing, Monitoring, and Mapping NPK Content in Soil and Crops in African Agricultural Land. Remote Sens. 2022, 14, 81. https://0-doi-org.brum.beds.ac.uk/10.3390/rs14010081
Misbah K, Laamrani A, Khechba K, Dhiba D, Chehbouni A. Multi-Sensors Remote Sensing Applications for Assessing, Monitoring, and Mapping NPK Content in Soil and Crops in African Agricultural Land. Remote Sensing. 2022; 14(1):81. https://0-doi-org.brum.beds.ac.uk/10.3390/rs14010081
Chicago/Turabian StyleMisbah, Khalil, Ahmed Laamrani, Keltoum Khechba, Driss Dhiba, and Abdelghani Chehbouni. 2022. "Multi-Sensors Remote Sensing Applications for Assessing, Monitoring, and Mapping NPK Content in Soil and Crops in African Agricultural Land" Remote Sensing 14, no. 1: 81. https://0-doi-org.brum.beds.ac.uk/10.3390/rs14010081