

A Framework Integrating DeeplabV3+, Transfer Learning, Active Learning, and Incremental Learning for Mapping Building Footprints

Key Laboratory of Land Surface Pattern and Simulation, Institute of Geographic Sciences and Natural Resources Research, Chinese Academy of Sciences, Beijing 100101, China
*
Author to whom correspondence should be addressed.
Remote Sens. 2022, 14(19), 4738; https://0-doi-org.brum.beds.ac.uk/10.3390/rs14194738
Submission received: 18 August 2022
/
Accepted: 19 September 2022
/
Published: 22 September 2022
(This article belongs to the Special Issue Active Learning Methods for Remote Sensing Image Classification)
Abstract
:Convolutional neural network (CNN)-based remote sensing (RS) image segmentation has become a widely used method for building footprint mapping. Recently, DeeplabV3+, an advanced CNN architecture, has shown satisfactory performance for building extraction in different urban landscapes. However, it faces challenges due to the large amount of labeled data required for model training and the extremely high costs associated with the annotation of unlabelled data. These challenges encouraged us to design a framework for building footprint mapping with fewer labeled data. In this context, the published studies on RS image segmentation are reviewed first, with a particular emphasis on the use of active learning (AL), incremental learning (IL), transfer learning (TL), and their integration for reducing the cost of data annotation. Based on the literature review, we defined three candidate frameworks by integrating AL strategies (i.e., margin sampling, entropy, and vote entropy), IL, TL, and DeeplabV3+. They examine the efficacy of AL, the efficacy of IL in accelerating AL performance, and the efficacy of both IL and TL in accelerating AL performance, respectively. Additionally, these frameworks enable the iterative selection of image tiles to be annotated, training and evaluation of DeeplabV3+, and quantification of the landscape features of selected image tiles. Then, all candidate frameworks were examined using WHU aerial building dataset as it has sufficient (i.e., 8188) labeled image tiles with representative buildings (i.e., various densities, areas, roof colors, and shapes of the building). The results support our theoretical analysis: (1) all three AL strategies reduced the number of image tiles by selecting the most informative image tiles, and no significant differences were observed in their performance; (2) image tiles with more buildings and larger building area were proven to be informative for the three AL strategies, which were prioritized during the data selection process; (3) IL can expedite model training by accumulating knowledge from chosen labeled tiles; (4) TL provides a better initial learner by incorporating knowledge from a pre-trained model; (5) DeeplabV3+ incorporated with IL, TL, and AL has the best performance in reducing the cost of data annotation. It achieved good performance (i.e., mIoU of 0.90) using only 10–15% of the sample dataset; DeeplabV3+ needs 50% of the sample dataset to realize the equivalent performance. The proposed frameworks concerning DeeplabV3+ and the results imply that integrating TL, AL, and IL in human-in-the-loop building extraction could be considered in real-world applications, especially for building footprint mapping.
1. Introduction
Worldwide, rapid urbanization and urban revitalization are occurring, and approximately two-thirds of the world population will live in urban areas by 2050 [1]. Extracting and updating building footprints is critical for a wide range of sustainable development applications, including urban planning, population health, and risk assessment [2,3].
Due to rapid advancements in remote sensing (RS) technology and deep learning (DL), pixel-level image segmentation using very high resolution (VHR) RS data and Convolutional Neural Network (CNN) architectures have become widely used methods for extracting building footprints, with many studies focusing on developing new models or improving the accuracy of existing models [2,4,5,6,7,8,9]. Some CNN architectures have demonstrated good performance in mapping the building footprints in a variety of landscapes (e.g., urban areas, suburban areas, urban villages/slums, and damaged buildings) [4,10,11,12,13]. More recently, DeeplabV3+, the latest Deeplab architecture, has been increasingly used for building extraction and multiple land use mapping as it enables refinement of the building boundaries while incorporating other strategies, such as dilated convolution and spatial pyramid pooling [5,14,15,16].
In real-world applications, generating sufficient informative labeled data is an important issue for achieving accurate building extraction. Although there are some open-source datasets for building footprints, such as SpaceNet, Inria Aerial Image, Massachusetts Building dataset, and WHU aerial building dataset [14,17,18,19,20,21], and some publicly available pre-trained models, mapping building footprints in a specific study area, especially a large-scale region, still needs a sufficient number of training and validation samples to calculate and update the hyperparameters due to landscape differences and the complexity and diversity of buildings [6,22,23]. However, manual data labeling is highly dependent on prior knowledge of RS and geographic information systems (GIS), time consuming, and labor intensive [24,25]. Additionally, RS images covering the study area should be divided into an appropriate number of image tiles, with a small size (e.g., 512 × 512 pixels) acceptable CNN architectures. However, it is commonly unknown which image tiles are informative for model training. These limitations impede the efficient extraction and updating of building footprints, particularly when large-scale building footprint mapping is required. In this case, it is crucial to propose an efficient framework for selecting informative data and achieving a satisfying building footprint map with fewer labeled data.
Numerous methods have been proposed in the field of artificial intelligence to facilitate model training with fewer labeled samples from a variety of perspectives, including active learning (AL), incremental learning (IL), and transfer learning (TL). To begin with, a framework incorporating AL and deep learning is used to query the unlabeled dataset. It prioritizes informative unlabeled data for human annotation, thereby lowering the cost of data annotation and optimizing the performance of models built with fewer labeled data [26]. Recently, it has been applied to a variety of computer vision tasks, including segmentation of satellite images [27,28], segmentation of medical images [29,30], and image classification [31]. Secondly, IL accelerates the accumulation of DL model knowledge by retaining previous model knowledge and continuously fine-tuning the previous model with new samples, which has been used in land use mapping [22,32,33]. Thirdly, TL refers to a method of learning that makes use of pre-trained models’ knowledge to address target tasks [34]. In RS applications, pre-trained models are often transferred in space and time for the same task, such as transferring pre-trained CNN architectures for crop mapping to identify crop types in different regions or periods [35,36], or pre-trained models are transferred based on their similarity to two distinct tasks, such as transferring CNN architectures trained on nighttime light intensities to predict poverty [37]. Additionally, it has been demonstrated that combining AL with IL and/or TL accelerates DL model training with fewer labeled data in a variety of tasks [33,38]. To our knowledge, no studies on the performance of AL, IL, TL, and incorporated methods in building footprint mapping have been conducted to date.
In this context, focusing on building footprint mapping using DeeplabV3+, this study aims to clarify the effectiveness of AL in reducing the efforts of data annotation and the role of both IL and TL in facilitating DeeplabV3+ training and propose a human-in-the-loop framework for building footprint mapping by integrating AL, IL, and TL. It makes three contributions as follows: (i) We summarize the commonly used AL strategies, IL, and TL for RS image segmentation, as well as their interrelations. (ii) We propose a framework by integrating AL, IL, TL, and DeeplabV3+ and greatly improve the effectiveness of building footprint mapping. The proposed framework suggests that leveraging the knowledge of an appropriate pre-trained model and incrementally acquiring knowledge from actively selected samples can significantly reduce the effort associated with data annotation. (iii) We preliminarily understand the priority of image tiles in data annotation to achieve an efficient building footprint mapping.
The remainder of this paper is organized as follows: Section 2 reviews related works on AL strategies, IL, and TL for RS image segmentation; Section 3 proposes three candidate frameworks for improving the effectiveness of building footprint mapping; Section 4 outlines experiments quantifying and comparing the performance of the candidate frameworks; Section 5 presents the results of the experiments; Section 6 discusses the limitations of this study and makes some recommendations for future building extraction; Section 7 summarizes the major findings in this study.
2. Related Works
2.1. AL in RS Image Segmentation
AL aims to query data iteratively using a variety of different strategies, select informative data from an unlabeled dataset for manual annotation in each iteration, and optimize model performance using fewer labeled data. As a result, AL enables the cost of human annotation to be reduced. There are several types of query strategies described in the literature on AL, including uncertainty sampling, query-by-committee, expected model change, expected error reduction, variance reduction, and density-based methods [39]. Uncertainty sampling is the most frequently used method in machine learning or DL-based LULC mapping, which selects samples with the greatest prediction uncertainty. For instance, Li et al. (2014) computed margin sampling to select candidate samples for the margin of the model and enhanced the performance of the model in LULC mapping using Landsat images and 15 different pixel- and object-based machine learning classifiers [40]. Hamrouni et al. (2020) efficiently constructed a global random forest classifier for poplar plantations from a local one by using margin sampling and entropy to select informative samples in new geographical regions and retain the local classifier [41]. Recently, Wang et al. (2021) investigated landslide mapping using two widely used AL strategies, uncertainty sampling and query by committee, in conjunction with a support vector machine classifier. They found that uncertainty sampling significantly reduced the cost of data annotation and outperformed queries by committee [42]. Robinson et al. (2020) used entropy, min-margin, randomness, and mistakes to fine-tune the model for high-resolution LULC mapping, and compared the performance of models to that of models fine-tuned with human-selected samples [27]. Additionally, random sampling is frequently used as a baseline for evaluating the contribution of AL strategies to machine learning and DL tasks [27,41].
2.2. IL in RS Image Segmentation
IL aims to incrementally update the model with new data while retaining the knowledge gained from previous data, thereby speeding up the training process. Thus, IL complements the current DL model by continuously accumulating knowledge. It has benefited land use (LU) mapping based on image segmentation in RS communities in recent years. For instance, Zhang et al. (2017) constructed a neural network (NN), adjusted the hidden layer of the NN to incrementally learn from new samples, and obtained an efficient and accurate model of road type recognition using 1 million RS images [43]. Tasar et al. (2019) proposed an IL method based on three RS datasets with multiple spectral bands and very high spatial resolution that enables learning capability for new LU classes while maintaining dense labeling capability for previous classes [32]. Yang et al. (2020) proposed a geographical IL model (named GeoBoost) for achieving the building footprint mapping required by the CNN architecture, a model that combines the U-Net and NASNet-Mobile to learn from data containing varying geographical information. The proposed method is valid for image segmentation when applied to a self-defined building dataset covering 100 cities worldwide with red, green, and blue spectral bands and a spatial resolution of 30 cm [22].
2.3. TL in RS Image Segmentation
TL, which includes inductive, transductive, and unsupervised TL, aims to use the knowledge gained from an existing task to solve a new task that is related to the existing one [34]. It is a viable option for reducing the effort required to collect training data and training time in real-world applications, which has benefited image segmentation in the RS community [44]. For example, Wurm et al. (2019) examined model transferability by focusing on slum mapping and transferring the pre-trained FCN model on QuickBird to Sentinel-2 and TerraSAR-X using an inductive TL approach. The findings indicate that pre-trained FCNs can significantly improve segmentation accuracy when used in conjunction with Sentinel-2 [4]. Ulmas and Liiv (2020) trained the ResNet50 on the BigEarthNet dataset, used the pre-trained model as the encoder for the modified U-Net, and retrained the modified U-Net on a small dataset to obtain land cover (LC) maps [45]. Zhang et al. (2020) addressed road extraction on Wuhan satellite data using the ResNet37 model trained on other two road datasets (i.e., Deepglobe and Spacenet road datasets) and FND-Linknet as encoder and decoder, respectively [46]. Nowakowski et al. (2021) addressed crop type classification using VGG16 and GoogLeNet trained on the ImageNet dataset, a computer vision dataset and fine-tuned the parameters of pre-trained models using training data derived from unmanned aerial vehicles (UAVs) [35]. TL and CNN architectures, in particular, can be used in conjunction to transfer knowledge and overcome the lack of training data. However, pre-trained models should be used carefully, and it provides a better starting point for the final convergence of the target task in case of sufficient data in the source task and high similarity between source and target tasks [47].
2.4. Interrelations between AL, IL, and TL
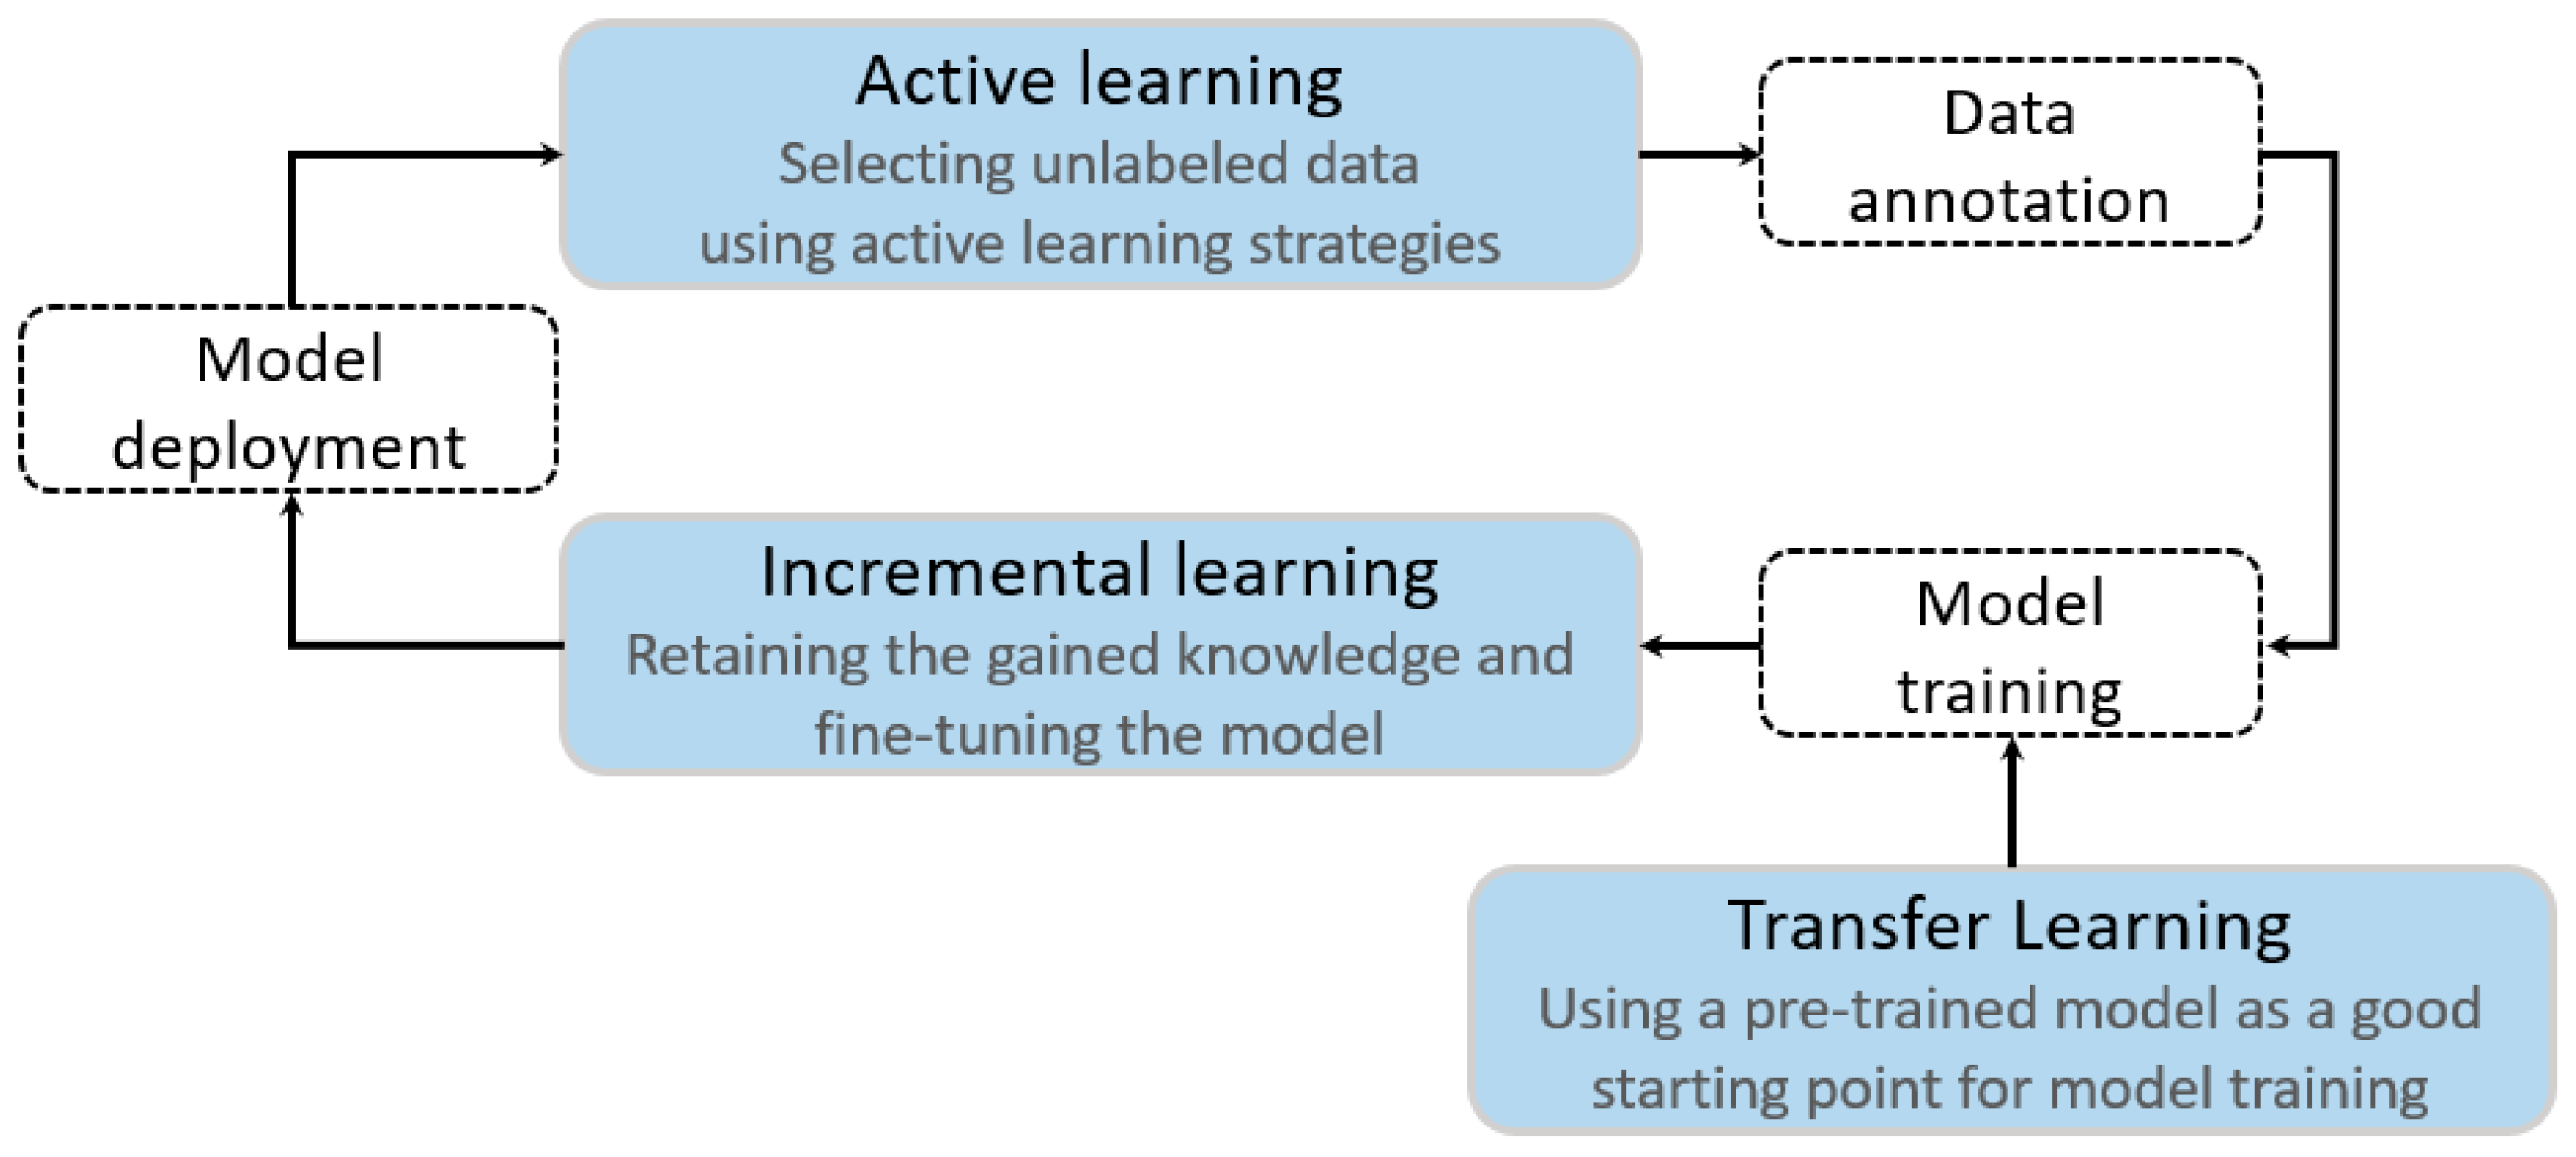
More recently, integrating AL, IL, and/or TL has been used to solve the problem with less resource consumption. For example, Zhou et al. (2017) successfully combined AL and IL to process biomedical images by fine-tuning the parameters of an existing network, thereby reducing both annotation effort and training time [38]. Lin et al. (2020) used a combination of three AL strategies and IL to segment ALS point clouds. They actively selected unlabeled data for annotation and incrementally fine-tuned the parameters of PointNet++ [33]. Shi et al. (2019) used a pre-trained multiple-input deep neural network (MIDNN) model and AL to select samples from unlabeled data and incrementally fine-tune the previous model to detect atrial fibrillation using electrocardiogram data [48]. These applications imply the interrelations between AL, IL, and TL in image segmentation tasks: adaptive use of a pre-trained model on the source domain data can provide more useful knowledge for model training; AL permits iteratively querying the target domain data using different strategies to select more informative unlabeled data to be annotated; IL permits accumulation of knowledge obtained from the pre-trained model and newly labeled data and incrementally updates the parameters in the process of the model training (Figure 1).
3. The Candidate Frameworks for Efficient Building Footprint Mapping
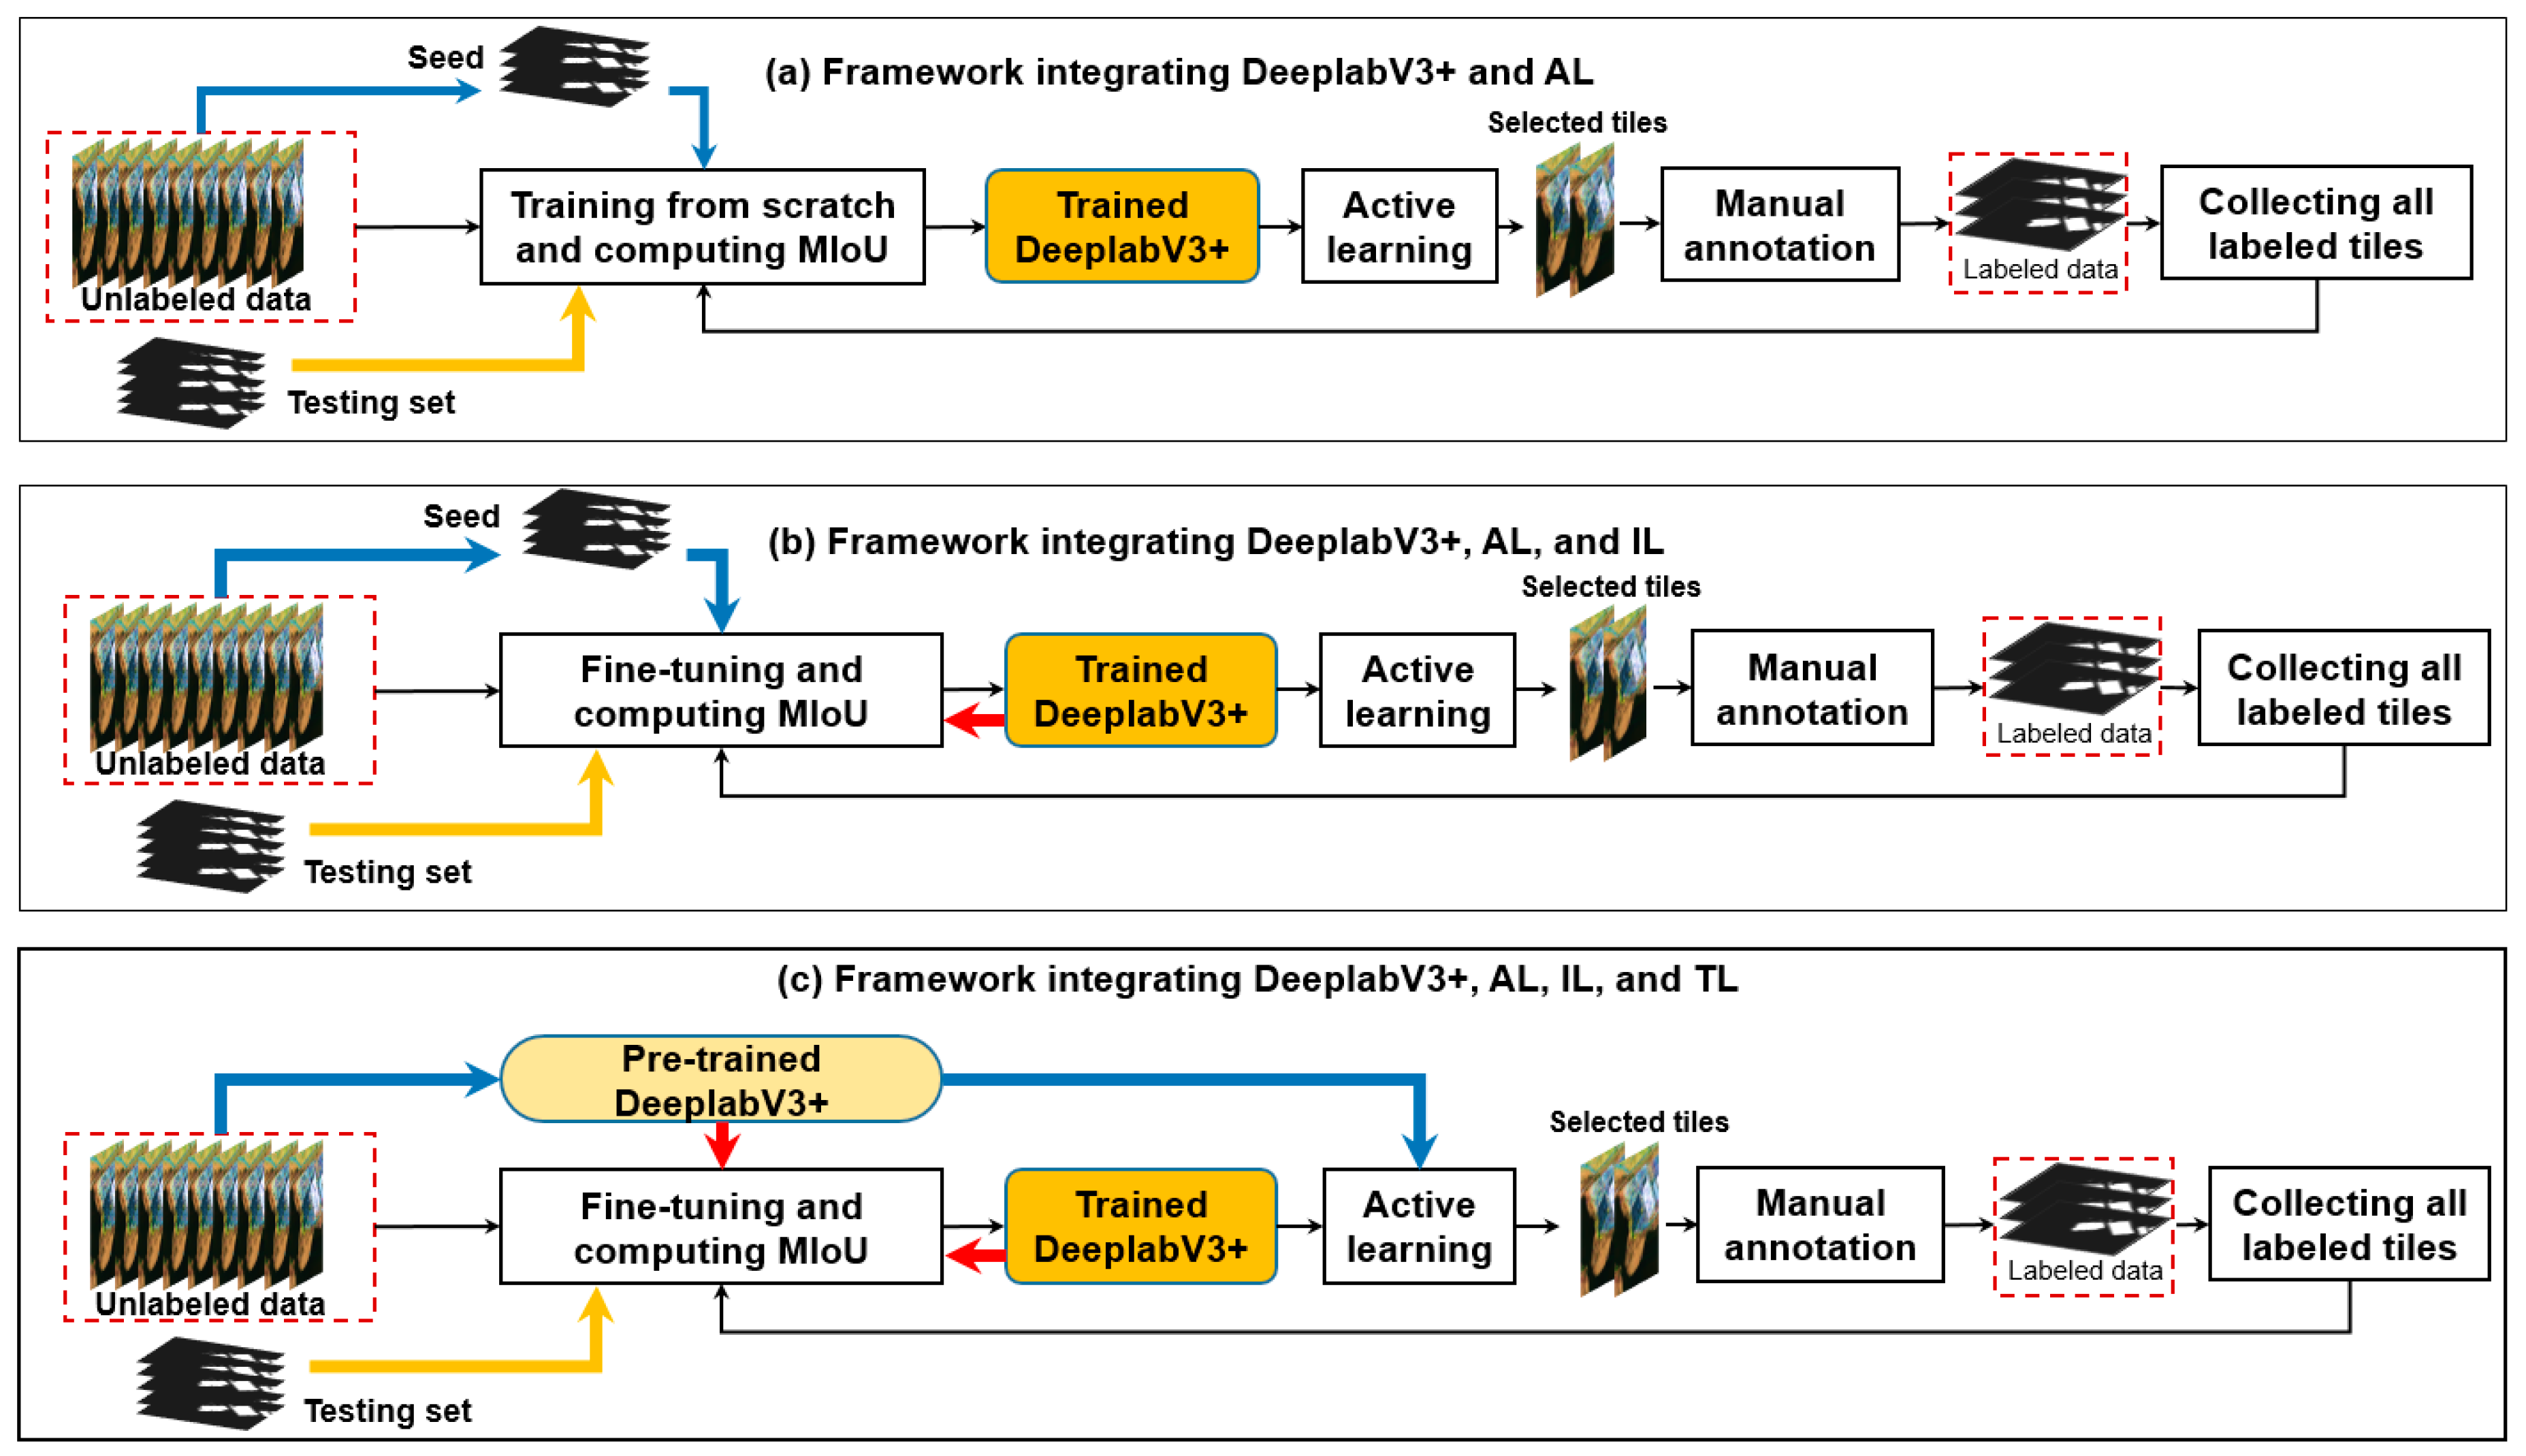
Based on the interrelations between AL, IL, and TL (Figure 1) and the human–machine collaboration method for LULC mapping [27], three candidate frameworks for efficient building footprint mapping using DeeplabV3+ are proposed (Figure 2).
They have the following common steps: (1) model training and evaluation in the first iteration, and (2) AL-based data selection, manual data annotation, collection of all labeled data, model re-training, and model evaluation in each iteration from the second iteration.
Differently, framework (a) examines the efficacy of various AL strategies and uses the seed set to initialize the model in the first iteration and trains the model from scratch (i.e., constructing and training a new model) in the next iteration; framework (b) examines the efficacy of using both AL and IL and also uses the seed set to initialize the model in the first iteration, but keeps the last trained model and fine-tunes it in the next iteration; framework (c) examines the efficacy of using AL, IL, and IL and uses a pre-trained model (i.e., a model trained on another dataset) in the first iteration and fine-tunes it in the next iteration.
Each framework generates a series of trained models (i.e., one trained model per iteration), which are evaluated using the testing set.
3.1. DeepLabV3+
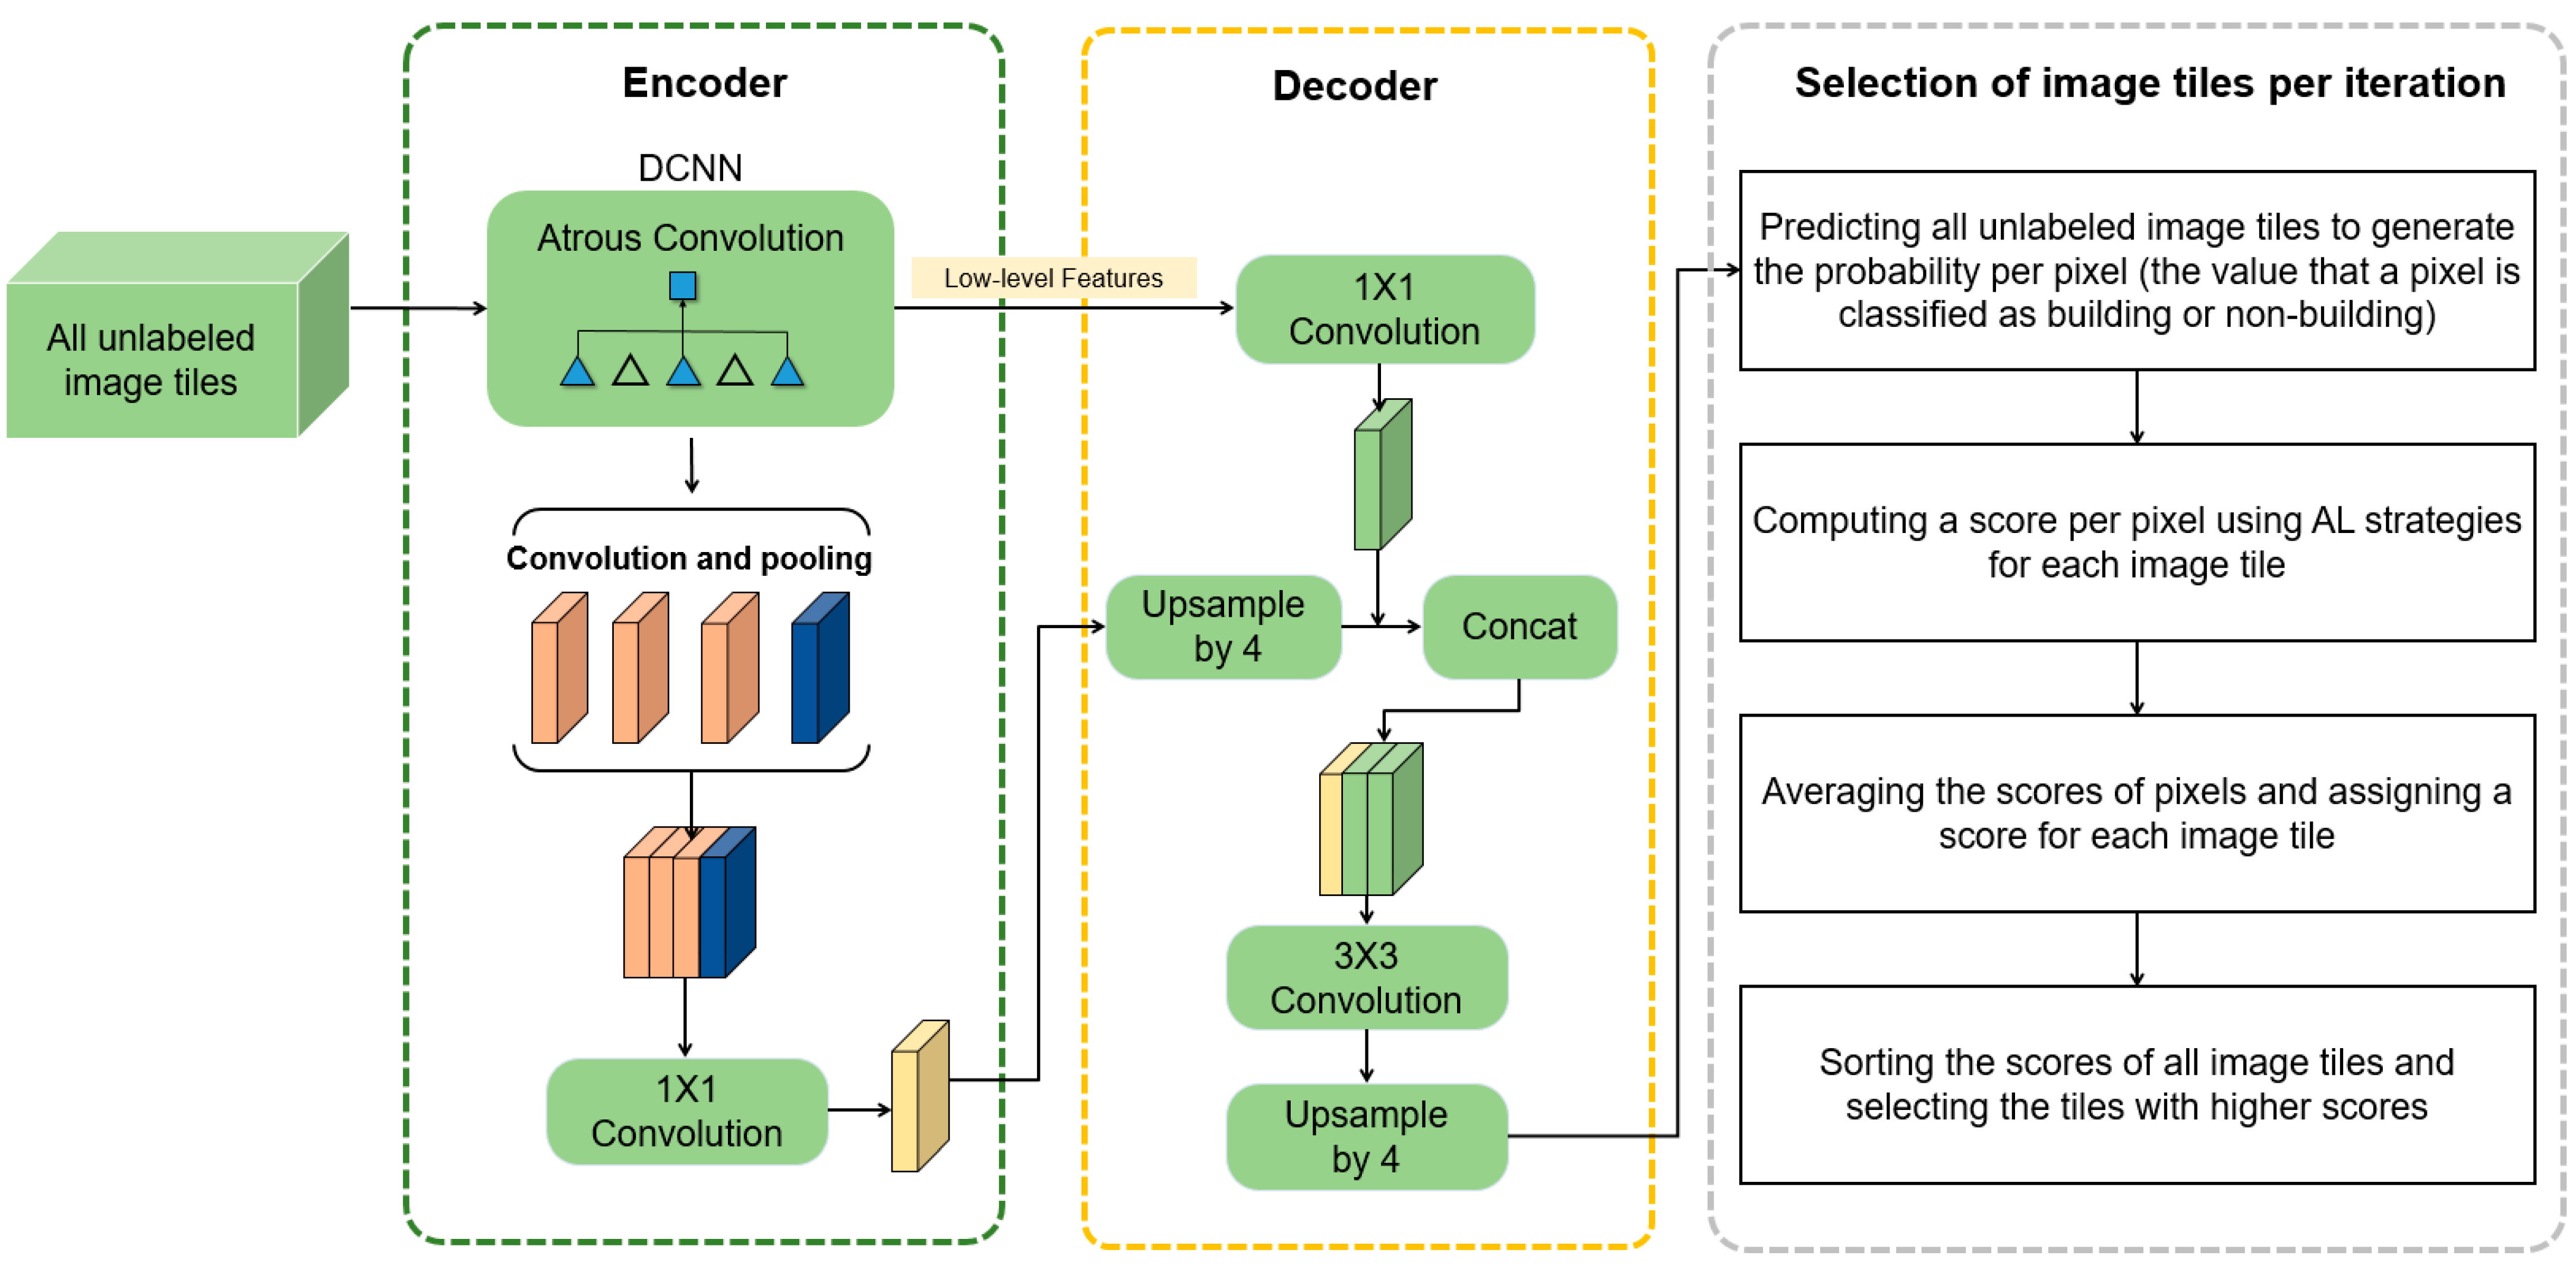
DeepLabV3+ is one of the most powerful image segmentation networks available [49]. It uses DeepLabV3 to encode multi-view information and decode it using the corresponding low-level features. DeepLabV3 takes advantage of a combination of atrous spatial pyramid pooling (ASPP) and variable dilation rates. It improves the resolution of the final feature map while also dealing with multi-scale objects. This study chose pre-trained MobileNetV2 as the backbone of DeepLabV3. MobileNetV2 is a lightweight Deep Convolutional Neural Network (DCNN). It accelerates computations by substituting Depthwise separable convolution for standard convolution. MobileNetV2 also makes use of residual blocks. The key enhancements to Deeplab models are atrous convolution and ASPP. In DCNN, a constrained receptive field limits the amount of information gained from the upper layers.
Subsampling techniques such as pooling and convolution are always used to increase the receptive field and reduce computation. However, traditional subsampling methods reduce the resolution of the feature map, making it more difficult to segment the image precisely. Atrous convolution and ASPP address this issue by extracting information at multiple scales with varying dilation rates. Rather than processing pixels one after the other, atrous convolution and ASPP jump a fixed number of pixels to efficiently expand the receptive field while maintaining an acceptable feature map resolution. DeeplabV3+ further improves atrous convolution by introducing atrous separable convolution. It combines atrous and depthwise separable convolution to significantly accelerate the computation. In the case of ASPP, both cascaded and parallel modules can improve performance. In this project, parallel modules were chosen. Instead of upsampling bilinearly by the fixed number, DeepLabV3+ upsamples twice and makes use of low-level features from DCNNs in the decoder. Due to the detailed pixel-level information obtained from DCNN, the additional decoder module significantly outperforms the naive decoder module.
3.2. Sample Selection
Three frequently used AL strategies were used in this study to iteratively select new data for manual annotation: margin sampling (MS), entropy (H), and vote entropy (VE). All three strategies choose informative samples based on , which is the probability of being classified as in the current model . MS is an example of an uncertainty-based strategy in which the difference between the first and second-largest probability of a sample is calculated and the samples with the smallest difference are selected [50].
where denotes the difference between the first and second-largest probabilities of the sample, and and denote the labels with the largest and second-largest probabilities, respectively.
H is another uncertainty-based strategy that ranks all unlabeled data in descending order by Shannon’s entropy and chooses samples with a high entropy for human annotation [50].
where denotes Shannon’s entropy and ranges over all possible labels of .
VE is one of the AL strategies for query-by-committee that assesses the level of committee disagreement and selects the samples with the highest entropy for human annotation [50].
where denotes the voter entropy, is the number of votes that a label received from the committee member, and C is the number of the committee members.
All unlabeled image tiles in the training set are predicted using the last-trained DeeplabV3+ to compute the probability per pixel (i.e., the probability that a pixel is classified as building or non-building). Then, the score values are computed for pixels of each tile using AL, and a score per image tile is given by averaging the scores of pixels. A fixed number of unlabeled image tiles are selected by sorting the image tile-level scores and selecting the tiles with higher scores (Figure 3). Additionally, to evaluate the performance of AL strategies, random sampling was used and the same amount of unlabeled data was selected in each iteration.
3.3. IL and TL
In frameworks (b) and (c), IL is used to fine-tune the CNN model using both AL strategies and random sampling in each iteration, as well as previously selected tiles. It is worth noting that the task of this study is a binary classification (i.e., built-up/non-built-up mapping), and no new classes are introduced during the AL process. Additionally, to introduce TL in framework (c), we make use of pre-trained CNN models to implement the initial selection of informative samples via AL strategies and random sampling.
3.4. Model Evaluation per Iteration
Based on the testing set, we evaluated the model performance using mIoU, which represents the ratio of intersection and union of ground truth and prediction. The mIoU is calculated as follows [50]:
where k + 1 denotes the total number of classes, denotes the number of pixels belonging to i that are predicted to be class i, denotes the number of pixels belonging to i that are predicted to be class j, and denotes the number of pixels belonging to j that are predicted to be class i.
4. Datasets and Experiments
4.1. Datasets
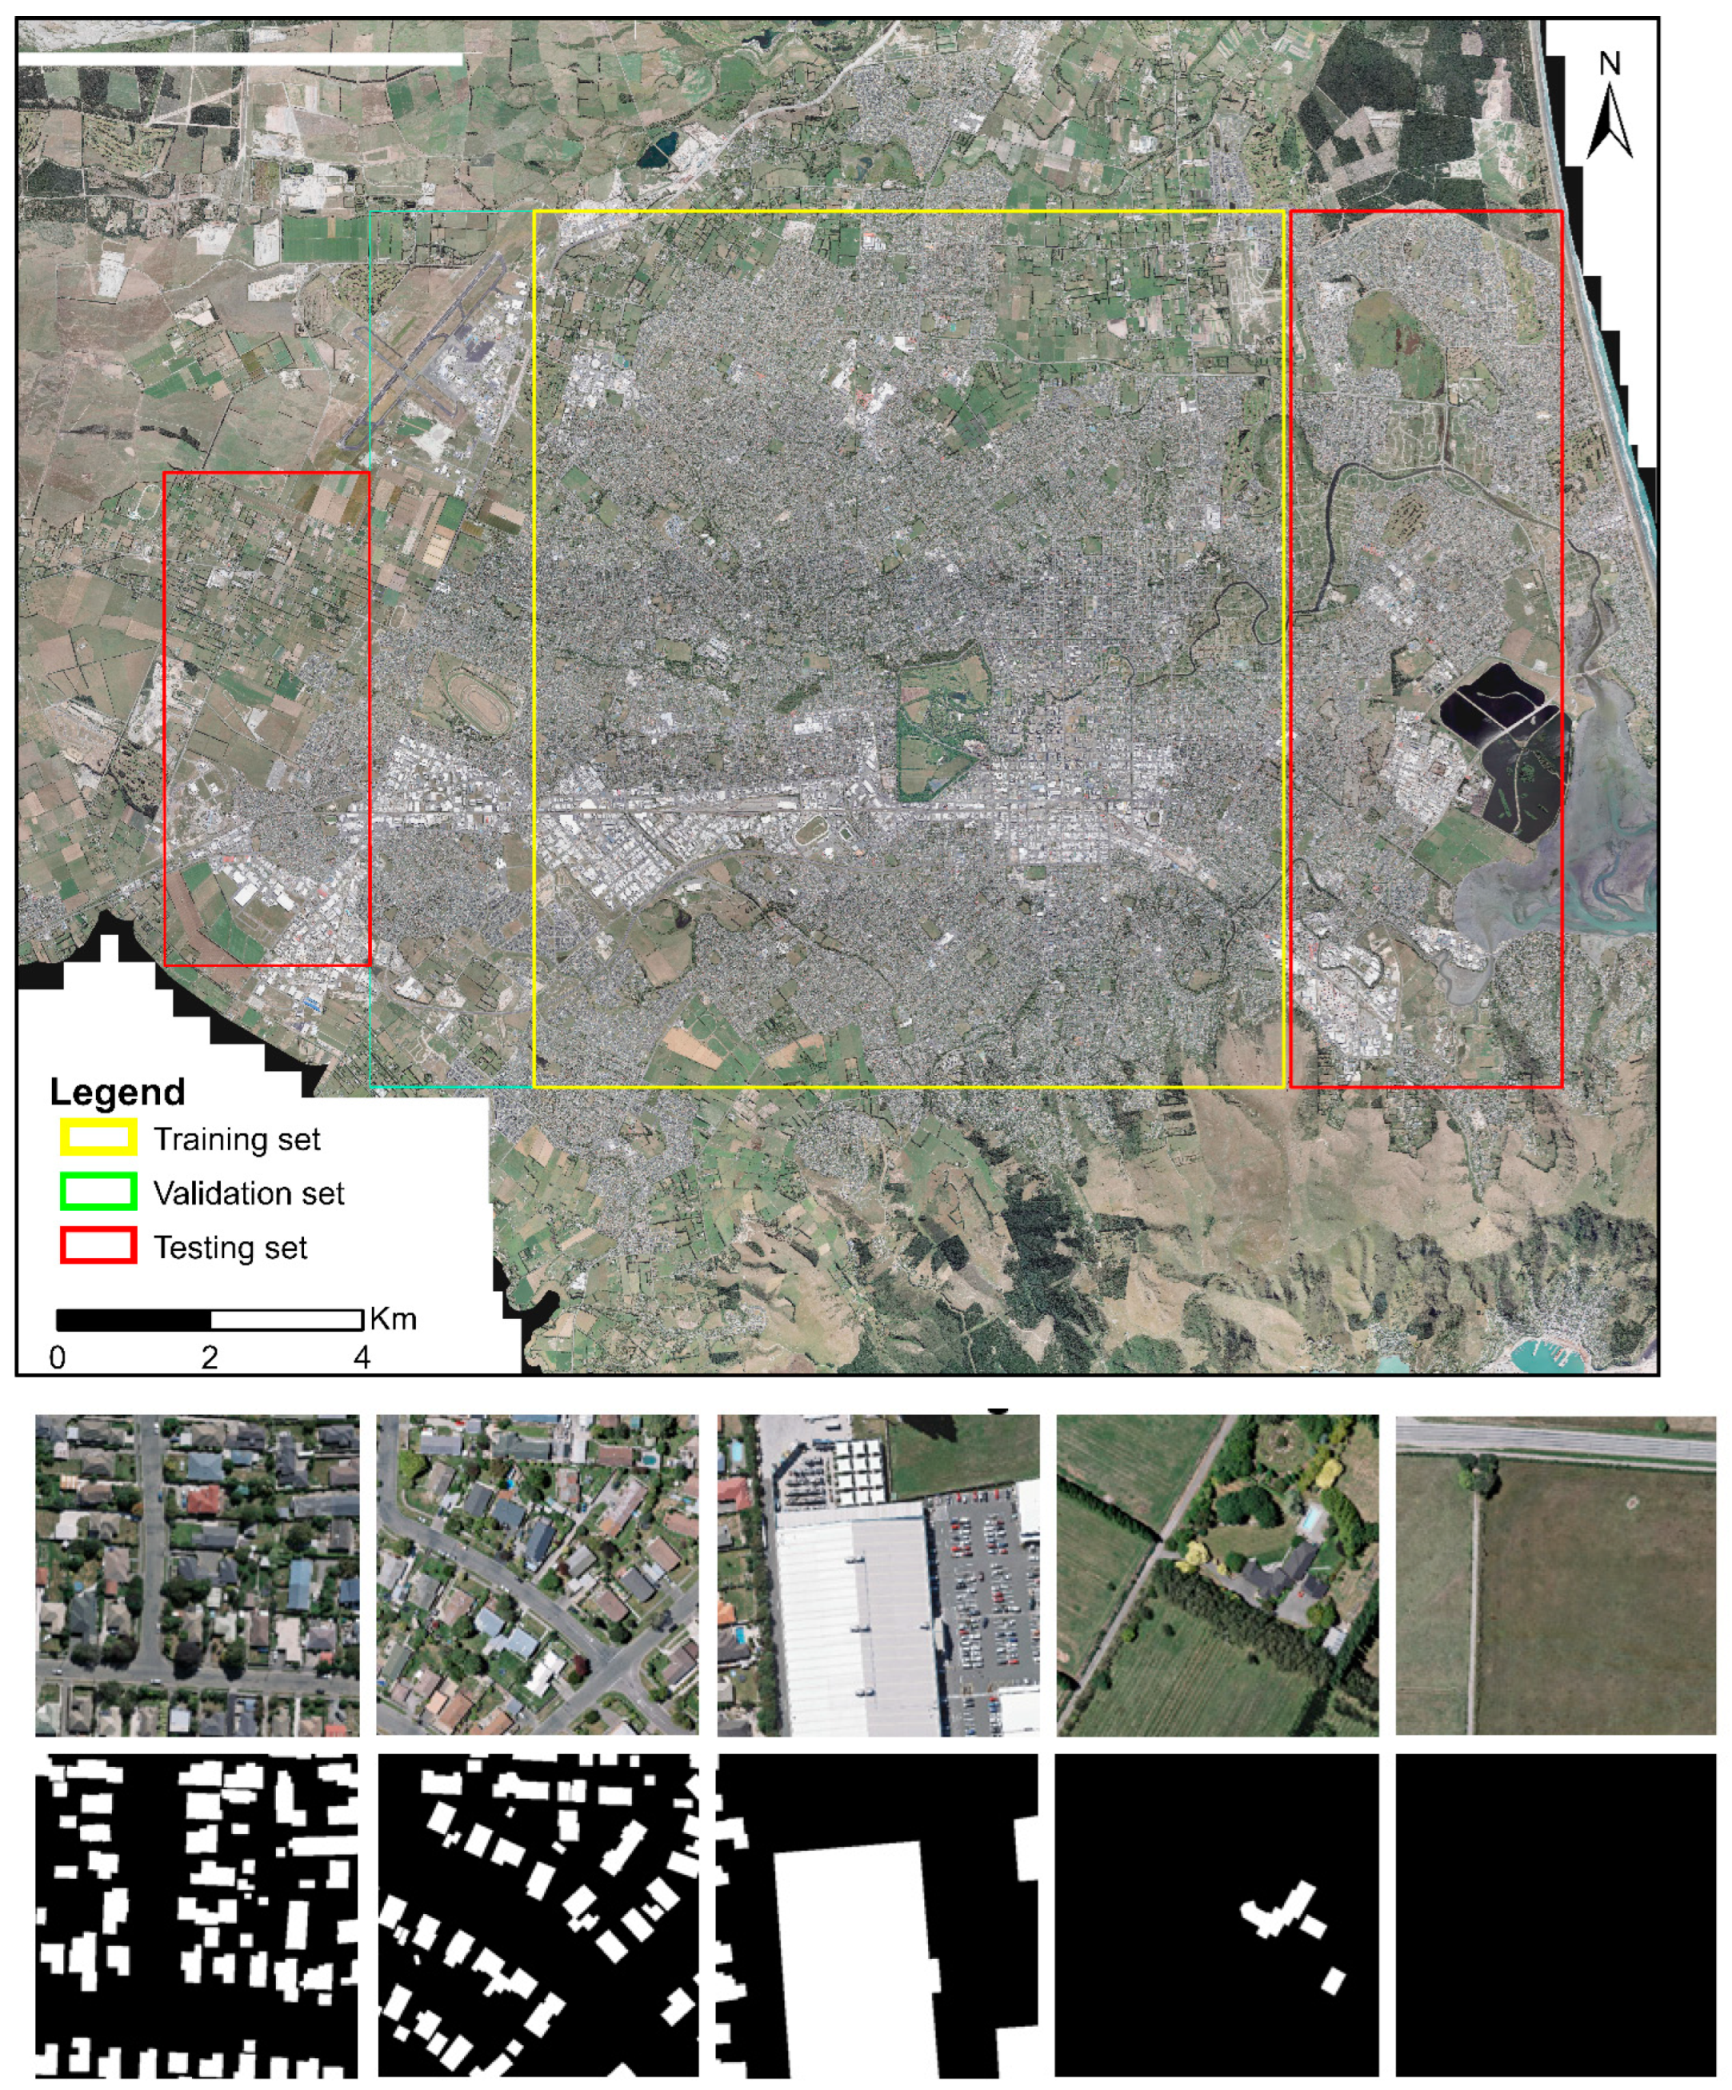
To illustrate the effectiveness of frameworks (a), (b), and (c), three experiments (i.e., experiments (a), (b), and (c)) were conducted using the WHU aerial building dataset, respectively. It is a standard dataset of building footprints consisting of 8188 labeled tiles with 512 × 512 pixels and a spatial resolution of 0.30 m [46]. It includes three datasets: training, validation, and testing sets (Table 1), which are spatially separated (Figure 4). It includes tiles with buildings of various densities, areas, roof colors, and shapes (Figure 4) [18].
4.2. Experiments
As illustrated in Figure 2, the seed set was selected from the training set and used to train the DeeplabV3+ model in experiments (a) and (b) in the first iteration. To introduce TL in experiment (c), we trained a DeeplabV3+ model with all image tiles of another dataset, namely WHU satellite building dataset II. This dataset is frequently used in building footprint mapping; it includes 3135 image tiles in the training set and 903 image tiles in the testing set covering East Asia cities. All image tiles have the same size (i.e., 512 × 512 pixels) and spatial resolution (i.e., 0.45 m) [18]. This pre-trained model was applied in the first iteration of experiment (c) for the initial data selection. Then, using an active and random selection process, 5% of the dataset was selected at a time for data annotation, and all the labeled tiles in previous iterations were used to retrain the DeeplabV3+ model. Here, the portion of data was selected as 5% to query in each iteration subjectively because selecting one tile per iteration requires a significant amount of time to run the training and selection processes, and selecting more tiles (e.g., 10% and 20%) per iteration conflicts with the objective of AL (i.e., reducing the cost of data annotation). In experiment (a), the DeeplabV3+ model was trained from scratch. The DeeplabV3+ model was fine-tuned in experiments (b) and (c) using all labeled data to introduce IL and TL. The obtained model in each iteration was used to segment the image tiles in the testing set, and the mIoU was calculated by comparing the predicted results to the labels in the testing set. The epoch was set to 100 for the mIoU computation, the mIoU was computed every 20 epochs, and the maximum of the five mIoU values was saved. Additionally, the learning rate was set to 0.1 and the batch size was set to 64 during training. The experiments (a), (b), and (c) were implemented without interruption on two Nvidia Tesla V100 GPUs until all image tiles in the training set were used. The DeeplabV3+ models used in experiments (a), (b), and (c) all had the same parameters as those in Table 2.
4.3. Comparison of Tiles Selected per Iteration and That of the Testing Set
To determine which image tiles will be prioritized by active learning, the average percentage of buildings per iteration, the number of tiles without buildings per iteration, and the average number of buildings per iteration were computed based on labeled tiles selected for each iteration in frameworks (a), (b), and (c) and three class-level metrics (i.e., the proportion of landscape, total area, and the number of patches) provided by PyLandStats, an open-source Pythonic library for computing landscape metrics [51]. We also computed the same landscape metrics for image tiles of the testing set to compare the difference between selected tiles of each iteration (i.e., tiles used for model training in the next iteration) and the testing set.
5. Results
5.1. Comparison of AL Strategies and Random Sampling in Terms of Model Performance and Landscape Metrics
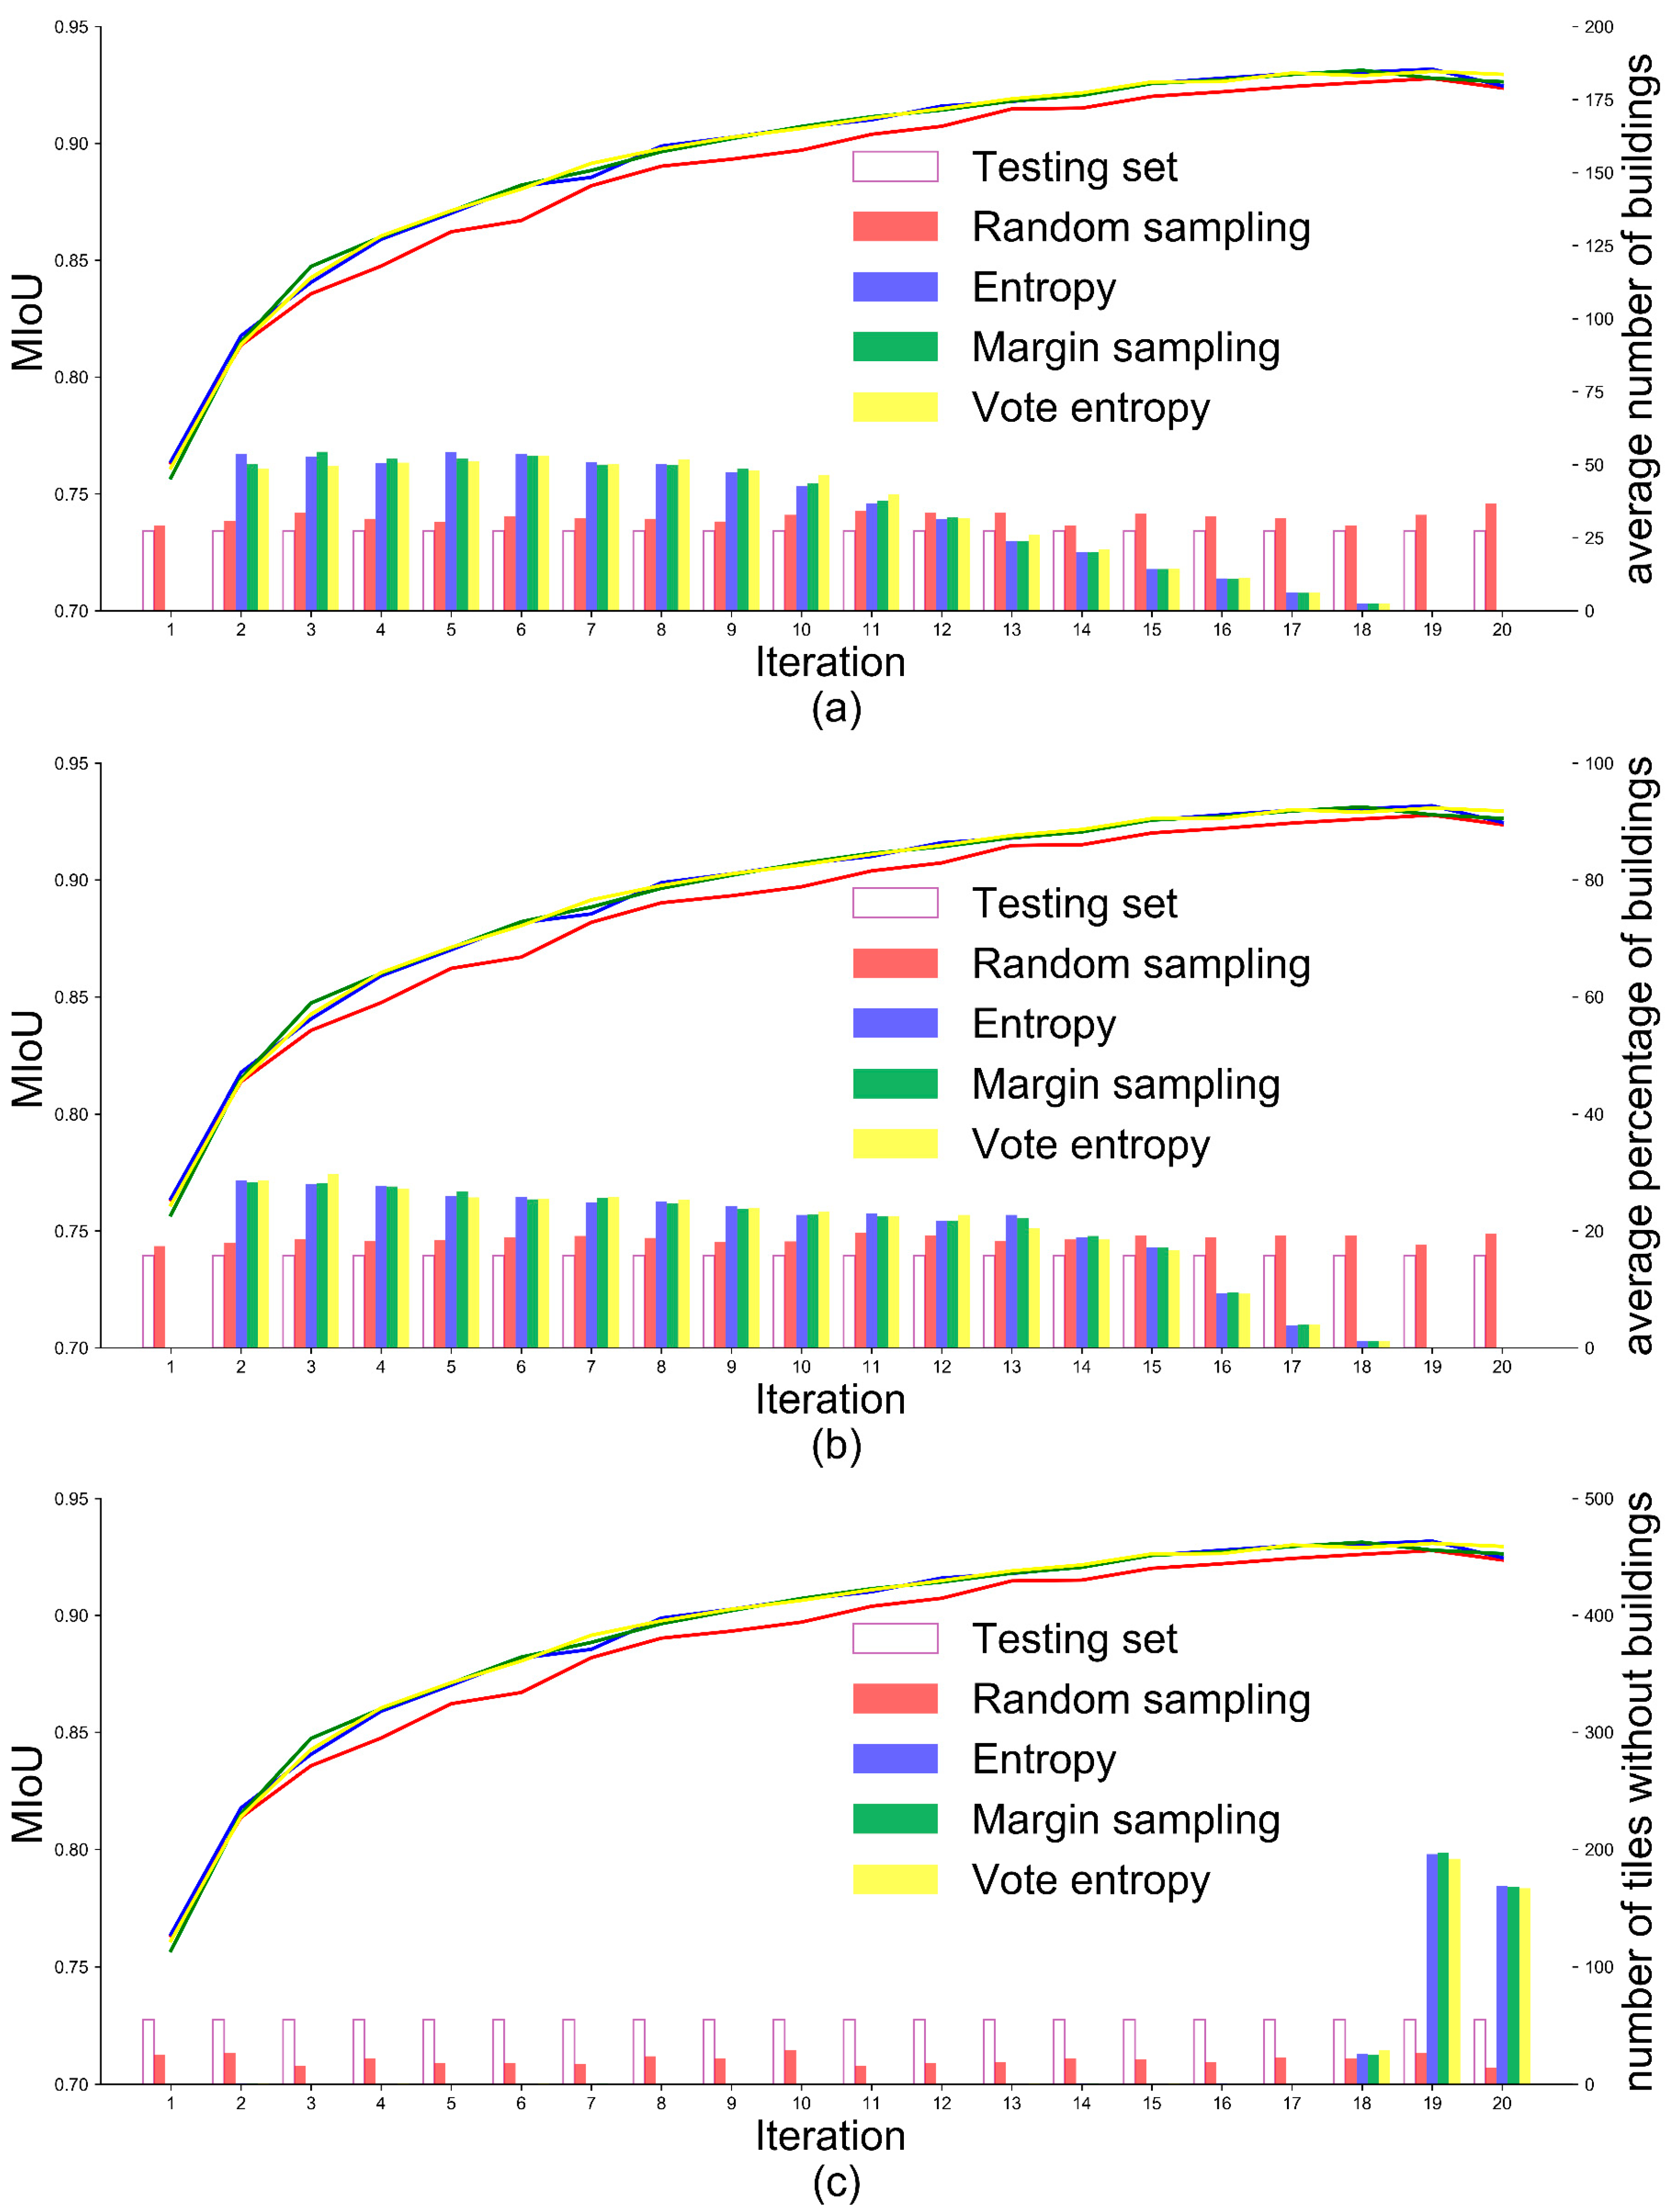
Figure 5 presents the performance of the framework incorporating DeeplabV3+ and AL (i.e., framework (a) in Figure 2) and the values of landscape metrics in each iteration of experiment (a). The mIoU of DeeplabV3+ increases with the increase in the number of iterations (i.e., the increase in the number of selected tiles), and AL strategies consistently outperformed random sampling. This demonstrates that incorporating DeeplabV3+ and AL selects informative image tiles for DeeplabV3+ model training and thus minimizes data annotation effort. However, when comparing the three AL strategies, it is difficult to determine which one is superior. In terms of landscape metrics of image tiles selected by AL, the average number of buildings (Figure 5a) and the average percentage of buildings (Figure 5b) have been trending downward with the increase in the number of tiles. The tiles without building had little or no effect on model training between the 2nd and 17th iterations (Figure 5c). In contrast, landscape metrics for tiles selected randomly and the testing set remain relatively constant throughout the sample selection process (Figure 5a–c). This demonstrates that when incorporating DeeplabV3+ and AL, image tiles with more building patches and a larger building area are preferred.
5.2. Comparative Analysis of Incorporating IL and TL in Deep Active Learning in Terms of Model Performance Improvement
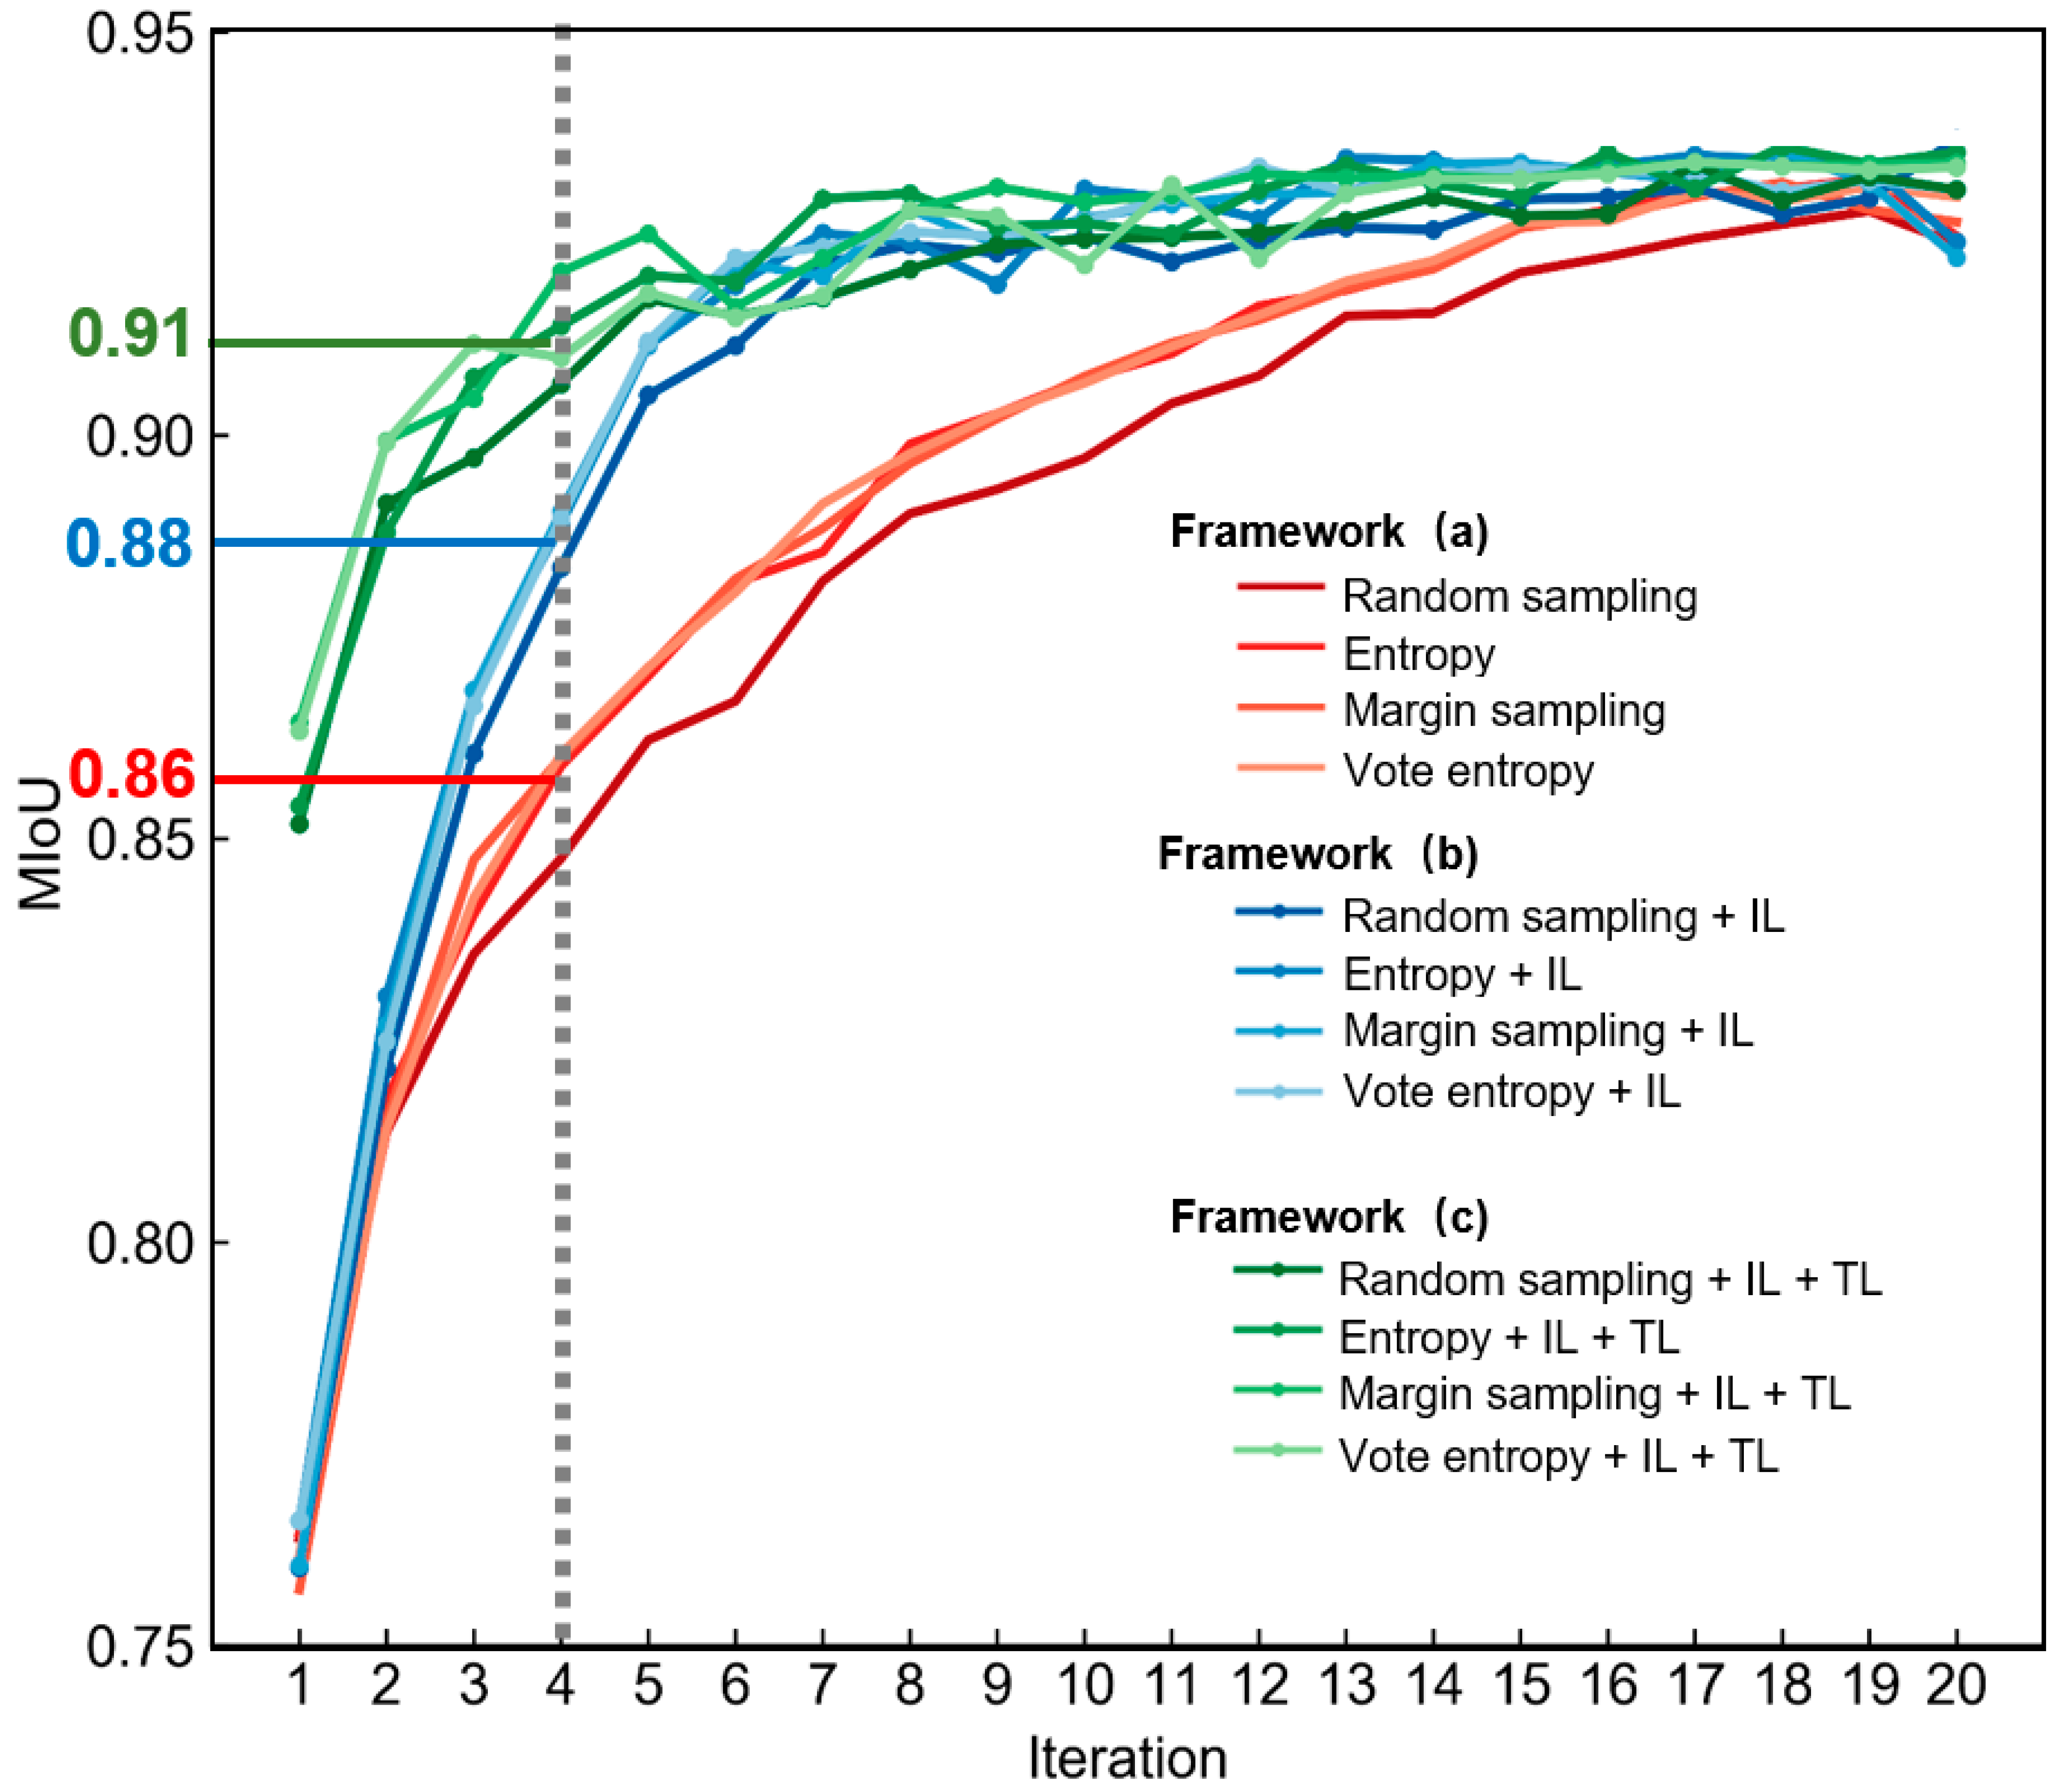
Figure 6 presents the comparison of frameworks (a), (b), and (c) in terms of model performance and the number of image tiles. Compared with framework (a), framework (b) (i.e., integrating IL with framework (a)) greatly improved the model performance (see the blue curves in Figure 6). It allows the model performance to be improved rapidly with increasing sample size, reaching satisfactory accuracy with fewer labeled tiles. This confirms that accumulating knowledge from previously selected tiles and fine-tuning can accelerate the model training. Framework (c) (i.e., integrating TL with framework (b)) could achieve the optimal accuracy of building footprint mapping with the fewest labeled image tiles. The high mIoU values (i.e., 0.85–0.87) in the first iteration for framework (c) suggest that pre-trained models incorporated the knowledge from other datasets and can provide a stronger foundation for the next iteration (see the green curves in Figure 6).
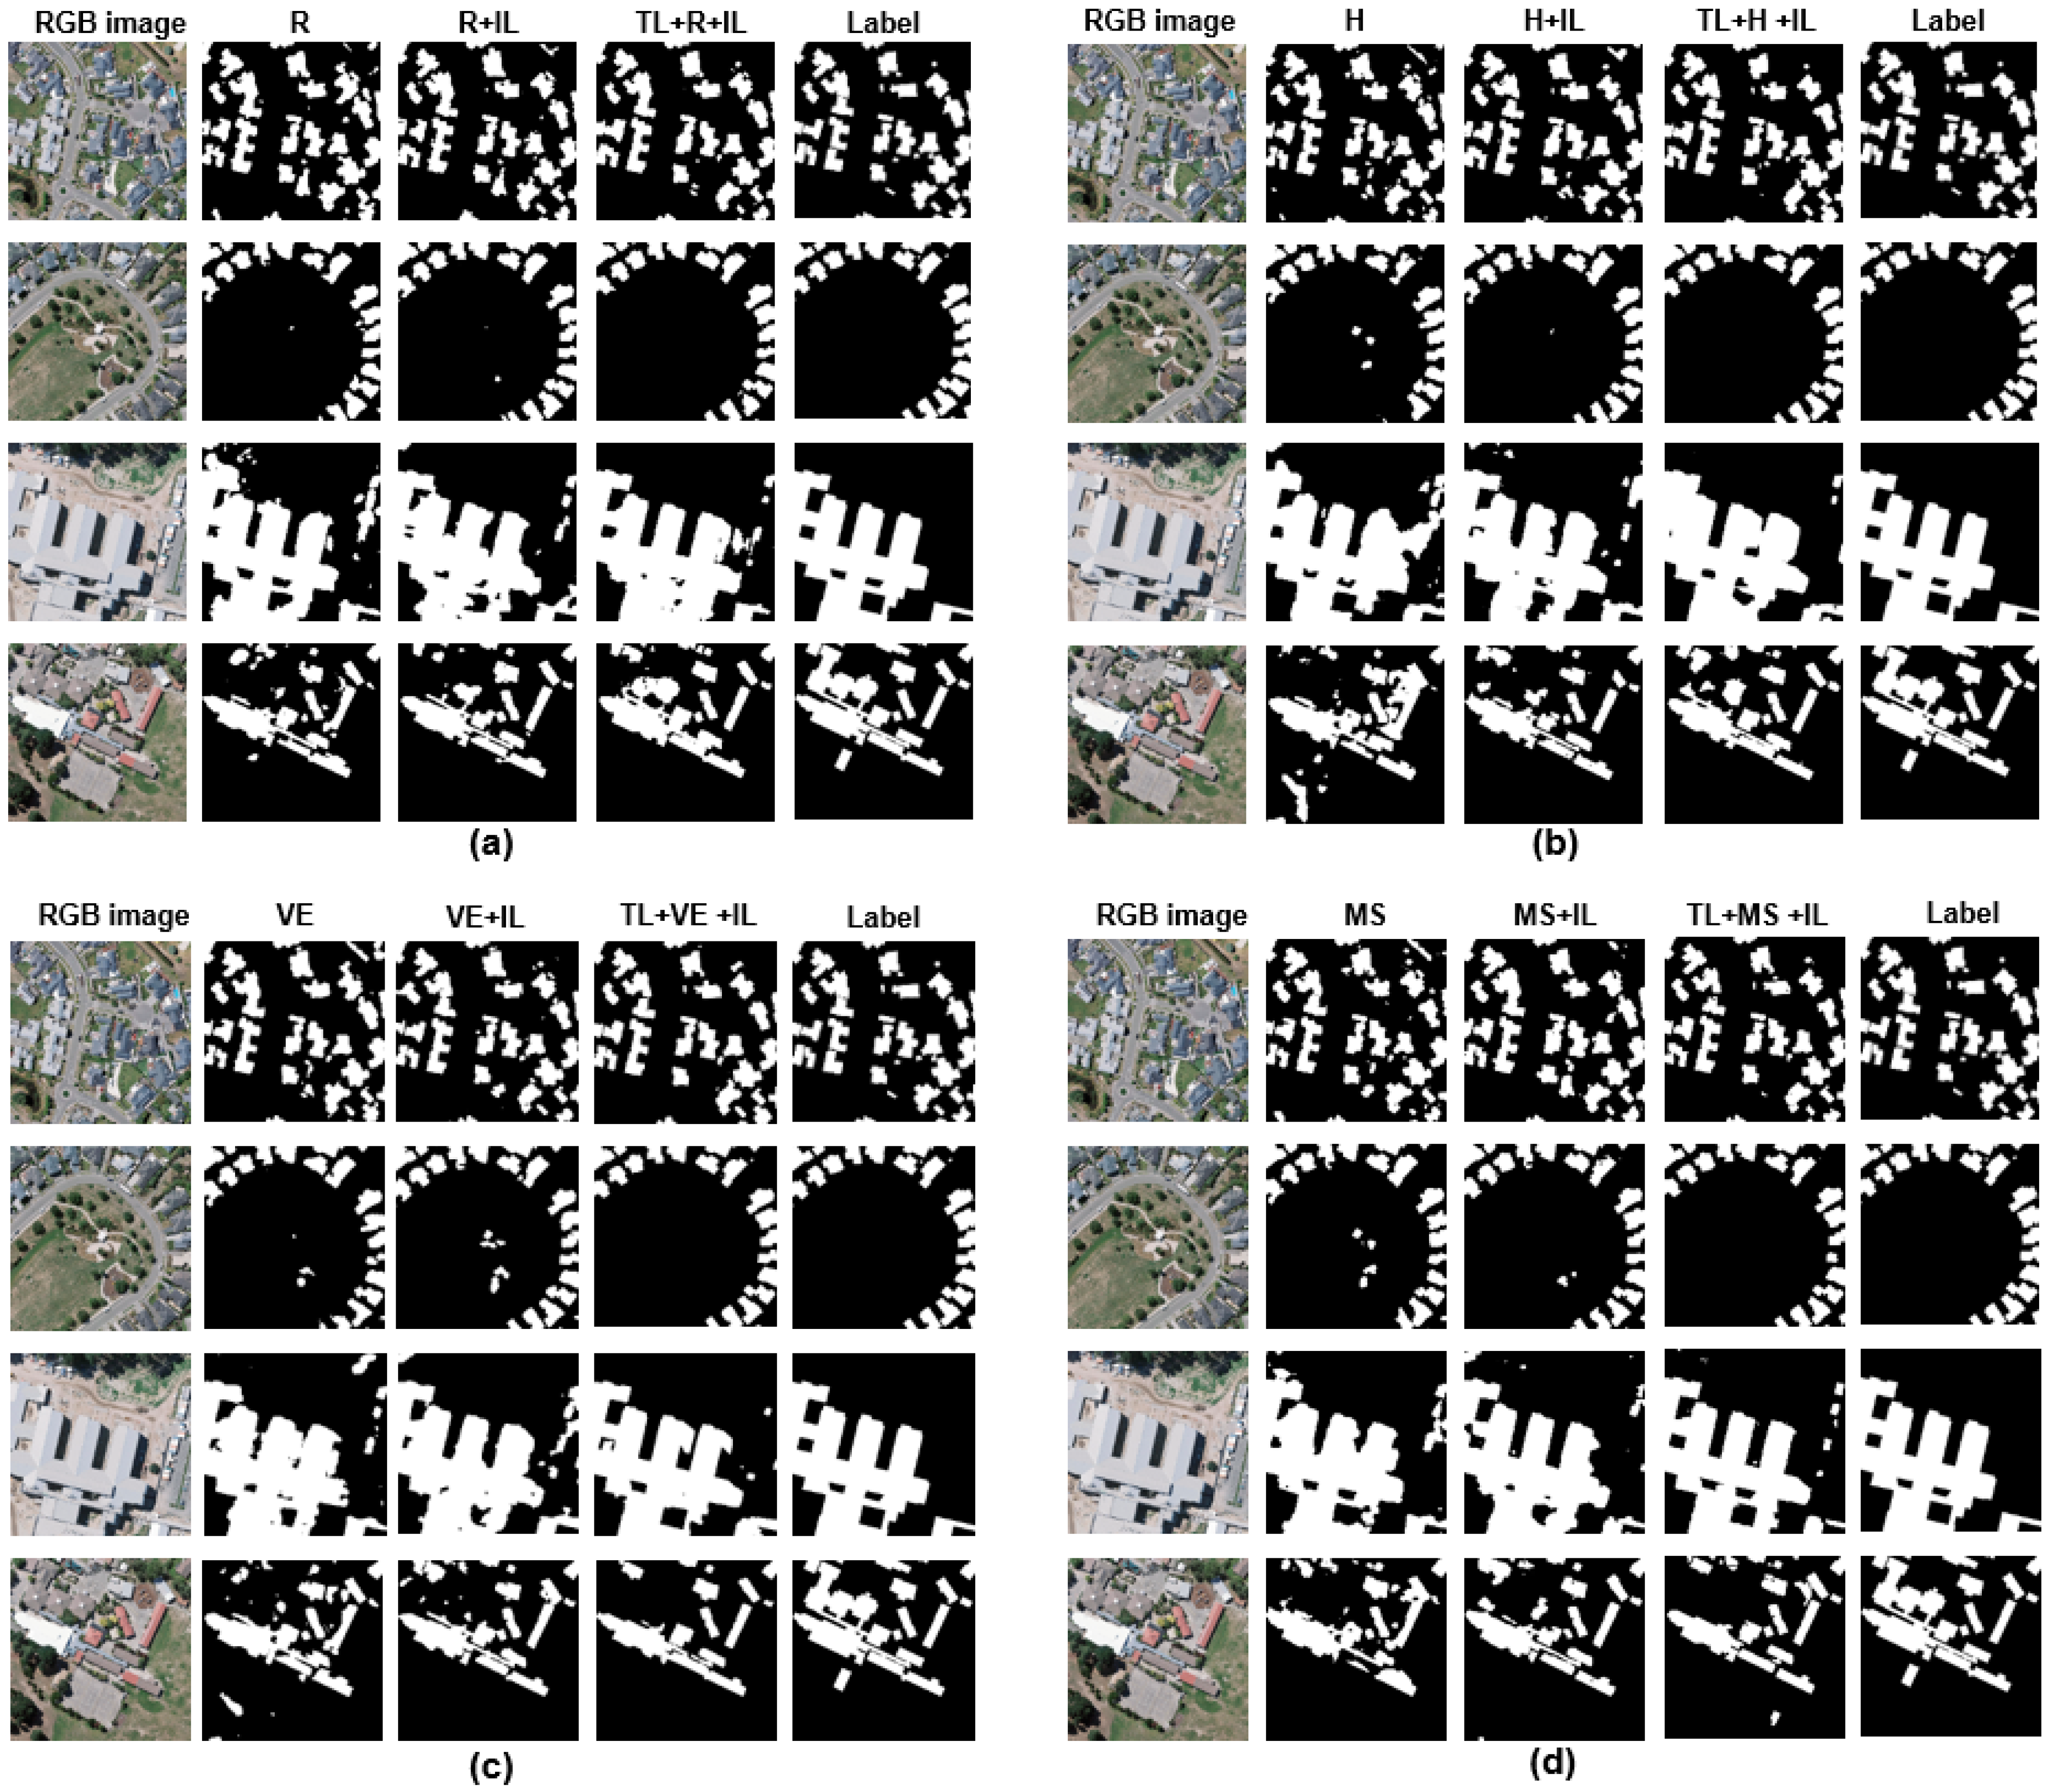
Moreover, the three frameworks have a large difference in terms of model performance when using a small size of labeled image tiles (e.g., from 2nd to 6th iteration). Taking the 4th iteration as an example, the image segmentation accuracies achieved by frameworks (a), (b), and (c) are 0.86, 0.88, and 0.91, respectively. The segmented results are shown in Figure 7; the results derived from framework (c) are closer to the labels.
5.3. Comparative Analysis of Incorporating IL and TL in Deep Active Learning in Terms of Landscape Metrics
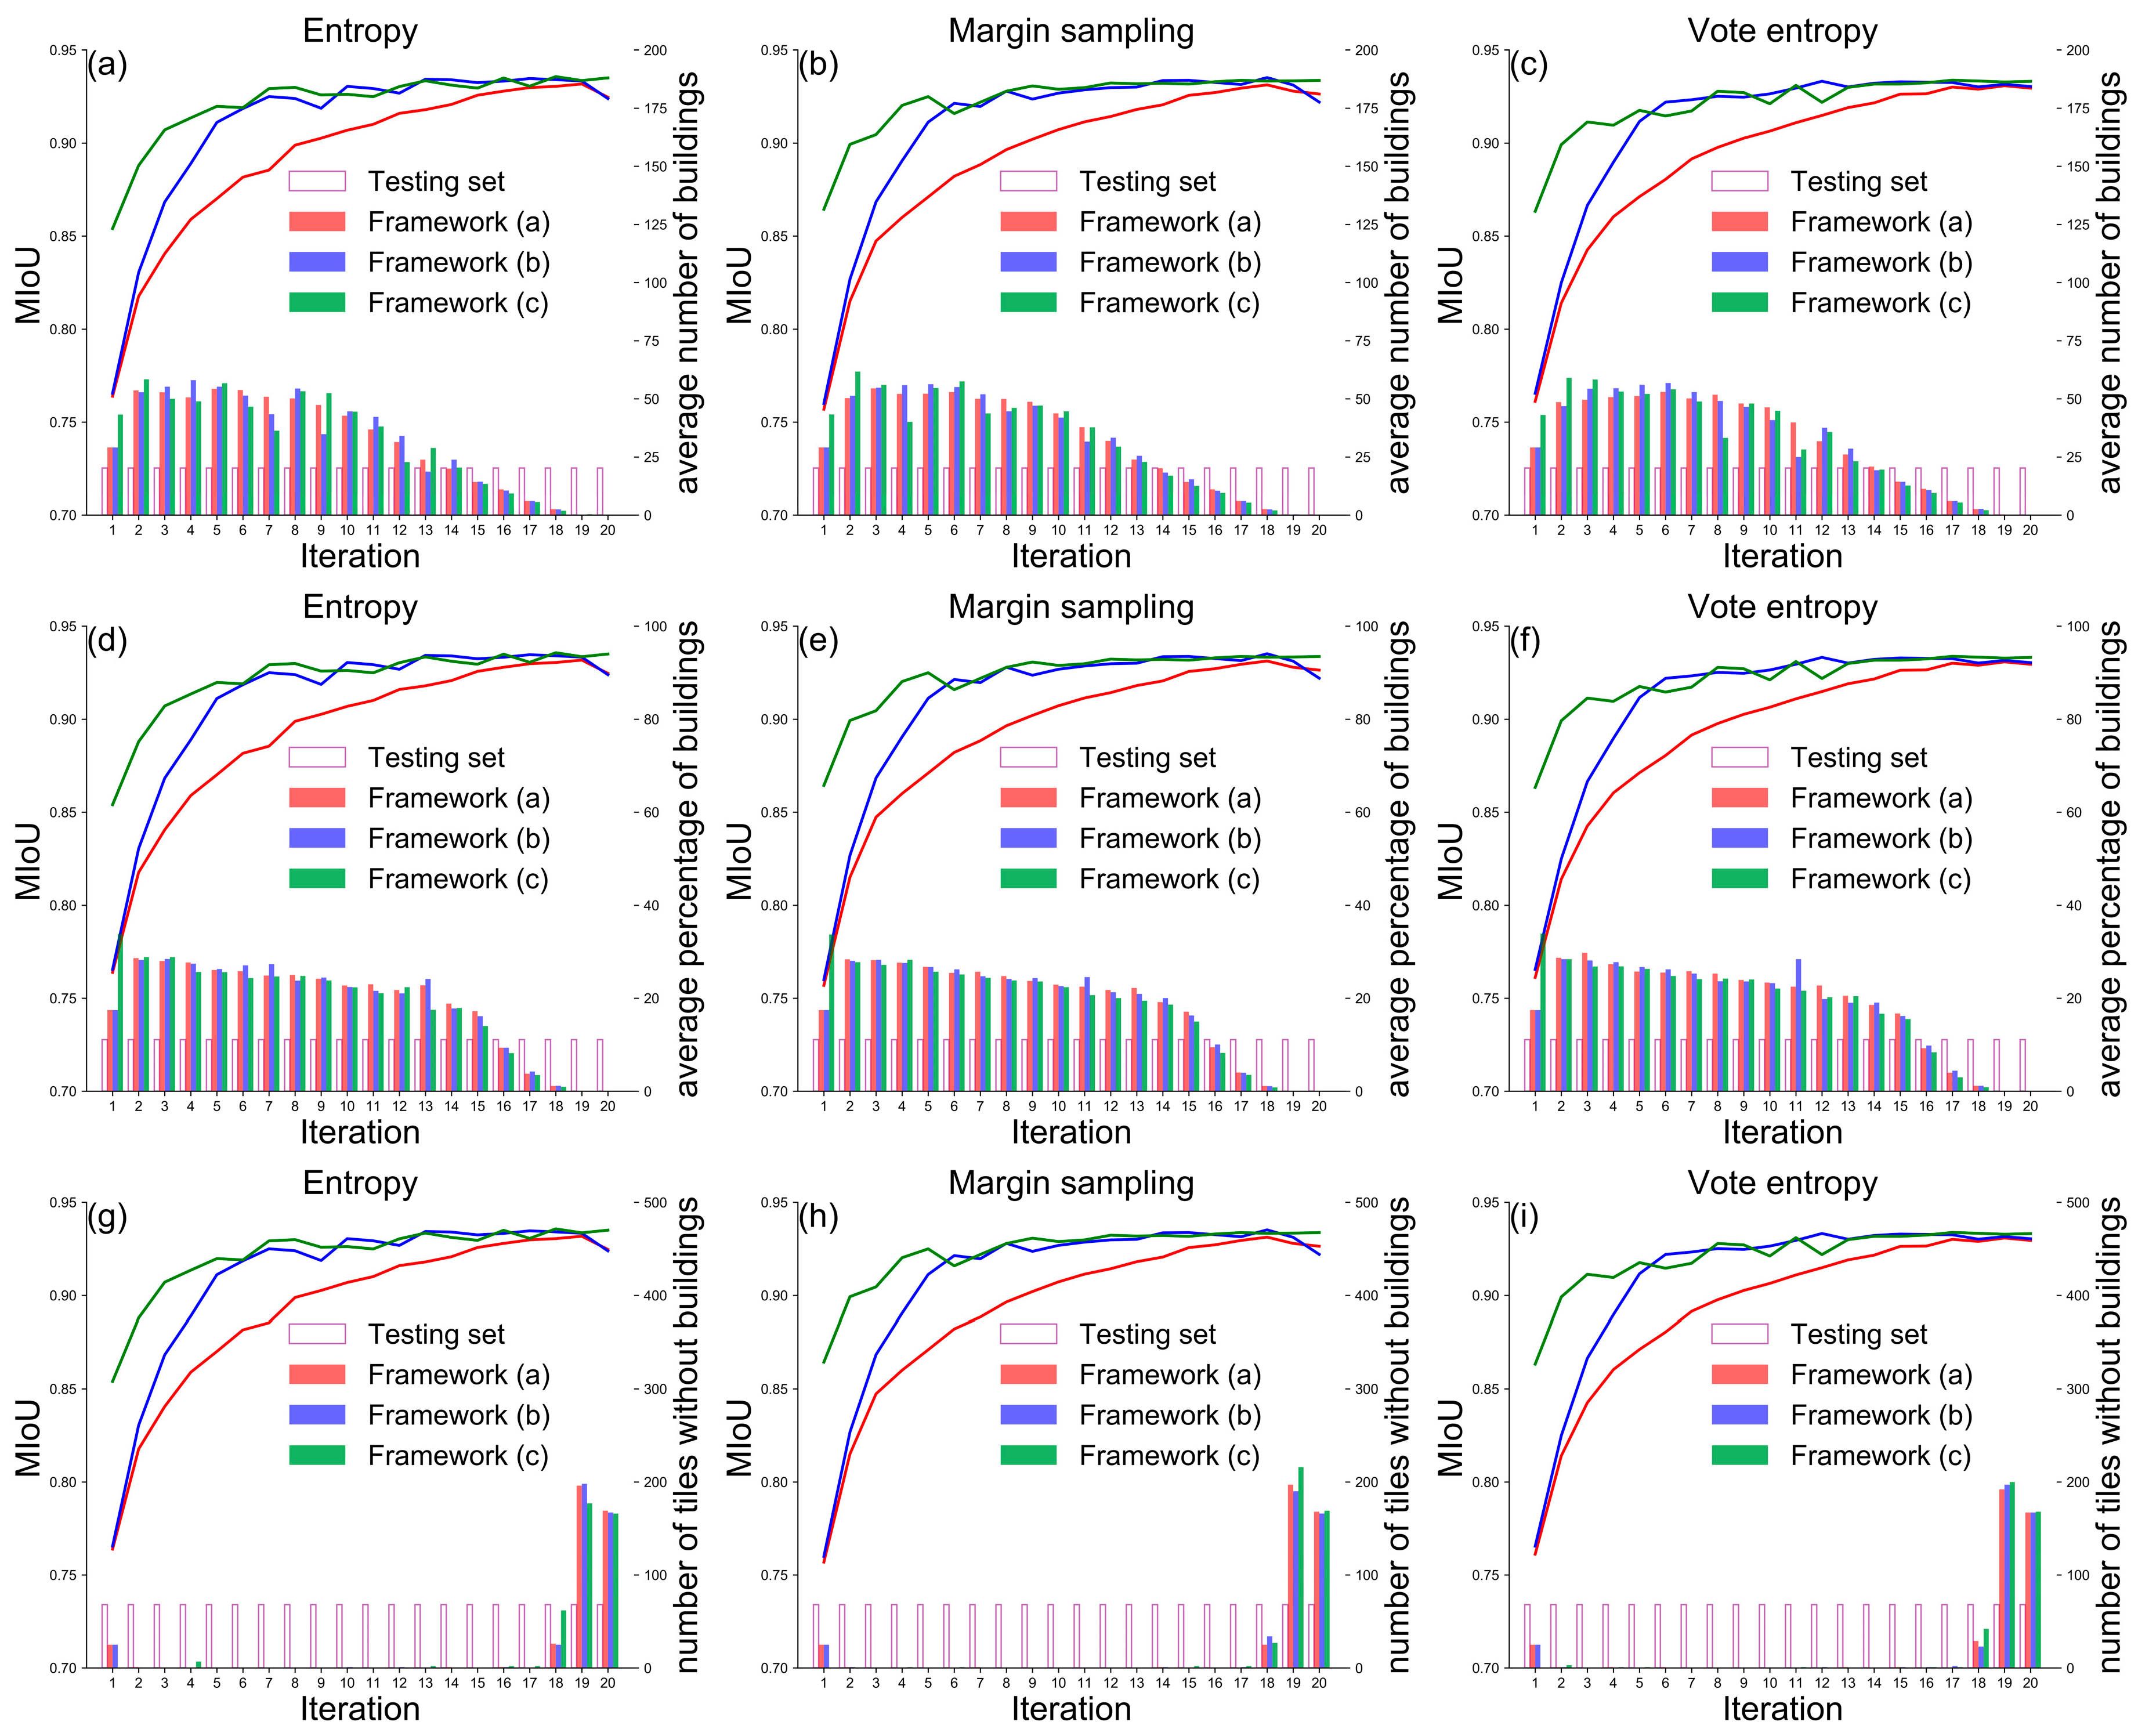
Figure 8 presents the mIoU values, the average number of buildings, the average percentage of building area, and the number of tiles without buildings in each iteration. Compared with the results of framework (a) (Figure 3), the three landscape metrics selected by framework (b) and framework (c) keep the same trends of change with the increase in the number of tiles. During the process of active data selection (i.e., from the 2nd and the 20th iteration), the average number of buildings (Figure 8a–c) and the average percentage of buildings (Figure 8d–f) have been trending downward, and the tiles without building had little or no effect on model training between the 2nd and 17th iterations (Figure 8g–i).
6. Discussion
This study has described the interrelations between AL, IL, and TL; examined their efficacy in reducing the number of unlabelled images to be annotated in building footprint mapping based on DeeplabV3+; and proposed an efficient framework integrating the DeeplabV3+ with AL, IL, and TL. In this study, three candidate frameworks were proposed and their performance was evaluated using experiments with a very high spatial resolution building dataset with a variety of landscape features. By comparing the results of the three frameworks, this study confirmed that AL can reduce the effort required for data annotation by selecting informative tiles (i.e., tiles with more buildings and a larger area of buildings) for the actual model, IL can accumulate knowledge learned by the model, and appropriate TL can provide a capable initial learner. These findings inspire us to consider the framework integrating TL, AL, IL, and DeeplabV3+ (i.e., framework (c) in Figure 2) in future building mapping, especially for large-scale building mapping.
The good results can be attributed to the following: (1) the light-weighted DeeplabV3+ with MobileNet backbone was able to avoid model overfitting during the iterative process of model training; (2) the high-quality building dataset used in this study consisted of manually delineated and checked building footprints; and (3) the pre-trained DeeplabV3+ used in framework (c) was derived from the WHU satellite building dataset II, which is comparable to the WHU aerial building dataset in terms of landscape features, spatial resolution, and spectral bands [18]. They have labeled image tiles with the same size (i.e., 512 × 512 pixels) and close spatial resolution (i.e., 0.45 m and 0.3 m).
This research focused on a binary image segmentation task based on DeeplabV3+, a straightforward situation involving building and non-building classes. The building footprint mapping based on other state-of-the-art CNN models and other real-world applications of binary VHR image segmentation tasks may benefit from the framework proposed to aid in visual interpretation during labeled data collection. However, several issues should be considered while using the proposed framework: (1) The representative landscapes within the whole study area (e.g., residential, commercial, and industrial buildings) should be considered in the testing set [23]. (2) the spatial independence between training and testing areas should be considered while splitting data in real-world applications [52]. The adjacent image tiles often have similar building landscapes, and the spatial correlation of the image tiles in the two sets affects the model evaluation based on the testing set. (3) the selection of a pre-trained model should be judicious. An inappropriate pre-trained model can make the starting accuracy of the model (i.e., the mIoU of the pre-trained model in the first iteration) even lower than that of the model trained on the seed set [47]. The initial model with high accuracy allows faster achievement of satisfactory accuracy and reduction of the gap to the best performance of the model trained on all training data.
In addition, the following aspects may be considered in the future to reduce the effort associated with data annotation in building footprint mapping. To begin with, incorporating other AL strategies such as diversity-based strategies or hybrid active learning (HAL) alongside IL and TL may be an effective way to increase the annotation effort reduction effectiveness [53]. Secondly, images with a greater number of spectral bands may be used. The dataset of buildings was used, each of which consisted of image tiles with red, green, and blue bands. However, satellite image with blue, green, red, and near-infrared (NIR) bands could be used to compute the Normalized Difference Built-up Index (NDBI) and Ratio Build-up Index (RBI) [54], which might give the tile-level label using the Gaussian distribution of indices. Collecting informative tiles at both the pixel and tile levels may be more efficient in terms of achieving model training with acceptable accuracy. Third, one-shot AL may be more practical than the iterative process of data selection and model training, as the iterative framework necessitates more interaction with subject matter experts, as well as more time spent reading data and training models [55].
7. Conclusions
Based on the interrelations between AL, IL, and TL, this study proposed three candidate frameworks for efficient building footprint mapping based on DeeplabV3+ by incorporating three AL strategies, IL, and TL. They were evaluated on a standard building dataset, and the comparison of the results of the three frameworks indicates that AL can reduce data annotation effort by selecting informative unlabelled data to be manually annotated. The image tiles with more buildings and the larger building area are prioritized during the data selection process. IL and TL can facilitate the model training to achieve satisfactory performance by accumulating knowledge and providing a more capable initial learner, respectively. The findings imply that DeeplabV3+ incorporating AL, IL, and TL could be considered in future building footprint mapping, especially for large-scale tasks, and the proposed frameworks could also be applied to other binary image segmentation tasks in the RS community.
Author Contributions
Conceptualization, methodology, data analyses, original draft preparation and reviewing the bibliography, Z.L. Data analyses, funding acquisition and reviewing the manuscript: J.D. All authors have read and agreed to the published version of the manuscript.
Funding
This study was supported by the Key Research Program of Frontier Sciences (QYZDB-SSW-DQC005) of the Chinese Academy of Sciences (CAS), the Strategic Priority Research Program (XDA19040301) of the CAS, the Informatization Plan of Chinese Academy of Sciences of the CAS (CAS-WX2021PY-0109).
Conflicts of Interest
The authors declare no conflict of interest.
References
- Schneider, A.; Friedl, M.A.; Potere, D. A new map of global urban extent from MODIS satellite data. Environ. Res. Lett. 2009, 4, 044003. [Google Scholar] [CrossRef]
- Guo, H.; Shi, Q.; Marinoni, A.; Du, B.; Zhang, L. Deep building footprint update network: A semi-supervised method for updating existing building footprint from bi-temporal remote sensing images. Remote Sens. Environ. 2021, 264, 112589. [Google Scholar] [CrossRef]
- Jochem, W.C.; Tatem, A.J. Tools for mapping multi-scale settlement patterns of building footprints: An introduction to the R package foot. PLoS ONE 2021, 16, e0247535. [Google Scholar] [CrossRef]
- Wurm, M.; Stark, T.; Zhu, X.X.; Weigand, M.; Taubenböck, H. Semantic segmentation of slums in satellite images using transfer learning on fully convolutional neural networks. ISPRS J. Photogramm. Remote Sens. 2019, 150, 59–69. [Google Scholar] [CrossRef]
- Touzani, S.; Granderson, J. Open Data and Deep Semantic Segmentation for Automated Extraction of Building Footprints. Remote Sens. 2021, 13, 2578. [Google Scholar] [CrossRef]
- Yang, H.L.; Yuan, J.; Lunga, D.; Laverdiere, M.; Rose, A.; Bhaduri, B. Building Extraction at Scale Using Convolutional Neural Network: Mapping of the United States. IEEE J. Sel. Top. Appl. Earth Obs. Remote Sens. 2018, 11, 2600–2614. [Google Scholar] [CrossRef]
- Li, Z.; Xin, Q.; Sun, Y.; Cao, M. A Deep Learning-Based Framework for Automated Extraction of Building Footprint Polygons from Very High-Resolution Aerial Imagery. Remote Sens. 2021, 13, 3630. [Google Scholar] [CrossRef]
- Pasquali, G.; Iannelli, G.C.; Dell’Acqua, F. Building Footprint Extraction from Multispectral, Spaceborne Earth Observation Datasets Using a Structurally Optimized U-Net Convolutional Neural Network. Remote Sens. 2019, 11, 2803. [Google Scholar] [CrossRef]
- Dixit, M.; Chaurasia, K.; Mishra, V.K. Dilated-ResUnet: A novel deep learning architecture for building extraction from medium resolution multi-spectral satellite imagery. Expert Syst. Appl. 2021, 184, 115530. [Google Scholar] [CrossRef]
- Zhao, F.; Zhang, C. Building Damage Evaluation from Satellite Imagery using Deep Learning. In Proceedings of the 2020 IEEE 21st International Conference on Information Reuse and Integration for Data Science (IRI), Las Vegas, NV, USA, 11–13 August 2020; pp. 82–89. [Google Scholar]
- Pan, Z.; Xu, J.; Guo, Y.; Hu, Y.; Wang, G. Deep Learning Segmentation and Classification for Urban Village Using a Worldview Satellite Image Based on U-Net. Remote Sens. 2020, 12, 1574. [Google Scholar] [CrossRef]
- Wagner, F.; Dalagnol, R.; Tarabalka, Y.; Segantine, T.; Thomé, R.; Hirye, M. U-Net-Id, an Instance Segmentation Model for Building Extraction from Satellite Images—Case Study in the Joanópolis City, Brazil. Remote Sens. 2020, 12, 1544. [Google Scholar] [CrossRef]
- Rastogi, K.; Bodani, P.; Sharma, S.A. Automatic building footprint extraction from very high-resolution imagery using deep learning techniques. Geocarto Int. 2020, 37, 1501–1513. [Google Scholar] [CrossRef]
- Jiwani, A.; Ganguly, S.; Ding, C.; Zhou, N.; Chan, D.M. A Semantic Segmentation Network for Urban-Scale Building Footprint Extraction Using RGB Satellite Imagery. arXiv 2021, arXiv:2104.01263. [Google Scholar]
- Du, S.; Du, S.; Liu, B.; Zhang, X. Incorporating DeepLabv3+ and object-based image analysis for semantic segmentation of very high resolution remote sensing images. Int. J. Digit. Earth 2021, 14, 357–378. [Google Scholar] [CrossRef]
- Li, Z.; Zhang, S.; Dong, J. Suggestive Data Annotation for CNN-Based Building Footprint Mapping Based on Deep Active Learning and Landscape Metrics. Remote Sens. 2022, 14, 3147. [Google Scholar] [CrossRef]
- Heris, M.P.; Foks, N.L.; Bagstad, K.J.; Troy, A.; Ancona, Z.H. A rasterized building footprint dataset for the United States. Sci. Data 2020, 7, 207. [Google Scholar] [CrossRef]
- Ji, S.; Wei, S.; Lu, M. Fully Convolutional Networks for Multisource Building Extraction From an Open Aerial and Satellite Imagery Data Set. IEEE Trans. Geosci. Remote Sens. 2018, 57, 574–586. [Google Scholar] [CrossRef]
- Maggiori, E.; Tarabalka, Y.; Charpiat, G.; Alliez, P. Can semantic labeling methods generalize to any city? The inria aerial image labeling benchmark. In Proceedings of the 2017 IEEE International Geoscience and Remote Sensing Symposium (IGARSS), Fort Worth, TX, USA, 23–28 July 2017; pp. 3226–3229. [Google Scholar]
- Etten, A.V.; Lindenbaum, D.; Bacastow, T.M. SpaceNet: A Remote Sensing Dataset and Challenge Series. arXiv 2018, arXiv:1807.01232. [Google Scholar]
- Mnih, V. Machine Learning for Aerial Image Labeling; University of Toronto: Toronto, ON, Canada, 2013. [Google Scholar]
- Yang, N.; Tang, H. GeoBoost: An Incremental Deep Learning Approach toward Global Mapping of Buildings from VHR Remote Sensing Images. Remote Sens. 2020, 12, 1794. [Google Scholar] [CrossRef]
- Zhou, D.; Wang, G.; He, G.; Yin, R.; Long, T.; Zhang, Z.; Chen, S.; Luo, B. A Large-Scale Mapping Scheme for Urban Building From Gaofen-2 Images Using Deep Learning and Hierarchical Approach. IEEE J. Sel. Top. Appl. Earth Obs. Remote Sens. 2021, 14, 11530–11545. [Google Scholar] [CrossRef]
- Li, J.; Meng, L.; Yang, B.; Tao, C.; Li, L.; Zhang, W. LabelRS: An Automated Toolbox to Make Deep Learning Samples from Remote Sensing Images. Remote Sens. 2021, 13, 2064. [Google Scholar] [CrossRef]
- Xia, G.-S.; Wang, Z.; Xiong, C.; Zhang, L. Accurate Annotation of Remote Sensing Images via Active Spectral Clustering with Little Expert Knowledge. Remote Sens. 2015, 7, 15014–15045. [Google Scholar] [CrossRef] [Green Version]
- Ren, P.; Xiao, Y.; Chang, X.; Huang, P.-Y.; Li, Z.; Gupta, B.B.; Chen, X.; Wang, X. A Survey of Deep Active Learning. ACM Comput. Surv. 2022, 54, 1–40. [Google Scholar] [CrossRef]
- Robinson, C.; Ortiz, A.; Malkin, K.; Elias, B.; Peng, A.; Morris, D.; Dilkina, B.; Jojic, N. Human-Machine Collaboration for Fast Land Cover Mapping. Proc. AAAI Conf. Artif. Intell. 2020, 34, 2509–2517. [Google Scholar] [CrossRef]
- Haut, J.M.; Paoletti, M.E.; Plaza, J.; Li, J.; Plaza, A. Active Learning With Convolutional Neural Networks for Hyperspectral Image Classification Using a New Bayesian Approach. IEEE Trans. Geosci. Remote Sens. 2018, 56, 6440–6461. [Google Scholar] [CrossRef]
- Belharbi, S.; Ayed, I.B.; McCaffrey, L.; Granger, E. Deep Active Learning for Joint Classification & Segmentation with Weak Annotator. In Proceedings of the 2021 IEEE Winter Conference on Applications of Computer Vision (WACV), Waikoloa, HI, USA, 3–8 January 2021; pp. 3337–3346. [Google Scholar]
- Siddiqui, Y.; Valentin, J.; Nießner, M. ViewAL: Active Learning with Viewpoint Entropy for Semantic Segmentation. In Proceedings of the 2020 IEEE/CVF Conference on Computer Vision and Pattern Recognition (CVPR), Seattle, WA, USA, 13–19 June 2020. [Google Scholar]
- Wang, K.; Zhang, D.; Li, Y.; Zhang, R.; Lin, L. Cost-Effective Active Learning for Deep Image Classification. IEEE Trans. Circuits Syst. Video Technol. 2017, 27, 2591–2600. [Google Scholar] [CrossRef]
- Tasar, O.; Tarabalka, Y.; Alliez, P. Incremental Learning for Semantic Segmentation of Large-Scale Remote Sensing Data. IEEE J. Sel. Top. Appl. Earth Obs. Remote Sens. 2019, 12, 3524–3537. [Google Scholar] [CrossRef]
- Lin, Y.; Vosselman, G.; Cao, Y.; Yang, M.Y. Active and incremental learning for semantic ALS point cloud segmentation. ISPRS J. Photogramm. Remote Sens. 2020, 169, 73–92. [Google Scholar] [CrossRef]
- Pan, S.J.; Yang, Q. A Survey on Transfer Learning. IEEE Trans. Knowl. Data Eng. 2010, 22, 1345–1359. [Google Scholar] [CrossRef]
- Nowakowski, A.; Mrziglod, J.; Spiller, D.; Bonifacio, R.; Ferrari, I.; Mathieu, P.P.; Garcia-Herranz, M.; Kim, D.-H. Crop type mapping by using transfer learning. Int. J. Appl. Earth Obs. Geoinf. 2021, 98, 102313. [Google Scholar] [CrossRef]
- Xu, G.; Zhu, X.; Tapper, N. Using convolutional neural networks incorporating hierarchical active learning for target-searching in large-scale remote sensing images. Int. J. Remote Sens. 2020, 41, 4057–4079. [Google Scholar] [CrossRef]
- Xie, M.; Jean, N.; Burke, M.; Lobell, D.; Ermon, S. Transfer Learning from Deep Features for Remote Sensing and Poverty Mapping. In Proceedings of the Thirtieth AAAI Conference on Artificial Intelligence, Phoenix, AZ, USA, 12–17 February 2016; p. 7. [Google Scholar]
- Zhou, Z.; Shin, J.; Zhang, L.; Gurudu, S.; Gotway, M.; Liang, J. Fine-Tuning Convolutional Neural Networks for Biomedical Image Analysis: Actively and Incrementally. In Proceedings of the 2017 IEEE Conference on Computer Vision and Pattern Recognition (CVPR), Honolulu, HI, USA, 21–26 July 2017; pp. 4761–4772. [Google Scholar]
- Settles, B. Active Learning Literature Survey; Department of Computer Sciences, University of Wisconsin-Madison: Madison, WI, USA, 2009; p. 7. [Google Scholar]
- Li, C.; Wang, J.; Wang, L.; Hu, L.; Gong, P. Comparison of Classification Algorithms and Training Sample Sizes in Urban Land Classification with Landsat Thematic Mapper Imagery. Remote Sens. 2014, 6, 964–983. [Google Scholar] [CrossRef] [Green Version]
- Hamrouni, Y.; Paillassa, E.; Chéret, V.; Monteil, C.; Sheeren, D. From local to global: A transfer learning-based approach for mapping poplar plantations at national scale using Sentinel-2. ISPRS J. Photogramm. Remote Sens. 2021, 171, 76–100. [Google Scholar] [CrossRef]
- Wang, Z.; Brenning, A. Active-Learning Approaches for Landslide Mapping Using Support Vector Machines. Remote Sens. 2021, 13, 2588. [Google Scholar] [CrossRef]
- Zhang, J.; Chen, L.; Wang, C.; Zhuo, L.; Tian, Q.; Liang, X. Road Recognition From Remote Sensing Imagery Using Incremental Learning. IEEE Trans. Intell. Transp. Syst. 2017, 18, 2993–3005. [Google Scholar] [CrossRef]
- Qin, R.; Liu, T. A Review of Landcover Classification with Very-High Resolution Remotely Sensed Optical Images—Analysis Unit, Model Scalability and Transferability. Remote Sens. 2022, 14, 646. [Google Scholar] [CrossRef]
- Ulmas, P.; Liiv, I. Segmentation of Satellite Imagery using U-Net Models for Land Cover Classification. arXiv 2020, arXiv:2003.02899. [Google Scholar]
- Zhang, Y.; Zhu, Q.; Zhong, Y.; Guan, Q.; Zhang, L.; Li, D. A Modified D-Linknet with Transfer Learning for Road Extraction from High-Resolution Remote Sensing. In Proceedings of the IGARSS 2020—2020 IEEE International Geoscience and Remote Sensing Symposium, Waikoloa, HI, USA, 26 September–2 October 2020; pp. 1817–1820. [Google Scholar]
- He, K.; Girshick, R.; Dollár, P. Rethinking imagenet pre-training. In Proceedings of the IEEE/CVF International Conference on Computer Vision, Seoul, Korea, 27 October–2 November 2019; pp. 4918–4927. [Google Scholar]
- Shi, H.; Wang, H.; Qin, C.; Zhao, L.; Liu, C. An incremental learning system for atrial fibrillation detection based on transfer learning and active learning. Comput. Methods Programs Biomed. 2020, 187, 105219. [Google Scholar] [CrossRef]
- Yuan, X.; Shi, J.; Gu, L. A review of deep learning methods for semantic segmentation of remote sensing imagery. Expert Syst. Appl. 2021, 169, 114417. [Google Scholar] [CrossRef]
- Long, J.; Shelhamer, E.; Darrell, T. Fully convolutional networks for semantic segmentation. In Proceedings of the IEEE Conference on Computer Vision and Pattern Recognition, Boston, MA, USA, 7–12 June 2015; pp. 3431–3440. [Google Scholar]
- Bosch, M. PyLandStats: An open-source Pythonic library to compute landscape metrics. PLoS ONE 2019, 14, e0225734. [Google Scholar] [CrossRef]
- Karasiak, N.; Dejoux, J.F.; Monteil, C.; Sheeren, D. Spatial dependence between training and test sets: Another pitfall of classification accuracy assessment in remote sensing. Mach. Learn. 2022, 111, 2715–2740. [Google Scholar] [CrossRef]
- Wu, X.; Chen, C.; Zhong, M.; Wang, J. HAL: Hybrid active learning for efficient labeling in medical domain. Neurocomputing 2021, 456, 563–572. [Google Scholar] [CrossRef]
- Zhou, Y.; Lin, C.; Wang, S.; Liu, W.; Tian, Y. Estimation of Building Density with the Integrated Use of GF-1 PMS and Radarsat-2 Data. Remote Sens. 2016, 8, 969. [Google Scholar] [CrossRef] [Green Version]
- Jin, Q.; Yuan, M.; Qiao, Q.; Song, Z. One-shot active learning for image segmentation via contrastive learning and diversity-based sampling. Knowl. Based Syst. 2022, 241, 108278. [Google Scholar] [CrossRef]
Figure 1.
The interrelations between AL, IL, and TL.

Figure 2.
Three candidate frameworks for building footprint mapping by incorporating the DeeplabV3+ model, AL, IL, and TL. In each framework, the blue arrows indicate the steps in the first iteration; the orange arrow shows the data flow for model evaluation; and the black arrows indicate the data selection, data annotation, updating labeled dataset, and model re-training per iteration from the second iteration. The red arrows indicate calling the previous model for fine-tuning. Framework (a) shows the basic process of incorporating DeeplabV3+ with AL. Framework (b) shows the process of incorporating DeeplabV3+ with AL and IL. Framework (c) shows the process of incorporating the DeeplabV3+ with AL strategies, IL, and TL.

Figure 3.
The process of active selection of unlabelled image tiles to be annotated in each iteration.
Figure 3.
The process of active selection of unlabelled image tiles to be annotated in each iteration.

Figure 4.
The spatial distribution of the training set, validation set, and testing set in the WHU aerial building dataset and the illustration of image tiles with different building landscapes and truth labels.
Figure 4.
The spatial distribution of the training set, validation set, and testing set in the WHU aerial building dataset and the illustration of image tiles with different building landscapes and truth labels.

Figure 5.
Comparison of AL strategies and random sampling based on WHU aerial building dataset. The X-axis represents the number of iterations in the experiments (a–c). The left Y-axis represents the mIoU value of DeeplabV3+ in each iteration. The right Y-axis represents the landscape metric value of selected tiles per iteration and all image tiles in the testing set. The active selection starts from the second iteration, and the image tiles with more buildings and the larger area of buildings are prioritized during the process of active data selection.

Figure 6.
Comparison of performance of the three frameworks based on WHU aerial building dataset. The red lines indicate the mIoU value of DeeplabV3+ in each iteration derived from framework (a), the blue lines indicate the mIoU value of DeeplabV3+ in each iteration derived from framework (b), and the green lines indicate the mIoU value of DeeplabV3+ in each iteration derived from framework (c).

Figure 7.
Illustration of the results of building extraction in the 4th iteration based on three proposed frameworks on the WHU aerial building dataset. The first column indicates the aerial image. Columns 2, 3, and 4 indicate the segmentation results of DeeplabV3+ with AL; DeeplabV3+ with AL and IL; and DeeplabV3+ with TL, AL, and IL, respectively. The last column shows the ground truth of each aerial image. Subfigures (a–d) represent the results for random selection, entropy, vote entropy, and margin sampling, respectively.

Figure 8.
Comparison of performance of the three frameworks based on WHU aerial building dataset in terms of mIoU, the average number of buildings, the average percentage of building area, and the number of tiles without buildings. The X-axis represents the percent of training data used for model training. The left Y-axis represents the value of mIoU in each iteration. The right Y-axis represents the landscape metric values per iteration.


Table 1.
The number of tiles in the training set, validation set, and testing set of the WHU aerial building dataset.
Table 1.
The number of tiles in the training set, validation set, and testing set of the WHU aerial building dataset.
| Dataset | Training Set | Validation Set | Testing set | Total |
|---|---|---|---|---|
| WHU aerial building dataset | 4736 | 1036 | 2416 | 8188 |
Table 2.
Experiment parameters used in the study.
| Parameters | Description |
|---|---|
| GPU | Tesla V100 × 2 |
| Image size | 320, 320 |
| Loss function | Cross entropy loss |
| Epoch | 100 |
| Batch size | 64 |
| Learning rate | 0.1 |
| Optimizer | Stochastic gradient descent (SGD) |
| Seed set | 240 tiles |
| Active selection size | 240 tiles |
| Max iteration | 20 |
| Selection mode | VE, H, MS, and random sampling |
| Parallel computing | Distributed data parallel (DDP) |
Publisher’s Note: MDPI stays neutral with regard to jurisdictional claims in published maps and institutional affiliations. |
© 2022 by the authors. Licensee MDPI, Basel, Switzerland. This article is an open access article distributed under the terms and conditions of the Creative Commons Attribution (CC BY) license (https://creativecommons.org/licenses/by/4.0/).
Share and Cite
MDPI and ACS Style
Li, Z.; Dong, J. A Framework Integrating DeeplabV3+, Transfer Learning, Active Learning, and Incremental Learning for Mapping Building Footprints. Remote Sens. 2022, 14, 4738. https://0-doi-org.brum.beds.ac.uk/10.3390/rs14194738
AMA Style
Li Z, Dong J. A Framework Integrating DeeplabV3+, Transfer Learning, Active Learning, and Incremental Learning for Mapping Building Footprints. Remote Sensing. 2022; 14(19):4738. https://0-doi-org.brum.beds.ac.uk/10.3390/rs14194738
Chicago/Turabian StyleLi, Zhichao, and Jinwei Dong. 2022. "A Framework Integrating DeeplabV3+, Transfer Learning, Active Learning, and Incremental Learning for Mapping Building Footprints" Remote Sensing 14, no. 19: 4738. https://0-doi-org.brum.beds.ac.uk/10.3390/rs14194738
Note that from the first issue of 2016, this journal uses article numbers instead of page numbers. See further details here.