Article

Effects of Vegetation Change on Soil Erosion by Water in Major Basins, Central Asia

1
Xinjiang Laboratory of Lake Environment and Resources in Arid Zone, Urumqi 830054, China
2
College of Geographic Science and Tourism, Xinjiang Normal University, Urumqi 830054, China
3
State Key Laboratory of Desert and Oasis Ecology, Xinjiang Institute of Ecology and Geography, Chinese Academy of Sciences, Urumqi 830011, China
4
Research Centre for Ecology and Environment of Central Asia, Chinese Academy of Sciences, Urumqi 830011, China
5
School of Geographic Sciences, Xinyang Normal University, Xinyang 464000, China
6
College of Geography and Remote Sensing Sciences, Xinjiang University, Urumqi 830046, China
*
Author to whom correspondence should be addressed.
Remote Sens. 2022, 14(21), 5507; https://0-doi-org.brum.beds.ac.uk/10.3390/rs14215507
Submission received: 7 September 2022 / Revised: 28 October 2022 / Accepted: 31 October 2022 / Published: 1 November 2022

Abstract

:
The uncertainties in soil erosion (SE) are further intensified by various factors, such as global warming, regional warming and humidification, and vegetation cover changes. Moreover, quantitative evaluations of SE in major basins of Central Asia (CA) under changing environments have rarely been conducted. This study conducted quantitative evaluation of SE in four major basins (Syr Darya Basin (SDB), Amu Darya Basin (ADB), Ili River Basin (IRB) and Tarim River Basin (TRB) using the Revised Universal Soil Loss Equation (RUSLE) and analyzed the main driving factors. SE quantities in the basins presented relatively consistent upward fluctuating trends from 1982 to 2017. Vegetation cover variation fluctuated significantly from 1982 to 2017. Specifically, vegetation cover decreased continuously in SDB, ADB, and IRB, but increased gradually in TRB. Pixels with positive spatial variation of vegetation mainly occurred around lakes and oases near rivers. The Normalized Difference Vegetation Index (NDVI) showed higher correlation with precipitation (80.5%) than with temperature (48.3%). During the study period, the area of arable land (AL) exhibited the largest change among all land use types in CA. Under long-term human activities, the proportion of NDVI of other land types converting to AL was the highest. In the structural equation model (SEM), precipitation, temperature, Shannon Diversity Index (SHDI), and NDVI strongly influenced SE. Overall, the major basins in CA were jointly affected by climate, human activities, and vegetation. Specifically, climatic factors exerted the strongest influence, followed by SHDI (human activities). SE was found to be relatively serious in ADB, SDB, and IRB, with SE in SDB even approaching that in the Loess Plateau. Under the background of global changes, appropriate water and land resource management and optimization configurations should be implemented in CA with reference to TRB in order to relieve local SE problems.

1. Introduction

The fifth climate change evaluation report of the Intergovernmental Panel on Climate Change (IPCC) pointed out that the global surface average temperature increased by 0.89 °C from 1901 to 2012 and the rate of increase in the 20th century was the highest during 1980–2010 [1]. Moreover, the rate of temperature increase has been increasing since 1980, with the highest rate in mid-latitude regions of the Northern Hemisphere [2,3]. Hence, climatic changes dominated by global warming have become one of important environmental problems in the world [4]. In global environmental change, vegetation, which is a key component of land ecosystems, is extremely sensitive to climatic changes, and dynamic changes of vegetation are often used as an important biological indicator of climatic change on Earth [5,6,7]. A previous study pointed out that the global greening of vegetated areas increased by 5% from 2000 to 2017, 1/3 of which was attributed to China and India. The growth of greening of vegetated areas in China accounted for 25% of global growth [8]. Although the greening of vegetated areas was increased significantly, vegetation areas in China and India account for only 9% of the global total vegetation area [9]. The analysis shows that afforestation and intensive agriculture contributed 42% and 32% respectively to China’s greening. Intensive agriculture accounts for 82% of India’s greening [10]. According to a previous study, the increase in vegetation cover and extension of the growing season in mid and high-latitude areas in the Northern Hemisphere was mainly attributed to climatic warming [11]. Furthermore, some studies have found a positive correlation between Normalized Difference Vegetation Index (NDVI) and temperature in high latitude areas of the Northern Hemisphere in the growing season [12,13]. Piao et al. [14] concluded that the increase in NDVI was attributable to temperature increase at the national scale, while it was related to precipitation at the regional scale. The increasing frequency of human activities since the industrial revolution has also introduced some ecological degradation problems, such as forest reduction, biodiversity reduction, and soil erosion (SE) [15,16,17]. Specifically, SE is the most serious problem [18].
SE refers to damages and loss of water-land resources and productivity of lands caused by various exogenic forces [19]. It not only causes land resource depletion, soil fertility reduction, and ecological imbalance, but also influences production development activities of various industries [20,21,22]. Climatic changes and human activities all influence the development rate of SE, and these influences are mainly reflected by the promotion of SE by global temperature rise [23,24]. As the near-surface temperature increases, the wind speed increases, which also accelerates the melting of ice and snow, and increases the flow of rivers, which in turn leads to increased SE [25]. Land-use and land-cover change (LUCC) caused by human activities and climatic changes alter the original surface vegetation types and coverage, runoff conditions, and physicochemical properties of soil, thus influencing the dynamics and anti-erosion resistance system of SE [26]. Eybergen et al. [27] studied the key process of climate sensitivity in 1989 and believed that SE was influenced by climatic changes. Kirkby et al. [28] performed model predictions and found that an increase in global temperature 2–3 °C will cause land vegetation changes at the local scale, thus causing serious SE. Furthermore, vegetation, which is the hub for material circulation and energy exchange of ecosystems, can control water and soil loss fundamentally. It is an important factor for controlling SE and the most positive and effective measure for soil and water conservation [29,30]. The 8th (2009–2013) national forest resource survey of China reported that the national forest area reached 208 million hm2 and the forest cover was 21.6%; the construction of key protection forest systems through the “Three North” Shelter Forest Program and in Yangtze River Basin decreased the water and soil loss area by 110,000 km2, and 40% of the water-land loss area in the engineering region could be controlled effectively [31]. Since the implementation of the policy of returning arable land (AL) into forest land (FL) and grass land (GL) in 1999, vegetation coverage in the Loess Plateau increased by 28% and water and soil loss has been inhibited effectively [32].
Central Asia (CA) is located in Eurasia’s hinterland, and it belongs to a typical temperate desert and temperate continental climate. In response to global warming, CA is experiencing a significant temperature rise [33]. Chen et al. [34] studied the characteristics of temperature change in arid regions of CA in the last 100 years (1901–2003) using empirical orthogonal functions and pointed out that the regional average rate of temperature rise was 0.18 °C per decade, reaching 0.21 °C per decade in winter. This was far higher than the global rate of temperature rise. The annual precipitation in CA has been increasing since the 20th century, but with significant spatial differences [35]. Based on the Climatic Research Unit (CRU) data, Chen et al. [36] pointed out that annual precipitation in arid regions of CA has generally been increasing in the past 80 years (1930–2009). Nevertheless, the arid regions of CA are different from other global arid regions because it features high mountain-basin structures with relatively abundant precipitation [37]. Zhang et al. [38] discussed vegetation changes in CA from 1982–2012 and found that vegetation activities were improving, with prominent improvements in mountainous areas [39]. In arid regions, SE mainly occurred on basin geomorphic units according to mountain–oasis–lake regions [40]. Influenced by climatic changes and human activities, some rivers in CA are cut off at lower reaches and lakes at lower reaches dry up gradually [41], thus intensifying local SE and exposing river basin ecosystems to more risks [42]. Although CA is generally warm and humid, such trends still cannot change the degree of droughts [43]. Therefore, SE continues to pose serious threats to CA [44]. However, water erosion by water in CA under the background of rapid global changes has rarely been investigated [45,46].
To address these issues, this study investigated SE in four major basins of CA and analyzed the major driving factors. The main objectives were to: (1) perform quantitative assessment of spatial-temporal changes in water erosion by water in major basins of CA; (2) explore environmental changes (global warming, global greening, regional warming, humidification, and LUCC) in CA and their impacts on water erosion by water in major river basins; (3) analyze the main controlling factors and regulation mechanism of water erosion by water in major basins of CA.

2. Materials and Methods
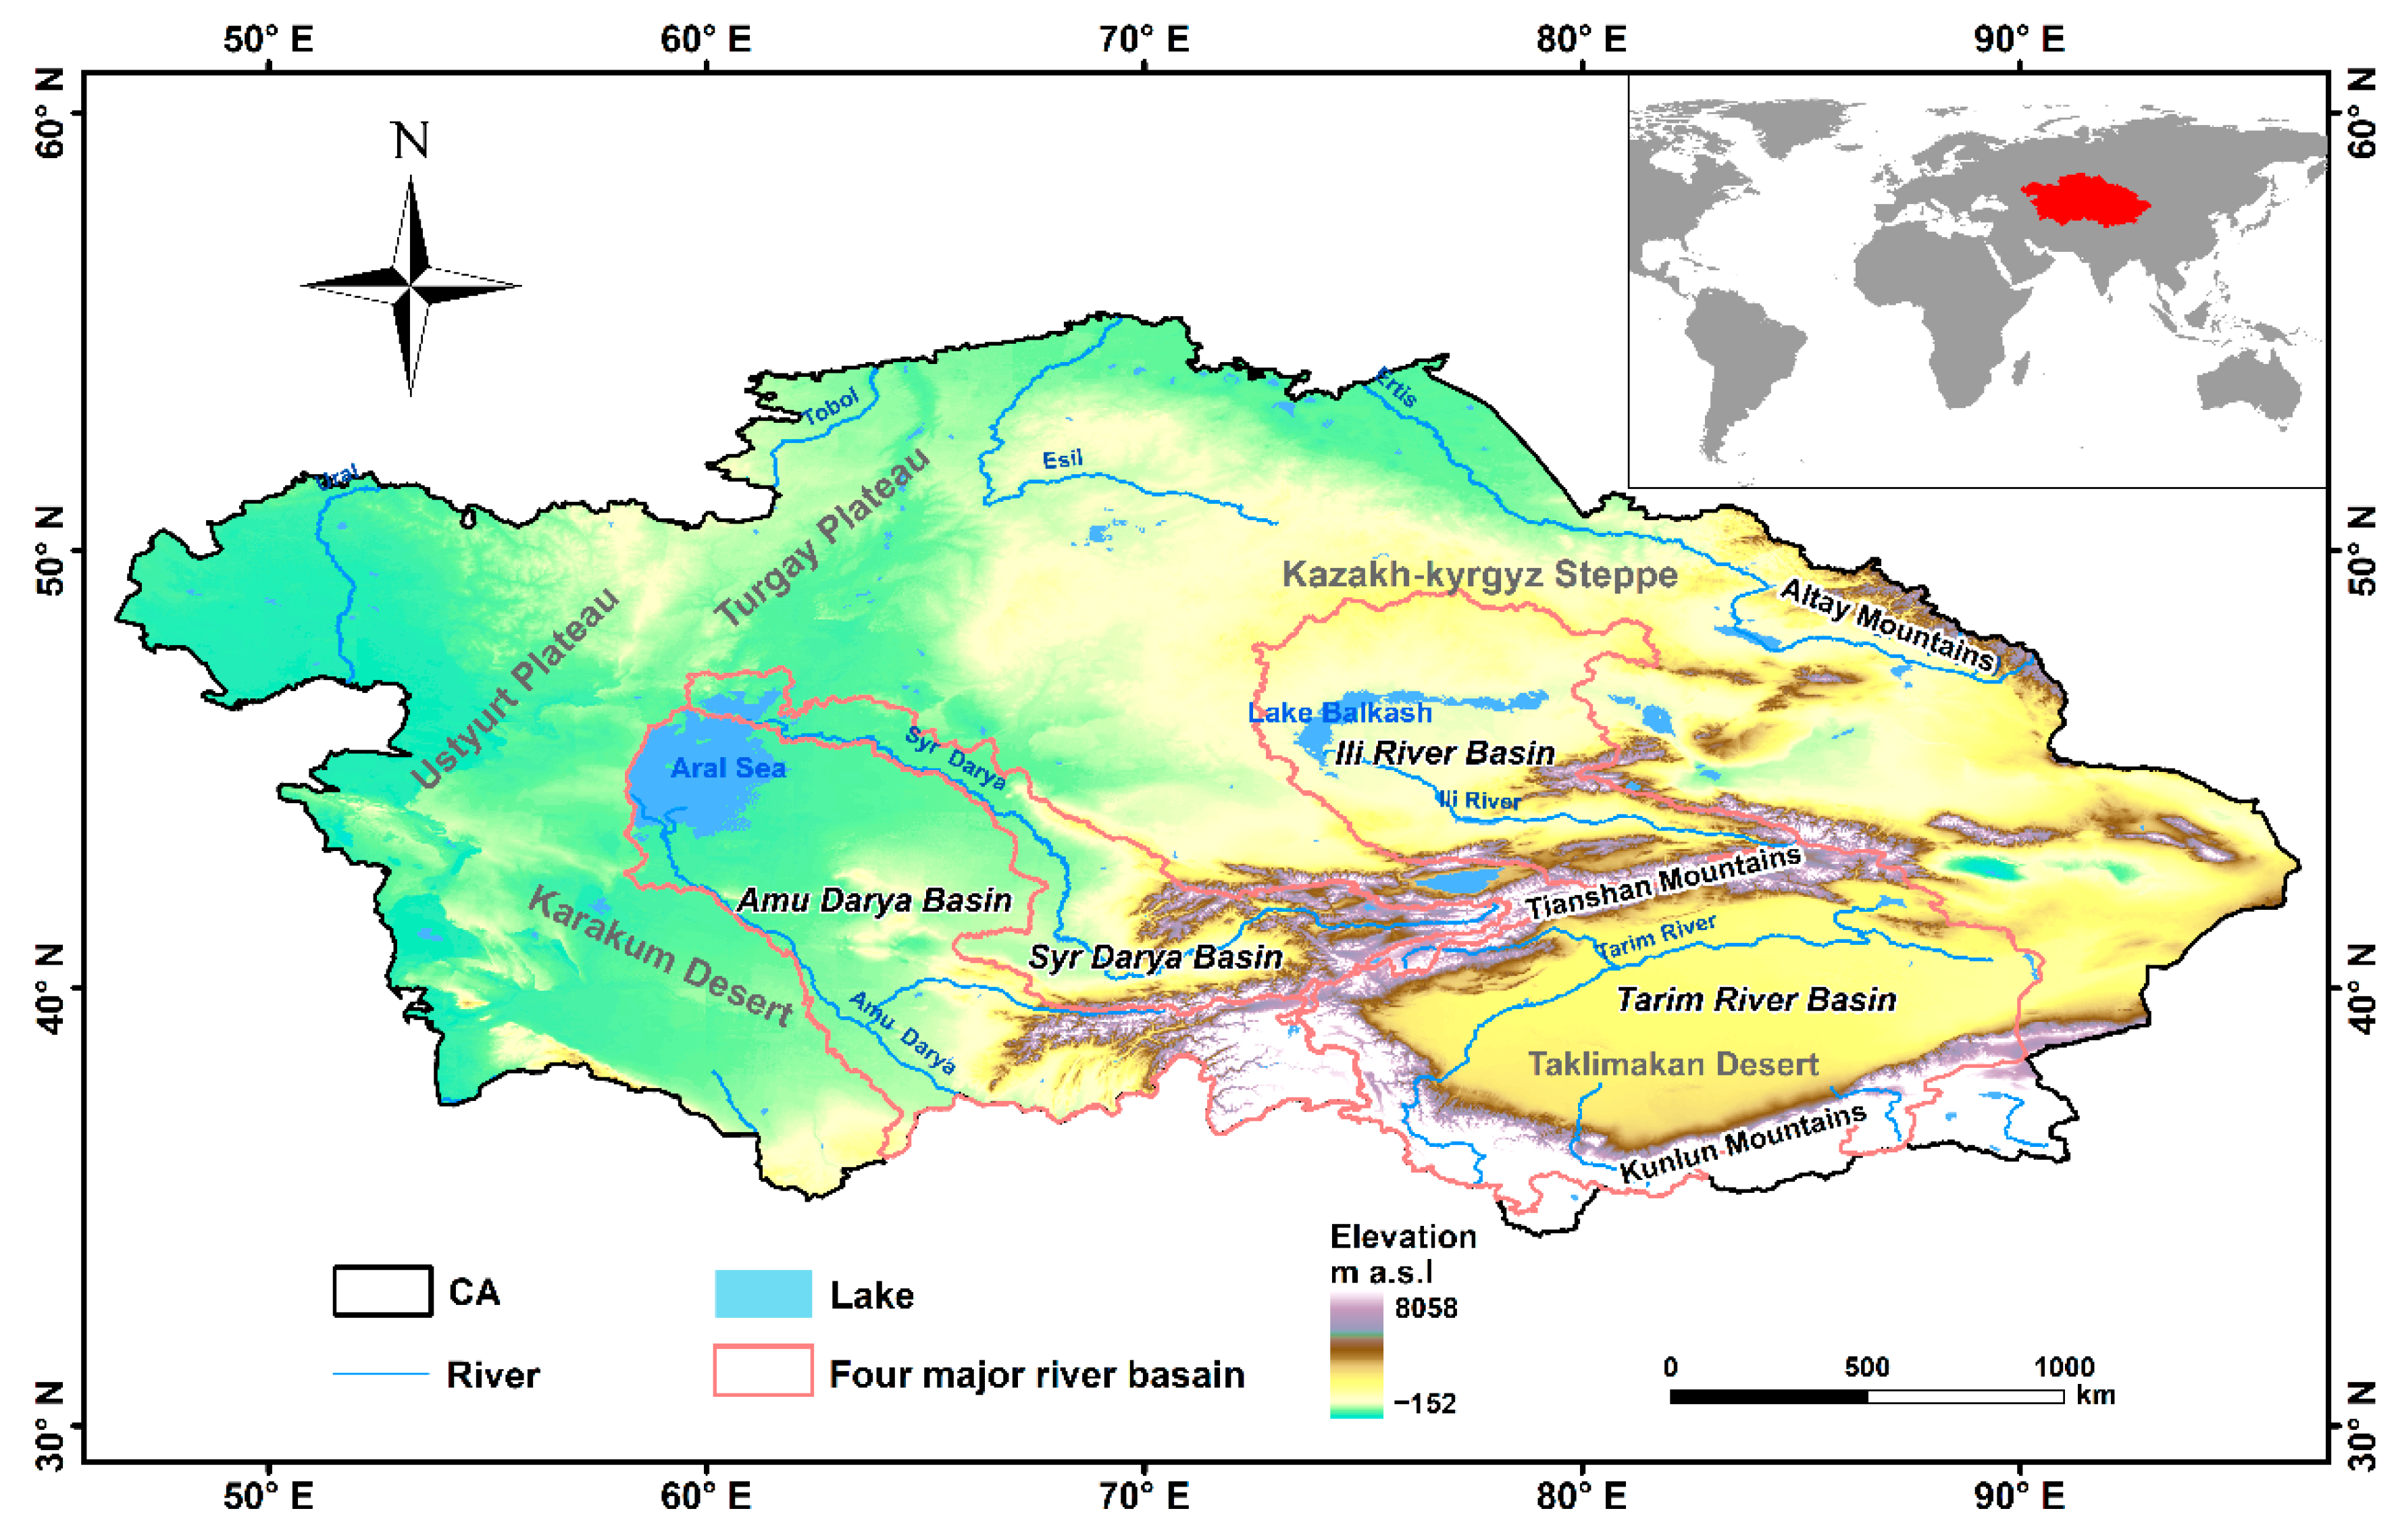
2.1. Study Area

CA (46°24′–97°06′E, 33°48′–55°48′N) covers five countries (Kazakhstan, Uzbekistan, Turkmenistan, Kyrgyzstan, and Tajikistan) and Xinjiang, China (Figure 1). It is located in Eurasia’s hinterland and belongs to the typical temperate continental climate. CA is an arid region with the largest transverse span in the Northern Hemisphere [47,48]. The annual average precipitation in CA is 17–800 mm. Extremely arid regions are located in the hinterland of Taklimakan Desert in the Tarim Basin, and regions with high precipitation are distributed in the Tianshan Mountains and Ili River Valley [49,50]. The main source of water in arid regions of CA is ice and snow melting in mountainous regions. The Tianshan Mountains are the “water tower” of CA and they serve as the major water source of CA [51].
Major river basins in CA include the Amu Darya Basin (ADB) (4.65 × 10⁵ km2), Syr Darya Basin (SDB) (2.19 × 10⁵ km2), Ili River Basin (IRB) (4.16 × 10⁵ km2), and Tarim River Basin (TRB) (8.46 × 10⁵ km2). Among them, TRB has the largest mobile desert in the world, which is the Taklimakan Desert [52]. Amu Darya and Syr Darya both originate from the Tianshan Mountains, and they are the two major rivers flowing into the Aral Sea [53,54]. The Ili River is the major inflowing river of Balkhash Lake. Global warming has accelerated ice and snow melting in mountainous areas [55]. Although this increases river runoff to some extent, the inflow volume to Balkhash Lake in the lower reaches is decreasing every year because of large-scale water diversion for irrigation in the upper reaches [56,57]. As a result, lake, and water areas in the lower reaches of CA, including the Aral Sea, Taitma Lake, and Balkhash Lake, are decreasing every year [58,59]. In arid regions, river basins support most human and social economic activities [60]. Therefore, problems such as the degradation of the ecological environment and water shortage in CA require urgent attention.

2.2. Data Sources

2.2.1. Meteorological and Soil Data

CA has extremely few meteorological stations, which are mainly distributed in oases and plains [61]. Moreover, most stations have been abandoned since the collapse of the Soviet Union. Consequently, it is very difficult to obtain long-term continuous meteorological data [62]. In this study, the CRU dataset of the University of East Anglia of East Anglia, UK (http://www.cru.uea.ac.uk/data (accessed on 14 April 2021)) was used for meteorological data. The CRU dataset has good adaptability over global areas and provides high accuracy in the characterization of drought and moisture [63,64]. Therefore, the temperature and precipitation data of CA from 1982 to 2017 were extracted from CRU TS v.4.04 (CRU Time series version 4.04), with a resolution of 0.5 × 0.5°. We resampled all data to a spatial resolution of 1 km by a statistical downscaling method in order to ensure consistency across data products.
Soil data used in this study were obtained from the world soil database (http://www.fao.org/soils-portal/en/ (accessed on 4 January 2021)). The Harmonized World Soil Database (HWSD) is the global soil database jointly developed by the Food and Agriculture Organization of the United Nations (FAO) and the International Institute for Applied Systems (IIASA). Based on the simplified American standards, HWSD divides soils into four types according to grain size: clay particles (<0.002 mm), silt (0.002–0.05 mm), sand (0.05–2 mm), and gravel (>2 mm). The spatial resolution of data is 1 km.

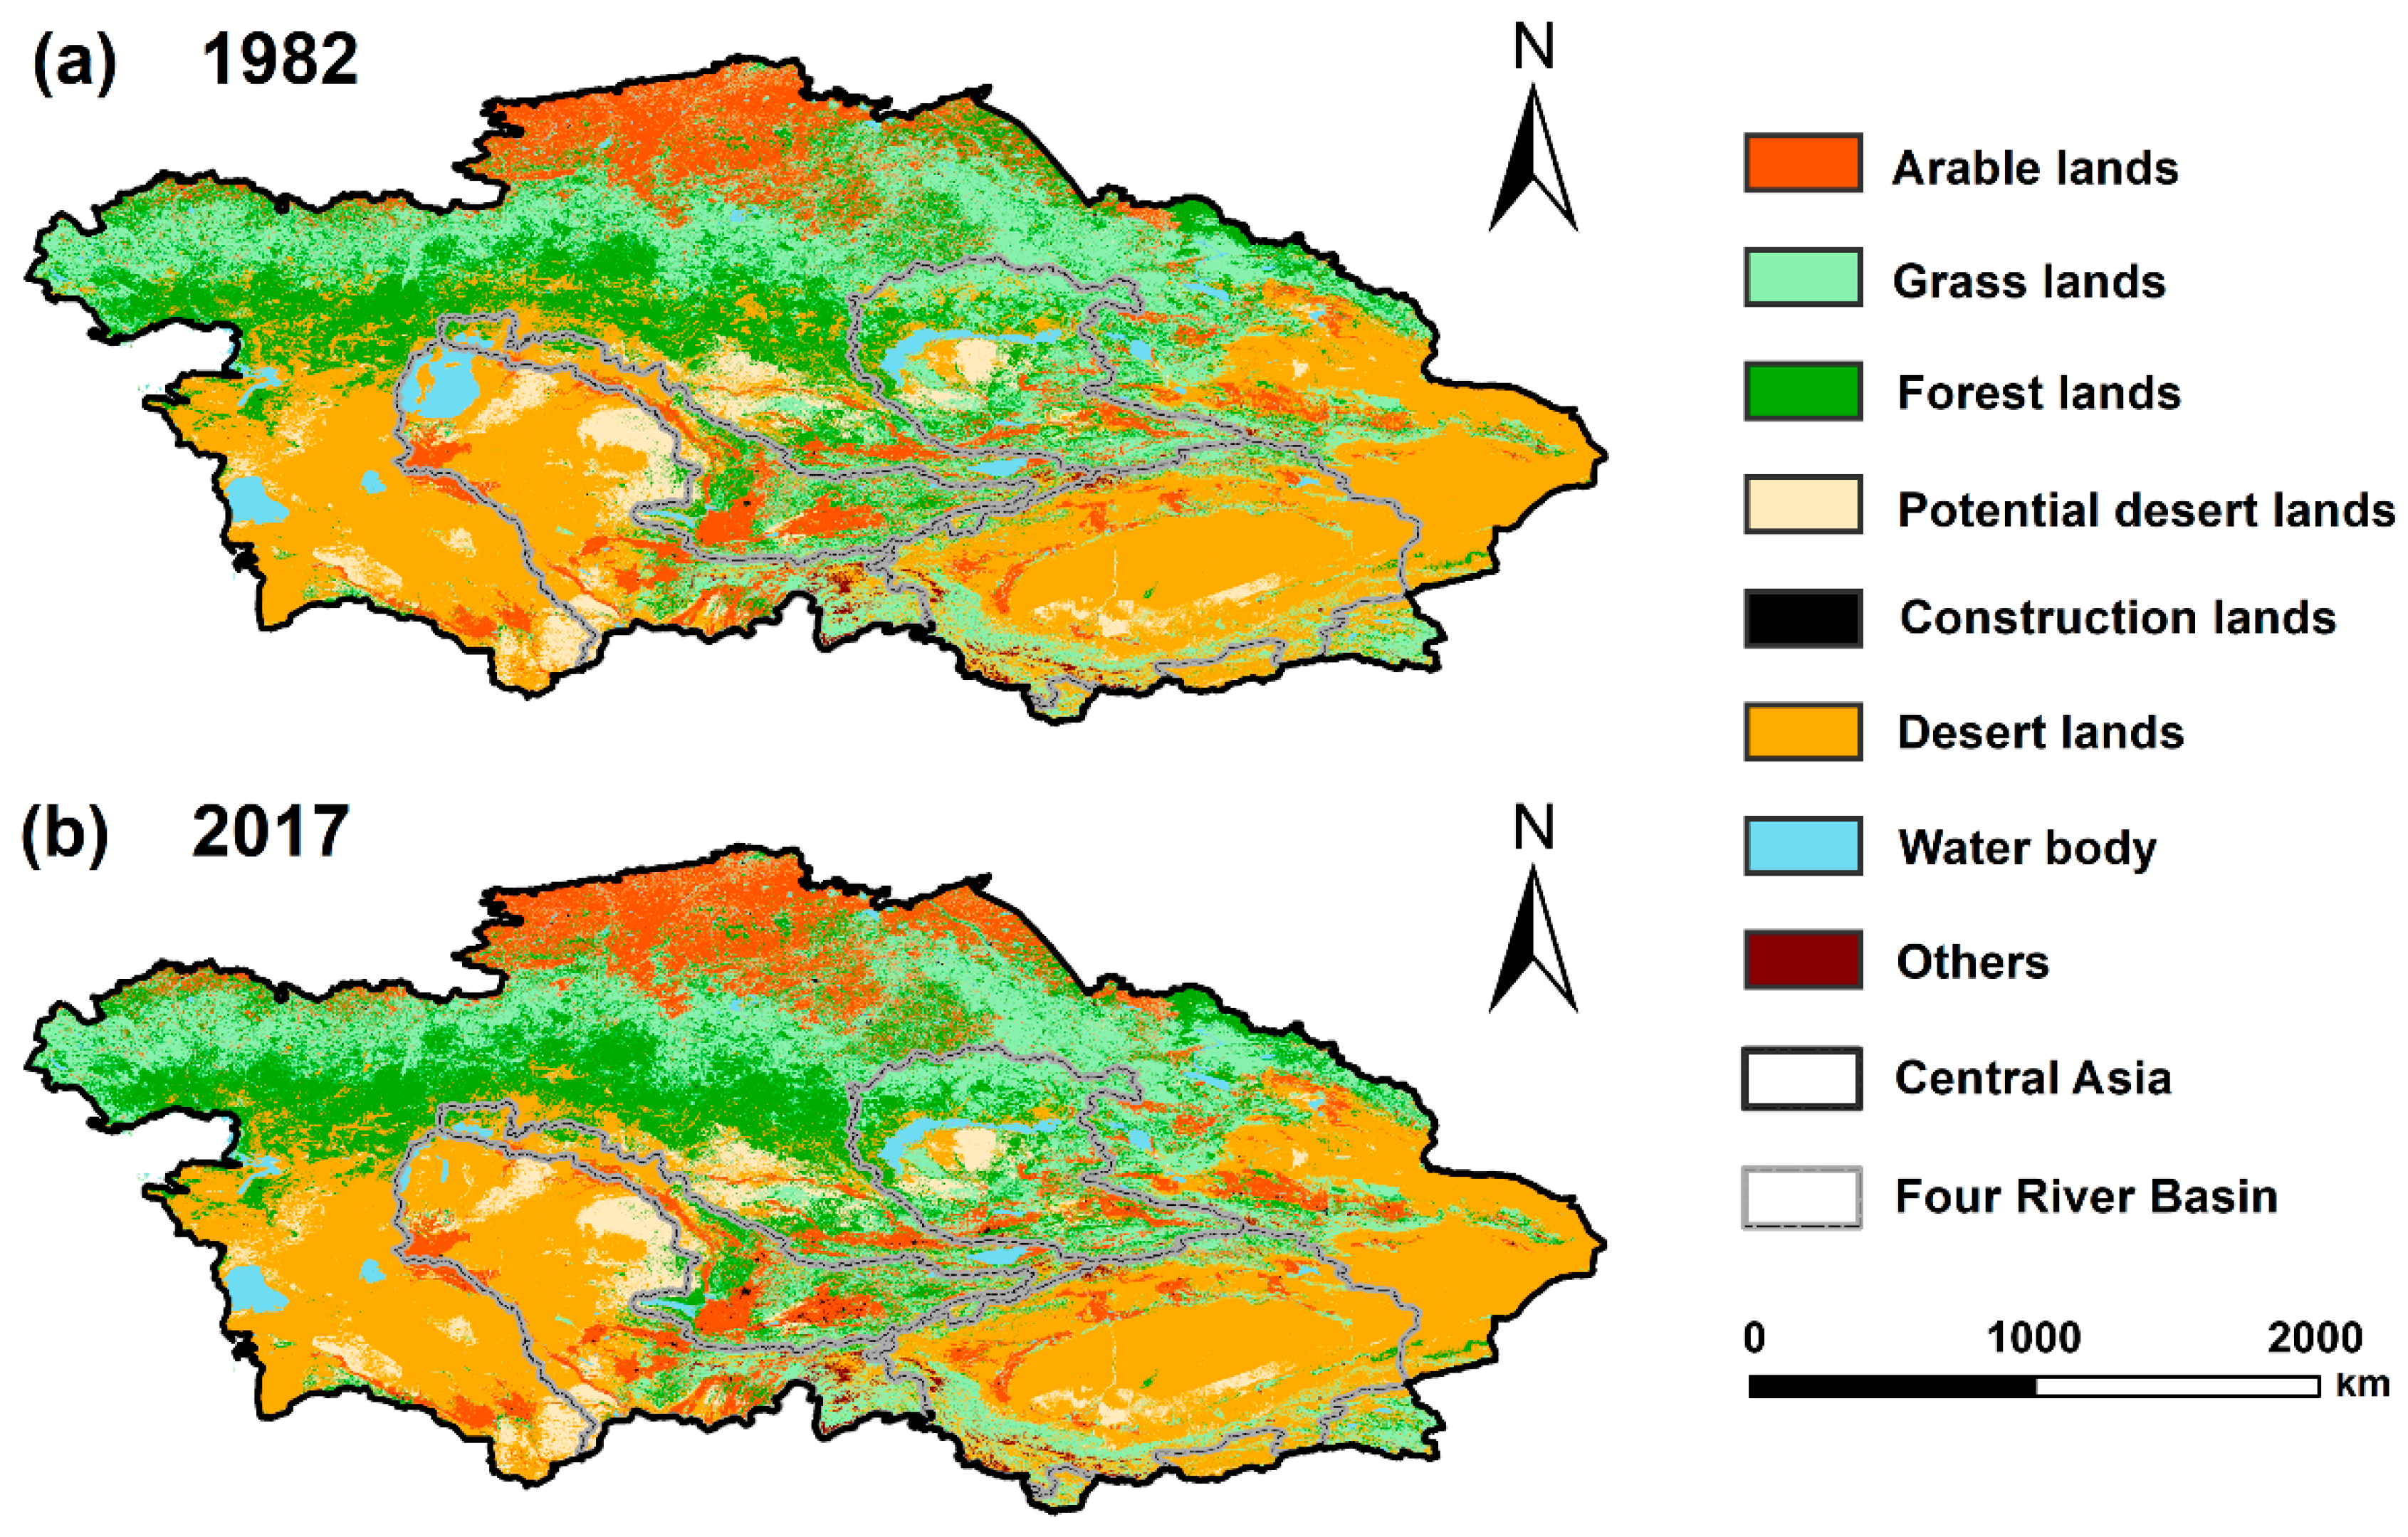
2.2.2. Vegetation and Land Use Data
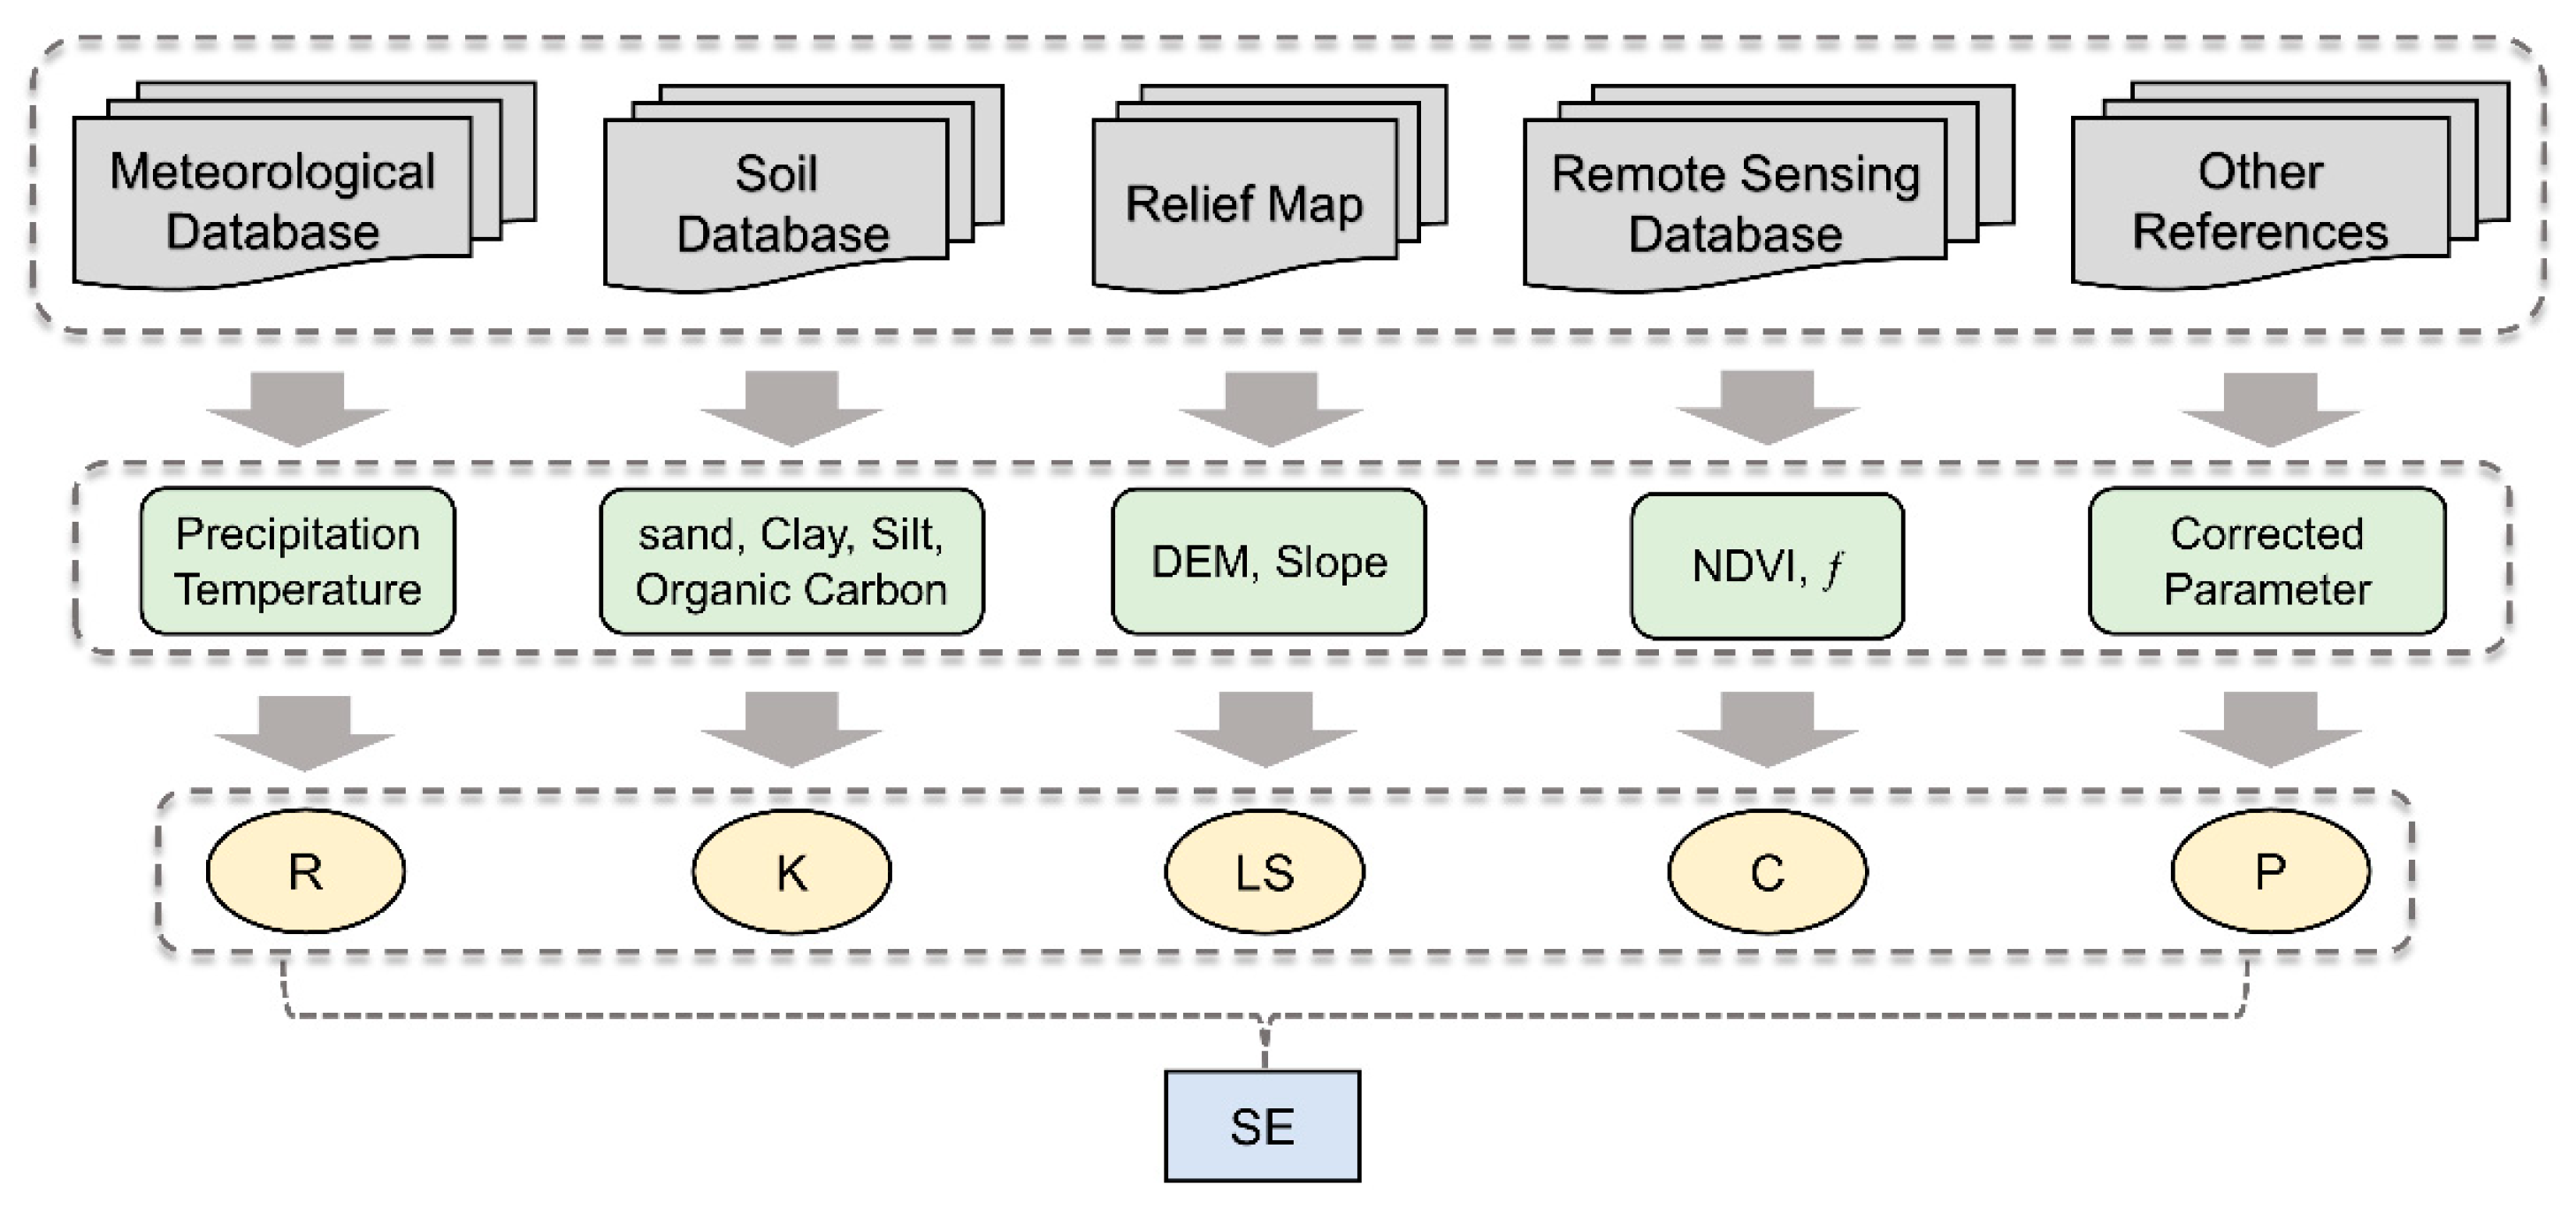
As an important component of ecosystems, vegetation is the link between the atmosphere and pedosphere [65]. With the continuous development of remote sensing technology, many vegetation indexes have become available for determining surface vegetation cover and its spatial heterogeneity, with support for global and regional studies [66,67]. NDVI, which is acquired by the AVHRR sensor of the National Oceanic and Atmospheric Administration and MODIS satellite sensor developed by the National Aeronautics and Space Administration (NASA), is characterized by wide coverage, long time series, and better accuracy. Thus far, it has been extensively used to study dynamic changes of global or regional vegetation [68,69]. In this study, two sets of global databases were applied, namely GIMMS3g NDVI and MODIS NDVI. The spatial resolution, interval, and time range of GIMMS3g NDVI (Global Inventory Modelling and Mapping Studies) data were 0.0833°, 15 d and 1982–2015, respectively. The MODIS NDVI data were collected from the Land Processes Distributed Active Archive Center (LP DAAC/NASA) of NASA MODIS. The MODIS NDVI database used in this study was the MOD13A2 V6 product, provided by the MODIS sensor onboard the Terra Satellite. The spatial resolution and time resolution were 1 km and 16 d, respectively. The data were collected during 2000–2017. The above databases have been widely used to study long-term changes in vegetation coverage in many regions worldwide [70,71,72]. Hence, GIMMS 3g NDVI was calibrated with the variance matching method using MODIS NDVI data as the benchmark, and the spatial resolution was unified to 1 km. Finally, an NDVI dataset of the major basins in CA from 1982 to 2017 was obtained.
LUCC data were obtained from ESA CCI-LC (European Space Agency, Climate Change Initiative, Land Cover, https://www.esa-landcover-cci.org (accessed on 18 June 2021)), with a spatial resolution of 300 m. ESA CCI-LC has been extensively applied in studies on CA [73,74]. In this study, ESA CCI-LC products in 1992 and 2017 were used as the basic data and TM images of CA in 1982 were selected as the background maps. Artificial visual interpretation was carried out with reference to ESA CCI-LC in 1992. According to the interpretation results, CA was divided into 8 land use/cover types: arable land (AL), grass land (GL), forest land (FL), potential desert land (PDL), desert land (DL), water body (WB), construction land (CL), and others. High-resolution Google Earth images were used for verification and the accuracy could reach more than 86% [75,76]. This indicates that the land use/cover data after artificial visual interpretation has good applicability to CA. In this study, we resample all raster data to 1-km.

2.3. Methods

The Revised Universal Soil Loss Equation (RUSLE) model is an improved SE analysis model based on the USLE model of the Agricultural Research Service (ARS) of the United States Department of Agriculture (USDA). With its strong practicability and comprehensive abilities, the RUSLE model has been extensively used in Chinese and foreign studies [77,78]. Based on the geographic information system (GIS), SE in CA was quantified using remote sensing images as the input data. The basic formula of the RUSLE model is:
S E = R × K × L S × C × P
where SE is the annual average soil erosion quantity (t km2 a−1) (Figure 2 and Figure 3). R is the rainfall erosivity factor (MJ mm km−2 h−1 a−1). K is the soil erodibility factor (h hm2 km−2 MJ−1 mm−1). LS is the slope length (L) and steepness (S) factor. C is the surface vegetation cover factor and P is a dimensionless conservation practice factor.

2.3.1. Rainfall Erosivity Factor (R)

Rainfall erosivity factor (R) is an important driving force of SE and it is an important factor for predicting SE [79,80]. This study uses the empirical formula derived by Wischmeier and Smith [81]. The formula, which fully considers the characteristics of rainfall, is one of the most scientific methods for calculating R and has been widely used in different regions.
R = i = 12 12 1.375 × 10 [ 1.5 × log 10 ( P i 2 P ) 0.08188 ]
where, i represents the month in a year; Pi is the rainfall in month i (mm); Pa represents the annual rainfall (mm). R is the annual average rainfall erosivity (MJ mm/[ha·h·a]). We compared the R-factor results for Central Asia with the published R-factor datasets for the pan-third pole region (20 countries containing key regions, http://data.tpdc.ac.cn/zh-hans/ (accessed on 23 December 2021)), and the fitting results were good (R2 = 0.853) (Figure S2), indicating that our results are accurate enough to be used in this study.

2.3.2. Soil Erodibility Factor (K)

Soil is the body on which SE occurs and soil erodibility significantly influences the occurrence probability of SE [82]. In this study, the extensively used EPIC model proposed by Williams et al. [83] was selected to calculate the soil erodibility factor (K value). The formula of the EPIC model is as follows:
K E P I C = { 0.2 + 0.3 e x p [ 0.0256 S a ( 1 S i 100 ) ] } × ( S i C l + S i ) 0.3 × [ 1 0.25 C C + e x p ( 3.72 2.95 C ) ] × [ 1 0.7 S n S n + e x p ( 5.51 + 22.9 S n ) ]
S n = 1 S a 100
where Sa is the sand content (2–0.05 mm), %. Si is the silt content (0.05–0.002 mm), %. Cl is the clay content (<0.002), and %. C is the organic carbon content, %. For the K factor, we compared it with the published K factor data of the pan-polar third pole 20 countries (http://data.tpdc.ac.cn/zh-hans/ (accessed on 23 December 2021)), which was calculated based on the soil attribute data of the International Soil Reference and Information Centre. The two fitted well (R2 = 0.768), indicating that the results of our K factor were more accurate and could be applied to Central Asia (Figure S3).

2.3.3. Slope Length and Steepness Factor (LS)

The LS factor was derived based on DEM (digital elevation model, 30-m http://hydro.iis.u-tokyo.ac.jp/~yamadai/MERIT_DEM (accessed on 25 October 2021)). The LS factor algorithm in this study was based on the studies of McCool et al. [84] as follows:
L = ( λ 22.1 ) m
S = { 10.8 s i n ( θ ) + 0.03   θ 9 ° 16.8 s i n ( θ ) 0.50   θ 10 °
where λ is the horizontal projection slope length (m); m is the variable slope length index; and θ is the steepness of slope (°).

2.3.4. Cover Management (C)

Vegetation cover and management factor (C) reflects the influences of vegetation cover and crop management measures on SE quantity [85]. As vegetation cover is highly correlated with NDVI, C was calculated using the method proposed by Cai et al. [86]:
f = ( N D V I N D V I m i n ) ( N D V I m a x N D V I m i n )
C = { 1 , f = 0 0.6508 0.3436 × log 10 f , 0 f 78.3 % 0 , f > 78.3 %
where f is the vegetation cover. NDVImax and NDVImin are maximum and minimum NDVI, respectively.

2.3.5. Support Practice Factor (P)

Support practice factor (P) reflects the inhibition effect of water and soil conservation measures on the occurrences of SE. It can be assigned according to the degree of water and soil conservation, which is reflected by different land use types [87,88]. P values range between 0 and 1. p = 1 indicates no conservation measure. Smaller p values indicate more effective water and soil conservation measures for inhibiting SE [89,90]. The P-factors in this study refer to the p-values of AL, GL, FL and PDL land use types in the relevant literature [32,45,88] to generate the final P-factor maps for the four major basins in CA. Finally, a diagram of P factor was generated (Figure 3).

2.4. Data Analysis

2.4.1. Trend Analysis

The unitary linear recursive analysis can simulate the variation trend of a single pixel. It uses the least square method to fit the slope of vegetation cover changes during a certain period [91]. The calculation formula is as follows:
θ s l o p e = n × i = 1 n ( i × A i ) i = 1 n i i = 1 n A i n × i = 1 n i 2 ( i = 1 n A i ) 2
where slope represents the slope of the variation trend; Ai is the numerical value of samples (SE, NDVI) in year i; and n is the research time. When θslope > 0 or <0 or =0, the sample value increases gradually or decreases continuously or remains constant, respectively, during this period.

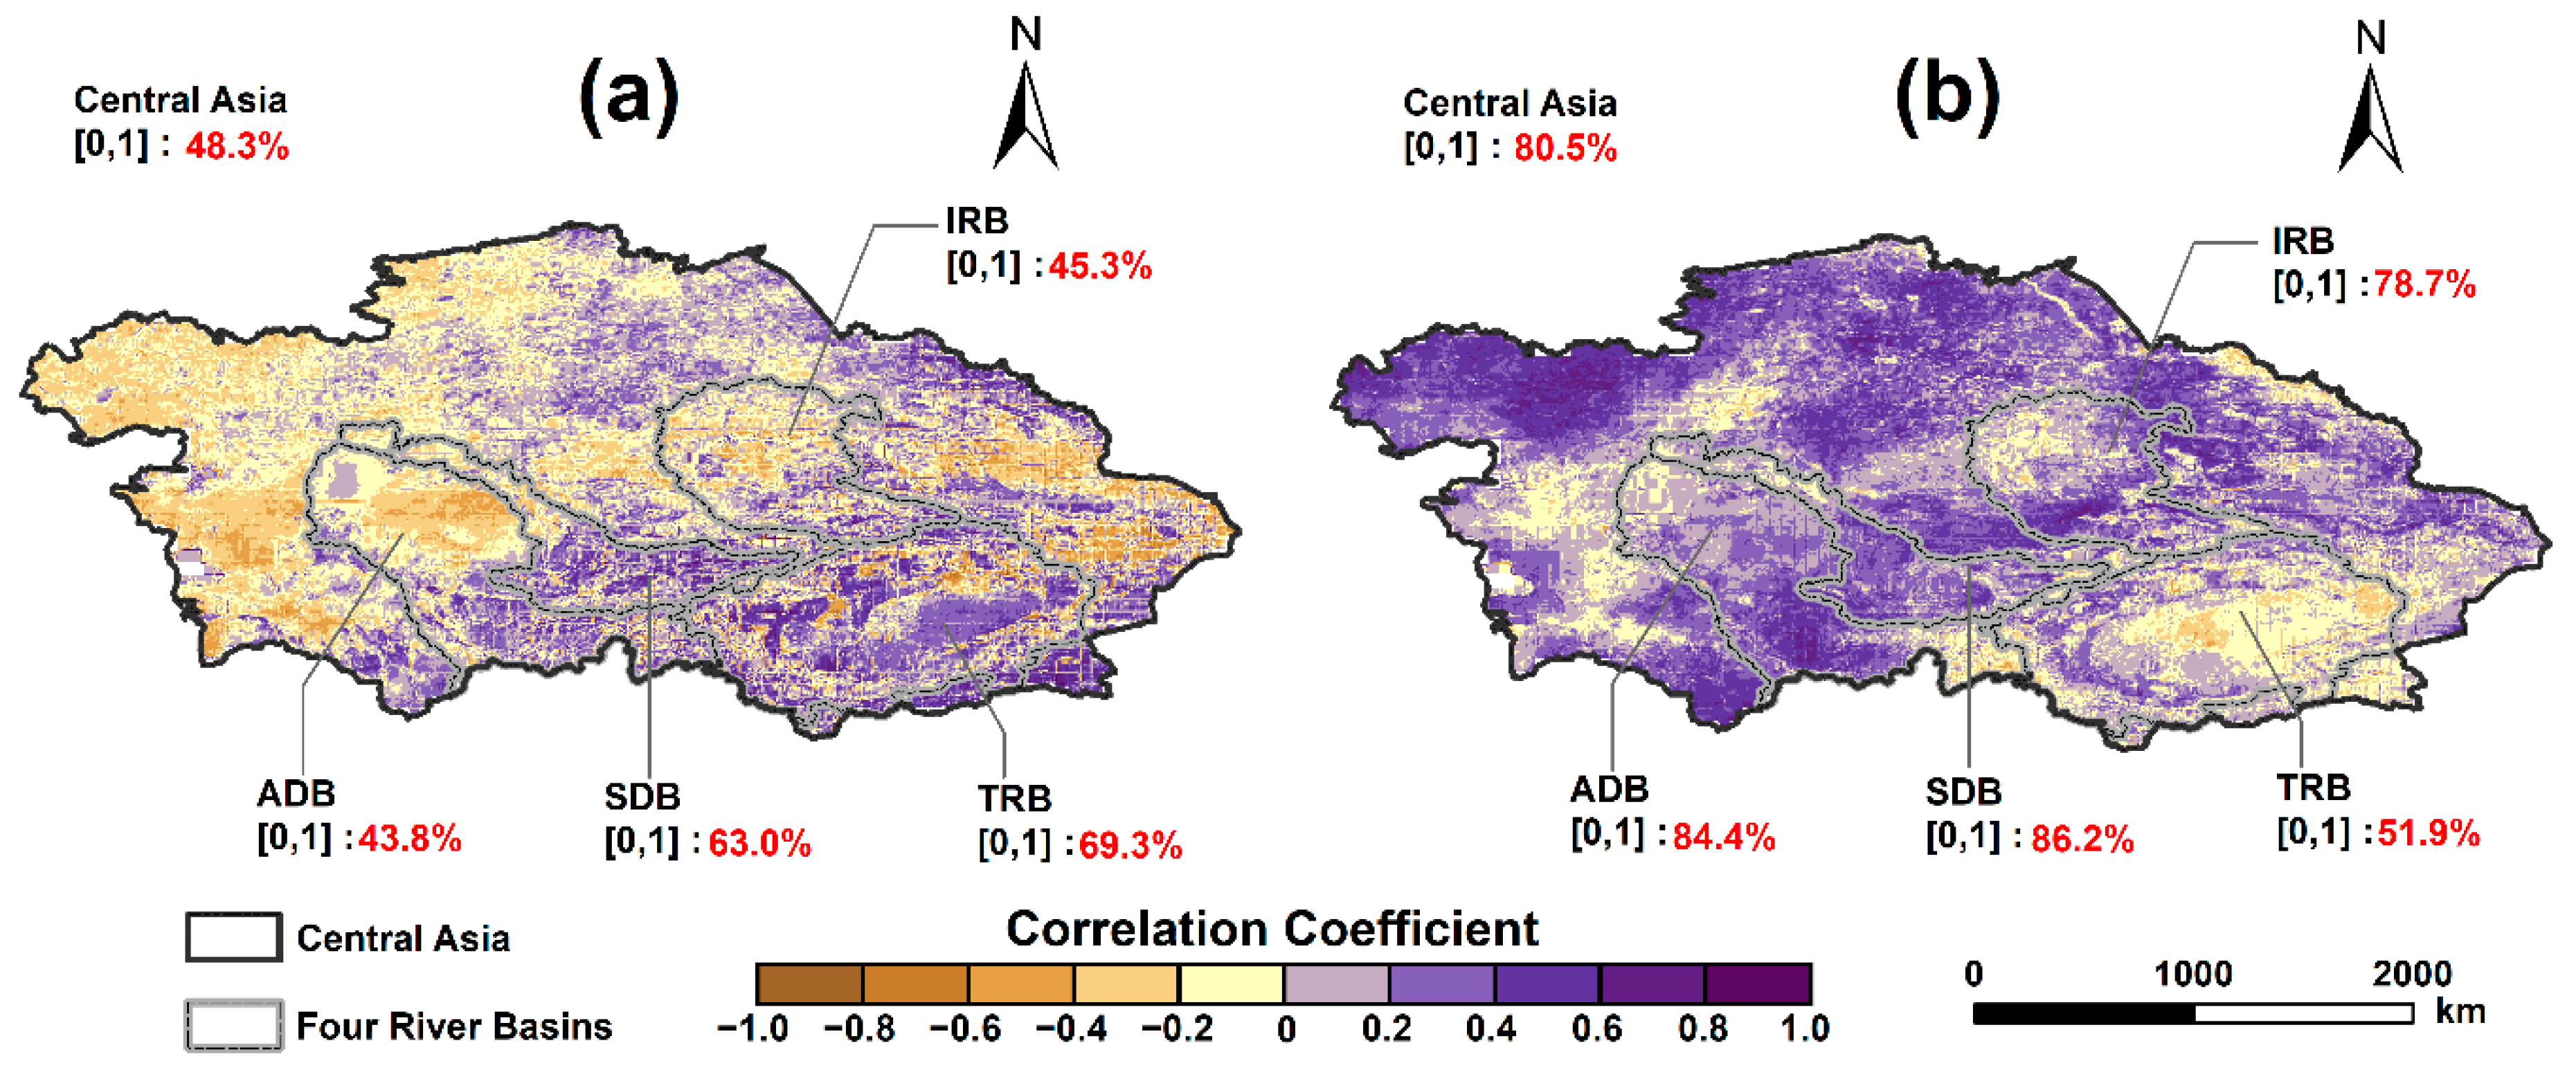
2.4.2. Correlation Analysis

The correlation between vegetation cover and climatic factor was analyzed using the spatial analysis method based on the single pixel approach. Similar to Jiang et al. [92], the correlation coefficients of vegetation cover with temperature and precipitation were calculated using the following formula:
r x y = i = 1 n ( x i x ¯ ) ( y i y ¯ ) i = 1 n ( x i x ¯ ) 2 i = 1 n ( y i y ¯ ) 2
where rxy is the correlation coefficient between vegetation cover and climatic factors; xi refers to the temperature or precipitation value in year i; x is the annual average temperature or precipitation; yi is vegetation coverage in year i; y is the annual average value of vegetation cover; and i is the number of study years.

2.4.3. Landscape Pattern Analysis

The Shannon Diversity Index (SHDI) is a comprehensive index. It can reflect not only the number of vegetation types, but also the evenness of the spatial distribution of different vegetation types [93]. Based on the LUCC data in CA, the landscape diversity index from 1982 to 2017 was calculated by using the Fragstats 4.2 software (University of Massachusetts, Amherst, MA, USA). The calculation formula is as follows:
S H D I = i = 1 n p i ln p i
where Pi is the proportion of type i in the whole landscape and n refers to the total number of plaque types in the landscape. SHDI represents the overall complexity degree of the landscape. SHDI = 0 indicates that the whole landscape is only composed of one plaque. With the increase in SHDI (SHDI ≥ 0), the plaque types increase or the distribution of different plaque types in the landscape becomes increasingly more uniform. The variations of SHDI in the study area from 1982 to 2017 are shown in Figure S1. In general, SHDI gradually increased in CA (+0.0003/year).

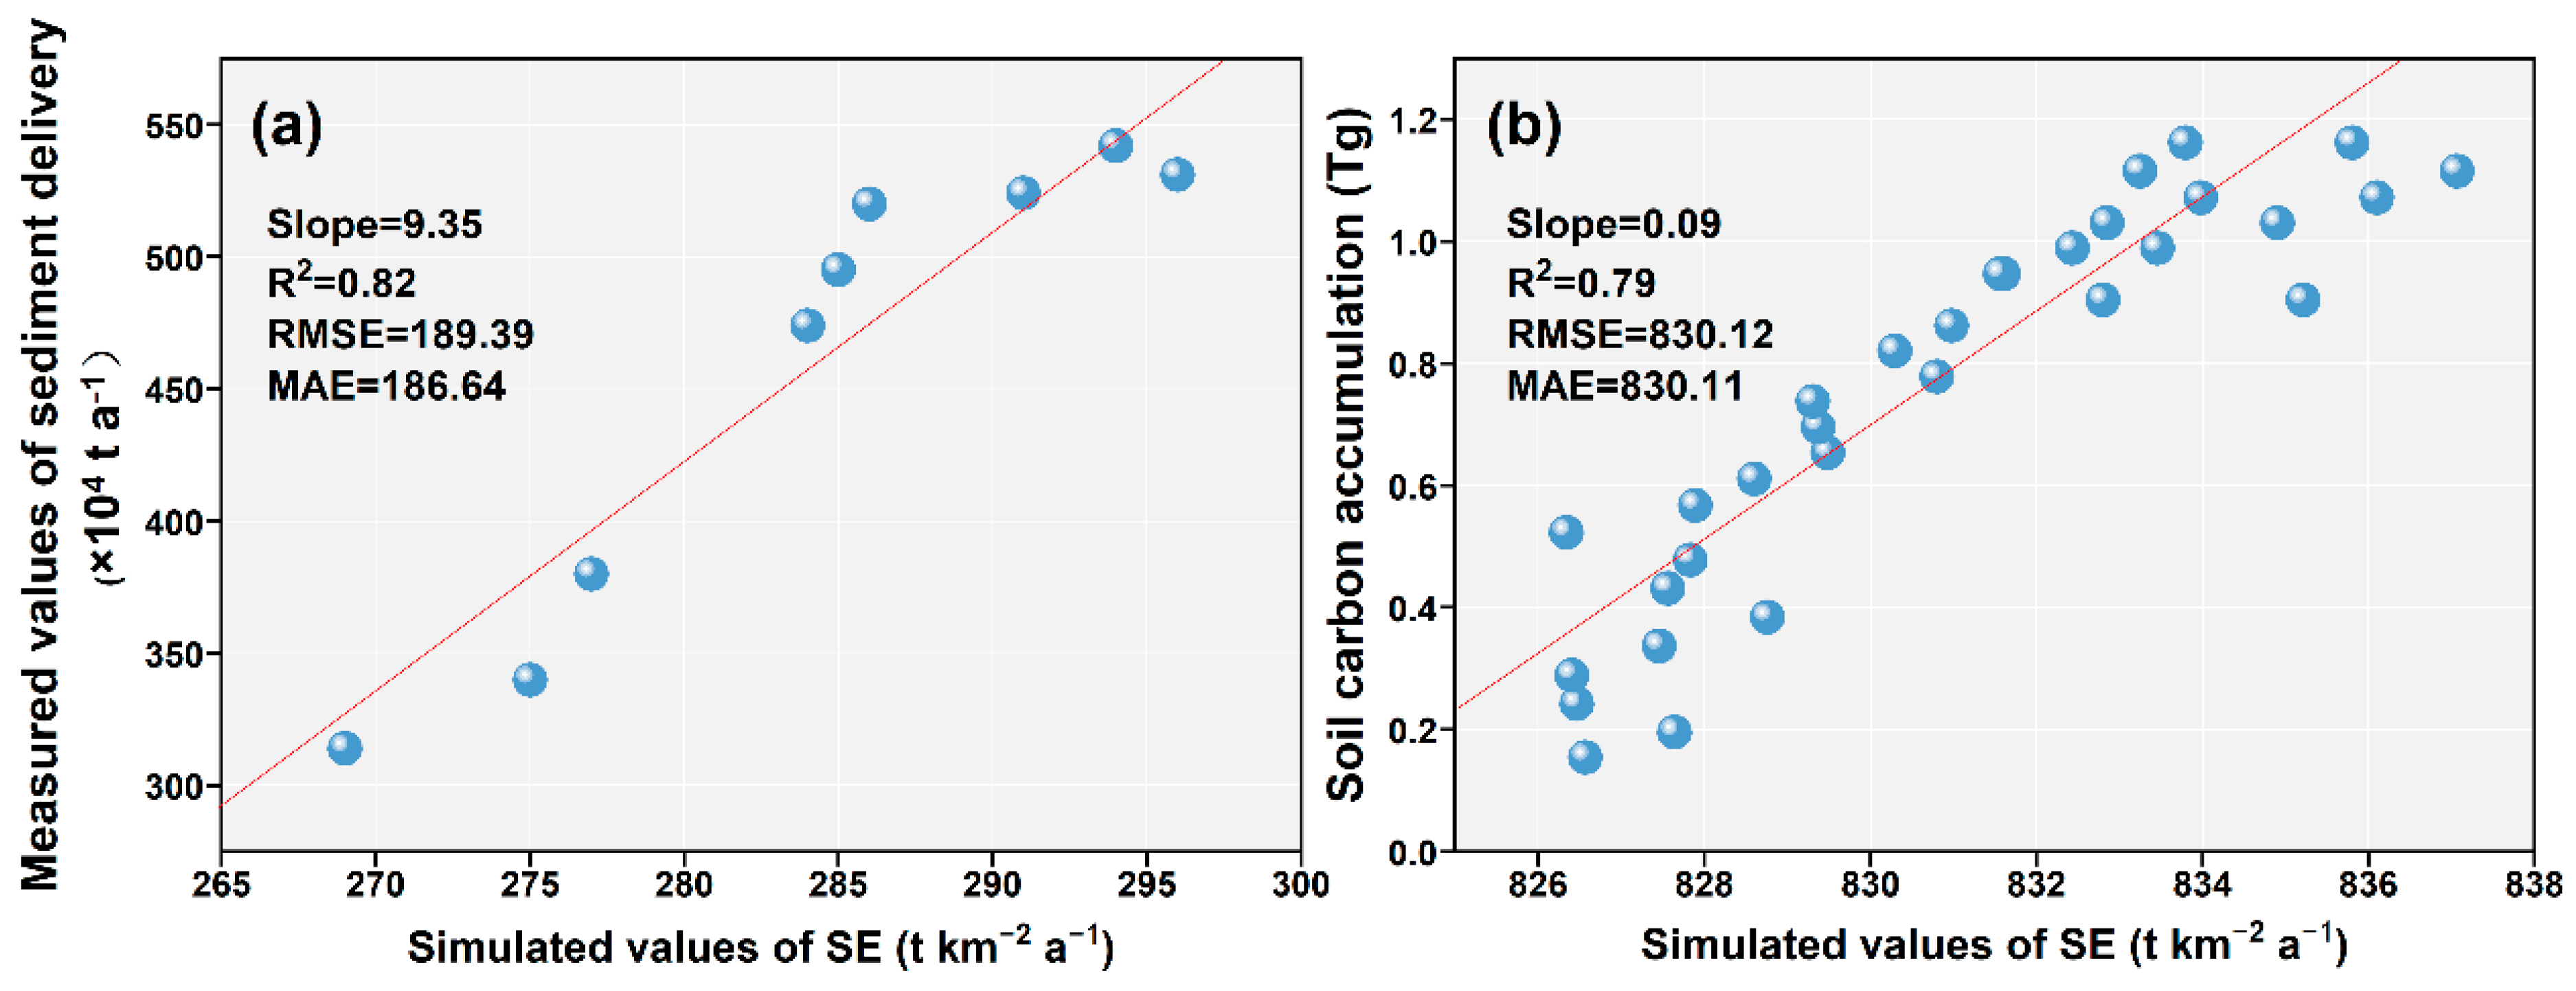
2.5. Model Validation

In the process of global changes, increases in atmospheric CO2 concentration gradually led to global warming [94]. SE can cause loss of soil organic carbon, thus altering global carbon reserves and carbon cycles [95] and accelerating the global warming process [96]. Berhe et al. [97] discussed the role of SE in the biogeochemical cycles of essential elements such as carbon, nitrogen, and phosphorus and found that the area of land with SE increases with soil carbon density, and it was influenced significantly by the distribution of soil carbon density. Therefore, SE has significant correlation with soil carbon accumulation. On this basis, the soil carbon cumulative data in CA was downloaded from FAO (http://faostat.fao.org/site/630/default.aspx (accessed on 26 September 2021)) for fitting with the SE quantity of the major river basins in CA. The results showed good correlation (R2 = 0.79, RMSE = 830.12, MAE = 830.11). To further verify the accuracy of the simulation results, annual sediment delivery data from 2006 to 2008 were collected from three hydrometric stations in TRB. The data of the water transmission is derived from the Annual Hydrological Report, China. The annual sediment delivery data is calculated by accumulating the daily sediment delivery data. A linear fitting analysis was carried out between the sediment delivery data in TRB and annual erosion quantity at hydrometric stations, and the results showed good degree of fitting (R2 = 0.82, RMSE = 189.39, MAE = 186.64). Although we used two different data sources to validate the simulation results and obtained larger RMSE values (Figure 4), we found that the RMSE values in our validation results differed less from the MAE values. Therefore, our simulation accuracy is better for SE by water in the main watersheds of CA by means of parameter localization and other means.

3. Results

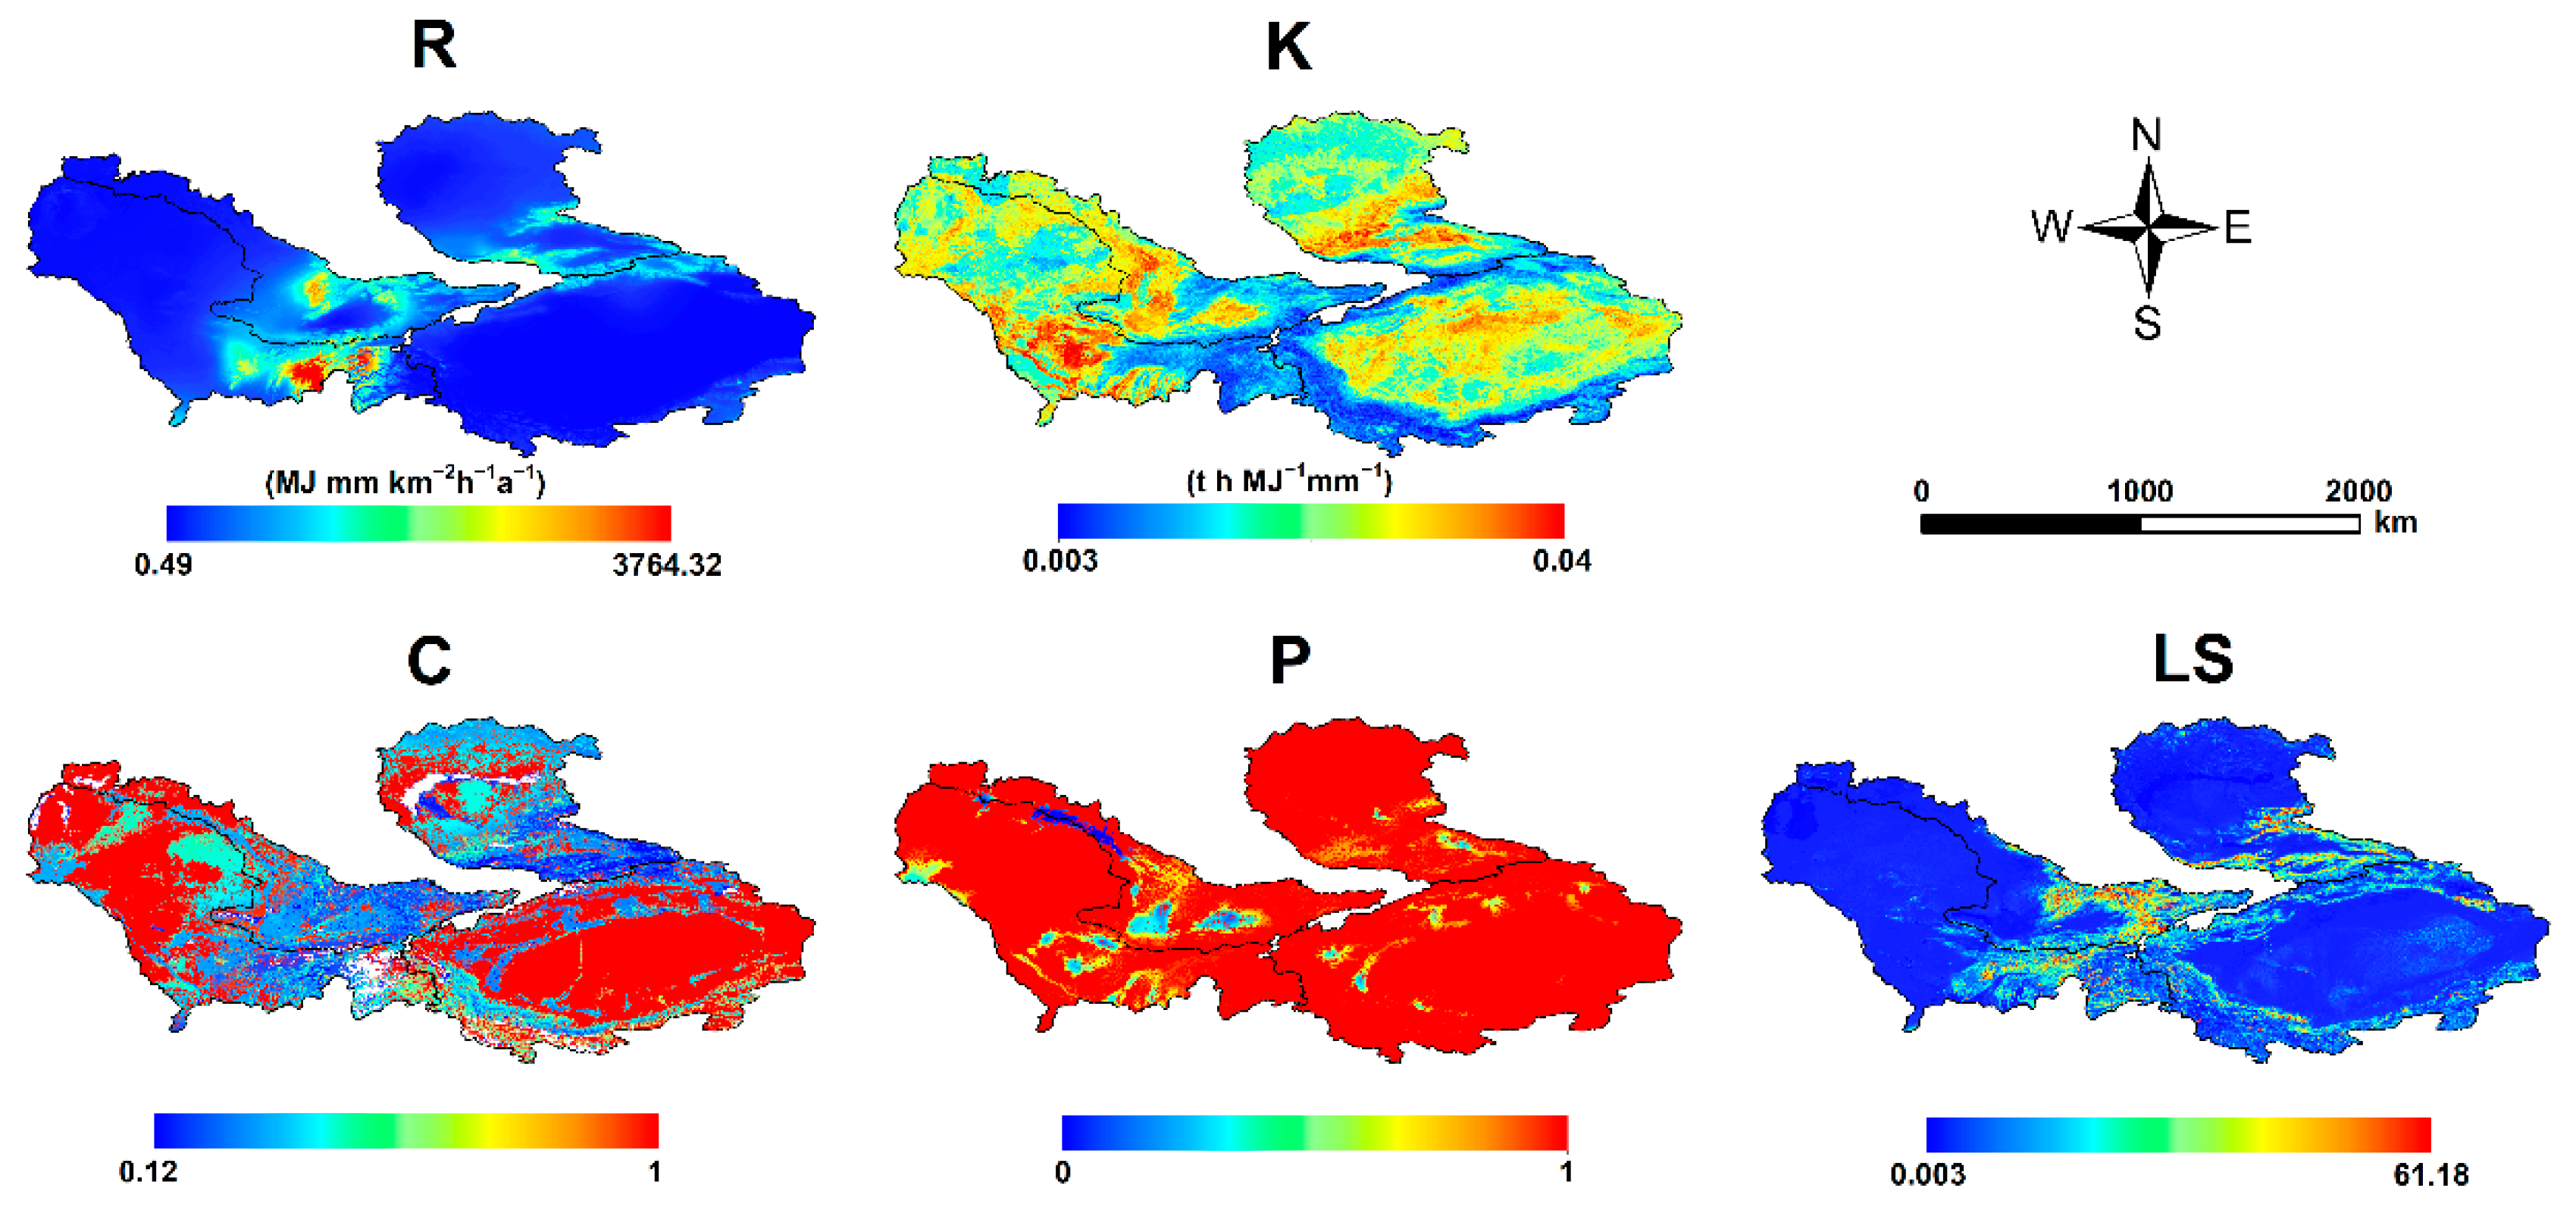
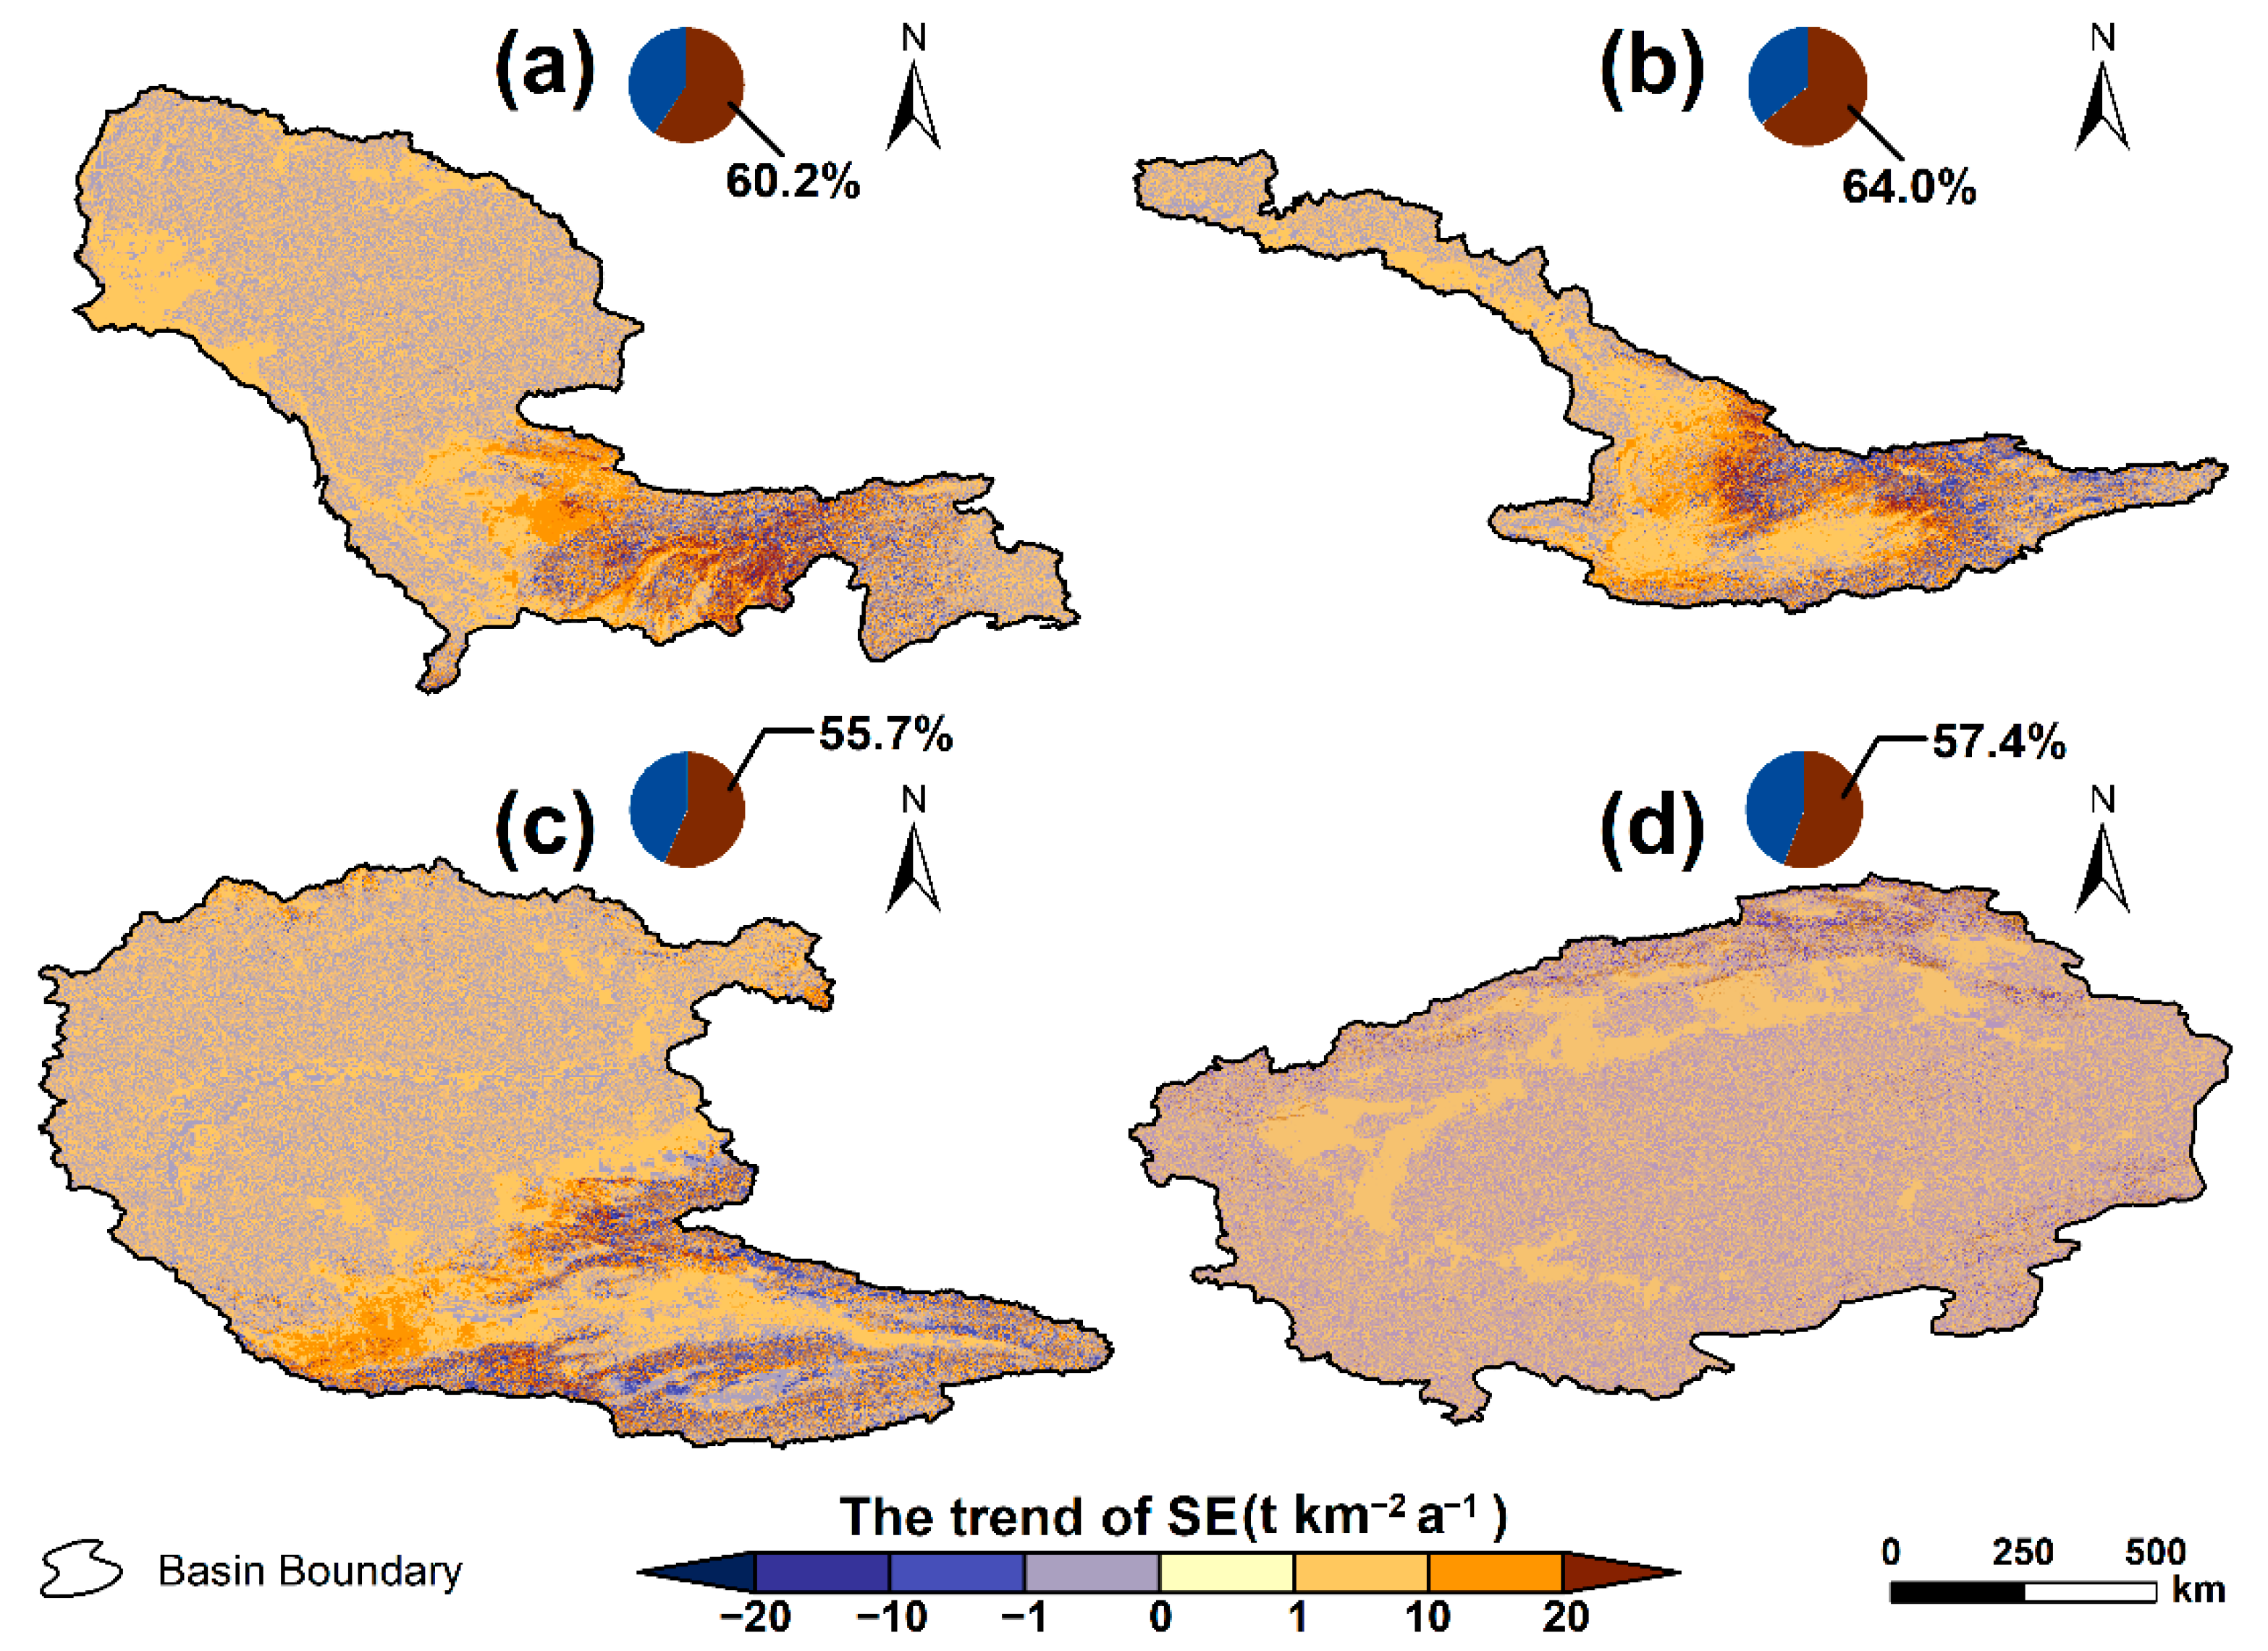
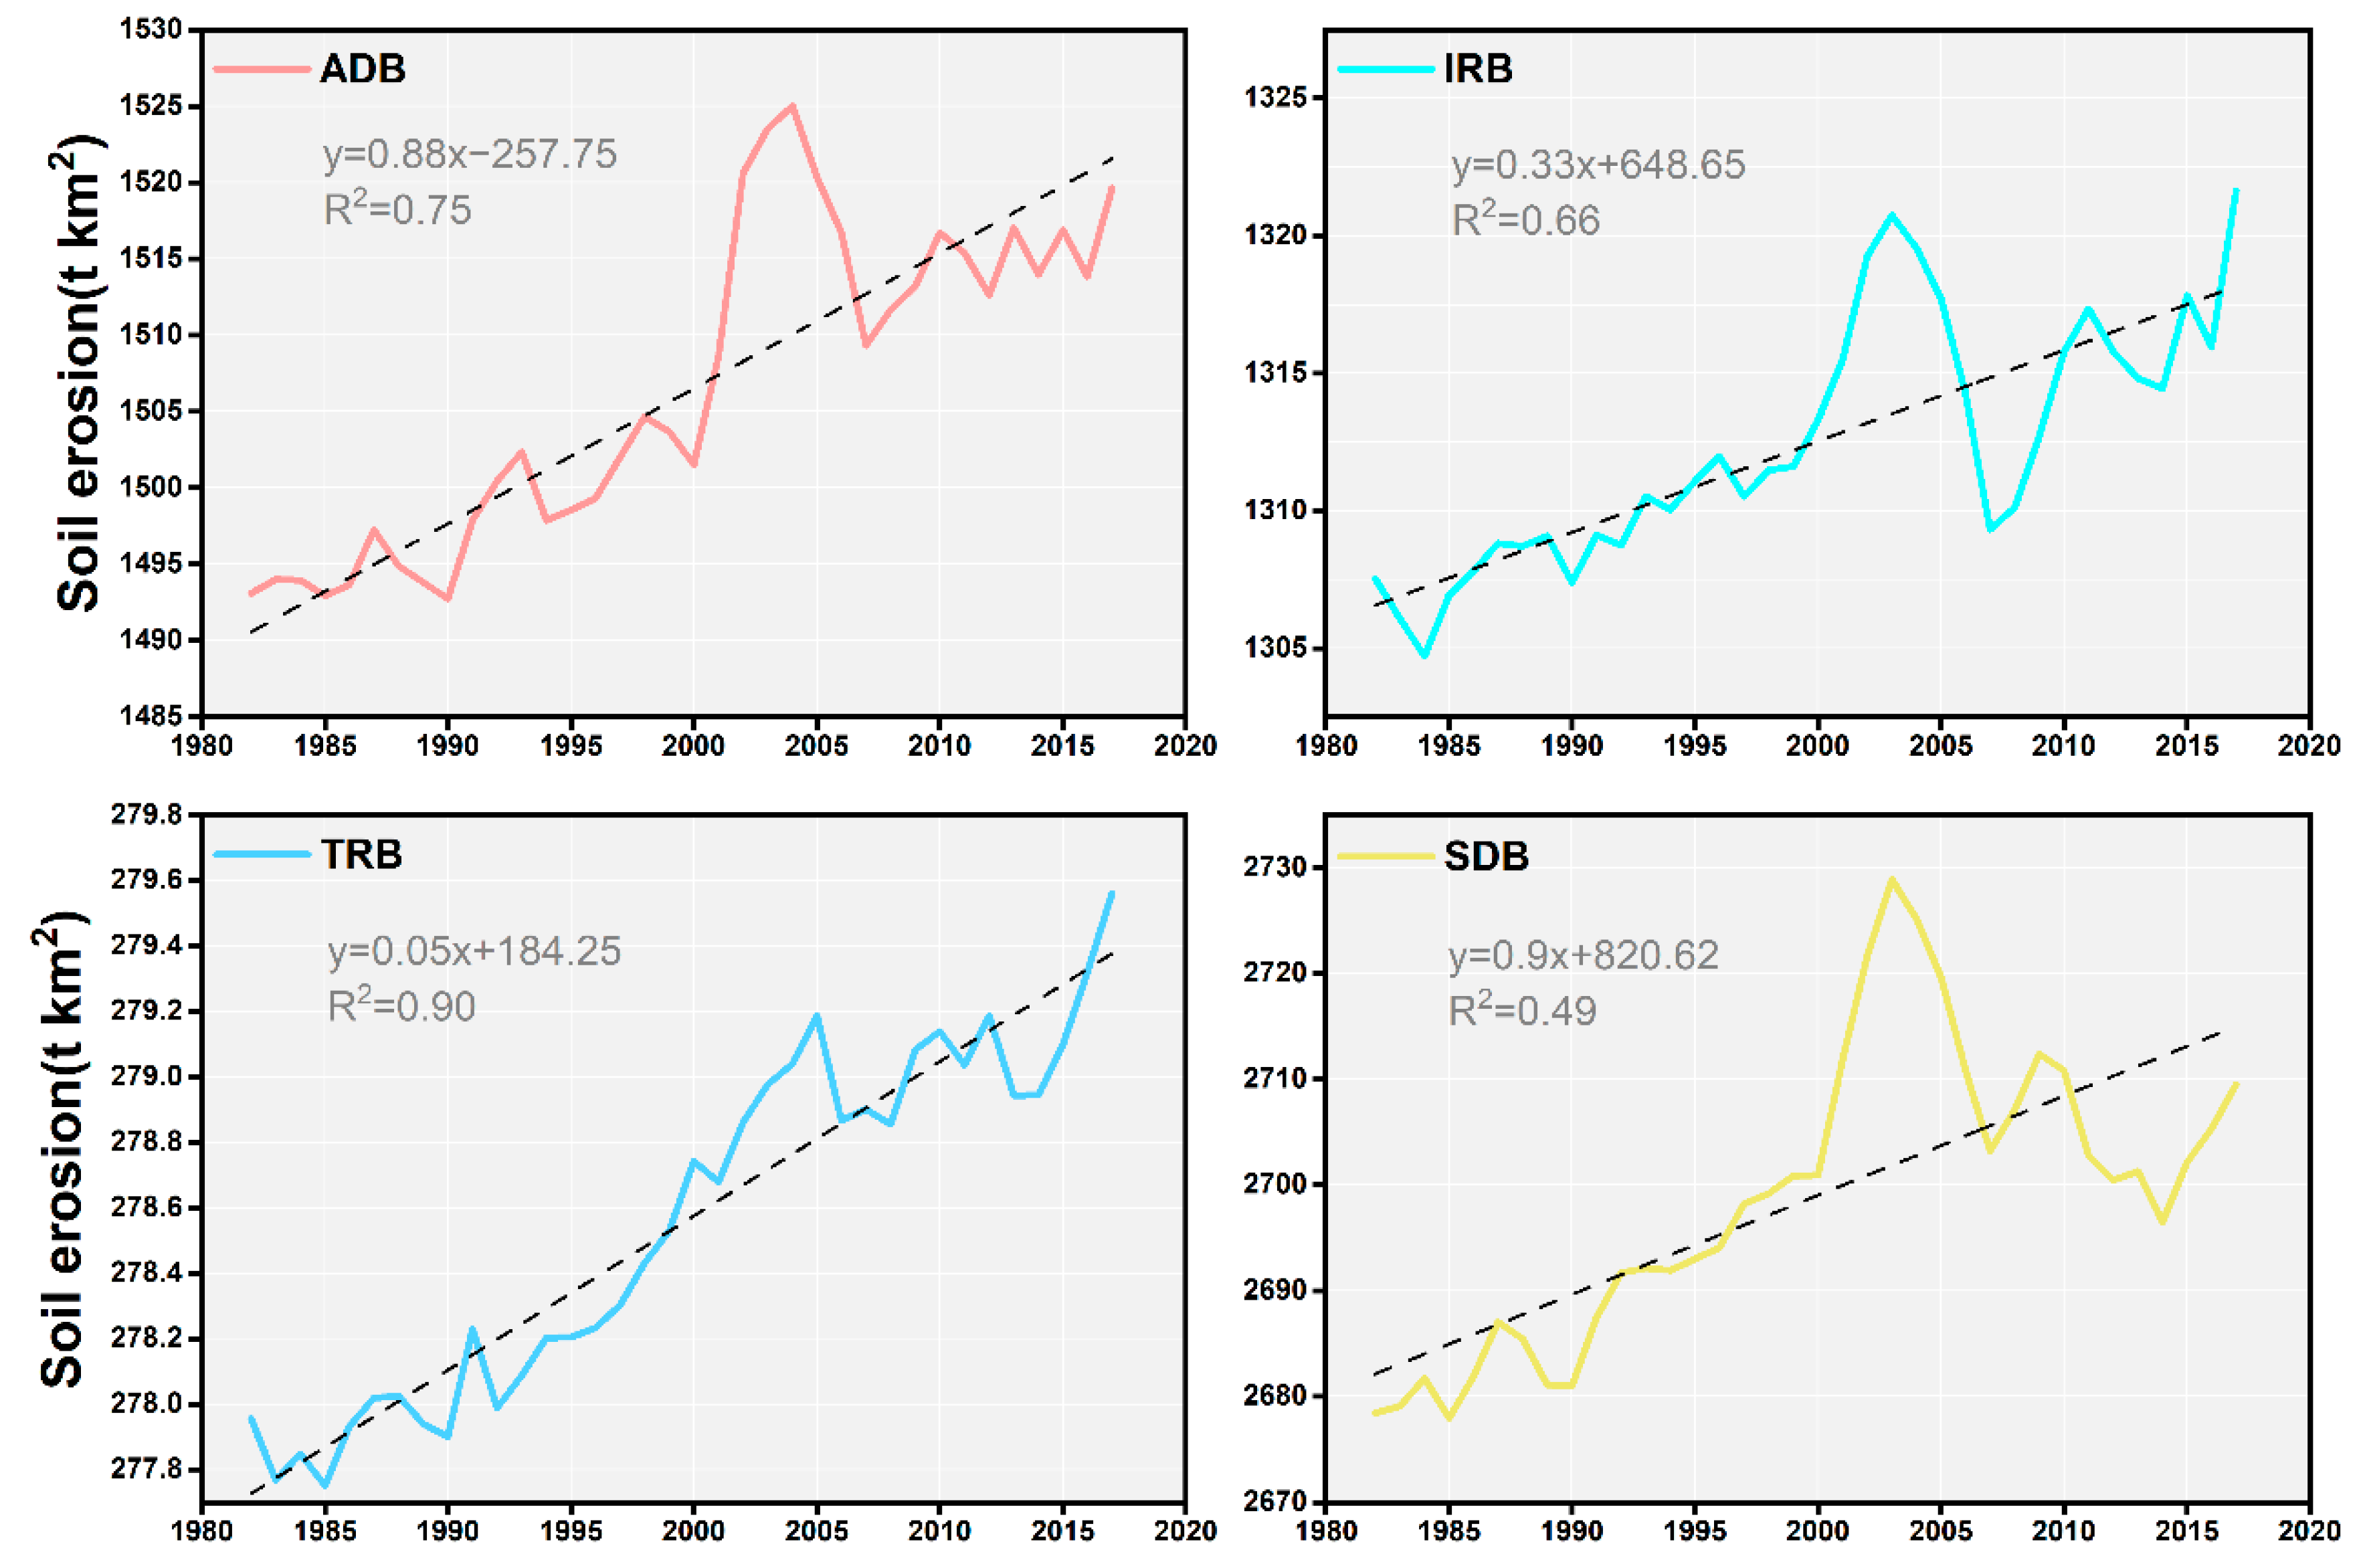
3.1. Spatial and Temporal Variation in Water Erosion by Water

As shown in Figure 5, there is a certain pattern in the spatial variation of the slope of SE in each basin. The grids with positive SE changes were mainly distributed near the rivers. According to the statistics of the area of pixels with slope of SE change greater than 0, the area of pixels with an increasing trend accounted for 59.3% of the total area of the four basins, indicating an overall increasing trend of SE. Compared with the other three basins, TRB has the smallest SE variation and fewer pixel points with high slope of SE variation are distributed. SDB shows the most prominent increasing trend, with pixels showing an increasing trend accounting for 64.2% of the total basin area. Among the four basins, SE was the most severe in SDB, which had the highest SE increasing trend, followed by ADB (60.2%), IRB (55.7%) and TRB (57.4%).
From 1982 to 2017, the average SE quantity of all four basins presented relatively consistent rising trend (Figure 6). Since 2000, the SE quantity in ADB, IRB, and SDB began to increase quickly and peaked in around 2003, but it dropped sharply in the following 3–5 years. The SE quantity in TRB did not show sudden changes in the end of 2000 but increased slowly. Moreover, the extremum did not occur within this period. According to the linear fitting analysis of SE changes in the four basins from 1982 to 2017, SE quantity changed the most rapidly in SDB and the change slope was 0.9, with the maximum reaching as high as 2728.68 t km−2. The variation rate of SE quantity was the lowest (only 0.05) in TRB and the maximum erosion quantity was 279.58 t km−2. The highest growth rate of SE quantity was observed in SDB (0.9), followed by ADB (0.88), IRB (0.33), and TRB (0.05).

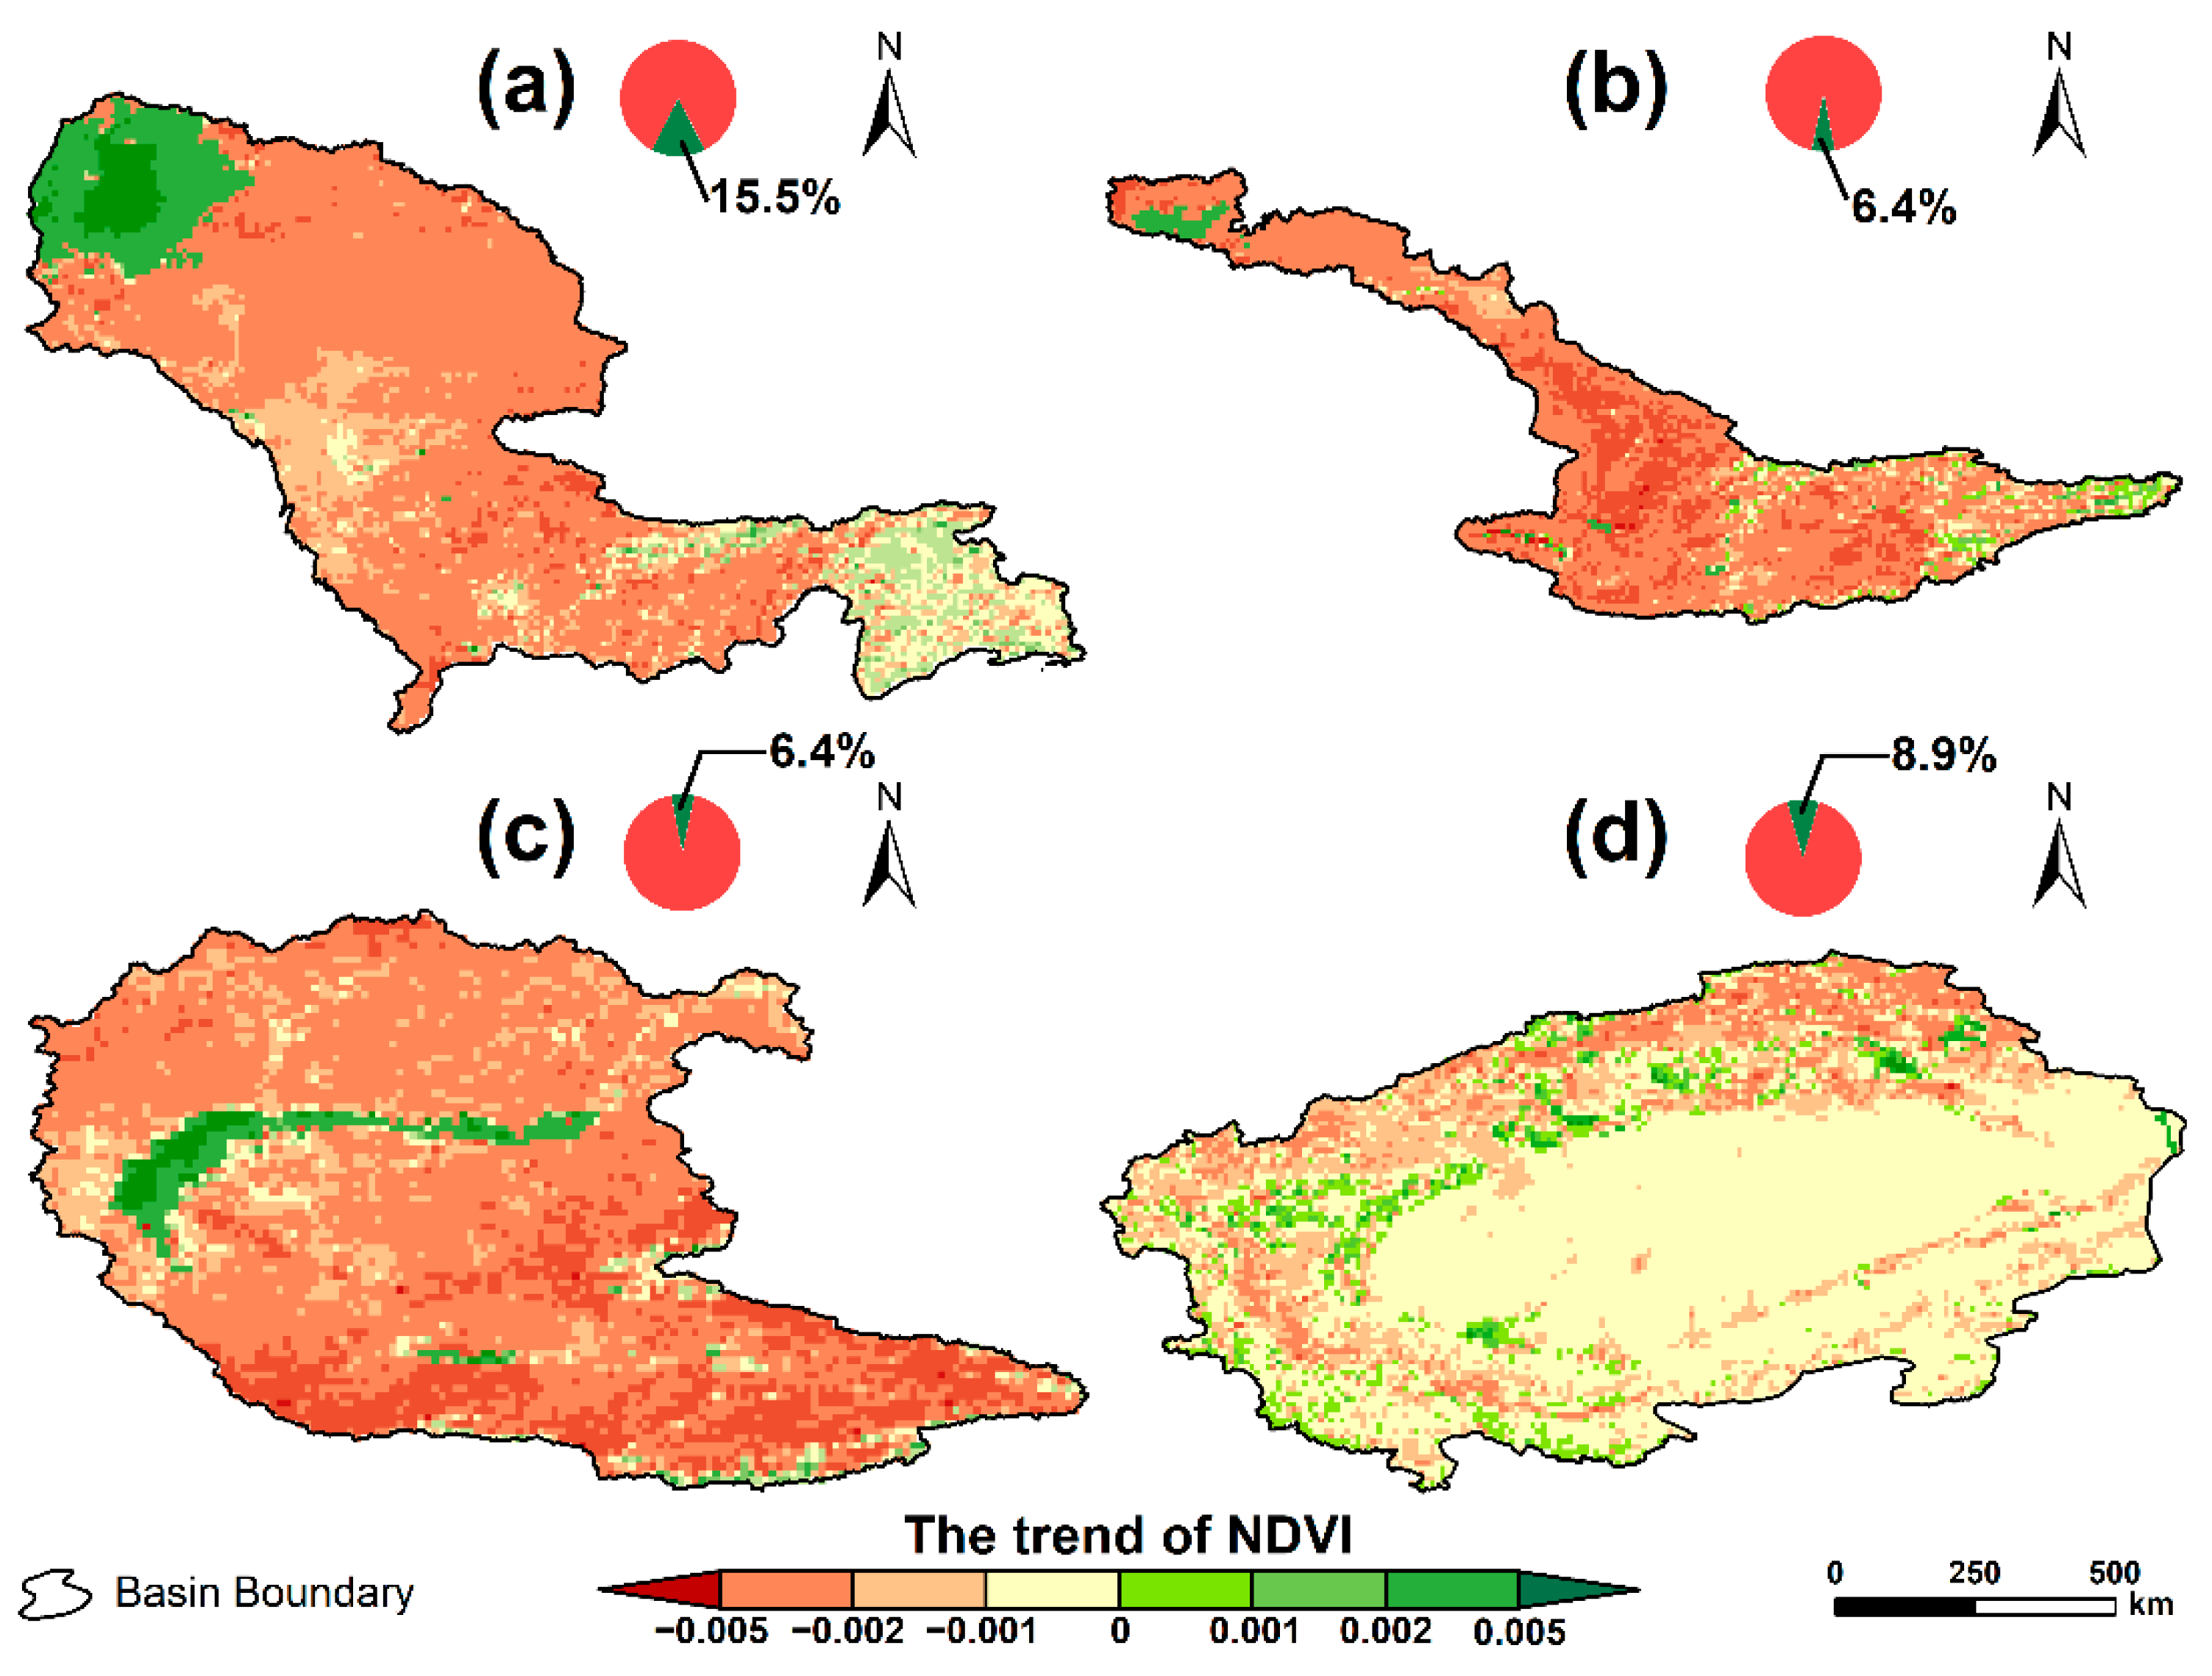
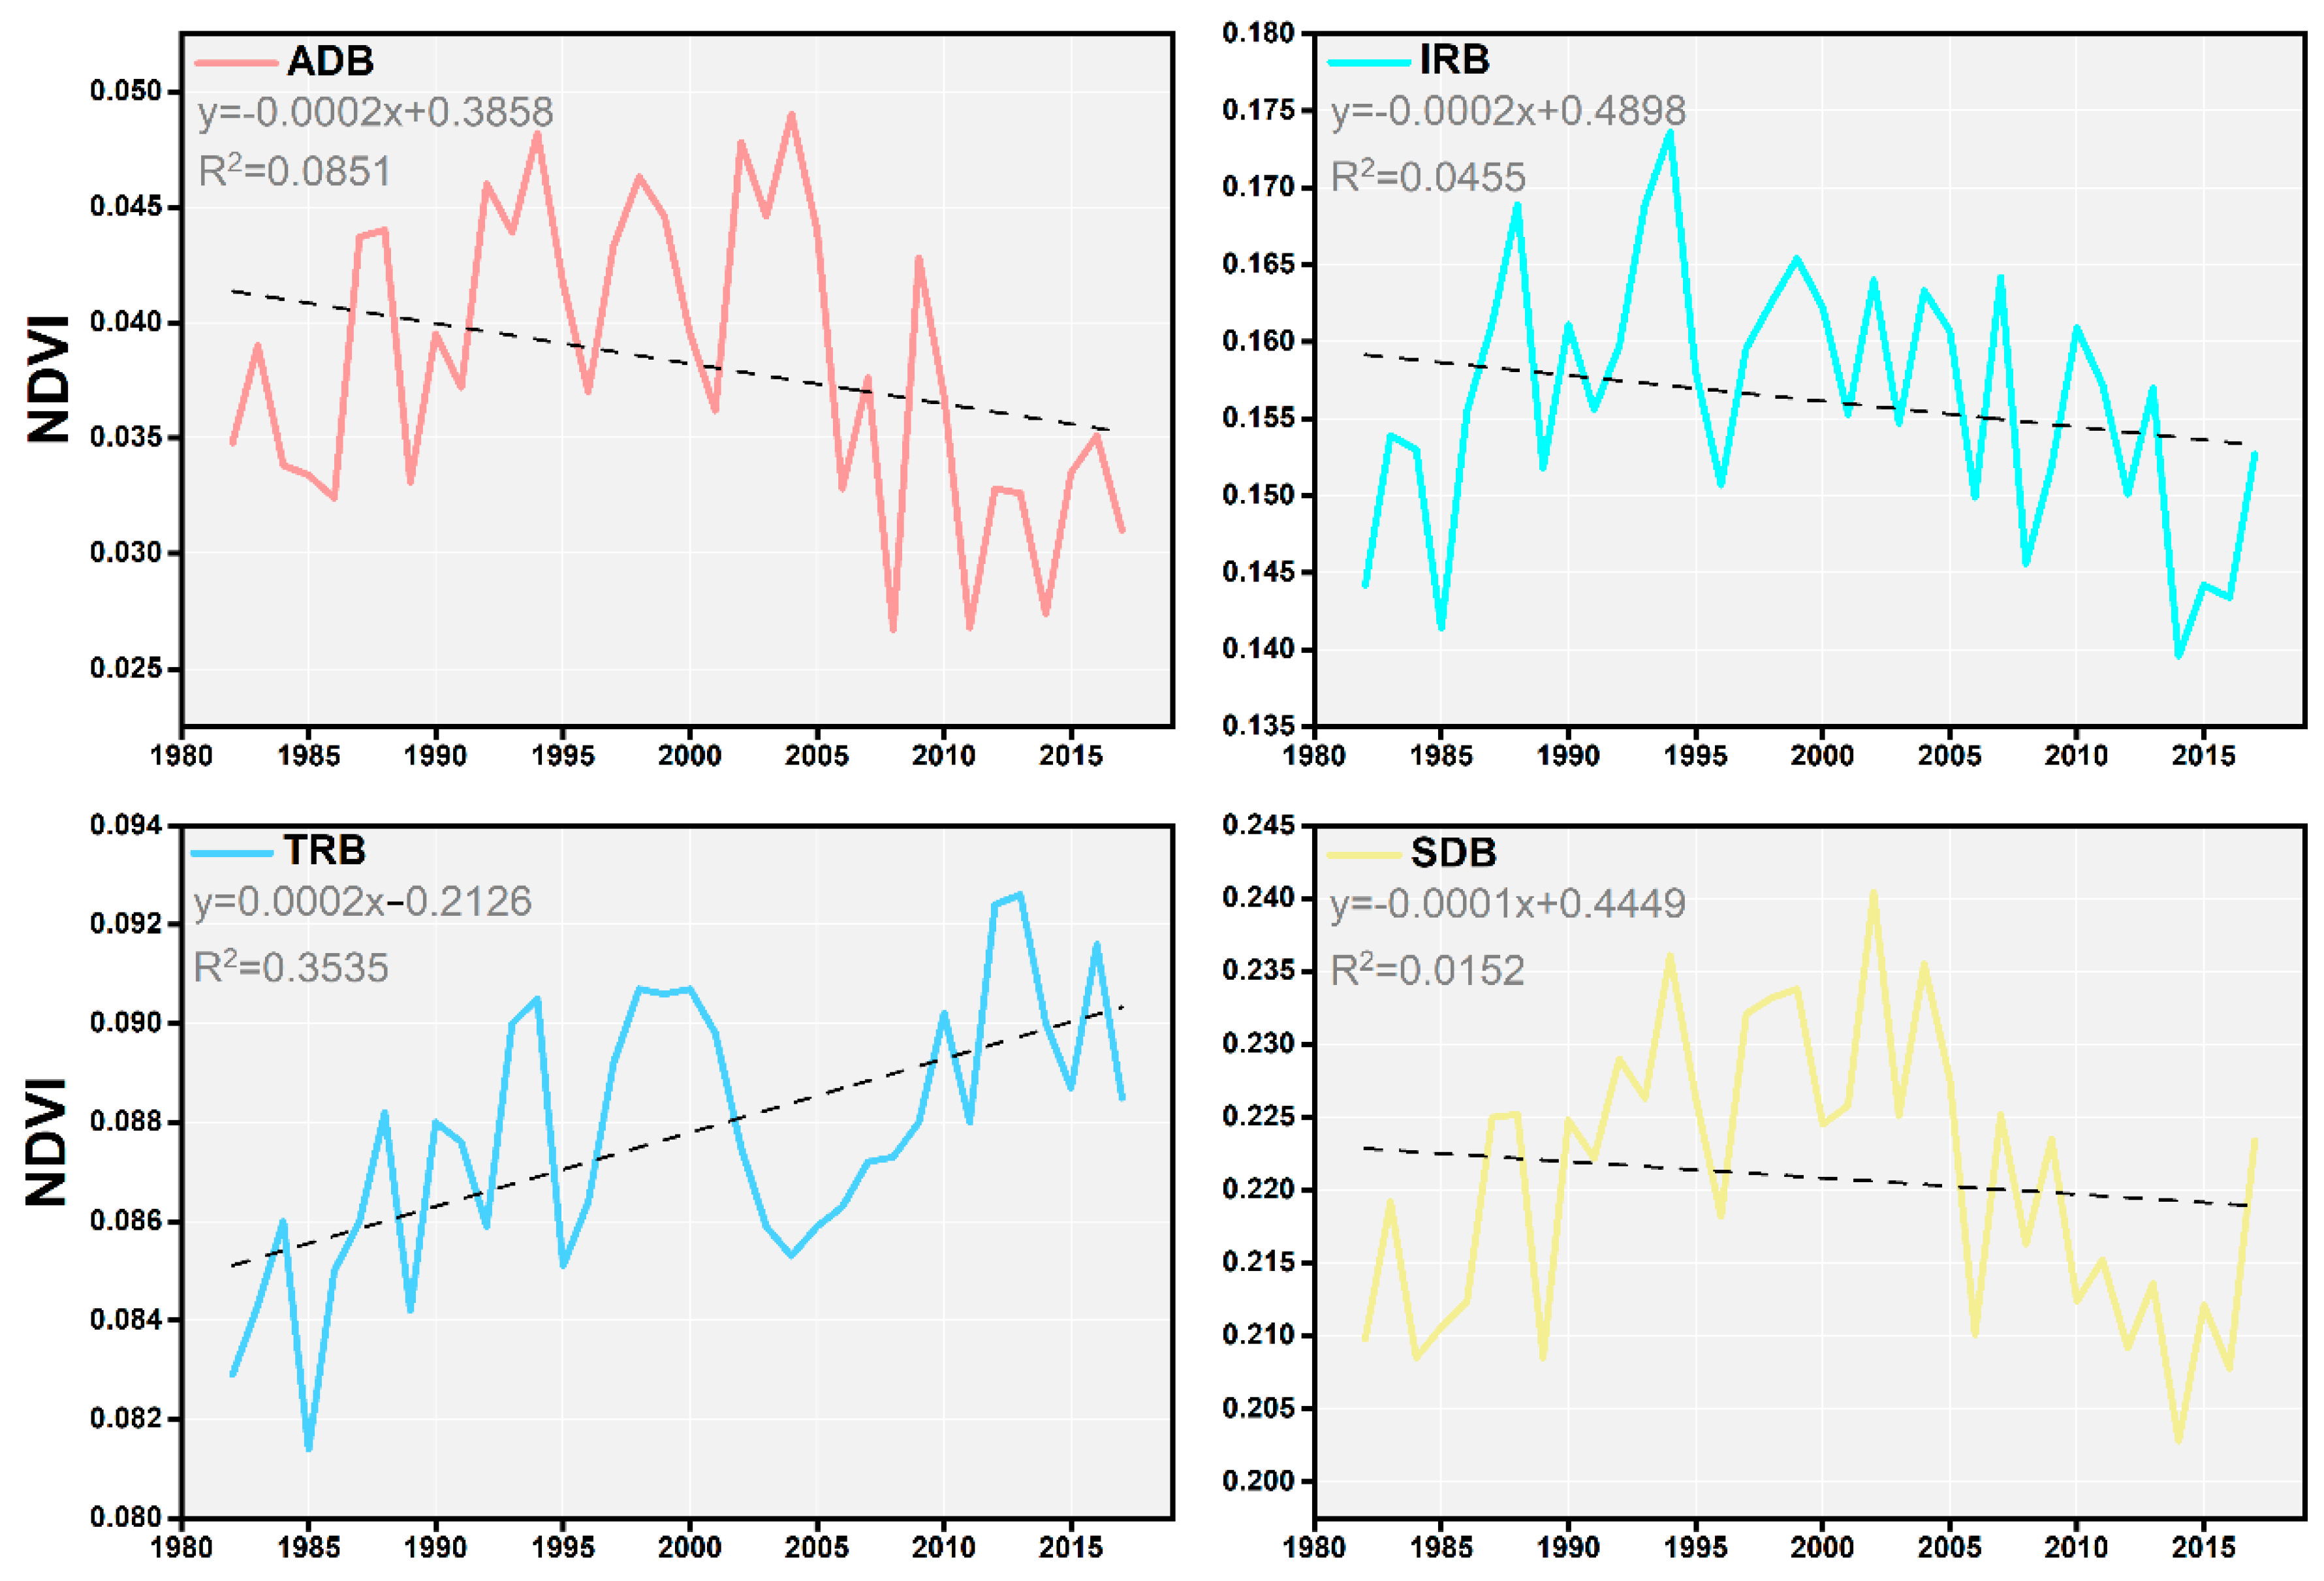
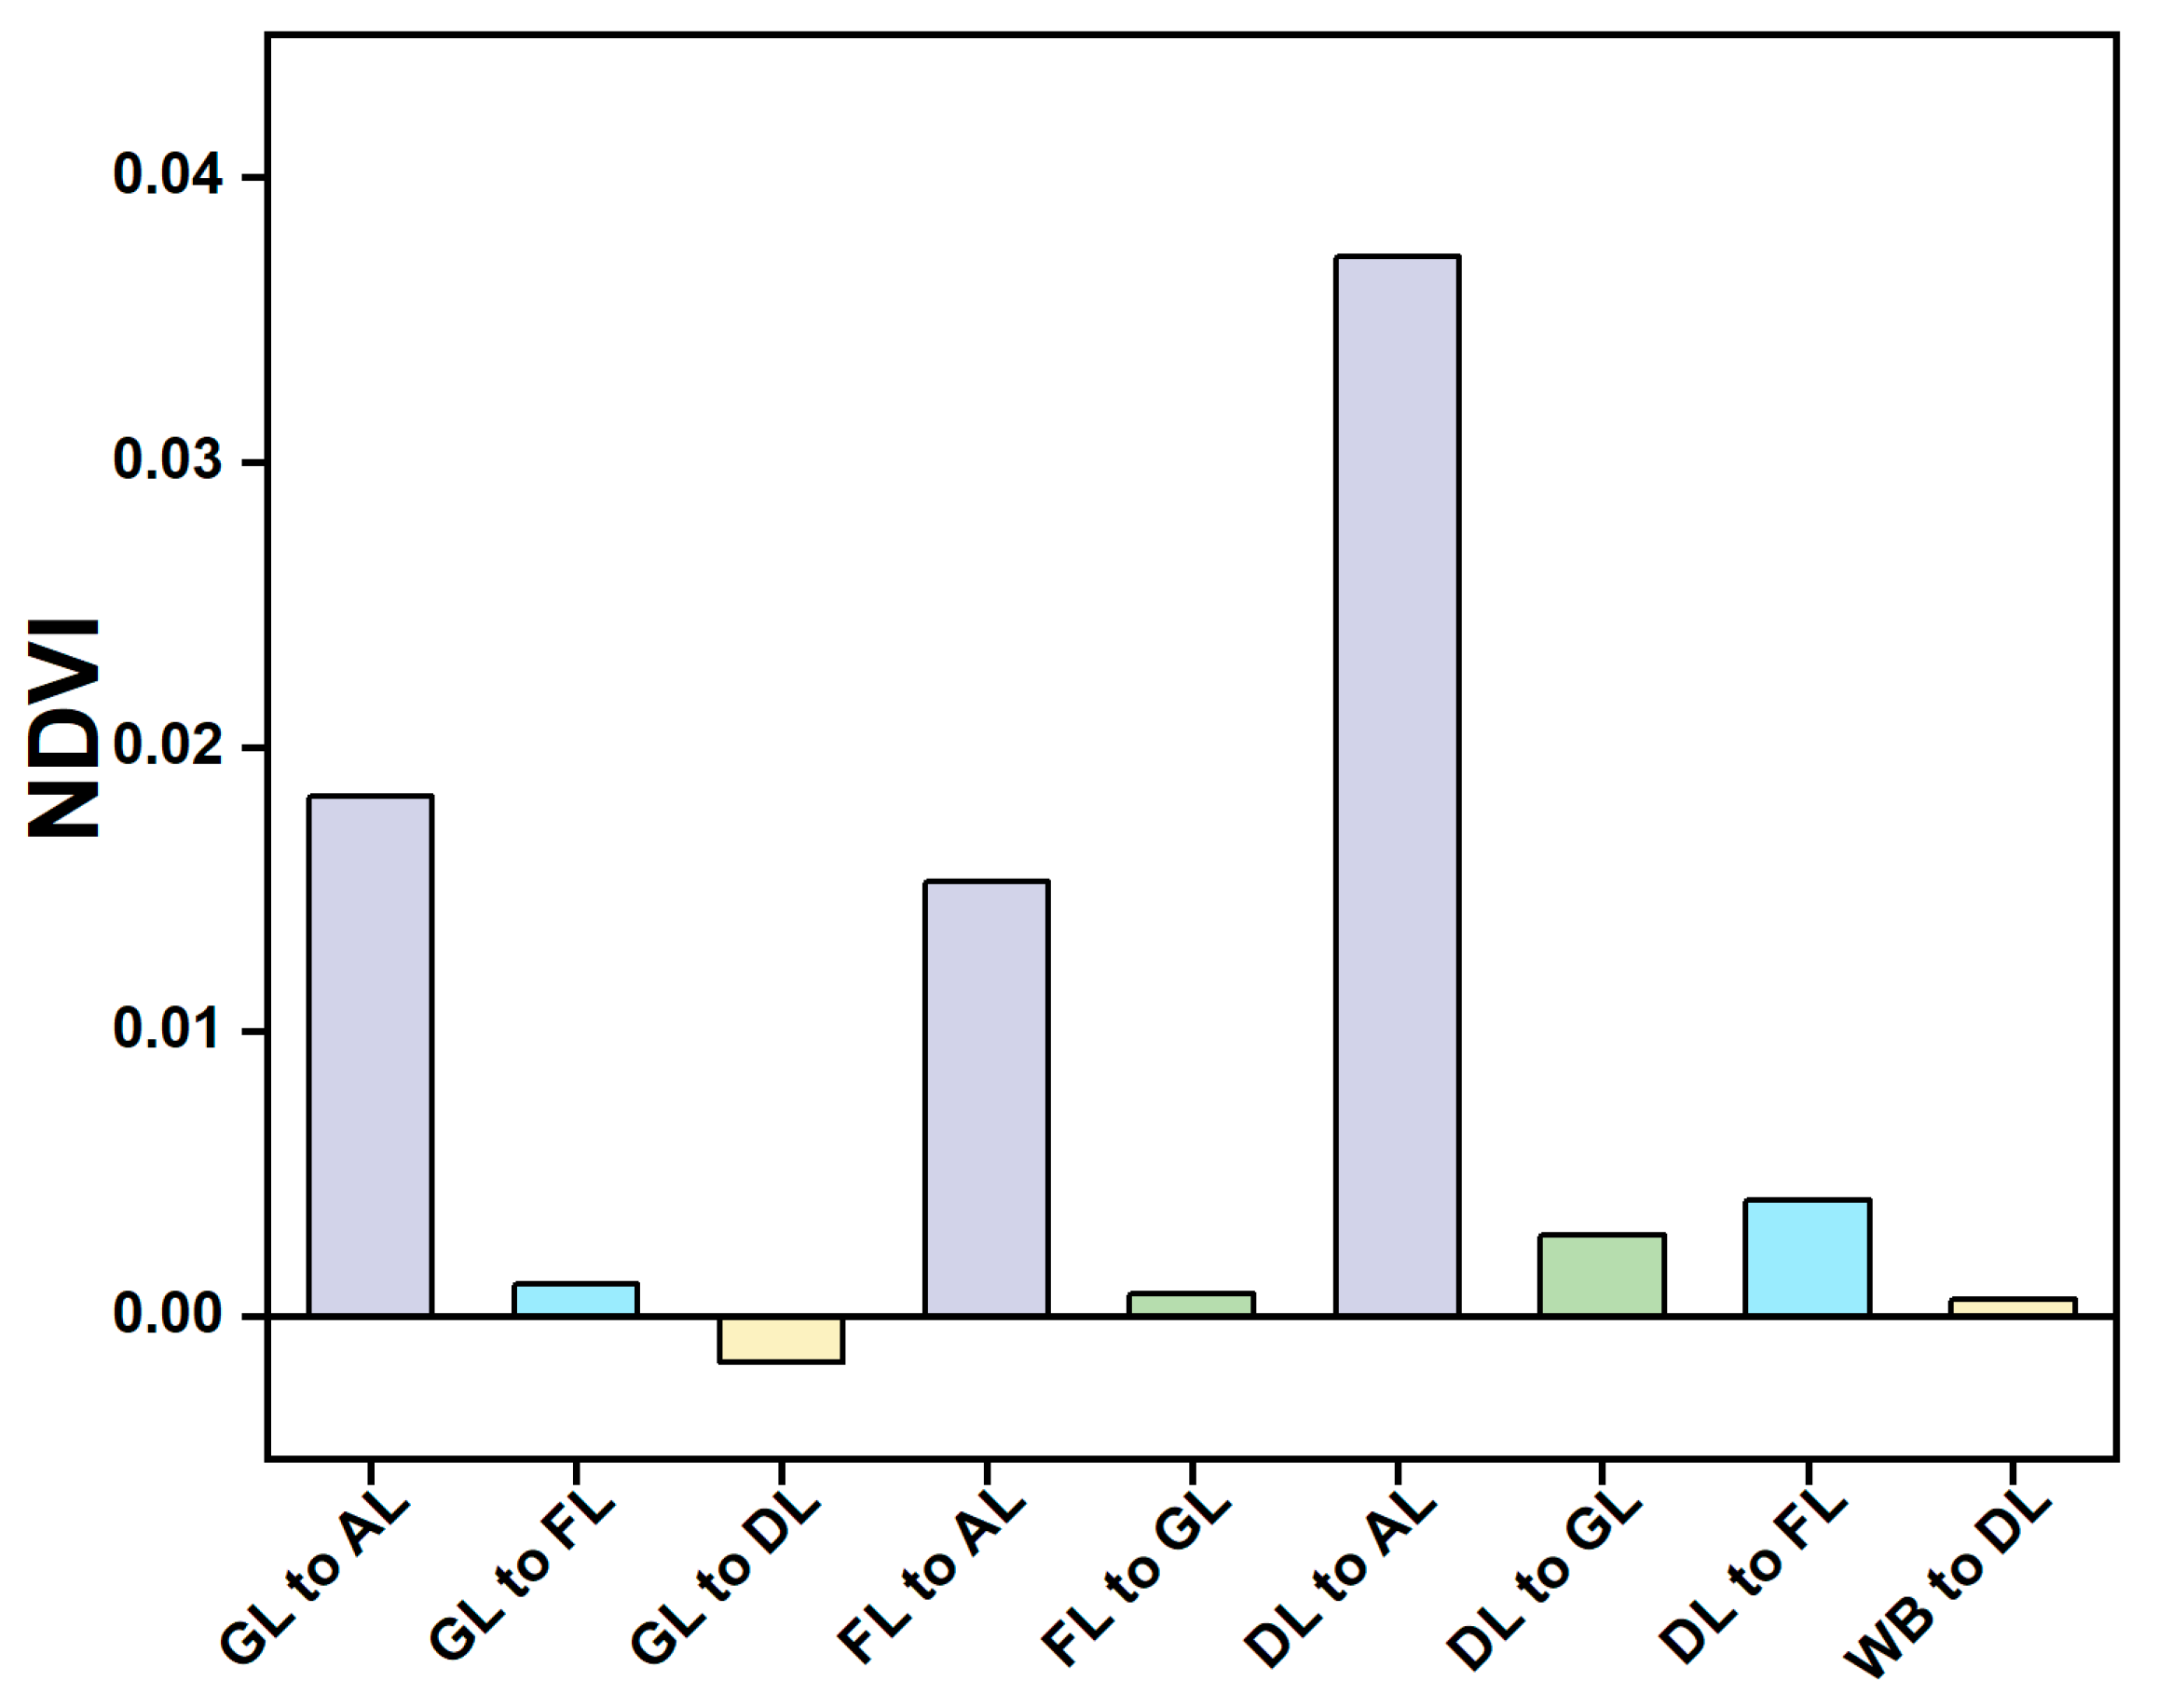
3.2. Spatial and Temporal Variation of Vegetation

The spatial variation trend of NDVI was explored through unitary linear recursive analysis and the features of vegetation variation were simulated pixel by pixel. The statistics on the percentage of pixel area with NDVI growth in the total basin area were also obtained (Figure 7). According to the results, NDVI in most areas declined gradually during this period and the proportion of pixels with NDVI growth was extremely low. The proportion of areas with NDVI growth was the highest in ADB (15.5%), but it was lower than 10.0% in SDB, IRB, and TRB. As shown in Figure 7, the distribution of regions with NDVI growth followed some spatial laws. Areas with increasing vegetation in ADB and SDB were mainly around the Aral Sea and the Tianshan Mountains in the east. NDVI in IRB was mainly distributed near Balkhash Lake. Areas with increasing NDVI in TRB were mainly concentrated in oasis regions near the Tarim River. In general, pixels with decreasing NDVI in CA were far higher than those with increasing NDVI from 1982 to 2017, indicating that vegetation activities were generally weakening during this period.
Statistics on annual average values of NDVI in the four basins were obtained. Furthermore, the variation characteristics of vegetation over time were analyzed. As shown in Figure 8, the interannual variation of NDVI was wide in all basins and NDVI fluctuated within a broad range. Although the NDVI fluctuated widely, the trends of NDVI in ADB, IRB, and SDB were relatively consistent, rising from 1982 to 2000 and then declining after 2000. The variation characteristics of NDVI in TRB were different from those in the other three basins. Specifically, NDVI in TRB increased with continuous fluctuation from 1982 to 2017. To explore overall variation trends of NDVI in different basins, a linear fitting analysis was performed on the average NDVI in different years. NDVI was found to increase in TRB (+0.0002/year), but it generally declined continuously in the other three basins. Overall, only vegetation activity in TRB was strengthened from 1982 to 2017. NDVI in generally presented a declining trend, indicating that local vegetation growth was declining.

4. Discussion

4.1. Effects of Climatic Factors on Vegetation Changes

Under the background of current climatic changes, the growth condition and spatial distribution of vegetation around the world are changing significantly [98,99,100]. Vegetation also exhibits significantly different responses to different climatic changes [101,102,103]. In the response of vegetation growth to climate, temperature and precipitation are two key factors [104,105]. Climatic warming driven by global temperature rise might change the vegetation phenology and primary productivity of ecosystems, thus influencing ecosystem services [106,107]. Meanwhile, global warming may increase the growth period of vegetation in spring and autumn, thus extending the growing season [108] and increasing vegetation cover [109]. As the main factor controlling changes in vegetation growth, precipitation can influence vegetation growth directly by changing soil water content [110,111]. In CA, NDVI exhibited significantly different responses to climate. With respect to correlations of temperature and precipitation with NDVI, precipitation showed distinctly higher sensitivity to climatic changes than temperature. In this study (Figure 9), areas with positive correlation between NDVI and temperature accounted for 48.3% of total area. Areas with positive correlation between NDVI and precipitation reached as high as 80.4%, indicating that precipitation is the major influencing factor of vegetation conditions in CA. Yin et al. [112] investigated the correlation between spatial-temporal changes of vegetation and climatic changes in CA from 1982 to 2012. They concluded that NDVI had a weak negative correlation with annual temperature changes, but a positive correlation with precipitation, which is consistent with the results of this study.
In terms of the spatial distribution of correlations between climate and NDVI, vegetation activities were affected more prominently by precipitation, especially in plains in northwest regions of CA (Figure 9a). The influences of temperature on vegetation activities were mainly observed in eastern regions with relatively high altitudes (Figure 9b). This agrees with the research results of Zhang et al. [38] on the responses of vegetation changes to climatic changes in CA from 1982 to 2012. At the basin level, correlations between NDVI and precipitation in ADB, SDB, and IRB all conformed to above characteristics, but the correlation was opposite in TRB. In TRB, although temperature and precipitation showed distinct correlations with NDVI, the area with correlation coefficients between NDVI and temperature higher than zero (69.3%) was significantly larger than that of precipitation (51.9%). Specifically, regions where NDVI showed good responses to precipitation were mainly concentrated in mountainous areas of TRB and oases near the mainstream of the Tarim River. Investigating vegetation dynamics in TRB and their responses to hydrologic climatic factors, Wang et al. [113] concluded that vegetation changes generally presented significantly positive correlations with annual average temperature and local precipitation in most mountainous areas. This verified the spatial differences in the correlations of NDVI with temperature and precipitation in TRB.

4.2. Effects of Human Activities on Vegetation Changes

LUCC is not only an important content in studying global environmental changes, but also a clear reflection of the close relationship between human activities and the natural environment [114,115]. Analyzing the dynamic change process of land uses can reflect the influences of human activities on vegetation cover directly or indirectly [116,117]. The economics and policies of countries in CA have changed greatly since the collapse of the Soviet Union, thus resulting in significant changes in land use [118,119]. The Aral Sea problem has been the key concern of people [120,121]. During the existence of the Soviet Union, irrigation systems and water conservancy facilities were well established in the Aral Sea Basin [122]. Specifically, the Aral Sea Basin provided irrigation water to 6.60 × 10⁶ km2 of farmland and cotton land in the 1960s, but the inflow volume and water level of Aral Sea dropped dramatically due to construction of water conservancy facilities such as reservoirs and canals [123,124]. After the collapse of the Soviet Union, edges of oases were reclaimed on a large scale over trans-boundary river basins such as ADB and SDB due to the lack of overall management at the country level as well as doubled populations [125,126]. Field irrigation intercepted inflow volume, thus continuously accelerating the shrinkage of the Aral Sea and worsening vegetation growth around it [127,128]. Regional climatic changes caused by global climatic changes are one of the causes of the Aral Sea crisis, but human activities have had a stronger influence on the Aral Sea [129,130]. In arid regions of China, large amounts of the water of the Tarim River have been used for irrigation due to disordered reclamation into farmlands [131]. Moreover, new reservoirs were constructed in the upper reaches. Consequently, the lower reaches of the Tarim River were in a cutoff state [132,133]. Taitma Lake is a terminal lake that has been associated with the large-scale death of Populus euphratica and shrubs along riverbanks and serious degradation of the ecological environment [134,135].
Human activities can change NDVI by altering the land use/cover mode [136,137]. An unreasonable mode of land use can destroy the soil structure, leading to SE and ultimately decreasing soil productivity and surface coverage [138,139,140]. In this study, LUCC data of CA in 1982 and 2017 were chosen for comparative analysis (Figure 10). Results showed that AL, GL, FL, DL, and WB underwent significant changes (>100 km2). Among them, the largest changes were observed in AL, GL, and FL, followed by WB and DL. The total area of GL, FL, and DL converting to AL amounted to 1195.74 km2 and the total area of GL and DL converting to FL was 1298.46 km2, which are far greater than that of areas converting to GL (867.32 km2) and DL (460.27 km2) (Table 1). Generally, AL experienced the largest changes from 1982 to 2017, with an increase of 11.90%.
In the process of land use and land cover changes, AL changes are the primary influencing factor of regional NDVI [141,142]. An overlay analysis was performed between regions with large land use changes and the spatial variation trends of NDVI, and the results are shown in Figure 11. In the process of land use transfer, the regional area transforming into AL accounted for the highest proportion of NDVI, whereas the area of other land use types transforming into FL and GL accounted for significantly lower proportions. Li et al. [143] reported that the greening of vegetation in the arid region of northwest China from 1990 to 2010 due to anthropogenic activities such as tillage expansion has increased the regional NDVI by 26.7%. The expansion of AL area became the main driver influencing the increase in regional NDVI. This agrees with the research results of this study.

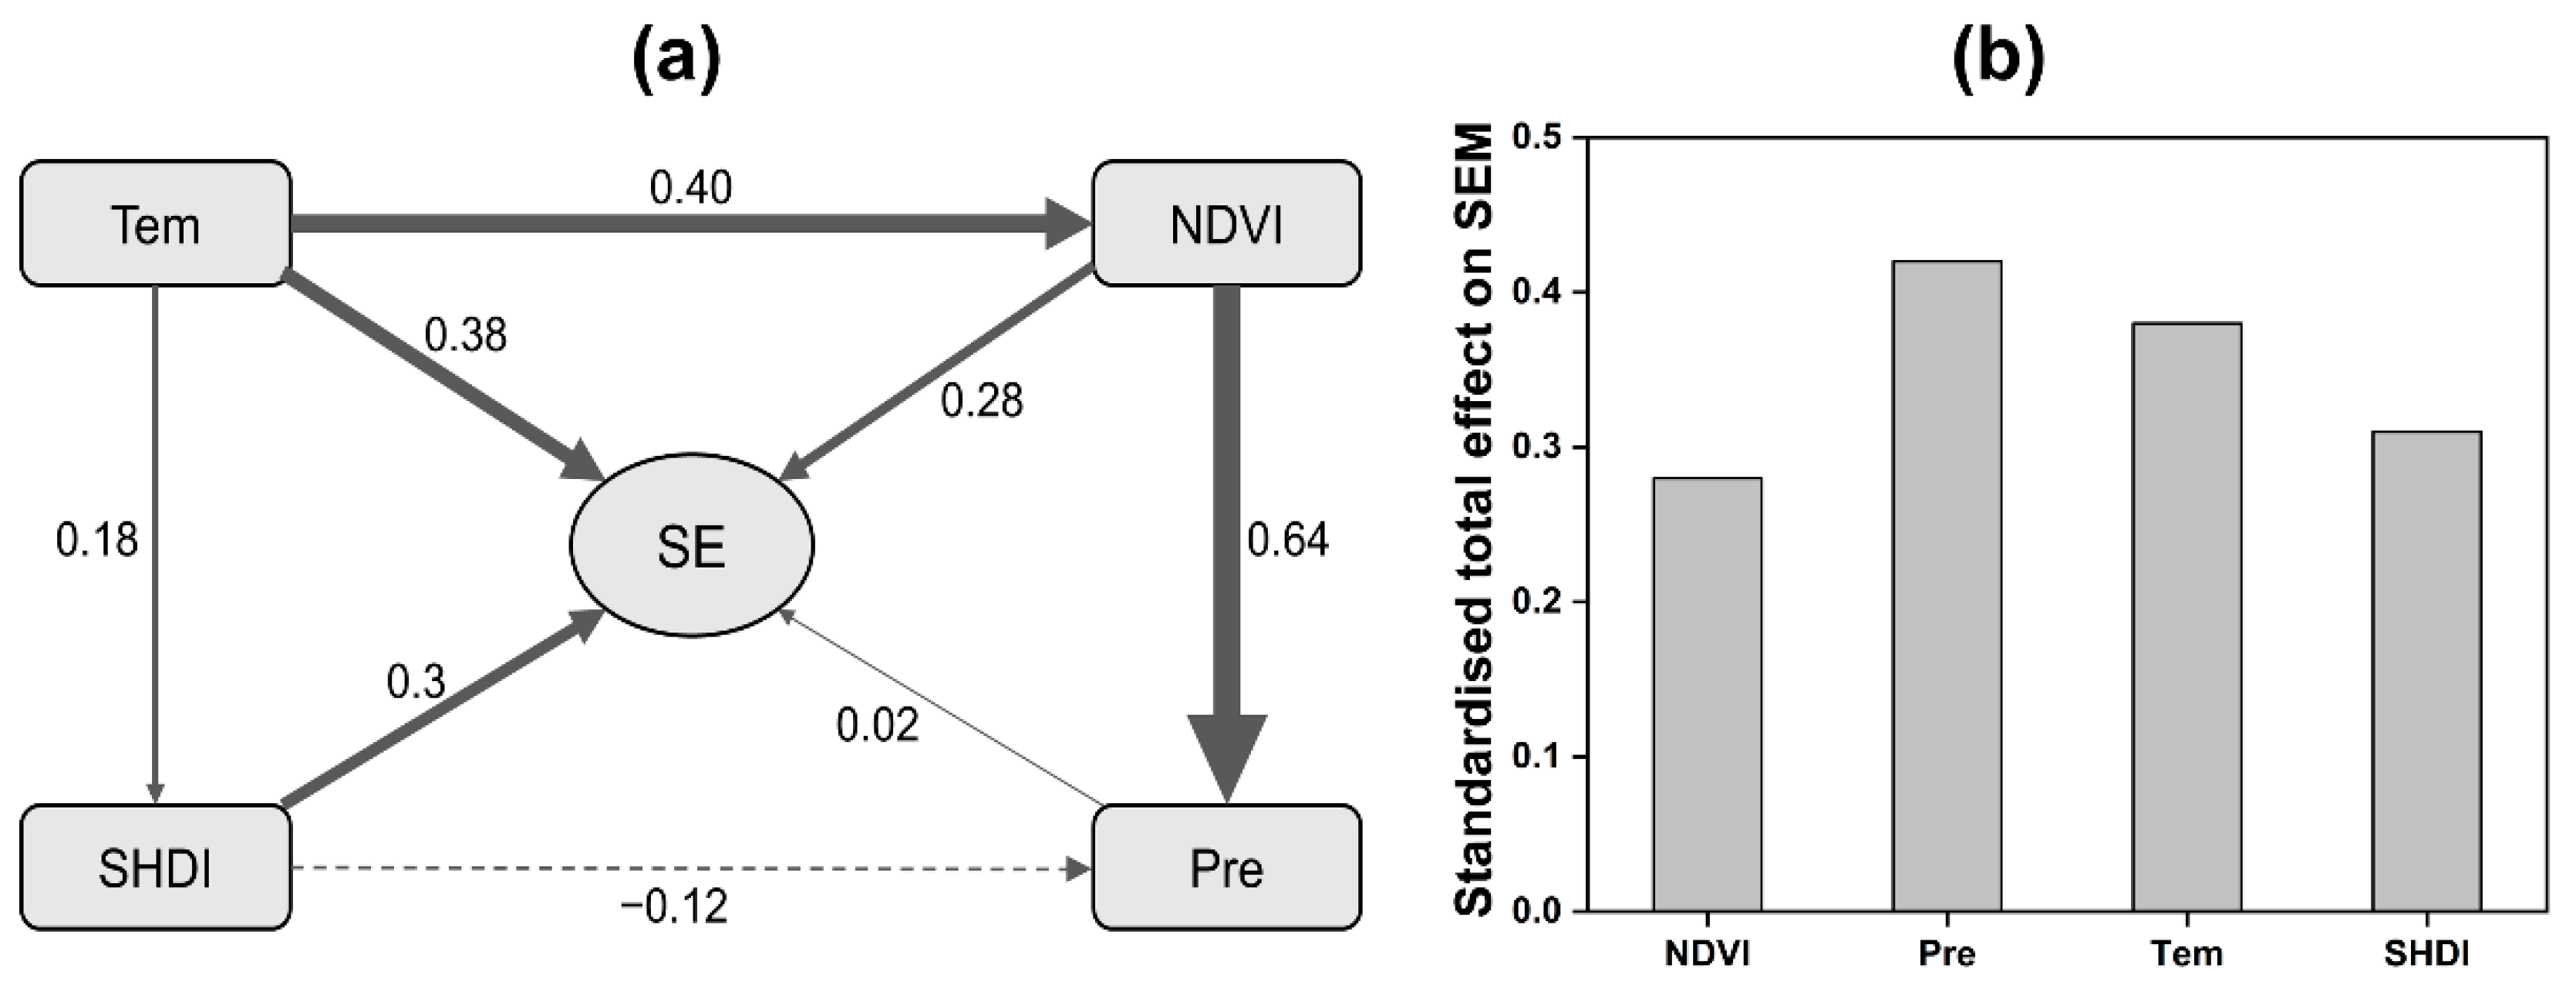
4.3. Feedback Relationship between Changing Environment and Water Erosion by Water

This study performed a comprehensive analysis on climate, vegetation, and human activity. The results (Figure 12b) showed that precipitation, temperature, Shannon diversity index, and vegetation cover influenced SE significantly. Among them, precipitation showed the most significant direct effect on SE (Figure 12a) and the path coefficient was 0.42. Moreover, the influences of precipitation on NDVI were found to be the most prominent with interactions among different factors, indicating that precipitation can influence SE indirectly by influencing vegetation growth. This might be because vegetation can relieve the spattering effect of raindrops on soils and the scouring effect of runoff on soils through the canopy and root systems, thus enabling the prevention of SE [144,145]. Zhou et al. [146] investigated SE in the lower reaches of the Minjiang River Basin and found that SE did not significantly increase in regions with high SE risk and vegetation coverage lower than 40% when vegetation recovered to 60%. If vegetation coverage was recovered to 78.3%, the C factor would increase by at least 0.001 and SE risk would decrease by more than 50%. On the whole, the correlation between precipitation and SE was mainly determined by land use and vegetation cover. In a similar study in America, Nearing et al. [147] found that given a fixed land cover, SE would increase by 25–55% in a year if precipitation increases by 10% during the erosion period. According to this study, temperature is the second primary influencing factor of SE after precipitation. Its influences on SE are slightly higher than those of SHDI and NDVI. The global temperature rise changed water circulation between the oceans and land, thus making SE more uncertain [148,149]. Ma et al. [95] carried out a meta-analysis on global SE and found that SE was intensified by 2.1% from 1982 to 2019 due to global warming. SE was the most intense in mid and high-altitude regions. Moreover, global warming can also cause changes of soil moisture content by influencing regional precipitation, which will directly influence the K factor in the RUSLE model [150,151]. In general, SE in CA is jointly influenced by climate, human activities, and vegetation. Among them, climatic factors are the primary influencing factors, followed by SHDI dominated by human activities.
The state of SE in the four basins was compared with that in the surrounding areas (Table 2). SE in ADB was found to be similar to that in Xinjiang. Xinjiang is a region with relatively serious drought, salinization, and desertification as well as water and soil loss [152]. SE in IRB was close to that in the Taohe River Basin. The Taohe River is the second tributary of the Yellow River and precipitation changes are the major cause of local SE changes in the corresponding basin [153]. IRB generally receives more precipitation than the other three basins in this study, which may explain the similarity in SE between IRB and the Taohe River Basin. The Loess Plateau represents the area with the most prominent SE problems in China [154], and SE in SDB was slightly lower than that in the Loess Plateau. This might be the collaborative consequences of unreasonable use of water resources and soil in SDB [155]. SE in TRB was very similar to that of the Houzhai River Basin in a karst region in South China, which was only 273–297 t hm−2 a−1. This may be attributable to the implementation of ecological water conveyance projects and artificial protection measures in TRB since 2000, which improved the ecological environment and thereby relieved land degradation in the basin [156,157]. In general, SE in the major basins of CA was relatively serious and the ecological environment in the basins require significant improvements.

4.4. Limitations and Prospects

Although the GIMMS NDVI3g database used in this study has relatively long time series, the spatial resolution is relatively low. Consequently, the quantitative study on vegetation cover changes based on remote sensing data might have some uncertainties [164,165]. This study mainly referred to parameters in previous studies for evaluating SE using the RUSLE model and it is an experimental formula, soil erosion amount between the simulation and the observation differs, which may introduce some errors in the measurement of SE in different basins [45,166]. Regarding the influences of human activities on SE, although the influences of LUCC-induced vegetation cover changes and spatial distribution characteristic changes on SE were analyzed, several other human activities, such as over grazing and agricultural management technology, that may influence vegetation cover were excluded [167,168]. Although we used higher resolution remote sensing data, there are large differences in the data products themselves (e.g., DEM), which can also cause some uncertainty in the assessment results. This will also be reflected in the factor calculation of the RUSLE model. For example, the calculation of K factor and R factor involves a variety of data parameters, and their results are correspondingly uncertain, while the calculation process of other factors is relatively simple, and fewer parameters are involved in the calculation, and their impact will be less than that of R factor and K factor [169,170]. In addition, the validation data used in this study are regional soil organic carbon and sediment delivery data of rivers. Although it can reflect the SE condition well, there are some errors. In the future study, we will conduct field tests of soil isotope tracing for this area to verify our simulation results more accurately.
Vegetation coverage is closely related to soil loss, and it has extremely important significance to the study of vegetation changes. The monitoring of vegetation changes is a long-term dynamic process [171]. Therefore, it is necessary to study vegetation cover changes in a longer time series. This study only discussed the relationship between vegetation cover in major basins of CA and regional climate factors preliminarily on a yearly scale, but annual vegetation changes as well as the relationship between interannual vegetation changes and climate in different seasons were not taken into account. Future studies should explore the responses of vegetation cover changes to temperature and precipitation at different spatial-temporal scales, aiming to further deepen our understanding on the relationship between vegetation and climate. As a preliminary study, this study reveals the different collaborative effects of climatic changes and LUCC on SE. However, the influencing mechanisms of climatic changes and LUCC on SE remain unclear. Therefore, the mechanisms also need to be further analyzed in depth at the earliest.

5. Conclusions

This study performed a quantitative evaluation of SE in major basins in CA from 1982 to 2017 using the RUSLE model and analyzed the major driving factors of SE changes in different basins under changing environments. Spatially, areas with increasing SE accounted for 58.9% of the total area of the four basins and pixels with high variation rates of SE were mainly concentrated in regions with high relief. Temporally, the SE quantity of all four basins presented relatively consistent rising trend with fluctuations. Specifically, the largest increase in SE quantity was observed in SDB (64.2%), followed by ADB (59.4%), IRB (56.5%), and TRB (55.7%). Regarding vegetation changes, pixels with positive spatial variation trends of NDVI were mainly around tail-end-lakes and rivers. In all four basins, areas with decreasing NDVI accounted for more than 90.0%. Except for TRB, vegetation cover exhibited a decreasing trend in all three basins. In terms of the correlation between climate and vegetation, the correlation between NDVI and precipitation in CA (80.5%) was significantly higher than that of temperature (48.3%) and precipitation was the major climatic factor affecting vegetation growth. However, temperature had a stronger influence on vegetation (69.3%) than precipitation (51.9%) in TRB. Among land use types in CA, AL underwent the largest change from 1982 to 2017, increasing by 999.38 km2. In the process of human activities influencing vegetation in CA, the NDVI proportion of other land use types converting to AL was the largest.
According to a comprehensive analysis of climate, vegetation, and human activities, SE in major basins in CA is jointly influenced by climate, human activities, and vegetation. Among them, climatic factors exert the strongest influence, followed by SHDI (human activities). Comparing the results of this study and other studies on surrounding areas, we found that SE is more serious in ADB, SDB, and IRB, with SE quantity in SDB even nearing that in the Loess Plateau, China. Under the background of global changes, appropriate water and soil resource management and optimization configuration should be implemented in CA with references to that in TRB. In this manner, SE problems in CA may be overcome.

Supplementary Materials

The following supporting information can be downloaded at: https://0-www-mdpi-com.brum.beds.ac.uk/article/10.3390/rs14215507/s1, Figure S1: Temporal variations in annual SHDI from 1982 to 2017; Figure S2. Validation of rainfall erosivity factor. (a) Our simulated rainfall erosivity factor. (b) Rainfall erosivity factor based on global site data released by Climate Prediction Center (CPC), (c) Fitted scatter plot of two rainfall erosivity factors (a and b). (d) The point used to extract validation data. Figure S3. Validation of soil erodibility factor. (a) Our simulated soil erodibility factor. (b) Soil erodibility factor based on International Soil Reference and Information Centre (ISRIC). (c) Fitted scatter plot of two soil erodibility factors (a and b). (d) The point used to extract validation data.

Author Contributions

Conceptualization, K.Q. and X.M.; methodology, Y.W., Y.L. and X.M.; software, J.L. and X.Y. (Xiuyun Yang); validation, W.Y. and X.Y. (Xiuliang Yuan); formal analysis, W.Y.; data curation, Y.W. and X.Y. (Xiuyun Yang); writing—original draft preparation, K.Q. and X.M.; writing—review and editing, W.Y.; supervision, X.M. All authors have read and agreed to the published version of the manuscript.

Funding

This research was funded by the National Natural Science Foundation of China (42101302), China Postdoctoral Science Foundation (2021M703470), 2022 Special Regional Collaborative Innovation in Xinjiang Uygur Autonomous Region (2022E01014), and the Strategic Priority Research Program of the Chinese Academy of Sciences (XDA2006030201).

Data Availability Statement

Not applicable.

Acknowledgments

We would like to express our sincere thanks to the anonymous reviewers.

Conflicts of Interest

The authors declare no conflict of interest.

References

  1. Pachauri, R.K.; Allen, M.R.; Barros, V.R.; Broome, J.; Cramer, W.; Christ, R.; Church, J.A.; Clarke, L.; Dahe, Q.; Dasgupta, P. Climate Change 2014: Synthesis Report. Contribution of Working Groups I, II and III to the Fifth Assessment Report of the Intergovernmental Panel on Climate Change; IPCC: Geneva, Switzerland, 2014. [Google Scholar]
  2. Piao, S.; Liu, Q.; Chen, A.; Janssens, I.A.; Fu, Y.; Dai, J.; Liu, L.; Lian, X.; Shen, M.; Zhu, X. Plant phenology and global climate change: Current progresses and challenges. Glob. Chang. Biol. 2019, 25, 1922–1940. [Google Scholar] [CrossRef] [PubMed]
  3. Shen, M.; Chen, J.; Zhuan, M.; Chen, H.; Xu, C.-Y.; Xiong, L. Estimating uncertainty and its temporal variation related to global climate models in quantifying climate change impacts on hydrology. J. Hydrol. 2018, 556, 10–24. [Google Scholar] [CrossRef]
  4. Zandalinas, S.I.; Fritschi, F.B.; Mittler, R. Global warming, climate change, and environmental pollution: Recipe for a multifactorial stress combination disaster. Trends Plant Sci. 2021, 26, 588–599. [Google Scholar] [CrossRef] [PubMed]
  5. Cannicci, S.; Burrows, D.; Fratini, S.; Smith III, T.J.; Offenberg, J.; Dahdouh-Guebas, F. Faunal impact on vegetation structure and ecosystem function in mangrove forests: A review. Aquat. Bot. 2008, 89, 186–200. [Google Scholar] [CrossRef]
  6. Cramer, W.P.; Leemans, R. Assessing impacts of climate change on vegetation using climate classification systems. In Vegetation Dynamics & Global Change; Springer: Berlin/Heidelberg, Germany, 1993; pp. 190–217. [Google Scholar]
  7. Gottfried, M.; Pauli, H.; Futschik, A.; Akhalkatsi, M.; Barančok, P.; Alonso, J.L.B.; Coldea, G.; Dick, J.; Erschbamer, B.; Kazakis, G. Continent-wide response of mountain vegetation to climate change. Nat. Clim. Chang. 2012, 2, 111–115. [Google Scholar] [CrossRef]
  8. Chen, C.; Park, T.; Wang, X.; Piao, S.; Xu, B.; Chaturvedi, R.K.; Fuchs, R.; Brovkin, V.; Ciais, P.; Fensholt, R. China and India lead in greening of the world through land-use management. Nat. Sustain. 2019, 2, 122–129. [Google Scholar] [CrossRef] [PubMed]
  9. Brandt, M.; Yue, Y.; Wigneron, J.P.; Tong, X.; Tian, F.; Jepsen, M.R.; Xiao, X.; Verger, A.; Mialon, A.; Al-Yaari, A. Satellite-observed major greening and biomass increase in south China karst during recent decade. Earth’s Future 2018, 6, 1017–1028. [Google Scholar] [CrossRef]
  10. Piao, S.; Wang, X.; Park, T.; Chen, C.; Lian, X.; He, Y.; Bjerke, J.W.; Chen, A.; Ciais, P.; Tømmervik, H. Characteristics, drivers and feedbacks of global greening. Nat. Rev. Earth Environ. 2020, 1, 14–27. [Google Scholar] [CrossRef] [Green Version]
  11. Liu, Q.; Fu, Y.H.; Zhu, Z.; Liu, Y.; Liu, Z.; Huang, M.; Janssens, I.A.; Piao, S. Delayed autumn phenology in the Northern Hemisphere is related to change in both climate and spring phenology. Glob. Chang. Biol. 2016, 22, 3702–3711. [Google Scholar] [CrossRef]
  12. Karkauskaite, P.; Tagesson, T.; Fensholt, R. Evaluation of the plant phenology index (PPI), NDVI and EVI for start-of-season trend analysis of the Northern Hemisphere boreal zone. Remote Sens. 2017, 9, 485. [Google Scholar] [CrossRef]
  13. Chen, C.; He, B.; Guo, L.; Zhang, Y.; Xie, X.; Chen, Z. Identifying critical climate periods for vegetation growth in the Northern Hemisphere. J. Geophys. Res. Biogeosci. 2018, 123, 2541–2552. [Google Scholar] [CrossRef]
  14. Piao, S.; Fang, J.; Ji, W.; Guo, Q.; Ke, J.; Tao, S. Variation in a satellite-based vegetation index in relation to climate in China. J. Veg. Sci. 2004, 15, 219–226. [Google Scholar] [CrossRef]
  15. Liu, R.; Xiao, L.; Liu, Z.; Dai, J. Quantifying the relative impacts of climate and human activities on vegetation changes at the regional scale. Ecol. Indic. 2018, 93, 91–99. [Google Scholar] [CrossRef]
  16. Nearing, M.A.; Xie, Y.; Liu, B.; Ye, Y. Natural and anthropogenic rates of soil erosion. Int. Soil Water Conserv. Res. 2017, 5, 77–84. [Google Scholar] [CrossRef]
  17. Corlett, R.T.; Primack, R.B.; Devictor, V.; Maas, B.; Goswami, V.R.; Bates, A.E.; Koh, L.P.; Regan, T.J.; Loyola, R.; Pakeman, R.J. Impacts of the coronavirus pandemic on biodiversity conservation. Biol. Conserv. 2020, 246, 108571. [Google Scholar] [CrossRef]
  18. Amundson, R.; Berhe, A.A.; Hopmans, J.W.; Olson, C.; Sztein, A.E.; Sparks, D.L. Soil and human security in the 21st century. Science 2015, 348, 6235. [Google Scholar] [CrossRef] [Green Version]
  19. Panagos, P.; Standardi, G.; Borrelli, P.; Lugato, E.; Montanarella, L.; Bosello, F. Cost of agricultural productivity loss due to soil erosion in the European Union: From direct cost evaluation approaches to the use of macroeconomic models. Land Degrad. Dev. 2018, 29, 471–484. [Google Scholar] [CrossRef]
  20. Telles, T.S.; Guimarães, M.d.F.; Dechen, S.C.F. The costs of soil erosion. Rev. Bras. Ciência Solo 2011, 35, 287–298. [Google Scholar] [CrossRef]
  21. Lal, R. Soil erosion by wind and water: Problems and prospects. In Soil Erosion Research Methods; Routledge: London, UK, 2017; pp. 1–10. [Google Scholar]
  22. Ananda, J.; Herath, G. Soil erosion in developing countries: A socio-economic appraisal. J. Environ. Manag. 2003, 68, 343–353. [Google Scholar] [CrossRef]
  23. Li, Z.; Fang, H. Impacts of climate change on water erosion: A review. Earth Sci. Rev. 2016, 163, 94–117. [Google Scholar] [CrossRef]
  24. Correa, S.W.; Mello, C.R.; Chou, S.C.; Curi, N.; Norton, L.D. Soil erosion risk associated with climate change at Mantaro River basin, Peruvian Andes. Catena 2016, 147, 110–124. [Google Scholar] [CrossRef]
  25. Borrelli, P.; Robinson, D.A.; Panagos, P.; Lugato, E.; Yang, J.E.; Alewell, C.; Wuepper, D.; Montanarella, L.; Ballabio, C. Land use and climate change impacts on global soil erosion by water (2015–2070). Proc. Natl. Acad. Sci. USA 2020, 117, 21994–22001. [Google Scholar] [CrossRef] [PubMed]
  26. Simonneaux, V.; Cheggour, A.; Deschamps, C.; Mouillot, F.; Cerdan, O.; Le Bissonnais, Y. Land use and climate change effects on soil erosion in a semi-arid mountainous watershed (High Atlas, Morocco). J. Arid. Environ. 2015, 122, 64–75. [Google Scholar] [CrossRef] [Green Version]
  27. Eybergen, F.; Imeson, A. Geomorphological processes and climatic change. Catena 1989, 16, 307–319. [Google Scholar] [CrossRef]
  28. Kirkby, M. A model to estimate the impact of climatic change on hillslope and regolith form. Catena 1989, 16, 321–341. [Google Scholar] [CrossRef]
  29. Zhang, L.; Wang, J.; Bai, Z.; Lv, C. Effects of vegetation on runoff and soil erosion on reclaimed land in an opencast coal-mine dump in a loess area. Catena 2015, 128, 44–53. [Google Scholar] [CrossRef]
  30. Zheng, F.-L. Effect of vegetation changes on soil erosion on the Loess Plateau. Pedosphere 2006, 16, 420–427. [Google Scholar] [CrossRef]
  31. Lei, D.; Shangguan, Z.-P.; Rui, L. Effects of the grain-for-green program on soil erosion in China. Int. J. Sediment Res. 2012, 27, 120–127. [Google Scholar] [CrossRef]
  32. Zhou, J.; Fu, B.; Gao, G.; Lü, Y.; Liu, Y.; Lü, N.; Wang, S. Effects of precipitation and restoration vegetation on soil erosion in a semi-arid environment in the Loess Plateau, China. Catena 2016, 137, 1–11. [Google Scholar] [CrossRef]
  33. Peng, D.; Zhou, T.; Zhang, L.; Zhang, W.; Chen, X. Observationally constrained projection of the reduced intensification of extreme climate events in Central Asia from 0.5 °C less global warming. Clim. Dyn. 2020, 54, 543–560. [Google Scholar] [CrossRef]
  34. Chen, F.; Wang, J.; Jin, L.; Zhang, Q.; Li, J.; Chen, J. Rapid warming in mid-latitude central Asia for the past 100 years. Front. Earth Sci. China 2009, 3, 42–50. [Google Scholar] [CrossRef]
  35. Groll, M.; Opp, C.; Aslanov, I. Spatial and temporal distribution of the dust deposition in Central Asia–results from a long term monitoring program. Aeolian Res. 2013, 9, 49–62. [Google Scholar] [CrossRef]
  36. Chen, F.; Huang, W.; Jin, L. Characteristics and spatial differences of precipitation in arid region of Central Asia under the background of global warming. Chin. Sci. Earth Sci. 2012, 41, 1647–1657. [Google Scholar] [CrossRef]
  37. Sun, J.; Zhang, Z.-y.; Chen, W.; Li, W.; Chen, R.-x. Spatial distribution of precipitation stable isotopes in the alpine zones in Central Asia. Arid Zone Res. 2019, 36, 22–31. [Google Scholar] [CrossRef]
  38. Zhang, Q.; YUAN, X.-L.; Chen, X.; LUO, G.-P.; LI, L.-H. Vegetation change and its response to climate change in Central Asia from 1982 to 2012. Chin. J. Plant Ecol. 2016, 40, 13. [Google Scholar] [CrossRef] [Green Version]
  39. Xu, M.; Kang, S.; Wu, H.; Yuan, X. Detection of spatio-temporal variability of air temperature and precipitation based on long-term meteorological station observations over Tianshan Mountains, Central Asia. Atmos. Res. 2018, 203, 141–163. [Google Scholar] [CrossRef]
  40. Capolongo, D.; Pennetta, L.; Piccarreta, M.; Fallacara, G.; Boenzi, F. Spatial and temporal variations in soil erosion and deposition due to land-levelling in a semi-arid area of Basilicata (Southern Italy). Earth Surf. Processes Landf. J. Br. Geomorphol. Res. Group 2008, 33, 364–379. [Google Scholar] [CrossRef]
  41. Wang, N.; Yang, X. The Nexus among the Changes in Glacier, Human Activities and Rump Lake in the Arid Central Asia: A Case Study in the Aral Sea Basin; AGU Fall Meeting Abstracts: Washington, DC, USA, 2019. [Google Scholar]
  42. Sun, H.; Song, Y.; Chen, X.; Cheng, L.; Liu, H. Holocene dust deposition in the Ili Basin and its implications for climate variations in Westerlies-dominated Central Asia. Palaeogeogr. Palaeoclimatol. Palaeoecol. 2020, 550, 109731. [Google Scholar] [CrossRef]
  43. Gong, Z.; Peng, D.; Wen, J.; Cai, Z.; Wang, T.; Hu, Y.; Ma, Y.; Xu, J. Research on trend of warm-humid climate in Central Asia. In IOP Conference Series: Earth and Environmental Science, 2017; IOP Publishing: Bristol, UK, 2017; p. 012017. [Google Scholar]
  44. Spaeth, K.E.; Weltz, M.A.; Guertin, D.P.; Qi, J.; Henebry, G.M.; Nesbit, J.; Yespolov, T.I.; Beksultanov, M. Hydrology and erosion risk parameters for grasslands in Central Asia. In Landscape Dynamics of Drylands across Greater Central Asia: People, Societies and Ecosystems; Landscape Series; Springer: Cham, Switzerland, 2020; Volume 17, p. 125. [Google Scholar] [CrossRef]
  45. Ma, X.; Zhu, J.; Yan, W.; Zhao, C. Assessment of soil conservation services of four river basins in Central Asia under global warming scenarios. Geoderma 2020, 375, 114533. [Google Scholar] [CrossRef]
  46. Li, J.; Ma, X.; Zhang, C. Predicting the spatiotemporal variation in soil wind erosion across Central Asia in response to climate change in the 21st century. Sci. Total Environ. 2020, 709, 136060. [Google Scholar] [CrossRef]
  47. Zhang, M.; Chen, Y.; Shen, Y.; Li, Y. Changes of precipitation extremes in arid Central Asia. Quat. Int. 2017, 436, 16–27. [Google Scholar] [CrossRef]
  48. Cheng, H.; Zhang, P.; Spötl, C.; Edwards, R.; Cai, Y.; Zhang, D.; Sang, W.; Tan, M.; An, Z. The climatic cyclicity in semiarid-arid central Asia over the past 500,000 years. Geophys. Res. Lett. 2012, 39, L01705. [Google Scholar] [CrossRef] [Green Version]
  49. Mannig, B.; Müller, M.; Starke, E.; Merkenschlager, C.; Mao, W.; Zhi, X.; Podzun, R.; Jacob, D.; Paeth, H. Dynamical downscaling of climate change in Central Asia. Glob. Planet. Chang. 2013, 110, 26–39. [Google Scholar] [CrossRef]
  50. Hu, Z.; Zhou, Q.; Chen, X.; Qian, C.; Wang, S.; Li, J. Variations and changes of annual precipitation in Central Asia over the last century. Int. J. Climatol. 2017, 37, 157–170. [Google Scholar] [CrossRef]
  51. Varis, O.; Kummu, M. The major Central Asian river basins: An assessment of vulnerability. Int. J. Water Resour. Dev. 2012, 28, 433–452. [Google Scholar] [CrossRef]
  52. Issanova, G.; Abuduwaili, J. Aeolian Processes as Dust Storms in the Deserts of Central Asia and Kazakhstan; Springer: Berlin/Heidelberg, Germany, 2017. [Google Scholar]
  53. White, C.J.; Tanton, T.W.; Rycroft, D.W. The impact of climate change on the water resources of the Amu Darya Basin in Central Asia. Water Resour. Manag. 2014, 28, 5267–5281. [Google Scholar] [CrossRef]
  54. Sorg, A.; Mosello, B.; Shalpykova, G.; Allan, A.; Clarvis, M.H.; Stoffel, M. Coping with changing water resources: The case of the Syr Darya river basin in Central Asia. Environ. Sci. Policy 2014, 43, 68–77. [Google Scholar] [CrossRef]
  55. Hansen, J.; Sato, M.; Hearty, P.; Ruedy, R.; Kelley, M.; Masson-Delmotte, V.; Russell, G.; Tselioudis, G.; Cao, J.; Rignot, E. Ice melt, sea level rise and superstorms: Evidence from paleoclimate data, climate modeling, and modern observations that 2 °C global warming is highly dangerous. Atmos. Chem. Phys. Discuss. 2015, 15, 14. [Google Scholar] [CrossRef] [Green Version]
  56. Karthe, D.; Abdullaev, I.; Boldgiv, B.; Borchardt, D.; Chalov, S.; Jarsjö, J.; Li, L.; Nittrouer, J.A. Water in Central Asia: An Integrated Assessment for Science-Based Management; Springer: Berlin/Heidelberg, Germany, 2017; Volume 76, pp. 1–15. [Google Scholar]
  57. Yang, X.; Wang, N.; He, J.; Hua, T.; Qie, Y. Changes in area and water volume of the Aral Sea in the arid Central Asia over the period of 1960–2018 and their causes. Catena 2020, 191, 104566. [Google Scholar] [CrossRef]
  58. Duan, W.; Zou, S.; Chen, Y.; Nover, D.; Fang, G.; Wang, Y. Sustainable water management for cross-border resources: The Balkhash Lake Basin of Central Asia, 1931–2015. J. Clean. Prod. 2020, 263, 121614. [Google Scholar] [CrossRef]
  59. Yapiyev, V.; Sagintayev, Z.; Inglezakis, V.J.; Samarkhanov, K.; Verhoef, A. Essentials of endorheic basins and lakes: A review in the context of current and future water resource management and mitigation activities in Central Asia. Water 2017, 9, 798. [Google Scholar] [CrossRef] [Green Version]
  60. Dugerdil, L.; Ménot, G.; Peyron, O.; Jouffroy-Bapicot, I.; Ansanay-Alex, S.; Antheaume, I.; Behling, H.; Boldgiv, B.; Develle, A.-L.; Grossi, V. Late Holocene Mongolian climate and environment reconstructions from brGDGTs, NPPs and pollen transfer functions for Lake Ayrag: Paleoclimate implications for Arid Central Asia. Quat. Sci. Rev. 2021, 273, 107235. [Google Scholar] [CrossRef]
  61. Lioubimtseva, E.; Cole, R.; Adams, J.M.; Kapustin, G. Impacts of climate and land-cover changes in arid lands of Central Asia. J. Arid Environ. 2005, 62, 285–308. [Google Scholar] [CrossRef]
  62. Formica, A.F.; Burnside, R.J.; Dolman, P.M. Rainfall validates MODIS-derived NDVI as an index of spatio-temporal variation in green biomass across non-montane semi-arid and arid Central Asia. J. Arid Environ. 2017, 142, 11–21. [Google Scholar] [CrossRef] [Green Version]
  63. Hu, Z.; Zhou, Q.; Chen, X.; Li, J.; Li, Q.; Chen, D.; Liu, W.; Yin, G. Evaluation of three global gridded precipitation data sets in central Asia based on rain gauge observations. Int. J. Climatol. 2018, 38, 9. [Google Scholar] [CrossRef]
  64. Eini, M.R.; Javadi, S.; Delavar, M.; Monteiro, J.A.; Darand, M. High accuracy of precipitation reanalyses resulted in good river discharge simulations in a semi-arid basin. Ecol. Eng. 2019, 131, 107–119. [Google Scholar] [CrossRef]
  65. Richardson, A.D.; Hufkens, K.; Milliman, T.; Aubrecht, D.M.; Furze, M.E.; Seyednasrollah, B.; Krassovski, M.B.; Latimer, J.M.; Nettles, W.R.; Heiderman, R.R. Ecosystem warming extends vegetation activity but heightens vulnerability to cold temperatures. Nature 2018, 560, 368–371. [Google Scholar] [CrossRef]
  66. Gao, L.; Wang, X.; Johnson, B.A.; Tian, Q.; Wang, Y.; Verrelst, J.; Mu, X.; Gu, X. Remote sensing algorithms for estimation of fractional vegetation cover using pure vegetation index values: A review. ISPRS J. Photogramm. Remote Sens. 2020, 159, 364–377. [Google Scholar] [CrossRef]
  67. Cao, Z.; Li, Y.; Liu, Y.; Chen, Y.; Wang, Y. When and where did the Loess Plateau turn “green”? Analysis of the tendency and breakpoints of the normalized difference vegetation index. Land Degrad. Dev. 2018, 29, 162–175. [Google Scholar] [CrossRef]
  68. Cai, Z.; Jönsson, P.; Jin, H.; Eklundh, L. Performance of smoothing methods for reconstructing NDVI time-series and estimating vegetation phenology from MODIS data. Remote Sens. 2017, 9, 1271. [Google Scholar] [CrossRef] [Green Version]
  69. Wang, G.; Wang, J.; Zou, X.; Chai, G.; Wu, M.; Wang, Z. Estimating the fractional cover of photosynthetic vegetation, non-photosynthetic vegetation and bare soil from MODIS data: Assessing the applicability of the NDVI-DFI model in the typical Xilingol grasslands. Int. J. Appl. Earth Obs. Geoinf. 2019, 76, 154–166. [Google Scholar] [CrossRef]
  70. Fensholt, R.; Proud, S.R. Evaluation of earth observation based global long term vegetation trends—Comparing GIMMS and MODIS global NDVI time series. Remote Sens. Environ. 2012, 119, 131–147. [Google Scholar] [CrossRef]
  71. Tian, F.; Fensholt, R.; Verbesselt, J.; Grogan, K.; Horion, S.; Wang, Y. Evaluating temporal consistency of long-term global NDVI datasets for trend analysis. Remote Sens. Environ. 2015, 163, 326–340. [Google Scholar] [CrossRef]
  72. Zhang, Y.; Song, C.; Band, L.E.; Sun, G.; Li, J. Reanalysis of global terrestrial vegetation trends from MODIS products: Browning or greening? Remote Sens. Environ. 2017, 191, 145–155. [Google Scholar] [CrossRef] [Green Version]
  73. Li, W.; MacBean, N.; Ciais, P.; Defourny, P.; Lamarche, C.; Bontemps, S.; Houghton, R.A.; Peng, S. Gross and net land cover changes in the main plant functional types derived from the annual ESA CCI land cover maps (1992–2015). Earth Syst. Sci. Data 2018, 10, 219–234. [Google Scholar] [CrossRef] [Green Version]
  74. Mousivand, A.; Arsanjani, J.J. Insights on the historical and emerging global land cover changes: The case of ESA-CCI-LC datasets. Appl. Geogr. 2019, 106, 82–92. [Google Scholar] [CrossRef]
  75. Khwarahm, N.R.; Qader, S.; Ararat, K.; Fadhil Al-Quraishi, A.M. Predicting and mapping land cover/land use changes in Erbil/Iraq using CA-Markov synergy model. Earth Sci. Inform. 2021, 14, 393–406. [Google Scholar] [CrossRef]
  76. Ma, X.; Zhu, J.; Yan, W.; Zhao, C. Projections of desertification trends in Central Asia under global warming scenarios. Sci. Total Environ. 2021, 781, 146777. [Google Scholar] [CrossRef]
  77. Ghosal, K.; Bhattacharya, S.D. A review of RUSLE model. J. Indian Soc. Remote Sens. 2020, 48, 689–707. [Google Scholar] [CrossRef]
  78. Naipal, V.; Reick, C.; Pongratz, J.; Oost, K.V. Improving the global applicability of the RUSLE model–adjustment of the topographical and rainfall erosivity factors. Geosci. Model Dev. 2015, 8, 2893–2913. [Google Scholar] [CrossRef] [Green Version]
  79. Angima, S.; Stott, D.; O’neill, M.; Ong, C.; Weesies, G. Soil erosion prediction using RUSLE for central Kenyan highland conditions. Agric. Ecosyst. Environ. 2003, 97, 295–308. [Google Scholar] [CrossRef]
  80. Ziadat, F.M.; Taimeh, A. Effect of rainfall intensity, slope, land use and antecedent soil moisture on soil erosion in an arid environment. Land Degrad. Dev. 2013, 24, 582–590. [Google Scholar] [CrossRef]
  81. Wischmeier, W.H.; Smith, D.D. Predicting Rainfall Erosion Losses: A Guide to Conservation Planning; Department of Agriculture, Science and Education Administration: Washington, DC, USA, 1978.
  82. Keesstra, S.; Pereira, P.; Novara, A.; Brevik, E.C.; Azorin-Molina, C.; Parras-Alcántara, L.; Jordán, A.; Cerdà, A. Effects of soil management techniques on soil water erosion in apricot orchards. Sci. Total Environ. 2016, 551, 357–366. [Google Scholar] [CrossRef] [PubMed] [Green Version]
  83. Williams, J.; Nearing, M.; Nicks, A.; Skidmore, E.; Valentin, C.; King, K.; Savabi, R. Using soil erosion models for global change studies. J. Soil Water Conserv. 1996, 51, 381–385. [Google Scholar]
  84. McCool, D.K.; Foster, G.R.; Mutchler, C.K.; Meyer, L.D. Revised Slope Length Factor for the Universal Soil Loss Equation. Trans. ASAE 1989, 32, 5. [Google Scholar] [CrossRef]
  85. Panagos, P.; Borrelli, P.; Meusburger, K.; Alewell, C.; Lugato, E.; Montanarella, L. Estimating the soil erosion cover-management factor at the European scale. Land Use Policy 2015, 48, 38–50. [Google Scholar] [CrossRef]
  86. Cai, C.F.; Ding, S.W.; Shi, Z.H.; Huang, L.; Zhang, G.Y. Study of applying USLE and geographical information system IDRISI to predict soil erosion in small watershed. J. Soil Water Conserv. 2000, 14, 19–24. [Google Scholar] [CrossRef]
  87. Panagos, P.; Borrelli, P.; Meusburger, K.; van der Zanden, E.H.; Poesen, J.; Alewell, C. Modelling the effect of support practices (P-factor) on the reduction of soil erosion by water at European scale. Environ. Sci. Policy 2015, 51, 23–34. [Google Scholar] [CrossRef]
  88. Ochoa-Cueva, P.; Fries, A.; Montesinos, P.; Rodríguez-Díaz, J.A.; Boll, J. Spatial estimation of soil erosion risk by land-cover change in the Andes of southern Ecuador. Land Degrad. Dev. 2015, 26, 565–573. [Google Scholar] [CrossRef]
  89. Fu, B.; Zhao, W.; Chen, L.; Zhang, Q.; Lü, Y.; Gulinck, H.; Poesen, J. Assessment of soil erosion at large watershed scale using RUSLE and GIS: A case study in the Loess Plateau of China. Land Degrad. Dev. 2005, 16, 73–85. [Google Scholar] [CrossRef]
  90. Renard, K.G.; Foster, G.; Yoder, D.; McCool, D. RUSLE revisited: Status, questions, answers, and the future. J. Soil Water Conserv. 1994, 49, 213–220. [Google Scholar]
  91. Liu, Y.; Li, Y.; Li, S.; Motesharrei, S. Spatial and temporal patterns of global NDVI trends: Correlations with climate and human factors. Remote Sens. 2015, 7, 13233–13250. [Google Scholar] [CrossRef] [Green Version]
  92. Jiang, L.; Bao, A.; Guo, H.; Ndayisaba, F. Vegetation dynamics and responses to climate change and human activities in Central Asia. Sci. Total Environ. 2017, 599, 967–980. [Google Scholar] [CrossRef] [PubMed]
  93. Agbelade, A.D.; Onyekwelu, J.C.; Oyun, M.B. Tree species richness, diversity, and vegetation index for federal capital territory, Abuja, Nigeria. Int. J. For. Res. 2017, 2017, 4549756. [Google Scholar] [CrossRef] [Green Version]
  94. Shakun, J.D.; Clark, P.U.; He, F.; Marcott, S.A.; Mix, A.C.; Liu, Z.; Otto-Bliesner, B.; Schmittner, A.; Bard, E. Global warming preceded by increasing carbon dioxide concentrations during the last deglaciation. Nature 2012, 484, 49–54. [Google Scholar] [CrossRef]
  95. Olson, K.R.; Al-Kaisi, M.; Lal, R.; Cihacek, L. Impact of soil erosion on soil organic carbon stocks. J. Soil Water Conserv. 2016, 71, 61A–67A. [Google Scholar] [CrossRef] [Green Version]
  96. Ma, X.; Zhao, C.; Zhu, J. Aggravated risk of soil erosion with global warming—A global meta-analysis. Catena 2021, 200, 105129. [Google Scholar] [CrossRef]
  97. Berhe, A.A.; Barnes, R.T.; Six, J.; Marín-Spiotta, E. Role of soil erosion in biogeochemical cycling of essential elements: Carbon, nitrogen, and phosphorus. Annu. Rev. Earth Planet. Sci. 2018, 46, 521–548. [Google Scholar] [CrossRef]
  98. Song, X.-P.; Hansen, M.C.; Stehman, S.V.; Potapov, P.V.; Tyukavina, A.; Vermote, E.F.; Townshend, J.R. Global land change from 1982 to 2016. Nature 2018, 560, 639–643. [Google Scholar] [CrossRef]
  99. Giesecke, T.; Brewer, S.; Finsinger, W.; Leydet, M.; Bradshaw, R.H. Patterns and dynamics of European vegetation change over the last 15,000 years. J. Biogeogr. 2017, 44, 1441–1456. [Google Scholar] [CrossRef] [Green Version]
  100. Duveiller, G.; Hooker, J.; Cescatti, A. The mark of vegetation change on Earth’s surface energy balance. Nat. Commun. 2018, 9, 679. [Google Scholar] [CrossRef] [PubMed]
  101. Langgut, D.; Almogi-Labin, A.; Bar-Matthews, M.; Weinstein-Evron, M. Vegetation and climate changes in the South Eastern Mediterranean during the Last Glacial-Interglacial cycle (86 ka): New marine pollen record. Quat. Sci. Rev. 2011, 30, 3960–3972. [Google Scholar] [CrossRef]
  102. Chu, H.; Venevsky, S.; Wu, C.; Wang, M. NDVI-based vegetation dynamics and its response to climate changes at Amur-Heilongjiang River Basin from 1982 to 2015. Sci. Total Environ. 2019, 650, 2051–2062. [Google Scholar] [CrossRef] [PubMed]
  103. Svenning, J.C.; Sandel, B. Disequilibrium vegetation dynamics under future climate change. Am. J. Bot. 2013, 100, 1266–1286. [Google Scholar] [CrossRef] [PubMed]
  104. Yu, L.; Liu, Y.; Liu, T.; Yan, F. Impact of recent vegetation greening on temperature and precipitation over China. Agric. For. Meteorol. 2020, 295, 108197. [Google Scholar] [CrossRef]
  105. Liang, S.; Yi, Q.; Liu, J. Vegetation dynamics and responses to recent climate change in Xinjiang using leaf area index as an indicator. Ecol. Indic. 2015, 58, 64–76. [Google Scholar] [CrossRef]
  106. Piao, S.; Fang, J.; Zhou, L.; Zhu, B.; Tan, K.; Tao, S. Changes in vegetation net primary productivity from 1982 to 1999 in China. Glob. Biogeochem. Cycles 2005, 19, 3–9. [Google Scholar] [CrossRef] [Green Version]
  107. Wu, L.; Ma, X.; Dou, X.; Zhu, J.; Zhao, C. Impacts of climate change on vegetation phenology and net primary productivity in arid Central Asia. Sci. Total Environ. 2021, 796, 149055. [Google Scholar] [CrossRef]
  108. Liu, Q.; Piao, S.; Janssens, I.A.; Fu, Y.; Peng, S.; Lian, X.; Ciais, P.; Myneni, R.B.; Peñuelas, J.; Wang, T. Extension of the growing season increases vegetation exposure to frost. Nat. Commun. 2018, 9, 426. [Google Scholar] [CrossRef] [Green Version]
  109. Gu, Z.; Duan, X.; Shi, Y.; Li, Y.; Pan, X. Spatiotemporal variation in vegetation coverage and its response to climatic factors in the Red River Basin, China. Ecol. Indic. 2018, 93, 54–64. [Google Scholar] [CrossRef]
  110. Na, X.; Yu, H.; Wang, P.; Zhu, W.; Niu, Y.; Huang, J. Vegetation biomass and soil moisture coregulate bacterial community succession under altered precipitation regimes in a desert steppe in northwestern China. Soil Biol. Biochem. 2019, 136, 107520. [Google Scholar] [CrossRef]
  111. Huang, K.; Zhang, Y.; Zhu, J.; Liu, Y.; Zu, J.; Zhang, J. The influences of climate change and human activities on vegetation dynamics in the Qinghai-Tibet Plateau. Remote Sens. 2016, 8, 876. [Google Scholar] [CrossRef] [Green Version]
  112. Yin, G.; Meng, X.; Hu, Z.; Sun, Z. Spatial-temporal variation of vegetation and its correlation with climate change in Central Asia during the period of 1982–2012. Acta Ecol. Sin. 2017, 37, 3149–3163. [Google Scholar] [CrossRef]
  113. Wang, Y.; Shen, Y.; Chen, Y.; Guo, Y. Vegetation dynamics and their response to hydroclimatic factors in the Tarim River Basin, China. Ecohydrology 2013, 6, 927–936. [Google Scholar] [CrossRef]
  114. López-Carr, D.; Davis, J.; Jankowska, M.M.; Grant, L.; López-Carr, A.C.; Clark, M. Space versus place in complex human–natural systems: Spatial and multi-level models of tropical land use and cover change (LUCC) in Guatemala. Ecol. Model. 2012, 229, 64–75. [Google Scholar] [CrossRef] [Green Version]
  115. Li, X.; Chen, G.; Liu, X.; Liang, X.; Wang, S.; Chen, Y.; Pei, F.; Xu, X. A new global land-use and land-cover change product at a 1-km resolution for 2010 to 2100 based on human–environment interactions. Ann. Am. Assoc. Geogr. 2017, 107, 1040–1059. [Google Scholar] [CrossRef]
  116. Wang, J.; Wang, K.; Zhang, M.; Zhang, C. Impacts of climate change and human activities on vegetation cover in hilly southern China. Ecol. Eng. 2015, 81, 451–461. [Google Scholar] [CrossRef]
  117. Kidane, Y.; Stahlmann, R.; Beierkuhnlein, C. Vegetation dynamics, and land use and land cover change in the Bale Mountains, Ethiopia. Environ. Monit. Assess. 2012, 184, 7473–7489. [Google Scholar] [CrossRef]
  118. Klein, I.; Gessner, U.; Kuenzer, C. Regional land cover mapping and change detection in Central Asia using MODIS time-series. Appl. Geogr. 2012, 35, 219–234. [Google Scholar] [CrossRef]
  119. Maimaitiaili, A. Multi Satellites Monitoring of Land Use/Cover Change and Its Driving Forces in Kashgar Region, Central Asia; AGU Fall Meeting Abstracts: Washington, DC, USA, 2016; p. GC21B-107. [Google Scholar]
  120. Micklin, P. The future Aral Sea: Hope and despair. Environ. Earth Sci. 2016, 75, 844. [Google Scholar] [CrossRef]
  121. Cretaux, J.-F.; Letolle, R.; Bergé-Nguyen, M. History of Aral Sea level variability and current scientific debates. Glob. Planet. Chang. 2013, 110, 99–113. [Google Scholar] [CrossRef]
  122. AghaKouchak, A.; Norouzi, H.; Madani, K.; Mirchi, A.; Azarderakhsh, M.; Nazemi, A.; Nasrollahi, N.; Farahmand, A.; Mehran, A.; Hasanzadeh, E. Aral Sea syndrome desiccates Lake Urmia: Call for action. J. Great Lakes Res. 2015, 41, 307–311. [Google Scholar] [CrossRef]
  123. Bekchanov, M.; Ringler, C.; Bhaduri, A.; Jeuland, M. Optimizing irrigation efficiency improvements in the Aral Sea Basin. Water Resour. Econ. 2016, 13, 30–45. [Google Scholar] [CrossRef]
  124. Micklin, P.; Aladin, N.V.; Plotnikov, I. Aral Sea; Springer: Berlin/Heidelberg, Germany, 2016. [Google Scholar]
  125. Wang, X.; Chen, Y.; Li, Z.; Fang, G.; Wang, F.; Liu, H. The impact of climate change and human activities on the Aral Sea Basin over the past 50 years. Atmos. Res. 2020, 245, 105125. [Google Scholar] [CrossRef]
  126. Gaybullaev, B.; Chen, S.-C.; Gaybullaev, D. Changes in water volume of the Aral Sea after 1960. Appl. Water Sci. 2012, 2, 285–291. [Google Scholar] [CrossRef] [Green Version]
  127. Berdimbetov, T.; Ilyas, S.; Ma, Z.; Bilal, M.; Nietullaeva, S. Climatic Change and Human Activities Link to Vegetation Dynamics in the Aral Sea Basin Using NDVI. Earth Syst. Environ. 2021, 5, 303–318. [Google Scholar] [CrossRef]
  128. White, K.D. Nature–society linkages in the Aral Sea region. J. Eurasian Stud. 2013, 4, 18–33. [Google Scholar] [CrossRef] [Green Version]
  129. Lioubimtseva, E. A multi-scale assessment of human vulnerability to climate change in the Aral Sea basin. Environ. Earth Sci. 2015, 73, 719–729. [Google Scholar] [CrossRef]
  130. Ermakhanov, Z.K.; Plotnikov, I.S.; Aladin, N.; Micklin, P. Changes in the Aral Sea ichthyofauna and fishery during the period of ecological crisis. Lakes Reserv. Res. Manag. 2012, 17, 3–9. [Google Scholar] [CrossRef]
  131. Zhang, Q.; Sun, P.; Li, J.; Xiao, M.; Singh, V.P. Assessment of drought vulnerability of the Tarim River basin, Xinjiang, China. Theor. Appl. Climatol. 2015, 121, 337–347. [Google Scholar] [CrossRef]
  132. Xue, L.; Wang, J.; Zhang, L.; Wei, G.; Zhu, B. Spatiotemporal analysis of ecological vulnerability and management in the Tarim River Basin, China. Sci. Total Environ. 2019, 649, 876–888. [Google Scholar] [CrossRef] [PubMed]
  133. Bao, A.; Huang, Y.; Ma, Y.; Guo, H.; Wang, Y. Assessing the effect of EWDP on vegetation restoration by remote sensing in the lower reaches of Tarim River. Ecol. Indic. 2017, 74, 261–275. [Google Scholar] [CrossRef]
  134. Yang, P.; Xia, J.; Zhan, C.; Qiao, Y.; Wang, Y. Monitoring the spatio-temporal changes of terrestrial water storage using GRACE data in the Tarim River basin between 2002 and 2015. Sci. Total Environ. 2017, 595, 218–228. [Google Scholar] [CrossRef]
  135. Xue, L.; Yang, F.; Yang, C.; Chen, X.; Zhang, L.; Chi, Y.; Yang, G. Identification of potential impacts of climate change and anthropogenic activities on streamflow alterations in the Tarim River Basin, China. Sci. Rep. 2017, 7, 8254. [Google Scholar] [CrossRef] [PubMed] [Green Version]
  136. Li, S.; Yang, S.; Liu, X.; Liu, Y.; Shi, M. NDVI-based analysis on the influence of climate change and human activities on vegetation restoration in the Shaanxi-Gansu-Ningxia Region, Central China. Remote Sens. 2015, 7, 11163–11182. [Google Scholar] [CrossRef] [Green Version]
  137. Jiang, M.; Tian, S.; Zheng, Z.; Zhan, Q.; He, Y. Human activity influences on vegetation cover changes in Beijing, China, from 2000 to 2015. Remote Sens. 2017, 9, 271. [Google Scholar] [CrossRef] [Green Version]
  138. Guan, Q.; Yang, L.; Guan, W.; Wang, F.; Liu, Z.; Xu, C. Assessing vegetation response to climatic variations and human activities: Spatiotemporal NDVI variations in the Hexi Corridor and surrounding areas from 2000 to 2010. Theor. Appl. Climatol. 2019, 135, 1179–1193. [Google Scholar] [CrossRef]
  139. Memoli, V.; De Marco, A.; Esposito, F.; Panico, S.C.; Barile, R.; Maisto, G. Seasonality, altitude and human activities control soil quality in a national park surrounded by an urban area. Geoderma 2019, 337, 1–10. [Google Scholar] [CrossRef]
  140. Borrelli, P.; Robinson, D.A.; Fleischer, L.R.; Lugato, E.; Ballabio, C.; Alewell, C.; Meusburger, K.; Modugno, S.; Schütt, B.; Ferro, V. An assessment of the global impact of 21st century land use change on soil erosion. Nat. Commun. 2017, 8, 2013. [Google Scholar] [CrossRef] [Green Version]
  141. Neeti, N.; Rogan, J.; Christman, Z.; Eastman, J.R.; Millones, M.; Schneider, L.; Nickl, E.; Schmook, B.; Turner, B.L.; Ghimire, B. Mapping seasonal trends in vegetation using AVHRR-NDVI time series in the Yucatán Peninsula, Mexico. Remote Sens. Lett. 2012, 3, 433–442. [Google Scholar] [CrossRef]
  142. Xie, H.; Chen, Q.; Wang, W.; He, Y. Analyzing the green efficiency of arable land use in China. Technol. Forecast. Soc. Chang. 2018, 133, 15–28. [Google Scholar] [CrossRef]
  143. Li, B.; Shi, X.; Chen, Y.; Jiang, Y. Quantitative assessment of the ecological effects of land use/cover change in the arid region of Northwest China. Environ. Monit. Assess. 2019, 191, 704. [Google Scholar] [CrossRef]
  144. Zhongming, W.; Lees, B.G.; Feng, J.; Wanning, L.; Haijing, S. Stratified vegetation cover index: A new way to assess vegetation impact on soil erosion. Catena 2010, 83, 87–93. [Google Scholar] [CrossRef]
  145. Jiao, J.; Zou, H.; Jia, Y.; Wang, N. Research progress on the effects of soil erosion on vegetation. Acta Ecol. Sin. 2009, 29, 85–91. [Google Scholar] [CrossRef]
  146. Zhou, P.; Luukkanen, O.; Tokola, T.; Nieminen, J. Effect of vegetation cover on soil erosion in a mountainous watershed. Catena 2008, 75, 319–325. [Google Scholar] [CrossRef]
  147. Nearing, M.; Jetten, V.; Baffaut, C.; Cerdan, O.; Couturier, A.; Hernandez, M.; Le Bissonnais, Y.; Nichols, M.; Nunes, J.; Renschler, C. Modeling response of soil erosion and runoff to changes in precipitation and cover. Catena 2005, 61, 131–154. [Google Scholar] [CrossRef]
  148. Wu, Y.; Ouyang, W.; Hao, Z.; Lin, C.; Liu, H.; Wang, Y. Assessment of soil erosion characteristics in response to temperature and precipitation in a freeze-thaw watershed. Geoderma 2018, 328, 56–65. [Google Scholar] [CrossRef]
  149. Savabi, M.R.; Stockle, C.O. Modeling the possible impact of increased CO2 and temperature on soil water balance, crop yield and soil erosion. Environ. Model. Softw. 2001, 16, 631–640. [Google Scholar] [CrossRef]
  150. Luetzenburg, G.; Bittner, M.J.; Calsamiglia, A.; Renschler, C.S.; Estrany, J.; Poeppl, R. Climate and land use change effects on soil erosion in two small agricultural catchment systems Fugnitz–Austria, Can Revull–Spain. Sci. Total Environ. 2020, 704, 135389. [Google Scholar] [CrossRef]
  151. Teng, H.; Liang, Z.; Chen, S.; Liu, Y.; Rossel, R.A.V.; Chappell, A.; Yu, W.; Shi, Z. Current and future assessments of soil erosion by water on the Tibetan Plateau based on RUSLE and CMIP5 climate models. Sci. Total Environ. 2018, 635, 673–686. [Google Scholar] [CrossRef]
  152. Hu, H.; Tian, F.; Hu, H. Soil particle size distribution and its relationship with soil water and salt under mulched drip irrigation in Xinjiang of China. Sci. China Technol. Sci. 2011, 54, 1568–1574. [Google Scholar] [CrossRef]
  153. Wu, H.; Guo, B.; Xue, H.; Zang, W.; Han, B.; Yang, F.; Lu, Y.; Wei, C. What are the dominant influencing factors on the soil erosion evolution process in the Yellow River Basin? Earth Sci. Inform. 2021, 14, 1899–1915. [Google Scholar] [CrossRef]
  154. Chen, H.; Zhang, X.; Abla, M.; Lü, D.; Yan, R.; Ren, Q.; Ren, Z.; Yang, Y.; Zhao, W.; Lin, P. Effects of vegetation and rainfall types on surface runoff and soil erosion on steep slopes on the Loess Plateau, China. Catena 2018, 170, 141–149. [Google Scholar] [CrossRef]
  155. Zou, S.; Jilili, A.; Duan, W.; Maeyer, P.D.; de Voorde, T.V. Human and natural impacts on the water resources in the Syr Darya River Basin, Central Asia. Sustainability 2019, 11, 3084. [Google Scholar] [CrossRef] [Green Version]
  156. Wang, F.; Chen, Y.; Li, Z.; Fang, G.; Li, Y.; Xia, Z. Assessment of the irrigation water requirement and water supply risk in the Tarim River Basin, Northwest China. Sustainability 2019, 11, 4941. [Google Scholar] [CrossRef] [Green Version]
  157. Yu, G.-A.; Li, Z.; Yang, H.; Lu, J.; Huang, H.Q.; Yi, Y. Effects of riparian plant roots on the unconsolidated bank stability of meandering channels in the Tarim River, China. Geomorphology 2020, 351, 106958. [Google Scholar] [CrossRef]
  158. Ye, W.; van Dijk, A.I.; Huete, A.; Yebra, M. Global trends in vegetation seasonality in the GIMMS NDVI3g and their robustness. Int. J. Appl. Earth Obs. Geoinf. 2021, 94, 102238. [Google Scholar] [CrossRef]
  159. Liu, Y.; Li, L.; Chen, X.; Zhang, R.; Yang, J. Temporal-spatial variations and influencing factors of vegetation cover in Xinjiang from 1982 to 2013 based on GIMMS-NDVI3g. Glob. Planet. Chang. 2018, 169, 145–155. [Google Scholar] [CrossRef]
  160. Dou, X.; Ma, X.; Zhao, C.; Li, J.; Yan, Y.; Zhu, J. Risk assessment of soil erosion in Central Asia under global warming. Catena 2022, 212, 106056. [Google Scholar] [CrossRef]
  161. Teng, M.; Huang, C.; Wang, P.; Zeng, L.; Zhou, Z.; Xiao, W.; Huang, Z.; Liu, C. Impacts of forest restoration on soil erosion in the Three Gorges Reservoir area, China. Sci. Total Environ. 2019, 697, 134164. [Google Scholar] [CrossRef]
  162. Han, J.; Ge, W.; Hei, Z.; Cong, C.; Ma, C.; Xie, M.; Liu, B.; Feng, W.; Wang, F.; Jiao, J. Agricultural land use and management weaken the soil erosion induced by extreme rainstorms. Agric. Ecosyst. Environ. 2020, 301, 107047. [Google Scholar] [CrossRef]
  163. Wu, G.L.; Liu, Y.F.; Cui, Z.; Liu, Y.; Shi, Z.H.; Yin, R.; Kardol, P. Trade-off between vegetation type, soil erosion control and surface water in global semi-arid regions: A meta-analysis. J. Appl. Ecol. 2020, 57, 875–885. [Google Scholar] [CrossRef]
  164. Li, Y.; Bai, X.; Zhou, Y.; Qin, L.; Tian, X.; Tian, Y.; Li, P. Spatial–temporal evolution of soil erosion in a typical mountainous karst basin in SW China, based on GIS and RUSLE. Arab. J. Sci. Eng. 2016, 41, 209–221. [Google Scholar] [CrossRef]
  165. Fu, B.; Liu, Y.; Lü, Y.; He, C.; Zeng, Y.; Wu, B. Assessing the soil erosion control service of ecosystems change in the Loess Plateau of China. Ecol. Complex. 2011, 8, 284–293. [Google Scholar] [CrossRef]
  166. Zhang, W.; Zhou, J.; Feng, G.; Weindorf, D.C.; Hu, G.; Sheng, J. Characteristics of water erosion and conservation practice in arid regions of Central Asia: Xinjiang, China as an example. Int. Soil Water Conserv. Res. 2015, 3, 97–111. [Google Scholar] [CrossRef] [Green Version]
  167. He, Q.; Dai, X.A.; Chen, S. Assessing the effects of vegetation and precipitation on soil erosion in the Three-River Headwaters Region of the Qinghai-Tibet Plateau, China. J. Arid Land 2020, 12, 865–886. [Google Scholar] [CrossRef]
  168. Panagos, P.; Borrelli, P.; Poesen, J.; Ballabio, C.; Lugato, E.; Meusburger, K.; Montanarella, L.; Alewell, C. The new assessment of soil loss by water erosion in Europe. Environ. Sci. Policy 2015, 54, 438–447. [Google Scholar] [CrossRef]
  169. Talchabhadel, R.; Prajapati, R.; Aryal, A.; Maharjan, M. Assessment of rainfall erosivity (R-factor) during 1986–2015 across Nepal: A step towards soil loss estimation. Environ. Monit. Assess. 2020, 192, 293. [Google Scholar] [CrossRef]
  170. Kumar, M.; Sahu, A.P.; Sahoo, N.; Dash, S.S.; Raul, S.K.; Panigrahi, B. Global-scale application of the RUSLE model: A comprehensive review. Hydrol. Sci. J. 2022, 67, 806–830. [Google Scholar] [CrossRef]
  171. Wang, H.; Zhao, H. Dynamic changes of soil erosion in the Taohe River Basin using the RUSLE Model and Google Earth Engine. Water 2020, 12, 1293. [Google Scholar] [CrossRef]
Figure 1. Geographical location of major basins in Central Asia.
Remotesensing 14 05507 g001
Figure 2. Workflow of the application of the SE model to CA.
Remotesensing 14 05507 g002
Figure 3. Spatial distribution of the annual mean of SE factors based on the RUSLE model in CA from 1982 to 2017. R represents rainfall erosivity factor, K represents soil erodibility factor, LS represents topographic factor, P represents erosion control practice factor, and C represents vegetation cover factor.
Remotesensing 14 05507 g003
Figure 4. Validation results of SE. (a) Relationship between measured values of sediment delivery and simulated values of SE in TRB from 2006 to 2008; (b) Relationship between soil carbon accumulation and simulated values of SE. R2 (Coefficients of determination), RMSE (Root mean square error), MAE (mean absolute error).
Remotesensing 14 05507 g004
Figure 5. Spatial variation in annual SE of major basins in CA from 1982 to 2017. The pie chart shows the percentages of areas of SE increase (brown) and decrease (blue) relative to the entire basin. (a) ADB, Amu Darya Basin; (b) SDB, Syr Darya Basin; (c) IRB, Ili River Basin and (d) TRB, Tarim River Basin.
Remotesensing 14 05507 g005
Figure 6. Temporal variations in annual SE from 1982 to 2017. ADB, Amu Darya Basin; SDB, Syr Darya Basin; IRB, Ili River Basin and TRB, Tarim River Basin.
Remotesensing 14 05507 g006
Figure 7. Spatial variation of annual NDVI in major basins in CA from 1982 to 2017. The pie chart shows the percentages of areas of NDVI decrease (red) and increase (green) relative to the entire basin. (a) ADB, Amu Darya Basin; (b) SDB, Syr Darya Basin; (c) IRB, Ili River Basin and (d) TRB, Tarim River Basin.
Remotesensing 14 05507 g007
Figure 8. Temporal variations in annual NDVI from 1982 to 2017. ADB, Amu Darya Basin; SDB, Syr Darya Basin; IRB, Ili River Basin and TRB, Tarim River Basin.
Remotesensing 14 05507 g008
Figure 9. Spatial correlation between climatic factors and NDVI (1982–2017). (a) Spatial correlation between temperature and NDVI. (b) Spatial correlation coefficient between precipitation and NDVI. Square brackets represent positive correlations. Red text indicates the percentage of areas with positive correlations in the respective regions. ADB, Amu Darya Basin; SDB, Syr Darya Basin; IRB, Ili River Basin and TRB, Tarim River Basin.
Remotesensing 14 05507 g009
Figure 10. Land use classification for CA in (a) 1980 and (b) 2017.
Remotesensing 14 05507 g010
Figure 11. Effects of land use transfer types on the spatial variation of NDVI in CA from 1982 to 2017. (AL represents arable land, GL represents grassland, FL represents forestland, PDL represents potential desert land, CL represents construction land, DL represents desert land, WB represents water body, and Others represents other land types).
Remotesensing 14 05507 g011
Figure 12. Relationship and contribution of environmental factors to SE. (a) Structural equation model of the influence of climate, vegetation, and human activities on SE in CA (the numbers on the arrows are standardized path coefficients, and the width of the arrows indicates the strength of the causal effects). (b) Histogram statistics of the contribution degree of each environmental factor to SE. Tem represents temperature, NDVI represents Normalized Difference Vegetation Index, SHDI represents Shannon Diversity Index, and Pre represents precipitation.
Remotesensing 14 05507 g012
Table 1. Land use transfer matrix from 1982 to 2017 (km2).
2017
Land-UseALGLFLPDLCLDLWBOthers
AL8399.3665.8562.930.1060.3210.253.080
GL268.0317,410.85598.231.5121.87103.585.830
FL682.83442.8512,043.651.2410.0448.577.800
1982PDL0.021.613.274206.140.315.630.700
CL0.0300038.6000
DL244.88424.47700.264.905.1422,256.1821.320
WB6.1230.0419.9125.430.13356.691412.820
Others0000000527.73
Note: AL represents arable land, GL represents grassland, FL represents forestland, PDL represents potential desert land, CL represents construction land, DL represents desert land, WB represents water body, and Others represents other land types.
Table 2. Comparative analysis of SE with other surrounding areas.
Study AreasSE Ranges
(t/km2·a)
PeriodsReferences
Houzhai River Basin104–2231973–2013Li et al. [158]
Loess Plateau2399–29572000–2008Fu et al. [159]
Xinjiang Province1350–20841985–2011Zhang et al. [160]
Three-River Headwaters Region38–542005–2015He et al. [161]
European Union2220–24602010Panagos et al. [162]
Taohe River Basin1099–14242000–2018Wang and Zhao [163]
ADB1490–15251982–2017This study
SDB2677–2729
IRB1306–1321
TRB273–297
Publisher’s Note: MDPI stays neutral with regard to jurisdictional claims in published maps and institutional affiliations.

