Article

Pulse Parameters and Peak Currents of Return Strokes Observed by the Ningxia FALMA in the Chinese Inland Areas

1
College of Electrical, Energy and Power Engineering, Yangzhou University, Yangzhou 225001, China
2
China Science Skyline Tech. Co., Yinchuan 750000, China
3
Department of Electrical, Electronic and Computer Engineering, Gifu University, Gifu 501-1193, Japan
*
Author to whom correspondence should be addressed.
Submission received: 4 March 2022 / Revised: 6 April 2022 / Accepted: 8 April 2022 / Published: 11 April 2022

Abstract

:
We have studied the pulse parameters and peak currents of 17,225 return stroke (RS) events in the cloud-to-ground lightning flashes observed in Chinese inland areas by a multistation mapping system called Ningxia Fast Antenna Lightning Mapping Array. There are a total of 685 positive and 16,540 negative RS events, respectively, producing 8280 and 195,860 pulses at multi stations. It is found that on average, the positive RS pulse appears to have a longer rise time, wider half-peak width, shorter fall time and longer zero-crossing time than the negative RS pulse. The RS peak currents are estimated through time-matching with a modest number of RS from the calibrated lightning location system. The statistical results show that the arithmetic means of positive and negative RS peak currents are 31.5 and 22.8 kA, respectively. Compared to previously reported studies, both the RS pulse parameters and peak currents are significantly different. Particularly, we note that in our dataset, the percentage of positive RSs with peak currents below 10 kA is up to 27%, a significant number which should be taken into account in such types of statistical studies. Additionally, we have further used the data from Gifu, Japan, and Ningxia, China, to verify how distance ranges and observation regions affect the RS characteristics. The results have provided distinct evidence that the distance ranges and observation regions should be at least two of the factors attributing to the statistical disparities among different studies.

Graphical Abstract

1. Introduction

Since the late 1980s, several unusual electric features were observed in the summer thunderstorms in the Chinese inland plateau. These features contain roughly two aspects: the electric field waveforms and the in-cloud charge structure configurations. Unlike the dominant negative electric field commonly seen in the summer storms reported in previous studies [1,2], Wang et al. [3] found that the electric field at the ground was dominantly positive in Gansu, China, which was also supported or indicated by Liu et al. [4], Qie et al. [5], Zhang et al. [6] and Wang et al. [7]. Here, the polarity of the electric field follows the atmospheric electricity sign convention, suggesting that the positive electric field corresponds to the positive charge overhead. Based on this suggestion, it is natural to imagine that the charge distribution may be responsible for such a dominant positive electric field observed in the storms of the Chinese inland plateau areas.
To understand what kind of charge structures should be responsible for the dominant positive electric field, various observations [8,9,10,11,12] have been carried out during the last 30 years. These studies indicate that in the Chinese inland plateau areas, there is a tripolar charge structure but with a larger than usual lower positive charge center (LPCC). However, it should be noted that most of these previous studies were restricted by observational measurements. For example, the deduced charge structure is based on the changing tendency of an electric field recorded at one or multiple stations [8] or the sounding system that measures the electric field only along the propagating path inside the thunderstorm [12]. All of these restrictions make the charge structure in the thunderstorm incompletely revealed. Recently, three-dimensional (3D) mapping systems were developed and widely used to retrieve the temporal and spatial evolution of charge structures in thunderstorms. Using this mapping system, Li et al. [13,14] found that in two isolated thunderstorms occurring in Qinghai province, China, there was an inverted dipole charge structure during the developing and mature stages. These observation results apparently do not support the hypothesis of a larger than usual LPCC.
No matter what type of charge structure is the dominant one, the charge structure configurations in the Chinese inland plateau thunderstorms are indeed different from those in lowland areas and thus have a significant effect on the lightning discharge processes such as return stroke (RS). On the one hand, as pointed out by Wang et al. [7], RS in Lhasa city, Tibet Plateau region of China has larger rise times for both the first and subsequent strokes. On the other hand, as speculated by Shi et al. [15], the combination of a wide middle negative charge region and a small LPCC is a favorable condition for an intense first RS. If so, under the inferred charge structure in plateau thunderstorms, the corresponding RS characteristics, in terms of both RS pulse parameters and RS currents, should have some differences from those RSs in lowland areas.
Since March 2019, to better understand the lightning features in Chinese inland areas, we have deployed a low frequency (LF) mapping system called Fast Antenna Lightning Mapping Array (FALMA) in Ningxia, China. During the observation of 2019, the Ningxia FALMA recorded plenty of RSs in the cloud-to-ground lightning flashes, allowing us to make a statistical study on the RS features. In this paper, we will first study the pulse parameters and currents of 17,225 RS events observed in two thunderstorm days. The pulse parameters are characterized by 10-to-90% rise time, half-peak width, fall time, and zero-crossing time. The RS peak currents are estimated through time-matching with a modest number of RS from the calibrated lightning location system. Then, we will compare these statistical results with those previously reported throughout the world, which is expected to reveal the lightning specificity of Chinese inland areas.

2. Observational Experiment

The FALMA was first developed by the lightning research group in Gifu University, Japan and used to observe lightning flashes from the summer season of 2017 [16]. Using the fine structures of waveforms and lightning channel locations, we have completed several research studies associated with lightning physics. More details can be seen in Wu et al. [17,18,19,20,21,22,23] and Shi et al. [15,24,25].
In March of 2019, with the cooperation of China Science Skyline Tech Co., Ltd., we started to install a FALMA in Ningxia, China, which is located on the Loess Plateau adjoining the Qinghai-Tibet Plateau to the west. The geographical location of the Ningxia FALMA is shown in Figure 1, with the fill color representing the elevation above sea level. Most of the terrain is at an elevation of 1250–2000 m. There are 24 sites marked by the red triangles with the neighboring distance ranging from 14 to 375 km. The Ningxia FALMA covers an area of about 400 km × 300 km.
At each site, there is a fast antenna and a data acquiring system, as shown by an example scenario of site TJZ in Figure 2a. The equipment is similar to that introduced by Wu et al. [16]. For example, the fast antennas shown in Figure 2b had a time constant of about 200 μs and received radio waves in the frequency range of about 500 Hz to 500 kHz. All of the sites were synchronized by the real-time GPS clock. Other devices such as power switches and industrial computers are put in the controlling box (Figure 2c). In the data acquiring process, the Ningxia FALMA is a real-time locating system that differs from the FALMA deployed in Gifu. To reduce the signal transmission burden, we set the sampling rate down to 10 megasamples per second (MS/s), indicating that the data time resolution is 0.1 μs. The time-of-arrival technique was applied for locating the pulses on the electric field change (E-change) waveforms. More information on the initial locating results in Ningxia in 2019 can be seen in Gao et al. [26].

3. Data Processing

In the summer of 2017, the Gifu FALMA observed thousands of CG flashes with clear 3D locations, among which the accuracy of RS identification is considered to be up to 100%.
We first extracted the criteria thresholds of RS identification based on these CG flashes with clear 3D locations, and then used a machine-learning method similar to Zhu et al. [27] to identify RS in Ningxia CG lightning. However, there may be some differences in RS waveform characteristics due to different regions. Hence, we needed to manually confirm multistation RS waveforms after automated programming to ensure identification accuracy.
Eventually, in two thunderstorm days, 2 August and 5 August, during the first observation year of 2019, we identified more than 200,000 RS pulses from 17,225 RS events. For each RS pulse, we will analyze pulse parameters (e.g., rise time, half-peak width, and falling time) and RS peak currents. The specific processing description follows.

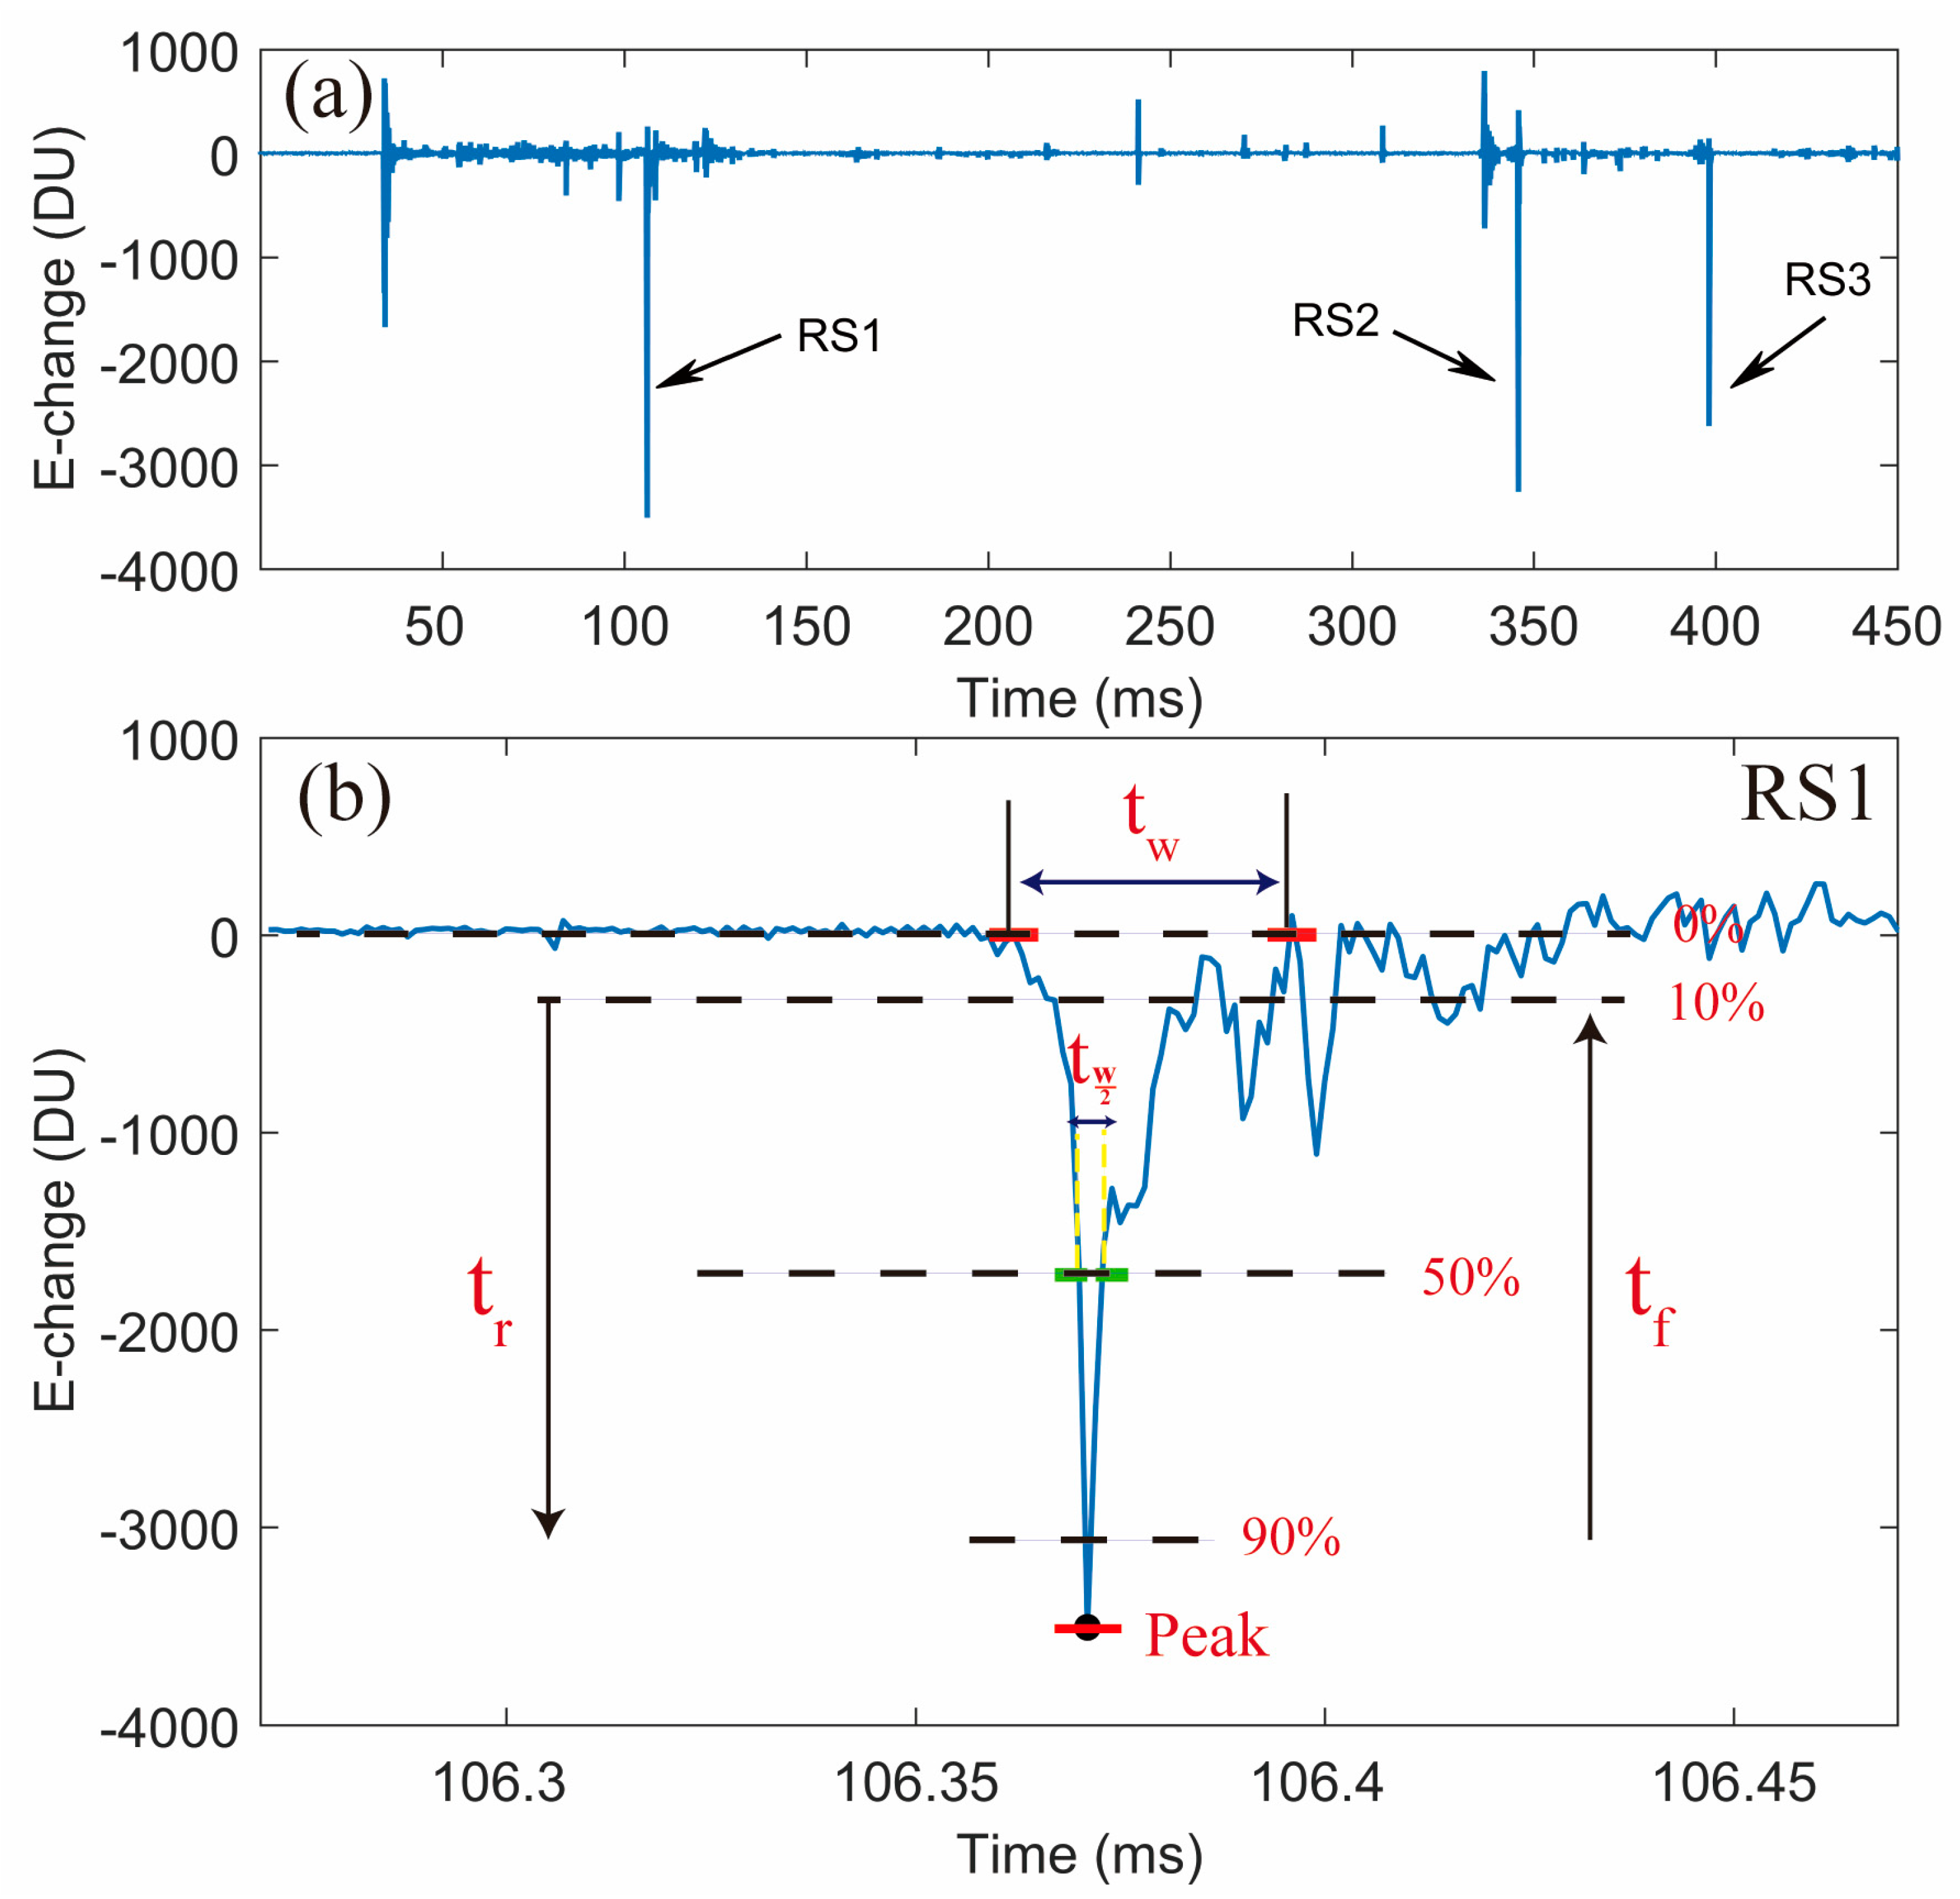
3.1. Calculation of Pulse Parameter

The parameter calculation from an example E-change waveform of typical negative cloud-to-ground (CG) lightning is illustrated in Figure 3. It lasted more than 400 ms, containing one preliminary breakdown process and three negative RSs. The expanded waveform of the first negative RS is shown in Figure 3b, with the marking of 0%-, 10%-, 50%-, and 90%-peak crossing points. Similar to definitions of the RS parameters in [28,29,30], the following four pulse parameters will be calculated and described:
A.
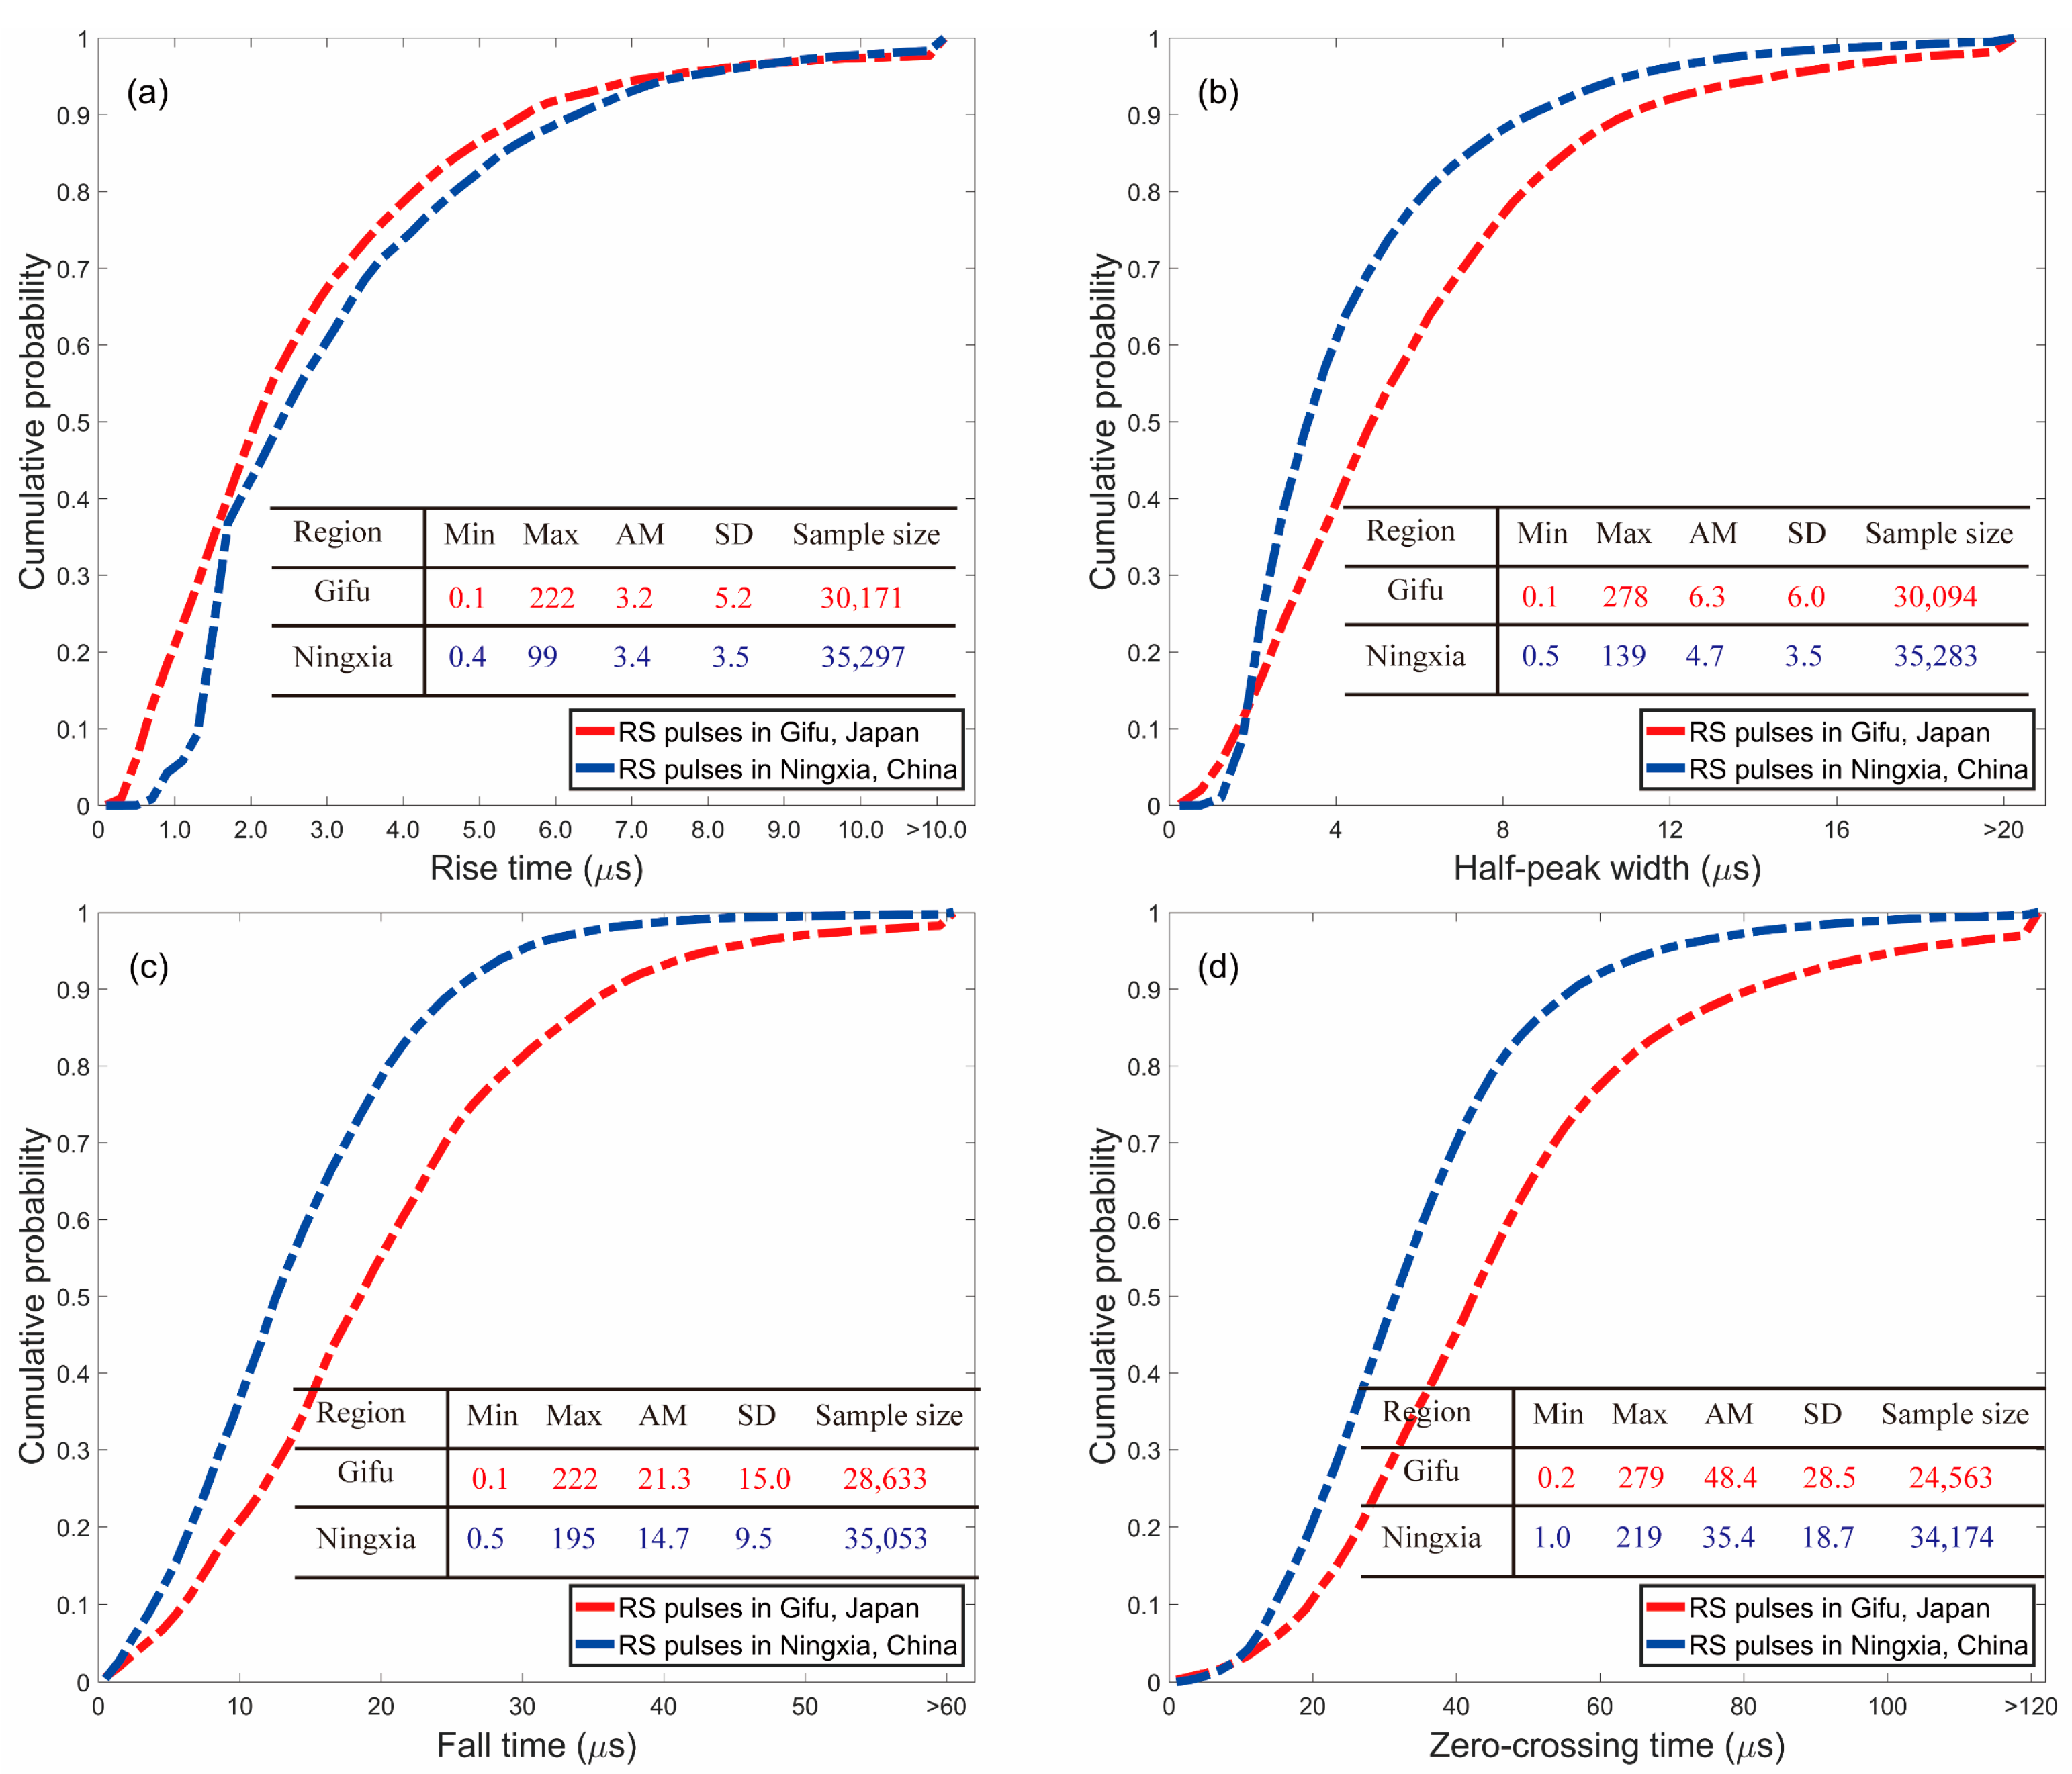
A 10-to-90% rise time (tr): interval rising from 10% to 90% of the RS peak amplitude;
B.
Half-peak width (tw/2): 50%-of-peak-crossing time;
C.
Fall time (tf): time difference falling from 90% to 10% of the RS peak amplitude;
D.
Zero-crossing time (tw): the interval between the zero-crossing points.

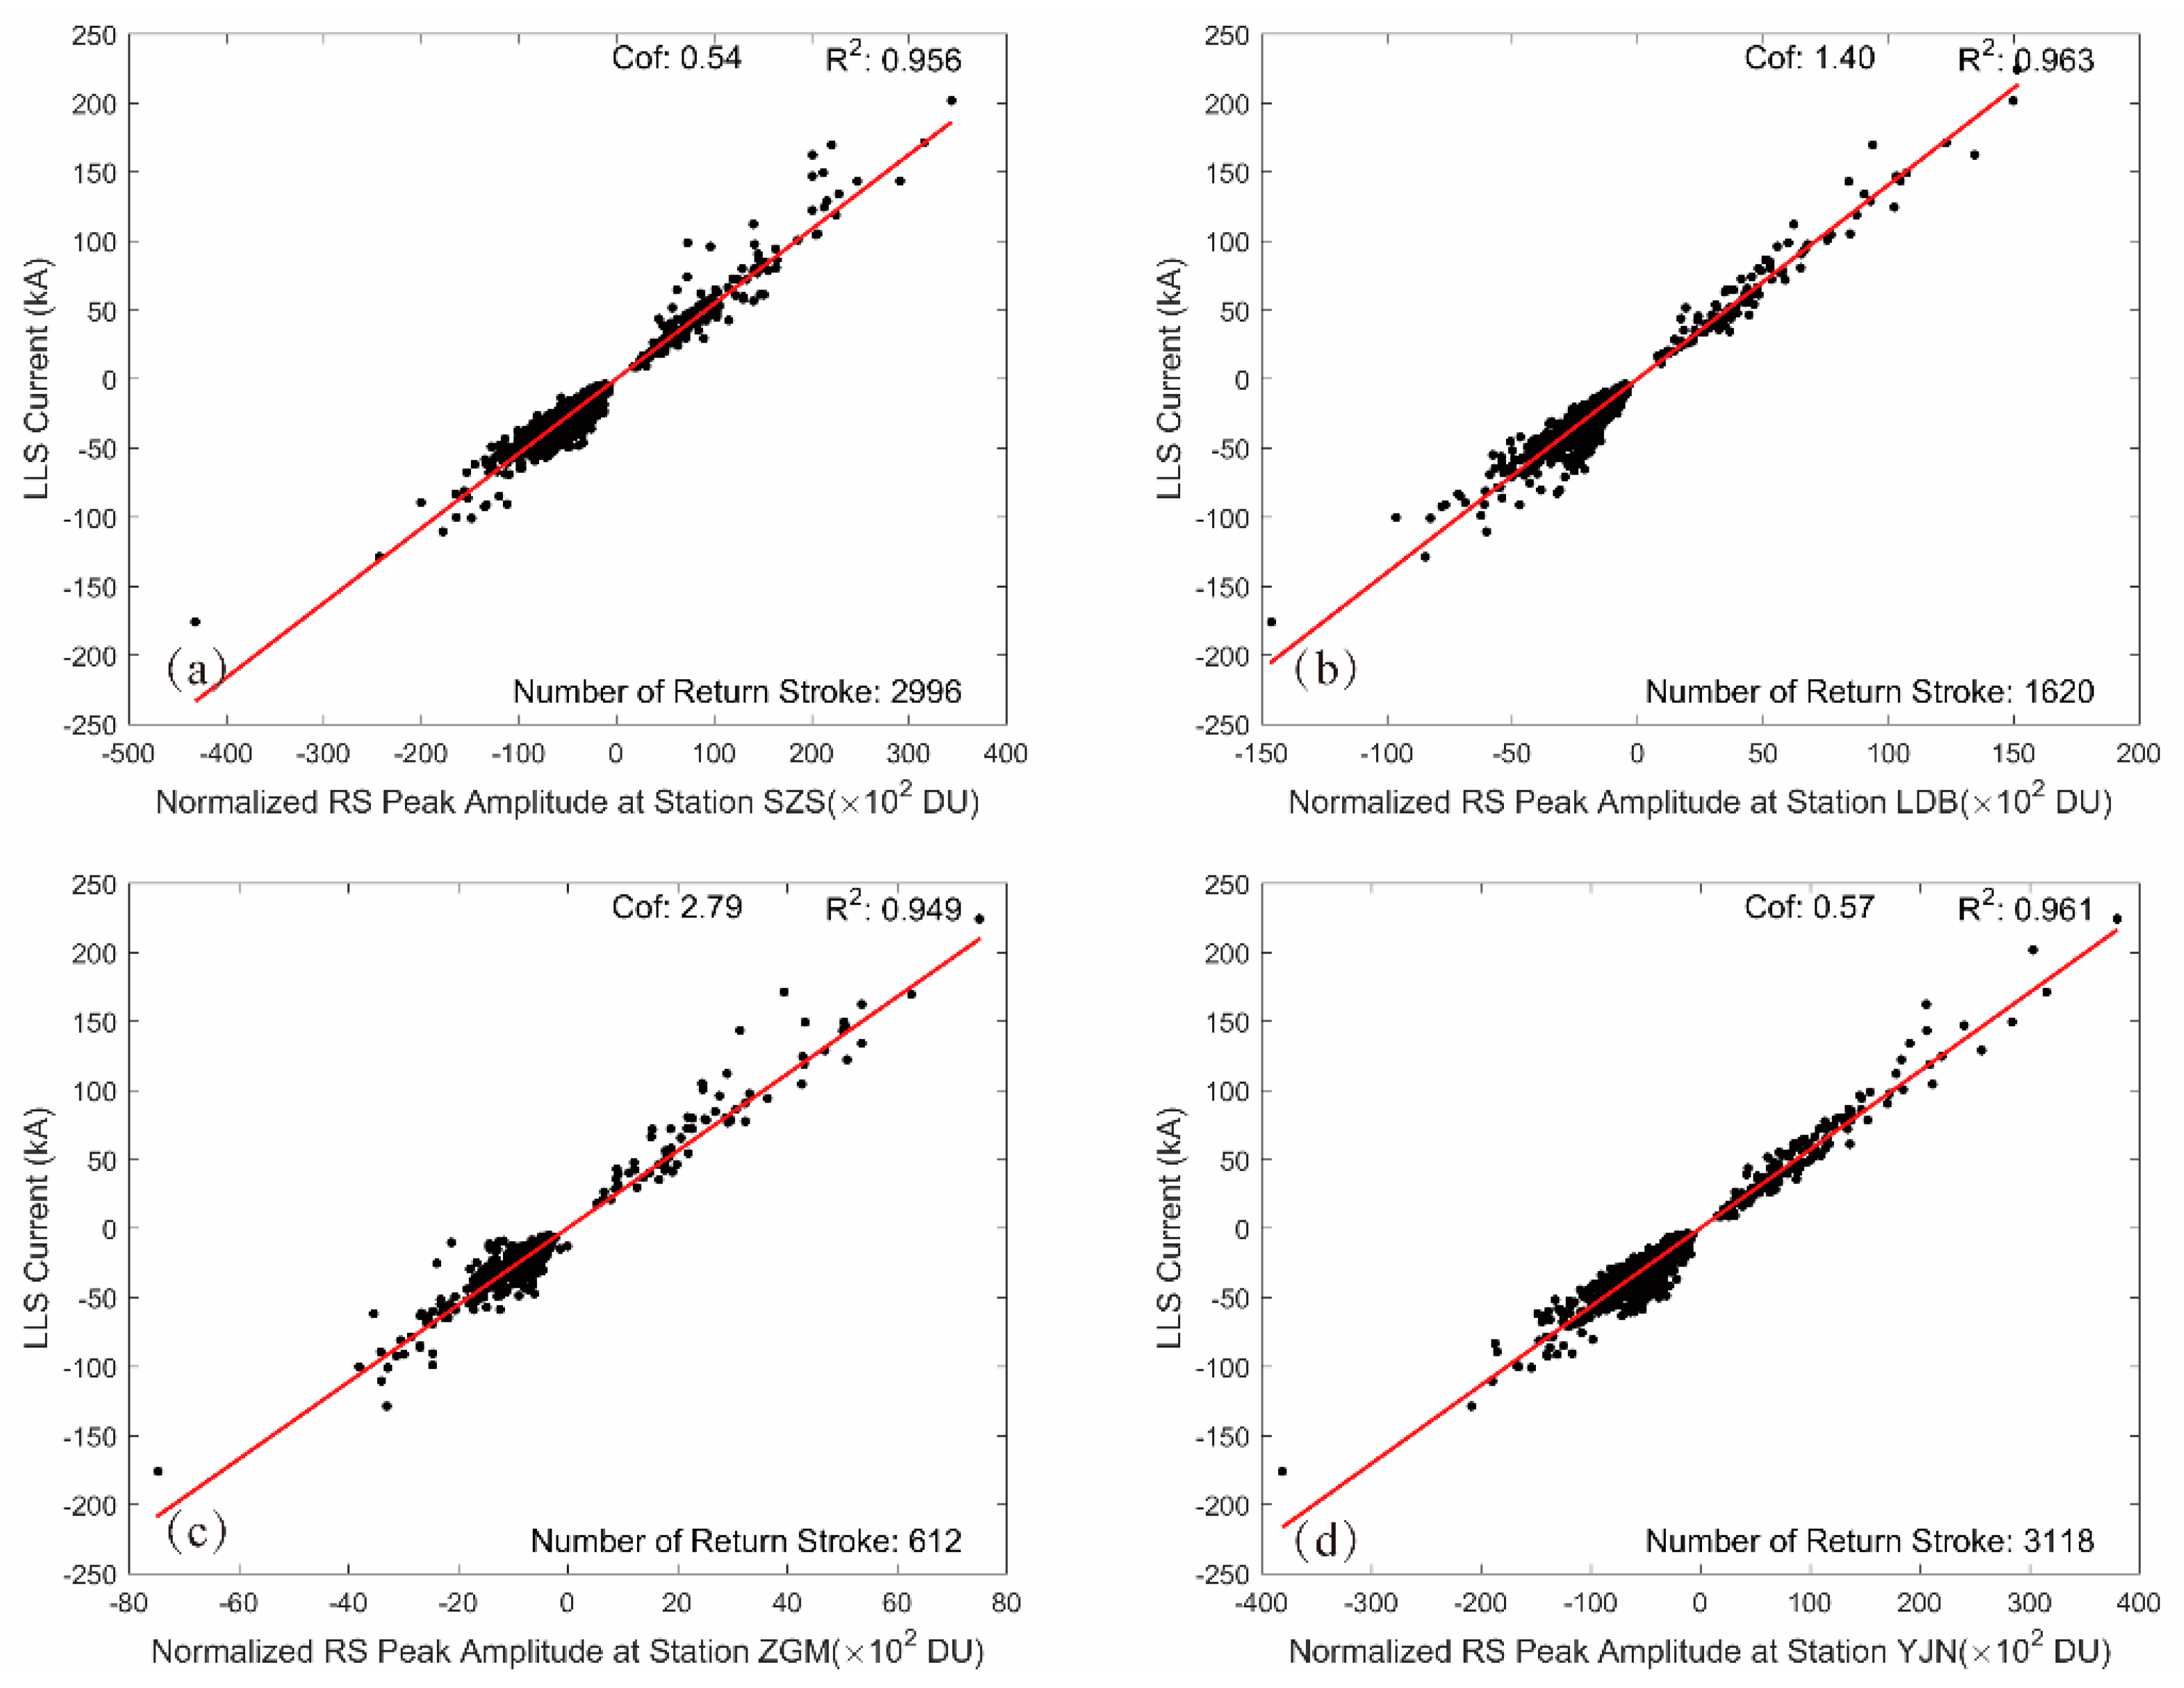
3.2. Estimation of RS Current

There are two steps for converting from RS peak magnitudes in digital units (DU) to RS peak currents in kiloamperes (kA). First, a well-known fact is that the radiation field of RS peak magnitudes are inversely proportional to the distance. Therefore, peak magnitudes of RS measured at each site can be rang-normalized to 100 km (km), which is calculated by multiplying RS peak magnitudes by r/100, where r is the horizontal distance in km between the RS and the specific site. Moreover, r should satisfy the relation r > 50 km because for r < 50 km, the RS pulse may be distorted by electrostatic and induction electric fields. The detailed normalization procedure is similar to the method provided in the supporting information of Shi et al. [15] or Appendix A in Wu et al. [23].
Second, the transformation from the normalized RS peak magnitudes to the estimated currents is based on time-matching with a modest number of RS from the lightning location system (LLS) operated by the State Grid Electric Power Research Institute. This LLS provides plane position and time for each located RS. The performance evaluation for the LLS has been conducted by Chen et al. [31] through the triggered lightning experiment in which the currents of RS in triggered lightning flashes were measured accurately. The results showed that the absolute percentage error of peak currents from LLS was 16.3% on average, indicating the high reliability of the RS current estimation.
RS events from the Ningxia FALMA and the LLS are matched with a tolerance of 1 μs. To avoid the other discharge events being misidentified as RS, we manually examined all the matched RS events. Eventually, 3,729 RS events in the two thunderstorm days are selected.
For each site, we estimated the conversion coefficients between the normalized RS peak magnitudes and RS peak currents, as the examples shown in Figure 4. The black scattered dots in Figure 4 correspond to each matched RS’s normalized peak amplitude and LLS current. The red lines represent the fitted regression curves. The conversion coefficients are estimated through the slope of the red fitted lines. The statistics of RS peak currents observed by the Ningxia FALMA will be given in Section 5.

4. Statistics of RS Pulse Parameters

In the two studied thunderstorm days, we observed 17,225 RS events with 685 and 16,540 of them belonging to positive and negative ones, respectively. Each RS can be detected by multiple FALMA sites. As a result, a total of 8280 positive and 195,860 negative RS pulses were found and then used to analyze the pulse parameters including 10-to-90% rise time, half-peak width, 90-to-10% fall time, and zero-crossing time. Note that in our study, we do not make a distinction between first and subsequent RS due to the huge number of waveform samples and the extremely wide RS geographic distribution.

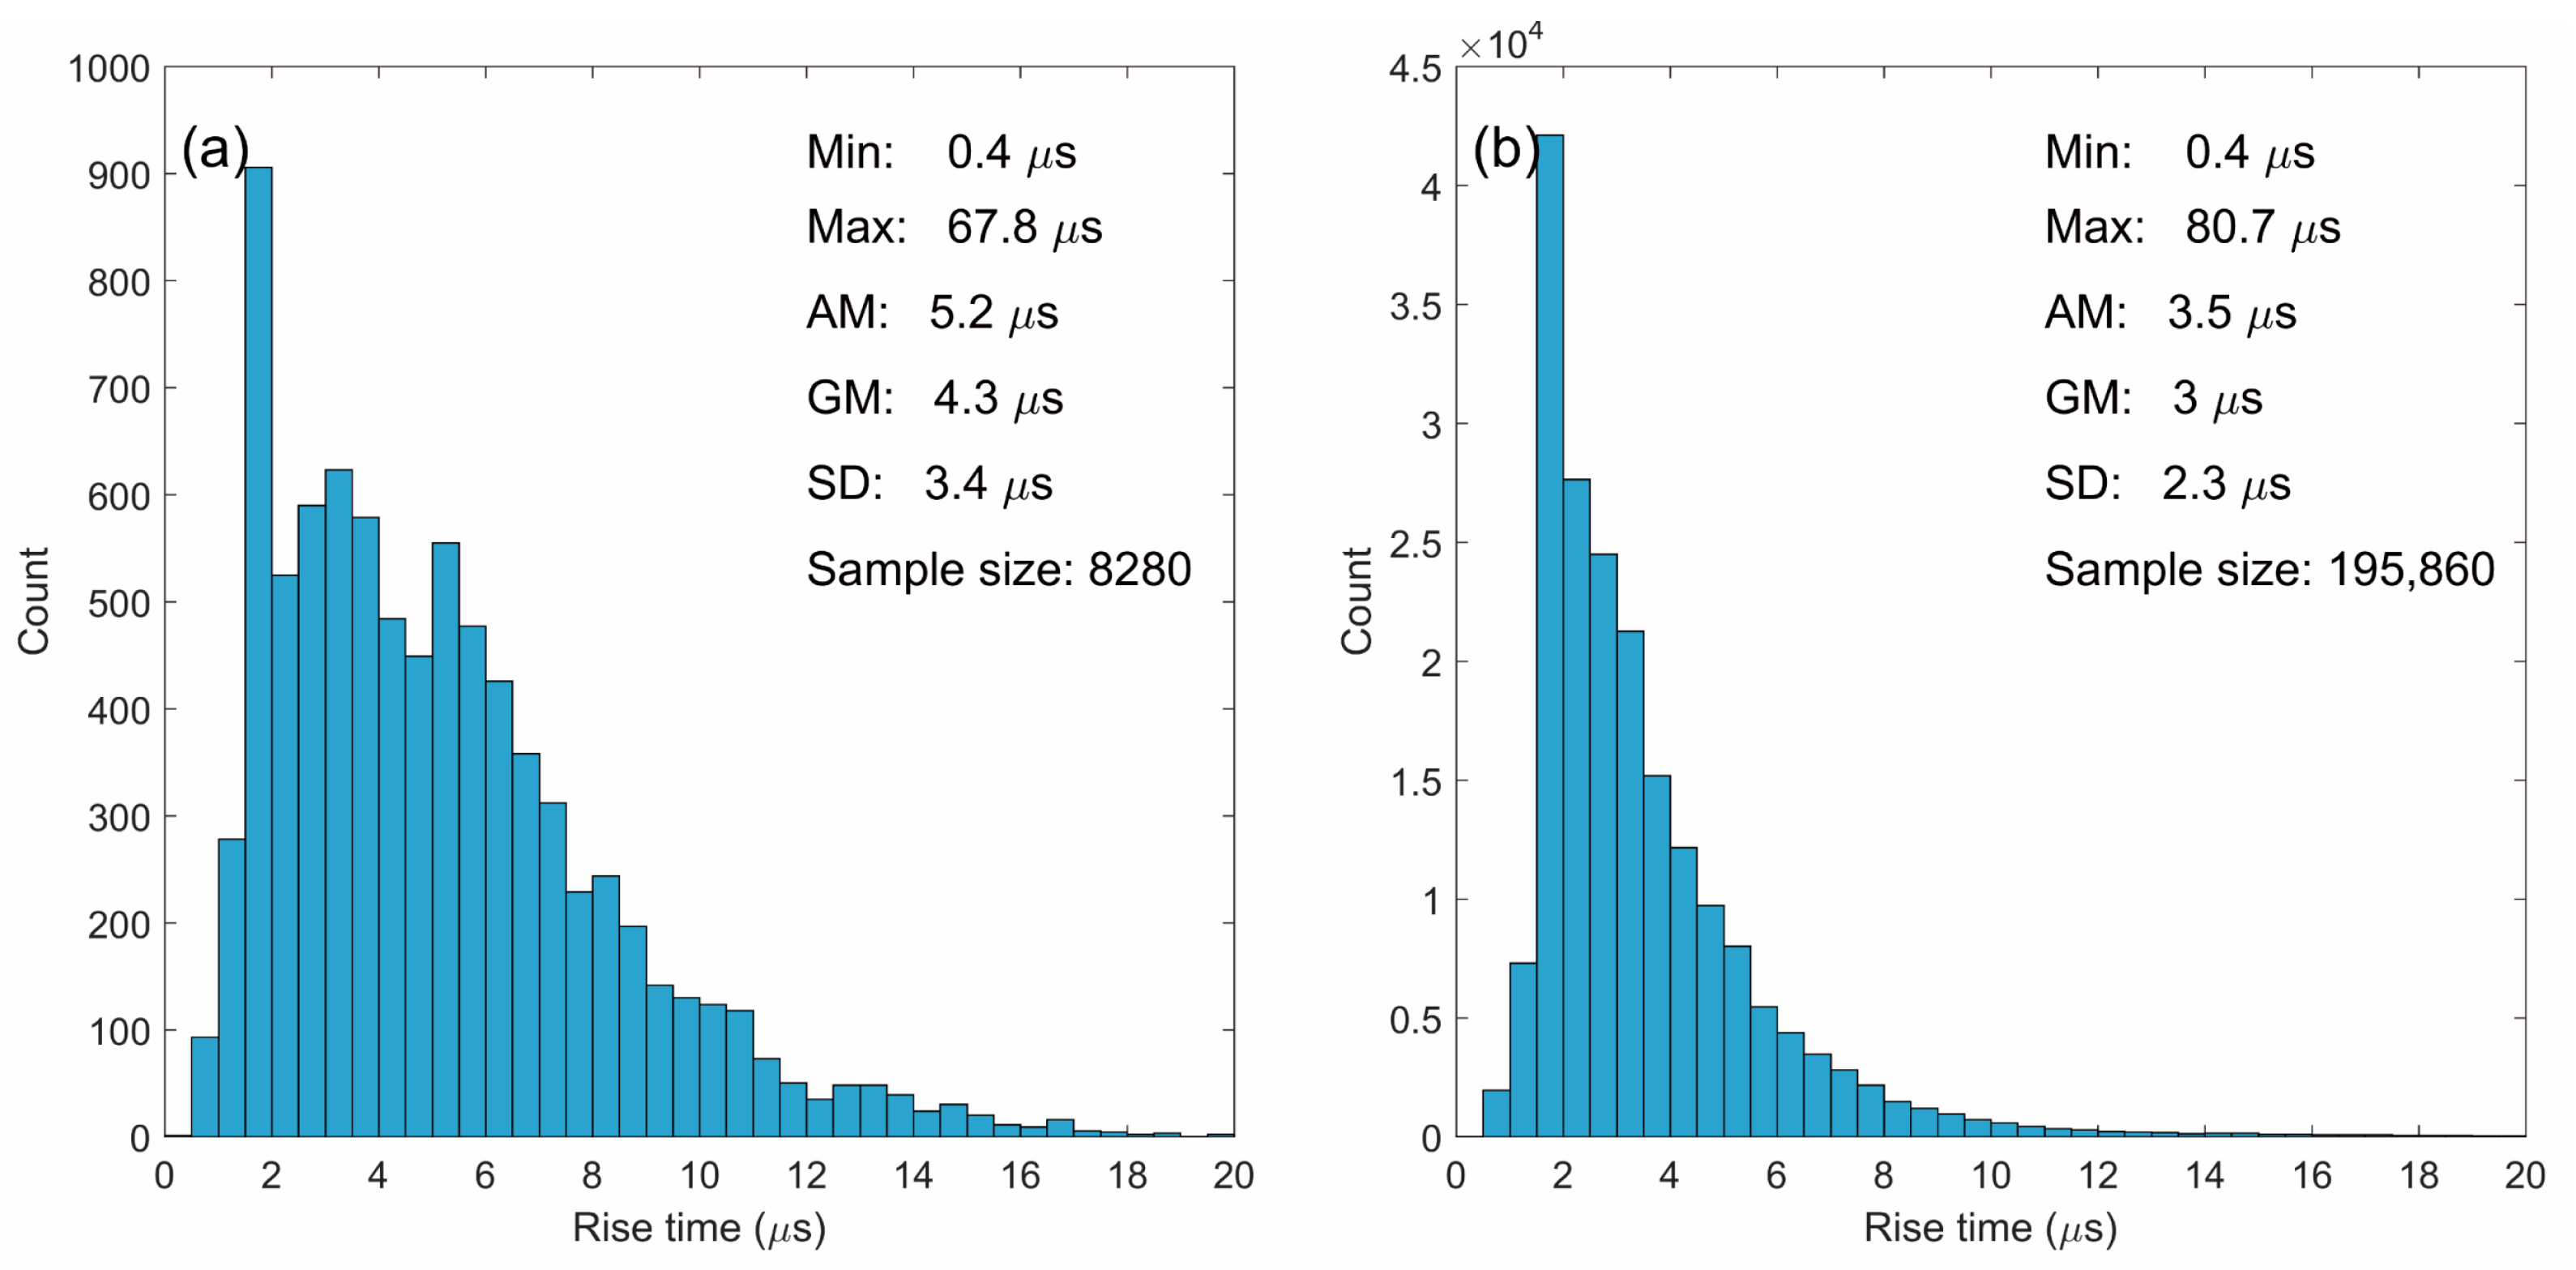
4.1. 10-to-90% Rise Time

The histograms of the 10-to-90% rise times in positive and negative RSs are shown in Figure 5. The arithmetic mean (AM) and geometric mean (GM) values for positive RS ones are 5.2 and 4.3 μs, respectively. A detailed comparison of rise time in various studies is given in Table 1. We can see that the average values in this study are larger than that in Nag and Rakov [32] but apparently smaller than those in Hoko et al. [33], Schumann et al. [34] and Qie et al. [35].
Compared to positive ones, 10-to-90% rise times of negative RSs appear to be smaller with AM and GM values of 3.5 and 3 μs. As seen in Table 1, the mean values obtained in this study, in general, tend to be one or more times larger than the results in Master et al. [36] and Ding et al. [37]. The previous studies stated that subsequent RS in both natural flashes and triggered lightning flashes have relatively shorter rise time with the AM values of around 1.5 μs (Uman et al. [38]; Mallick et al. [39] and Wang et al. [28]), while the first RS have longer rise times (Haddad et al. [30]; Ding et al. [37]). As shown in Figure 5, the rise times in both positive and negative RSs have the largest count in the interval of [1.5, 2], indicating a high percentage of the subsequent RS. Hence, we speculate that the mix of first and subsequent RSs in our dataset should be one of the possible reasons for the differences between our statistical results and previous studies.

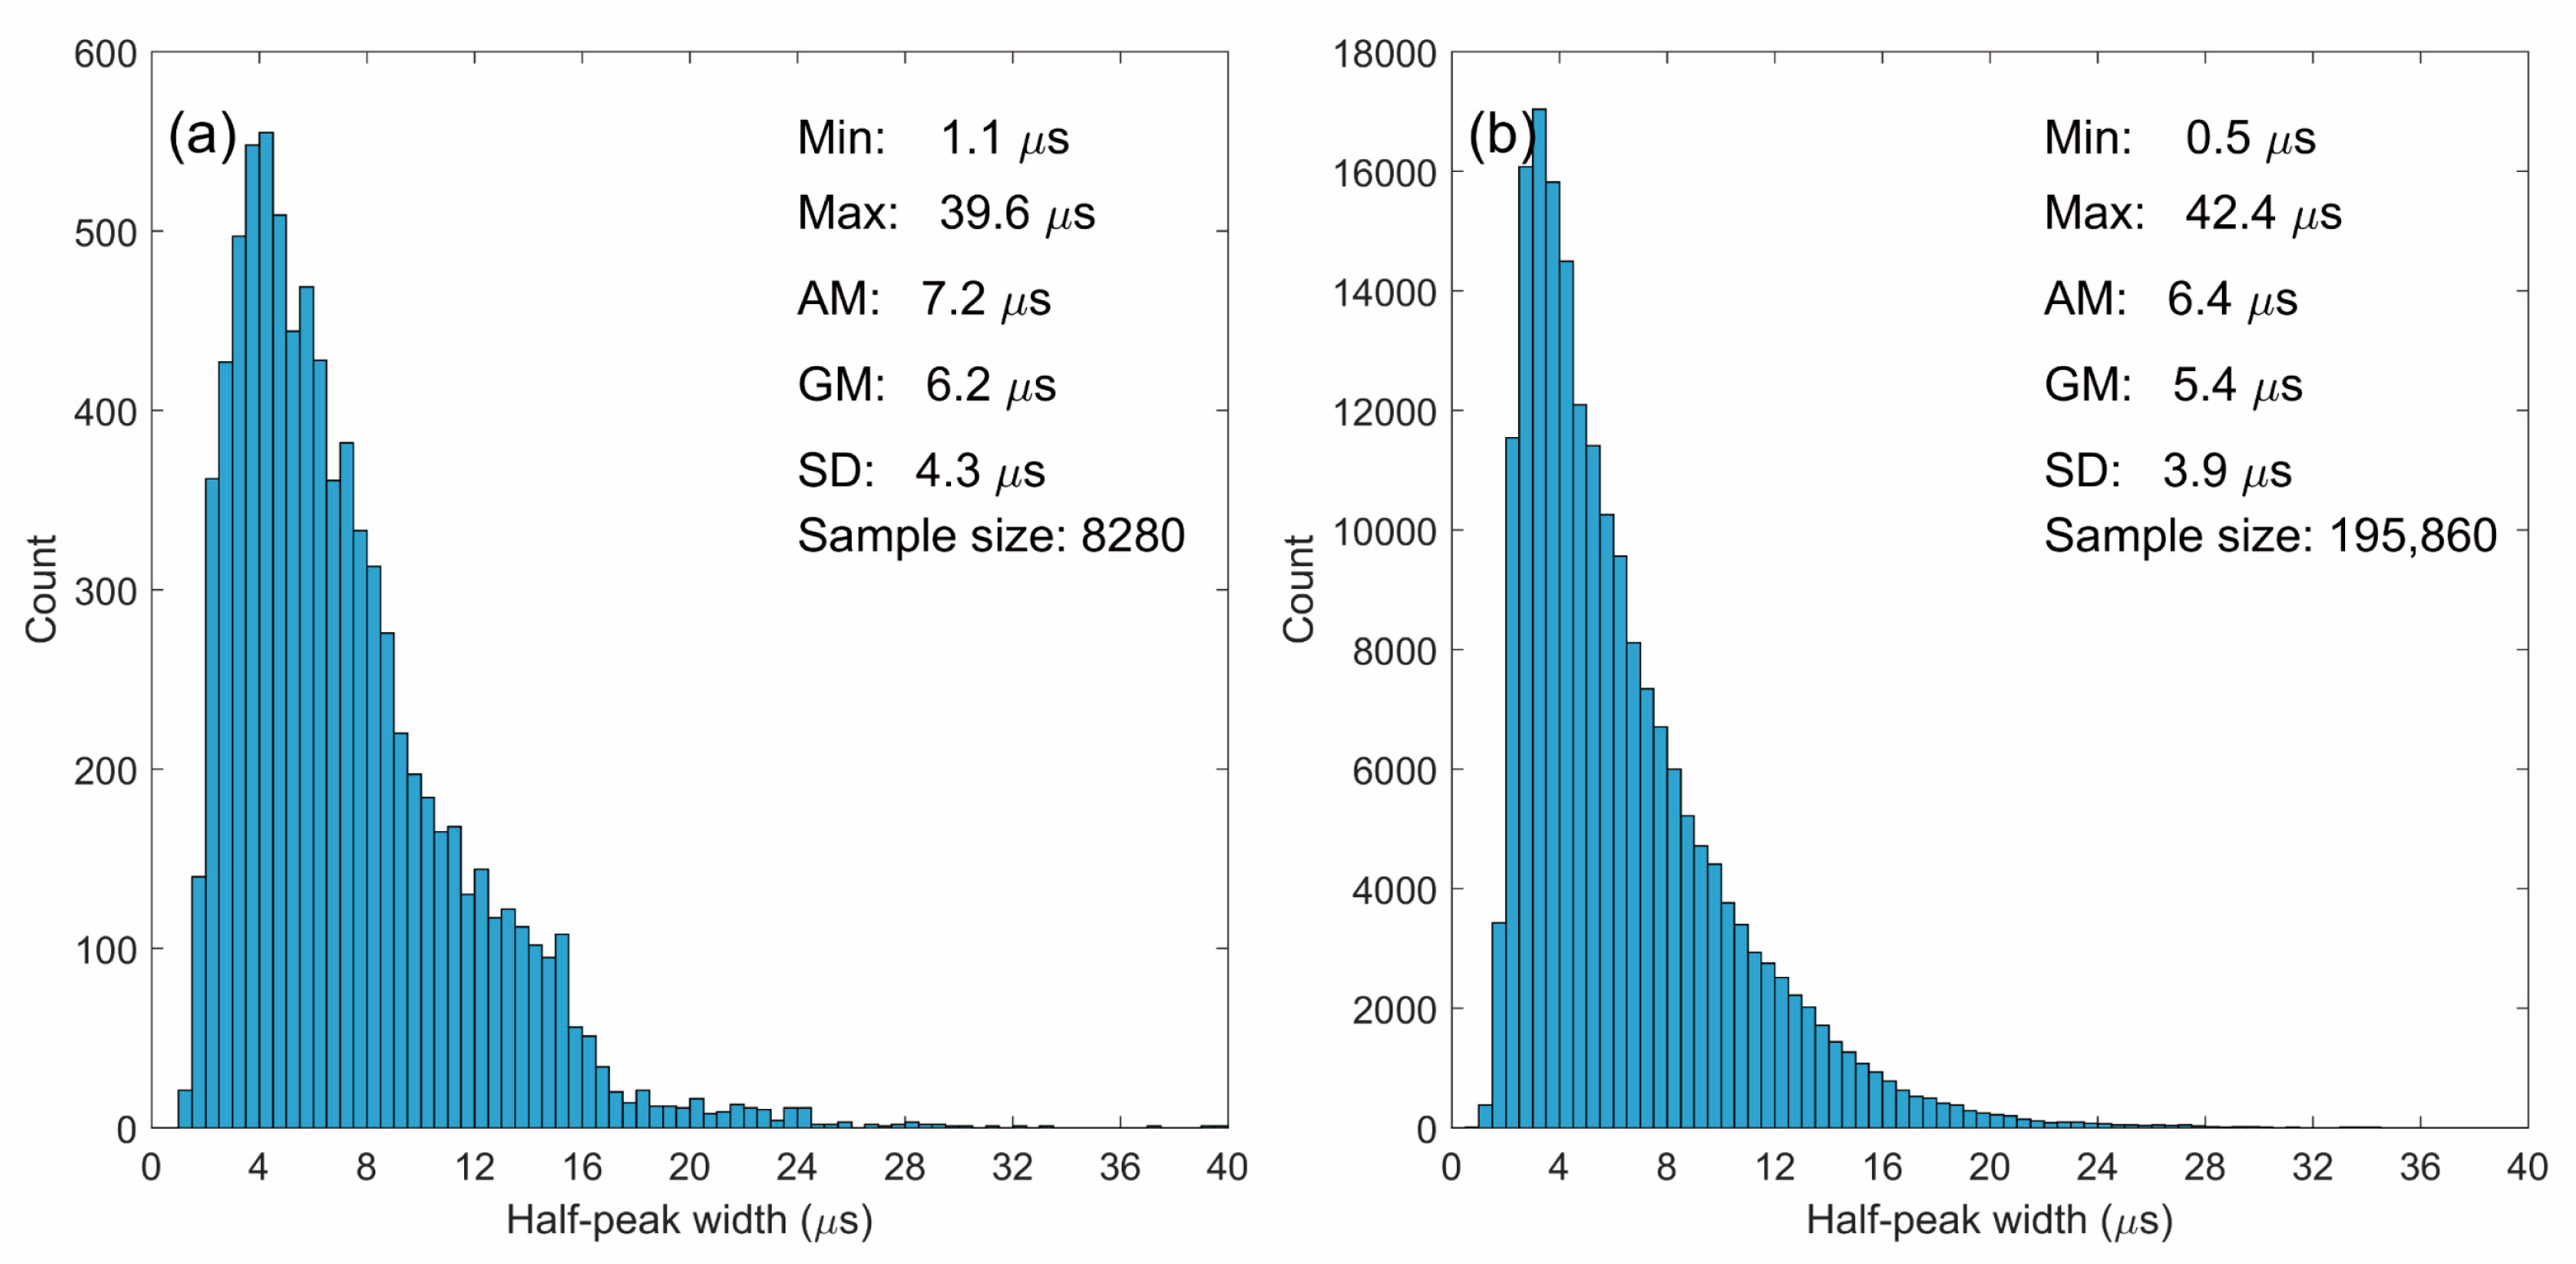
4.2. Half-Peak Width

The statistics of the half-peak width are given in Figure 6. The AM (GM) values for positive and negative RSs are 7.2 (6.2) μs and 6.4 (5.4) μs, respectively. The mean half-peak width tends to be slightly wider in the positive RS than in the negative RS.
Similar to Section 4.1, a detailed comparison of the half-peak width among various studies is shown in Table 2. The average half-peak widths in both positive and negative RSs are apparently larger than the results in the majority of the previous studies but quite similar to the results recently obtained by Ding et al. [37]. As found by Ding et al. [37], natural flashes have a much wider half-peak width than rocket-triggered lightning flashes. We speculate that the different lightning data sources should be one possible factor that attributes to the difference of half-peak width among various studies. Other possible factors will be discussed in Section 6.

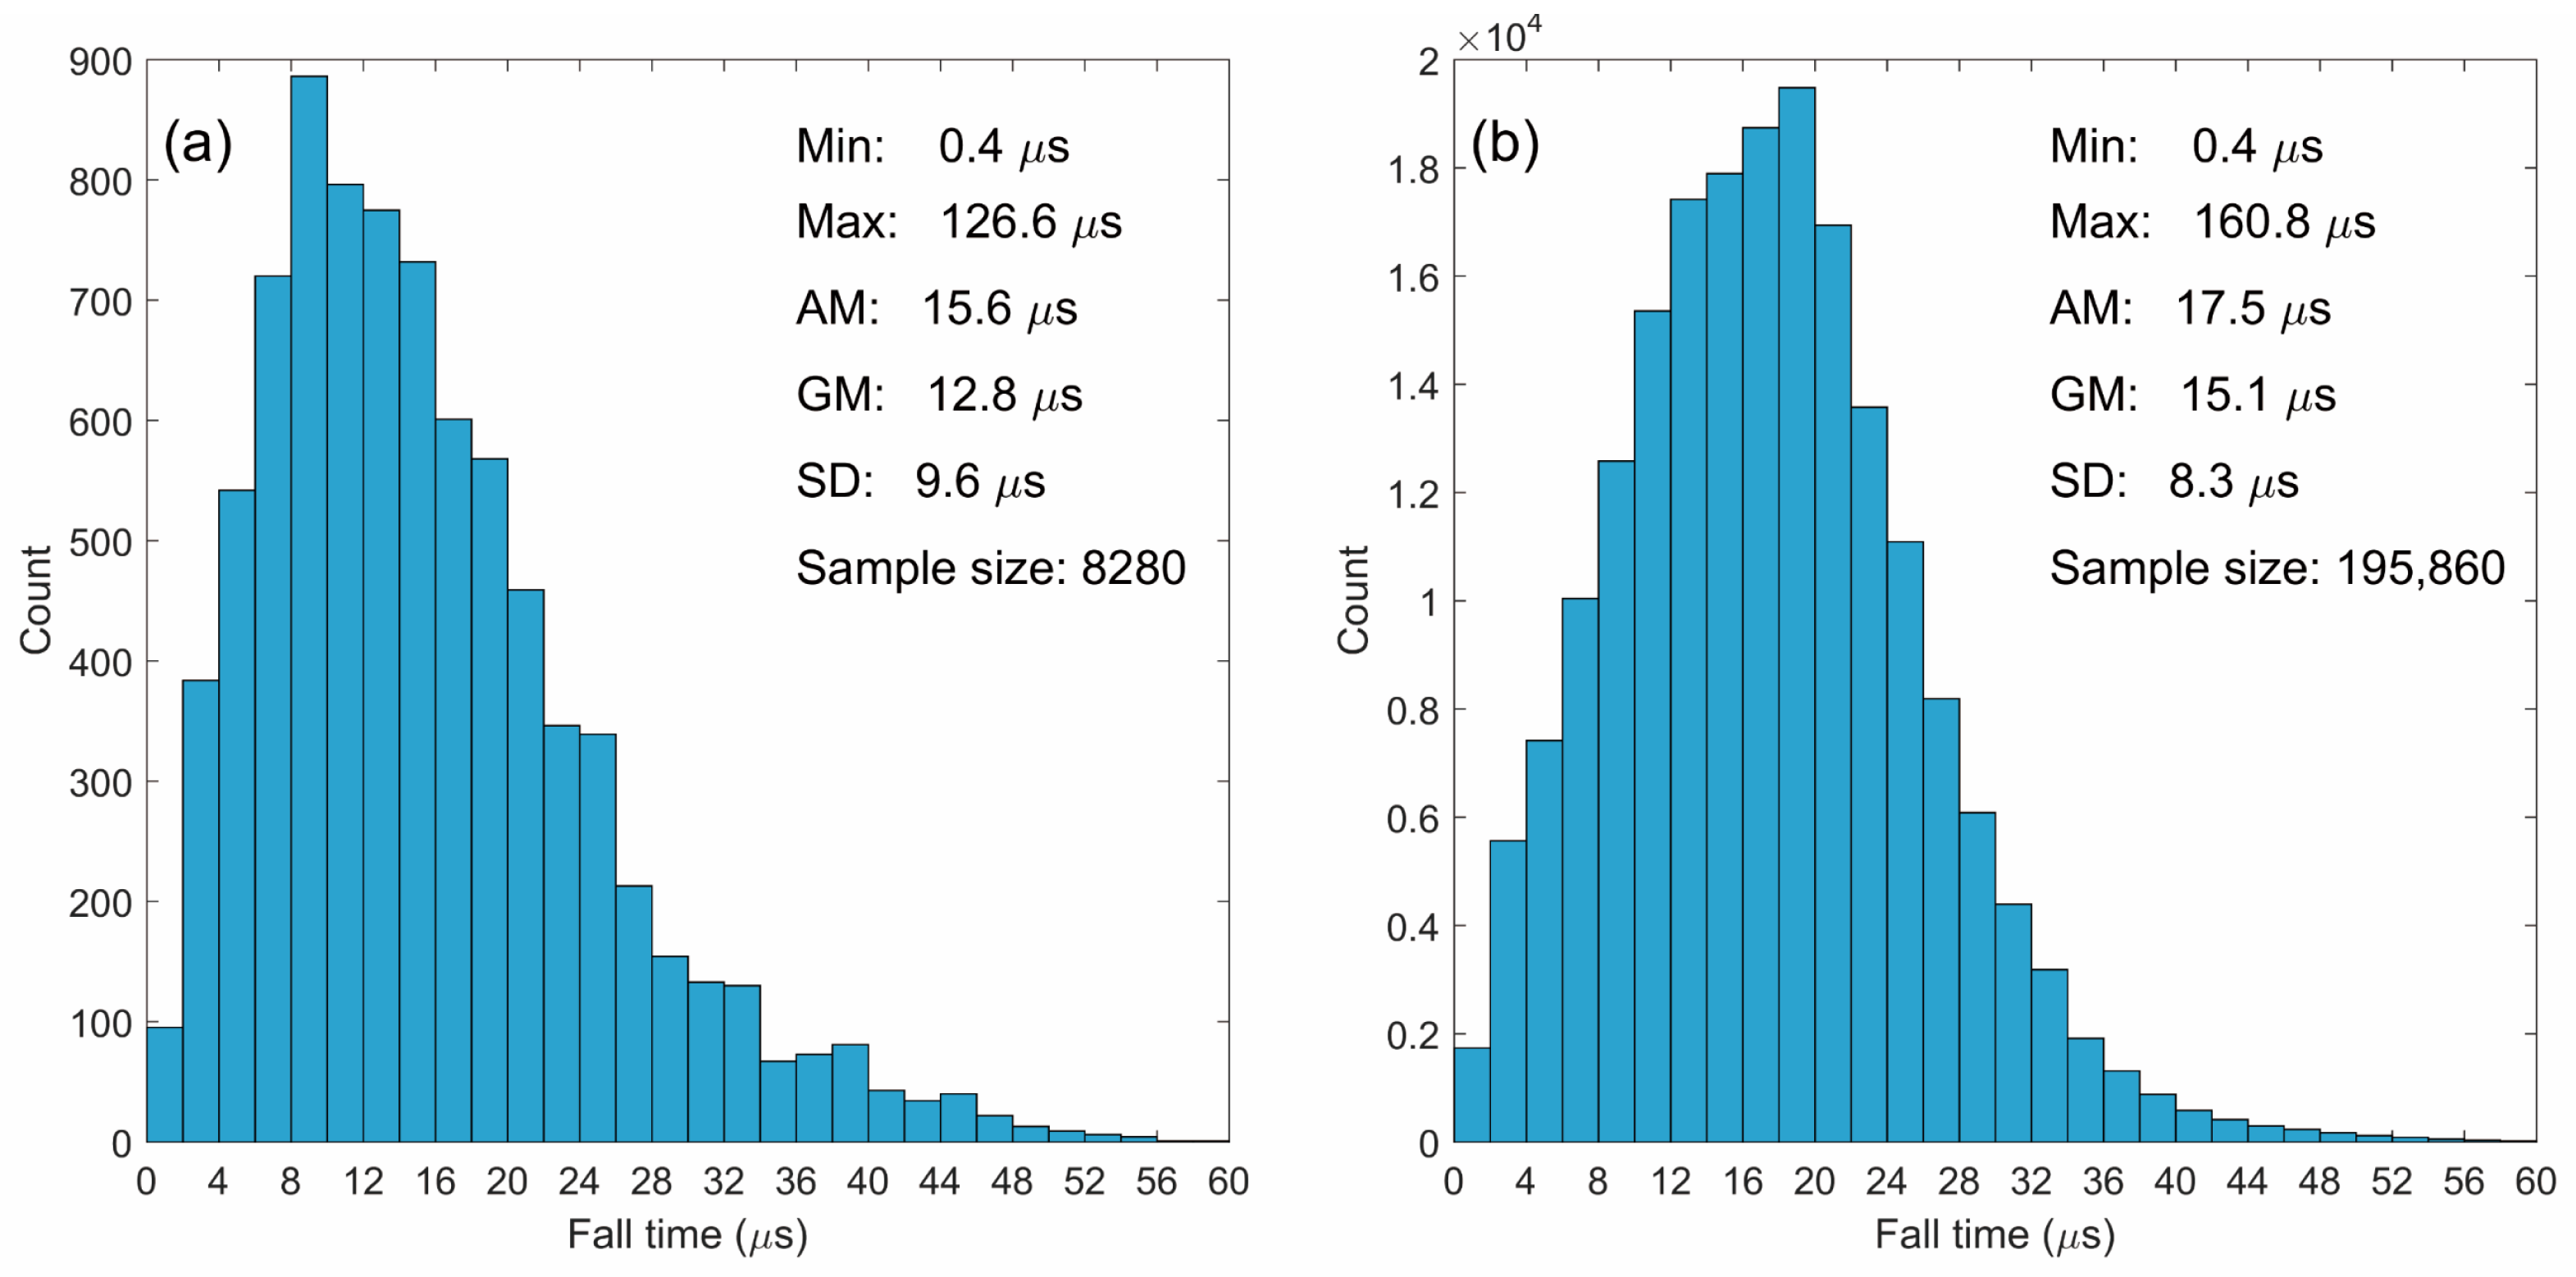
4.3. 90-to-10% Fall Time

Figure 7 shows the histograms of the fall time of positive and negative RSs. The AM and GM fall times in positive RSs are 15.6 and 12.8 μs. The largest count occurs at the interval of [10,12]. Compared to positive RSs, the histogram of fall time in negative RSs distributes much differently. The AM and GM fall times are longer in the negative RSs than in the positive RSs (AM: 17.5 vs. 15.6 μs; GM: 15.1 vs. 12.8 μs). The largest count occurs at the interval of [18,20].
A comparison of the fall time among various studies is also shown in Table 3. Overall, our results of both positive and negative RSs are similar to Li et al. [40] but much smaller than the statistical results in Liu et al. [41].

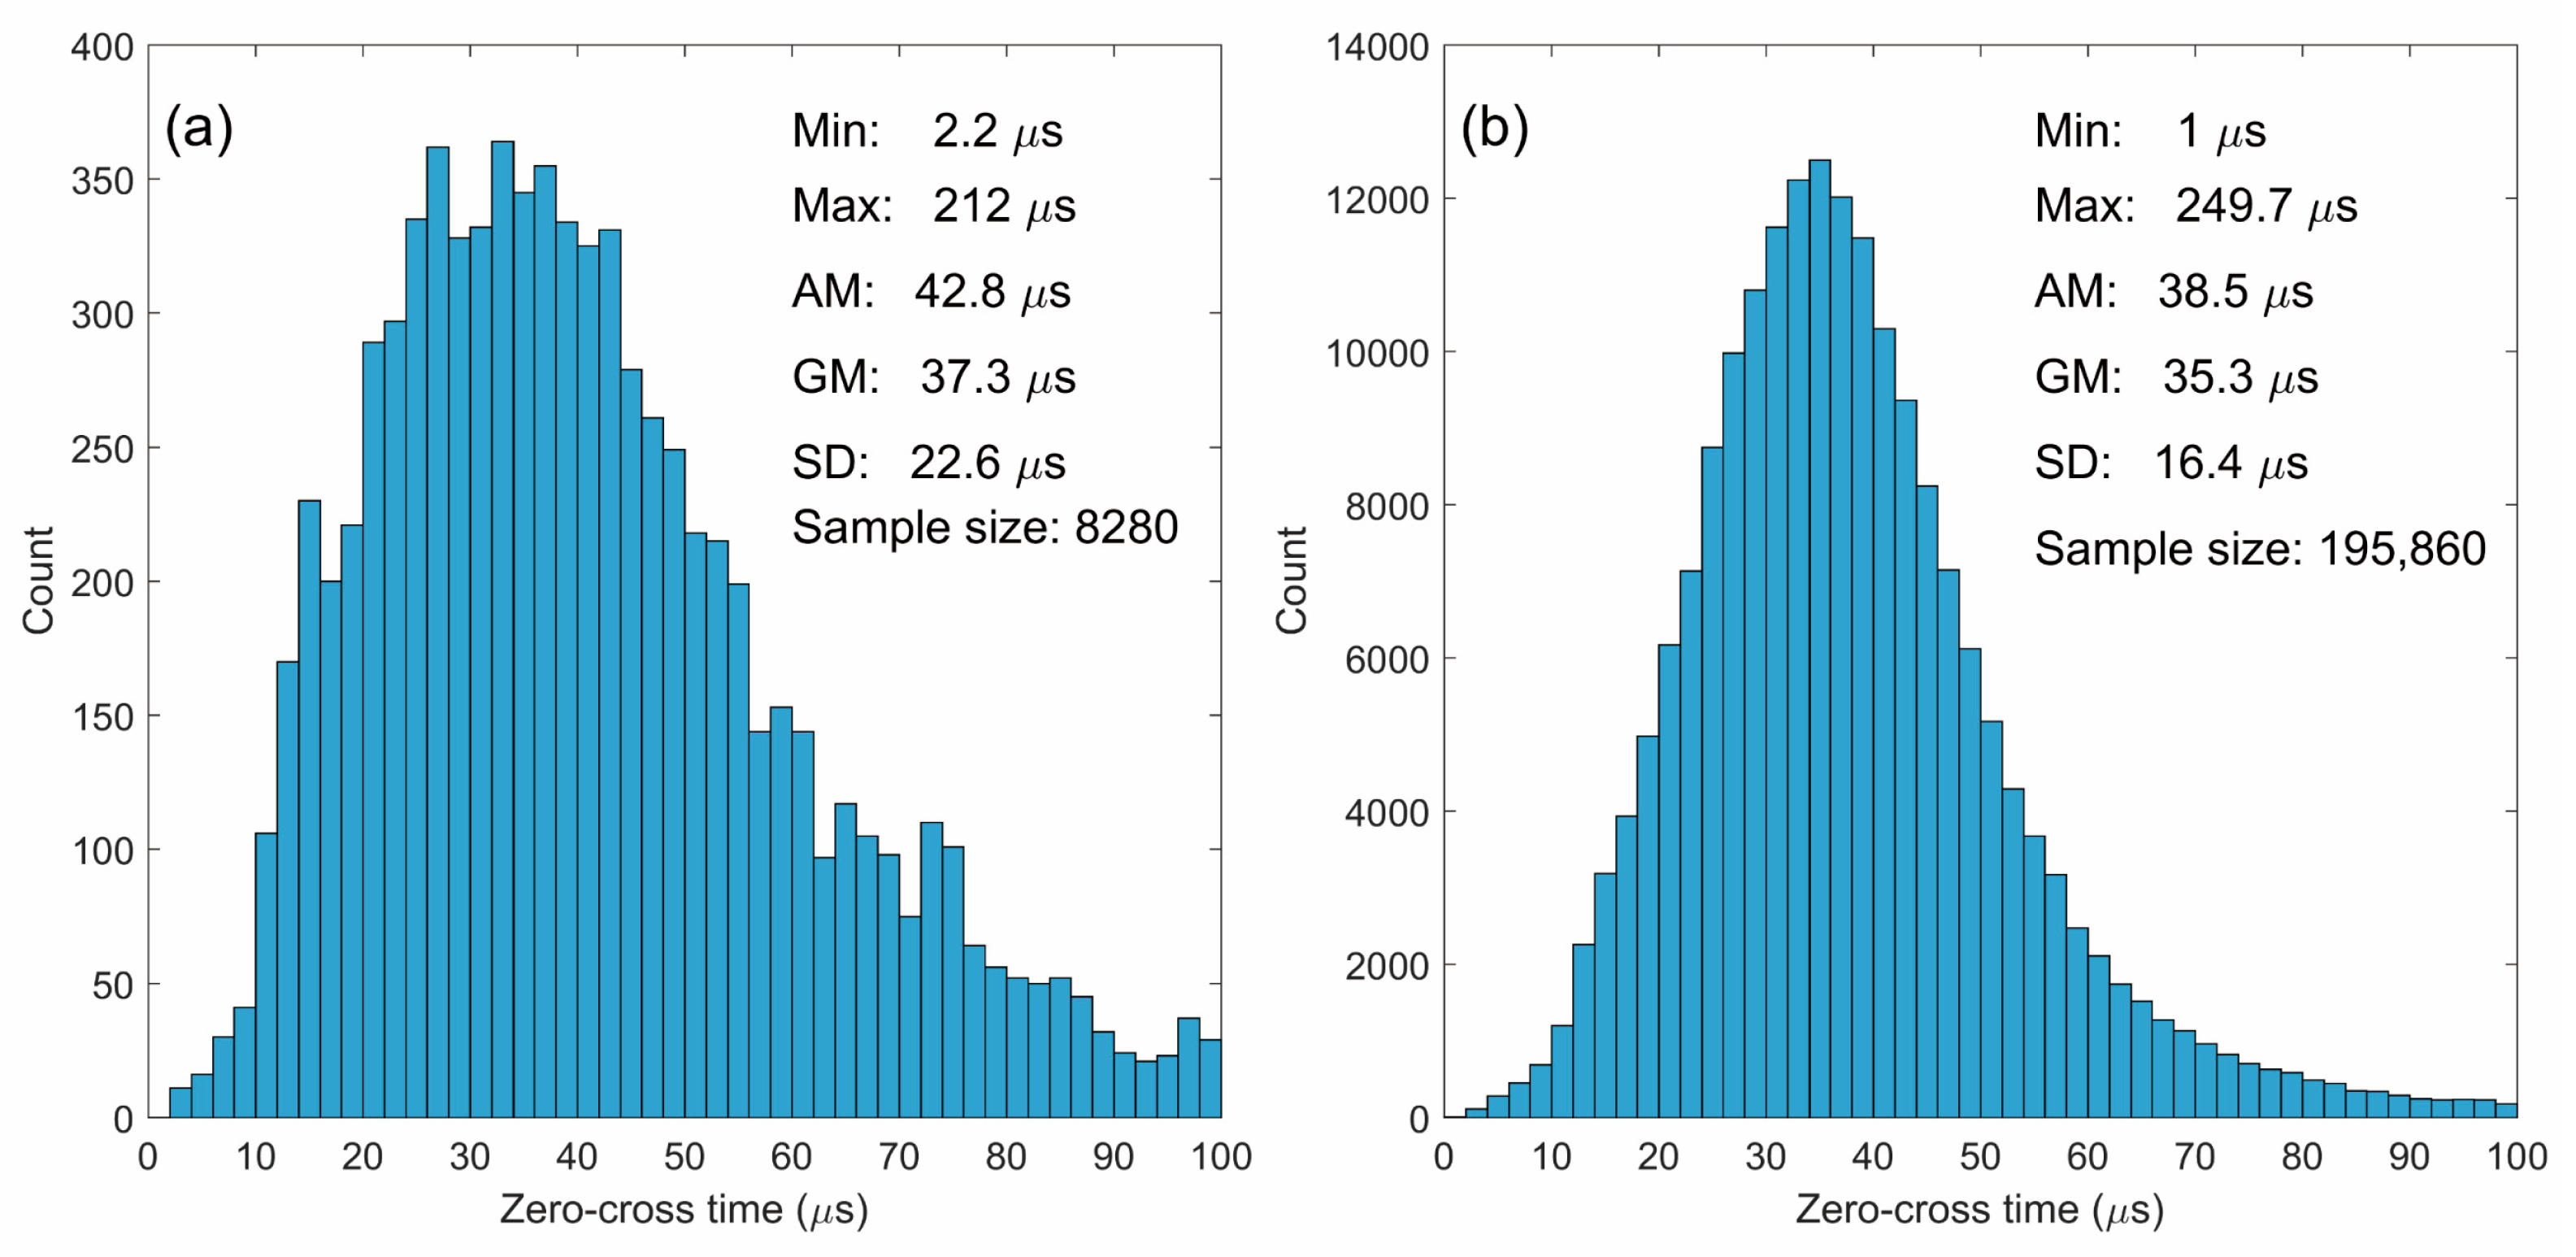
4.4. Zero-Crossing Time

Figure 8 is the statistical results of zero-crossing time in positive and negative RSs. In general, the positive RS has a longer zero-crossing time than the negative RS (AM: 42.8 vs. 38.5 μs; GM: 37.3 vs. 35.3 μs), which is similar to Lin et al. [42]. If compared to those previously reported as seen in Table 4, our statistical results tend to be smaller. As suggested by Haddad et al. [30], the relatively small zero-crossing times should be related to the insufficiently long instrumental decay time constant. Since the Ningxia FALMA has a time constant of 200 μs, the obtained zero-crossing times may be underestimated.

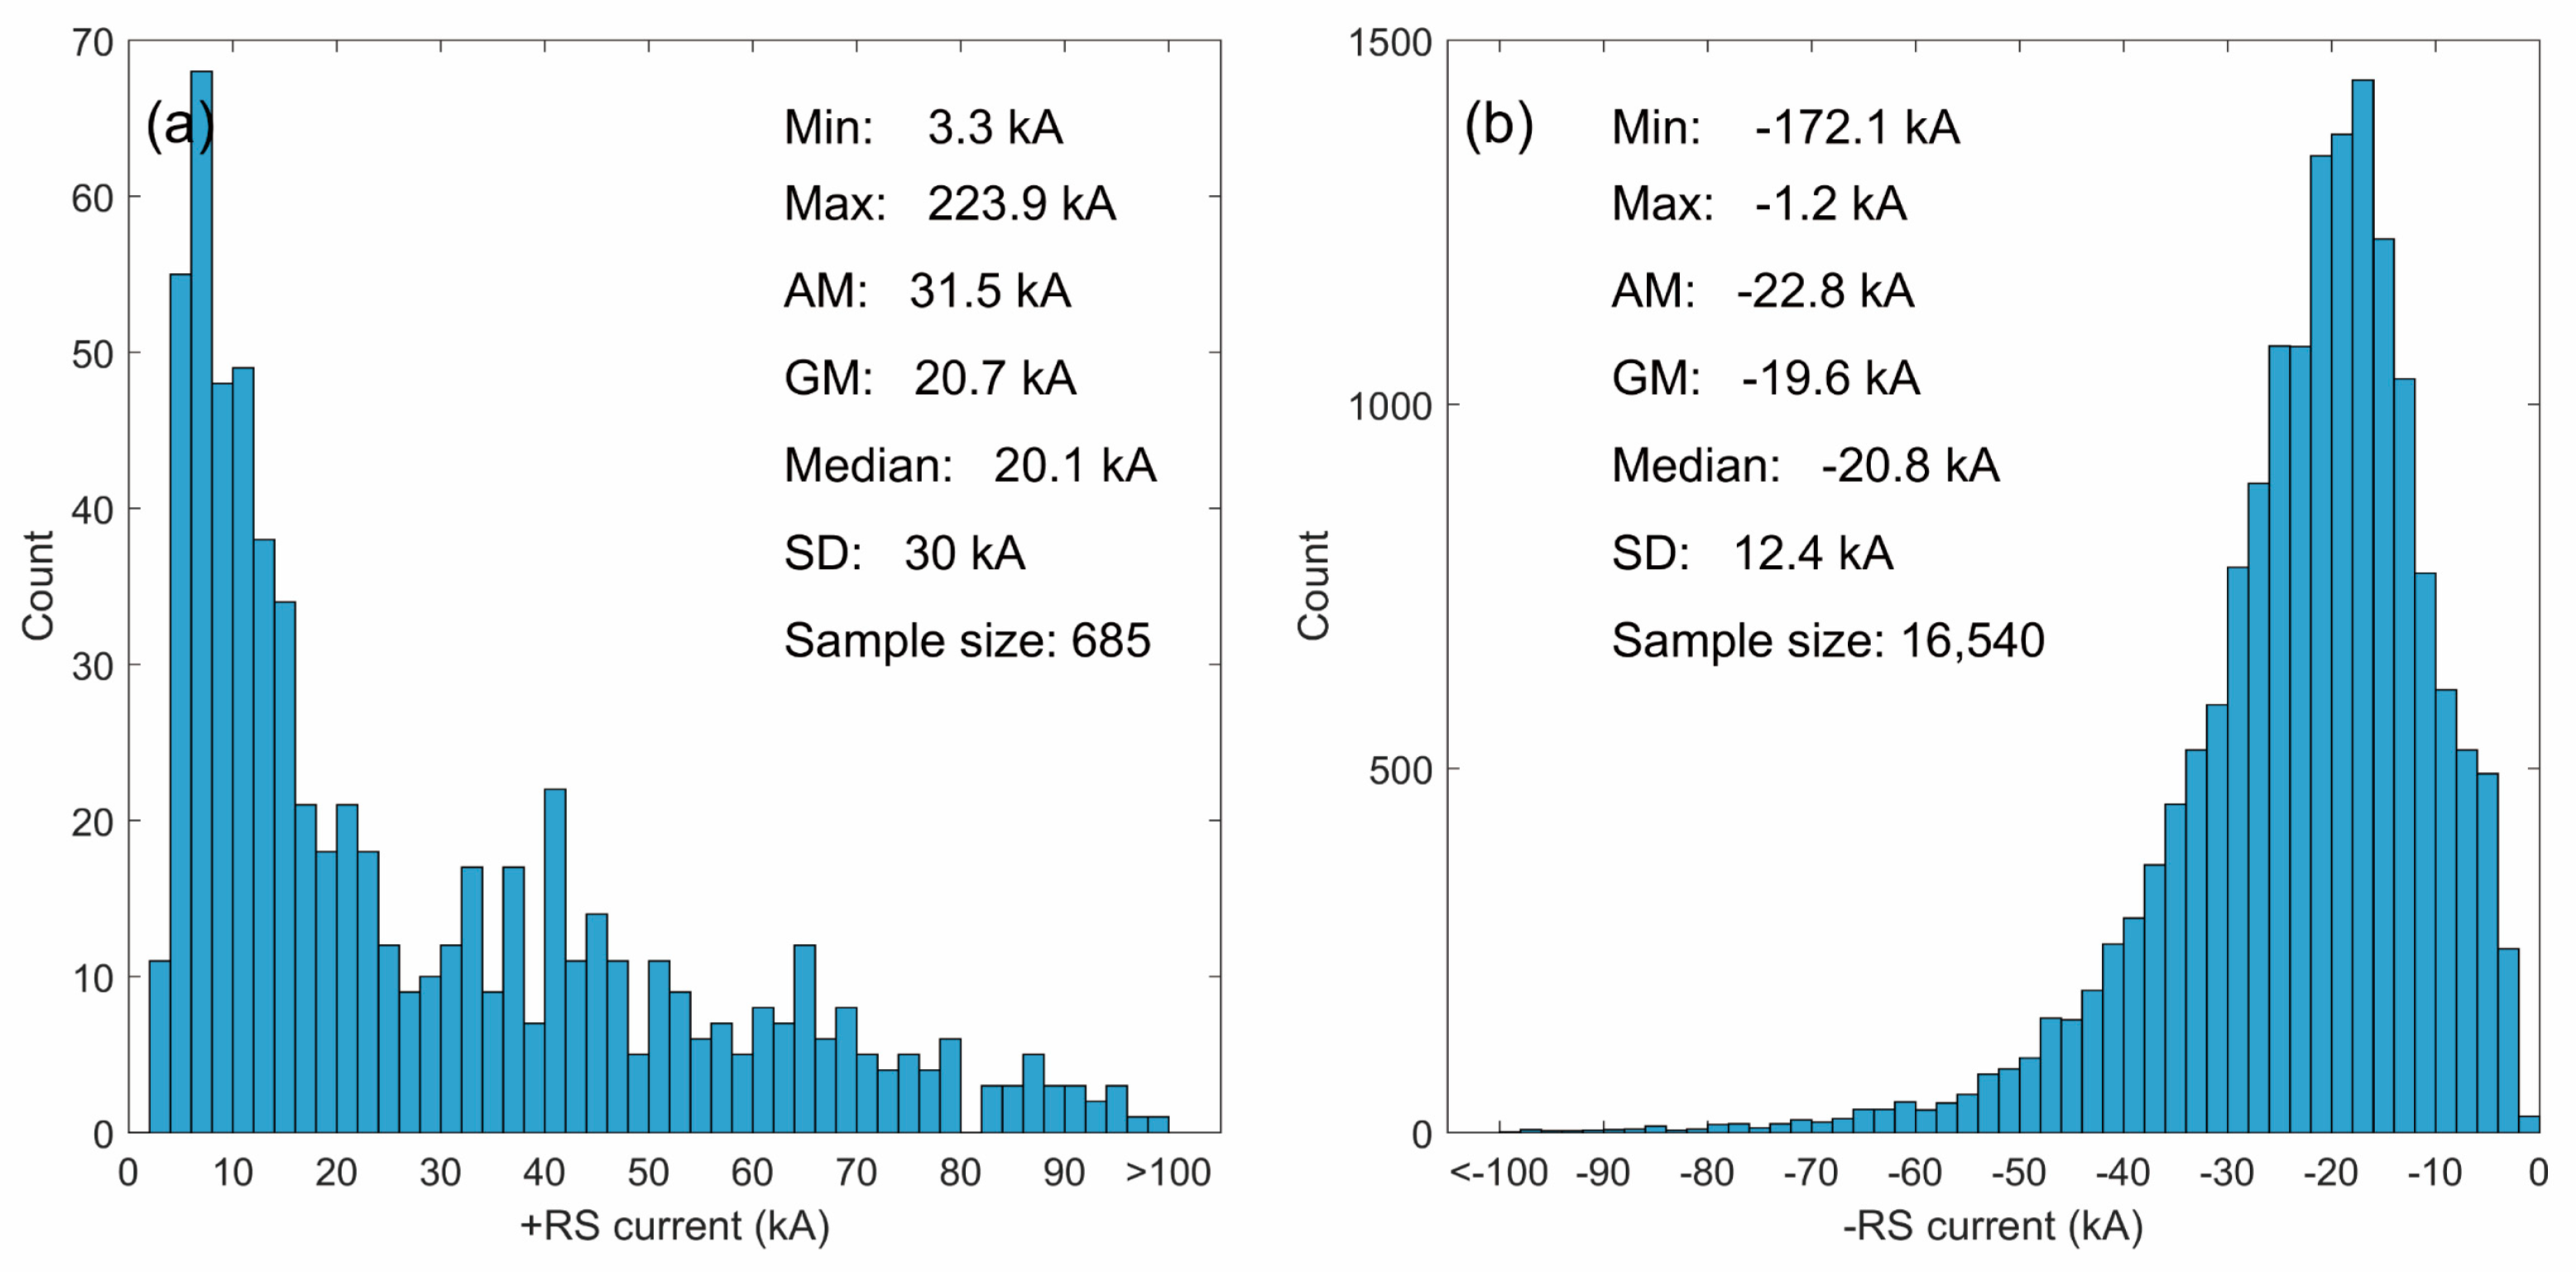
5. Statistics of RS Peak Currents

The statistics of RS peak currents are shown in Figure 9. The AM value of positive RS peak currents is 31.5 kA, which is larger than that of negative RS peak currents (AM: 31.5 versus 22.8 kA). It is interesting to note that the GM and median values for positive and negative RS peak currents are almost the same (GM: 20.7 versus 19.6 kA; Median: 20.1 versus 20.8 kA). In Figure 9a, the largest count of positive RS peak currents distributes at the interval of [6,8]. Cummins et al. [44] inferred that not all of those events with currents between 5 and 15 kA are CG flashes and recommend that positive discharge events with currents smaller than 10 kA should be treated as cloud discharges. However, since all of the positive RS pulses in this study are examined manually, we are confident enough to exclude the misclassified in-cloud discharge pulses. In our dataset, the positive RSs with currents below 10 kA reached up to a percentage of 27% (182/685). Therefore, we are prone to take the small positive discharge pulses into account seriously.
The comparison of the RS peak currents is given in Table 5. For positive ones, the AM values are comparable to that in Zhang et al. [45] and Berger et al. [46] but much smaller than that in Nag et al. [47]. We suggest that a considerable sample count difference caused the significant oscillation of the statistical results. As a comparison, the variation of the statistics for the negative RSs with enough samples is moderate. The AM/Median negative RS peak currents in our study are apparently larger than subsequent RSs obtained from previous studies (e.g., [46,48] (AM: 22.8 versus 18.6 kA; Median: 20.8 versus 12 kA;) or the mixing of first and subsequent RSs from Zhang et al. [45] (22.8 versus 9.5 kA). The median values of the negative RSs in our data are even comparable to the first RS currents in Nag and Cummins. [49] (Median: 20.8 versus 20 kA). Overall, the RS currents recorded in the Chinese inland regions seem to be relatively larger. To examine this issue, we need to do more rigorous research in the future.

6. Discussion

As summarized in Figure 5, Figure 6, Figure 7, Figure 8 and Figure 9 and Table 1, Table 2, Table 3, Table 4 and Table 5, the pulse parameters and peak currents of RS obviously vary between different studies. Based on comparing the results, it is worth noting two factors, namely the RS distance range and the regions where RS are recorded.
In terms of the effect of the range distance on the pulse parameter, there always exists a debate that both the experimental and simulated results have demonstrated the increasing rise time of RS pulses with the propagation distance of the electric field [50,51,52], while there is no clear distance dependence of the rise time for either triggered lightning flashes in Wang et al. [28] or natural flashes in Haddad et al. [30]. Such a debate motivates us to examine the RS pulse characteristics as a function of distance.
The statistical results are seen in Figure 10. The red and blue scattered dots represent the AM values for the positive and negative RSs that are grouped into distance ranges to show the dependence of pulse parameters on distance. Correspondingly, the red and blue dotted lines show the fitted curves of pulse parameters by distance, with the equation and fitting goodness marked on the upper of each subplot. In Figure 10, all of the pulse parameters containing rise time, half-peak width, fall time, and zero-crossing time apparently exhibit a positive correlation with the distance range. For example, as indicated by Figure 10a, the rise time of positive (negative) RSs increases by 0.6 (0.2) μs for each 100 km increase in distance.
Similar to Leal and Rakov [53] and Li et al. [54], we think that one possible factor contributing to the increasing rise time with distance is the attenuation of high-frequency components during the propagation of electromagnetic waves on the finite conductivity and lossy ground. As a result, the pulses tend to be less sharp. The zero-crossing time shows a slightly decreasing tendency in Leal and Rakov [53] but apparently presents an increasing tendency with distance in Li et al. [54] which is consistent with our results in Figure 10. The reason for the diversity of the zero-crossing time is presently not clear. We speculate that one possible explanation could be the small number of events with a range larger than 200 km recorded in Leal and Rakov [53]. The other results on the RS pulse parameters with range distance are similar to what has been found in Li et al. [54].
Additionally, we also give the recorded RS currents with distance in Figure 11. There is an obvious tendency that the RS recorded from larger distances are toward higher-intensity discharge events, supporting the suggestion in Nag et al. [32].
Another factor that would probably attribute to the statistical disparities among different studies is the observation regions. To verify the RS pulse features as a function of observation regions, we have made a simple comparison of pulse parameters between Gifu, Japan and Ningxia, China. The RS in Gifu was recorded on 22 August 2017. Since positive RSs in Gifu are rarely observed, all of the compared RSs from Gifu and Ningxia are negative and required to be in the same distance range of [0, 150] km. The statistical comparison of pulse parameters is shown in Figure 12. We identified 30,171 and 35,297 RS pulses, respectively in Gifu and Ningxia. On average, RS pulses in Ningxia have longer rise time (3.4 versus 3.2 μs), narrower half-peak width (4.7 versus 6.3 μs), shorter fall time (14.7 versus 21.3 μs), and smaller zero-crossing time (35.4 versus 48.4 μs). All of these statistical disparities between Gifu and Ningxia prove the RS pulse parameters as a function of observation regions.
Finally, we need to point out that by now, as we have not calibrated the RS peak field into the current for the Gifu FALMA, the peak current comparison of RS between Gifu and China is unavailable in this study.

7. Conclusions

We have studied the pulse parameters and peak currents using 17,225 RS events observed in the Chinese inland areas by the Ningxia FALMA. Our main conclusions are summarized as follows.
  • All of the statistical histograms of RS pulse parameters in this study apparently follow the normal distribution. The comparison between the positive and negative RSs shows that on average, the positive RS tends to have a longer rise time (AM: 5.3 versus 3.6 μs), wider half-peak width (AM: 7.3 versus 6.4 μs), shorter fall time (AM: 15.8 versus 17.5 μs), and longer zero-crossing time (AM: 42.8 versus 38.5 μs). Compared to the results in other studies, the fall time and zero-crossing time in this study appear to be shorter, and we suggest that the two parameters should be underestimated due to the limitation of the short time constant of the fast antenna used in the FALMA.
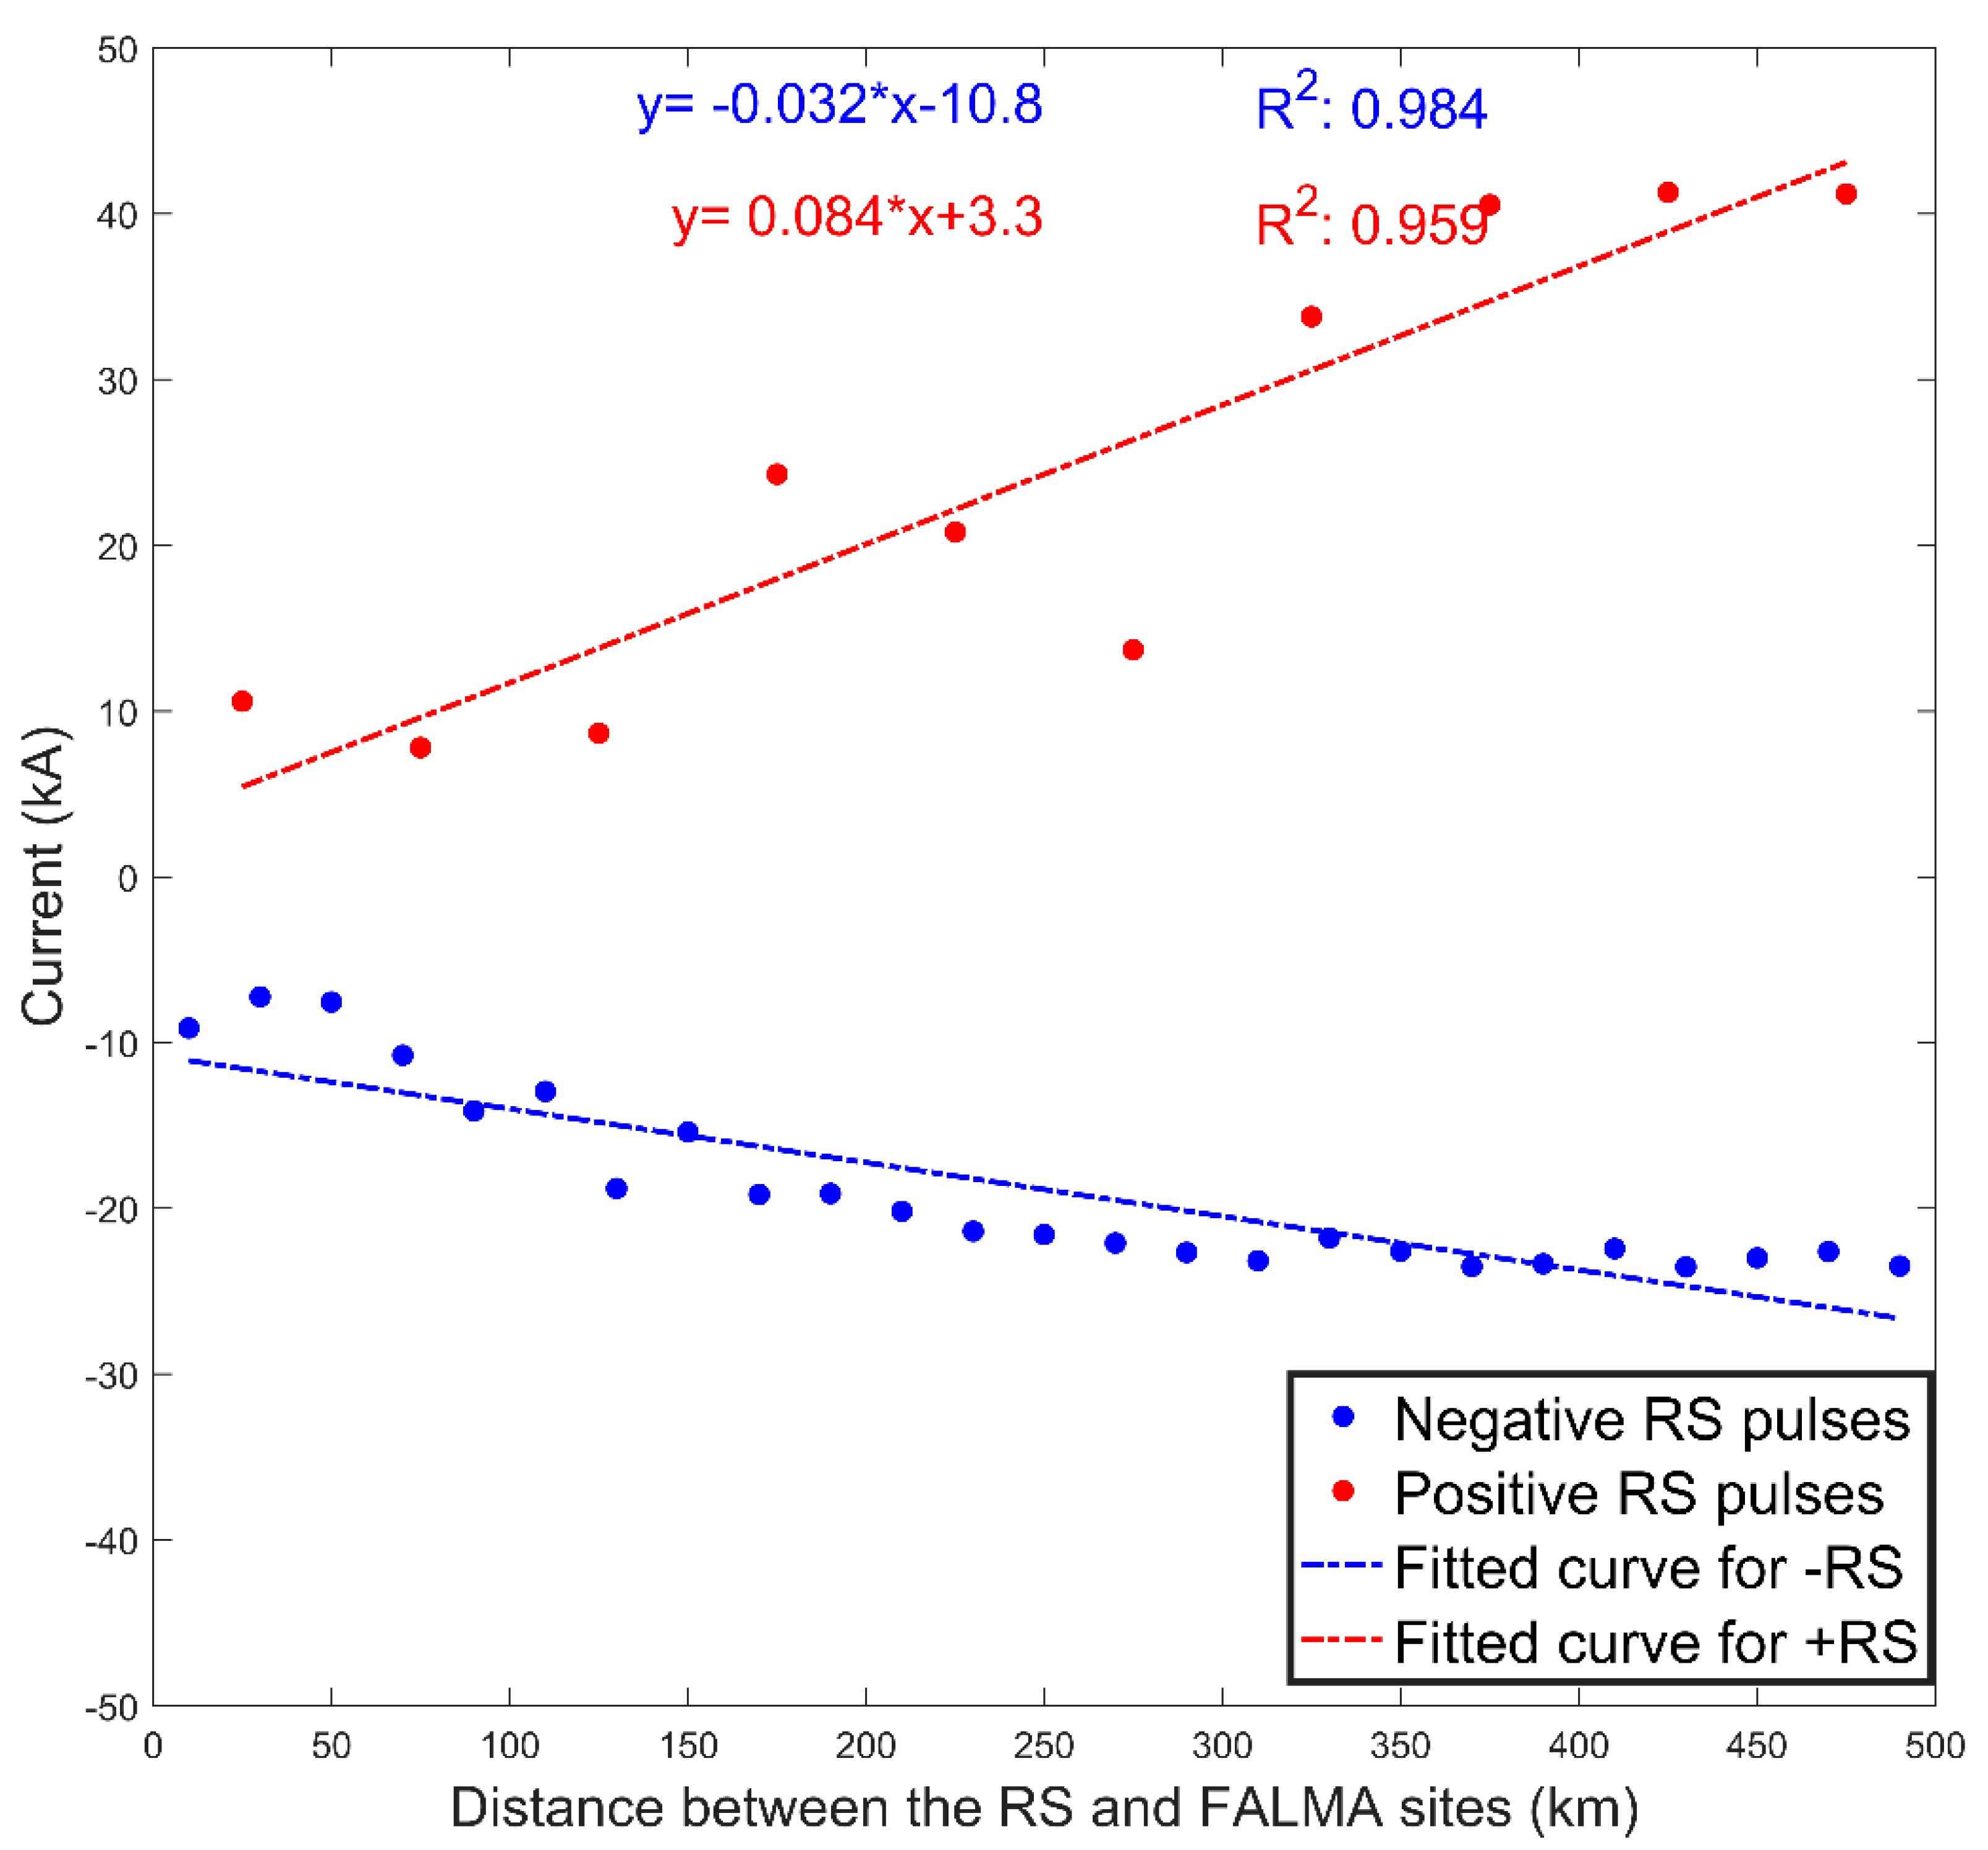
  • The AM positive and negative RS currents are 31.5 and 22.8 kA, respectively. Compared to the previously reported results, the RS peak currents in the Chinese inland areas seem to be relatively larger. In our dataset, the positive RSs with peak currents below 10 kA account for up to 27% (182/685), indicating that small positive discharge pulses should be taken into account.
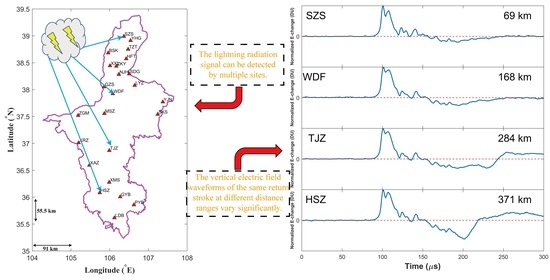
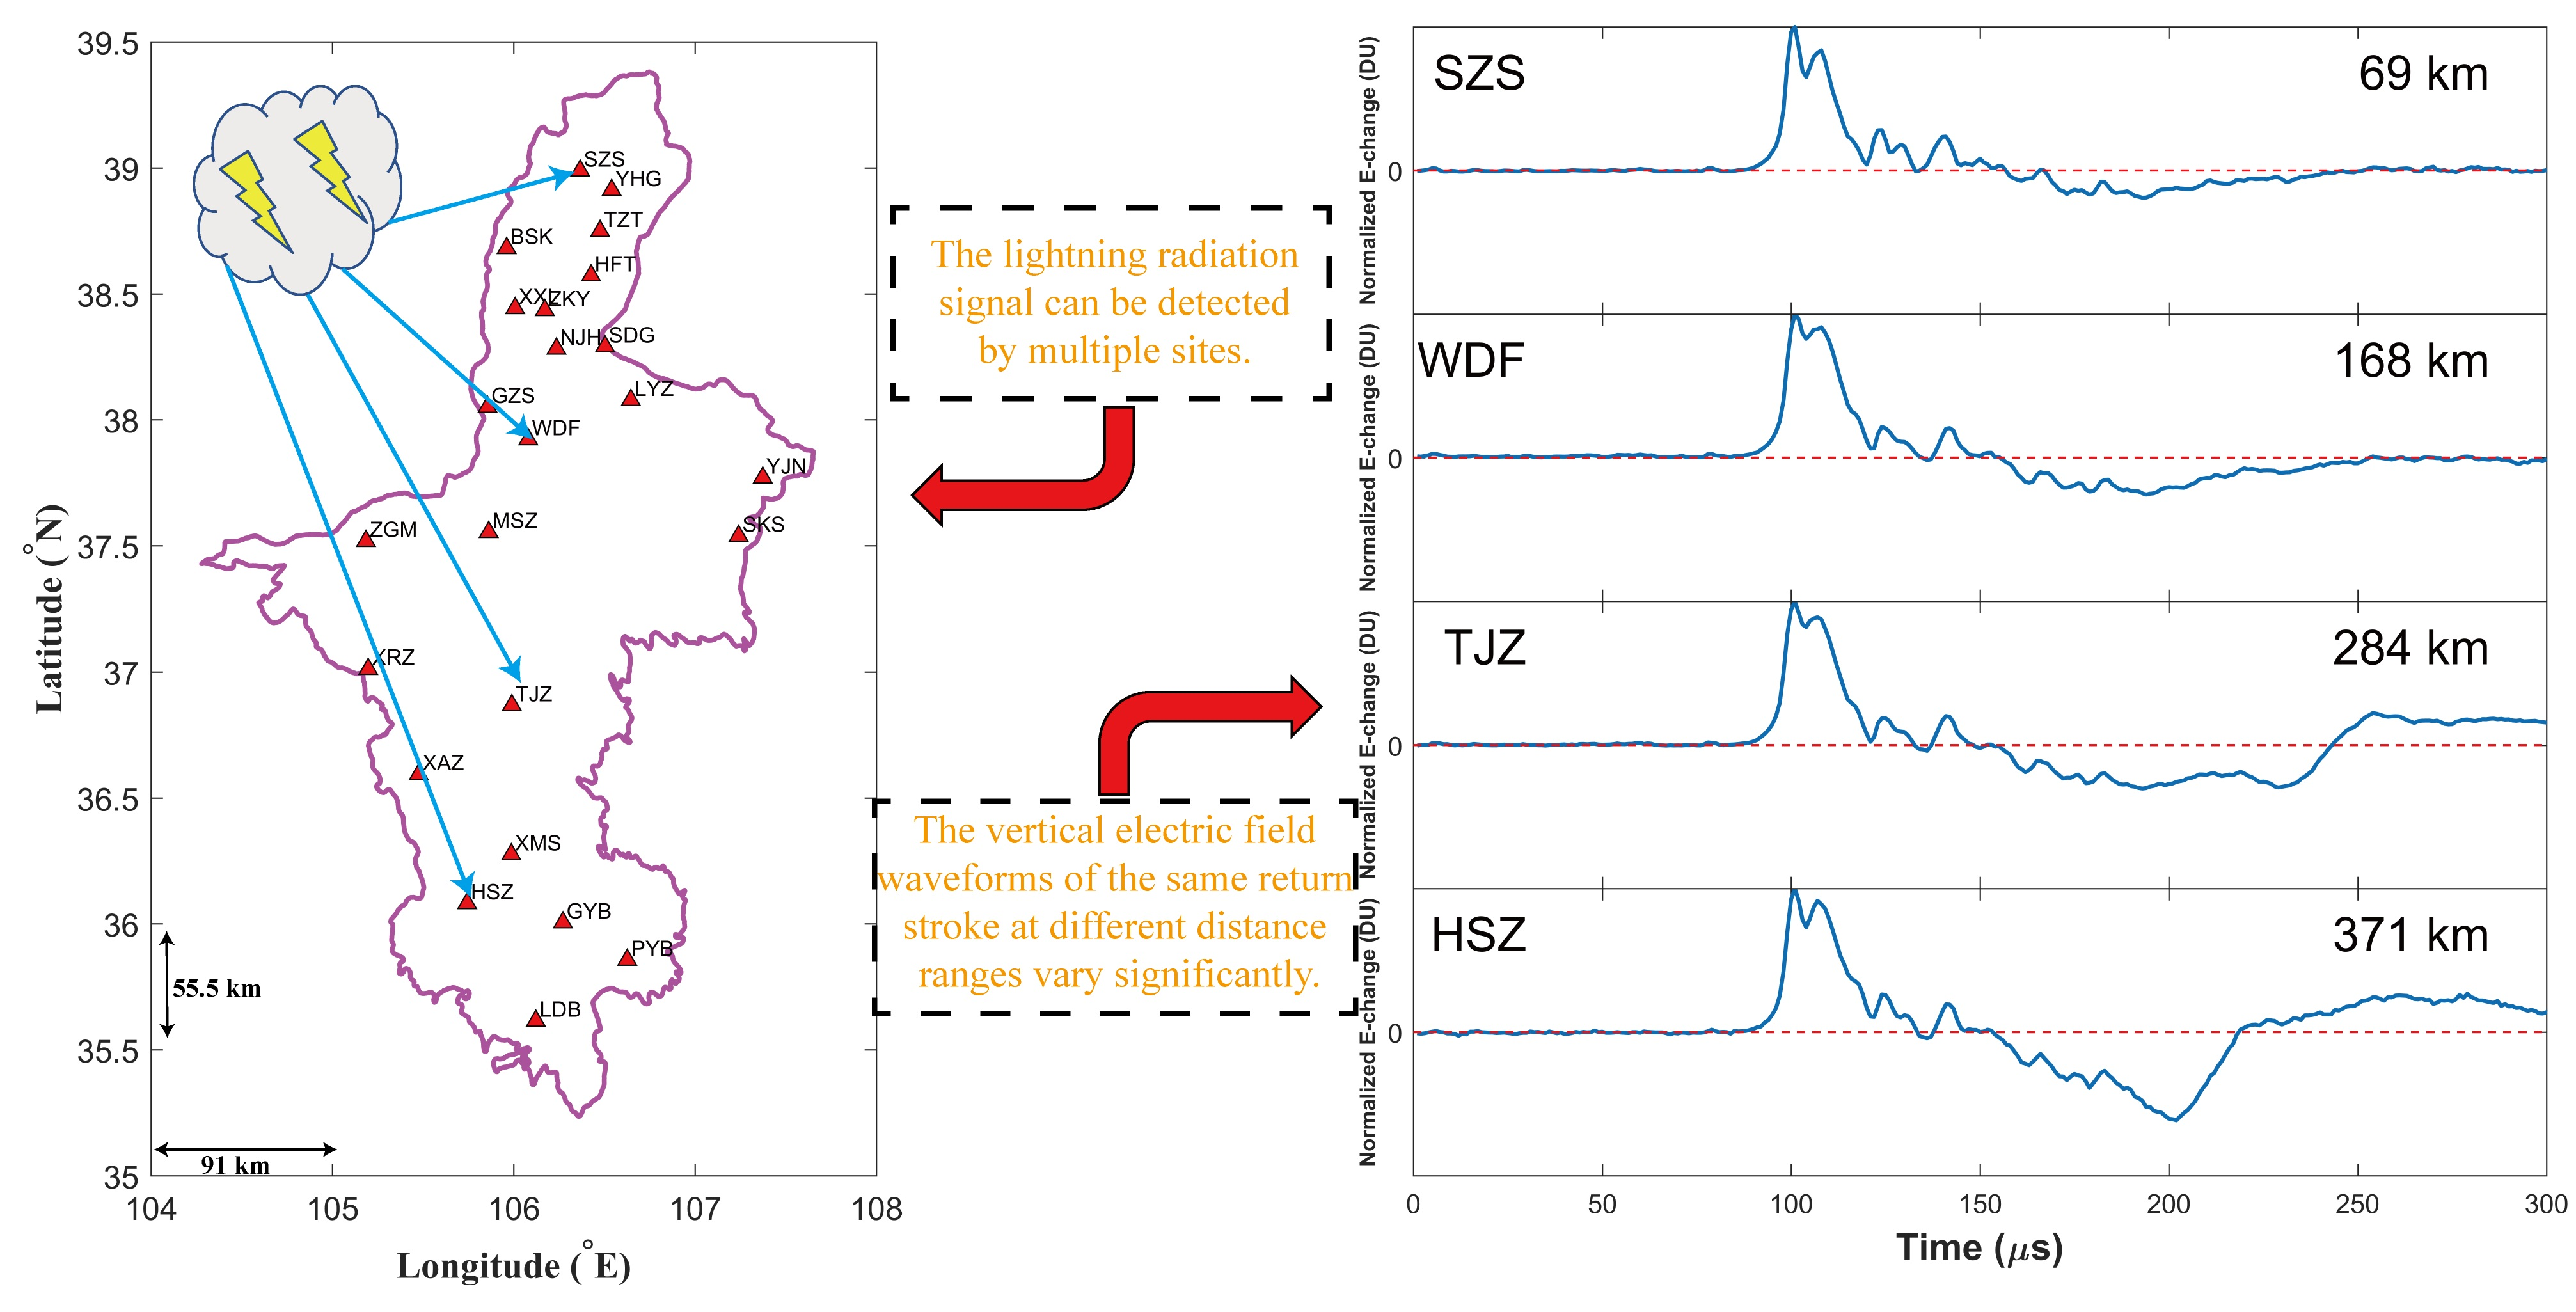
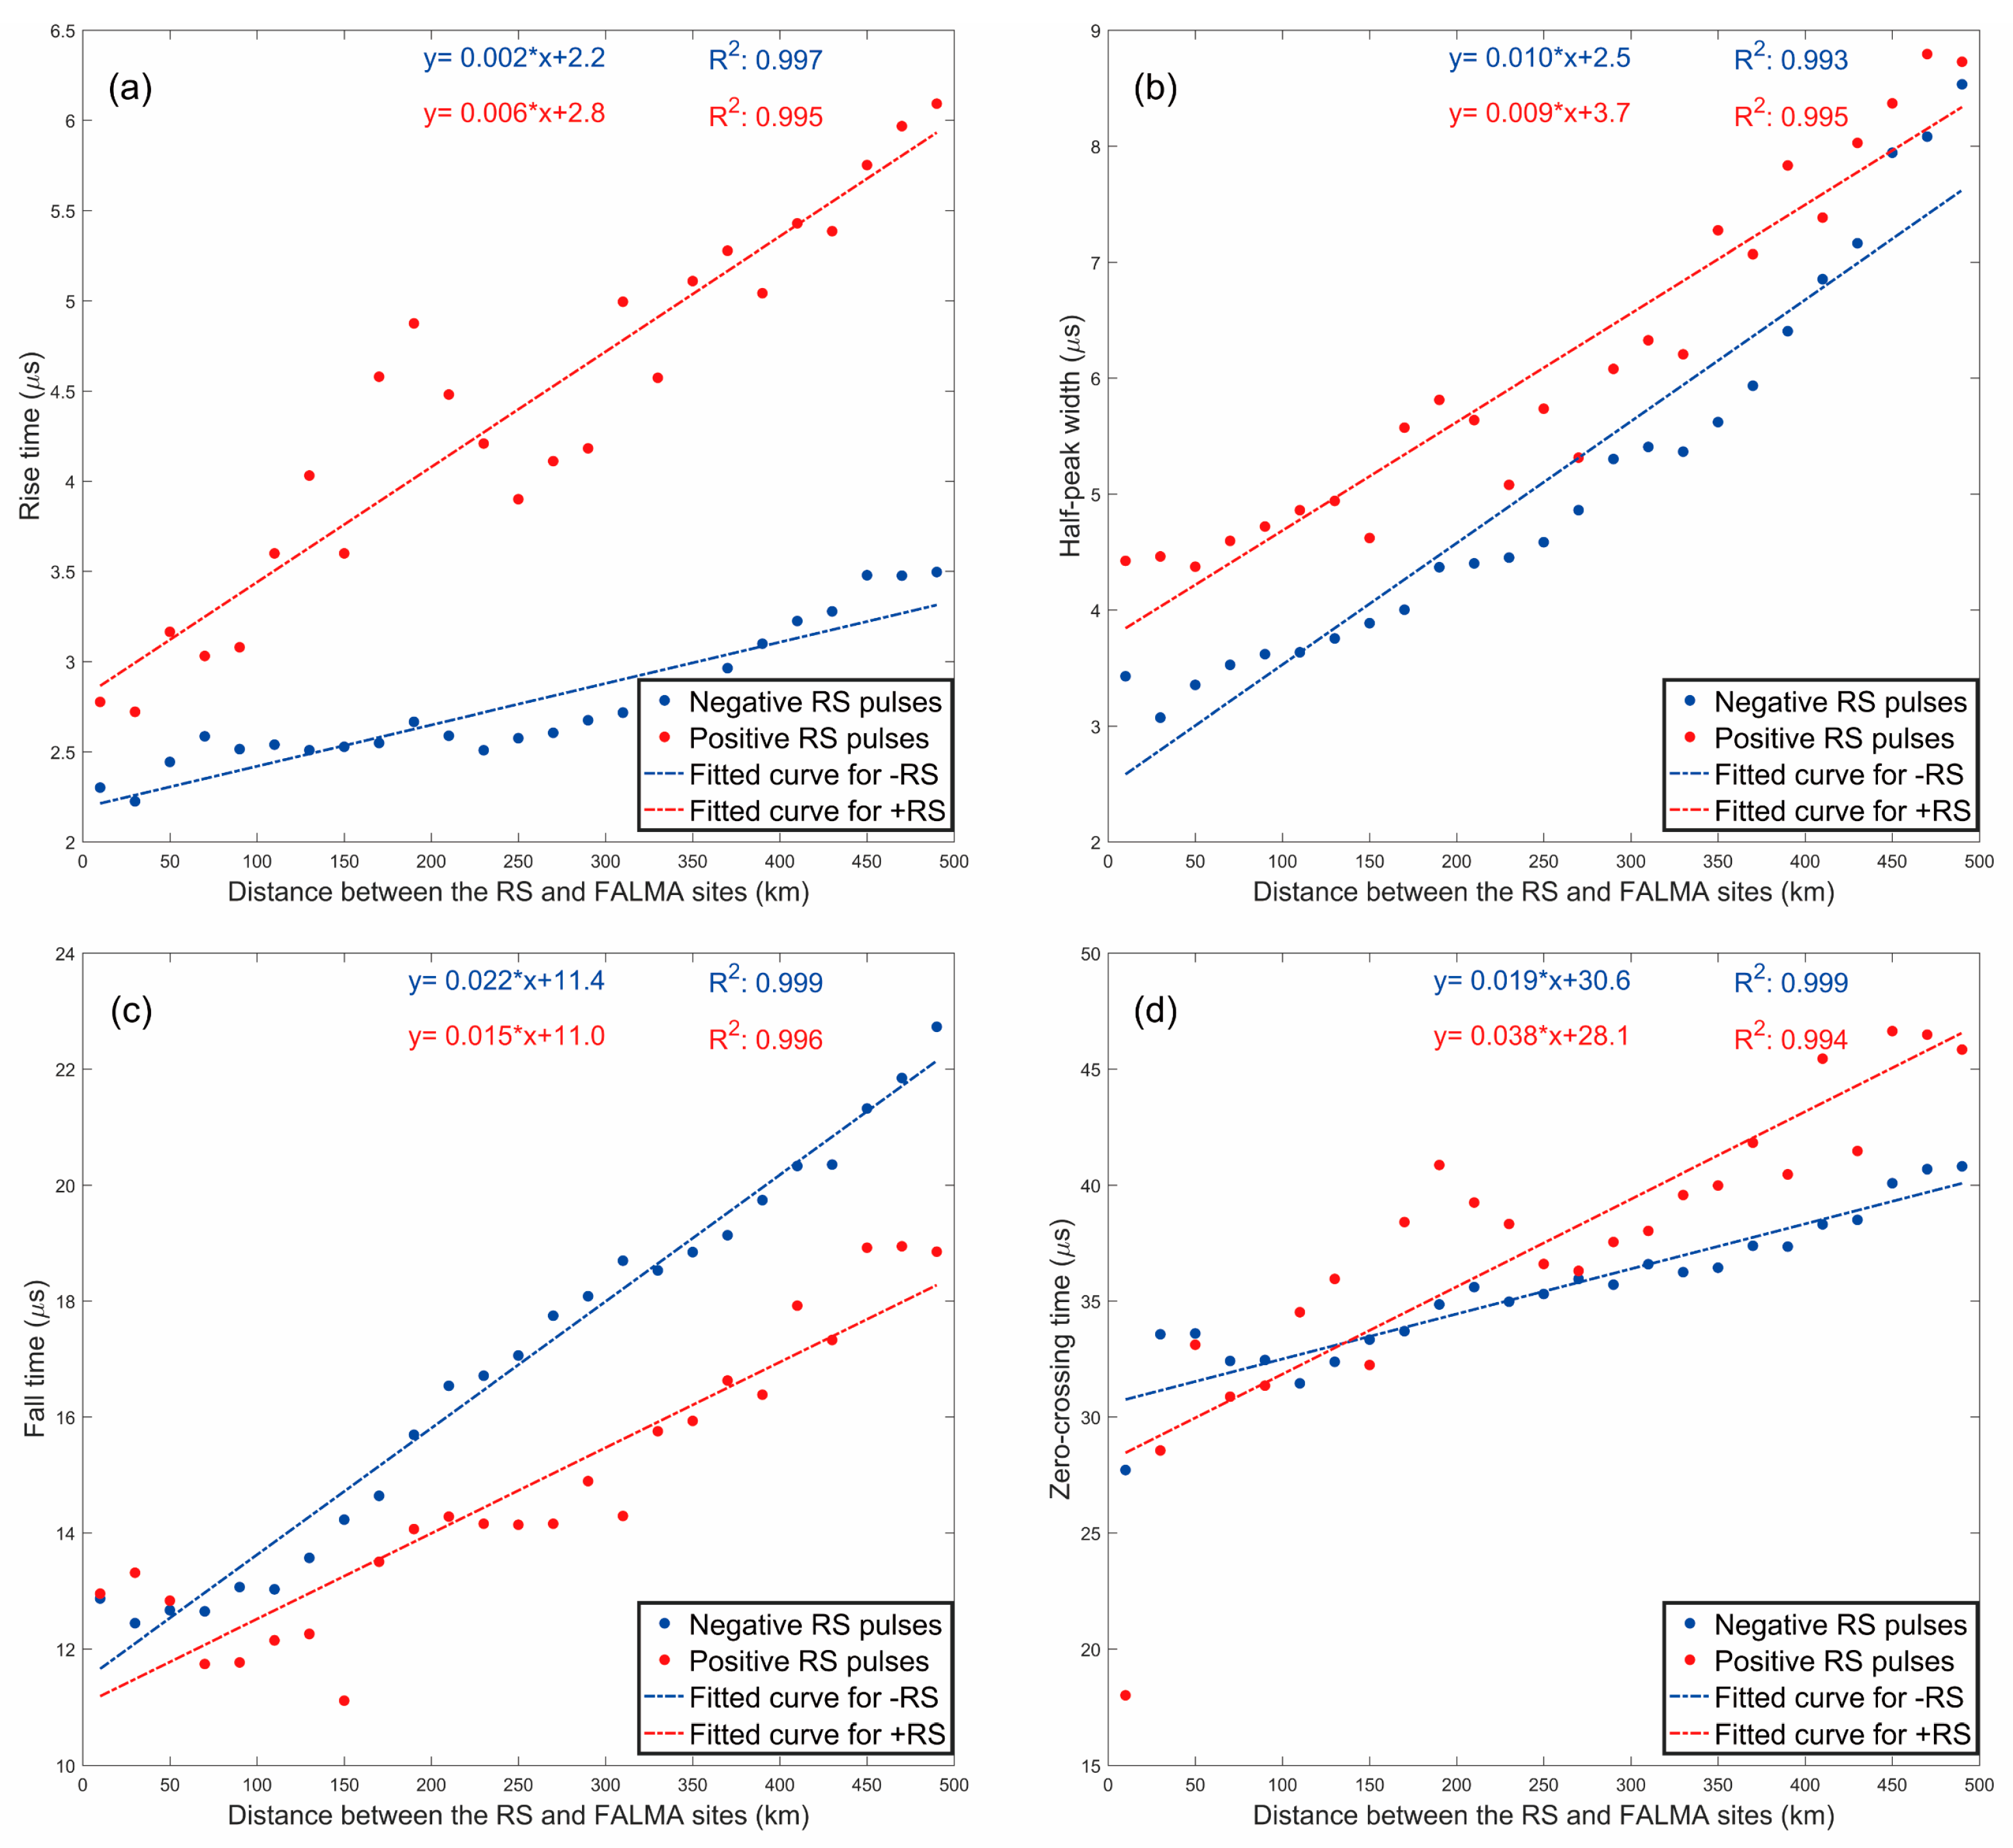
  • The RS pulse characteristics versus distance ranges and regions are verified. The results show that with increasing distance ranges, pulse parameters and currents for both positive and negative RSs significantly exhibit an increasing tendency. Take the rise time as an example, for each 100 km increase in distance, the rise time of positive (negative) RS increases by 0.6 (0.2) μs. Furthermore, a simple comparison between Gifu, Japan and Ningxia, China has indicated that pulse parameters differed significantly in different regions.

Author Contributions

Conceptualization, D.S.; methodology, D.S.; software, D.S.; validation, D.S.; formal analysis, D.S.; resources, T.W., P.G. and D.W.; writing—original draft preparation, D.S. and T.W.; writing—review and editing, D.S. and D.W.; visualization, D.S.; funding acquisition, W.J. and P.G. All authors have read and agreed to the published version of the manuscript.

Funding

This research was funded by 2022 Key R&D Plan of Ningxia Hui Autonomous Region—The first batch of pre-leading projects in the high-tech field “Development and Application of Lightning Strike and Safety Protection Research Platform”, and Yangzhou city-Yangzhou University joint Fund, grant number YZ2020169.

Institutional Review Board Statement

Not applicable.

Informed Consent Statement

Not applicable.

Data Availability Statement

The data used in this paper are available on request from the corresponding author.

Acknowledgments

The authors would like to thank the people who carried out the observation experiment during the summer of 2019 in Ningxia, China. The special gratitude needs to be expressed to the lightning group of Wuhan NARI Co. Ltd. of State Grid Electric Power Research Institute for sharing their valuable lightning locating data.

Conflicts of Interest

The authors declare no conflict of interest.

References

  1. Simpson, S.G.; Robinson, G.D. The distribution of electricity in thunderclouds. II. Proc. R. Soc. Lond. A 1941, 177, 281–329. [Google Scholar]
  2. Simpson, S.G.; Scrase, F.J. The distribution of electricity in thunderclouds. Proc. R. Soc. Lond. A 1937, 161, 309–352. [Google Scholar]
  3. Wang, D.; Liu, X.; Wang, C. A preliminary analysis of the characteristics of ground discharges in thunderstorms near Zhongchuan, Gansu province. Plateau Meteorol 1990, 9, 405–410. [Google Scholar]
  4. Liu, X.S.; Guo, C.M.; Wang, C.W. The surface electrostatic field-change produced by lightning flashes and the lower positive charge layer of the thunderstorm. Acta Meteorol. Sin. 1987, 45, 500–504. [Google Scholar]
  5. Qie, X.S.; Liu, X.S.; Zhang, G.S.; Yu, Y.; Guo, C.M.; Wang, D.H.; Ushio, T.; Watanabe, T. Characteristics of lightning discharge to ground in Zhongchuan area. Acta Meteorol. Sin. 1998, 56, 312–322. [Google Scholar]
  6. Zhang, Y.J.; Dong, W.S.; Zhao, Y.; Zhang, G.S.; Zhang, H.F.; Chen, C.P.; Zhang, T. Study of charge structure and radiation characteristic of intracloud discharge in thunderstorms of Qinghai–Tibet Plateau. Sci. China Earth Sci. 2004, 47, 108–114. [Google Scholar]
  7. Wang, D.; Takagi, N.; Watanabe, T.; Yuan, T.; Qie, X.; Zhang, Y. Observed characteristics of lightning occurred in Lhasa city, Tibet Plateau region of China. J. Atmos. Electr. 2007, 27, 1–7. [Google Scholar] [CrossRef]
  8. Shao, X.M.; Liu, X.S. A preliminary analysis of intracloud lightning flashes and lower positive charge of thunderclouds. Plateau Meteorol. 1987, 6, 317–325. [Google Scholar]
  9. Qie, X.; Kong, X.; Zhang, G.; Zhang, T.; Yuan, T.; Zhou, Y.; Zhang, Y.; Wang, H.; Sun, A. The possible charge structure of thunderstorm and lightning discharges in northeastern verge of Qinghai–Tibetan Plateau. Atmos. Res. 2005, 76, 231–246. [Google Scholar] [CrossRef]
  10. Qie, X.S.; Zhang, T.L.; Chen, C.P.; Zhang, G.S.; Zhang, T.; Wei, W.Z. The lower positive charge center and its effect on lightning discharges on the Tibetan-Plateau. Geophys. Res. Lett. 2005, 32, L05814. [Google Scholar] [CrossRef] [Green Version]
  11. Qie, X.S.; Zhang, T.L.; Zhang, G.S.; Zhang, T.; Kong, X.Z. Electrical characteristics of thunderstorms in different plateau regions of China. Atmos. Res. 2009, 91, 244–249. [Google Scholar] [CrossRef]
  12. Zhao, Z.K.; Qie, X.S.; Zhang, T.L.; Zhang, T.; Zhang, H.F.; Wang, Y.; She, Y.; Sun, B.L.; Wang, H.B. Electric field soundings and the charge structure within an isolated thunderstorm. Chin. Sci. Bull. 2010, 55, 872–876. [Google Scholar] [CrossRef]
  13. Li, Y.J.; Zhang, G.S.; Wen, J.; Wang, D.H.; Wang, Y.H.; Zhang, T.; Fan, X.P.; Fan, X.P.; Wu, B. Electrical structure of a Qinghai–Tibet Plateau thunderstorm based on three-dimensional lightning mapping. Atmos. Res. 2013, 134, 137–149. [Google Scholar] [CrossRef]
  14. Li, Y.; Zhang, G.; Wang, Y.; Wu, B.; Li, J. Observation and analysis of electrical structure change and diversity in thunderstorms on the Qinghai-Tibet Plateau. Atmos. Res. 2017, 194, 130–141. [Google Scholar] [CrossRef]
  15. Shi, D.; Wang, D.; Wu, T.; Takagi, N. Correlation between the first return stroke of negative CG lightning and its preceding discharge processes. J. Geophys. Res. Atmos. 2019, 124, 8501–8510. [Google Scholar] [CrossRef]
  16. Wu, T.; Wang, D.; Takagi, N. Lightning mapping with an array of fast antennas. Geophys. Res. Lett. 2018, 45, 3698–3705. [Google Scholar] [CrossRef]
  17. Wu, T.; Wang, D.; Huang, H.; Takagi, N. The Strongest Negative Lightning Strokes in Winter Thunderstorms in Japan. Geophys. Res. Lett. 2021, 48, e2021GL095525. [Google Scholar] [CrossRef]
  18. Wu, T.; Wang, D.; Takagi, N. A negative cloud-to-ground lightning flash initiating at a high altitude and starting without classic preliminary breakdown pulses. J. Atmos. Electr. 2020, 39, 16–32. [Google Scholar] [CrossRef]
  19. Wu, T.; Wang, D.; Takagi, N. Multiple-stroke positive cloud-to-ground lightning observed by the FALMA in winter thunderstorms in Japan. J. Geophys. Res. Atmos. 2020, 125, 1–17. [Google Scholar] [CrossRef]
  20. Wu, T.; Wang, D.; Takagi, N. Upward negative leaders in positive upward lightning in winter: Propagation velocities, electric field change waveforms, and triggering mechanism. J. Geophys. Res. Atmos. 2020, 125, 1–17. [Google Scholar] [CrossRef]
  21. Wu, T.; Wang, D.; Takagi, N. Velocities of positive leaders in intracloud and negative cloud-to-ground lightning flashes. J. Geophys. Res. Atmos. 2019, 124, 9983–9995. [Google Scholar] [CrossRef]
  22. Wu, T.; Wang, D.; Takagi, N. Intracloud lightning flashes initiated at high altitudes and dominated by downward positive leaders. J. Geophys. Res. Atmos. 2019, 124, 6982–6998. [Google Scholar] [CrossRef]
  23. Wu, T.; Wang, D.; Takagi, N. Compact lightning strokes in winter thunderstorms. J. Geophys. Res. Atmos. 2021, 126, 1–19. [Google Scholar] [CrossRef]
  24. Shi, D.; Wang, D.; Wu, T.; Takagi, N. Temporal and Spatial Characteristics of Preliminary Breakdown Pulses in Intracloud Lightning Flashes. J. Geophys. Res. Atmos. 2019, 124, 12901–12914. [Google Scholar] [CrossRef]
  25. Shi, D.; Wang, D.; Wu, T.; Takagi, N. A comparison on the E-change pulses occurring in the bi-level polarity-opposite charge regions of the intracloud lightning flashes. J. Geophys. Res. Atmos. 2020, 125, e2020JD032996. [Google Scholar] [CrossRef]
  26. Gao, P.; Wu, T.; Wang, D. Initial Results of Long-term Continuous Observation of Lightning Discharges by FALMA in Chinese Inland Plateau Region. Atmosphere 2021, 12, 514. [Google Scholar] [CrossRef]
  27. Zhu, Y.; Bitzer, P.; Rakov, V.; Ding, Z. A Machine-Learning Approach to Classify Cloud-to-Ground and Intracloud Lightning. Geophys. Res. Lett. 2020, 48, 1–8. [Google Scholar] [CrossRef]
  28. Wang, J.; Li, Q.; Li, C.; Zhou, M.; Fan, Y.; Xiao, J.; Sunjerga, A. Multiple-Station Measurements of a Return-Stroke Electric Field from Rocket-Triggered Lightning at Distances of 68–126 km. IEEE Trans. EMC 2018, 61, 440–448. [Google Scholar] [CrossRef]
  29. Mallick, S.; Rakov, V.A. Characterization of far electric field waveforms produced by rocket-triggered lightning. In Proceedings of the 32th International Conference on Lightning Protection, Shanghai China, 13–17 October 2014. [Google Scholar]
  30. Haddad, M.A.; Rakov, V.A.; Cummer, S.A. New measurements of lightning electric fields in Florida: Waveform characteristics, interaction with the ionosphere, and peak current estimates. J. Geophys. Res. 2012, 117, D10101. [Google Scholar] [CrossRef]
  31. Chen, L.; Zhang, Y.; Lu, W.; Zheng, D.; Zhang, Y.; Chen, S.; Huang, Z. Performance evaluation for a lightning location system based on observations of artificially triggered lightning and natural lightning flashes. J. Atmos. Oceanic Technol. 2012, 29, 1835–1844. [Google Scholar] [CrossRef]
  32. Nag, A.; Rakov, V.A. Parameters of Electric Field Waveforms Produced by Positive Lightning Return Strokes. IEEE Trans. Electromagn. Compat. 2014, 56, 932–939. [Google Scholar] [CrossRef]
  33. Hojo, J.; Ishii, M.; Kawamura, T.; Suzuki, F.; Funayama, R. The fine structure in the field change produced by positive ground strokes. J. Geophys. Res. 1985, 90, 6139–6143. [Google Scholar] [CrossRef]
  34. Schumann, C.; Saba, M.M.F.; Da Silva, R.B.G.; Schulz, W. Electric fields changes produced by positives cloud-to-ground lightning flashes. J. Atmos. Sol. Terr. Phys. 2013, 92, 37–42. [Google Scholar] [CrossRef]
  35. Qie, X.; Wang, Z.; Wang, D.; Liu, M.; Xuan, Y. Characteristics of positive cloud-to-ground lightning in Da HingganLing forest region at relatively high latitude, northeastern China. J. Geophys. Res. Atmos. 2013, 118, 13393–13404. [Google Scholar] [CrossRef]
  36. Master, M.J.; Uman, M.A.; Beasley, W.; Darveniza, M. Lightning induced voltages on power lines: Experiment. IEEE Trans. PAS 1984, 103, 2519–2529. [Google Scholar] [CrossRef]
  37. Ding, Z.; Chen, S.; Rakov, V.A.; Kereszy, I.; Zhu, Y. Comparison of Far Electric Field Waveforms Produced by Rocket-Triggered Lightning Strokes and Subsequent Strokes in Natural Lightning. In Proceedings of the 35th International Conference on Lightning Protection, Colombo, Sri Lanka, 30 August–4 September 2020. [Google Scholar]
  38. Uman, M.A.; Swanberg, C.E.; Tiller, J.A.; Lin, Y.T.; Krider, E.P. Effects of 200 km propagation on lightning return stroke electric fields. Radio Sci. 1976, 11, 985–990. [Google Scholar] [CrossRef]
  39. Mallick, S.; Rakov, V.A.; Hill, J.D.; Ngin, T.; Gamerota, W.R.; Pilkey, J.T.; Biagi, C.J.; Jordan, D.M.; Uman, M.A.; Cramer, J.A.; et al. Performance characteristics of the NLDN for return strokes and pulses superimposed on steady currents, based on rocket-triggered lightning data acquired in Florida in 2004–2012. J. Geophys. Res. 2014, 119, 3825–3856. [Google Scholar] [CrossRef] [Green Version]
  40. Li, X.; Qie, X.; Liu, K.; Wang, Y.; Wang, D.; Liu, M.; Sun, Z.; Zhang, H. Characteristics of cloud-to-ground lightning return strokes in Beijing based on high temporal resolution data of fast electric field change. Clim. Environ. Res. 2017, 22, 231–241. (In Chinese) [Google Scholar]
  41. Liu, H.; Dong, W.; Wang, T.; Qiu, S. A time-domain analysis on waveform changes of lightning electric field and identification of discharge types. Meteorol. Mon. 2009, 35, 49–59. (In Chinese) [Google Scholar]
  42. Lin, Y.; Uman, M.; Tiller, J.A.; Brantley, R.D.; Beasley, W.; Krider, E.; Weidman, C.; Merril, J.; Grant, J.R.; Platt, U.; et al. Characterization of lightning return stroke electric and magnetic fields from simultaneous two-station measurements. J. Geophys. Res. 1979, 84, 6307–6314. [Google Scholar] [CrossRef]
  43. Ishii, M.; Hojo, J. Statistics on fine structure of cloud-to-ground lightning field waveforms. J. Geophys. Res. 1989, 94, 13267–13274. [Google Scholar] [CrossRef]
  44. Cummins, K.L.; Murphy, M.J.; Bardo, E.A.; Hiscox, W.L.; Pyle, R.B.; Pifer, A.E. A Combined TOA/MDF Technology Upgrade of the U.S. National Lightning Detection Network. J. Geophys. Res. Atmos. 1998, 103, 9035–9044. [Google Scholar] [CrossRef]
  45. Zhang, Y.; Zhang, Y.; Meng, Q.; Weitao, L. Temporal distribution and waveform characteristics of positive cloud-to-ground lightning in Beijing area. J. Appl. Meteor. Sci. 2010, 21, 442–449. [Google Scholar]
  46. Berger, K.; Anderson, R.B.; Kröninger, H. Parameters of lightning flashes. Electra 1975, 41, 23–37. [Google Scholar]
  47. Nag, A.; Rakov, V.A.; Cummins, K.L. Positive Lightning Peak Currents Reported by the U.S. National Lightning Detection Network. IEEE Trans. Electromagn. Compat. 2014, 56, 404–412. [Google Scholar] [CrossRef]
  48. Cummins, K.L.; Wilson, J.G.; Eichenbaum, A.S. The Impact of Cloud-To-Ground Lightning Type on the Differences in Return Stroke Peak Current Over Land and Ocean. IEEE Access 2019, 7, 174774–174781. [Google Scholar] [CrossRef]
  49. Nag, A.; Cummins, K.L. Negative first stroke leader characteristics in cloud-to-ground lightning over land and ocean. Geophys. Res. Lett. 2017, 44, 1973–1980. [Google Scholar] [CrossRef] [Green Version]
  50. Li, D.; Azadifar, M.; Rachidi, F.; Rubinstein, M.; Diendorfer, G.; Sheshyekani, K.; Zhang, Q.; Wang, Z. Analysis of lightning electromagnetic field propagation in mountainous terrain and its effects on TOA-based lightning location systems. J. Geophys. Res. Atmos. 2016, 121, 895–911. [Google Scholar] [CrossRef]
  51. Shi, D.; Zheng, D.; Zhang, Y.; Zhang, Y.; Huang, Z.; Lu, W.; Chen, S.; Yan, X. Low-frequency E-field Detection Array (LFEDA)—Construction and preliminary results. Sci. China 2017, 10, 1–13. [Google Scholar] [CrossRef]
  52. Zhang, Q.; Yang, J.; Jing, X.; Li, D.; Wang, Z. Propagation effect of a fractal rough ground boundary on the lightning-radiated vertical electric field. Atmos. Res. 2012, 104, 202–208. [Google Scholar] [CrossRef]
  53. Leal, A.F.R.; Rakov, V.A. Characterization of lightning electric field waveforms using a large database: 2 Analysis and results. IEEE Trans. Electromagn. Compat. 2021, 63, 1989–1997. [Google Scholar] [CrossRef]
  54. Li, J.; Cai, L.; Wang, J.; Zhou, M.; Fan, Y.; Li, Q. Electrical Field Parameters of Natural Return Strokes at Different Distances. IEEE Trans. Electromagn. Compat. 2022. in print. [Google Scholar] [CrossRef]
Figure 1. Geographical locations of the Ningxia FALMA sites with the filling color representing the elevation above sea level. The cyan scattered points represent the RS events that were used to estimate the conversion coefficients in Section 3.2.
Remotesensing 14 01838 g001
Figure 2. The field scene at site TJZ (a); that is equipped with a fast antenna (b); and controlling box (c).
Remotesensing 14 01838 g002
Figure 3. Illustration of calculating pulse parameters: (a) E-change waveform of a negative CG flash containing three negative RSs; (b) parameter definitions in the expanded view of the first RS. The abbreviation of DU stands for digital unit.
Remotesensing 14 01838 g003
Figure 4. The LLS currents versus the normalized RS peak amplitude at FALMA station SZS (a); LDB (b); ZGM (c); and YJN (d). The red lines represent the fitted curves. The fitting goodness and the conversion coefficients between the normalized RS peak magnitudes and RS peak currents are marked on the upper right corner of each subplot.
Remotesensing 14 01838 g004
Figure 5. Histograms of rise time for RS pulses: (a) positive RS; (b) negative RS; Here, Min, Max, AM, GM, and SD are abbreviations for Minimum, Maximum, Arithmetic mean, Geometric mean, and Standard deviation, respectively.
Remotesensing 14 01838 g005
Figure 6. Histograms of half-peak width for RS pulses: (a) positive RS; (b) negative RS; Here, Min, Max, AM, GM, and SD are abbreviations for Minimum, Maximum, Arithmetic mean, Geometric mean, and Standard deviation, respectively.
Remotesensing 14 01838 g006
Figure 7. Histograms of fall time for RS pulses: (a) positive RS; (b) negative RS; Here, Min, Max, AM, GM, and SD are abbreviations for Minimum, Maximum, Arithmetic mean, Geometric mean, and Standard deviation, respectively.
Remotesensing 14 01838 g007
Figure 8. Histograms of zero-crossing time for RS pulses: (a) positive RS; (b) negative RS; Here, Min, Max, AM, GM, and SD are abbreviations for Minimum, Maximum, Arithmetic mean, Geometric mean, and Standard deviation, respectively.
Remotesensing 14 01838 g008
Figure 9. Histograms of RS peak currents: (a) positive RS; (b) negative RS; Here, Min, Max, AM, GM, and SD are abbreviations for Minimum, Maximum, Arithmetic mean, Geometric mean, and Standard deviation, respectively.
Remotesensing 14 01838 g009
Figure 10. Scatterplots of the mean values for positive (red dots) and negative (blue dots) RS pulse parameters in different distance ranges. The fitted curves of pulse parameters by distance are represented by dashed lines with the equation and fitting goodness marked on the upper of subplots. (a) rise time; (b) half-peak width; (c) fall time; (d) zero-crossing time.
Remotesensing 14 01838 g010
Figure 11. Scatterplots of the mean values for positive (red dots) and negative (blue dots) RS peak currents in different distance ranges. The fitted curves of RS peak currents by distance are represented by dashed lines with the equation and fitting goodness marked on the upper half.
Remotesensing 14 01838 g011
Figure 12. Cumulative probability distribution and corresponding statistical results of the RS pulse parameters: (a) rise time; (b) half-peak width; (c) fall time; (d) zero-crossing time. Here, Min, Max, AM, and SD are abbreviations for Minimum, Maximum, Arithmetic mean, Standard deviation, respectively.
Remotesensing 14 01838 g012
Table 1. Comparison of 10-to-90% rise time among different studies.
PolarityReferenceDistance (km)NumberAM (μs)GM (μs)
PositiveNag and Rakov [32] (NL)7.8–157624.03.4
Qi et al. [35] (NL)/1967.777.27
Hoko et al. [33] (NL)/446.7/
Schumann et al. [34] (NL)3–80725.75.2
This study (NL)0.6–50082805.24.3
NegativeMaster et al. [36] (NL)1–202201.5/
Ding et al. [37] (NL)35–551842.52.2
This study (NL)0.6–500195,8603.53
RTL = rocket triggered lightning; NL = Natural lightning; AM = arithmetic mean; GM = geometric mean.
Table 2. Comparison of half-peak width among different studies.
PolarityReferenceDistance (km)NumberAM (μs)GM (μs)
PositiveLi et al. [40] (NL)/3046.24.8
This study (NL)0.6–50082807.26.2
NegativeMallick et al. [39] (RTL)645692.32.2
Li et al. [40] (NL)/14675.33.7
Wang et al. [28] (RTL)68–126382.92.9
Ding et al. [37] (NL)35–551846.35.4
This study (NL)0.6–500195,8606.45.4
RTL = rocket triggered lightning; NL = Natural lightning; AM = arithmetic mean; GM = geometric mean.
Table 3. Comparison of fall time among different studies.
PolarityReferenceDistance (km)NumberAM (μs)GM (μs)
PositiveLi et al. [40] (first RS in NL)/30414.5/
Li et al. [40] (subsequent RS in NL)/2912.6/
This study (NL)0.6–500828015.612.8
NegativeLiu et al. [41] (NL)/75089/
Li et al. [40] (first RS in NL)/146723.9/
Li et al. [40] (subsequent RS in NL)/410919.5/
This study (NL)0.6–500195,86017.515.1
RTL = rocket triggered lightning; NL = Natural lightning; AM = arithmetic mean; GM = geometric mean.
Table 4. Comparison of zero-crossing time among different studies.
PolarityReferenceDistance (km)NumberAM (μs)GM (μs)
PositiveNag and Rakov [32] (first RS in NL)7.8–157426945
Ishii and Hojo [43] (NL)100–30034151/
This study (NL)0.6–500828042.837.3
NegativeLin et al. [42] (NL)2007736/
Haddad et al. [30] (subsequent RS in NL)10–33019767.661.5
Wang et al. [28] (RTL)68–126125047
Ding et al. [37] (NL)35–551455853
This study (NL)0.6–500195,86038.535.3
RTL = rocket triggered lightning; NL = Natural lightning; AM = arithmetic mean; GM = geometric mean.
Table 5. Comparison of RS currents among different studies.
PolarityReferenceNumberMedian(kA)AM (kA)GM (kA)
PositiveBerger et al. [46]2635//
Zhang et al. [45] (NL)8184/29.7/
Nag et al. [47] (NL)48/8875
This study (NL)68520.131.520.7
NegativeBerger et al. [46] (subsequent RS in NL)13512//
Zhang et al. [45] (NL)67,022/9.5/
Nag and Cummins. [49] (first RS in NL)28,3282027/
Cummins et al. [48] (subsequent RS in NL)88614.518.6/
This study (NL)16,54020.822.819.6
RTL = rocket triggered lightning; NL = Natural lightning; AM = arithmetic mean; GM = geometric mean.
Publisher’s Note: MDPI stays neutral with regard to jurisdictional claims in published maps and institutional affiliations.

